Share or Die: End Of Ownership And Rise of The Sharing Economy in 2014
Upload
john-farrellCategory
view
379download
0
H O W C O M M U N I T I E S C A N TA K E O W N E R S H I P O F R E N E W A B L E P O W E R
B E Y O N D S H A R I N G
John Farrell May 11, 2016
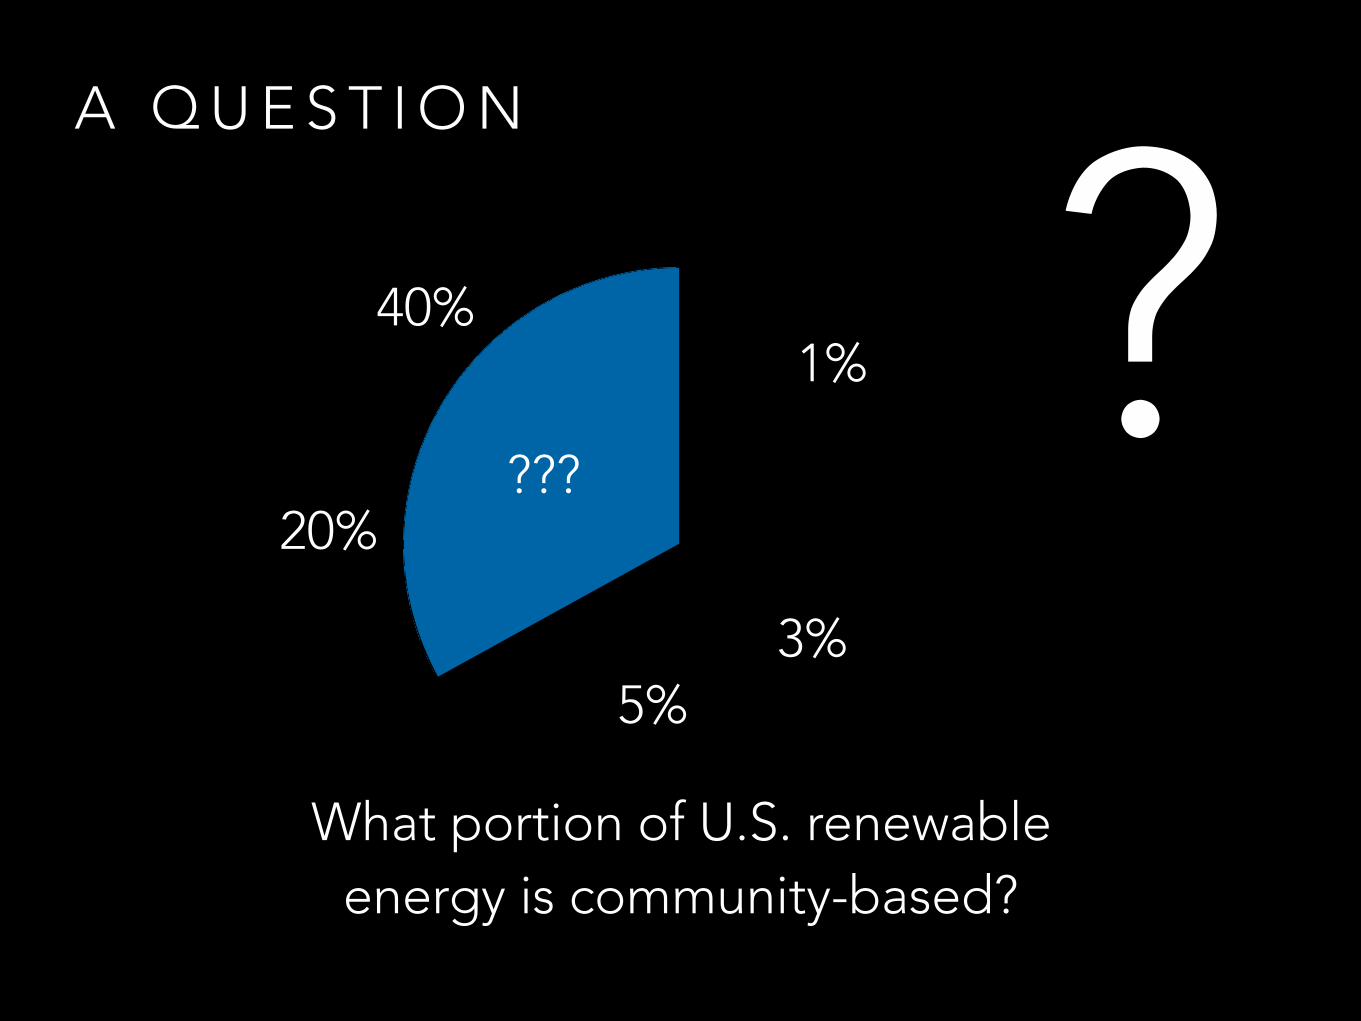
A Q U E S T I O N
1%
What portion of U.S. renewable energy is community-based?
???
3%
20%
40% ?5%
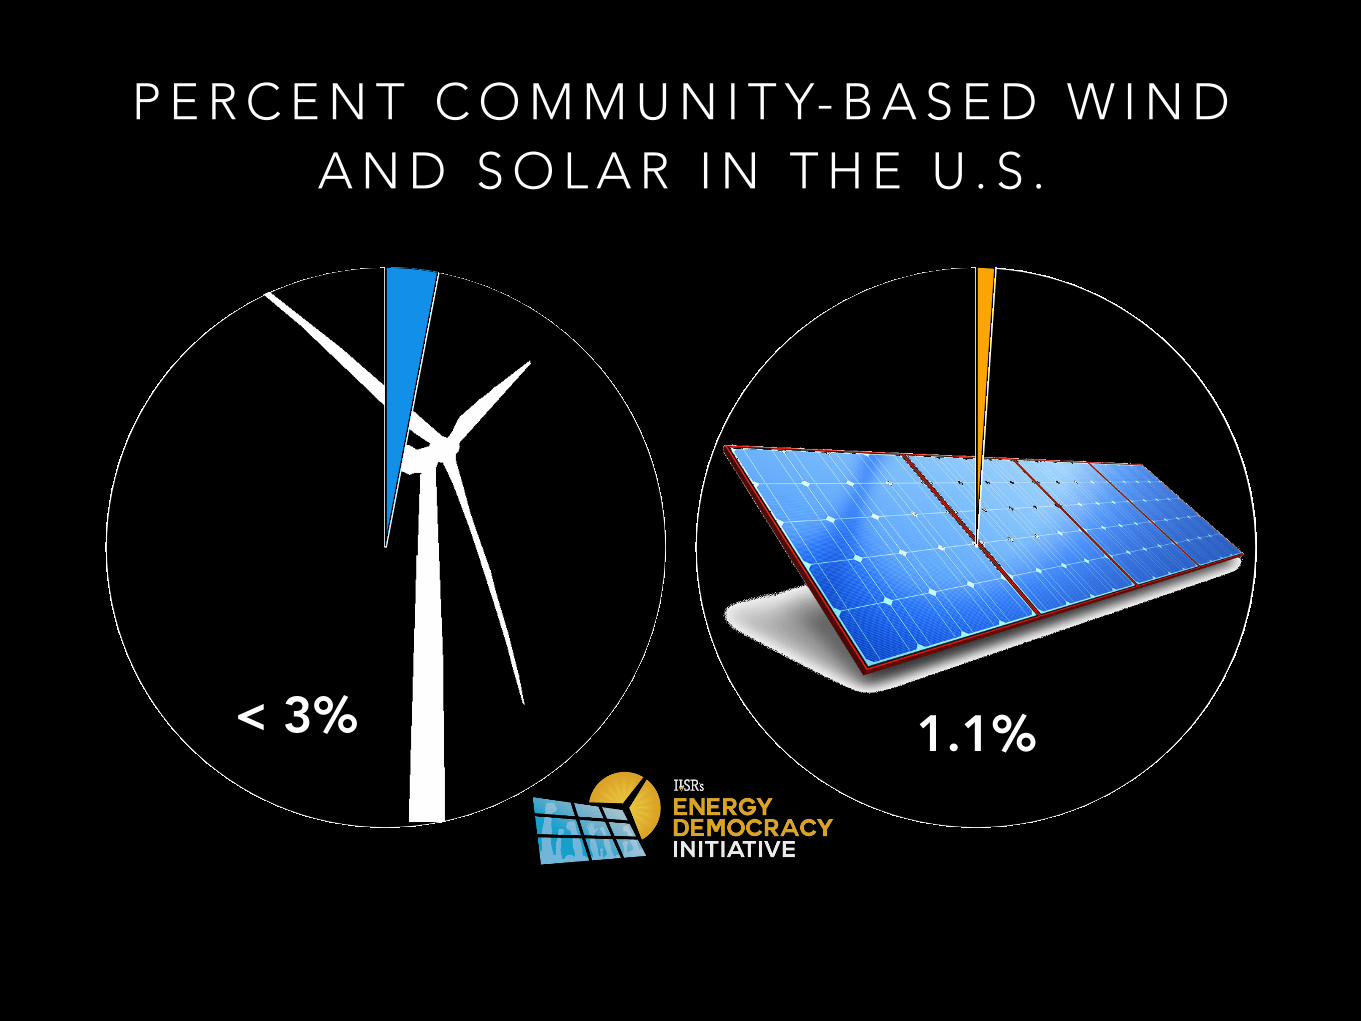
< 3%
P E R C E N T C O M M U N I T Y- B A S E D W I N D A N D S O L A R I N T H E U . S .
1.1%
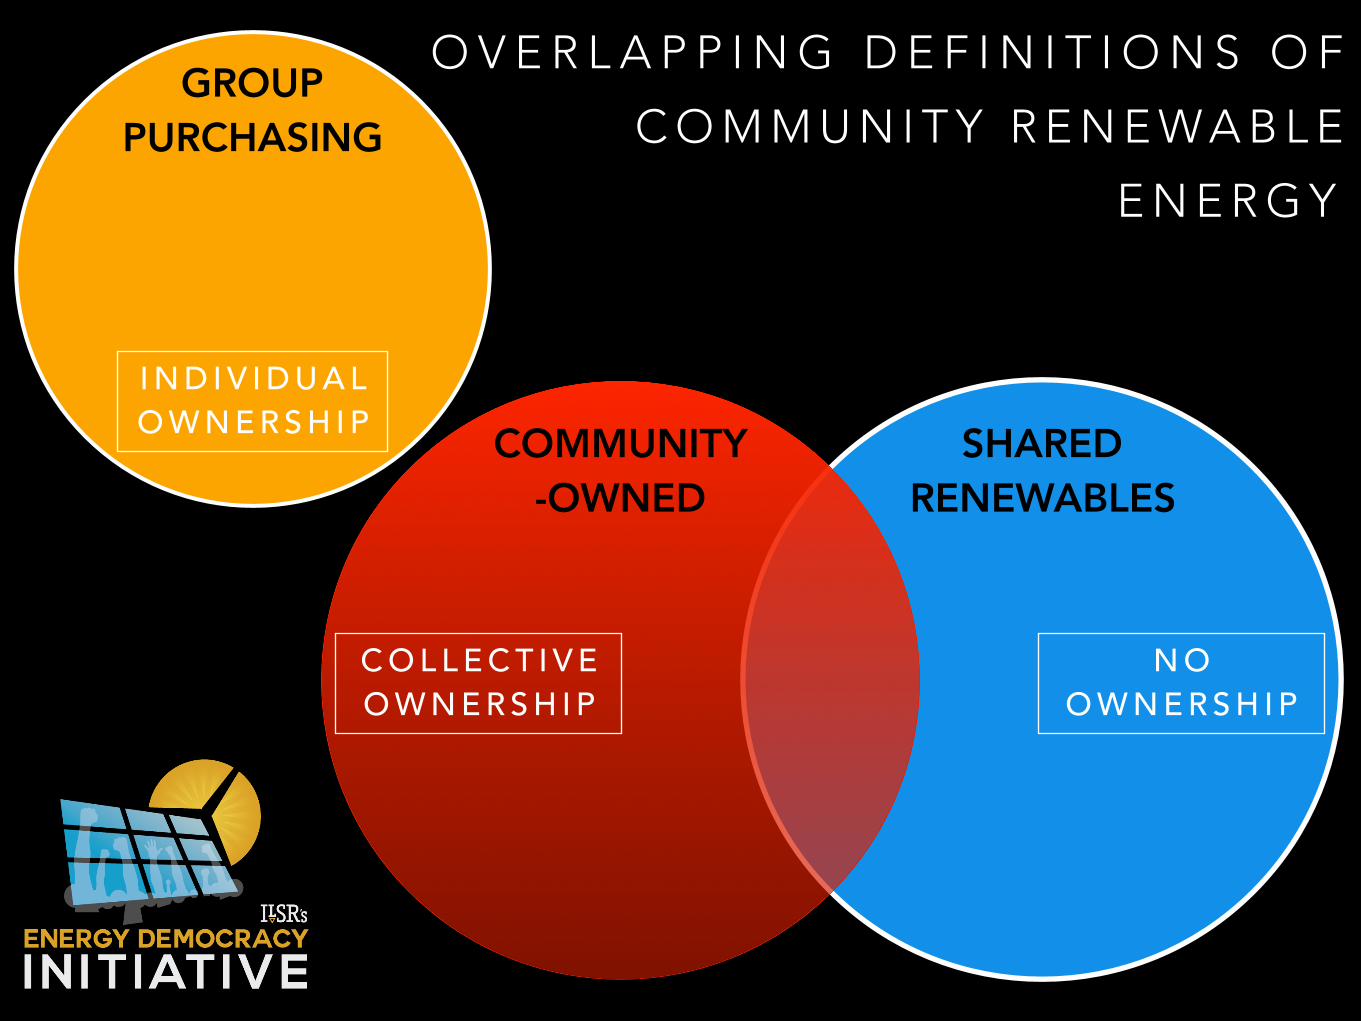
COMMUNITY -OWNED
SHARED RENEWABLES
GROUP PURCHASING
C O L L E C T I V E O W N E R S H I P
N O O W N E R S H I P
O V E R L A P P I N G D E F I N I T I O N S O F
C O M M U N I T Y R E N E W A B L E
E N E R G Y
I N D I V I D U A L O W N E R S H I P
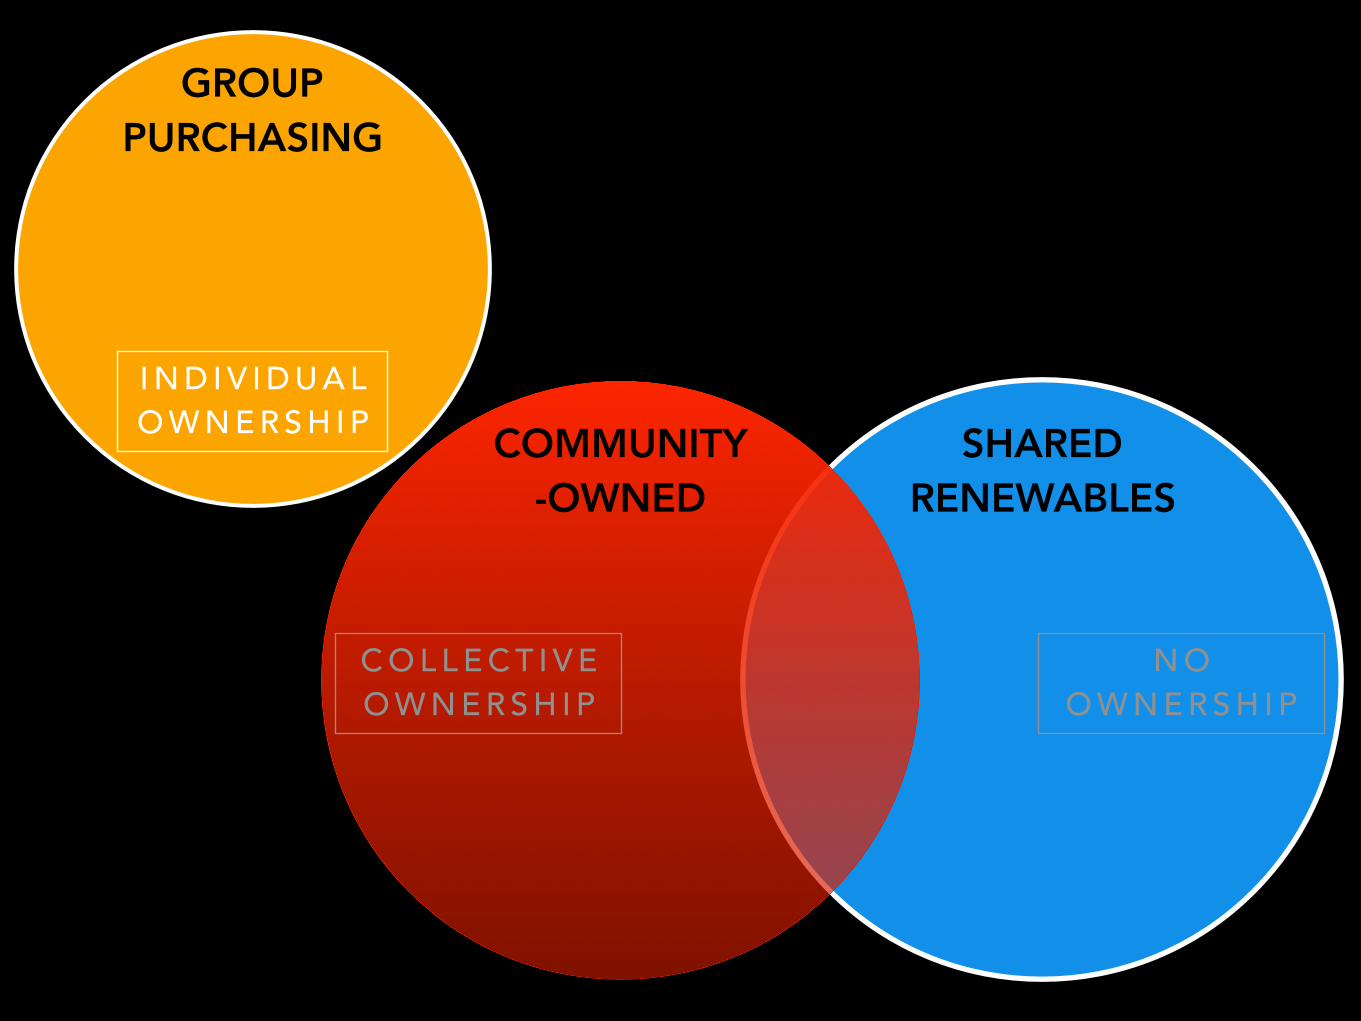
COMMUNITY -OWNED
SHARED RENEWABLES
GROUP PURCHASING
C O L L E C T I V E O W N E R S H I P
N O O W N E R S H I P
I N D I V I D U A L O W N E R S H I P
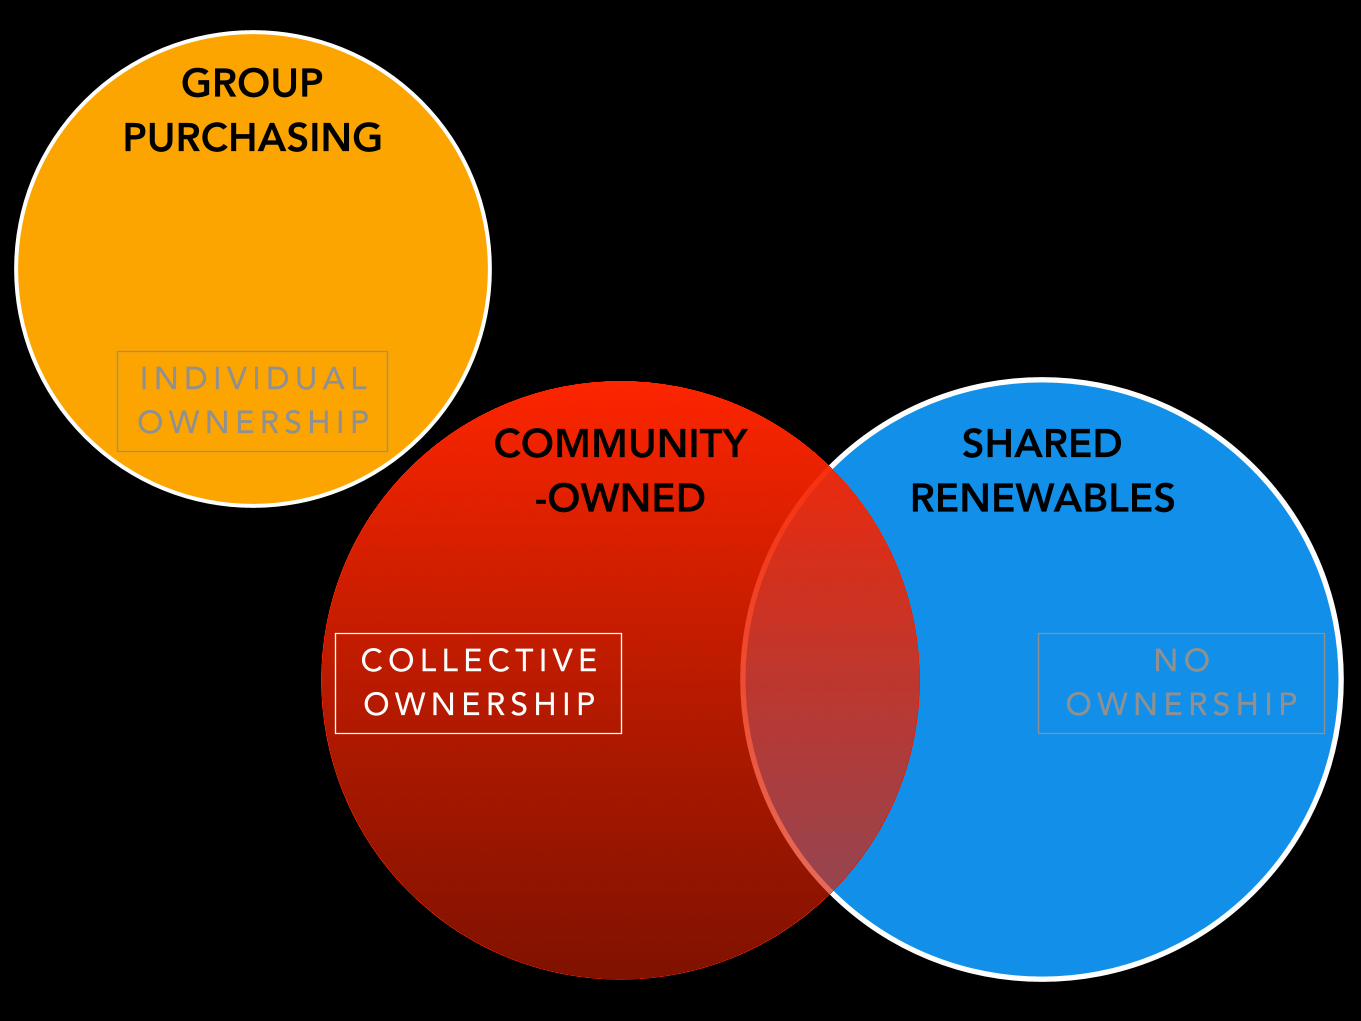
COMMUNITY -OWNED
SHARED RENEWABLES
GROUP PURCHASING
C O L L E C T I V E O W N E R S H I P
N O O W N E R S H I P
I N D I V I D U A L O W N E R S H I P

COMMUNITY -OWNED
SHARED RENEWABLES
GROUP PURCHASING
C O L L E C T I V E O W N E R S H I P
N O O W N E R S H I P
I N D I V I D U A L O W N E R S H I P
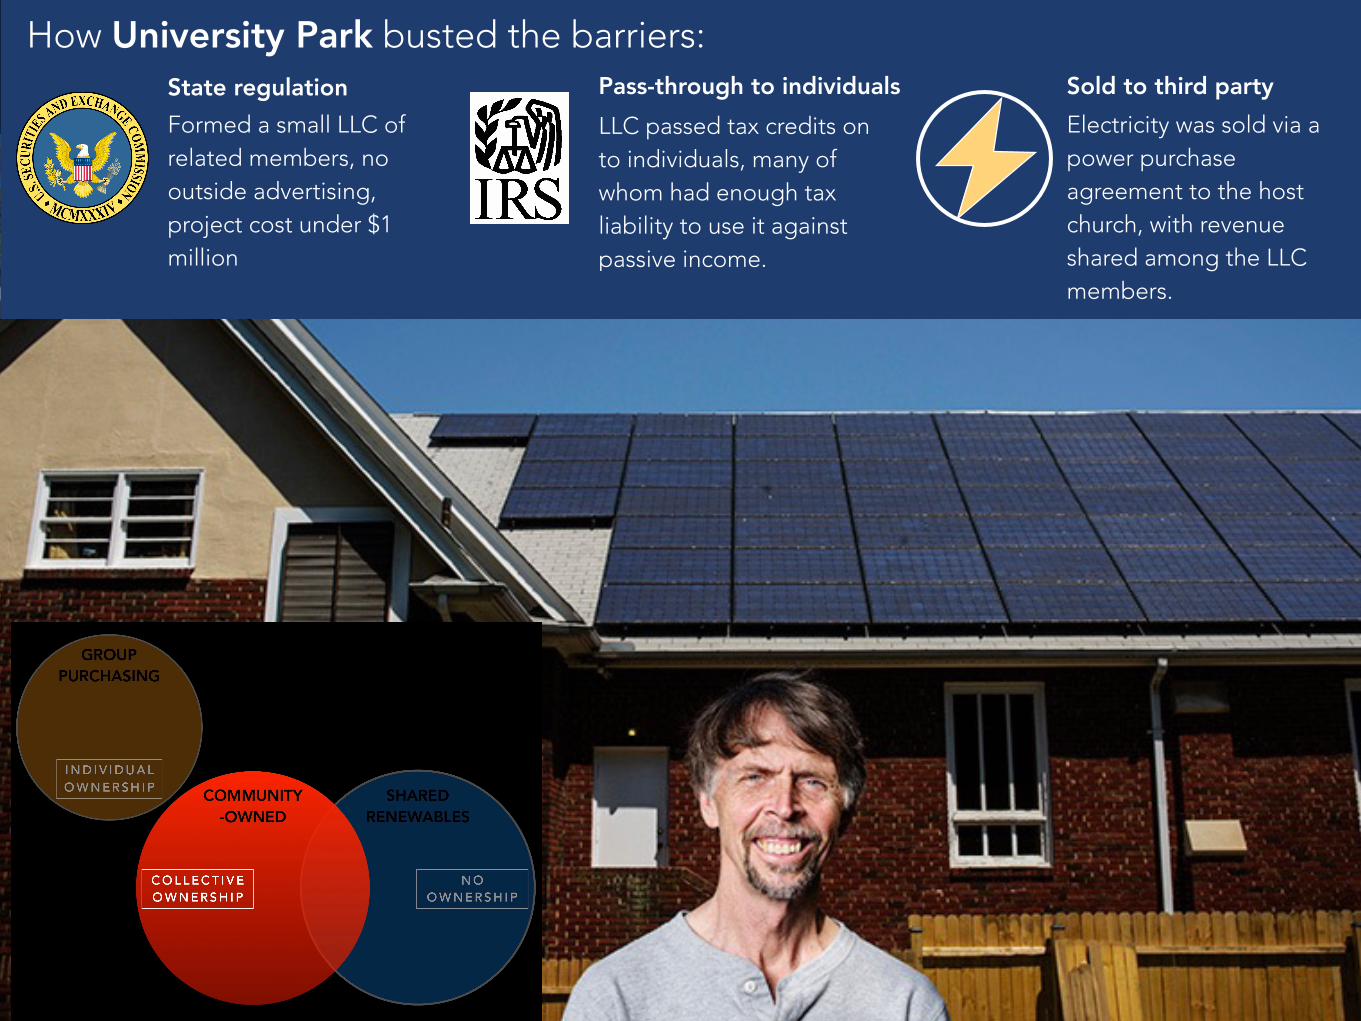
How University Park busted the barriers:
Formed a small LLC of related members, no outside advertising, project cost under $1 million
State regulation Pass-through to individualsLLC passed tax credits on to individuals, many of whom had enough tax liability to use it against passive income.
Sold to third partyElectricity was sold via a power purchase agreement to the host church, with revenue shared among the LLC members.
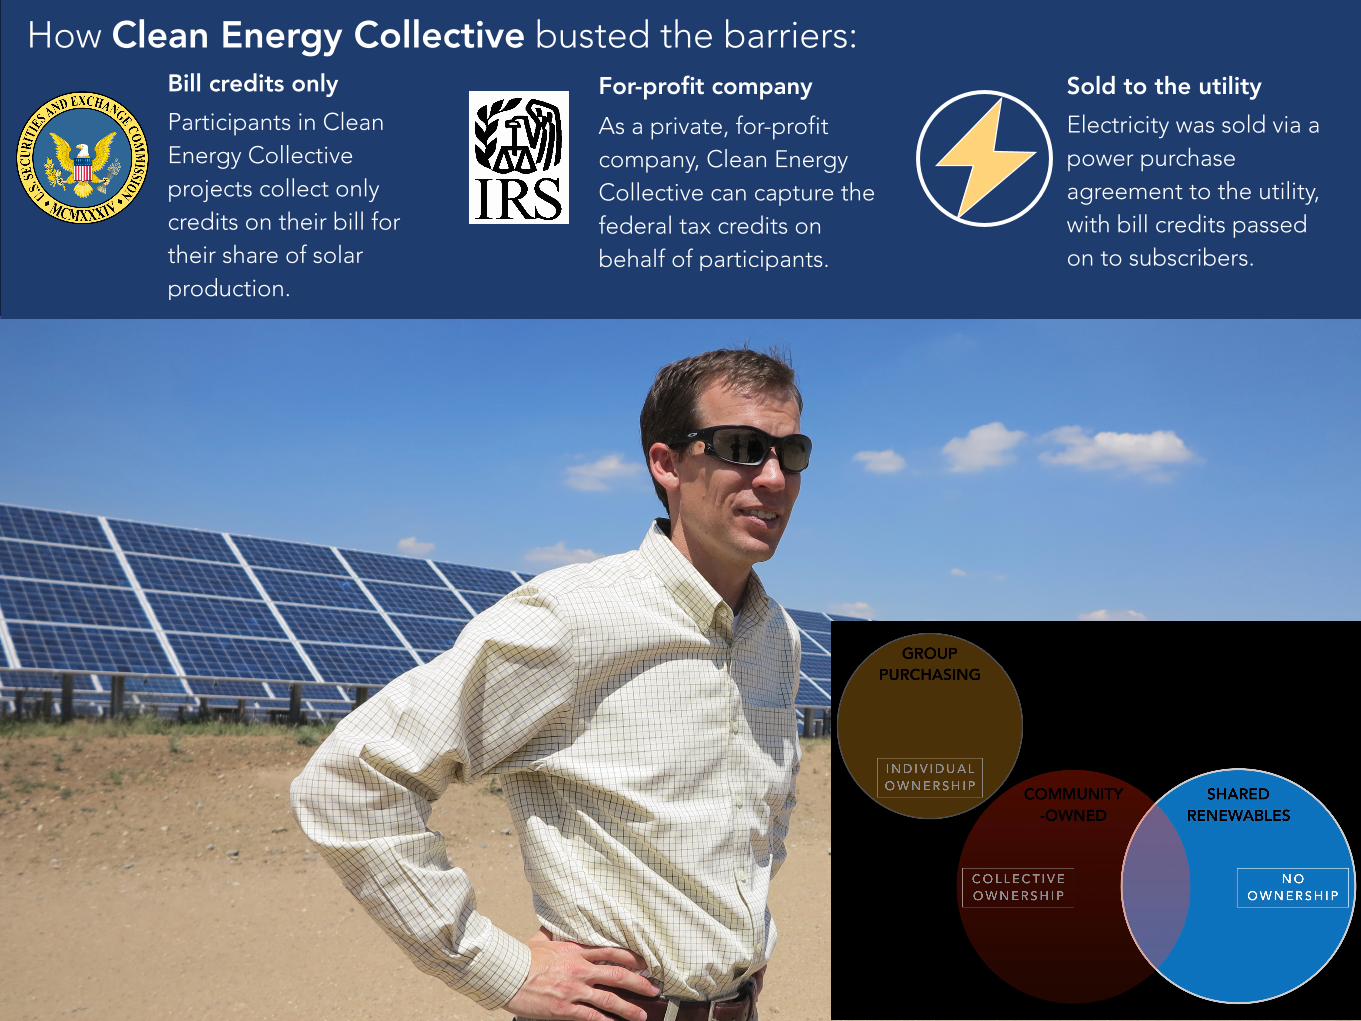
How Clean Energy Collective busted the barriers:
Participants in Clean Energy Collective projects collect only credits on their bill for their share of solar production.
Bill credits only For-profit companyAs a private, for-profit company, Clean Energy Collective can capture the federal tax credits on behalf of participants.
Sold to the utilityElectricity was sold via a power purchase agreement to the utility, with bill credits passed on to subscribers.

W H Y C O M M U N I T Y ?

30%
23%
47%
34%
40%
32%
50%
31%
25%35%
57%
26%
32%
39%
47%
35%
23%74%40%
34%
31%
27%
34%26%
28%
14%
34%44%
34%
44%
24%
39%
34%
42%
39%
36%
40%
33%
30%
37%
46%
30% 35%
37%
60%
53%60%
All buildings Source: http://www.nrel.gov/docs/fy16osti/65298.pdf
R O O F T O P S O L A R P O T E N T I A L 2 0 1 6
43%
43%
POTENTIAL PERCENT OF POWER FROM LOCAL
ROOFTOP SOLAROver 50% 40 to 50% 25 to 40% 11 to 25%
49%2008 data
23%
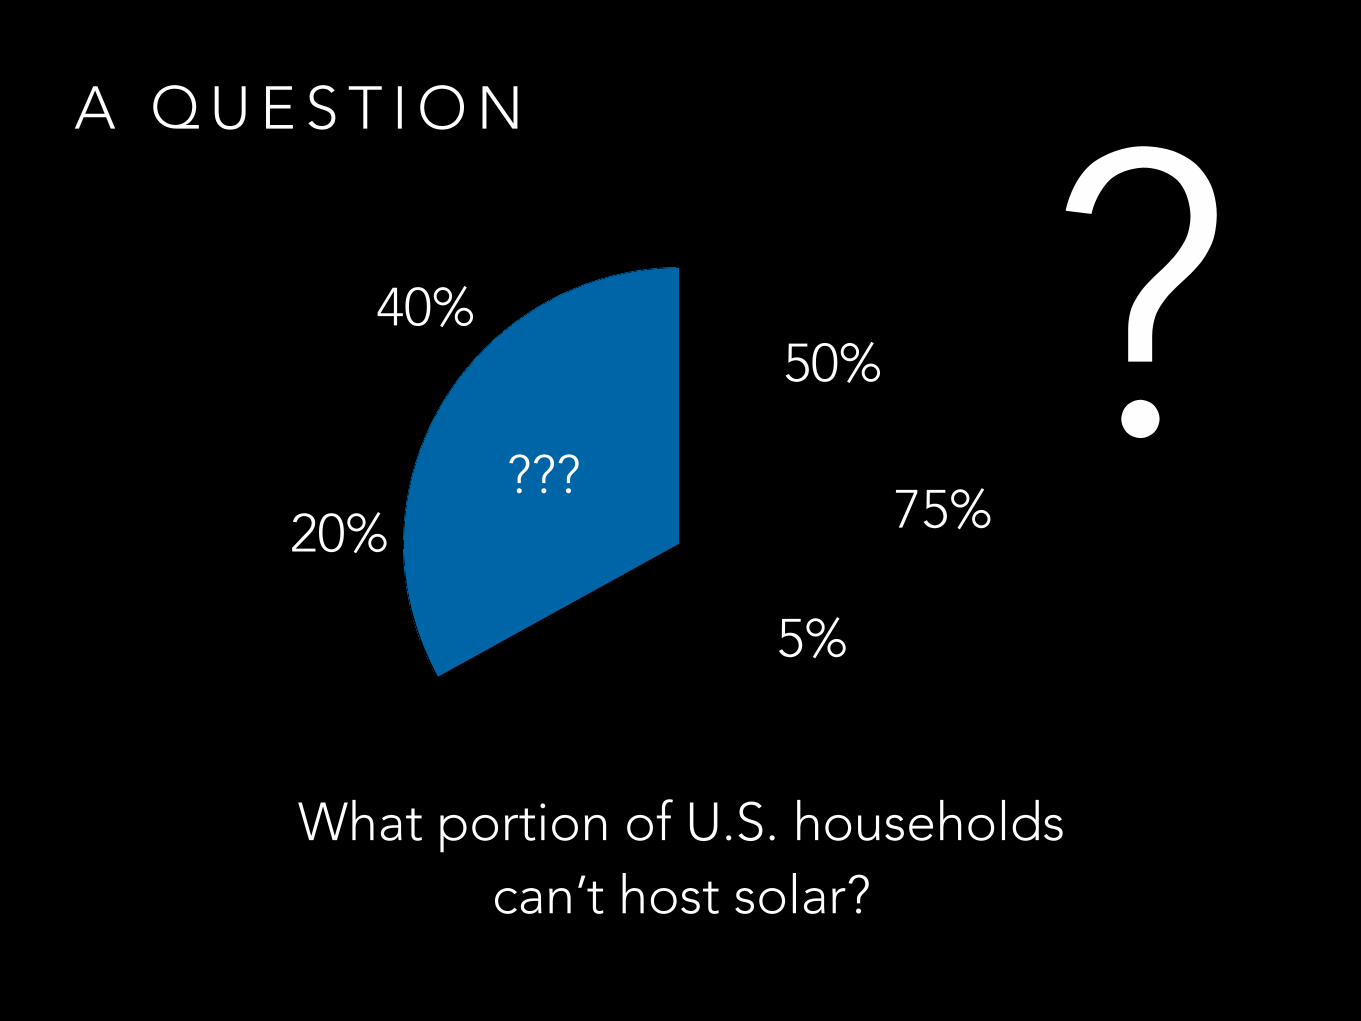
A Q U E S T I O N
50%
What portion of U.S. households can’t host solar?
???
5%
20%
40%
75%
?
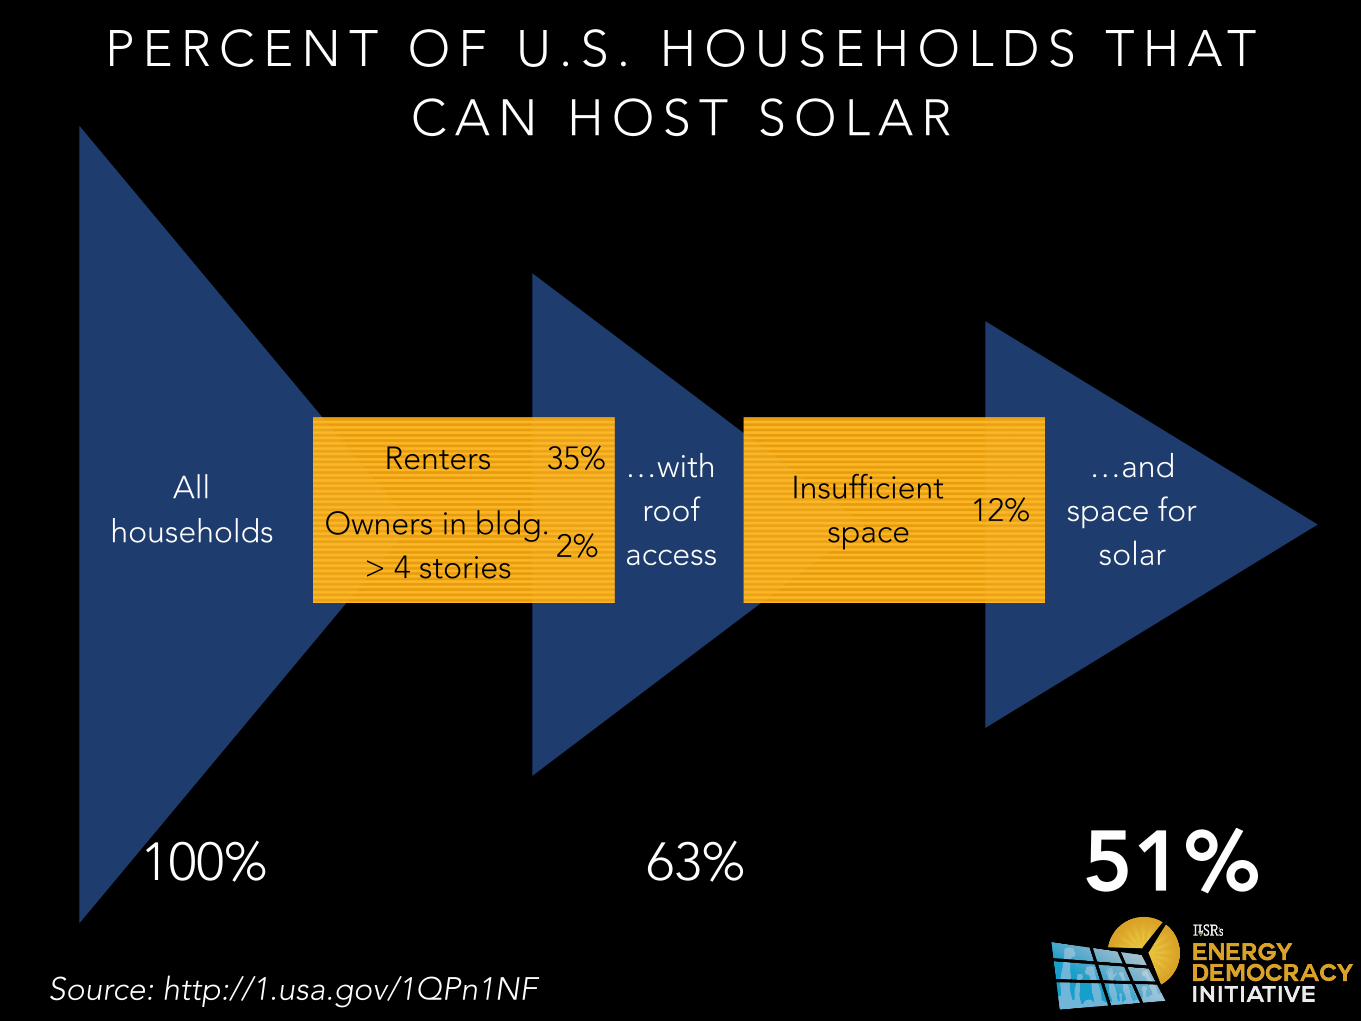
P E R C E N T O F U . S . H O U S E H O L D S T H AT C A N H O S T S O L A R
100% 63%
35%
2%
51%
All households
Renters
Owners in bldg. > 4 stories
12%Insufficient
space
…with roof
access
…and space for
solar
Source: http://1.usa.gov/1QPn1NF

B I G B E N E F I T S
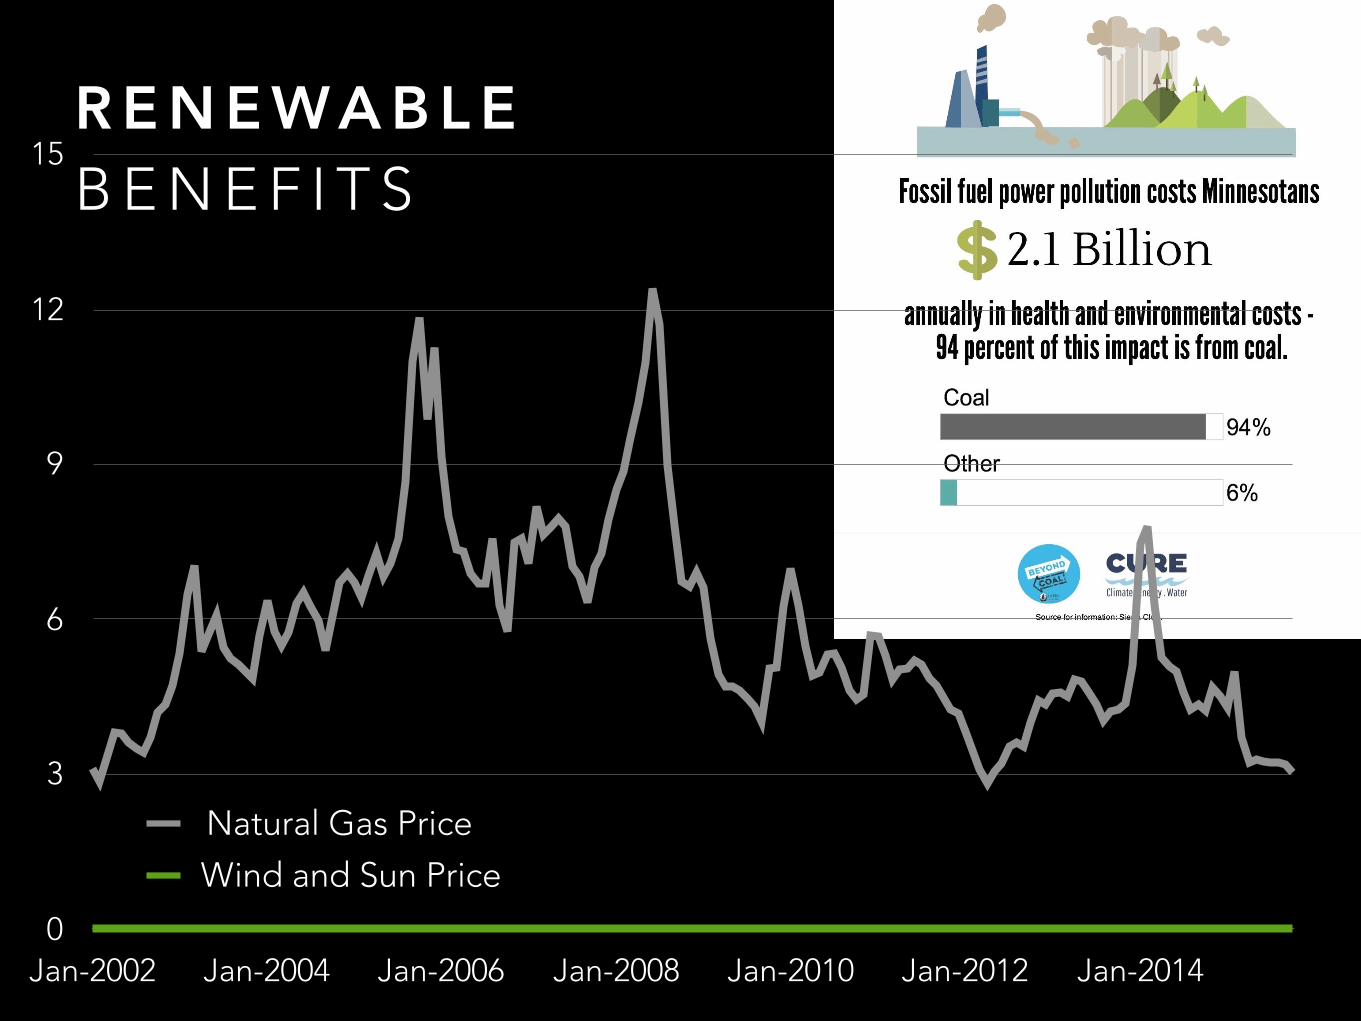
R E N E WA B L E B E N E F I T S
0
3
6
9
12
15
Jan-2002 Jan-2004 Jan-2006 Jan-2008 Jan-2010 Jan-2012 Jan-2014
Natural Gas Price
Wind and Sun Price

D I S T R I B U T E D B E N E F I T S
Solar on Littlestown Hospital
D I S P E R S I N G 1 - M W S O L A R P L A N T S R E D U C E S I N T E G R AT I O N C O S T S
0
1
2
3
4
1 solar project 5 solar projects 25 solar projects
0.3¢
1.1¢
3.9¢
cents per kilowatt-hour
Credit: USDA
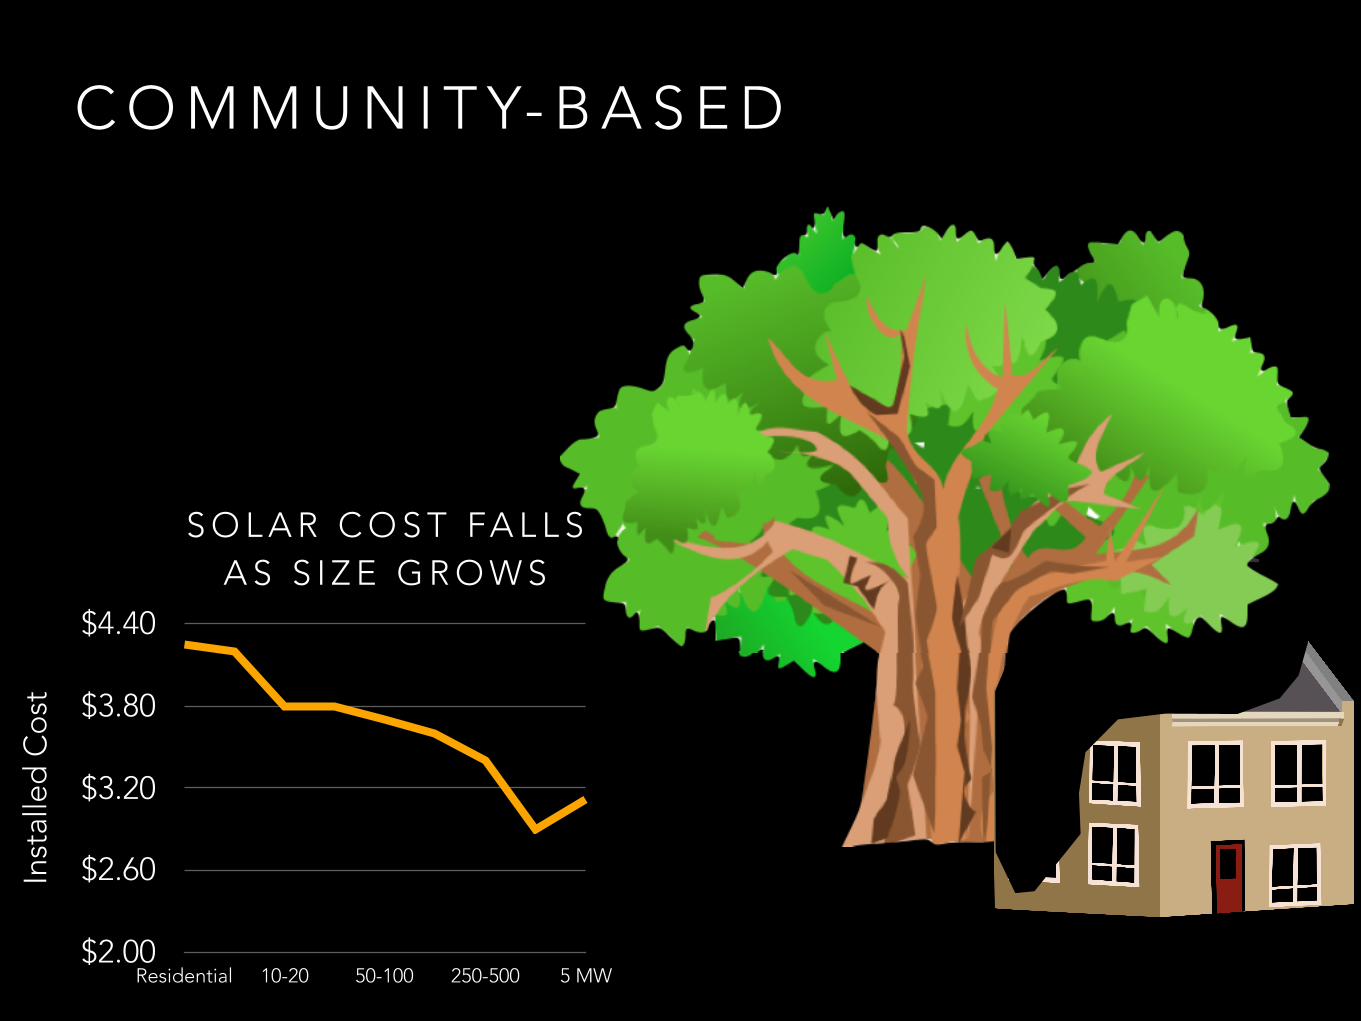
C O M M U N I T Y- B A S E D
Shade tree49%
S O L A R C O S T FA L L S A S S I Z E G R O W S
Inst
alle
d C
ost
$2.00
$2.60
$3.20
$3.80
$4.40
Residential 10-20 50-100 250-500 5 MW
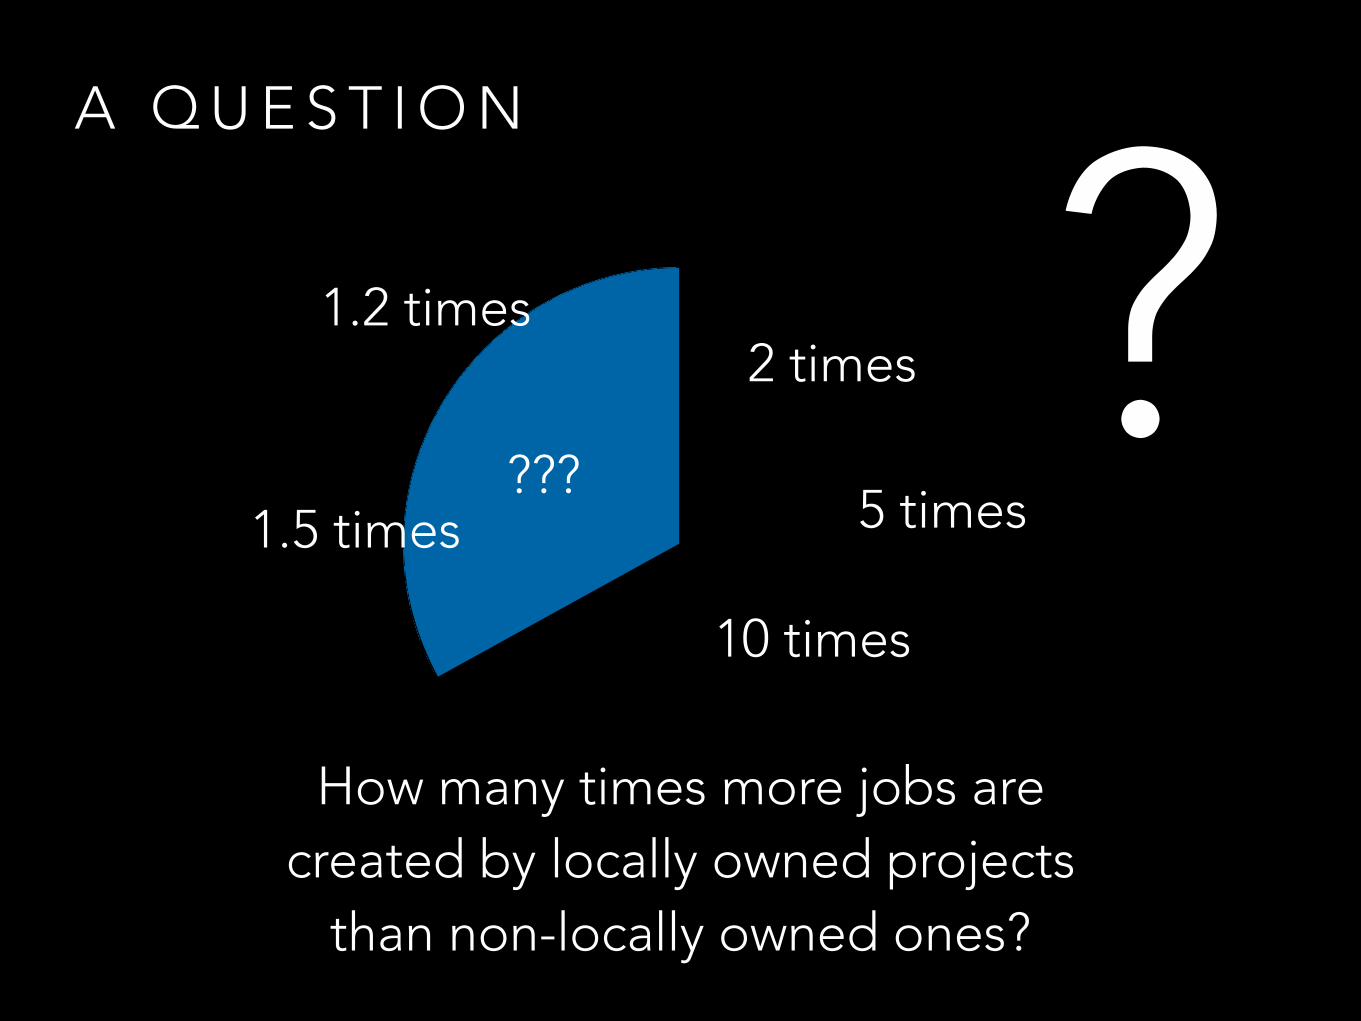
A Q U E S T I O N
2 times
How many times more jobs are created by locally owned projects
than non-locally owned ones?
???
10 times
1.5 times
1.2 times
5 times
?
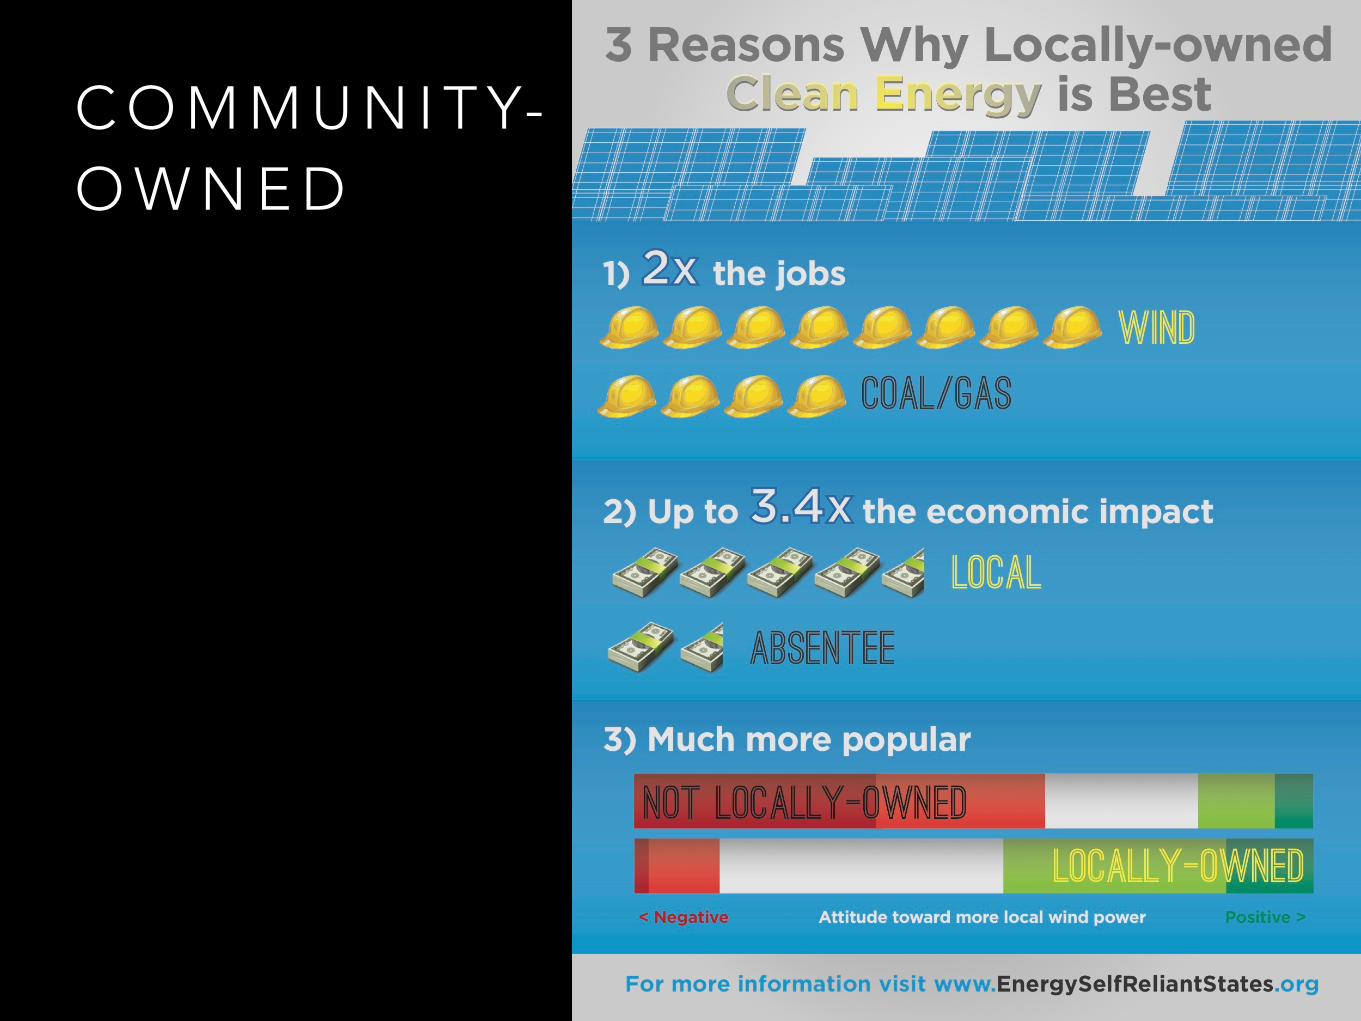
C O M M U N I T Y-O W N E D
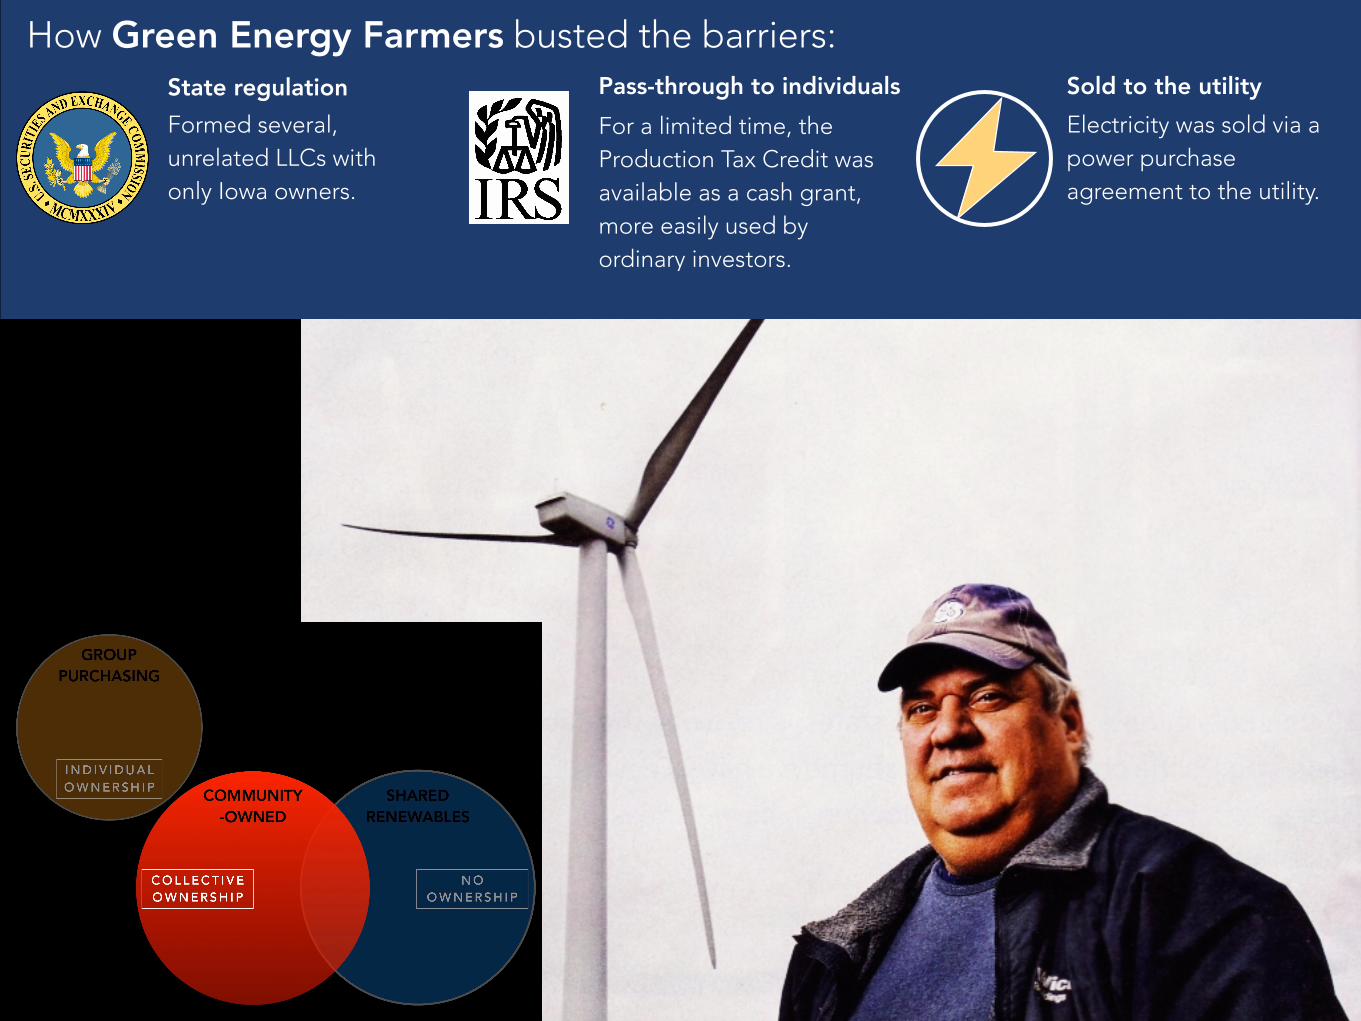
How Green Energy Farmers busted the barriers:
Formed several, unrelated LLCs with only Iowa owners.
State regulation Pass-through to individualsFor a limited time, the Production Tax Credit was available as a cash grant, more easily used by ordinary investors.
Sold to the utilityElectricity was sold via a power purchase agreement to the utility.

B I G B A R R I E R S
0¢
5¢
10¢
15¢
20¢
Lease A Lease B PPA*0¢
5¢
10¢
15¢
20¢
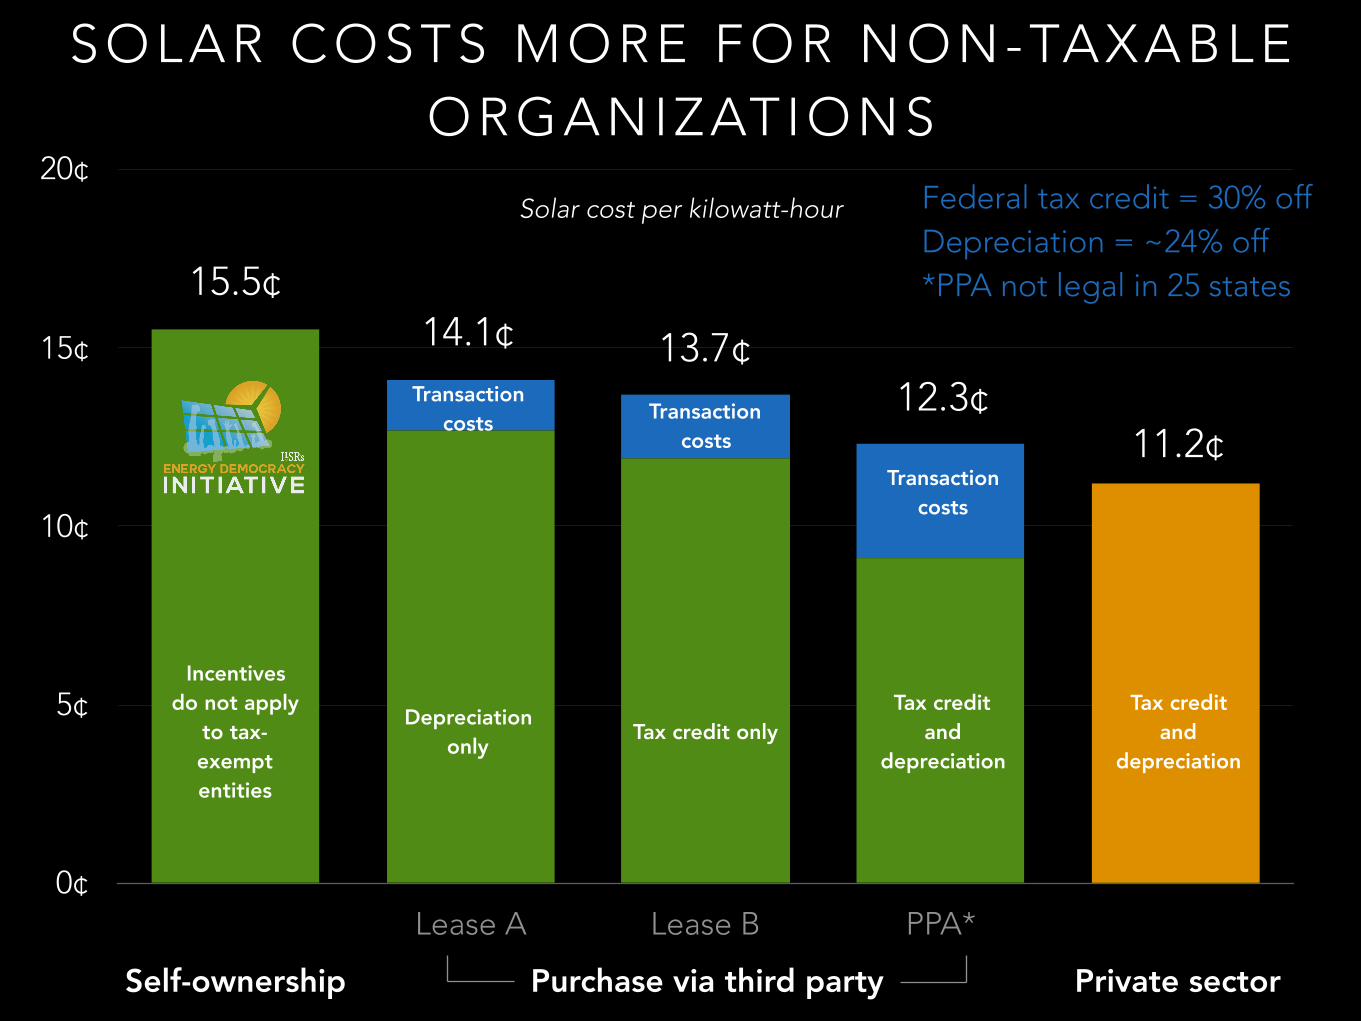
SOLAR COSTS MORE FOR NON-TAXABLE ORGANIZATIONS
Incentives do not apply
to tax-exempt entities
Depreciation only Tax credit only
Tax credit and
depreciation
Transaction costs
Tax credit and
depreciation
Transaction costs
Transaction costs
15.5¢14.1¢ 13.7¢
12.3¢11.2¢
Federal tax credit = 30% off Depreciation = ~24% off *PPA not legal in 25 states
Solar cost per kilowatt-hour
Purchase via third partySelf-ownership Private sector
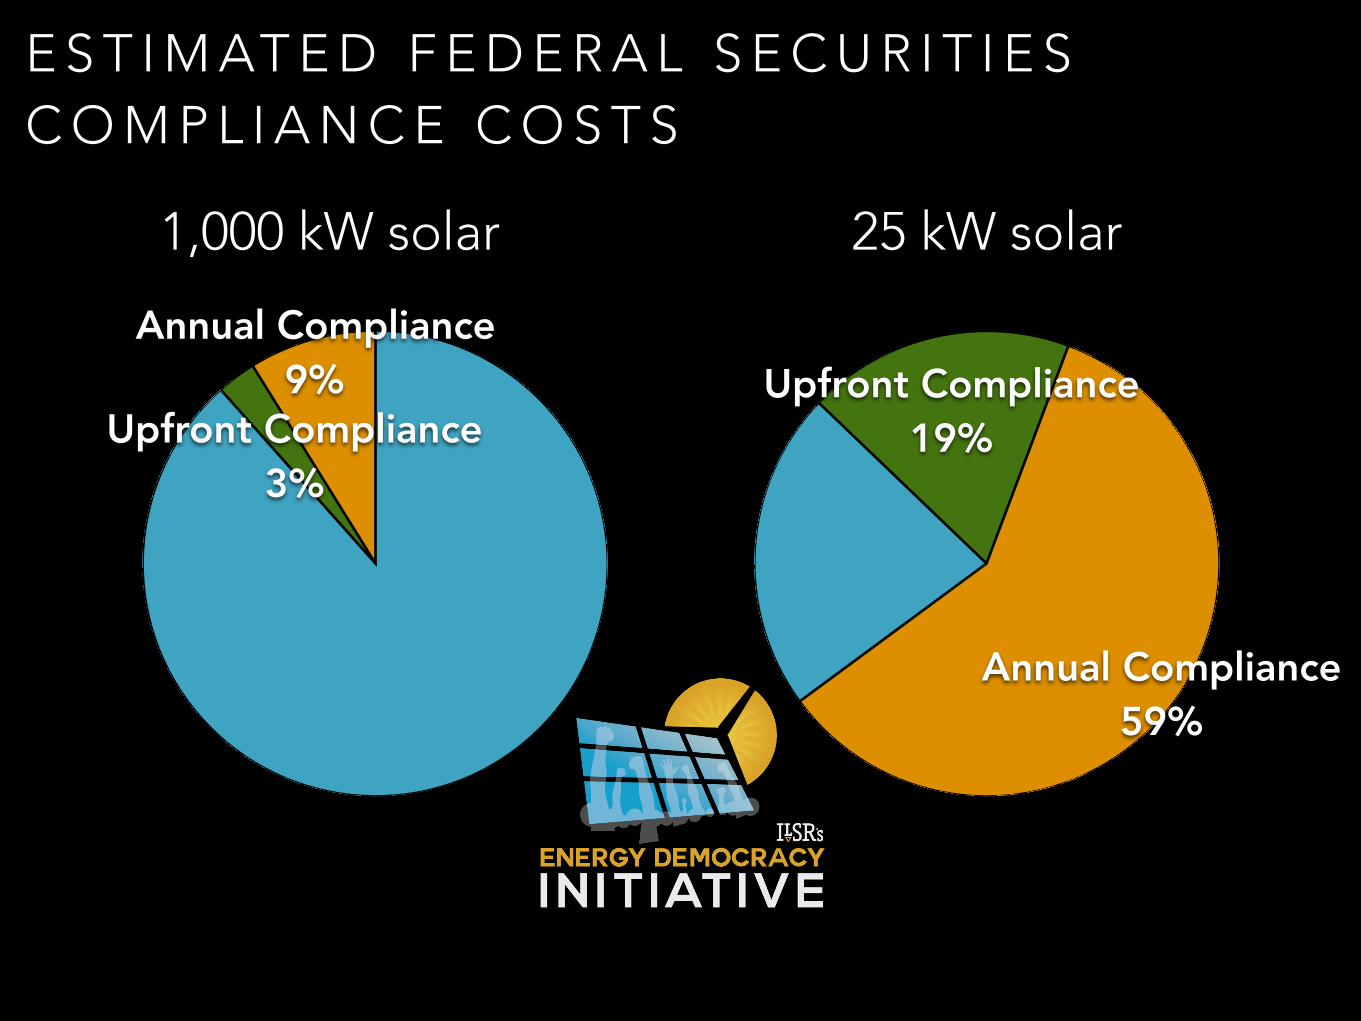
E S T I M AT E D F E D E R A L S E C U R I T I E S C O M P L I A N C E C O S T S
Annual Compliance 9%
Upfront Compliance 3%
Annual Compliance 59%
Upfront Compliance 19%
1,000 kW solar 25 kW solar

S H A R I N G O U T P U T
Prohibited in 34 states
B A R R I E R B U S T I N G : TA X I N C E N T I V E S
A D O P T E D D E C . 2 0 1 5
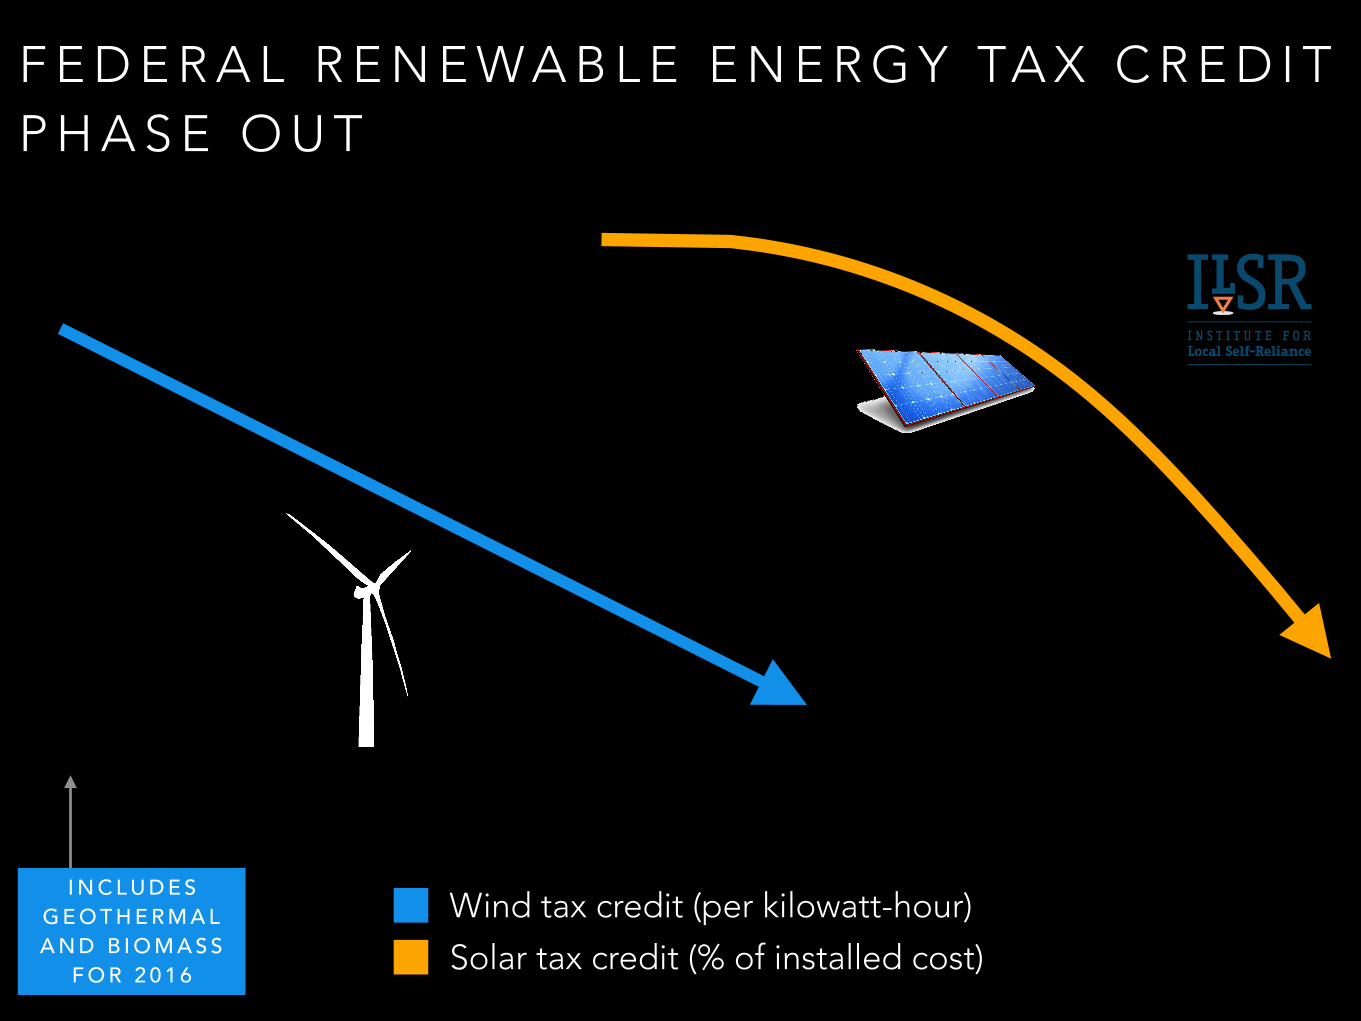
F E D E R A L R E N E W A B L E E N E R G Y TA X C R E D I T P H A S E O U T
0.075
0.225
0
0.75
1.5
2.25
3
2016 2017 2018 2019 2020 2021 2022
Wind tax credit (per kilowatt-hour)
Solar tax credit (% of installed cost)
10%
22%
26%
30%30%30%30%
0.0¢
0.9¢
1.4¢
1.8¢
2.3¢
I N C L U D E S G E O T H E R M A L A N D B I O M A S S
F O R 2 0 1 6
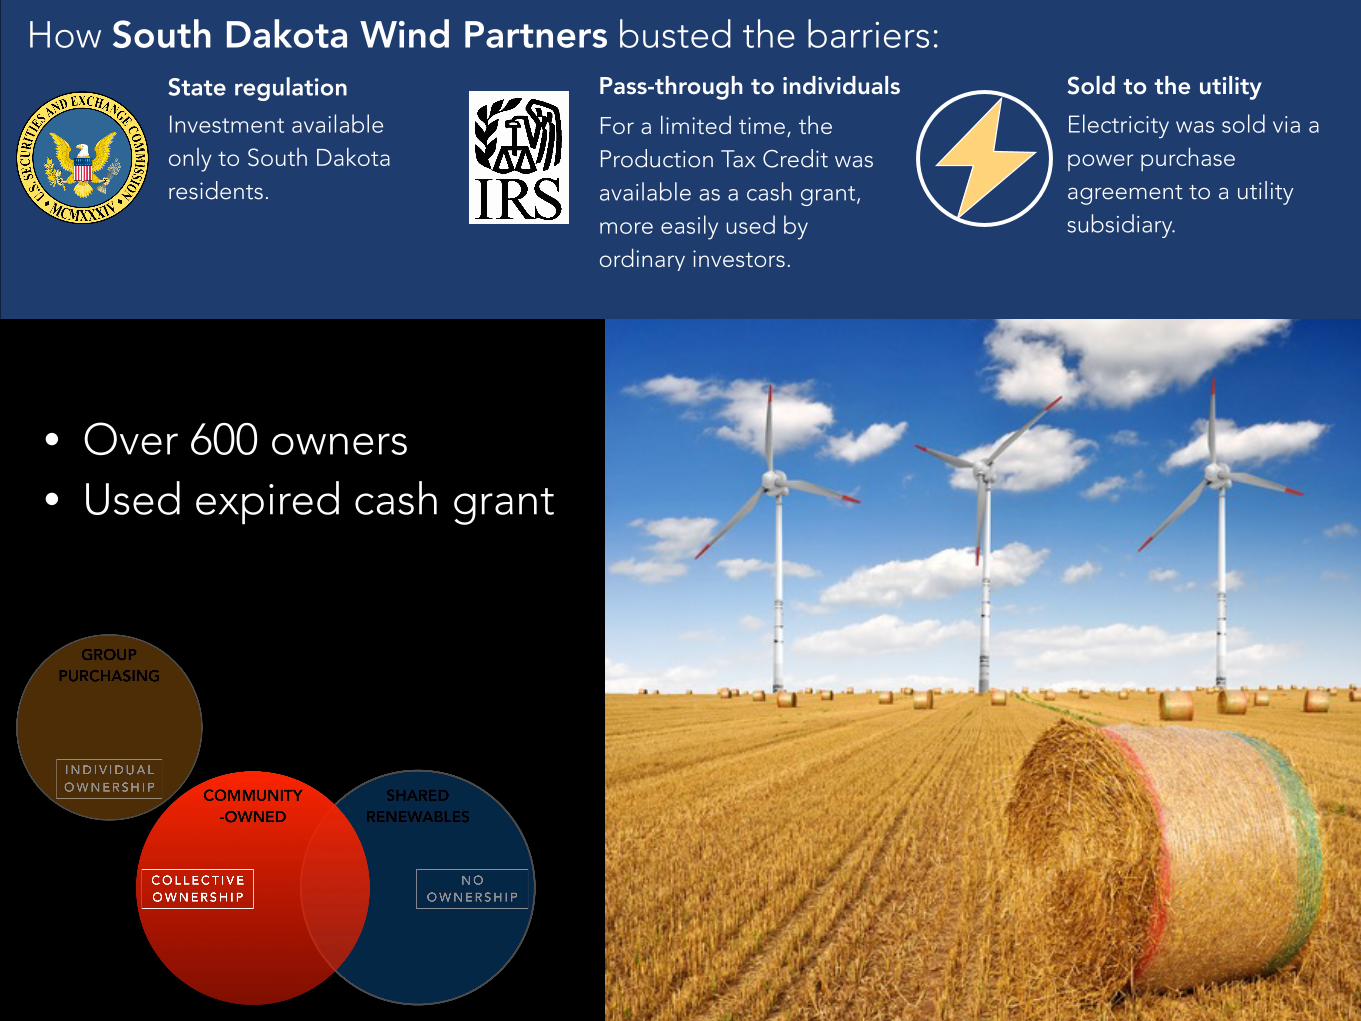
How South Dakota Wind Partners busted the barriers:
Investment available only to South Dakota residents.
State regulation Pass-through to individualsFor a limited time, the Production Tax Credit was available as a cash grant, more easily used by ordinary investors.
Sold to the utilityElectricity was sold via a power purchase agreement to a utility subsidiary.
• Over 600 owners • Used expired cash grant
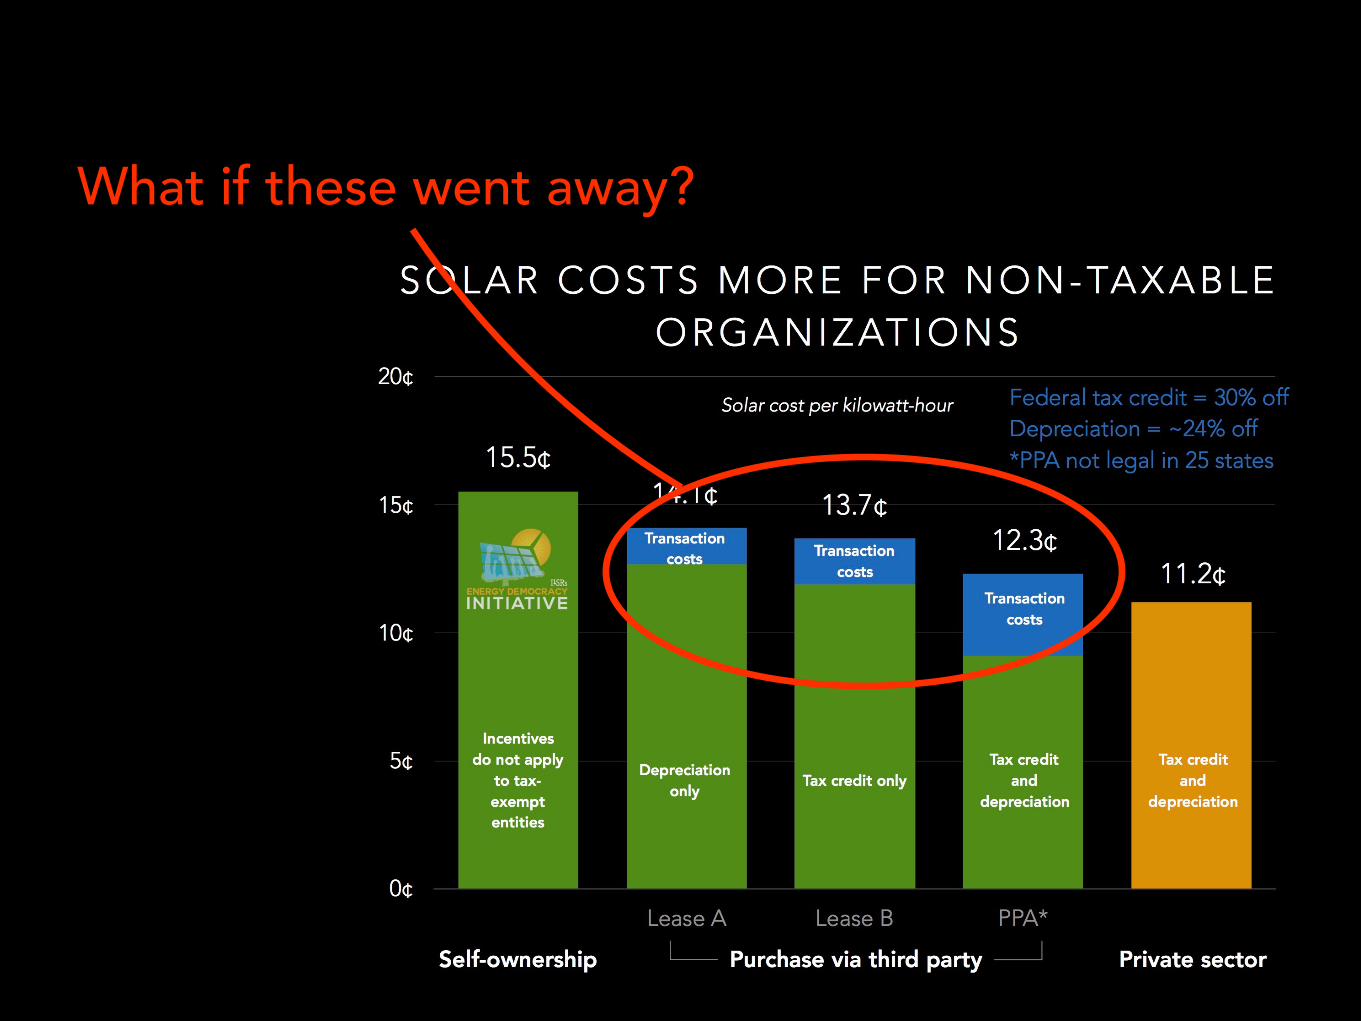
What if these went away?
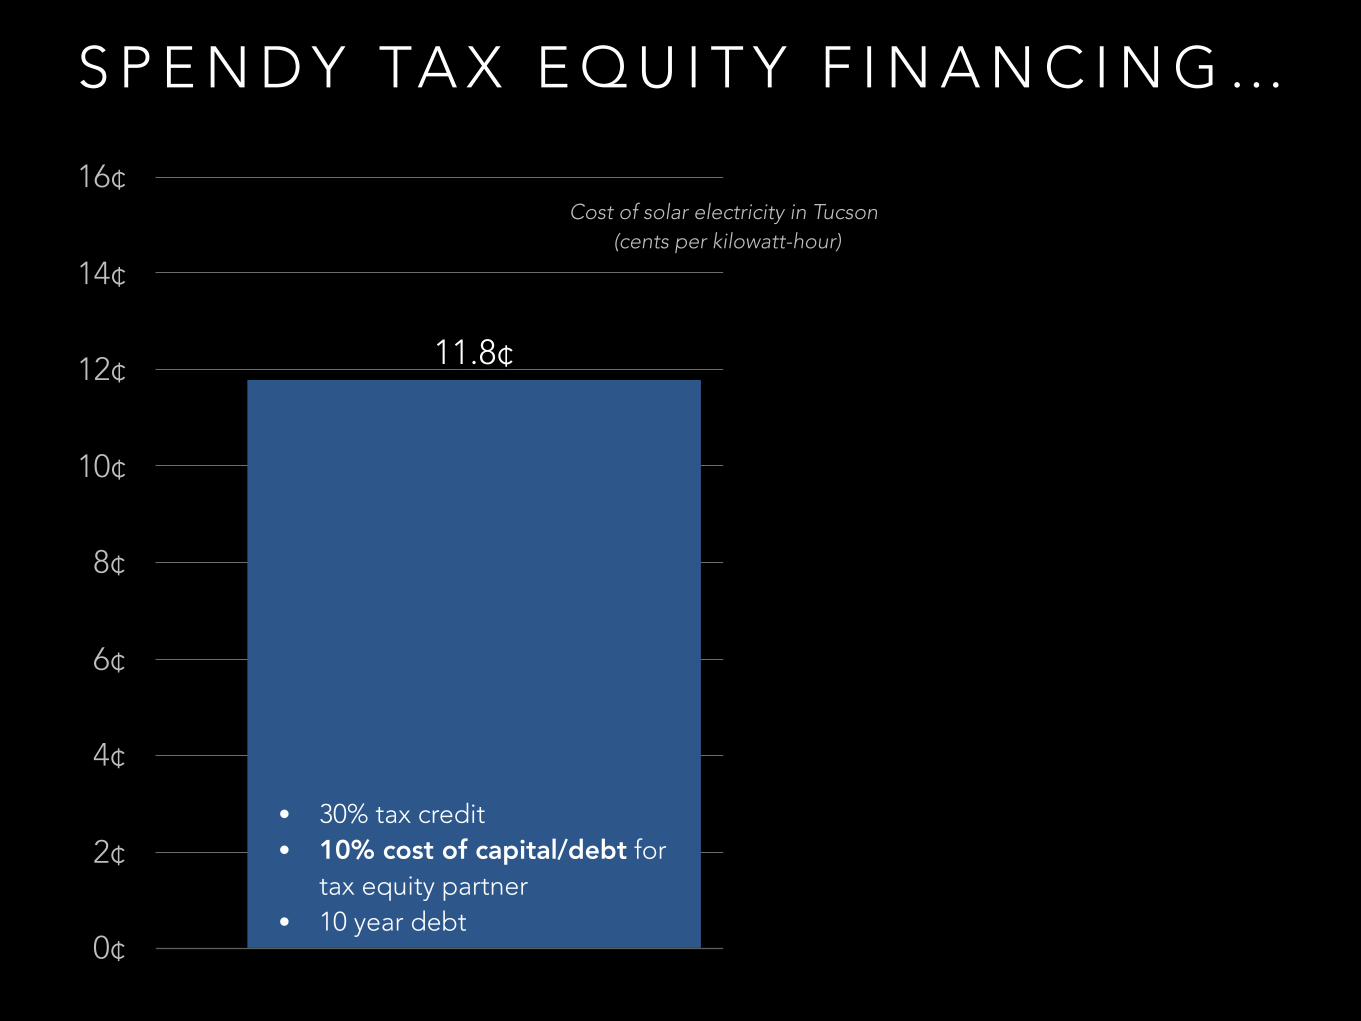
S P E N D Y TA X E Q U I T Y F I N A N C I N G …
0¢
2¢
4¢
6¢
8¢
10¢
12¢
14¢
16¢
12.1¢11.8¢
• NO tax credit • 5% cost of capital/
debt • 20 year debt
LOSS OF 30% TAX CREDIT ONLY RAISES
COST BY 2.5%
Cost of solar electricity in Tucson (cents per kilowatt-hour)
• 30% tax credit • 10% cost of capital/debt for
tax equity partner • 10 year debt
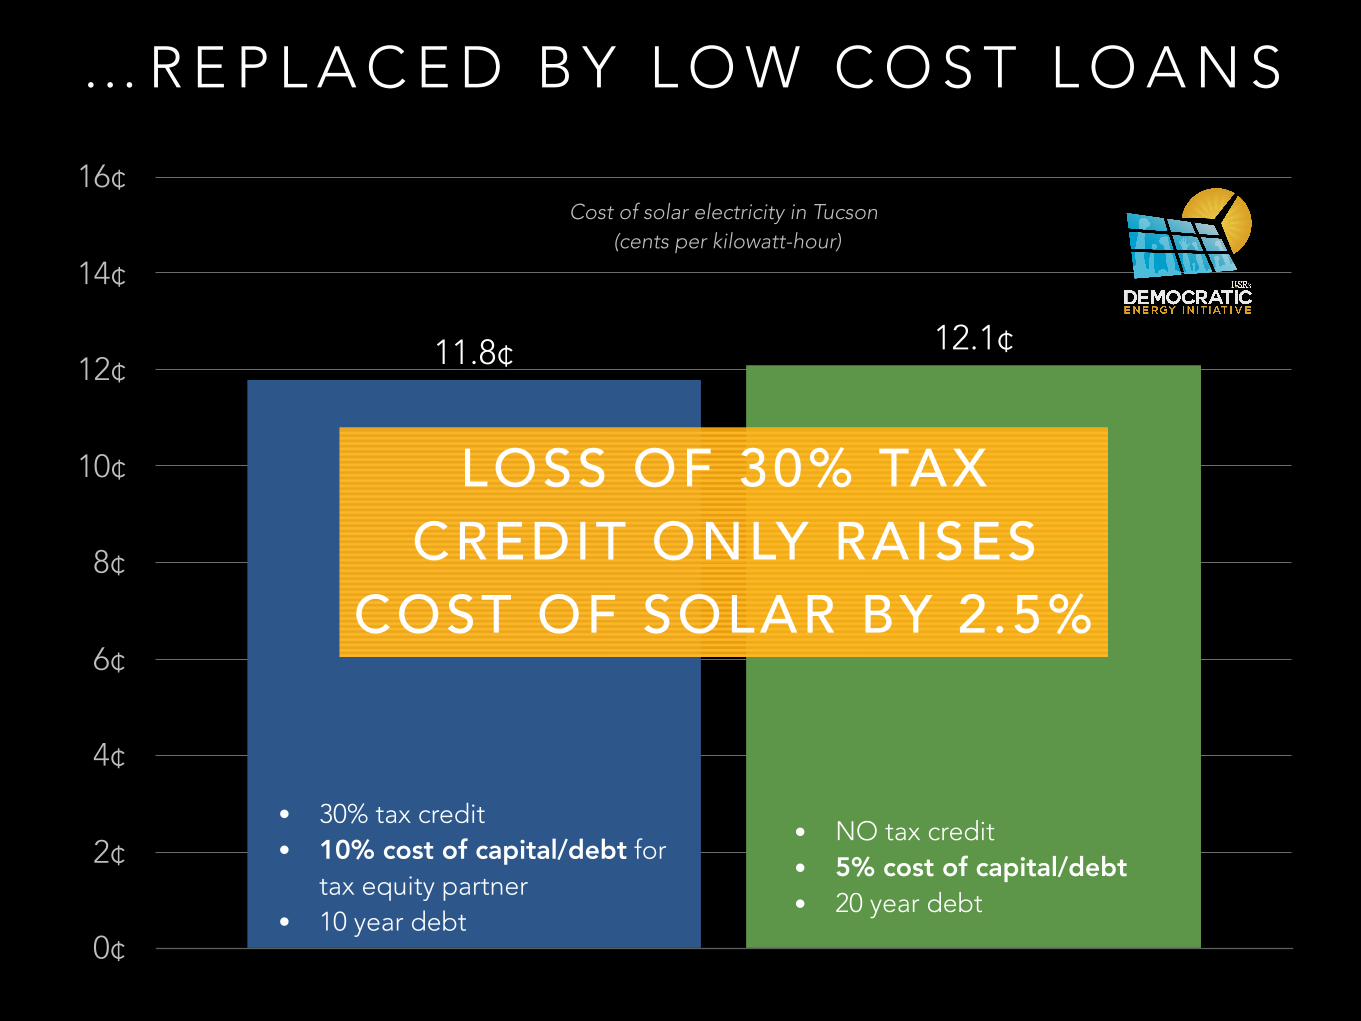
… R E P L A C E D B Y L O W C O S T L O A N S
0¢
2¢
4¢
6¢
8¢
10¢
12¢
14¢
16¢
12.1¢11.8¢
Cost of solar electricity in Tucson (cents per kilowatt-hour)
• 30% tax credit • 10% cost of capital/debt for
tax equity partner • 10 year debt
• NO tax credit • 5% cost of capital/debt • 20 year debt
LOSS OF 30% TAX CREDIT ONLY RAISES
COST OF SOLAR BY 2.5%
B A R R I E R B U S T I N G : S E C U R I T I E S
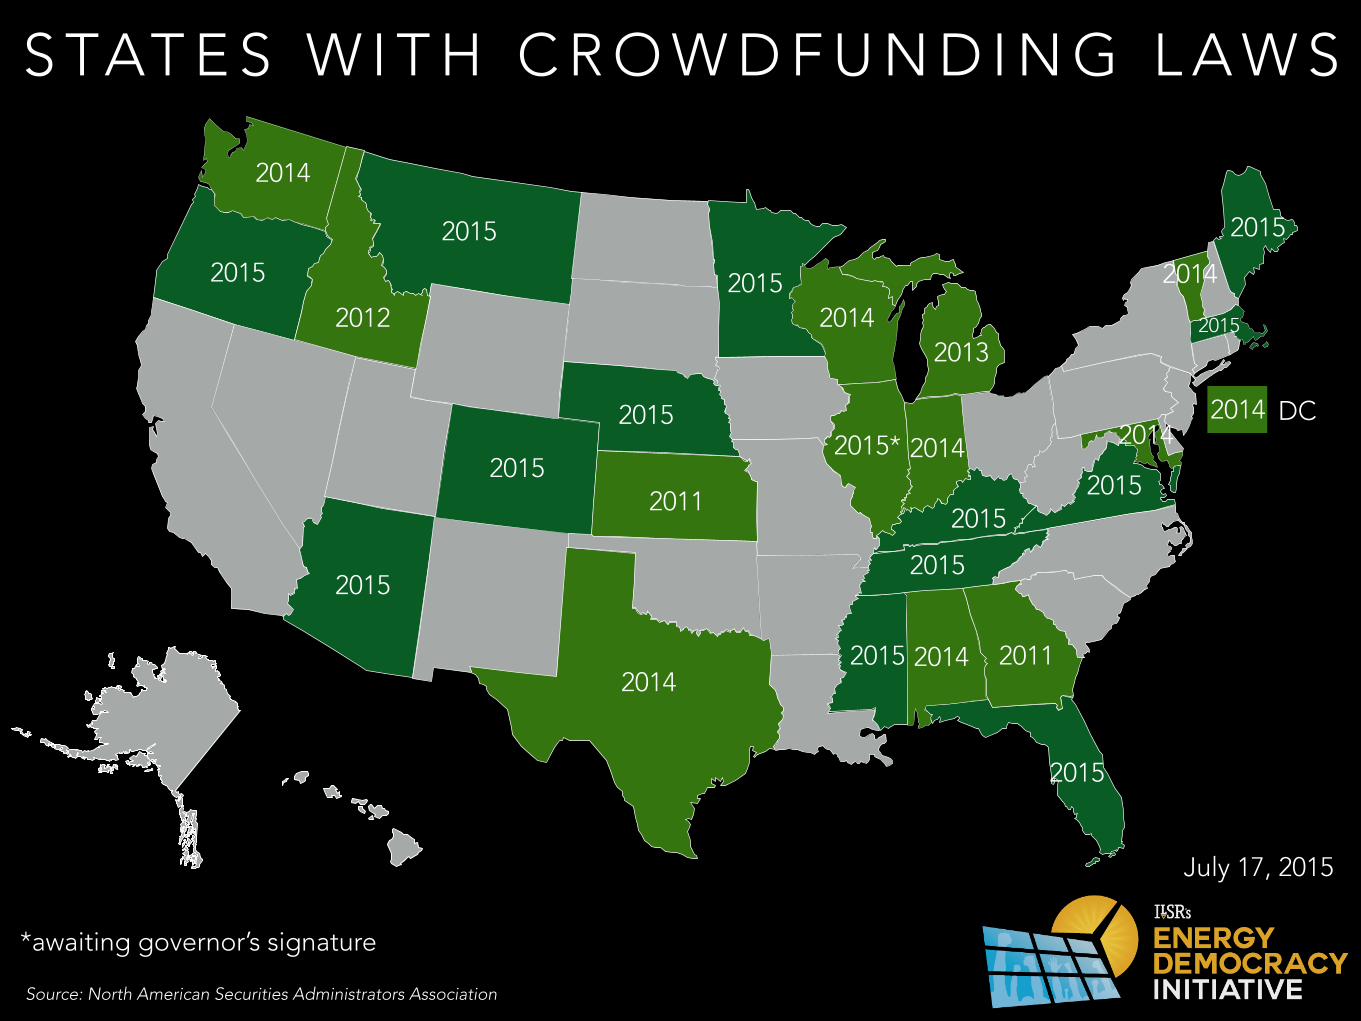
S TAT E S W I T H C R O W D F U N D I N G L A W S
2014
2015
2015
2015
2011
2012
2015*
*awaiting governor’s signature
2011
2014
2015
2015
2015
2015
2015
2013
20142015
2015
2015
2015
2014
2014
2015
2014
2014
DC2014
Source: North American Securities Administrators Association
July 17, 2015

S TAT E C R O W D F U N D I N G L A W S
$1 millionordinary investors
online
reduced compliance
in-state only
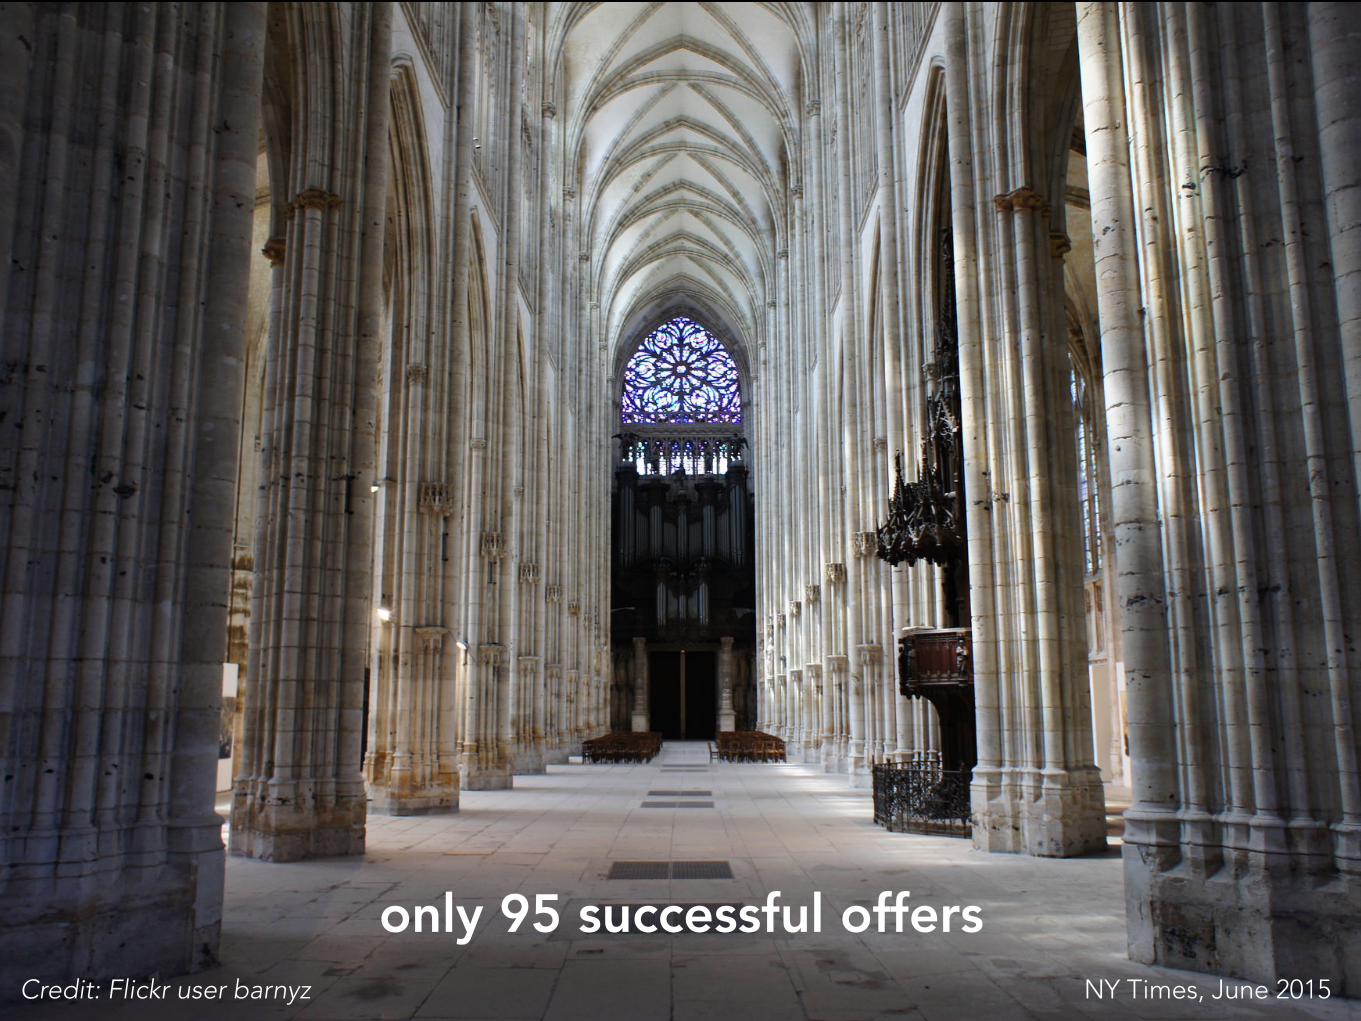
only 95 successful offersNY Times, June 2015Credit: Flickr user barnyz
B A R R I E R B U S T I N G : E L E C T R I C I T Y S H A R I N G
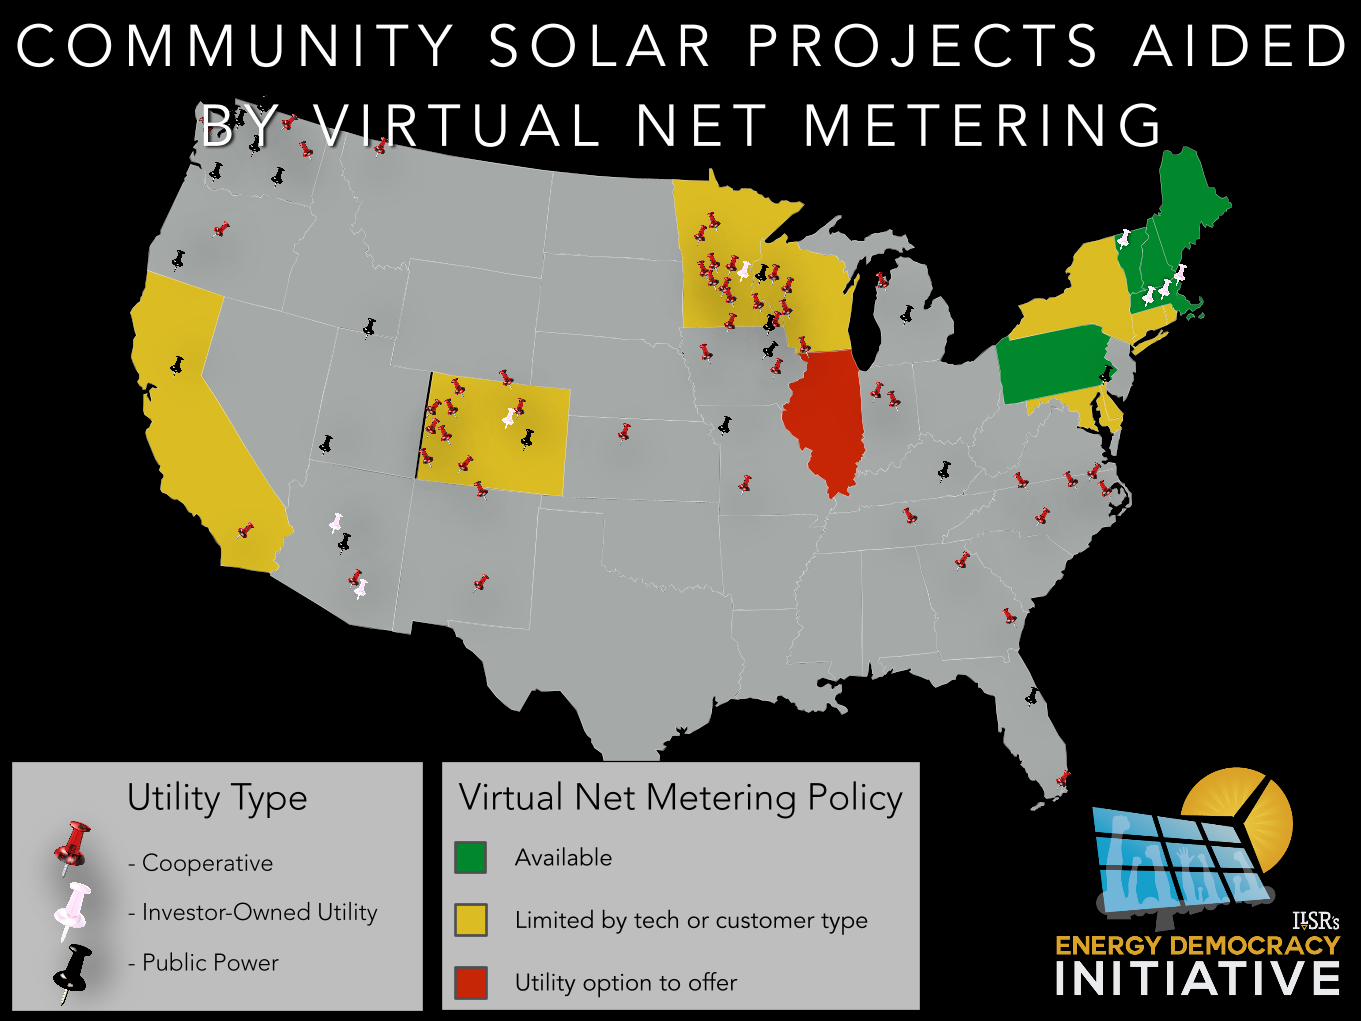
C O M M U N I T Y S O L A R P R O J E C T S A I D E D B Y V I R T U A L N E T M E T E R I N G
Utility Type
- Cooperative
- Investor-Owned Utility
- Public Power
Available
Limited by tech or customer type
Utility option to offer
Virtual Net Metering Policy
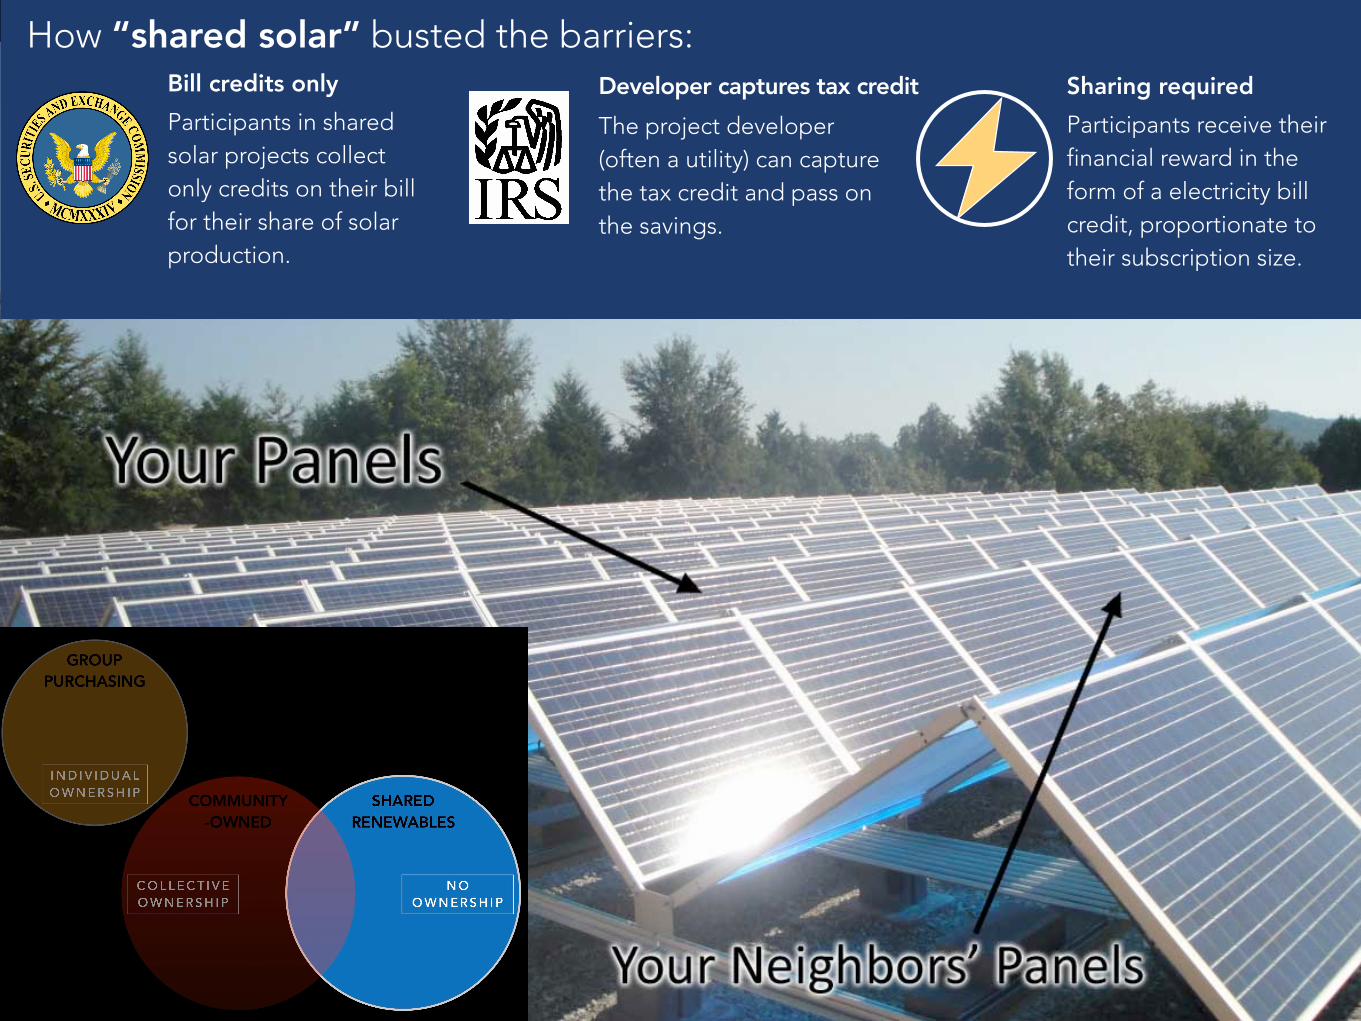
How “shared solar” busted the barriers:
Participants in shared solar projects collect only credits on their bill for their share of solar production.
Bill credits only Developer captures tax creditThe project developer (often a utility) can capture the tax credit and pass on the savings.
Sharing requiredParticipants receive their financial reward in the form of a electricity bill credit, proportionate to their subscription size.
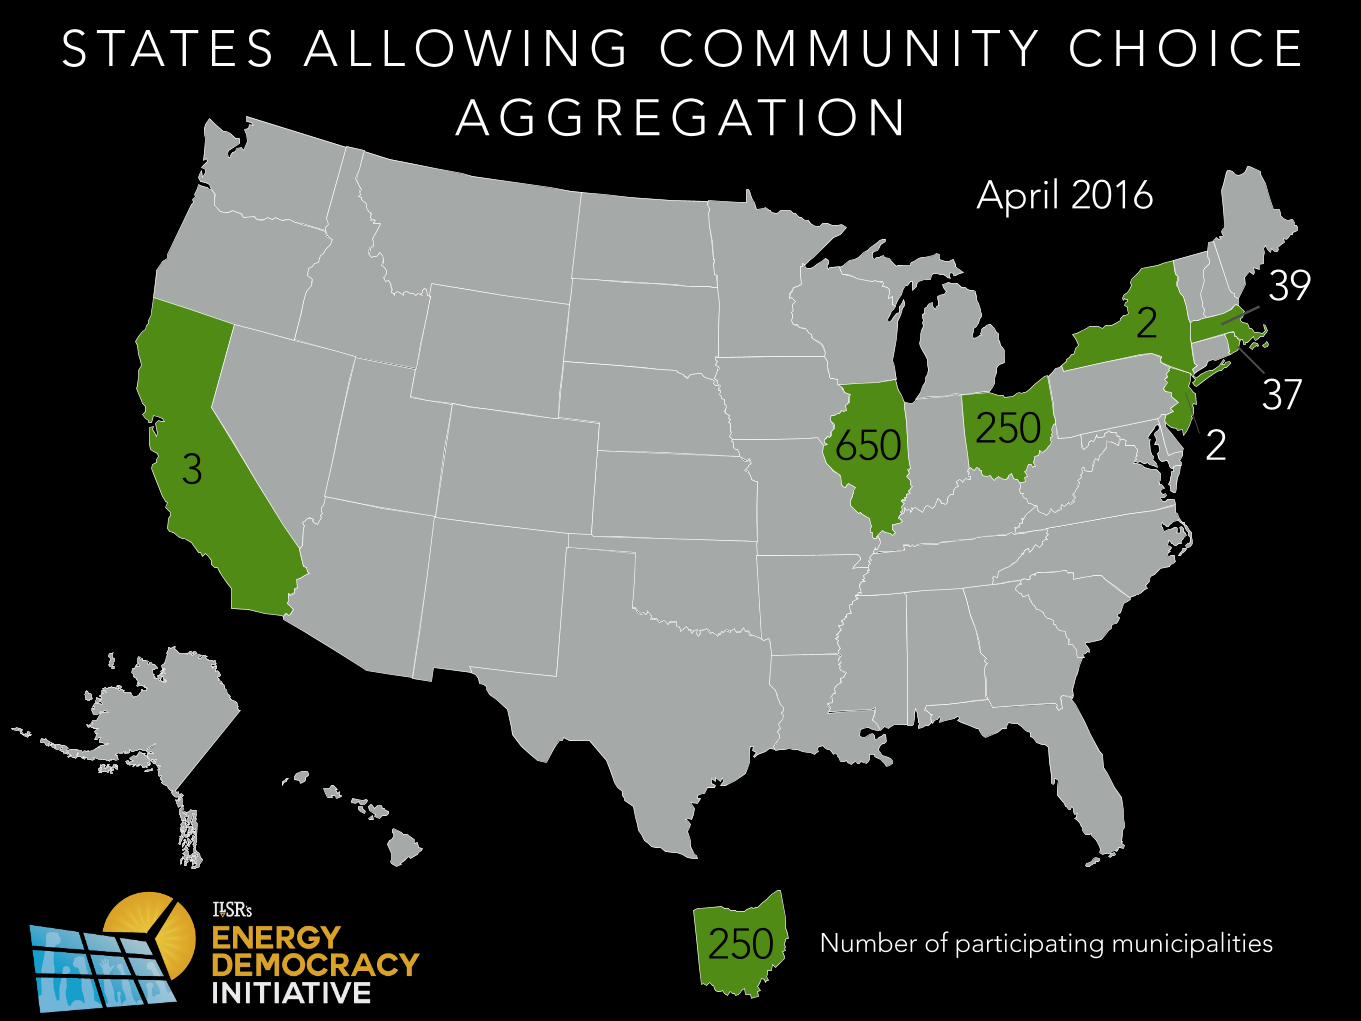
S TAT E S A L L O W I N G C O M M U N I T Y C H O I C E A G G R E G AT I O N
3 650
39
Number of participating municipalities
225037
250
2
April 2016
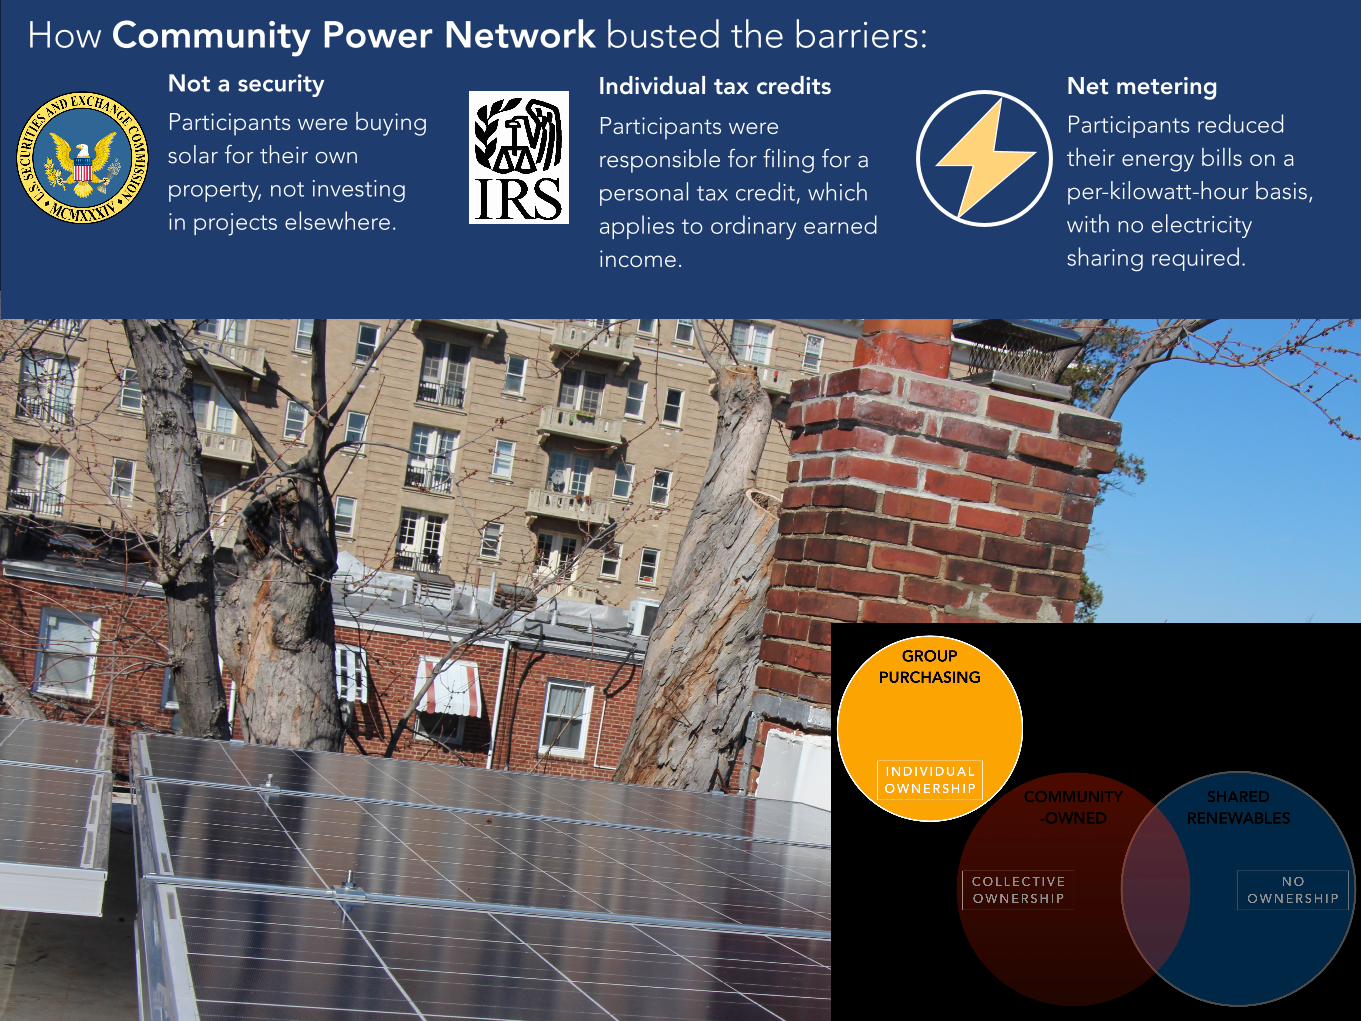
How Community Power Network busted the barriers:
Participants were buying solar for their own property, not investing in projects elsewhere.
Not a security Individual tax creditsParticipants were responsible for filing for a personal tax credit, which applies to ordinary earned income.
Net meteringParticipants reduced their energy bills on a per-kilowatt-hour basis, with no electricity sharing required.

A G O L D S TA N D A R D ?
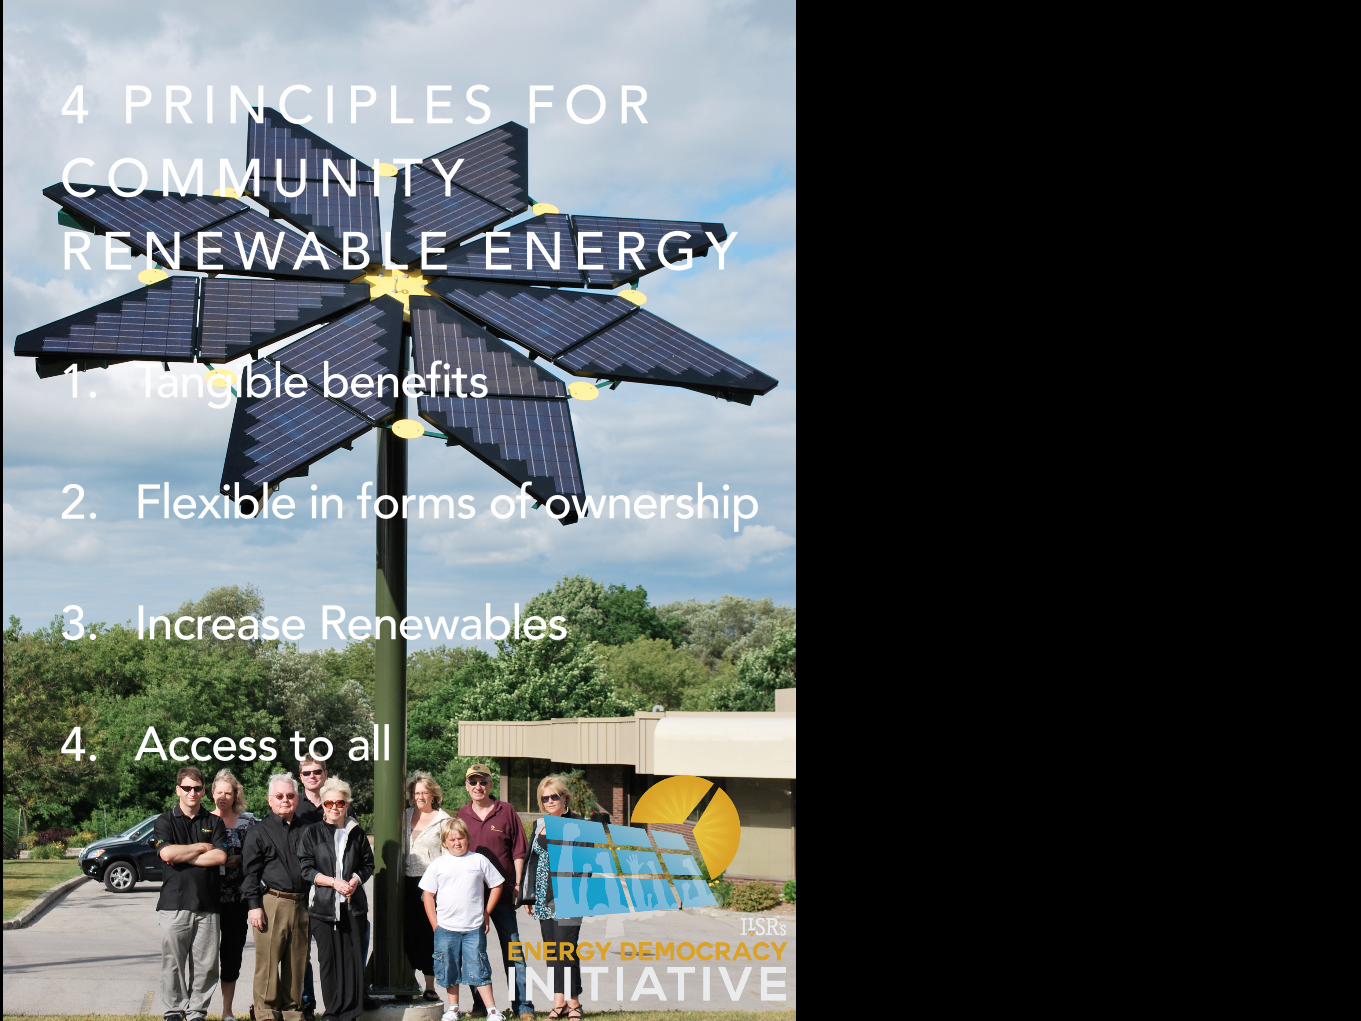
4 P R I N C I P L E S F O R C O M M U N I T Y R E N E WA B L E E N E R G Y
1. Tangible benefits
2. Flexible in forms of ownership
3. Increase Renewables
4. Access to all

Q U E S T I O N : W H I C H PAY S B E T T E R ?
?or
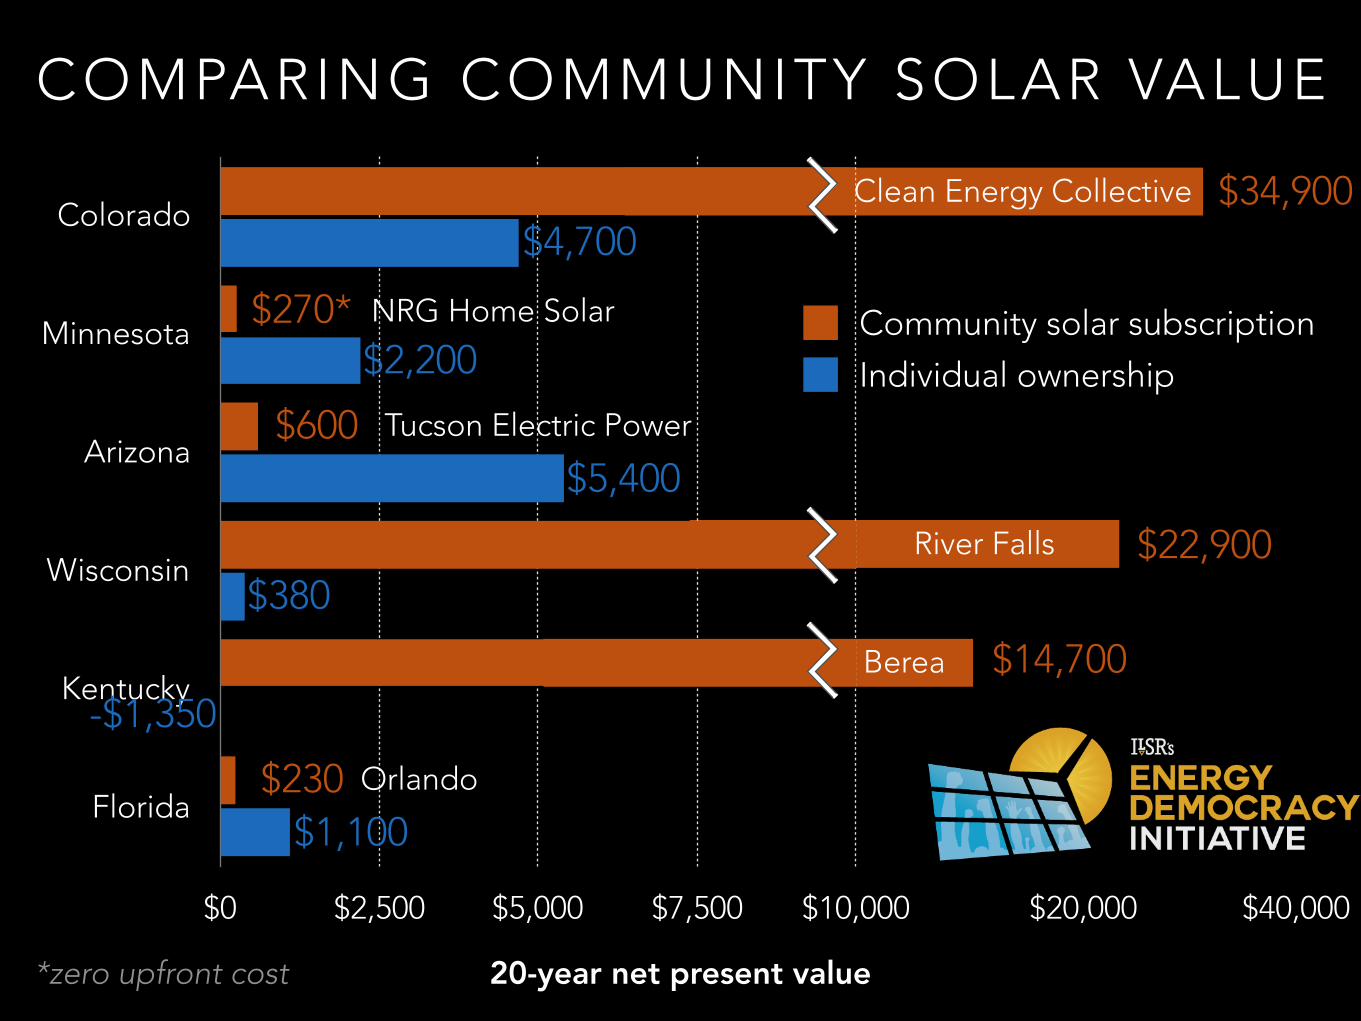
COMPARING COMMUNITY SOLAR VALUE
Colorado
Minnesota
Arizona
Wisconsin
Kentucky
Florida
$0 $2,500 $5,000 $7,500 $10,000
$1,100
-$1,350
$380
$5,400
$2,200
$4,700
Community solar subscription
Individual ownership
*zero upfront cost
$270*
$34,900
$600
$22,900
$14,700
$230
$40,000$20,000
20-year net present value
Clean Energy Collective
NRG Home Solar
Tucson Electric Power
River Falls
Berea
Orlando
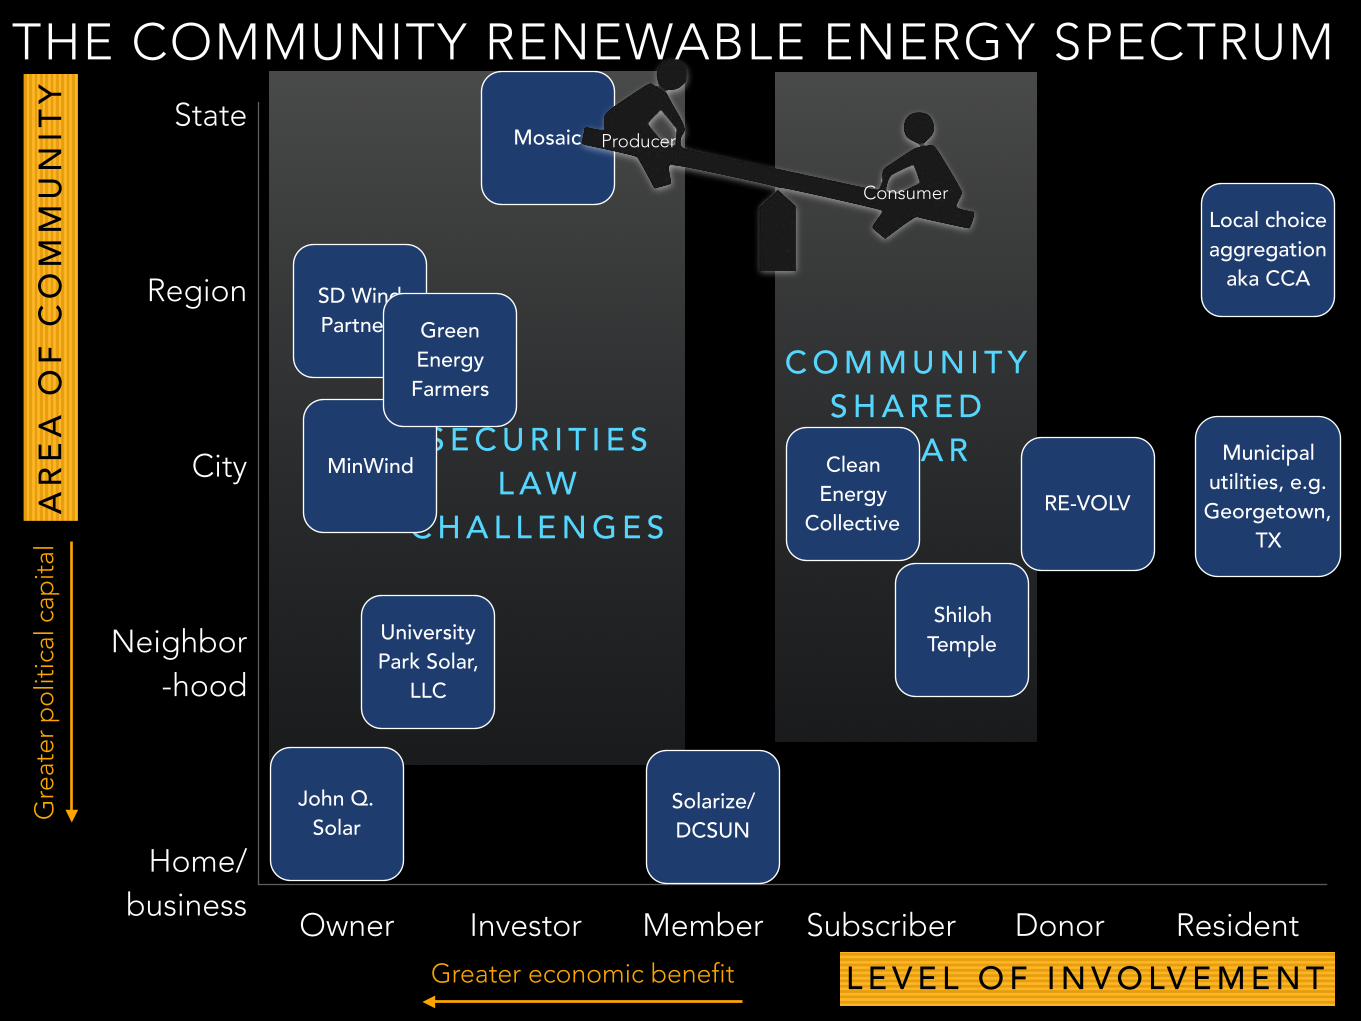
Owner Investor Member Subscriber Donor Resident
S E C U R I T I E S L AW
C H A L L E N G E S
MinWind
C O M M U N I T Y S H A R E D S O L A R
THE COMMUNITY RENEWABLE ENERGY SPECTRUMState
Region
City
Neighbor -hood
Home/ business
ARE
A O
F C
OM
MU
NIT
Y
L E V E L O F I N V O LV E M E N T
Clean Energy
Collective
John Q. Solar
University Park Solar,
LLC
Mosaic
SD Wind Partners Green
Energy Farmers
Shiloh Temple
RE-VOLV
Solarize/ DCSUN
Municipal utilities, e.g. Georgetown,
TX
Greater economic benefit
Gre
ater
po
litic
al c
apita
l
Local choice aggregation
aka CCA
Consumer
Producer
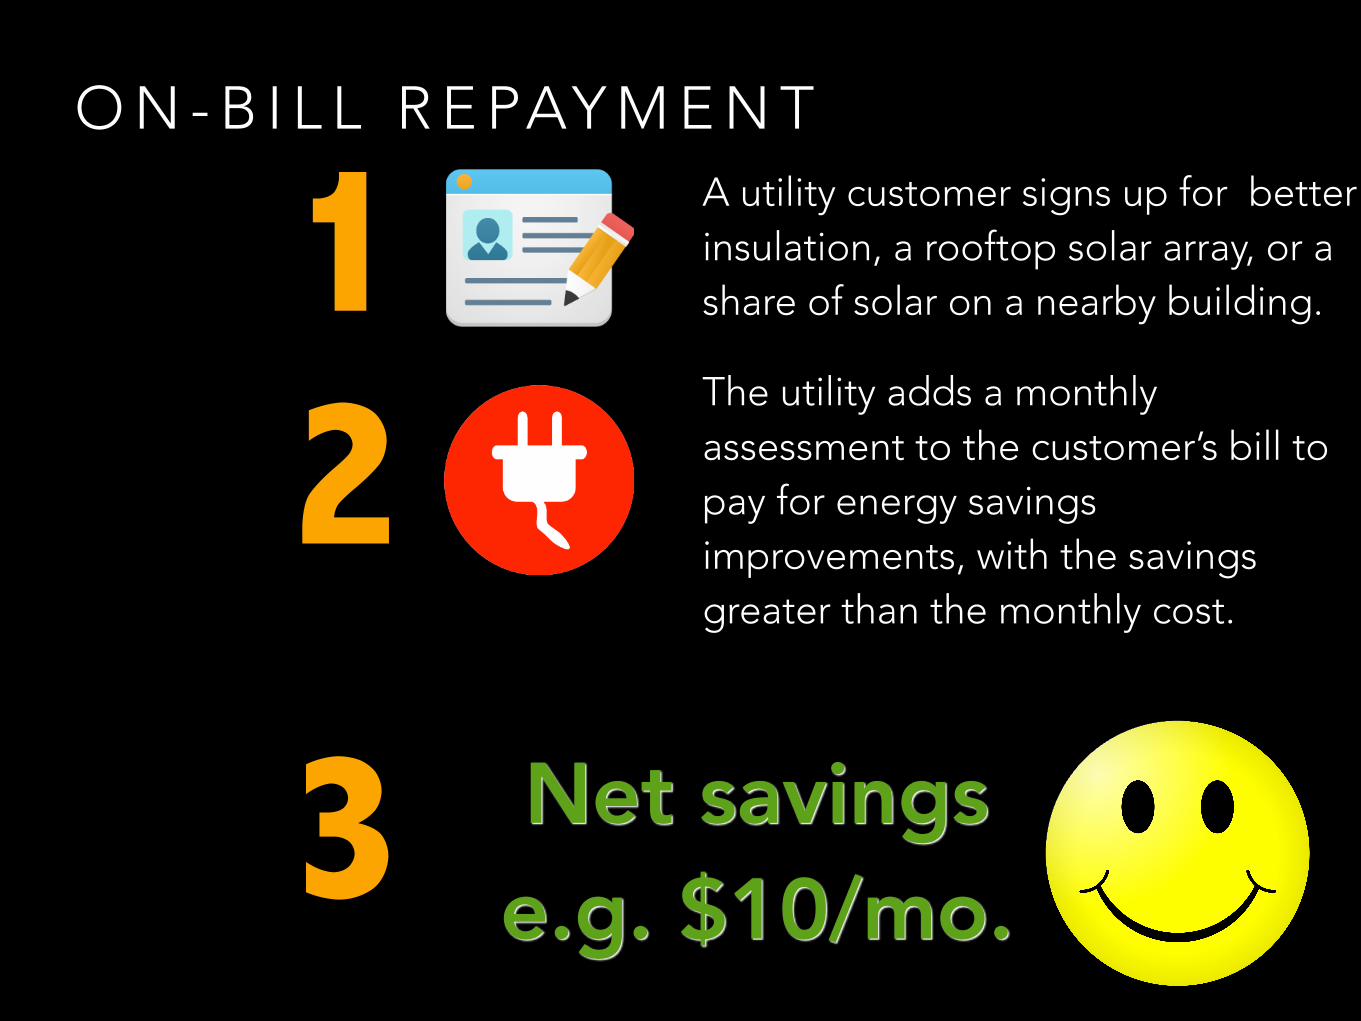
O N - B I L L R E PAY M E N T
The utility adds a monthly assessment to the customer’s bill to pay for energy savings improvements, with the savings greater than the monthly cost.
A utility customer signs up for better insulation, a rooftop solar array, or a share of solar on a nearby building.
Net savings e.g. $10/mo.
12
3
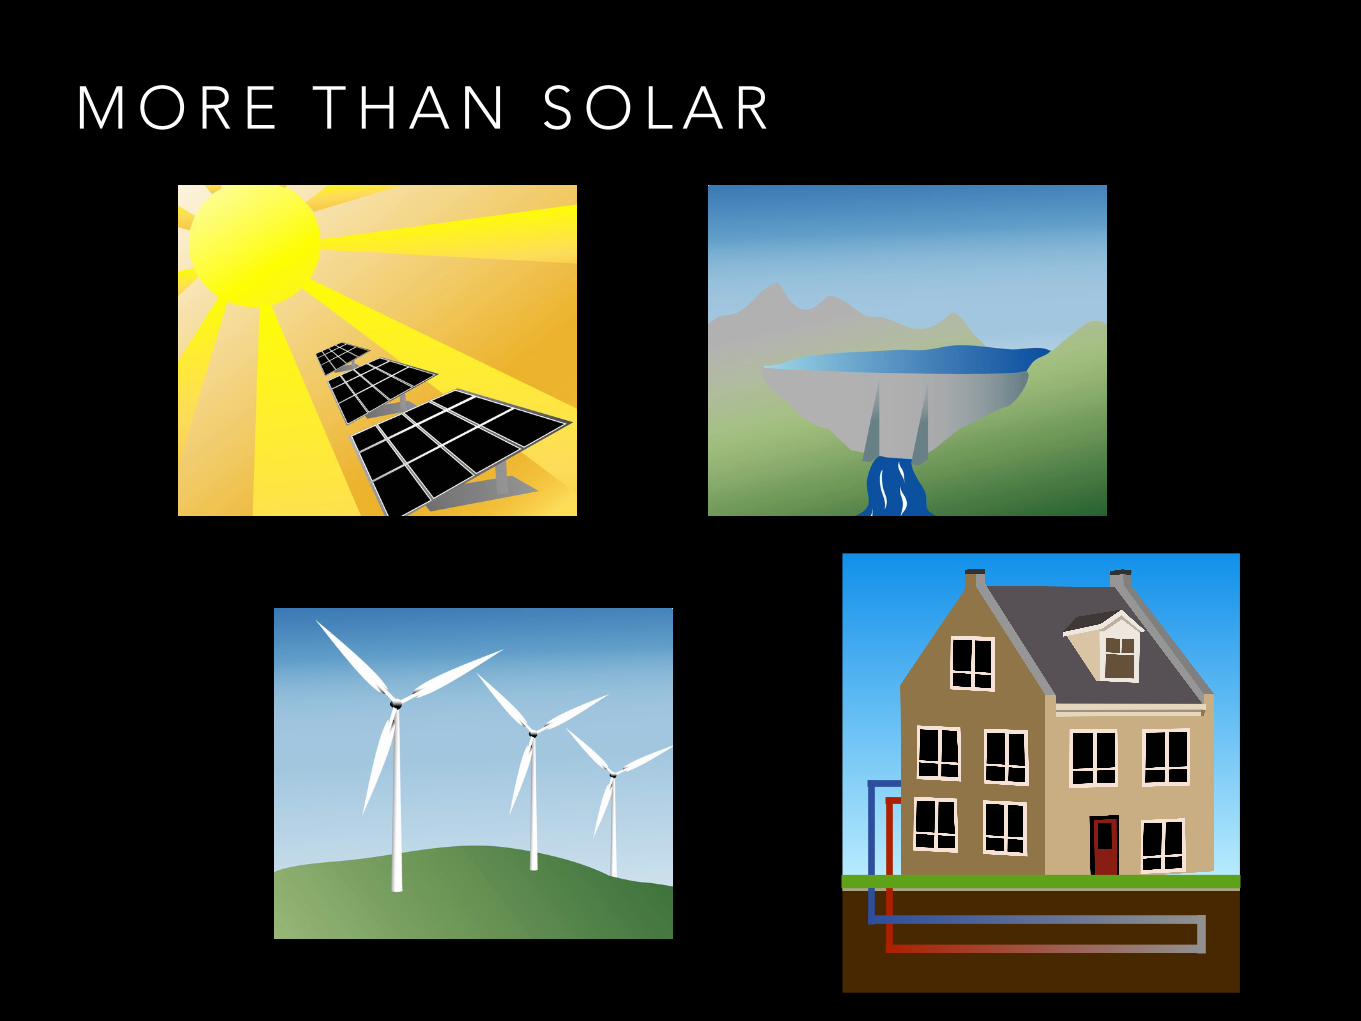
M O R E T H A N S O L A R
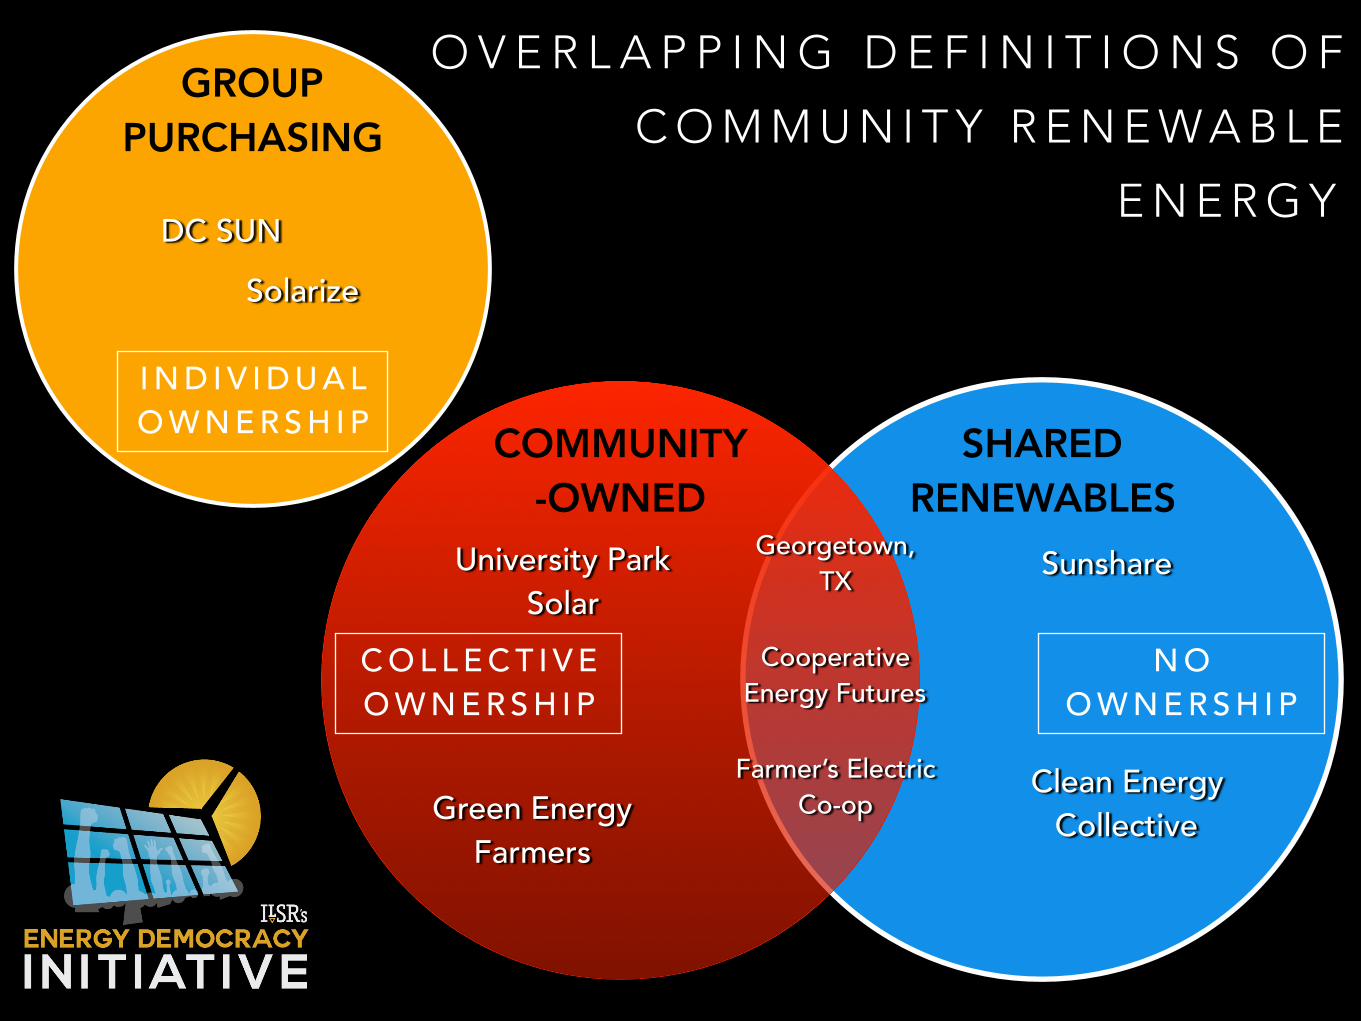
COMMUNITY -OWNED
SHARED RENEWABLES
GROUP PURCHASING
C O L L E C T I V E O W N E R S H I P
N O O W N E R S H I P
O V E R L A P P I N G D E F I N I T I O N S O F
C O M M U N I T Y R E N E W A B L E
E N E R G Y
I N D I V I D U A L O W N E R S H I P
Georgetown, TX
Farmer’s Electric Co-op
Sunshare
Clean Energy Collective
DC SUNSolarize
University Park Solar
Green Energy Farmers
Cooperative Energy Futures
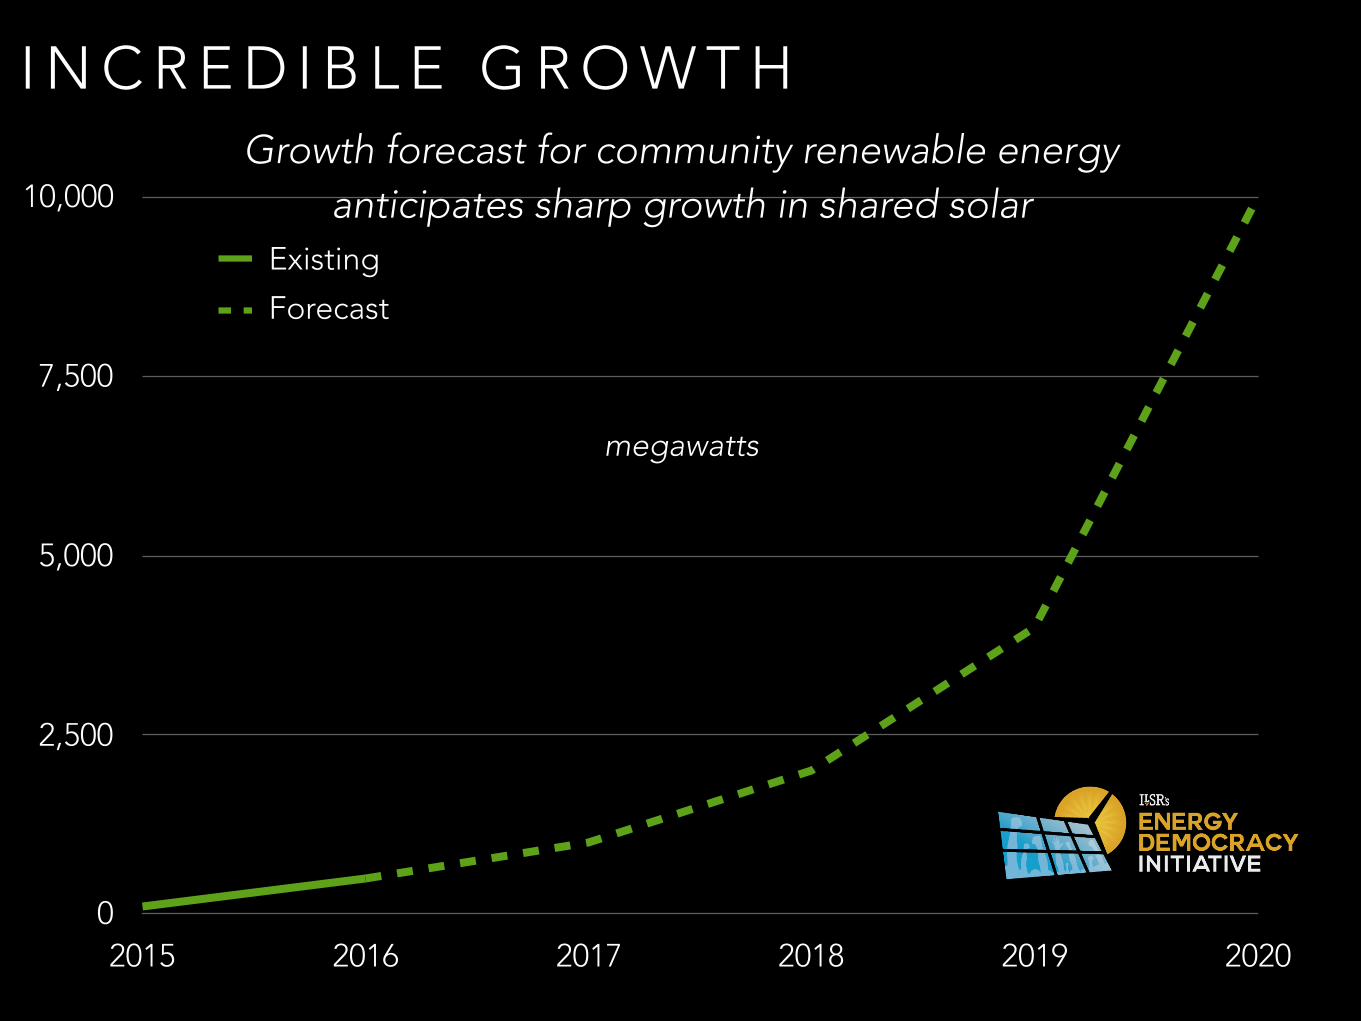
Forecast
Existing
I N C R E D I B L E G R O W T H
0
2,500
5,000
7,500
10,000
2015 2016 2017 2018 2019 2020
megawatts
Growth forecast for community renewable energy anticipates sharp growth in shared solar
www.ilsr.org
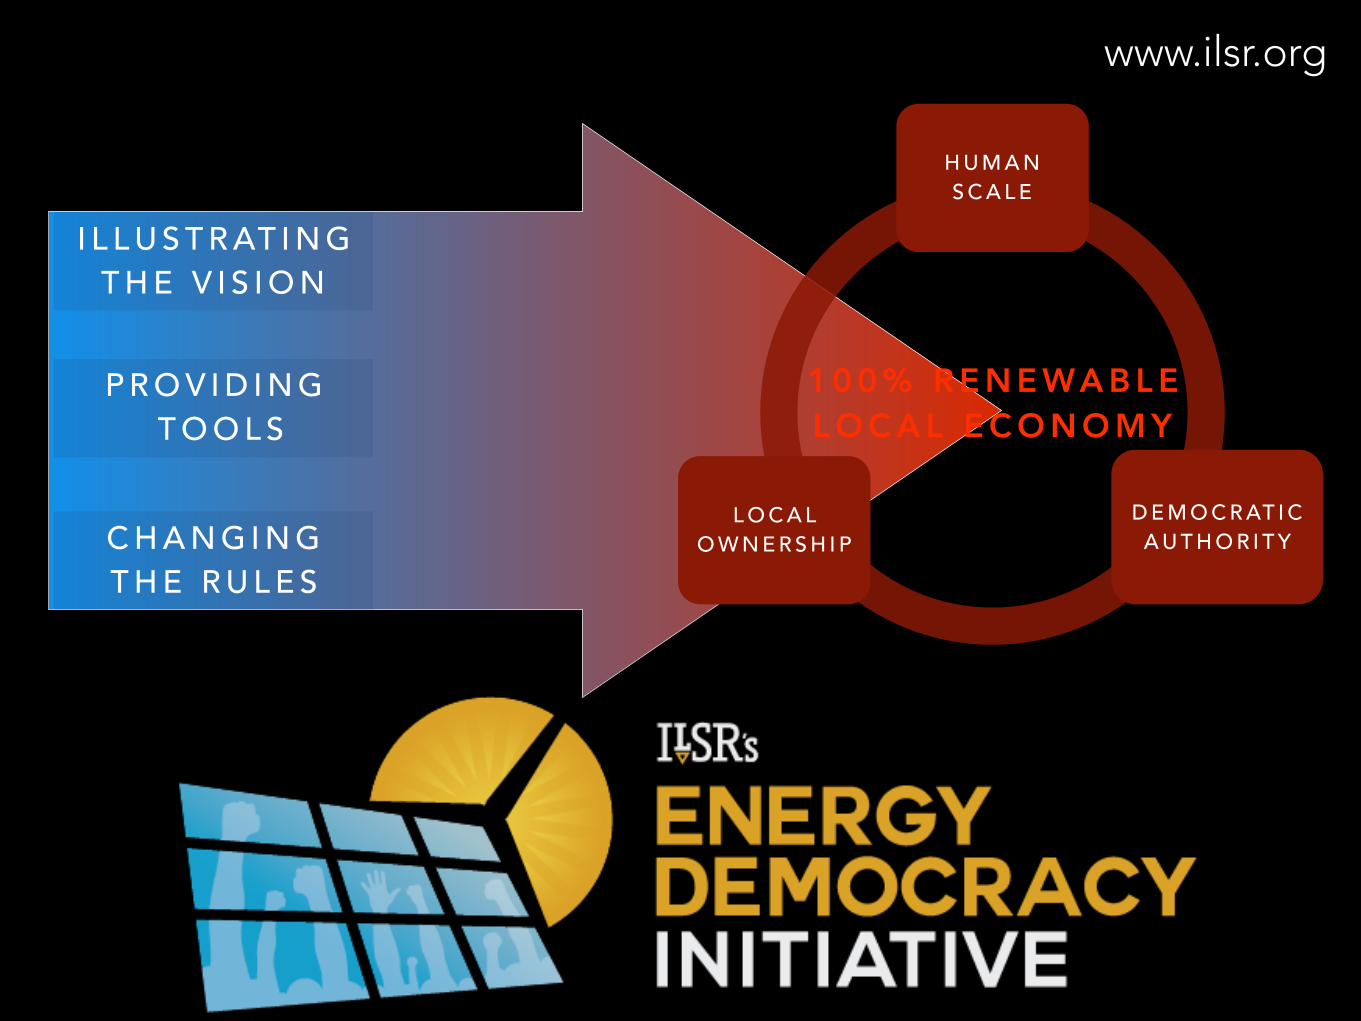
C H A N G I N G T H E R U L E S
P R O V I D I N G T O O L S
1 0 0 % R E N E WA B L E L O C A L E C O N O M Y
H U M A N S C A L E
L O C A L O W N E R S H I P
D E M O C R AT I C A U T H O R I T Y
I L L U S T R AT I N G T H E V I S I O N

BeyondSharing:HowCommunitiesCanTakeOwnershipofRenewablePowerThe electric utility monopoly is breaking up, but will new companies make renewable energy become another form of wealth extraction or can community renewable energy enable communities to capture their renewable power?
John FarrellApril 2016
www.ilsr.org
D O W N L O A D O U R F U L L R E P O R T
R E A D M O R E
@johnffarrell