
BEXAR COUNTY, TEXAS COMPREHENSIVE ANNUAL FINANCIAL REPORT ...
270
BEXAR COUNTY, TEXAS COMPREHENSIVE ANNUAL FINANCIAL REPORT Fiscal Year Ended September 30, 2018 OFFICIAL ISSUING REPORT SUSAN T. YEATTS, CPA COUNTY AUDITOR
Transcript of BEXAR COUNTY, TEXAS COMPREHENSIVE ANNUAL FINANCIAL REPORT ...

BEXAR COUNTY, TEXAS
COMPREHENSIVE ANNUAL FINANCIAL REPORT
Fiscal Year Ended
September 30, 2018
OFFICIAL ISSUING REPORT SUSAN T. YEATTS, CPA
COUNTY AUDITOR

Bexar County Courthouse Photo by Peter Petroff

Bexar County, Texas
Comprehensive Annual Financial Report
September 30, 2018
TABLE OF CONTENTS
INTRODUCTORY SECTION
I. Transmittal Letter I-1
II. Organizational Chart I-9
III. List of Principal Officials I-10
IV. 2017 Certificate of Achievement I-11
FINANCIAL SECTION
I. Independent Auditor's Report 1
II. Management's Discussion & Analysis 5
III. Basic Financial Statements
a. Government-wide Statement of Net Position (including component units) 30
b. Government-wide Statement of Activities (including component units) 32
c. Balance Sheet - Governmental Funds 34
d. Reconciliation of Balance Sheet - Governmental Funds to
Statement of Net Position 35
e. Statement of Revenues, Expenditures, and Changes in Fund Balances
- Governmental Funds 36
f. Reconciliation of Changes in Fund Balances - Governmental Funds to
Statement of Activities 37
g. Statement of Net Position - Proprietary Funds 38
h. Statement of Revenues, Expenses, and Changes in Net Position
- Proprietary Funds 40
i. Statement of Cash Flows - Proprietary Funds 41
j. Statement of Fiduciary Net Position 43
k. Statement of Net Position - Component Units 44
l. Statement of Activities - Component Units 45
m. Notes to the Basic Financial Statements 47

TABLE OF CONTENTS (Continued)
FINANCIAL SECTION (Continued)
IV. Required Supplementary Information
a. General Fund Schedule of Revenues, Expenditures, and Changes in Fund Balance
- Budget and Actual 107
b. Notes to Required Supplementary Information 120
c. Schedule of Funding Progress for the System Retired Employee Healthcare Plan 121
d. Schedule of Changes in Net Pension Liability and Related Ratios 122
e. Schedule of Employer Pension Contributions 123
f. Notes to Required Supplementary Information 124
g. Schedule of Changes in Total OPEB Liability and Related Ratios 125
V. Combining and Individual Fund Financial Statements and Schedules
a. Combining Balance Sheet - Nonmajor Governmental Funds 129
b. Combining Statement of Revenues, Expenditures, and Changes in Fund
Balance - Nonmajor Governmental Funds 136
c. Schedules of Revenues, Expenditures, and Changes in Fund Balance - Budget
and Actual
1 Debt Service Fund - Schedule of Revenues, Expenditures, and Changes in Fund Balance - Budget and Actual 142
2 Special Revenue Funds - Schedule of Revenues, Expenditures, and Changes in
Fund Balance - Budget and Actual - County Clerk Records Management Fund 143
3 Special Revenue Funds - Schedule of Revenues, Expenditures, and Changes in
Fund Balance - Budget and Actual - County Records Management Fund 144
4 Special Revenue Funds - Schedule of Revenues, Expenditures, and Changes in
Fund Balance - Budget and Actual - Courthouse Security Fund 145
5 Special Revenue Funds - Schedule of Revenues, Expenditures, and Changes in
Fund Balance - Budget and Actual - Justice of Peace Technology Fund 146
6 Special Revenue Funds - Schedule of Revenues, Expenditures, and Changes in
Fund Balance - Budget and Actual - Fire Code Fund 147
7 Special Revenue Funds - Schedule of Revenues, Expenditures, and Changes in
Fund Balance - Budget and Actual - District Clerk Records Management Fund 148
8 Special Revenue Funds - Schedule of Revenues, Expenditures, and Changes in
Fund Balance - Budget and Actual - Law Library Fund 149

TABLE OF CONTENTS (Continued)
FINANCIAL SECTION (Continued)
9 Special Revenue Funds - Schedule of Revenues, Expenditures, and Changes in
Fund Balance - Budget and Actual - County Wide Court Technology Fund 150
10 Special Revenue Funds - Schedule of Revenues, Expenditures, and Changes in
Fund Balance - Budget and Actual - Dispute Resolution Fund 151
11 Special Revenue Funds - Schedule of Revenues, Expenditures, and Changes in
Fund Balance - Budget and Actual - Justice of Peace Security Fund 152
12 Special Revenue Funds - Schedule of Revenues, Expenditures, and Changes in
Fund Balance - Budget and Actual - Domestic Relations Fund 153
13 Special Revenue Funds - Schedule of Revenues, Expenditures, and Changes in
Fund Balance - Budget and Actual - Probate Contribution Fund 154
14 Special Revenue Funds - Schedule of Revenues, Expenditures, and Changes in
Fund Balance - Budget and Actual - Law Enforcement Officer Special
Education (LEOSE) Fund 155
15 Special Revenue Funds - Schedule of Revenues, Expenditures, and Changes in
Fund Balance - Budget and Actual - Child Abuse Prevention Fund 156
16 Special Revenue Funds - Schedule of Revenues, Expenditures, and Changes in
Fund Balance - Budget and Actual - Drug Court Program Fund 157
17 Special Revenue Funds - Schedule of Revenues, Expenditures, and Changes in
Fund Balance - Budget and Actual - Family Protection Fee Fund 158
18 Special Revenue Funds - Schedule of Revenues, Expenditures, and Changes in
Fund Balance - Budget and Actual - District Court Records Technology Fund 159
19 Special Revenue Funds - Schedule of Revenues, Expenditures, and Changes in
Fund Balance - Budget and Actual - Juvenile Case Manager Fund 160
20 Special Revenue Funds - Schedule of Revenues, Expenditures, and Changes in
Fund Balance - Budget and Actual - Probate Guardianship Fund 161
21 Special Revenue Funds - Schedule of Revenues, Expenditures, and Changes in
Fund Balance - Budget and Actual - Probate Education Fund 162
22 Special Revenue Funds - Schedule of Revenues, Expenditures, and Changes in
Fund Balance - Budget and Actual - Juvenile Delinquency Prevention Fund 163
23 Special Revenue Funds - Schedule of Revenues, Expenditures, and Changes in
Fund Balance - Budget and Actual - Grants Fund 164

TABLE OF CONTENTS (Continued)
FINANCIAL SECTION (Continued)
24 Special Revenue Funds - Schedule of Revenues, Expenditures, and Changes in
Fund Balance - Budget and Actual - Technology Improvement Fund 166
25 Special Revenue Funds - Schedule of Revenues, Expenditures, and Changes in
Fund Balance - Budget and Actual - Stormwater Mitigation Fund 168
26 Special Revenue Funds - Schedule of Revenues, Expenditures, and Changes in
Fund Balance - Budget and Actual - Chapter 19 Voter Registration Fund 169
27 Special Revenue Funds - Schedule of Revenues, Expenditures, and Changes in
Fund Balance - Budget and Actual - Election Contracting Services Fund 170
28 Special Revenue Funds - Schedule of Revenues, Expenditures, and Changes in
Fund Balance - Budget and Actual - Tax Collector's Special Inventory Tax Fund 171
29 Special Revenue Funds - Schedule of Revenues, Expenditures, and Changes in
Fund Balance - Budget and Actual - District Attorney Programs Fund 172
30 Special Revenue Funds - Schedule of Revenues, Expenditures, and Changes in
Fund Balance - Budget and Actual - Asset Forfeiture Fund 173
d. Combining Statement of Net Position - Nonmajor Enterprise Funds 176
e. Combining Statement of Revenues, Expenses, and Changes in Net
Position - Nonmajor Enterprise Funds 177
f. Combining Statement of Cash Flows - Nonmajor Enterprise Funds 178
g. Combining Statement of Net Position - Internal Service Funds 182
h. Combining Statement of Revenues, Expenses, and Changes in Fund Net
Position - Internal Service Funds 183
i. Combining Statement of Cash Flows - Internal Service Funds 184
j. Combining Net Position - Agency Funds 188
STATISTICAL SECTION
I. Financial Trend Information
a. Table 1 - Net Position by Component 196
b. Table 2 - Changes in Net Position 198
c. Table 3 - Net Changes in Fund Balance, Governmental Funds 202
d. Table 4 - Fund Balances, Governmental Funds 204

TABLE OF CONTENTS (Continued)
STATISTICAL SECTION (Continued)
II. Revenue Capacity Information
a. Table 5 - Assessed Value and Estimated Actual Value of Taxable Property 206
b. Table 6 - Direct and Overlapping Property Tax Rates 208
c. Table 7 - Principal Property Taxpayers 210
d. Table 8 - Property Tax Levies and Collections 211
III. Debt Capacity Information
a. Table 9 - Ratio of Outstanding Debt by Type 212
b. Table 10 - Ratio of Outstanding General Bonded County Debt 214
c. Table 11 - Ratio of Annual Debt Service for General Bonded Debt to Total
Expenditures - All Government Fund Types 215
d. Table 12 - Direct and Overlapping Governmental Activities Debt 216
e. Table 13 - Pledged - Revenue Coverage 217
f. Table 14 - Motor Vehicle Rental Tax Collections 218
g. Table 15 - Hotel Occupancy Tax Net Collections 219
h. Table 16 - Hotel Occupancy Tax Collections - Top Ten Hotels 220
i. Table 17 - Convention Statistics 221
j. Table 18 - San Antonio Hotel Occupancies and Average Daily Rates/History 222
k. Table 19 - County Expenditures for Assets Owned by Other Entities 224
IV. Demographic and Economic Information
a. Table 20 - Demographic and Economic Statistics 228
b. Table 21 - Principal Employers 229
V. Operating Information
a. Table 22 - Operating Indicators by Function/Program 230
b. Table 23 - Capital Asset Statistics by Function/Program 232
c. Table 24 - Full-Time Equivalent County Governmental Employees by 234
Function/Program
VI. Miscellaneous Information
a. Table 25 - Analysis of Funding Progress and Contribution Rates 235
b. Table 26 - Legal Debt Margin Information 236
c. Table 27 - Miscellaneous Information 237

TABLE OF CONTENTS (Continued)
COMPLIANCE SECTION
I. Report of Internal Control Over Financial Reporting and on Compliance and Other
with Government Auditing Standards 239
II. Report on Compliance for Each Major Program and on Internal Control Over Compliance
Required by the Uniform Guidance and the State of Texas Single Audit Circular 241
III. Schedule of Expenditures of Federal and State Awards 243
IV. Notes to Schedule of Expenditures of Federal and State Awards 248
V. Schedule of Findings and Questioned Costs 249
Matters Based on an Audit of Financial Statements Performed in Accordance


Bexar County, Texas
Transmittal Letter
For Year Ending September 30, 2018
I-2
Three component units, Bexar County Housing Finance Corporation (BCHFC), Bexar County Health Facilities Development
Corporation (BCHFDC) and Bexar County Industrial Development Corporation (BCIDC) are blended with the County. The
Commissioners Court of the County sits as the governing board for all three entities. Accordingly, the Commissioners Court
approves the issuance of single-family mortgage bonds for the BCHFC and authorizes the issuance of tax-exempt bonds for
the BCHFDC as well as the BCIDC. None of the bond issuances constitute a debt or a pledge of faith or credit by the County.
The University Health System (the Bexar County Hospital District), The Alamo Regional Mobility Authority (RMA), and the
Cibolo Canyons Special Improvement District are considered component units for reporting purposes and are discretely
presented in the report. The Commissioners Court for the County appoints the seven member board and sets the tax rates for
the County’s Hospital District. Likewise, the Commissioners Court also appoints the seven member board of the Cibolo
Canyons Special Improvement District and it has the statutory requirement to approve any issuance of debt by the Improvement
District. The RMA has a seven member board, of which six are appointed by Commissioners Court. In addition, Commissioners
Court has the authority to approve RMA transportation projects. For more information on these component units, refer to Note
A of the Basic Financial Statements.
The independent audit of the County’s financial statements was performed by the firm of Garza/Gonzalez & Associates, a firm
licensed as certified public accountants. The goal of the independent audit is to provide reasonable assurance that the financial
statements of Bexar County for the fiscal year ended September 30, 2018, are free of material misstatements. The independent
auditor concluded, based on the examination of the underlying documentation on a test basis and related disclosures, that the
County’s financial statements are fairly presented in conformity with accounting principles generally accepted in the United
States of America and therefore able to render an unmodified opinion.
The independent audit of the County’s financial statements includes a “Compliance Section.” The Compliance Section contains
information related to the County’s annual “Single Audit,” which is a required provision of the Single Audit Act of 1984 as
amended by the Act of 1996. The Act comes under the oversight of the Office of Management and Budget Circular A-133,
Audits of States and Local Governments, and Non-Profit Organizations and 2 CFR Part 200, Subpart F ( the Uniform
Guidance), and the State of Texas Single Audit Circular.
The standards governing the Single Audit engagements require the independent auditor to report not only on the fair
presentation of the financial statements, but also on the County’s internal control and compliance with legal requirements and
special emphasis on internal controls involving the administration of federal and state awards. Information related to this Single
Audit can be found within the “Compliance Section” of this report and includes:
Independent Auditor’s Report on Internal Control Over Financial Reporting and on Compliance and Other
Matters,
Independent Auditor’s Report on Compliance for Each Major Program and on Internal Control Over Compliance,
Schedule of Expenditures of Federal and State Awards,
Schedule of Findings and Questioned Costs
Management’s Discussion and Analysis (MD&A) immediately follows the Independent Auditor’s Report and provides a
narrative introduction, overview, and analysis of the basic financial statements. The MD&A complements this letter of
transmittal and should be read in conjunction with it.
BEXAR COUNTY GOVERNMENT PROFILE
Historical
Bexar County is located in south central Texas in the interior belt of the Coastal Plain of South Central Texas, and is crossed
by the Balcones Escarpment. The area northwest of the escarpment, about one-eighth of the County, lies on the Edwards
Plateau in high, hilly country - the source of numerous springs and artesian and underground wells. The San Antonio River
and San Pedro Creek originate in such springs. The San Antonio River is the County's principal river, and into it, flow a number
of smaller streams. One of these smaller streams, Cibolo Creek, forms the boundary between Bexar and Comal Counties on
the north and Guadalupe County on the east.
Bexar County comprises 1,248 square miles. The altitude varies from 600 to 1,200 feet. In the far northwestern corner of the
County are the Glenrose Hills, in which the highest elevations of the county are found. To the southeast lie the somewhat lower

Bexar County, Texas
Transmittal Letter
For Year Ending September 30, 2018
I-3
Edwards Flint Hills. The northern third of the County has undulating to hilly, terrain and limy earths with shallow to deep
loamy soils. The northern quarter of the County has Edwards Plateau vegetation of tall and medium-height grasses, live oak,
juniper, and mesquite. A central strip is Blackland Prairie with vegetation consisting of tall grasses. The remainder of the
County has South Texas Plain's vegetation including grasses, live oak, mesquite, thorny bushes, and cacti.1
The first Europeans to explore the region came with an expedition in 1691 led by Domingo Terán de los Ríos and Fray Damián
Massanet, who eventually reached the San Antonio River near where the San Juan Capistrano Mission was later founded. Prior
to the exploration, the land had been inhabited for thousands of years by various tribes of people, collectively referred to as,
the Coahuiltecan People. The Indians, as Massanet recorded in his diary, called the place Yanaguana; however, he renamed
the site San Antonio de Padua to celebrate the memorial day of St. Anthony (June 13). By 1724, the San Antonio de Valero
mission compound, which had originally been located south of San Pedro Springs, was moved to what is referred today as the
Alamo Plaza.2
In 1772, the government offices of Spanish Texas were moved to Bexar. The mission lands were distributed to the increasing
number of Spanish settlers. Most of the better land nearest the settled areas was controlled by the town's elite, which was made
up of the descendants of the original Canary Islanders and the presidential soldiers. The missions developed as self-supporting
communities, each ringed with farmland irrigated by a comprehensive system of acequias, or irrigation ditches.
During the late colonial period, Bexar continued to serve as the capital of the province of Tejas as well, as the main shipping
point for supplies headed for Nacogdoches (to the east) and Santa Fe (to the west). Soon after the first Anglo-American
colonists came to Texas, in 1821, San Antonio became the western outpost of settlement. In 1824, Tejas and Coahuila were
united by the Mexican government into one state with the capital at Saltillo. The Department of Bexar was created with a
political representative appointed to have authority over the Tejas portion of the state. During the late 1820s and early 1830s,
increasing numbers of American settlers began moving to San Antonio, though the city remained predominately Mexican at
the beginning of the Texas Revolution. In late October 1835, Texas volunteers laid siege to the city, which was garrisoned by
the Mexican army. After fierce hand-to-hand fighting, it was occupied by Texian forces. San Antonio was retaken by
government forces commanded by Antonio López de Santa Anna during the battle for the Alamo on March 6, 1836. After the
subsequent defeat of Santa Anna's army at the battle of San Jacinto, the city was reoccupied by Texian forces, but the area,
claimed by both sides, continued to be fought over for the next six years. 3
The County is best known for being the home of Mission San Antonio de Valero, better known as the Alamo, the Cradle of
Texas Liberty. In 1718, a formal military and civilian population settled in the land, and then in 1731, the Canary Islanders
established the first civil government. The County is rich in heritage and history. Organized on December 20, 1836, Bexar
County was established, with San Antonio as county seat. Bexar County is one of the original counties of the Republic of
Texas. In the latest population estimate, the United States Census Bureau estimates the 2017 population of Bexar County at
1.96 million (a 14.2% increase from the 2010 Census), which makes it the fourth largest county in the State. The County
contains 29 incorporated cities. The Census Bureau also estimates the population for the greater San Antonio Metropolitan
Area to be 2.47 million.4
The origin of the Texas county is found in the "municipality", the unit of local government under Spanish and Mexican rule.
These municipalities were rather large districts embracing one or more settlements and the surrounding rural territory. The
government of the municipality was vested in a council composed of at least one alcalde (judge), varying number of aldermen,
an attorney, a sheriff (alguacil), and supported by a secretary.1
Under the Republic (1836), the municipalities became counties, but the Spanish-Mexican influence on their government was
recognizable. The new local governments were based on the county form of governments as found in the southern part of the
United States. The chief governing body of the county during the Republic was a county board, composed of the Chief Justice
(appointed) and elective Justices of the Peace. By 1845, four elective Commissioners were substituted for the Justices of the
Peace.
The County Commissioners Court, or County Board, was established by the Constitution of 1876 and was composed of a
county judge as presiding officer, and four commissioners elected from precincts for four-year terms. During the Republic of
1 The Hand Book of Texas 2 Ibid 3 Habig, Marion A., A History of San Antonio’s Five Missions 4 US Census Bureau (www.census.gov)

Bexar County, Texas
Transmittal Letter
For Year Ending September 30, 2018
I-4
Texas, the County Board was composed of the chief justice and the justices of the peace of the County; under the Constitutions
of 1845, 1861, and 1866, it was composed of the chief justice and four elected Commissioners. During the Reconstruction
period, the Constitution of 1869 was issued, and the Board was made of any three of the five justices of the peace of the County.
The Bexar County Commissioners Court has executive as well as judicial functions. It is responsible for establishing a
courthouse and jail, making appointments, filling vacancies in the county offices, signing contracts in the name of the county,
building and maintaining roads and bridges, administering the county's public welfare services, performing numerous duties in
regard to elections, setting the county tax rate, issuing bonds, and adopting the county budget.
Economic
San Antonio is the county seat for Bexar County. San Antonio is currently the second largest city in Texas and the seventh
largest city in the United States. In Bexar County, the unemployment rate, as of September 30, 2018, is at 3.3%, which is
above the unemployment rate of 3.2%, at September 30, 2017. The County’s rate is below the State’s rate of 3.7%, for the same
period.5 The County's diverse economic base ranges from agribusiness, advanced manufacturing, technology and cyber
security, finance, tourism, to medicine, and the military. San Antonio is ranked among the lowest in cost of living indicators
at an 86.7% composite index, which is 13.3% below the national average.6
The County continues to provide diversified industries with one of the lowest cost workforces of any major U.S. city.
According to the most recent data, the health care and bioscience, advanced manufacturing, tourism and hospitality, and
information technology and cyber security and new energy industries generate a combined economic impact of an estimated
$107.4 billion on the local economy.7 According to the latest economic impact study, (2018) the health care and bioscience
industry continues to be one of San Antonio’s largest industries, with more than one of every six employees working in the
industry, either directly or indirectly. Direct healthcare services includes hospital care, doctor office care, nursing home care,
and ambulatory and outpatient care. There are also indirect, but related healthcare industries, such as health insurance
providers, pharmaceutical companies, medical equipment producers and manufacturers, civilian and military medical
education, biomedical research organizations, residential care and social service providers, and a variety of related endeavors.
The 2018 comprehensive estimate of the bioscience and healthcare economic impact is $40.2 billion.7 Government is a
significant industry in the County with the military being the predominate employer. Joint Base San Antonio (JBSA) has a
substantial impact on the San Antonio and the Texas economies. According to the Texas Comptroller of Public Accounts,
JBSA contributed an overall economic impact of $30.37 billion in 2017, and nearly one out of eight people in Bexar County is
associated with JBSA.6 According to a 2016 economic impact study, the manufacturing industry contributes $40.5 billion to
the local economy, a 28% increase from the 2011 impact study.8 The manufacturing industry includes transportation (motor
vehicle and aerospace), equipment and metal products (machinery, computers, electronic components and products, electric
appliances, the repair and maintenance of machinery and electronic equipment, and both primary and fabricated metal
products), diversified products (printing, food and beverages, textiles, apparel and leather products, furniture, and
miscellaneous products such as medical equipment), and materials and electricity (production of wood, paper and nonmetallic
mineral products, petroleum products, plastic and rubber products, chemicals, and electricity). The transportation sector of the
manufacturing industry has shown the biggest gain, growing almost 50% since 2011. The 2017 economic impact study of San
Antonio’s hospitality industry indicates that tourism provides an estimated $15.2 billion to the economy from approximately
37 million visitors annually.9 Because the hospitality industry is a major financial contributor of taxes and other revenues to
local governments through Hotel Occupancy tax, property taxes, utility fees, and sales tax, taxes paid by residents of the San
Antonio Metropolitan area are reduced. The study only takes into consideration the impact from out of town visitors, therefore
the full economic impact of the hospitality industry not fully realized. In 2015, five Spanish colonial missions in San Antonio
were designated a World Heritage Site by the United Nations Educational, Scientific and Cultural Organization (UNESCO).
With the World Heritage Site Designation for the San Antonio Missions, there will be even more opportunity for growth in the
Hospitality industry. According to the study, Potential Economic Impact of World Heritage Site Designation for the San
Antonio Missions, over the next ten years, the economic impact is expected to generate up to $105 million in economic activity.7
The financial service industry employs over 91 thousand people and is considered a stable and significant business sector in
the San Antonio Metropolitan area.5 Another major industry leader in Bexar County is the Information Technology and Cyber
Security industry, with an economic impact of $10 billion. In fact, San Antonio has been recognized as a national leader in the
5 Texas LMCI Tracer, Data Link (www.tracer2.com) 6 San Antonio Economic Development Foundation, (www.sanantonioedf.com) 7 San Antonio Chamber of Commerce, (www.sachamber.org) 8 San Antonio Manufacturing Association, (www.sama.org) 9 San Antonio Area Tourism Council, (sanantoniotourism.com)

Bexar County, Texas
Transmittal Letter
For Year Ending September 30, 2018
I-5
Technology and Cyber Security industry with the U.S. Air Force’s Intelligence Agency, the National Security Agency, and the
Center for Infrastructure Assurance and Security, among many other diverse technology companies are all located within Bexar
County. San Antonio has the second largest cyber ecosystem in the United States.10 The Information and Technology and
Cybersecurity industries continue to grow as leaders support education and startups. Looking to the future, local leaders are
joining together to offer business incentives to encourage growth in the green industry. Leaders have invested in the New
Energy Economy (NEE), and as a result, the NEE has led to more than $1.5 billion in annual economic impact. The idea is to
have a pro-business government that is also pro-environment. San Antonio has become a national leader in renewable energy,
such as wind power and solar power, and by doing so, has reduced power plant emissions by more than 3.6 million tons per
year.10
The County's proximity to Mexico provides favorable conditions for international business relations in the areas of agriculture,
tourism, manufacturing, and wholesale and retail markets. At the end of calendar year 2018, trade between the United States
and Mexico was over $265 million in exports. This significant trade amount is largely attributed to the passage of the North
American Free Trade Agreement (NAFTA) in 1993.11 San Antonio is also the headquarters for the North American
Development Bank (NADBank). This bi-national institution created by NAFTA is intended to help finance environmental
infrastructure within 62 miles of the US/Mexican border. With a lending capacity of $3 billion, NADBank finances projects
including water, waste management, cleaner and renewable energy, air quality, industrial and hazardous waste, and energy
efficiency. The Mexican consulate has been expanded in San Antonio to assist the transition and to facilitate the development
of the NAFTA agreement.12
FINANCIAL POLICIES AND LONG-TERM FINANCIAL PLANNING
The population growth in the incorporated, as well as the unincorporated areas, is considered by the Commissioners Court
annually in appropriating funds to support the delivery of services. The County has developed working arrangements with the
majority of the incorporated cities within the County to allow the Court to anticipate needs and to establish a cost effective
manner to apply available resources.
Commissioners Court is responsible for establishing the tax rates for the County (operations and debt service) as well as to
service the flood control projects in the County (operations and debt service). In addition, the County includes in its debt
service tax rate, the debt service requirements for certain San Antonio River Authority (“SARA”) Channel Improvement
Revenue Bonds used for flood control and soil conservation projects in Bexar County. The tax rate, for the year ended,
September 30, 2017 was $0.30895 per $100 of valuation, and for the year ended September 30, 2018, the rate is set at
$0.304097. The tax rate of $0.301097, for fiscal year ending September 30, 2019, was approved in Commissioners Court on
September 11, 2018.
Current financial policies include:
Reimbursement resolutions are used on an interim basis to finance projects rather than initially issuing long-term
bonds;
Balanced financial operations will be maintained;
Expenditures are to be budgeted and controlled to ensure that at the end of the fiscal year the unassigned fund balance
in the general fund is at a minimum 15% of the fiscal year’s expenditures;
All elected officials and department heads are required to keep expenditures within allocated budgets;
The County is to maintain an open line of communication with rating agencies and seeks to obtain a high debt rating
with a stable outlook. The County currently uses the bond rating services of Fitch IBCA, Inc., Standard & Poor’s
Rating Service, and Moody’s Investment Services. At September 30, 2018, the County had been assigned bond ratings
of AAA, AAA, and Aaa, respectively.
Current long-term financial policies of the County are listed below:
Use technological solutions to improve operations;
Provide an equitable justice system that is responsive to the needs of the County;
Delivery of services to the constituents;
10 San Antonio Economic Foundation, (www.sanantonioedf.com) 11 US Census Bureau, (www.census.gov/foreign-trade/balance) 12 North American Development Bank, (www.nadb.org)

Bexar County, Texas
Transmittal Letter
For Year Ending September 30, 2018
I-6
Encourage flexibility and accountability in all offices and departments;
Promote diversity in the workforce;
Maintain full disclosure and open lines of communications with the rating agencies;
Develop a highly efficient and effective cash management program to maximize the County’s ability to earn an
equitable return on its assets, while at the same time maintaining asset protection.
MAJOR INITIATIVES FOR THE YEAR
Flood Control
In 2007, Commissioners Court approved a ten-year, $500 million Flood Control and Capital Improvement program which
identified and prioritized multiple flood control projects to be completed over a ten-year period. While 2017 was the intended
final year of the program, some Flood Control projects remain in progress. Of the 83 projects to be completed, a total of seven
projects are in the design phase, four are in the construction phase, 56 have been completed, and 16 were not recommended for
construction. The total project costs of $444 million were funded through the capital improvements program. Moving forward,
the County is planning to undertake flood control projects as needed and has proposed funding in the amount of $2.5 million
for enhancements and maintenance of the County’s High-Water Alert Life-Saving Technology (HALT) system.
New Capital Projects
The County has budgeted $582 million for its capital improvements program for both horizontal (Roads) and vertical
(Buildings) construction. This includes funding in the amount of $44 million for new capital improvement projects that include,
but are not limited to: the University Oaks Property Purchase (Sheriff’s Office North Substation), the Archives Building (FRB)
Parking Garage Information and Technology and Wellness Center Buildout, Juvenile Probation Facility Improvements, Justice
Center Improvements, County Park Deteriorating Recreational Trails, as well as technology projects, which are discussed
below.
Technology
Major technology projects at various stages from planning to implementation include:
Fire Marshal Alerting System: This project will provide funding to implement an alerting system to fully automate
the dispatching process which will assist emergency personnel to react as efficiently as possible to each call. Because
other local entities use this system, the cost of interfacing with these existing systems will be reduced.
Mainframe Database and Programming Language Upgrade: This project will provide funding to update the
County’s mainframe database and coding language. The current coding language is not covered by supported software
in the event of an outage. The upgrade will bring the County to a level that is supported.
Bexar County Integrated Justice System (CJIS): This project will fund a new justice information system that will
replace an outdated legacy system. Additional components include an E-Discovery System, a District Attorney Case
Management System, a Jail Management System, a Jury Management System, a Juvenile Case Management System,
CJIS Storage and CJIS Peripherals.
Infor System Enhancements: This project provides for software enhancements including, Human Capital
Management, Enterprise Asset Management, Dynamic Enterprise Performance Management, and Supply Chain
Management Enhancements.
EMPLOYMENT GROWTH
According to the Texas Workforce Commission, the County’s unemployment rate increased from 3.2% (September 2017) to
3.3% (September 2018). The total jobs created were 10,471. The State’s unemployment rate decreased to 3.7% (September
2018) from 4% (September 2017), and 305,100 nonagricultural jobs were created during the same period.
The County experienced some external corporate employment growth (4,460 positions) from various companies. On the
following page is a list of companies that each brought 50 or more positions to the area (4,107 positions in total) in 2018.

Bexar County, Texas
Transmittal Letter
For Year Ending September 30, 2018
I-7
Company Name Positions
OKIN PBS 1,462
Cambridge Development Group 550
TaskUs 500
Charter Communications 455
ALLCAT 300
Ernst & Young 300
The Hut Group 165
Maestro’s Workshop 150
Grunt Style 125
Amerivet 100
Source: San Antonio Economic Development Foundation.
The following table reflects the internal and external creation of 10,471 jobs over the last twelve months, ended September 30,
2018.
Employment
Sectors 2017 2018 Percent
Increase or
(Decrease)
Natural Resource and Mining 5,286 6,241 18.07%
Construction 38,691 39,128 1.13%
Manufacturing 35,987 36,656 1.86%
Trade, Transportation, Utilities 141,484 140,645 -0.59%
Information 18,570 18,805 1.27%
Financial Activities 76,872 77,153 0.37%
Professional and Business Services 117,772 120,564 2.37%
Education and Health Services 139,474 143,349 2.78%
Leisure and Hospitality 113,541 115,425 1.66%
Other Services 24,624 24,492 -0.54%
Unclassified 735 930 26.53%
Government 142,080 142,199 0.08%
Total Jobs 855,116 865,587 1.22%
Source: Texas LMCI, Data Link, QCEW
FINANCIAL INFORMATION
Budgetary Control
Budgets are adopted for the General, Special Revenue, and Debt Service Funds on a budgetary basis. Although this basis
departs from generally accepted accounting principles, it provides meaningful feedback and control to management.
The revenue budget for the General, Debt Service, and Special Revenue Funds are established by the County Auditor's Office.
The expenditure budget is set by Commissioners Court and controlled by the County Auditor at the appropriation level by a
review of estimated purchase amounts prior to the release of purchase orders to vendors. A purchase order, which would result
in an overrun of an appropriation unit, is not released until additional appropriations are made available.
Under State law, the budget cannot be exceeded in any expenditure category. Grants from the Criminal Justice Division (CJD)
may overrun a category allowance by 5%, but the total of the grant may not overrun. In Community Development Block Grant


I-9

I-10
Bexar County, Texas
PRINCIPAL OFFICIALS
COUNTY JUDGE NELSON W. WOLFF
COMMISSIONER, PRECINCT 1 SERGIO "CHICO" RODRIGUEZ
COMMISSIONER, PRECINCT 2 JUSTIN RODRIGUEZ
COMMISSIONER, PRECINCT 3 KEVIN WOLFF
COMMISSIONER, PRECINCT 4 TOMMY CALVERT, JR.
ASSESSOR-COLLECTOR OF TAXES ALBERT URESTI
COUNTY CLERK LUCY ADAME-CLARK
DISTRICT ATTORNEY JOE GONZALES
DISTRICT CLERK MARY ANGIE GARCIA
SHERIFF JAVIER SALAZAR
COUNTY AUDITOR SUSAN T. YEATTS
COUNTY MANAGER DAVID SMITH
PURCHASING AGENT MARY QUINONES

I-11

I-12
Photo by Peter Petroff

Garza/Gonzalez & Associates
CERTIFIED PUBLIC ACCOUNTANTS
INDEPENDENT AUDITOR’S REPORT
The Honorable County Judge and Commissioners
Bexar County, Texas
Report on the Financial Statements
We have audited the accompanying financial statements of the governmental activities, the business-type activities, the
aggregate discretely presented component units, each major fund, and the aggregate remaining fund information of Bexar
County, Texas (the County), as of and for the year ended September 30, 2018, and the related notes to the financial
statements, which collectively comprise the County’s basic financial statements as listed in the table of contents. We
did not audit the financial statements of the University Health System (the System), the Cibolo Canyons Special
Improvement District (the District), and the Alamo Regional Mobility Authority (the Authority), which represent 100
percent of assets, net position, and revenues of the discretely presented component units. Those statements were audited
by other auditors whose report has been furnished to us, and our opinion, insofar as it relates to the amounts included for
the System, the District, and the Authority is based solely on the report of the other auditors.
Management’s Responsibility for the Financial Statements
Management is responsible for the preparation and fair presentation of these financial statements in accordance with
accounting principles generally accepted in the United States of America; this includes the design, implementation, and
maintenance of internal control relevant to the preparation and fair presentation of financial statements that are free from
material misstatement, whether due to fraud or error.
Auditor’s Responsibility
Our responsibility is to express opinions on these financial statements based on our audit. We conducted our audit in
accordance with auditing standards generally accepted in the United States of America and the standards applicable to
financial audits contained in Government Auditing Standards, issued by the Comptroller General of the United States.
Those standards require that we plan and perform the audit to obtain reasonable assurance about whether the financial
statements are free from material misstatement. We did not audit the financial statements of the System, the District,
and the Authority which were audited by other auditors. The financial statements of the District, audited by other
auditors, were not audited in accordance with Government Auditing Standards.
An audit involves performing procedures to obtain audit evidence about the amounts and disclosures in the
financial statements. The procedures selected depend on the auditor’s judgment, including the assessment of
the risks of material misstatement of the financial statements, whether due to fraud or error. In making those
risk assessments, the auditor considers internal control relevant to the County’s preparation and fair
presentation of the financial statements in order to design audit procedures that are appropriate in the
circumstances, but not for the purpose of expressing an opinion on the effectiveness of the County’s internal
control. Accordingly, we express no such opinion. An audit also includes evaluating the appropriateness of
accounting policies used and the reasonableness of significant accounting estimates made by management,
as well as evaluating the overall presentation of the financial statements.
207 Arden Grove San Antonio, TX 78215 210/227-1389 Fax 227-0716
1

2
We believe that the audit evidence we have obtained is sufficient and appropriate to provide a basis for our audit
opinions.
Opinions
In our opinion, based on our audit and the report of other auditors, the financial statements referred to above present
fairly, in all material respects, the respective financial position of the governmental activities, the business-type
activities, the aggregate discretely presented component units, each major fund, and the aggregate remaining fund
information of the County, as of September 30, 2018, and the respective changes in financial position and, where
applicable, cash flows thereof for the year then ended in accordance with accounting principles generally accepted in
the United States of America.
Emphasis of Matter
As described in the notes to the financial statements, in fiscal year 2018, the County adopted new accounting guidance,
Governmental Accounting Standards Board (GASB) Statement No. 75, Accounting and Financial Reporting for
Postemployment Benefits Other Than Pensions amending GASB Statement No. 45. GASB Statement No. 75 requires
state and local government employers to display the actuarially determined Net OPEB Liability in its financial
statements. Our opinion is not modified with respect to this matter.
Other Matters
Required Supplementary Information
Accounting principles generally accepted in the United States of America require that the management’s discussion
and analysis, budgetary comparison information – general fund, the schedule of changes in total OPEB liability and
related ratios, and the Texas County and District Retirement System pension information, as listed in the table of
contents be presented to supplement the basic financial statements. Such information, although not a part of the basic
financial statements, is required by the Governmental Accounting Standards Board, who considers it to be an essential
part of financial reporting for placing the basic financial statements in an appropriate operational, economic, or
historical context. We and other auditors have applied certain limited procedures to the required supplementary
information in accordance with auditing standards generally accepted in the United States of America, which consisted
of inquiries of management about the methods of preparing the information and comparing the information for
consistency with management’s responses to our inquiries, the basic financial statements, and other knowledge we
obtained during our audit of the basic financial statements. We do not express an opinion or provide any assurance
on the information because the limited procedures do not provide us with sufficient evidence to express an opinion or
provide any assurance.
Other Information
Our audit was conducted for the purpose of forming opinions on the financial statements that collectively comprise
the County’s basic financial statements. The introductory section, combining nonmajor fund financial statements,
individual nonmajor fund - schedules of revenues, expenditures and changes in fund balance – budget and actual, and
statistical sections, are presented for purposes of additional analysis and are not a required part of the basic financial
statements. The schedule of expenditures of federal and state awards is presented for purposes of additional analysis
as required by Title 2 U.S. Code of Federal Regulations Part 200, Uniform Administrative Requirements, Cost
Principles, and Audit Requirements for Federal Awards and the State of Texas Single Audit Circular, and is also not
a required part of the basic financial statements.

3
The combining nonmajor fund financial statements, individual nonmajor fund - schedules of revenues, expenditures
and changes in fund balance – budget and actual, and the schedule of expenditures of federal and state awards are the
responsibility of management and were derived from and relate directly to the underlying accounting and other records
used to prepare the basic financial statements. Such information has been subjected to the auditing procedures applied
in the audit of the basic financial statements and certain additional procedures, including comparing and reconciling
such information directly to the underlying accounting and other records used to prepare the basic financial statements
or to the basic financial statements themselves, and other additional procedures in accordance with auditing standards
generally accepted in the United States of America. In our opinion, based on our audit, the procedures performed as
described above, and the report of the other auditors, the combining nonmajor fund financial statements; individual
nonmajor fund - schedules of revenues, expenditures and changes in fund balance – budget and actual, and the
schedule of expenditures of federal and state awards are fairly stated in all material respects, in relation to the basic
financial statements as a whole.
The introductory and statistical sections have not been subjected to the auditing procedures applied in the audit of the
basic financial statements and, accordingly, we do not express an opinion or provide any assurance on them.
Other Reporting Required by Government Auditing Standards
In accordance with Government Auditing Standards, we have also issued our report dated March 29, 2019, on our
consideration of the County’s internal control over financial reporting and on our tests of its compliance with certain
provisions of laws, regulations, contracts, and grant agreements and other matters. The purpose of that report is to
describe the scope of our testing of internal control over financial reporting and compliance and the results of that
testing, and not to provide an opinion on internal control over financial reporting or on compliance. That report is an
integral part of an audit performed in accordance with Government Auditing Standards in considering the County’s
internal control over financial reporting and compliance.
March 29, 2019
4
This page intentionally left blank

Bexar County, Texas Management Discussion & Analysis For Year Ended September 30, 2018
5
This section of the Bexar County comprehensive annual financial report presents management’s discussion and analysis (“MD&A”) of the financial performance of the primary government during the fiscal year ended September 30, 2018. The MD&A should be read in conjunction with the transmittal letter at the front of this report and the County’s basic financial statements and related notes following this section. The MD&A is a narrative overview and analysis of the financial activities of Bexar County for the fiscal year ended September 30, 2018 offered by management of Bexar County (the County). For information specific to the University Health System (the System), a significant discretely presented component unit of the County, please refer to the MD&A included in the separately issued financial statements of the System. A copy of those financial statements may be obtained by contacting the University Health System’s Financial Offices: 4502 Medical Drive, San Antonio, Texas 78229. For information specific to Cibolo Canyons Special Improvement District (the District), a discretely presented component unit of the County, please refer to the MD&A included in the separately issued financial statements of the District. A copy of those financial statements may be obtained by contacting the District’s General Counsel: 7550 W-IH 10, San Antonio, Texas 78229. For information specific to the Alamo Regional Mobility Authority (the Authority), a discretely presented component unit of the County, please refer to the MD&A included in the separately issued financial statements of the Authority. A copy of those financial statements may be obtained by contacting the Alamo Regional Mobility Authority c/o Bexar County Public Works: 233 N. Pecos La Trinidad, Suite 420, San Antonio Texas 78207. FINANCIAL HIGHLIGHTS GOVERNMENT-WIDE FINANCIAL STATEMENTS
• The total government-wide assets and deferred outflows of resources of the County exceeded the liabilities and deferred inflows of resources at September 30, 2018 by $284,387,005 and are reported as total net position of the primary government. This is comparable to the previous year when assets and deferred outflows of resources exceeded liabilities and deferred inflows of resources by $297,242,561(restated – see Note S). The total net position is comprised of unrestricted net position (funds that may be used to meet ongoing obligations to citizens and creditors), restricted net position (funds to be used for a specified purpose), and net investment in capital assets.
• The government-wide total net position decreased by $12,855,556 during the fiscal year ending September 30, 2018.
The change can be attributed to a decrease in governmental activities of $17,643,503 and an increase in business-type activities of $4,787,947. Comparative changes can be examined as follows:
• Total net position of the primary government is comprised of:
1) Net investment in capital assets, which includes land, buildings, improvements, roads, bridges, equipment,
furniture and fixtures as well as construction in progress, net of accumulated depreciation: September 30, 2018 $1,074,163,147 September 30, 2017 $1,031,365,933
2) Net position restricted by constraints imposed from outside the County such as debt obligations, regulations and/or federal and state laws:
September 30, 2018 $299,778,768 September 30, 2017 $326,139,364 3) Unrestricted net position represents the portion available to meet current requirements and obligations to the
County’s creditors and citizens: September 30, 2018 ($1,089,554,910) September 30, 2017 (Restated) ($1,060,262,736)

Bexar County, Texas Management Discussion & Analysis For Year Ended September 30, 2018
6
FINANCIAL HIGHLIGHTS (Continued) FUND FINANCIAL STATEMENTS
• As of September 30, 2018, the County’s governmental funds reported combined fund balances of $676,861,699 as compared with $779,874,225 at September 30, 2017. The decrease of $103,012,526 is primarily due to the deficiency of revenues and other financing sources over expenditures and other financing uses of $132,262,293 in the Capital Projects Fund. Approximately 13%, or $87,977,792, of the combined fund balances are unassigned at September 30, 2018 and are available to meet the County’s current and future needs. The total fund balance for the Nonmajor Governmental Funds is $64,289,379 at September 30, 2018 and $58,997,301 at September 30, 2017. The fund balance for the Governmental Nonmajor Funds is dedicated to service specific County functions.
• As of September 30, 2018, fund balance for the General Fund was $93,155,543 or 21% of total General Fund
expenditures for the year ended September 30, 2018. The County’s General Fund experienced a $2.5 million increase in fund balance from the prior fiscal period. The increase is due to the excess of revenues over expenditures of $14,055,442 reduced by net transfers out to other funds of $11,550,838.
• At September 30, 2018, the County’s Internal Service Funds had a deficit net position of $187,833,093, an increase
in the deficit of $8.8 million from the prior year. The increase in the deficit is primarily attributed to the net deficiency of operating revenues and transfers in from other funds over operating expenses of $8,801,421. The Internal Service Funds include the effect of the net other post-employment benefit (OPEB) obligation of $119,131,960 due to the implementation of GASB Statement No. 75 in the OPEB Fund. See Note O and S to the financial statements for the effect of GASB Statement No. 75.
LONG-TERM DEBT During the year, the County issued $384,715,000 in Limited Tax Refunding Bonds and $28,140,000 in Flood Control Tax Refunding Bonds. The refundings were undertaken to reduce debt service payments over the next several years and resulted in an economic gain of $16,542,822. The County also issued $40,840,000 in Pass-Through Revenue and Limited Tax Bonds for the purposes of making permanent public improvements. Note H to the financial statements provides details of long-term debt and information regarding Fiscal Year 2017-18 debt obligation activity. OVERVIEW OF THE FINANCIAL STATEMENTS This discussion and analysis is intended to introduce the reader to the County’s basic financial statements. These statements are comprised of three basic components:
1) Government-wide financial statements, 2) Fund financial statements, and 3) Notes to the basic financial statements.
Required Supplementary Information is included in addition to the basic financial statements. The County includes its Single Audit report in the Compliance Section.
GOVERNMENT-WIDE FINANCIAL STATEMENTS The government-wide financial statements are designed to provide readers with a broad overview of the financial position of the County in a manner similar to a private-sector business. The statements include a Statement of Net Position and a Statement of Activities. Both of these statements are presented using the accrual basis of accounting; therefore, revenues are recorded when earned and expenses are recorded when a liability is incurred.

Bexar County, Texas Management Discussion & Analysis For Year Ended September 30, 2018
7
OVERVIEW OF THE FINANCIAL STATEMENTS (Continued) GOVERNMENT-WIDE FINANCIAL STATEMENTS (Continued) The Statement of Net Position presents information on all County assets, deferred outflows of resources, liabilities and deferred inflow of resources, with the difference between the four reported as net position. Over time, increases or decreases in net position will serve the reader as a useful indicator of whether the financial position of the County is improving or deteriorating (Table 1 – Statistical Section). There are other non-financial factors, such as changes in the County’s property tax base (Tables 5 to 8 – Statistical Section) and the condition of the County’s roads, which should be considered to assess the overall health of the County. Another important factor to be taken into consideration is the County expenditures for assets owned by other entities. Table 19 in the Statistical Section lists those expenditures beginning with fiscal year 2007. The Statement of Activities presents information showing how net position changed during the most recent fiscal year. All changes in net position are reported as soon as the underlying event giving rise to the change occurs, regardless of the timing of related cash flows. Due to a full accrual presentation, revenues and expenses are reported in this statement for some items that will affect cash flows in future fiscal periods (Table 2 - Statistical Section). Allocated within the governmental activities functions in the Statement of Activities are expenses for services provided by the Internal Service Funds. Both government-wide financial statements distinguish functions of the County that are governmental activities principally supported by taxes, operating and capital grants, and charges for services that are intended to recover all or in part a portion of their costs through user fees, and investment earnings.
The governmental activities of the County include general government, judicial, public safety, education and recreation, public works, and health and public welfare. The business-type activities of the County include various community venue activities and the AT&T Center, which is the home court of the San Antonio Spurs and the Stock Show and Rodeo, the Commissary operated by the Sheriff’s office for inmates, two County owned parking facilities and the operation of a firing range.
Component units are included in the County’s basic financial statements and consist of legally separate entities for which the County is financially accountable. Three component units - Bexar County Housing Finance Corporation, Bexar County Health Facilities Development Corporation and Bexar County Industrial Development Corporation - are blended with the County. The three discretely presented component units are the University Health System (the System), Cibolo Canyons Special Improvement District (the District) and Alamo Regional Mobility Authority (the Authority). The System is reported as a discretely presented component unit because Commissioners Court appoints members of the System’s Board and approves the System’s tax rate, annual budget and issuance of bonded debt. The District is reported as a discretely presented component unit because Commissioners Court appoints and reappoints the seven member board of directors and is statutorily required to approve the issuance of any debt by the District. The Authority is reported as a discretely presented component unit because Commissioners Court appoints and reappoints six of its seven members of its board of directors. The seventh member, the Chairman, is appointed by the Governor of the State of Texas. Additionally, the Commissioners Court, by statute, approves the projects that the Authority funds with its primary revenue source, the vehicle registration fee. For more detailed information on these component units, refer to Note A of the basic financial statements. FUND FINANCIAL STATEMENTS
The fund financial statements are groupings of related accounts that are used to maintain control over resources that have been segregated for specific activities or objectives. The County, like other state and local governments, uses fund accounting to ensure and demonstrate finance-related legal compliance. All of the funds of the County can be divided into three categories: governmental funds, proprietary funds and fiduciary funds.

Bexar County, Texas Management Discussion & Analysis For Year Ended September 30, 2018
8
OVERVIEW OF THE FINANCIAL STATEMENTS (Continued) FUND FINANCIAL STATEMENTS (Continued)
Governmental Funds (Continued) Governmental funds are used to account for essentially the same functions reported as governmental activities in the government-wide financial statements. However, unlike the government-wide financial statements, governmental funds financial statements focus on near-term inflows and outflows of spendable resources, as well as on balances of spendable resources available at the end of the fiscal year. Such information may be useful in evaluating the County’s near-term financing requirements. Because the focus of governmental funds is narrower than that of the government-wide financial statements, it is useful to compare the information presented for governmental funds with similar information presented for governmental activities in the government-wide financial statements. This will allow the reader to better understand the long-term impact of the government’s near-term financing decisions. The governmental funds’ Balance Sheet and the governmental funds’ Statement of Revenues, Expenditures, and Changes in Fund Balances provide a reconciliation to facilitate this comparison between governmental funds and governmental activities and can be found on pages 35 and 37. Information is presented separately in the governmental funds’ Balance Sheet and in the governmental funds’ Statement of Revenues, Expenditures and Changes in Fund Balances for the major funds: General Fund, Debt Service Fund, and Capital Projects Fund. Data from the Nonmajor Governmental Funds, which include 29 special revenue funds and three blended component units, are combined into a single, aggregated presentation. Individual fund data for each of these Nonmajor Governmental Funds is provided in the combining statements which can be found on pages 127-141.
The County maintains various special revenue funds - virtually all are created by statute and are required to annually submit a budget to the Commissioners Court for review and adoption. Most of these funds receive financial resources from fees specifically designated by the State’s legislature to be used for a specified purpose.
In addition, the County is awarded grants by the State and the Federal governments. These grants cover periods as short as six months to multiple years. All grant programs have formal budgets which are reviewed annually.
Various law enforcement agencies, including the District Attorney’s Office, are awarded forfeited funds either by the State of Texas or the Federal government. These funds are to be used to support the law enforcement activity of the office. While there is no requirement for the federal funds to be budgeted, State law requires all public funds to be appropriated and presented to Commissioners Court. Therefore, every year the departments appropriate funds on hand that will be used in the following year. Proprietary Funds
Proprietary funds provide the same type of information as the government-wide financial statements, only in more detail. The County’s proprietary funds are maintained in two formats:
• An enterprise fund is used to report the same functions presented as business-type activities in the government-wide financial statements.
The Community Venue Fund is considered to be a major enterprise fund of the County. The fund is used to account for proceeds derived by the County from its sale of venue project revenue bonds for the primary purpose of financing a portion of the costs of certain projects authorized at the 2008 Venue election.
The Sheriff’s Commissary Fund is used to account for commissary sales to inmates housed in the Bexar County jail. The Parking Facilities Fund is used to account for the operation and maintenance of parking facilities. The facilities are intended to be financed primarily through user charges.

Bexar County, Texas Management Discussion & Analysis For Year Ended September 30, 2018
9
OVERVIEW OF THE FINANCIAL STATEMENTS (Continued) FUND FINANCIAL STATEMENTS (Continued) Proprietary Funds (Continued)
The Firing Range Fund is used to account for the operation and maintenance of a firing range. The facility is intended to be financed primarily through user charges.
• An Internal Service Fund is used to account for goods or services provided to one department by another on a cost reimbursement basis. The fund is profit and loss oriented and hence follows accrual accounting.
The County uses internal service funds to account for: the maintenance of County vehicles; other post-employment benefits; the administration of the County’s self-insurance programs for health, workers compensation and property liability claims; and the records management facility. Because these services predominantly benefit governmental rather than business-type functions, they have been included within governmental activities in the government-wide financial statements. Individual fund data for the internal service funds is provided in the form of combining statements on pages 181-185. The County’s four internal service funds are combined into a single, aggregated presentation in the proprietary funds’ financial statements.
Fiduciary Funds A Fiduciary fund (Trust or Agency) is used to account for resources held for the benefit of parties outside the government. Fiduciary funds are not reflected in the government-wide financial statements because the resources are not available to support programs and services provided by the County. The County’s fiduciary funds are agency funds which are purely custodial and thus do not involve measurement of results of operations. The County’s fiduciary financial information is reported in a separate Statement of Fiduciary Net Position on page 43. Individual fund data for the agency funds is provided with the combining statements on pages 187-193. NOTES TO THE BASIC FINANCIAL STATEMENTS
The notes to the financial statements provide additional information that is essential to a full understanding of the data provided in both the government-wide and fund financial statements. Notes to the financial statements begin on page 47. REQUIRED SUPPLEMENTARY INFORMATION Required supplementary information is presented to reflect budgetary compliance for the County’s General Fund. The County adopts an annual budget for this fund. A budgetary comparison schedule, which includes the original and final amended budget and actual figures, has been provided to demonstrate compliance with this budget. This section also includes the Schedule of Changes in Net Pension Liability and Related Ratios, the Schedule of Employer Pension Contributions and the Schedule of Changes in Total OPEB Liability and Related Ratios. Required supplementary information begins on page 107. COMPLIANCE SECTION The compliance section contains the report on compliance with the U.S. Office of Management and Budget (OMB) Circular Compliance Supplement and the State of Texas Single Audit Circular that are applicable to each major federal and state program for the fiscal year ended September 30, 2018, along with the schedule of expenditures of federal and state awards, and schedule of federal and state award findings and questioned costs. GOVERNMENT-WIDE FINANCIAL ANALYSIS
The current financial reporting model focuses on net position and serves as a useful indicator of a government’s financial position. For the primary government, assets and deferred outflows of resources exceeded liabilities and deferred inflows of resources by $284,387,005 at the close of the most recent fiscal year as compared to $297,242,561 (restated) at the close of the last fiscal year. This represents a $12,855,556, or 4%, decrease.

Bexar County, Texas Management Discussion & Analysis For Year Ended September 30, 2018
10
GOVERNMENT-WIDE FINANCIAL ANALYSIS (Continued) The following are condensed statements of net position for fiscal years 2018 and 2017.
Condensed Statement of Net Position September 30, 2018
Primary GovernmentGovernmental Business-type
Activities Activities Total Current and other assets 771,172,746$ 91,143,430$ 862,316,176$ Noncurrent assets 9,700,000 30,620,271 40,320,271 Capital assets 1,800,625,648 208,692,662 2,009,318,310 Total assets 2,581,498,394 330,456,363 2,911,954,757Deferred outflows of resources 83,909,628 2,480,810 86,390,438
Current and other liabilities 148,538,745 9,448,312 157,987,057 Noncurrent liabilities 2,154,034,229 382,395,093 2,536,429,322 Total liabilities 2,302,572,974 391,843,405 2,694,416,379 Deferred inflows of resources 19,400,744 141,067 19,541,811
Net position:Net investment in capital assets 1,012,651,582 61,511,565 1,074,163,147 Restricted net position 273,957,773 25,820,995 299,778,768 Unrestricted net position (943,175,051) (146,379,859) (1,089,554,910) Total net position 343,434,304$ (59,047,299)$ 284,387,005$
September 30, 2017Primary Government
(Restated)Governmental Business-type
Activities Activities Total Current and other assets 873,288,280$ 85,425,737$ 958,714,017$ Noncurrent assets 9,700,000 30,518,115 40,218,115 Capital assets 1,678,769,436 215,818,195 1,894,587,631 Total assets 2,561,757,716 331,762,047 2,893,519,763
Deferred outflows of resources 118,449,951 3,471,293 121,921,244
Current and other liabilities 145,303,286 9,308,429 154,611,715 Noncurrent liabilities 2,165,894,782 389,700,597 2,555,595,379 Total liabilities 2,311,198,068 399,009,026 2,710,207,094
Deferred inflows of resources 7,931,792 59,560 7,991,352
Net position:Net investment in capital assets 965,387,857 65,978,076 1,031,365,933 Restricted net position 301,680,655 24,458,709 326,139,364 Unrestricted net position (905,990,705) (154,272,031) (1,060,262,736) Total net position 361,077,807$ (63,835,246)$ 297,242,561$

Bexar County, Texas Management Discussion & Analysis For Year Ended September 30, 2018
11
GOVERNMENT-WIDE FINANCIAL ANALYSIS (Continued) For governmental activities, total net position of $343,434,304 reflects a 5%, or $17,643,503, decrease from the prior fiscal year. For business-type activities, total net position deficit of $59,047,299 reflects a 8%, or $4,787,947, deficit decrease from the prior fiscal year. Net pension liability decreased by $63,118,128 from $165,970,960 in the prior fiscal year to $102,852,832 in the current fiscal year. Deferred outflows of resources related to the net pension liability and the net OPEB liability decreased by $52,752,696 from $93,707,192 in the prior fiscal year to $40,954,496 in the current fiscal year. Deferred inflows of resources related to net pension liability increased by $11,550,459 from $7,991,352 in the prior fiscal year to $19,541,811. See Note N and Note O for more details. The County’s assets and deferred outflows of resources exceeded its liabilities and deferred inflows of resources by $284,387,005 at September 30, 2018 which is a 4%, or $12,855,556, decrease over the prior fiscal year. The following is a further analysis of the decrease.
Net investment in capital assets of $1,074,163,147 represents the County’s investment in capital assets such as buildings, infrastructure, land, construction and equipment in progress, net of accumulated depreciation and related debt. Although the County’s investment in its capital assets is reported net of related debt, it should be noted that resources needed to repay this debt must be externally provided from other sources. Liquidation of capital assets is not an alternative to providing funds to service debt and other related liabilities.
Restricted net position of $299,778,768 represents resources that are subject to external restrictions as to the use of the funds. For governmental activities, net position is restricted as follows:
1) The largest portion of restricted net position is $129,236,402 for capital projects.
2) The County has net position in various grant programs totaling to $12,552,709; however, this net position is to be used to fund continual budgets related to specific federal and state programs. Excess funding is returned at the end of the grant programs.
3) Legislative net position of $50,815,806 is comprised of a majority of the special revenue funds that were
created through the establishment of fees by the State Legislature or through federal funding to serve specific purposes. Accordingly, those revenues generated may only be used as directed by legislation.
4) Net position restricted for debt service is $107,173,851.
The deficit balance in unrestricted net position of $1,089,554,910 is comprised of a deficit balance of $943,175,051 in governmental activities and $146,379,859 in business-type activities. The deficit balances are primarily attributed to County expenses for assets owned by other entities. The County issues bonds to finance these projects that do not get capitalized on the County’s financial statements. The net effect of these transactions leaves a liability balance on the County’s financial statements for the bonds the County is still obligated to pay. The total balance for expenses on assets owned by other entities is $1,080,600,187 at September 30, 2018. See Table 19 in the Statistical Section for detailed balances.

Bexar County, Texas Management Discussion & Analysis For Year Ended September 30, 2018
12
GOVERNMENT-WIDE FINANCIAL ANALYSIS (Continued)
The difference between total fund balance in the governmental fund Balance Sheet (fund financial statements) and total net position for governmental activities in the Statement of Net Position (government-wide) is a decrease of $333,427,395. This variance exists because of items that are presented in the government-wide financial statements that are not presented in the fund financial statements, such as:
• Capital assets used in governmental activities of $1,800,147,429 • Investments in joint ventures of $9,700,000 • Adjustments to recognize unavailable revenues of $26,162,369 • Long-term liabilities of ($1,981,604,100) • Net position of the Internal Service Funds ($187,833,093)
A detailed reconciliation can be found in the Basic Financial Statements, page 35.

Bexar County, Texas Management Discussion & Analysis For Year Ended September 30, 2018
13
GOVERNMENT-WIDE FINANCIAL ANALYSIS (Continued)
The condensed statement of activities reflects the changes in net position for fiscal years ended September 30, 2018 and 2017.
Condensed Statement of Activities
Primary Government Business-
Governmental typeActivities Activities Total
RevenuesProgram revenues: Charges for service 109,121,877$ 8,343,408$ 117,465,285$ Operating grants and contributions 40,478,292 - 40,478,292 Capital grants and contributions 139,498,994 - 139,498,994 General revenues: Ad valorem taxes 436,292,268 - 436,292,268 Motor vehicle taxes 15,820,056 9,924,336 25,744,392 Other taxes 12,132,546 19,351,541 31,484,087 Investment earnings 13,392,740 1,802,805 15,195,545 Miscellaneous 23,322,569 645 23,323,214
Total Revenues 790,059,342 39,422,735 829,482,077
ExpensesGeneral government 143,816,856 - 143,816,856 Judicial 118,945,194 - 118,945,194 Public safety 243,887,769 - 243,887,769 Education and recreation 9,910,149 - 9,910,149 Public works 188,397,391 - 188,397,391 Health and public welfare 20,902,695 - 20,902,695 Interest and other charges 82,019,470 - 82,019,470 Unallocated depreciation 114,711 - 114,711 Community venue - 28,050,246 28,050,246 Commissary - 5,364,084 5,364,084 Firing range - 201,046 201,046 Parking facilities - 728,022 728,022
Total Expenses 807,994,235 34,343,398 842,337,633
Excess (deficiency) before other items and transfers (17,934,893) 5,079,337 (12,855,556) Transfers 291,390 (291,390) -
Change in net position (17,643,503) 4,787,947 (12,855,556) Net position - beginning (restated) 361,077,807 (63,835,246) 297,242,561
Net position - ending 343,434,304$ (59,047,299)$ 284,387,005$
For the Fiscal Year Ended September 30, 2018

Bexar County, Texas Management Discussion & Analysis For Year Ended September 30, 2018
14
GOVERNMENT-WIDE FINANCIAL ANALYSIS (Continued)
Condensed Statement of Activities
Primary Government (Restated)Business-
Governmental typeActivities Activities Total
RevenuesProgram revenues: Charges for service 105,715,688$ 7,853,831$ 113,569,519$ Operating grants and contributions 44,649,367 - 44,649,367 Capital grants and contributions 115,519,024 2,089,354 117,608,378 General revenues: Ad valorem taxes 416,975,864 - 416,975,864 Motor vehicle taxes 16,399,324 9,673,817 26,073,141 Other taxes 10,910,187 18,237,592 29,147,779 Investment earnings 8,295,219 864,943 9,160,162 Miscellaneous 19,980,840 10,570 19,991,410
Total Revenues 738,445,513 38,730,107 777,175,620
ExpensesGeneral government 137,106,877 - 137,106,877 Judicial 113,574,714 - 113,574,714 Public safety 239,226,903 - 239,226,903 Education and recreation 7,712,093 - 7,712,093 Public works 225,090,295 - 225,090,295 Health and public welfare 26,302,915 - 26,302,915 Interest and other charges 77,974,335 - 77,974,335 Unallocated depreciation 114,711 - 114,711 Community venue - 29,423,382 29,423,382 Commissary - 4,954,319 4,954,319 Firing range - 183,283 183,283 Parking facilities - 762,507 762,507
Total Expenses 827,102,843 35,323,491 862,426,334
(Deficiency) before other items and transfers (88,657,330) 3,406,616 (85,250,714) Transfers 229,424 (229,424) -
Change in net position (88,427,906) 3,177,192 (85,250,714) Net position - beginning (restated) 449,505,713 (67,012,438) 382,493,275
Net position - ending 361,077,807$ (63,835,246)$ 297,242,561$
For the Fiscal Year Ended September 30, 2017

Bexar County, Texas Management Discussion & Analysis For Year Ended September 30, 2018
15
GOVERNMENT-WIDE FINANCIAL ANALYSIS (Continued) REVENUE ANALYSIS (Continued) For the year ended September 30, 2018, total revenues for the primary government were $829,482,077 compared to $777,175,620 for the year ending September 30, 2017, a net increase of $52,306,457. Governmental activities provided revenues of $790,059,342 and $738,445,513 in 2018 and 2017, respectively, while business-type activities provided revenues of $39,422,735 and $38,730,107 in 2018 and 2017, respectively.
Property taxes represented the largest revenue source for the governmental activities for the two periods. The tax rate for fiscal year 2018 was $0.304097 and in 2017 it was $0.308950 per hundred ($100) dollars of valuation as authorized by Commissioners Court.
A comparative overview of ad valorem tax revenue, appraised values, and taxable values for the current and prior fiscal periods is as follows:
Percentage Year Ended Year Ended Change
September 30, 2018 September 30, 2017 From Prior Year
Ad Valorem Tax Revenue 435,014,178$ 416,975,864$ 4.33%
Appraised Value 161,417,662,975$ 149,992,953,069$ 7.62%
Taxable Value 150,253,090,360$ 139,279,867,321$ 7.88% Program revenues for the primary government are principally derived from the program that the revenues service and thereby reduce the cost of the function to the County. For the fiscal years ended September 30, 2018 and 2017 program revenues for the County were $297,442,571 and $275,827,264, respectively. Program revenue is made up of charges for services and operating and capital grants and contributions. Comparative overviews of these revenues are as follows:
Percentage Year Ended Year Ended Change
September 30, 2018 September 30, 2017 From Prior Year
Charges for Services 117,465,285$ 113,569,519$ 3.43%
Operating and Capital Grants and Contributions 179,977,286$ 162,257,745$ 10.92%
General revenues are revenues that are not assigned to support a specific function, but are available to provide financial resources as necessary. Included in general revenues are ad valorem taxes (discussed previously), other tax related revenues, interest earned from investments, and miscellaneous income. Overall, general revenues for the primary government increased by $30,691,150 compared to the prior fiscal period. The largest increases to general revenues were to ad valorem taxes of $19,316,404. The increase to ad valorem taxes was due to the increase in appraised and taxable values as noted above.

Bexar County, Texas Management Discussion & Analysis For Year Ended September 30, 2018
16
GOVERNMENT-WIDE FINANCIAL ANALYSIS (Continued) REVENUE ANALYSIS (Continued)
Government-Wide Revenues by Resource For the Years Ended September 30,
EXPENSE ANALYSIS
For the year ended September 30, 2018, the function and program costs for the governmental activities were $807,994,235 and $34,343,399 for the business-type activity. Comparative figures for the prior fiscal year are $827,102,843 and $35,323,491, respectively.
Operating expenses for the governmental activities during the fiscal year decreased by $19,108,608 over the previous fiscal year due primarily to the following:

Bexar County, Texas Management Discussion & Analysis For Year Ended September 30, 2018
17
GOVERNMENT-WIDE FINANCIAL ANALYSIS (Continued) EXPENSE ANALYSIS (Continued)
• Public works expenses decreased by $36,692,904. The decrease was attributable to a onetime payment made in fiscal year 2017 of $39,080,033 to the Texas Department of Transportation for a road project. Such payment did not occur again in fiscal year 2018.
Expenses for the business-type activities during the fiscal year decreased by $980,093 compared to the previous fiscal year. The decrease is primarily attributed to a onetime contribution to the Witte Museum of $2,250,000 recorded in fiscal year 2017. Such contribution did not occur again in fiscal year 2018. The difference between the governmental funds net change in fund balance in the Statement of Revenues, Expenditures and Changes in Fund Balances (fund financial statements) and the change in net position in the Statement of Activities (government-wide) is an increase of $85,369,023. The variance exists because of items that are presented in the government-wide financial statements that are not presented in the fund financial statements and items reported in the fund financial statements that are not reported in the government-wide financial statements, such as:
• Expenditures of $104,268,694 at the fund level for capital outlays that are capitalized at the government-wide level. • Capital donations of $116,109,591 recorded at the government-wide level only. • Depreciation expense of $98,425,406 recorded at the government-wide level only. • Recording of transactions associated with long-term debt and liabilities differ at the fund and government-wide
levels for a net decrease to net position of $30,618,969.
• Other adjustments due to the change in the basis of revenue recognition that increases net position and a decrease in net position of the Internal Service Funds reported as governmental activities at the government-wide level of $2,836,534 and $8,801,421 respectively.
A detailed reconciliation can be found in the Basic Financial Statements, page 37.

Bexar County, Texas Management Discussion & Analysis For Year Ended September 30, 2018
18
GOVERNMENT-WIDE FINANCIAL ANALYSIS (Continued) EXPENSE ANALYSIS (Continued)
Government-Wide Expenses by Function For the Year Ended September 30,

Bexar County, Texas Management Discussion & Analysis For Year Ended September 30, 2018
19
FINANCIAL ANALYSIS OF FUNDS
MAJOR GOVENMENTAL FUNDS The County’s governmental functions are contained in the General, Debt Service, Capital Projects, and Nonmajor Governmental Funds. The focus of the County’s governmental funds is to provide information on near-term inflows, outflows, and balances of spendable resources. Such information is useful in assessing the County’s annual financing and budgeting requirements. In particular, unassigned fund balance may serve as a useful measure of a government’s net resources available for spending at the end of the fiscal year. At September 30, 2018, the County’s governmental funds reported a combined fund balance of $676,861,699 and at September 30, 2017, reported $779,874,225, a decrease of $103,012,526 or 13%. Of the total fund balance, $87,977,792 or 13% constitutes unassigned fund balance, which is available to meet the County’s current and future needs of its citizens. Restricted fund balance of $582,785,292 or 86% of total fund balance is restricted for debt service in the amount of $81,935,785, capital expenditures in the amount of $437,480,992 and special revenue funds in the amount of $63,368,515. Committed fund balance of $920,864 is attributed to a special revenue fund. The remainder of fund balance is in nonspendable form of $5,177,751. The following schedule compares the revenues by source of the County’s governmental funds for fiscal years ending September 30, 2018 and 2017.
Revenues Classified by Source Governmental Funds
Increase2018 2017 (Decrease)
Revenues by source: Ad valorem taxes 435,014,178$ 416,185,808$ 18,828,370$ Other taxes, licenses, and permits 45,927,299 44,771,993 1,155,306 Intergovernmental revenue 52,164,833 73,512,073 (21,347,240) Court costs and fines 19,847,313 20,942,708 (1,095,395) Fees on motor vehicles 22,315,190 21,843,855 471,335 Other fees 40,357,549 38,236,799 2,120,750 Commissions from governmental units 5,041,751 4,850,594 191,157 Revenues from use of assets 28,740,544 24,555,514 4,185,030 Sales, refunds and miscellaneous 22,604,614 19,176,269 3,428,345 Total revenues 672,013,271$ 664,075,613$ 7,937,658$
September 30,
The General Fund
The General Fund is the chief operating fund of the County and a major governmental fund. At September 30, 2018, the total fund balance was $93,155,543, of which $87,977,792 was unassigned and $5,177,751 was in nonspendable form. As a measure of the General Fund’s liquidity, it is useful to compare unassigned fund balance to total expenditures and other financing uses. Unassigned fund balance is 20% of the combined total of General Fund expenditures and other financing uses. This is in compliance with the County’s policy that the unassigned fund balance in the General Fund is to be maintained at a minimum 15% of the expenditures of the fiscal year.
The Debt Service Fund
The Debt Service Fund, a major governmental fund, accounts for receipts and disbursements of funds related to the County’s long-term debt obligations for governmental activities. Expenditures include principal and interest payments on County debt, San Antonio River Authority bonds (see Note K to the financial statements), and bond issuance costs. Restricted fund balance increased by $21,453,085, or 35%, from prior year. The increase is primarily due to the excess of other financing sources from the transfers in for debt service over the excess of revenues over expenditures. For more information on the County’s long-term debt, see Note H in the Notes to the Financial Statements.

Bexar County, Texas Management Discussion & Analysis For Year Ended September 30, 2018
20
FINANCIAL ANALYSIS OF FUNDS (Continued)
MAJOR GOVENMENTAL FUNDS (Continued) The Capital Projects Fund
The Capital Projects Fund, a major governmental fund, is used to account for receipts and disbursements relating to the acquisition or construction of major capital projects, including assets to be owned by other entities (see Statistical Section, Table 19). At the end of fiscal year 2018, the fund balance was $437,480,992 compared with the 2017 fund balance of $569,743,285, a decrease of $132,362,293. This decrease is primarily attributable to a decrease in the issuance of long term debt and bond premiums of $84,041,396. More detailed information concerning capital improvement activity can be found in the Notes to the Financial Statements, Notes A, G, and Q.

Bexar County, Texas Management Discussion & Analysis For Year Ended September 30, 2018
21
FINANCIAL ANALYSIS OF FUNDS (Continued)
MAJOR GOVENMENTAL FUNDS (Continued)
Governmental Funds Revenues by Resource For the Years Ended September 30,

Bexar County, Texas Management Discussion & Analysis For Year Ended September 30, 2018
22
FINANCIAL ANALYSIS OF FUNDS (Continued)
MAJOR GOVENMENTAL FUNDS (Continued)
Governmental Funds Expenditures by Function For the Years Ended September 30,

Bexar County, Texas Management Discussion & Analysis For Year Ended September 30, 2018
23
FINANCIAL ANALYSIS OF FUNDS (Continued) PROPRIETARY FUNDS
The County accounts for five proprietary funds – four business-type activities (the Community Venue Fund, the Sheriff’s Commissary Fund, the Parking Facilities Fund and the Firing Range Fund), and one governmental activity (Internal Service Funds). The County’s proprietary fund statements provide the same type of information found in the government-wide financial statements but in more detail. Community Venue Fund (Venue Fund)
The Community Venue Fund currently is the County’s only major business-type proprietary fund. This fund is used to account for proceeds derived by the County from its sale of venue project revenue bonds and receipts from visitor taxes - hotel occupancy tax and short-term motor vehicle tax - for the construction, improvements and financing of the various community projects approved by voters in the May 2008 election. The May 2008 bond election authorized the County to issue $415 million in venue bonds to fund 24 projects within the County to include: San Antonio River improvements, construction of youth and amateur athletic facilities, community arena enhancements and renovations to the performing and cultural arts center. As of September 30, 2018, the County had issued $397,950,000 of the $415,000,000. The debt is secured by and payable, in whole or in part, from the revenues derived by the County by imposing and collecting visitor taxes.
As of September 30, 2018, the Venue Fund’s net position of ($61,864,777) is made up of $61,345,172 in net investment in capital assets, $25,820,995 of restricted net position for debt service and grant payments, and ($149,030,944) of unrestricted net position. The change in net position was an increase of $4,283,207 from the previous fiscal year which is primarily attributed to an increase in net non-operating revenues and expenses of $2,985,575. Net non-operating revenues and expenses in 2018 are $11,427,849 compared to $8,442,274 in 2017. The major difference between both years is an increase of hotel occupancy tax of $1,113,949, motor vehicle tax of $250,519 and investment income of $910,009.
The Sheriff’s Commissary Fund (Commissary Fund)
The Commissary Fund supports the inmates that are in the County Jail. All goods and services of the Commissary Fund are priced out at market value and are available for the inmates to purchase if they have funds available in their Inmate Trust account. The profits made from the sales of goods and services are to be used to support services for the inmates as well as to support the personal needs of indigent inmates. At September 30, 2018, the Commissary Fund had total net position of $1,363,920 compared with $968,500 at September 30, 2017. The increase in net position from 2017 is primarily attributed to an operating gain in 2018 of $368,763.
The Parking Facilities Fund
The Parking Facilities Fund is used to account for the operation and maintenance of parking facilities. The facilities are intended to be financed primarily through user charges. At September 30, 2018, the Parking Facilities Fund had total net position of $1,449,044 compared with $1,300,970 at September 30, 2017. The increase in net position from 2017 is primarily attributed to operating income of $577,434 reduced by transfers to other funds of $450,000. The Firing Range Fund
The Firing Range Fund is used to account for the operation and maintenance of a firing range. The facility is intended to be financed primarily through user charges. The decrease in net position from 2017 of $38,754 is primarily attributed to the deficit of a $199,546 operating loss over a transfer of $158,610 from the General Fund.

Bexar County, Texas Management Discussion & Analysis For Year Ended September 30, 2018
24
FINANCIAL ANALYSIS OF FUNDS (Continued) PROPRIETARY FUNDS (Continued) Internal Service Funds
The County uses Internal Service Funds to support activities of the General Fund as well as activities of the Special Revenue Funds and Capital Projects Fund. For the year ended September 30, 2018, the funds reflected a total deficit in net position of $187,833,093 as compared to $179,031,672 (Restated) at September 30, 2017. Revenues were provided through $57,511,681 in premiums, fees, charges for services, sales and other income. Operating expenses for the current fiscal year were $73,843,462. The largest expenses were claims paid through self-insurance funds of $55,847,926 and $11,513,434 accrued for the net increase in the other post employment benefits liability. The decrease in net position is primarily due to an increase in healthcare expenses and the accrual of the net increase in the other postemployment benefits obligation. For more information, see the combining statements on pages 181-185. GENERAL FUND BUDGETARY HIGHLIGHTS The General Fund’s original and final revenue budget was $445,336,149 with actual revenues of $448,177,525. The difference of $2,841,376 is primarily due to the County receiving $1,412,758 more than estimated for intergovernmental revenue and $1,128,303 in other fees. The final amended expenditure budget was $449,877,242 and actual expenditures were $434,122,083, a difference of $15,755,159. This variance was primarily due to savings in payroll, computer supplies, postage, personnel training and a carry forward to fiscal year 2019 of equipment purchases. There was no significant variance between the original expenditure budget and the final budget. The following table summarizes the General Fund’s budgeted and actual amounts for fiscal year 2018.
General Fund Budget vs. Actual Fiscal Year 2018
Original Final Budget Budget Actual
Revenues Ad valorem taxes 336,255,070$ 336,255,070$ 336,475,868$ Other taxes, licenses, and permits 28,286,500 28,286,500 28,243,732 Intergovernmental revenue 7,590,185 7,590,185 9,002,943 Court costs and fines 15,140,000 15,140,000 14,498,101 Fees on motor vehicles 6,158,600 6,158,600 6,048,070 Other fees 24,640,475 24,640,475 25,768,778 Commissions from governmental units 5,071,619 5,071,619 5,041,751 Revenues from use of assets 18,302,200 18,302,200 18,326,513 Sales, refunds and miscellaneous 3,891,500 3,891,500 4,771,769 Total revenues 445,336,149 445,336,149 448,177,525
Expenditures 449,764,861 449,877,242 434,122,083
TransfersInterfund transfers in 214,022 214,022 305,043 Interfund transfers out (11,788,236) (11,855,881) (11,855,881) Total transfers (11,574,214) (11,641,859) (11,550,838) Net change in fund balance (16,002,926)$ (16,182,952)$ 2,504,604$

Bexar County, Texas Management Discussion & Analysis For Year Ended September 30, 2018
25
CAPITAL ASSETS AND DEBT ADMINISTRATION CAPITAL ASSETS
The capital assets of the County are those assets (land, right-of-way, buildings, improvements, roads, bridges, machinery, and equipment) which are used by the County in performance of the County’s functions. At September 30, 2018, capital assets (net of depreciation) for the governmental activities of the County were $1,800,625,648 and at September 30, 2017 were $1,678,769,436. Retirements for the County were $2,570,214 and $2,424,843, for 2018 and 2017, respectively.
Depreciation on capital assets is recognized in the government-wide financial statements. Depreciation provided for the current fiscal year for the governmental activities was $98,537,020 as compared to $94,735,655 for the year ended September 30, 2017. At September 30, 2018, the County’s governmental activities had $347,506,116 invested in ongoing construction in progress compared to $275,899,514 at the end of the prior fiscal year. The balance in capital assets in the County’s business-type activity at September 30, 2018 was $208,692,663, as compared to $215,818,195 at September 30, 2017. The depreciation provided for the current fiscal year was $7,125,532 and $5,812,998 for the prior fiscal period. Major capital activity during the current fiscal year included additions of approximately $116,109,591 in donated roads and $104,268,694 in expenditures for construction costs associated with roads, buildings and major renovations to existing buildings for governmental activities. For additional information related to capital asset activity, see Note G to the Notes of the Financial Statements. A condensed analysis of the County’s capital assets is as follows:
Capital Assets(net of accumulated depreciation)
September 30, Increase 2018 2017 (Decrease)
Governmental Activities: Land 87,022,141$ 83,192,193$ 3,829,948$ Buildings 337,560,875 345,805,588 (8,244,713) Machinery and Equipment 17,649,133 18,664,151 (1,015,018) Infrastructure 953,083,387 902,481,036 50,602,351 Construction in Progress 405,310,112 328,626,468 76,683,644
Totals 1,800,625,648 1,678,769,436 121,856,212 Business-Type Activities: Buildings 208,526,268 215,591,172 (7,064,904) Equipment 166,394 227,023 (60,629) Construction in Progress - - -
Totals 208,692,662 215,818,195 (7,125,533) Total Capital Assets, net 2,009,318,310$ 1,894,587,631$ 114,730,679$

Bexar County, Texas Management Discussion & Analysis For Year Ended September 30, 2018
26
CAPITAL ASSETS AND DEBT ADMINISTRATION (Continued) LONG-TERM DEBT
At September 30, 2018, the County had total long-term debt and other liabilities outstanding of $2,305,503,149 as compared to $2,262,596,891 in the prior year:
2018 2017Governmental Activities: Bonds Payable 977,615,000$ 585,140,000$ Certificates of Obligations 705,950,000 1,087,760,000 Unamortized Premium and Discount 187,787,701 153,772,980 Compensated Absences 45,686,841 40,928,803
Total Governmental Activities 1,917,039,542$ 1,867,601,783$
Business-Type Activities: Tax Exempt Bonds 343,915,000$ 348,610,000$ Taxable Bonds 37,490,000 39,100,000 Unamortized Premium and Discount 7,058,607 7,285,108
Total Business-Type Activities 388,463,607$ 394,995,108$
Outstanding At September 30,
During the current fiscal period for governmental activities, the County issued $384,715,000 in Limited Tax Refunding Bonds, $28,140,000 Flood Control Tax Refunding Bonds, and $40,840,000 Pass-Through Revenue and Limited Tax Bonds. In fiscal year 2019 the County issued $198,035,000 in Combination Tax and Revenue Certificates of Obligation. See Note H and Note R for more information.
For business-type activities, the County retired $6,305,000 in venue debt. See Note H of the financial statements for further information about the County’s long-term debt.
County officials, citizens and investors will find the ratio of net bonded debt to assessed valuation and the amount of bonded debt per capita as useful indicators of the County's debt position in Tables 9 and 10 of the statistical section of this report.
The County is currently in compliance with all required bond covenants. The County continues to enjoy a favorable debt rating. The bond rating services have assigned Bexar County the following long-term bond ratings:
• Standard & Poor’s Rating Services AAA • Fitch IBCA, Inc. AAA • Moody’s Investor Service, Inc. Aaa
ECONOMIC FACTORS
For the fiscal year ending September 30, 2018, the current tax rate is $0.304097 per $100 valuation. It is anticipated that ad valorem revenues for fiscal year 2019 will be approximately $438,098,000 with actual ad valorem revenues totaling $435,014,178 for fiscal year 2018. For the General Fund in fiscal year 2019, both total available funds and the adopted expenditure budget, including appropriated fund balance, were estimated to be approximately $546,655,453.

Bexar County, Texas Management Discussion & Analysis For Year Ended September 30, 2018
27
ECONOMIC FACTORS (Continued) The County’s unemployment rate increased from 3.2% to 3.3%, according to the Texas Workforce Commission. The County’s unemployment rate is below the State’s unemployment rate of 3.7%. In addition, the County enjoyed some external corporate employment growth (4,460 positions) from various sectors. See the letter of transmittal for more information. REQUESTS FOR INFORMATION This financial report is designed to provide a general overview of the County’s finances for all those with an interest in the County’s finances. Questions concerning any of the information provided in this report or requests for additional financial information should be addressed to the County Auditor’s Office, 101 W. Nueva Street, Suite 800, San Antonio, Texas 78205.

28
This page intentionally left blank

29
GOVERNMENT
WIDE
FINANCIAL
STATEMENTS

30 The accompanying notes are an integral part of this statement.
Governmental Activities
Business-Type Activities Total
Component Units
ASSETSCurrent Assets: Cash, cash equivalents, and temporary investments 72,765,084$ 17,900,390$ 90,665,474$ 105,608,030$ Investments 638,721,258 62,718,679 701,439,937 406,157,132 Receivables: Delinquent taxes, net of allowance for uncollectable accounts 12,399,782 - 12,399,782 215,784,973 Accounts and other 44,570,135 4,580,783 49,150,918 284,844,443 Inventories 510,391 - 510,391 - Restricted Assets: Cash and cash equivalents - 5,543,771 5,543,771 - Accrued interest 2,023,076 1 2,023,077 - Prepaid assets 21,587 399,806 421,393 - Deposits 161,433 - 161,433 -Total Current Assets 771,172,746 91,143,430 862,316,176 1,012,394,578
Noncurrent Assets: Cash and cash equivalents - - - 440,950,000 Investments - - - 53,662,725 Restricted assets: Cash and cash equivalents - 25,374,227 25,374,227 4,673,864 Investments - - - 50,282,566 Other assets - - - 10,640,087 Prepaid assets - 5,246,044 5,246,044 - Capital assets: Land 87,022,141 - 87,022,141 20,906,000 Equipment and construction in progress 405,310,112 - 405,310,112 26,749,107 Other capital assets, net of depreciation 1,308,293,395 208,692,662 1,516,986,057 1,218,970,932 Investment in joint venture 9,700,000 - 9,700,000 -Total Noncurrent Assets 1,810,325,648 239,312,933 2,049,638,581 1,826,835,281
TOTAL ASSETS 2,581,498,394 330,456,363 2,911,954,757 2,839,229,859
DEFERRED OUTFLOWS OF RESOURCESDeferred charge on refundings 43,217,630 2,218,312 45,435,942 14,374,000Pension 36,054,948 262,498 36,317,446 61,049,000OPEB 4,637,050 - 4,637,050 -TOTAL DEFERRED OUTFLOWS OF RESOURCES 83,909,628$ 2,480,810$ 86,390,438$ 75,423,000$
Bexar County, TexasSTATEMENT OF NET POSITION
September 30, 2018
Primary Government

31 The accompanying notes are an integral part of this statement.
Governmental Activities
Business-Type Activities Total
Component Units
LIABILITIESCurrent Liabilities Accounts payable and accrued liabilities 56,477,716$ 261,665$ 56,739,381$ 292,684,262$ Due to other governmental units 3,634,488 9,175 3,643,663 - Unearned revenue 608,046 - 608,046 6,027,000 Current portion of: Long-term liabilities 11,421,711 - 11,421,711 22,755,000 Payable from restricted assets: Contract retainage payable 8,096,812 - 8,096,812 - Current portion of long-term debt 45,606,801 6,811,501 52,418,302 - Accrued interest payable 22,693,171 2,365,971 25,059,142 2,192,549 Retainage Payable - - - 13,210 Due to TxDOT - - - 1,763,023Total Current Liabilities 148,538,745 9,448,312 157,987,057 325,435,044
Noncurrent Liabilities Long-term liabilities 1,860,011,031 381,652,106 2,241,663,137 900,230,570 Due to other governments - - - 17,974,789 Net pension liability 102,109,845 742,987 102,852,832 166,683,000 OPEB liability 190,671,163 - 190,671,163 - Claims payable 1,242,190 - 1,242,190 - Estimated self-insurance reserves - - - 5,169,000Total Noncurrent Liabilities 2,154,034,229 382,395,093 2,536,429,322 1,090,057,359
TOTAL LIABILITIES 2,302,572,974 391,843,405 2,694,416,379 1,415,492,403
DEFERRED INFLOWS OF RESOURCESPension 19,400,744 141,067 19,541,811 3,591,000Property taxes - - - 427,393,000TOTAL DEFERRED INFLOWS OF RESOURCES 19,400,744 141,067 19,541,811 430,984,000
NET POSITIONNet investment in capital assets 1,012,651,582 61,511,565 1,074,163,147 505,277,050Restricted for: Debt service 81,352,856 25,820,995 107,173,851 1,182,236 Grants 12,552,709 - 12,552,709 - Capital projects 129,236,402 - 129,236,402 51,738,469 Health care - - - 46,007,000 Legislative 50,815,806 - 50,815,806 - Restricted obligations - - - 5,201,961Unrestricted (943,175,051) (146,379,859) (1,089,554,910) 458,769,740
TOTAL NET POSITION 343,434,304$ (59,047,299)$ 284,387,005$ 1,068,176,456$
Primary Government
Bexar County, TexasSTATEMENT OF NET POSITION
September 30, 2018

32 The accompanying notes are an integral part of this statement.
Expenses Charges for ServicesOperating Grants and
ContributionsCapital Grants and
Contributions
Functions/Programs Governmental activities: General government 143,816,856$ 35,693,180$ 635,021$ -$ Judicial 118,945,194 18,437,622 8,343,200 - Public safety 243,887,769 33,172,774 14,438,664 - Education and recreation 9,910,149 119 1,327,655 - Public works 188,397,391 20,083,431 1,202,096 139,498,994 Health and public welfare 20,902,695 1,734,751 14,531,656 - Interest and other fees 82,019,470 - - -
Unallocated depreciation 114,711 - - - Total governmental activities 807,994,235 109,121,877 40,478,292 139,498,994 Business-type activities: Venue Fund 28,050,246 1,300,000 - - Commissary Fund 5,364,084 5,737,097 - -
Firing Range Fund 201,046 1,500 - -
Parking Facilities Fund 728,022 1,304,811 - - Total business-type activities 34,343,398 8,343,408 - -Total primary government 842,337,633 117,465,285 40,478,292 139,498,994
Component Units: University Health System 1,718,366,000$ 1,349,164,000$ -$ -$ Cibolo Canyons Special Improvement District 19,601,878 - - - Alamo Regional Mobility Authority 14,347,634 - - 283,020Total component units 1,752,315,512$ 1,349,164,000$ -$ 283,020$
Net position - ending
Bexar County, TexasSTATEMENT OF ACTIVITIES
For Fiscal Year Ended September 30, 2018
Program Revenues
Gain on disposal of assets Transfers between governmental and business-type activities Total general revenues, special items, and transfers Change in net position
Occupancy taxes Mixed drink taxes
Net position - beginning (Restated - See Note S)
Motor vehicle taxes
General revenues: Taxes: Property taxes Flood control taxes Bingo taxes
Sale and use taxes Unrestricted investment earnings
Miscellaneous Investment income

33 The accompanying notes are an integral part of this statement.
Governmental Activities
Business-type Activities Total Component Units
(107,488,655)$ -$ (107,488,655)$ -$ (92,164,372) - (92,164,372) -
(196,276,331) - (196,276,331) - (8,582,375) - (8,582,375) -
(27,612,870) - (27,612,870) - (4,636,288) - (4,636,288) -
(82,019,470) - (82,019,470) -
(114,711) - (114,711) - (518,895,072) - (518,895,072) -
- - (26,750,246) (26,750,246) - - 373,013 373,013 -
- (199,546) (199,546) -
- 576,789 576,789 - - (25,999,990) (25,999,990) -
(518,895,072) (25,999,990) (544,895,062) -
(369,202,000)$ (19,601,878)(14,064,614)
(402,868,492)$
416,955,334 - 416,955,334 404,188,64919,336,934 - 19,336,934 -1,579,557 - 1,579,557 -
15,820,056 9,924,336 25,744,392 16,267,220- 19,351,541 19,351,541 5,711,406
10,552,989 - 10,552,989 -- - - 1,076,282
13,392,740 1,802,805 15,195,545 -- - - 10,171,242
22,991,436 645 22,992,081 16,020,190331,133 - 331,133 -291,390 (291,390) - -
501,251,569 30,787,937 532,039,506 453,434,989(17,643,503) 4,787,947 (12,855,556) 50,566,497361,077,807 (63,835,246) 297,242,561 1,017,609,959343,434,304$ (59,047,299)$ 284,387,005$ 1,068,176,456$
Net (Expenses) Revenues and
Changes in Net Position
Primary Government

34 The accompanying notes are an integral part of this statement.
General Debt ServiceCapital
Projects
Nonmajor Governmental
Funds
Total Governmental
FundsASSETS Cash and temporary investments 8,066,303$ 6,269,598$ 40,803,984$ 11,250,775$ 66,390,660$ Investments 96,585,401 75,586,323 413,287,816 51,621,552 637,081,092 Receivables: Taxes, net 9,830,213 2,141,333 428,236 - 12,399,782 Accounts receivable, net 16,858,854 - 1,737,752 58,790 18,655,396 Due from other funds 19,166 - - - 19,166 Advances to other funds 4,840,184 - - - 4,840,184 Due from other governmental units 5,780,070 1,704,951 10,547,584 7,882,134 25,914,739 Accrued interest 2,023,076 - - - 2,023,076 Prepaid assets 21,174 - - - 21,174 Inventories 316,393 - - - 316,393 Deposits 151,433 - - - 151,433
TOTAL ASSETS 144,492,267$ 85,702,205$ 466,805,372$ 70,813,251$ 767,813,095$
LIABILITIES Vouchers payable 7,948,783$ 600$ 8,917,246$ 2,923,229$ 19,789,858$ Accrued liabilities 17,777,517 - 7,558,978 2,573,978 27,910,473 Due to other funds - - - 19,166 19,166 Advances from other funds - - 4,330,184 400,000 4,730,184 Due to other governmental units 3,633,795 - - 693 3,634,488 Unearned revenues 1,240 - - 606,806 608,046 Contract retainage payable - - 8,096,812 - 8,096,812
TOTAL LIABILITIES 29,361,335 600 28,903,220 6,523,872 64,789,027
DEFERRED INFLOWS OF RESOURCES Unavailable revenue - property taxes 9,544,195 2,060,869 421,160 - 12,026,224 Unavailable revenue - court costs and fines 12,431,194 - - - 12,431,194 Unavailable revenue - other - 1,704,951 - - 1,704,951
TOTAL DEFERRED INFLOWS OF RESOURCES 21,975,389 3,765,820 421,160 - 26,162,369
FUND BALANCE Nonspendable 5,177,751 - - - 5,177,751 Restricted - 81,935,785 437,480,992 63,368,515 582,785,292 Committed - - - 920,864 920,864 Unassigned 87,977,792 - - - 87,977,792
TOTAL FUND BALANCE 93,155,543 81,935,785 437,480,992 64,289,379 676,861,699
TOTAL LIABILITIES, DEFERRED INFLOWS OF RESOURCES, AND FUND BALANCE 144,492,267$ 85,702,205$ 466,805,372$ 70,813,251$ 767,813,095$
The accompanying notes are an integral part of this statement.
Bexar County, TexasBALANCE SHEET - GOVERNMENTAL FUNDS
September 30, 2018
Major Funds

35 The accompanying notes are an integral part of this statement.
Bexar County, TexasReconciliation of Balance Sheet - Governmental Funds to
Statement of Net PositionSeptember 30, 2018
Total Fund Balances - Governmental Funds 676,861,699$
Amounts reported for governmental activities in the statement of net position are different because:
Capital assets used in governmental activities are not financial resources and therefore 1,800,147,429are not reported as assets in governmental funds.
Investments in joint ventures are not financial resources and therefore are not reported as 9,700,000assets on governmental funds.
Certain receivables are not available and, therefore, are reported as deferred inflows of 14,136,145resources in governmental funds.
Certain receivables will be collected this year, but are not available soon enough to pay 12,026,224for the current period's expenditures, and therefore are reported as deferred inflows of resources in governmental funds.
Internal service funds are used by the County's management to charge the cost of (187,833,093)self-insurance, fleet maintenance, records management, and other post-employment benefits to individual funds. The assets and liabilities of the internal service fundsare included with governmental activities in the Statement of Net Position but arenot included at the fund level.
Long-term liabilities, including notes and bonds payable, are not due and payable in the current period and therefore are not reported as liabilities in the funds.
Bonds (1,683,565,000)Deferred charge on refunding (to be amortized as interest expense) 43,217,630Issuance premium (to be amortized as interest expense) (187,787,702)Accrued interest (22,693,171)Compensated absences (45,686,841)Deferred outflows of resources - pension 35,900,122Deferred inflows of resources - pension (19,317,535)Net pension liability (101,671,603)
(1,981,604,100)
Total Net Position - Governmental Activities 343,434,304$

36 The accompanying notes are an integral part of this statement.
General Debt ServiceCapital
Projects
Nonmajor Governmental
Funds
Total Governmental
FundsREVENUES Ad valorem taxes 336,475,868$ 97,036,904$ 1,501,406$ -$ 435,014,178$ Other taxes, licenses, and permits 28,243,732 - 17,683,567 - 45,927,299 Intergovernmental revenue 9,002,943 2,769,806 3,463,745 36,928,339 52,164,833 Court costs and fines 14,498,101 - 572,782 4,776,430 19,847,313 Fees on motor vehicles 6,048,070 - 16,267,120 - 22,315,190 Other fees 25,768,778 - 743,078 13,845,693 40,357,549 Commissions from governmental units 5,041,751 - - - 5,041,751 Revenues from use of assets 18,326,513 7,977,220 1,707,386 729,425 28,740,544 Sales, refunds and miscellaneous 4,771,769 2,535,510 15,091,457 205,878 22,604,614
TOTAL REVENUES 448,177,525 110,319,440 57,030,541 56,485,765 672,013,271
EXPENDITURES Current General government 96,633,167 - 10,853,056 7,392,803 114,879,026 Judicial 106,834,093 - 59,000 8,521,723 115,414,816 Public safety 211,247,224 - 120,922 15,649,278 227,017,424 Education and recreation 6,813,019 - 862,500 1,232,070 8,907,589 Public works 6,492,929 - 100,809,461 3,933,917 111,236,307 Health and public welfare 5,560,811 - 65,351 15,451,990 21,078,152 Capital expenditures 540,840 - 102,431,128 1,296,726 104,268,694 Debt service: Principal - 29,900,000 - - 29,900,000 Interest - 77,536,864 - - 77,536,864 Bond issuance cost - 3,321,972 - - 3,321,972 Debt service SARA - 3,102,341 - - 3,102,341
TOTAL EXPENDITURES 434,122,083 113,861,177 215,201,418 53,478,507 816,663,185
Excess (deficiency) of revenues over expenditures 14,055,442 (3,541,737) (158,170,877) 3,007,258 (144,649,914)
OTHER FINANCING SOURCES (USES)Interfund transfers in 305,043 17,136,831 260,380 3,008,804 20,711,058Interfund transfer out (11,855,881) - (15,310,400) (723,984) (27,890,265)Issuance of long term debt - - 40,840,000 - 40,840,000Issuance of refunding bonds - 412,855,000 - - 412,855,000Payment to refunded debt paying agent - (469,913,894) - - (469,913,894)Premium on bond issues - 64,916,885 118,604 - 65,035,489 TOTAL OTHER FINANCING SOURCES (USES) (11,550,838) 24,994,822 25,908,584 2,284,820 41,637,388
Net change in fund balances 2,504,604 21,453,085 (132,262,293) 5,292,078 (103,012,526)
FUND BALANCE - BEGINNING 90,650,939 60,482,700 569,743,285 58,997,301 779,874,225
FUND BALANCE - ENDING 93,155,543$ 81,935,785$ 437,480,992$ 64,289,379$ 676,861,699$
Major Funds
Bexar County, TexasSTATEMENT OF REVENUES, EXPENDITURES AND CHANGES IN FUND BALANCES
GOVERNMENTAL FUNDSFor Fiscal Year Ended September 30, 2018

37 The accompanying notes are an integral part of this statement.
Bexar County, TexasReconciliation of Changes in Fund Balances - Governmental Funds to
Statement of ActivitiesFor the Fiscal Year Ended September 30, 2018
Net Change in Fund Balances - Total Governmental Funds (103,012,526)$ Amounts reported for governmental activities in the statement of activities are different because:
Governmental funds report capital outlays as expenditures. However, in the statementof activities the cost of those assets is allocated over their estimated useful lives and reported as depreciation expense. 104,268,694
Depreciation expense for capital assets that is allocated over their estimated useful lives. (98,425,406)
Capital asset donations 116,109,591
governmental funds, while the repayment of the principal of long-term debt consumes the current financialresources of governmental funds. Neither transaction, however, has any effect on net position. Also,governmental funds report the effect of premiums, discounts, and similar items when debt is first issued,whereas these amounts are deferred and amortized in the statement of activities. This amount is the neteffect of these differences in the treatment of long-term debt and related items.
Debt issued:General obligation bonds (453,695,000) Deferred charges 33,506,595 Premiums (41,758,190)
(461,946,595)
Repayments to paying agent for bond principal 443,030,000
resources and therefore are not reported as expenditures in governmental funds.
Accrued interest on debt 111,793 Amortization of debt premium 7,743,469 Amortization of deferred charges (9,031,546) Compensated absences (4,758,038) Net pension liability (5,768,052)
(11,702,374)
year end, they are not considered "available" revenues and are deferred in the governmental funds.Deferred inflows of resources decreased by this amount in the current period. 2,836,534
such as self insurance, OPEB and fleet maintenance, to individual funds. The net revenue (expense) ofcertain activities of internal service funds is reported with governmental activities. (8,801,421)
Change in Net Position - Governmental Activities (17,643,503)$
The issuance of long-term debt (e.g., bonds, notes) provides current financial resources to
Some expenses in the statement of activities do not require the use of current financial
Because some revenues will not be collected for several months after the County's fiscal
Internal service funds are used by management to charge the costs of certain activities,

38 The accompanying notes are an integral part of this statement.
Community Venue Fund
Nonmajor Enterprise
Fund Total
Internal Service Funds
ASSETSCurrent assets: Cash, cash equivalents 17,627,443$ 272,947$ 17,900,390$ 6,374,424$
Investments 59,572,100 3,146,579 62,718,679 1,640,166 Receivables: Accounts - 97,173 97,173 - Due from other governmental units 4,483,610 - 4,483,610 - Inventories - - - 193,998Restricted assets: Cash and cash equivalents 5,543,771 - 5,543,771 -Deposits - - - 10,000Prepaid assets 399,806 - 399,806 413Accrued interest 1 - 1 - TOTAL CURRENT ASSETS 87,626,731 3,516,699 91,143,430 8,219,001
Noncurrent assets: Prepaid assets 5,246,044 - 5,246,044 -Restricted assets: Cash and cash equivalents 25,374,227 - 25,374,227 -Capital assets: Buildings and improvements 281,281,306 - 281,281,306 125,708 Equipment 12,174,366 565,559 12,739,925 1,087,589 Reference library - 38,960 38,960 - Less: Accumulated depreciation (84,929,404) (438,125) (85,367,529) (735,079) TOTAL NONCURRENT ASSETS 239,146,539 166,394 239,312,933 478,218 TOTAL ASSETS 326,773,270 3,683,093 330,456,363 8,697,219
DEFERRED OUTFLOWS OF RESOURCESDeferred charge on refundings 2,218,312 - 2,218,312 -Pension 10,553 251,945 262,498 154,826OPEB - - - 4,637,050 TOTAL DEFERRED OUTFLOWS OF RESOURCES 2,228,865$ 251,945$ 2,480,810$ 4,791,876$
Enterprise Funds
Bexar County, TexasSTATEMENT OF NET POSITION
PROPRIETARY FUNDS September 30, 2018

39 The accompanying notes are an integral part of this statement.
Community Venue Fund
Nonmajor Enterprise
Fund Total
Internal Service Funds
LIABILITIESCurrent liabilities: Accounts payable -$ 160,349$ 160,349$ 393,056$ Claims payable - - - 8,349,649 Accrued liabilities 1,795 99,521 101,316 34,679 Due to other funds - - - - Due to other governmental units - 9,175 9,175 -Payable from restricted assets: Accrued interest payable 2,365,971 - 2,365,971 - Revenue bonds payable 6,811,501 - 6,811,501 - TOTAL CURRENT LIABILITIES 9,179,267 269,045 9,448,312 8,777,384
Noncurrent liabilities:
Advances from other funds - - - 110,000Revenue bonds payable 381,652,106 - 381,652,106 -
Net pension liability 29,868 713,119 742,987 438,242Claims payable - - - 1,242,190
OPEB obligation - - - 190,671,163 TOTAL NONCURRENT LIABILITIES 381,681,974 713,119 382,395,093 192,461,595
TOTAL LIABILITIES 390,861,241 982,164 391,843,405 201,238,979
DEFERRED INFLOWS OF RESOURCES
Pension 5,671 135,396 141,067 83,209 TOTAL DEFERRED INFLOWS OF RESOURCES 5,671 135,396 141,067 83,209
NET POSITIONNet investment in capital assets 61,345,172 166,393 61,511,565 478,209Restricted for debt service and grant payments 25,820,995 - 25,820,995 -Unrestricted (149,030,944) 2,651,085 (146,379,859) (188,311,302)
TOTAL NET POSITION (61,864,777)$ 2,817,478$ (59,047,299) (187,833,093)$
Enterprise Funds
Bexar County, TexasSTATEMENT OF NET POSITION
PROPRIETARY FUNDS September 30, 2018

40 The accompanying notes are an integral part of this statement.
Community Venue Fund
Nonmajor Enterprise
Funds Total
Internal Service Funds
OPERATING REVENUES Premiums -$ -$ -$ 54,659,041$ Records management storage fees - - - 100,000
Employee clinic fees - - - 16,635 Commissary sales - 5,737,097 5,737,097 - Fleet maintenance sales - - - 855,444 License fees 1,300,000 - 1,300,000 - User fees - 1,306,311 1,306,311 - Other income - 645 645 1,880,561 TOTAL OPERATING REVENUES 1,300,000 7,044,053 8,344,053 57,511,681
OPERATING EXPENSES Administrative fees - - - 2,930,929 Claims expenses - - - 55,847,926 Insurance expenses - - - 1,459,555
OPEB costs - - - 11,513,434 Personnel costs 92,203 2,481,733 2,573,936 1,509,656 Rent and utilities - - - 69,207 Purchased services 1,141,315 3,401,495 4,542,810 266,804 Supplies - 282,997 282,997 52,609 Repairs and maintenance - 70,548 70,548 81,735 Depreciation and amortization 7,211,124 60,629 7,271,753 111,607 TOTAL OPERATING EXPENSES 8,444,642 6,297,402 14,742,044 73,843,462Net operating income (loss) (7,144,642) 746,651 (6,397,991) (16,331,781)
NON-OPERATING REVENUES (EXPENSES) Hotel occupancy tax 19,351,541 - 19,351,541 - Motor vehicle tax 9,924,336 - 9,924,336 - Investment income 1,753,326 49,479 1,802,805 59,763 Interest expenses (19,506,323) - (19,506,323) -
Amortization (95,031) - (95,031) - TOTAL NON-OPERATING REVENUES (EXPENSES) 11,427,849 49,479 11,477,328 59,763
Income (loss) before transfers and contributions 4,283,207 796,130 5,079,337 (16,272,018)
Interfund transfers in - 158,610 158,610 7,470,597Interfund transfers out - (450,000) (450,000) - TOTAL TRANSFERS AND CONTRIBUTIONS - (291,390) (291,390) 7,470,597
Change in net position 4,283,207 504,740 4,787,947 (8,801,421)Net position at beginning of year (Restated - See Note S) (66,147,984) 2,312,738 (63,835,246) (179,031,672)Net position at end of year (61,864,777)$ 2,817,478$ (59,047,299)$ (187,833,093)$
Enterprise Funds
Bexar County, TexasSTATEMENT OF REVENUES, EXPENSES AND CHANGES IN NET POSITION
PROPRIETARY FUNDSFor Fiscal Year Ended September 30, 2018

41 The accompanying notes are an integral part of this statement.
Community Venue Fund
Nonmajor Enterprise Funds
Total Business-type Activities
Internal Service Funds
CASH FLOWS FROM OPERATING ACTIVITIESCash received for premiums -$ -$ -$ 56,146,096$ Cash received for employee clinic fees - - - 16,635 Cash received for fleet maintenance services - - - 857,441 Cash received for records management storage - - - 100,000 Cash received for commissary sales - 5,741,602 5,741,602 - Cash received for parking fees - 1,305,456 1,305,456 - Cash received for firing range fees - 1,500 1,500 - Cash received for license fee 1,300,000 - 1,300,000 - Receipts from other governmental units - 224 224 - Payments to suppliers (1,147,902) (3,853,460) (5,001,362) (4,773,452) Payments to employees for services (91,803) (2,458,275) (2,550,078) (1,479,381) Claims paid - - - (55,151,590) Net cash provided (used) for operating activities 60,295 737,047 797,342 (4,284,251)
CASH FLOWS FROM NONCAPITALFINANCING ACTIVITIESTaxes received 29,069,024 - 29,069,024 - Transfer from other funds - 158,610 158,610 7,470,597 Principal payments on noncapital debt (3,075,000) - (3,075,000) - Interest payments on noncapital debt (11,513,238) - (11,513,238) - Net cash provided for noncapital financing activities 14,480,786 158,610 14,639,396 7,470,597
CASH FLOWS FROM CAPITAL AND RELATEDFINANCING ACTIVITIESPrincipal payments on capital debt (3,230,000) - (3,230,000) - Interest payments on capital debt (7,700,791) - (7,700,791) - Transfer to other funds - (450,000) (450,000) - Purchase of capital assets - - - (14,939) Net cash (used) for capital and related financing activities (10,930,791) (450,000) (11,380,791) (14,939)
CASH FLOWS FROM INVESTING ACTIVITIESInvestment purchases (9,703,470) (686,875) (10,390,345) (1,640,158) Investment sales - 27,085 27,085 - Investment earnings 1,753,325 49,479 1,802,804 59,763 Net cash (used) for investing activities (7,950,145) (610,311) (8,560,456) (1,580,395)
Net increase (decrease) in cash and cash equivalents (4,339,855) (164,654) (4,504,509) 1,591,012
Cash and cash equivalents - beginning of year 52,885,296 437,601 53,322,897 4,783,412
Cash and cash equivalents - end of year 48,545,441$ 272,947$ 48,818,388$ 6,374,424$
Bexar County, TexasSTATEMENT OF CASH FLOWS
PROPRIETARY FUNDSFor Fiscal Year Ended September 30, 2018
Enterprise Funds
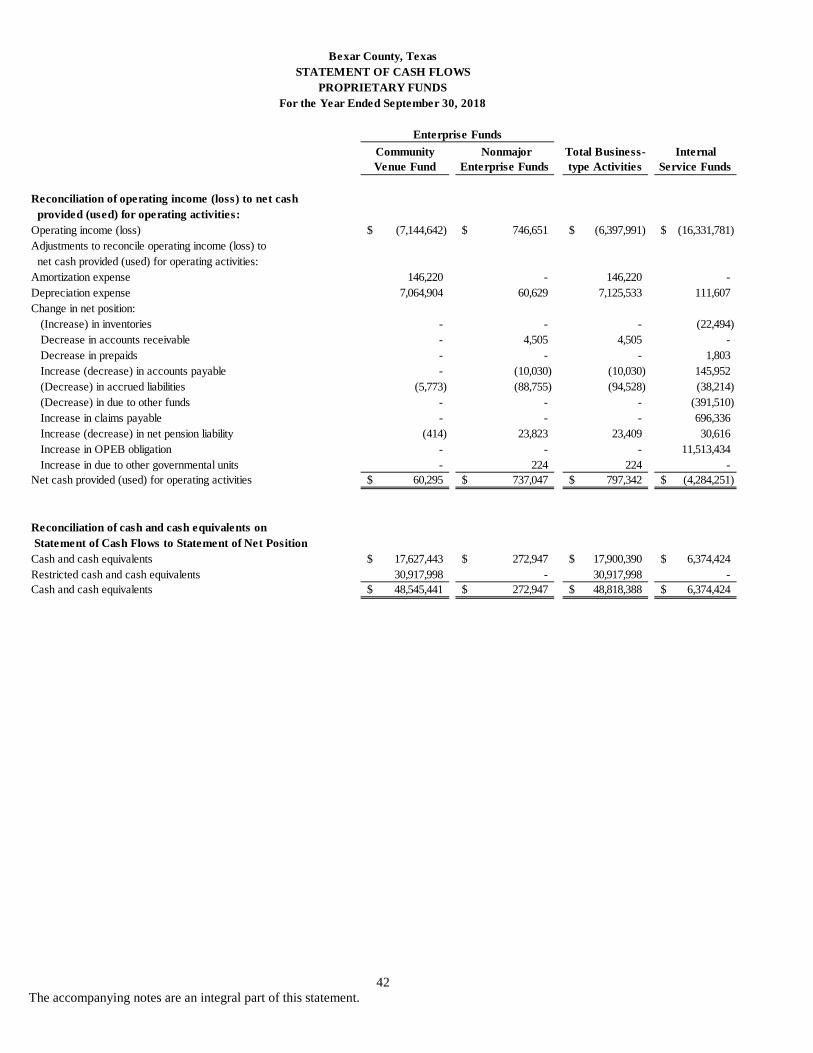
42 The accompanying notes are an integral part of this statement.
Community Venue Fund
Nonmajor Enterprise Funds
Total Business-type Activities
Internal Service Funds
Reconciliation of operating income (loss) to net cash provided (used) for operating activities:Operating income (loss) (7,144,642)$ 746,651$ (6,397,991)$ (16,331,781)$ Adjustments to reconcile operating income (loss) to net cash provided (used) for operating activities:Amortization expense 146,220 - 146,220 - Depreciation expense 7,064,904 60,629 7,125,533 111,607 Change in net position: (Increase) in inventories - - - (22,494) Decrease in accounts receivable - 4,505 4,505 - Decrease in prepaids - - - 1,803 Increase (decrease) in accounts payable - (10,030) (10,030) 145,952 (Decrease) in accrued liabilities (5,773) (88,755) (94,528) (38,214) (Decrease) in due to other funds - - - (391,510) Increase in claims payable - - - 696,336 Increase (decrease) in net pension liability (414) 23,823 23,409 30,616 Increase in OPEB obligation - - - 11,513,434 Increase in due to other governmental units - 224 224 - Net cash provided (used) for operating activities 60,295$ 737,047$ 797,342$ (4,284,251)$
Reconciliation of cash and cash equivalents on Statement of Cash Flows to Statement of Net PositionCash and cash equivalents 17,627,443$ 272,947$ 17,900,390$ 6,374,424$ Restricted cash and cash equivalents 30,917,998 - 30,917,998 - Cash and cash equivalents 48,545,441$ 272,947$ 48,818,388$ 6,374,424$
Enterprise Funds
Bexar County, TexasSTATEMENT OF CASH FLOWS
PROPRIETARY FUNDSFor the Year Ended September 30, 2018

43 The accompanying notes are an integral part of this statement.
Bexar County, TexasSTATEMENT OF FIDUCIARY NET POSITION
FIDUCIARY FUNDSSeptember 30, 2018
Agency Funds
ASSETS
Cash and cash equivalents 110,846,117$ Accounts receivable 7,352,806 Deferred outflows of resources - pension 2,722,725 Due from other governmental units 353,455
TOTAL ASSETS 121,275,103$
LIABILITIES
Vouchers payable 570,159$ Accrued liabilities 8,848,339 Due to participants 57,352,896 Deferred inflows of resources - pension 1,463,014 Due to other governmental units 53,040,695
TOTAL LIABILITIES 121,275,103$

44 The accompanying notes are an integral part of this statement.
University Health System
Cibolo Canyons Special
Improvement District
Alamo Regional Mobility
Authority TotalASSETSCurrent Assets: Cash, cash equivalents, and temporary investments 91,422,000$ 5,282,863$ 8,903,167$ 105,608,030$ Investments 367,643,000 - 38,514,132 406,157,132 Receivables:
Delinquent taxes, net of allowance for uncollectible accounts 215,777,000 7,973 - 215,784,973 Accounts and other 282,513,000 640,863 1,690,580 284,844,443
Total Current Assets 957,355,000 5,931,699 49,107,879 1,012,394,578
Noncurrent Assets: Cash and cash equivalents 440,950,000 - - 440,950,000
Investments 45,280,000 - 8,382,725 53,662,725 Restricted assets: Cash and cash equivalents - - 4,673,864 4,673,864 Investments - - 50,282,566 50,282,566
Other assets 10,427,000 - 213,087 10,640,087 Capital assets: Land 20,906,000 - - 20,906,000 Equipment and construction in progress 5,983,000 - 20,766,107 26,749,107 Other capital assets, net of depreciation 1,142,133,000 76,837,932 - 1,218,970,932
Total Noncurrent Assets 1,665,679,000 76,837,932 84,318,349 1,826,835,281
TOTAL ASSETS 2,623,034,000 82,769,631 133,426,228 2,839,229,859
DEFERRED OUTFLOWS OF RESOURCESLoss on bond refunding 14,374,000 - - 14,374,000 Pensions 61,049,000 - - 61,049,000 TOTAL DEFERRED OUTFLOWS OF RESOURCES 75,423,000 - - 75,423,000
LIABILITIESCurrent Liabilities
Accounts payable and accrued liabilities 292,199,000 35,270 449,992 292,684,262 Unearned revenue 6,027,000 - - 6,027,000 Current portion of:
Long-term liabilities 17,975,000 2,865,000 1,915,000 22,755,000 Accrued interest payable - 581,934 1,610,615 2,192,549 Retainage Payable - - 13,210 13,210 Due to TxDOT - - 1,763,023 1,763,023
Total Current Liabilities 316,201,000 3,482,204 5,751,840 325,435,044
Noncurrent LiabilitiesLong-term liabilities 652,107,000 120,873,580 127,249,990 900,230,570 Due to other governments - - 17,974,789 17,974,789 Net pension liability 166,683,000 - - 166,683,000 Estimated self-insurance costs 5,169,000 - - 5,169,000
Total Noncurrent Liabilities 823,959,000 120,873,580 145,224,779 1,090,057,359
TOTAL LIABILITIES 1,140,160,000 124,355,784 150,976,619 1,415,492,403
DEFERRED INFLOWS OF RESOURCESProperty taxes 427,393,000 - - 427,393,000 Pensions 3,591,000 - - 3,591,000 TOTAL DEFERRED INFLOWS OF RESOURCES 430,984,000 - - 430,984,000
NET POSITIONNet investment in capital assets 507,471,000 (3,698,282) 1,504,332 505,277,050 Restricted for:
Debt service - - 1,182,236 1,182,236 Capital projects - - 51,738,469 51,738,469 Health care 46,007,000 - - 46,007,000 Restricted obligations - 5,201,961 - 5,201,961
Unrestricted 573,835,000 (43,089,832) (71,975,428) 458,769,740
TOTAL NET POSITION 1,127,313,000$ (41,586,153)$ (17,550,391)$ 1,068,176,456$
Bexar County, TexasSTATEMENT OF NET POSITION - COMPONENT UNITS
September 30, 2018

45 The accompanying notes are an integral part of this statement.
University Health System
Cibolo Canyons Special
Improvement District
Alamo Regional Mobility
Authority Total
Expenses 1,718,366,000$ 19,601,878$ 14,347,634$ 1,752,315,512$ Total expenses 1,718,366,000 19,601,878 14,347,634 1,752,315,512
RevenuesProgram Revenues:
Charges for services 1,349,164,000 - - 1,349,164,000 Capital grants and contributions - - 283,020 283,020
Total program revenues 1,349,164,000 - 283,020 1,349,447,020
Total program (369,202,000) (19,601,878) (14,064,614) (402,868,492)
General RevenuesTaxes:
Property taxes 399,652,000 4,536,649 - 404,188,649 Motor vehicles taxes - - 16,267,220 16,267,220 Occupancy taxes - 5,711,406 - 5,711,406 Sales and use taxes - 1,076,282 - 1,076,282
Investment income 8,529,000 41,103 1,601,139 10,171,242 Miscellaneous 15,999,000 21,040 150 16,020,190
Total general revenues 424,180,000 11,386,480 17,868,509 453,434,989
Change in net position 54,978,000 (8,215,398) 3,803,895 50,566,497
Net position, beginning 1,072,335,000 (33,370,755) (21,354,286) 1,017,609,959 Net position, ending 1,127,313,000$ (41,586,153)$ (17,550,391)$ 1,068,176,456$
Bexar County, TexasSTATEMENT OF ACTIVITIES
COMPONENT UNITSFor Fiscal Year Ended September 30, 2018
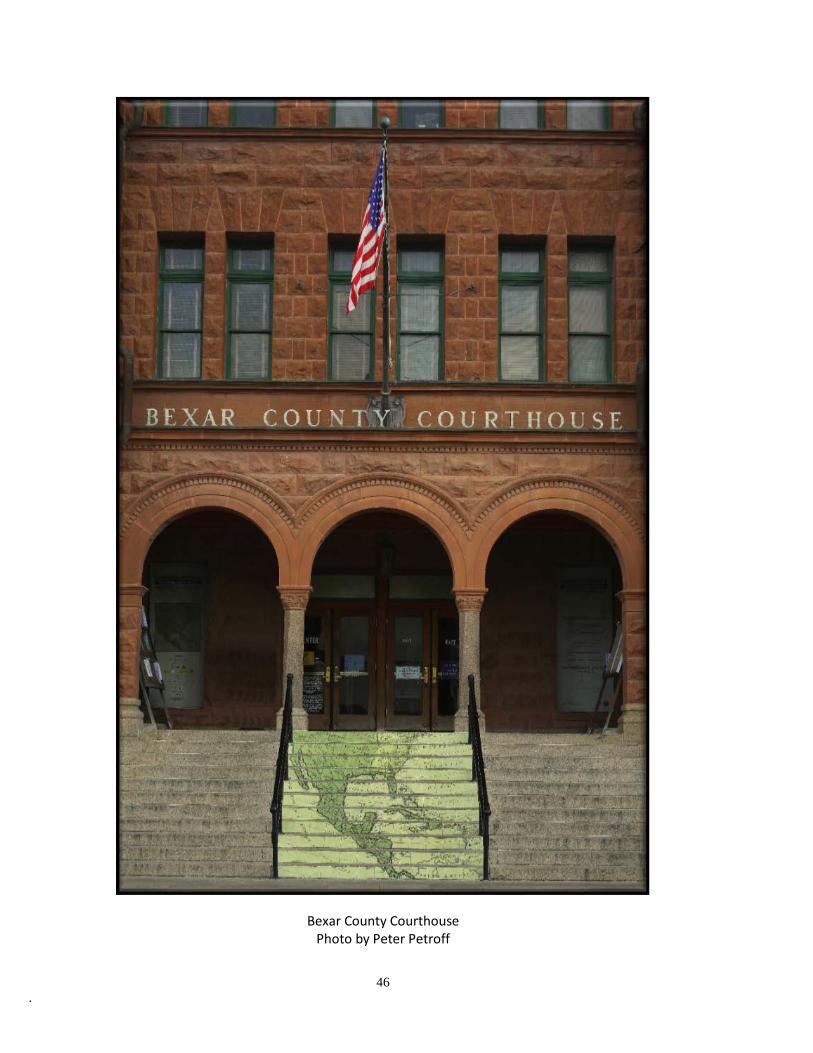
46 .
Bexar County Courthouse Photo by Peter Petroff

Bexar County, Texas NOTES TO BASIC FINANCIAL STATEMENTS
September 30, 2018
47
NOTE A - SUMMARY OF SIGNIFICANT ACCOUNTING POLICIES
The financial statements of Bexar County (the County) have been prepared in conformance with generally accepted accounting principles (GAAP) as applicable to local governmental units. The Governmental Accounting Standards Board (GASB) is the accepted body for establishing governmental accounting and financial reporting standards. The following is a summary of the more significant policies of the County.
1. The Reporting Entity
The County (the primary government in these financial statements) is governed by Commissioners Court. The Court is comprised of five elected officials consisting of the County Judge (elected County-wide) and four commissioners (elected by precinct).
In evaluating how to define the County for financial reporting purposes, management has considered all potential component units. The decision to include a potential component unit in the reporting entity was made by applying the criteria set forth in GASB Statement No.14, The Financial Reporting Entity, GASB Statement No. 39, Determining Whether Certain Organizations are Component Units and GASB Statement No. 61, The Financial Reporting Entity:Omnibus. In accordance with these standards, a financial reporting entity consists of the primary government and its component units. Component units are legally separate entities for which the elected officials of the County are financially accountable, or the relationship to the County is such that exclusion would cause the County's financial statements to be misleading or incomplete. Although blended component units are legally separate entities, they function as an integral part of the primary government and have their data blended with the primary government. All discretely presented component units, on the other hand, are reported in a separate column in the government-wide financial statements. The criteria used to determine whether an organization is a component unit of the County and whether it is a discretely presented or a blended component unit includes: whether the County appoints a voting majority of the component’s board and has the ability to impose its will on the component unit or a financial benefit or burden relationship exists between the County and component unit; whether the component unit is fiscally dependent on the County and a financial benefit or burden relationship exists; whether the component unit has substantively the same governing body as the primary government and a financial benefit or burden relationship exists or management (below the level of elected officials) of the primary government has operational responsibility for the activities of the component unit; whether services are provided entirely or almost entirely to the primary government; and whether the total debt of the component unit is repayable (almost) entirely from resources of the primary government. Blended with the Primary Government The relationship between the following component units and the County meet the criteria, for inclusion as part of the reporting entity as blended component units.
Bexar County Housing Finance Corporation The Bexar County Housing Finance Corporation (BCHFC) is a Texas public, non-profit corporation created in accordance with the Texas Housing Finance Corporations Act. Pursuant to the Act, the BCHFC is authorized to finance residential housing by issuing its tax-exempt revenue bonds to acquire mortgage loans made to low or moderate income persons, and to pledge such mortgage loans as security for the payment of the principal and interest of such revenue bonds. The tax-exempt bonds issued by the BCHFC do not constitute a debt or a pledge of faith or credit of the BCHFC or the County, but are payable by the user pursuant to terms defined in the loan agreement underlying each issue. Interest received on the bonds is generally exempt from federal income tax under Section 103 of the Internal Revenue Code. The BCHFC is governed by a five-member Board of Directors which is comprised of the Bexar County Commissioners Court. In addition, management (below the level of the elected officials) of the primary government has operational responsibility for the activities of the component unit.
Bexar County Health Facilities Development Corporation The Bexar County Health Facilities Development Corporation (BCHFDC) is a Texas public, non-profit corporation created on April 21, 1983 in accordance with the Texas Health Facilities Development Act of 1981. The BCHFDC's purpose is to acquire, construct, provide, improve, finance and refinance health facilities to assist the maintenance of the public health. The tax-exempt bonds issued by the BCHFDC do not constitute a debt or a pledge of faith or credit of the BCHFDC or the County, but are payable by the user pursuant to terms defined in the loan agreement underlying each issue. Interest received on the bonds is generally exempt from federal income tax under Section 103 of the Internal Revenue Code. The BCHFDC is governed by a five-member Board of Directors which is comprised of the Bexar County Commissioners Court. In addition, management
Bexar County, Texas NOTES TO BASIC FINANCIAL STATEMENTS
September 30, 2018
48
NOTE A - SUMMARY OF SIGNIFICANT ACCOUNTING POLICIES (Continued)
1. The Reporting Entity (Continued)
Bexar County Health Facilities Development Corporation (Continued) (below the level of the elected officials) of the primary government has operational responsibility for the activities of the component unit.
Bexar County Industrial Development Corporation The Bexar County Industrial Development Corporation (BCIDC) is a Texas public, non-profit corporation created on July 29, 1981, in accordance with the Texas Development Corporation Act of 1979. The BCIDC’s purpose is to issue bonds on behalf of the County, to finance projects as defined in the Act in order to promote and develop industrial and manufacturing enterprises thus encouraging employment and improving the public welfare. The tax-exempt bonds issued by the BCIDC do not constitute a debt or pledge of faith or credit of the BCIDC or the County, but are payable by the user pursuant to terms defined in the loan agreement underlying each issue. Interest received on the bonds is generally exempt from federal income tax under Section 103 of the Internal Revenue Code. The BCIDC is governed by a five-member Board of Directors which is comprised of the Bexar County Commissioners Court. In addition, management (below the level of the elected officials) of the primary government has operational responsibility for the activities of the component unit.
Separate, audited financial statements for these corporations are available from the County Auditor's Office, 101 W. Nueva Street, Suite 800, San Antonio, Texas 78205.
Discretely Presented Component Units The relationship between the following component units and the County is such that they meet the criteria, as set forth in GASB Statement No. 14, for inclusion as discretely presented component units in the reporting entity:
University Health System (The System) The Bexar County Hospital District, d/b/a University Health System, Bexar County, Texas (the System), is a political subdivision of the State of Texas, and is comprised of University Hospital, University Health System – Robert E. Green Campus, University Family Health Centers, University Center for Community Health, University Dialysis Centers, and Correctional Health Care Services. The System receives support from its supporting organization, the University Health System Foundation (the Foundation), a non-profit corporation established in 1984 to provide charitable, scientific and educational activities, and to raise funds on behalf of the System. The System serves as the major teaching facility for The University of Texas Health Science Center (UTHSC). The System is exempt from federal income taxes under section 115(a) of the Internal Revenue Code. The System formed Community First Health Plans, Inc. (CFHP), a non-profit corporation which operates as an HMO. CFHP is exempt from federal income tax under Section 501(c) (4) of the Internal Revenue Code. CFHP has agreements with plan sponsors, including the System, to arrange health service benefits for subscribing participants. Under these agreements, CFHP receives monthly capitation payments based on the number of each plan sponsor’s participants, regardless of services performed. In addition, CFHP receives supplementary delivery payments under the Medicaid program. The System is presented as an enterprise fund type.
The criteria used to determine inclusion as a significant discretely presented component unit are: Commissioners Court appoints members of the System’s Board of Managers; Commissioners Court approves the System’s tax rate and annual budget; and, the System cannot issue bonded debt without Commissioners Court approval. Furthermore, the System’s total net position in relation to the total primary government’s net position is such that to exclude essential disclosures from the County’s financial statements as they pertain to the System would be misleading. Therefore, relevant disclosures have been included in the County’s financial statements. The System's financial information presented in the government-wide financial statements is as of, and for the year ended, December 31, 2017, which is the latest audited System financial information available. Complete financial statements of the System may be obtained from the component unit’s administrative office:
University Health System 4502 Medical Drive San Antonio, Texas 78229

Bexar County, Texas NOTES TO BASIC FINANCIAL STATEMENTS
September 30, 2018
49
NOTE A - SUMMARY OF SIGNIFICANT ACCOUNTING POLICIES (Continued)
1. The Reporting Entity (Continued)
Discretely Presented Component Units (Continued)
Cibolo Canyons Special Improvement District (The District) The Cibolo Canyons Special Improvement District (the District) is a public improvement district created by an order of the Commissioners Court of Bexar County on September 1, 2005, pursuant to Chapter 372 of the Texas Local Government Code. The purpose of the District was to induce the developer to construct a major hotel and two golf courses as well as supporting infrastructure and to provide land and construct facilities for conservation, parks, recreation and open space within the District.
The criteria used to determine inclusion as a discretely presented component unit are: The Board of Directors is comprised of seven- members, as appointed by Commissioners Court, and the District cannot issue bonded debt without Commissioners Court approval. The District’s financial information presented in the government-wide financial statements is as of, and for the year ended, September 30, 2017, which is the latest audited District financial information available. Complete financial statements of the District may be obtained from the component unit’s administrative office:
The District’s General Counsel 7550 W-IH 10 San Antonio, Texas 78229
Alamo Regional Mobility Authority (The Authority)
The Bexar County Regional Mobility Authority was approved by the Texas Department of Transportation (“TxDOT”) on December 18, 2003 as a political subdivision of the State of Texas under the Texas Transportation Code, Chapter 370. The County formally approved the conditions of TxDOT on January 14, 2004. The Bexar County Regional Mobility Authority held its first meeting on April 13, 2004. On October 14, 2004, the Bexar County Regional Mobility Authority formally changed its name to Alamo Regional Mobility Authority (The Authority). The Authority’s powers and duties are enumerated under Texas Transportation Code, Chapter 370, and include authority to borrow monies and issue bonds to finance transportation projects. The Authority is governed by a seven-member Board of Directors. Six are appointed by Bexar County Commissioners Court, and the Chairman is appointed by the Governor of the State of Texas. In fiscal year 2013, the County took over the day-to-day business activity of the Authority. The Authority is currently being managed by the Office of the County Manager and Public Works Department. David Smith, the Bexar County Manager, was named Executive Director of the Authority.
The Authority was established by the Bexar County Commissioners Court with the intent to partner with the Texas Department of Transportation (TxDOT); the San Antonio-Bexar County Metropolitan Planning Organization (MPO); and the County to leverage funding and bring needed relief to the congestion impacting the Bexar County Area. In, 2018 the authority was informed by TxDOT that the last remaining toll road project, 1604 Managed Lane Project, was being reconfigured to be toll-free, i.e., fully funded by State and Federal governments with the need of toll revenues as a funding source. With no identifiable source of toll revenues in the immediate future, the Authority’s management and board of directors made the decision to change the reporting entity from a business-type activities to governmental activities, since the Authority’s primary source of revenue is now vehicle registration fees. As there was no change in the operations of the Authority, only a change in reporting structure, this change had no effect on beginning net position.
The criteria used to determine inclusion as a discretely presented component unit are: The Authority is governed by a seven-member Board of Directors. Six are appointed by Bexar County Commissioners Court, and the Chairman is appointed by the Governor of the State of Texas. The Authority’s financial information presented in the government-wide financial statements is as of, and for the year ended, September 30, 2018. Complete financial statements of the Authority may be obtained from the component unit’s administrative office: Alamo Regional Mobility
c/o Bexar County Public Works 1948 Probandt Street, San Antonio, TX 78214

Bexar County, Texas NOTES TO BASIC FINANCIAL STATEMENTS
September 30, 2018
50
NOTE A - SUMMARY OF SIGNIFICANT ACCOUNTING POLICIES (Continued)
2. Government-wide Financial Statements Government-wide financial statements consist of the Statement of Net Position and the Statement of Activities. These statements report information on all of the non-fiduciary activities of the primary government and its component units. Governmental activities are supported by taxes and intergovernmental revenues. They are reported separately from business-type activities, which rely, to a significant extent, on fees and charges for support.
The government-wide financial statements are reported using the economic resources measurement focus and the accrual basis of accounting, as are the proprietary fund financial statements. Revenues are recorded when earned, and expenses are recorded at the time liabilities and deferred inflows are incurred, regardless of the timing of cash flows. Property taxes are recognized as revenues in the year for which they are levied. Grants and similar items are recognized as revenue as soon as all eligibility requirements imposed by the provider have been met.
The Statement of Activities demonstrates the degree to which the direct expenses of the County’s programs are offset by those programs’ revenues. Program revenues include 1) charges to customers or applicants who purchase, use, or directly benefit from goods, services, or privileges provided by the function or program and 2) grants and contributions that are restricted to meeting the operational or capital requirements of a particular program or function. Program revenues for governmental activities include those generated from general government, judicial, public safety, education and recreation, public works, and health and public welfare. Taxes and other items not properly included among program revenues are reported instead as general revenues.
For proprietary funds, all revenues and expenses are classified as operating revenues and expenses except for taxes, investment income, interest expense, grant payments which are classified as nonoperating revenues and expenses.
The effects of interfund direct activity for changes based on actual use are not eliminated whereas indirect expense allocations are reversed and have been eliminated for the government-wide financial statements.
3. Fund Level Financial Statements
All governmental funds use the current financial resources measurement focus and the modified accrual basis of accounting. Under the modified accrual basis of accounting, revenues are recognized when susceptible to accrual (i.e., when they become both measurable and available). "Measurable" means the amount of the transaction can be determined and "available" means collectible within the current period, or soon enough thereafter, to be used to pay liabilities of the current period. The County considers revenues as available if they are collected within 60 days after year end. Expenditures are recorded when the related fund liability is incurred. Debt service expenditures, as well as expenditures related to compensated absences and claims and judgments, are recorded only when payment is due. Property tax revenues, the County's primary revenue source, is susceptible to accrual and is considered available to the extent of delinquent taxes collected within 60 days of the fiscal year end. Grant and entitlement revenues are also susceptible to accrual. Encumbrances are used during the year, and any unliquidated items are reported at year end as a reservation of fund balance. Governmental funds are accounted for on a spending "financial flow" measurement focus. This means that only current assets and deferred outflows, and current liabilities and deferred inflows are generally included on their balance sheets. Their reported fund balance (net current assets) is considered a measure of "available spendable resources." Governmental fund operating statements present increases (revenues and other financing sources) and decreases (expenditures and other financing uses) in net current assets. Accordingly, they are said to present a summary of sources and uses of "available spendable resources" during a period. All proprietary funds, including the enterprise funds and internal service funds are accounted for using the economic resources measurement focus and accrual basis of accounting. Revenues are recognized when earned and expenses when they are incurred. Claims incurred but not reported are included in payables and expenses. This means that all assets and deferred outflows and liabilities and deferred inflows (whether current or non-current) associated with their activity are included in the funds’ statement of net position. The agency funds are also reported using the accrual basis of accounting. The agency funds are custodial in nature and involve no measurement of results of operations.
The County's accounts are organized based on funds, each of which is considered to be a separate accounting entity. The operations of each fund are accounted for by providing a separate set of self-balancing accounts, which are comprised of each fund's assets and deferred outflows, liabilities and deferred inflows, net position/fund balance, revenues and expenditures or expenses. Separate financial statements are provided for governmental funds, proprietary funds and fiduciary funds. The County reports various Agency Funds which are

Bexar County, Texas NOTES TO BASIC FINANCIAL STATEMENTS
September 30, 2018
51
NOTE A - SUMMARY OF SIGNIFICANT ACCOUNTING POLICIES (Continued)
3. Fund Level Financial Statements (Continued)
fiduciary in nature, accordingly the fiduciary funds are excluded from the government-wide financial statements. The County reports the following major funds:
GOVERNMENTAL FUNDS
General Fund The General Fund accounts for the resources used to finance the fundamental operations of the County. It is the basic fund of the County and covers all activities for which a special revenue fund has not been established.
Debt Service Fund This fund is used to account for the accumulation of resources for and the payment of principal and interest on long-term debt of governmental funds.
Capital Projects Fund This fund is used to account for financial resources to be used for the acquisition and construction of major capital facilities and is principally financed by the sale of bonds or certificates of obligation, certain vehicle registration fees, and capital grants.
PROPRIETARY FUNDS
Community Venue Fund The Community Venue Fund is used to account for the development, financing, construction, leasing, management, operations and marketing of a multi-purpose arena and its related infrastructure. Additionally, the taxpayers of Bexar County approved an expanded use of the Venue tax in May 2008. As a result, numerous sports and tourist related facilities have been constructed and/or improved throughout the County. See Note F for County expenses on assets owned by other entities. The tax revenues and construction costs are recorded in the Community Venue Fund.
Proprietary funds distinguish operating revenues and expenses from nonoperating items. Operating revenues and expenses are the result of providing services in connection with a proprietary fund’s principal ongoing operations. The principal operating expenses for the enterprise funds include administrative expenses and depreciation on capital assets. All revenues and expenses not meeting this definition are reported as nonoperating revenue and expenses.
Nonmajor enterprise funds consist of the Sheriff’s Commissary Fund, the Parking Facilities Fund, and the Firing Range Fund. The Sheriff’s Commissary Fund is used to account for commissary sales to inmates housed in the Bexar County Jail. The Parking Facilities Fund is used to account for the operation and maintenance of the parking facilities. The Firing Range Fund is used to account for the operation and maintenance of the firing range. The parking facilities and firing range are intended to be financed primarily through user charges.
Additionally, the County uses internal service funds to account for County vehicle maintenance, self-insurance (medical benefits, workers’ compensation, and property and liability insurance coverage), other post-employment benefits, and the expenses of a records management center facility. The principal operating revenue of the County’s internal service funds are from user fees assessed to participants or service fees charged to other funds.
The principal operating expenses for the internal service funds include administrative, claims, insurance, and personnel expenses. A complete description of the County’s internal service funds can be found on page 181.
The County also uses various revenue funds to account for the proceeds of specific revenue sources for specified purposes.
AGENCY FUNDS
Agency funds are used to account for assets held by the County as an agent for individuals, private organizations, other governments and other funds. A complete description of the County’s agency funds can be found on page 187.

Bexar County, Texas NOTES TO BASIC FINANCIAL STATEMENTS
September 30, 2018
52
NOTE A - SUMMARY OF SIGNIFICANT ACCOUNTING POLICIES (Continued)
4. Budget
Primary Government
Annual budgets are legally approved and adopted for the general fund, special revenue funds, and debt service fund. Annual budgets are adopted for the special revenue and grant funds at the aggregate level by function. Budgets for grants are employed as a management control device in order to comply with grant provisions. All appropriations expire at the end of the fiscal year except for grant and capital project funds, many of which are funded for periods longer than one year.
Formal budgetary integration is employed for the general fund, special revenue funds, and the debt service fund. Capital project programs with the capital project fund are project oriented rather than by period. Therefore, project-length budgets are adopted based on resource allocation, and appropriations at year-end are carried forward to subsequent periods until the project is completed. Formal budget integration is employed by the County with regards to the internal service funds. All budgets are prepared on the modified accrual basis.
Commissioners Court historically adopts an annual budget and appropriates a portion of the available unassigned fund balance to provide resources for those issues that arise during the fiscal year that could not be anticipated at the time the budget was adopted. An expenditure line item is created to serve as a contingency to draw from as needed. At year end, the County closes the unused portion of the revenue and expenditure line items to budgetary fund balance.
The Bexar County Housing Finance Corporation, the Bexar County Health Facilities Development Corporation, and the Bexar County Industrial Development Corporation funds do not have legally adopted budgets.
5. Proprietary Fund Accounting
Primary Government
The County has implemented GASB Statement No. 62, Codification of Accounting and Financial Reporting Guidance Contained in Pre-November 30,1989 FASB and AICPA Pronouncements.
The remainder of this page intentionally left blank
Bexar County, Texas NOTES TO BASIC FINANCIAL STATEMENTS
September 30, 2018
53
NOTE A - SUMMARY OF SIGNIFICANT ACCOUNTING POLICIES (Continued)
6. Recent Accounting Pronouncements Primary Government The GASB has issued Statement No. 75, “Accounting and Financial Reporting for Postemployment Benefits Other Than Pensions.” This Statement was issued to improve accounting and financial reporting by state and local governments for postemployment benefits other than pensions (other postemployment benefits or OPEB). It also improves information provided by state and local governmental employers about financial support for OPEB that is provided by other entities. This Statement is effective for fiscal years beginning after June 15, 2017. The implementation of GASB 75 is reflected in the financial statements.
The GASB has issued Statement No. 83, “Certain Asset Retirement Obligations.” This statement was issued to address accounting and financial reporting for certain asset retirement obligations (AROs). An ARO is a legally enforceable liability associated with the retirement of a tangible capital asset. A government that has legal obligations to perform future asset retirement activities related to its tangible capital assets should recognize a liability based on the guidance in this Statement. The requirements of this Statement are effective for reporting periods beginning after June 15, 2018. GASB 83 will be implemented by the County in fiscal year 2019 and the impact has not yet been determined.
The GASB has issued Statement No. 84, “Fiduciary Activities.” The objective of this Statement is to improve guidance regarding the identification of fiduciary activities for accounting and financial reporting purposes and how those activities should be reported. This Statement establishes criteria for identifying fiduciary activities of all state and local governments. The requirements of this Statement are effective for reporting periods beginning after December 15, 2018. GASB 84 will be implemented by the County in fiscal year 2020 and the impact has not yet been determined.
The GASB has issued Statement No. 85, “Omnibus 2017”. The objective of this Statement is to address practice issues that have been identified during implementation and application of certain GASB Statements. This Statement address a variety of topics including issues related to blending component units, goodwill, fair value measurement and application, and postemployment benefits. The requirements of this Statement are effective for reporting periods beginning after June 15, 2017. The implementation of GASB 85 is reflected in the financial statements.
The GASB has issued Statement No. 86, “Certain Debt Extinguishment Issues.” The objective of this Statement is to improve consistency in accounting and financial reporting for in-substance defeasance of debt by providing guidance for transactions in which cash and other monetary assets acquired with only existing resources are placed in an irrevocable trust for the sole purpose of extinguishing debt. The requirements of this Statement are effective for reporting periods beginning after June 15, 2017. The implementation of GASB 86 is reflected in the financial statements.
The GASB has issued Statement No. 87, “Leases.” The objective of this Statement is to better meet the information needs of financial statement users by improving accounting and financial reporting for leases by governments. This Statement increases the usefulness of governments’ financial statements by requiring recognition of certain lease assets and liabilities for leases that previously were classified as operating leases and recognized as inflows of resources or outflows of resources based on the payment provision of the contract. The requirements of this Statement are effective for reporting periods beginning after December 15, 2019. GASB 87 will be implemented by the County in fiscal year 2021 and the impact has not yet been determined.
The GASB has issued Statement No. 88, “Certain Disclosures Related to Debt, including Direct Borrowings and Direct Placements.” The objective of this Statement is to improve the information that is disclosed in notes to government financial statements related to debt, including direct borrowings and direct placements. It also clarifies which liabilities governments should include when disclosing information related to debt. The requirements of this Statement are effective for reporting periods beginning after June 15, 2018. GASB 89 will be implemented by the County in fiscal year 2019 and the impact has not yet been determined.

Bexar County, Texas NOTES TO BASIC FINANCIAL STATEMENTS
September 30, 2018
54
NOTE A - SUMMARY OF SIGNIFICANT ACCOUNTING POLICIES (Continued)
6. Recent Accounting Pronouncements (Continued) Primary Government (Continued) The GASB has issued Statement No. 89, “Accounting for Interest Cost Incurred before the End of a Construction Period.” The objectives of this Statement are (1) to enhance the relevance and comparability of information about capital assets and the cost of borrowing for a reporting period and (2) to simplify accounting for interest cost incurred before the end of a construction period. This Statement also reiterates that in financial statements prepared using the current financial resources measurement focus, interest cost incurred before the end of a construction period should be recognized as an expenditure on a basis consistent with governmental fund accounting principles. The requirements of this Statement are effective for reporting periods beginning after December 15, 2019. GASB 89 will be implemented by the County in fiscal year 2021 and the impact has not yet been determined.
The GASB has issued Statement No. 90, “Majority Equity Interests.” The objectives of this Statement are to improve the consistency and comparability of reporting a government’s majority equity interest in a legally separate organization and to improve the relevance of financial statement information for certain component units. It defines a majority equity interest and specifies that a majority equity interest in a legally separate organization should be reported as an investment if a government’s holding of the equity interest meets the definition of an investment. The requirements of this Statement are effective for reporting periods beginning after December 15, 2018. GASB 90 will be implemented by the County in fiscal year 2020 and the impact has not yet been determined.
7. Cash, Cash Equivalents and Temporary Investments Primary Government For purposes of the Statement of Cash Flows, cash and cash equivalents include amounts in demand deposits as well as short-term investments with a maturity date within three months of the date acquired by the County. Temporary investments consist of a money market fund and funds invested in local government investment pools, which is permitted under the Public Funds Investment Act. Investments in local government investment pools are stated at net asset value or amortized cost which approximates fair value, as permitted under GASB Statement No. 31, Accounting and Financial Reporting for Certain Investments and for External Investment Pools, or are stated at Net Asset Value (NAV), in accordance with the Fair Value Measurement guidelines established by GASB Statements No. 72 and 79.

Bexar County, Texas NOTES TO BASIC FINANCIAL STATEMENTS
September 30, 2018
55
NOTE A - SUMMARY OF SIGNIFICANT ACCOUNTING POLICIES (Continued) 8. Inventories and Prepaid Items Primary Government The County accounts for inventories using the consumption method. The cost of inventories for internal service funds are determined by the average cost method. Any payments to vendors applicable to future accounting periods would be recorded as prepaid items in both government-wide and fund financial statements. 9. Restricted Assets and Liabilities Primary Government Certain proceeds of the revenue bonds issued for the County’s Community Venue Fund, as well as certain resources set aside for their repayment, are classified as restricted assets on the Statement of Net Position because they are maintained in separate bank accounts and their use is restricted by applicable bond covenants. The “tax-exempt debt service” and the “taxable debt service” accounts are used to segregate resources for the respective principal and interest amounts currently outstanding. The “tax-exempt reserve” account and the “taxable reserve” accounts are used to set aside resources to subsidize potential deficiencies in the debt service accounts. The construction accounts are used to report those proceeds of revenue bonds that are restricted for the four voter-approved propositions. The County’s policy is to apply restricted resources first if both restricted and unrestricted resources are available for the same activity. 10. Capital Assets Primary Government Capital assets include land, land improvements, right-of-way land, infrastructure, buildings, building improvements, site improvements, leasehold improvements, vehicles, machinery, furniture, equipment, other systems, animals, works of art and historical treasures that are used in operations and benefit more than a single fiscal period. Infrastructure assets, such as roads, bridges, and drainage systems, are long-lived assets that normally are stationary in nature and typically can be preserved for a significantly greater number of years than most capital assets. Capital assets are defined by the County as equipment with an initial, individual cost of more than $5,000 and an estimated useful life in excess of one year. Building improvements and infrastructure projects with an estimated cost to exceed $100,000 are capitalized. When capital assets are purchased, they are capitalized and depreciated in the government-wide financial statements and the proprietary fund statements. Capital assets are recorded as expenditures of the current period in the governmental fund financial statements. When historical records are available, capital assets are valued at cost. When no historical records are available, the County estimates the cost by applying back-trended inflation rates to a similar asset. Donated capital assets; donated works of art, historical treasures, and similar assets; and capital assets received in a service concession arrangements, if any; are valued at acquisition value as defined by GASB 72. Improvements to capital assets that materially extend the life of the asset or add to the value are capitalized. Other repairs and normal maintenance are not capitalized. Major outlays for capital assets and improvements are capitalized as projects are constructed. Interest incurred during construction is not capitalized in the governmental activities on the government-wide financial statements; however, capitalization of interest is required for business-type activities. Capital assets are depreciated over the useful lives of the assets or classes of assets on a straight-line basis as follows: Building and improvements 20 - 40 years Machinery and equipment 3 – 10 years Infrastructure 20 – 35 years

Bexar County, Texas NOTES TO BASIC FINANCIAL STATEMENTS
September 30, 2018
56
NOTE A - SUMMARY OF SIGNIFICANT ACCOUNTING POLICIES (Continued) The System The System’s capital assets are recorded at cost at the date of acquisition, or fair value at the date of donation if acquired by gift. Depreciation is computed using the straight-line method over the estimated useful life of each asset. Assets under capital lease obligations and leasehold improvements are depreciated over the shorter of the lease term or their respective estimated useful lives. The following estimated useful lives are being used by the System: Land Improvements 5 - 15 years Building and improvements 10 -30 years Equipment 5 - 15 years The District Capital assets, which include construction in progress and public improvements, are reported in the governmental activities column in the District’s government-wide financial statements. All costs associated with public improvement projects are capitalized. Such assets are recorded at historical cost or estimated historical cost if purchased or constructed. The costs of normal maintenance and repairs that do not add value to the asset or materially extend asset lives are not capitalized. Major outlays for capital assets and improvement are capitalized as projects are constructed. Public improvements are depreciated using the straight line method over an estimated useful life of 29 years. The Authority The Authority’s capital assets are stated at historical cost. Donated capital assets are valued at their estimated fair market value on the date received. For equipment, the Authority’s capitalization policy includes all items with a unit cost of $20,000 or more and an estimated useful life in excess of one year. Development in progress includes personnel cost that are directly attributable to a specific project in development. Depreciation is computed using the straight-line method over the estimated useful lives of the assets. Currently, the Authority has no assets other than the cost associated with projects in development. Expenditures for Assets Owned by Other Entities – The Authority has entered into or intends to enter into several inter-local agreements with various entities for the construction of infrastructure projects. The Authority will expend vehicle registration fee revenues and debt resources to complete the projects; however, once projects are substantially complete, ownership and maintenance requirements will be the responsibility of the other entities. These arrangements over time, will result in lowered total net position on the statement of net position because the Authority will not own the capital assets related to the debt the Authority incurred to purchase and/or fund the assets. Thus, the accumulated development in progress costs, which relate to assets that are ultimately going to be conveyed to other entities in accordance with the interlocal agreements, as well as the related debt (Series 2016 Revenue Bonds), are not part of the calculation of the amount reported as net investment in capital assets in the statement of net position. 11. Compensated Absences Primary Government The County allows employees to accumulate compensatory time, vacation, and sick leave with certain limitations. At September 30, 2018, the accumulated compensated absences amount to $45,686,841. For governmental funds, accrued compensated absences are recorded as expenditures in the respective funds to the extent it has matured. The majority of these have typically been liquidated from the general fund in previous years. A liability for these amounts is reported in governmental funds in the event of termination. Accumulated leave is reported in the government-wide Statement of Net Position as both a current and noncurrent liability.

Bexar County, Texas NOTES TO BASIC FINANCIAL STATEMENTS
September 30, 2018
57
12. Property Taxes
Primary Government Property taxes for the County and Flood Control are levied each October 1 on the taxable value as of the preceding January 1, the date a lien attaches, for all taxable real and personal property located in the County. Taxes are due by January 31 following the October 1 assessment date and become delinquent on February 1, at which time they begin accruing penalty and interest. The enforceable legal claim date for property taxes is the assessment date; therefore, the County did not record a receivable for accrual of future taxes at year end. Accordingly, no current taxes receivable are reported. On July 1, unpaid taxes are subject to additional penalties for collection expenses. Appraised values are determined by the Bexar County Appraisal District and are equal to 100% of the appraised market value as required by the State Property Tax Code. Taxes have been reported in the financial statements net of the allowance for uncollectible taxes. Tax revenues are recognized as they become available. Accordingly, an amount equal to taxes not yet available (not collectible within 60 days after year end) has been reported as deferred inflows of resources – unavailable revenue at the governmental fund level. The System The Commissioners Court of Bexar County levies for the System a tax as provided under state law on properties within the County. These taxes are collected by the Bexar County Tax Assessor-Collector and are remitted to the System when received. The System’s tax rate is levied and becomes collectible in October of each year based on the certified assessed value as of the previous January 1. Taxes levied on October 1 are designated to support the System’s operations for the following calendar year. The System records the levy, net of an assessment fee and allowance for uncollectible amounts, as a current receivable and deferred tax revenue in the year levied. The District Property taxes are levied by October 1 on the assessed value listed as of the prior January 1 for all real and business personal property located in the District in conformity with Subtitle E, Texas Property Code. Taxes are due upon receipt of the tax bill and are delinquent if not paid before February 1 of the year following the year in which imposed. On January 31 of each year, a tax lien attaches to property to secure payment of all taxes, penalties, and interest ultimately imposed. Property tax revenues are considered available when they become due or past due and receivable within the current period. The adjusted assessed value of the property tax roll upon which the levy for the 2017 fiscal year was based was $838,156,488. The remainder of this page intentionally left blank

Bexar County, Texas NOTES TO BASIC FINANCIAL STATEMENTS
September 30, 2018
58
NOTE A - SUMMARY OF SIGNIFICANT ACCOUNTING POLICIES (Continued)
13. Deferred Outflows/Inflows of Resources The deferred outflows of resources related to pension expense include: differences between expected and actual experience with regard to economic or demographic factors (differences between expected and actual experience) in the measurement of total pension liability; differences between projected and actual earnings on pension plan investments; and contributions to the pension plan from the employer subsequent to the measurement date of the net pension liability and before the end of the reporting period. The differences between expected and actual experience are recognized in pension expense, beginning in the current reporting period, using a systematic and rational method over a closed period equal to the average of the expected remaining service lives of all employees that are provided with pensions through the pension plan (active and inactive employees) determined as of the beginning of the measurement period. The portion not recognized in pension expense is reported as deferred outflows of resources. The differences between projected and actual earnings on pension plan investments are recognized in pension expense using a systematic and rational method over a closed five-year period, beginning in the current reporting period. The amount not recognized in pension expense is reported as deferred outflows of resources. The deferred outflows of resources related to OPEB expense are contributions to the OPEB plan from the employer subsequent to the measurement date of the net OPEB liability and before the end of the reporting period. NOTE B – CASH, CASH EQUIVALENTS, AND INVESTMENTS Primary Government As of September 30, 2018, the carrying amount of the County’s cash and cash equivalents is: Cash in Bank 18,325,053$ Money Market 41,708,111 TexPool 31,523,455 TexStar 30,026,853
Total 121,583,472$
Custodial Credit Risk-Deposits: Custodial credit risk is the risk that in the event of a bank failure, the government’s deposits may not be returned. It is the County’s policy to collateralize deposits at 110% of the deposit amount. As of September 30, 2018, the County’s bank balances of $21,058,532 were fully collateralized by federal depository insurance and/or collateral held by the County or its agent in the name of the County. The County’s cash balances in the bank that are above certain limits are invested overnight in money market fund sweep accounts. These money market funds meet the requirements of the Public Funds Investment Act since they only invest in U.S. Treasury bills, notes and other obligations issued or guaranteed as to the principal and interest by the U.S. Government, its agencies or instrumentalities, and repurchase agreements secured by such obligations or cash. The County has deposits in two different local government investment pools, TexPool and TexStar. TexPool is a public funds investment pool created by the Treasurer of the State of Texas acting by and through the Texas Treasury Safekeeping Trust Company. It is empowered to invest funds and act as a custodian of investments purchased with local investment funds. TexStar has the same authority as TexPool. It was organized and established pursuant to an Interlocal Agreement between participating government entities. The County has an undivided beneficial interest in the pool of assets held by TexStar. These assets include obligations guaranteed or insured by the United States Government or its agencies, collateralized repurchase agreements and reverse repurchase agreements and no-load money market funds which meet the requirements of the Public Funds Investment Act.

Bexar County, Texas NOTES TO BASIC FINANCIAL STATEMENTS
September 30, 2018
59
NOTE C –INVESTMENTS Primary Government The County’s investment policy provides that funds may be invested in: • Obligations of the United States, its agencies and instrumentalities. • Direct obligations of the State of Texas or its agencies. • Other obligations insured by the State of Texas or the United States or their respective agencies and instrumentalities. • Obligations of other governmental units with at least an “A” rating. • Bank certificates of deposits that are guaranteed or insured. • Guaranteed investment contracts as authorized by the Public Funds Investment Act. • Commercial paper as authorized by the Public Funds Investment Act. • Securities lending program as authorized by the Public Funds Investment Act. • Fully collateralized repurchase agreements as authorized by the Public Funds Investment Act. • SEC registered, no-load money market mutual funds as authorized by the Public Funds Investment Act. • Public funds investment pools as authorized by the Public Funds Investment Act. Fair Value of Investments: The County measures and records its investments using fair value measurement guidelines established by generally accepted accounting principles. GASB Statement 79 created an election option for external investment pools and pool participants to continue to utilize amortized cost accounting, rather than fair value, for certain investment pools and eliminated the reference to SEC 2A-7 guidance. Participants in qualifying pools would be permitted to continue measuring investments at amortized cost if they met certain criteria. The County's investment pools (TexPool and TexStar) are both in compliance with GASB Statement 79. The County's investment pool TexStar has elected to continue to measure its investments at fair value even though TexStar meets all criteria under GASB Statement 79 to report at amortized cost. The County's investment pool TexPool has elected to continue reporting assets at amortized cost. The County has mirrored these valuations. The County is required to disclose the fair value level of its investments within the fair value hierarchy established by GASB Statement 72. In the fair value hierarchy there are three levels:
• Level 1: Quoted prices for identical investments in active markets; • Level 2: Observable inputs other than quoted market prices; and, • Level 3: Unobservable inputs.
The remainder of this page intentionally left blank

Bexar County, Texas NOTES TO BASIC FINANCIAL STATEMENTS
September 30, 2018
60
NOTE C –INVESTMENTS (Continued) Primary Government (Continued) As of September 30, 2018, the County had the following recurring fair value measurements:
September 30, 2018 Level 1 Level 2 Level 3InvestmentsFHLB 97,119,702$ -$ 97,119,702$ -$ FHLMC 112,140,983 - 112,140,983 - FNMA 31,306,939 - 31,306,939 - FFCB 19,428,552 - 19,428,552 - Corporate Commercial Paper 169,012,719 - 169,012,719 - Local Government Commercial Paper 3,522,639 - 3,522,639 - US Treasury 144,712,856 - 144,712,856 - Municipal Bonds 124,195,547 - 124,195,547 -
Total investments 701,439,937 - 701,439,937 -
Investment poolsTexStar (net asset value) 30,026,853 N/A N/A N/ATexPool (valued at amoritized cost) 31,523,455 N/A N/A N/A
Total investment pools by fair value 61,550,308
Money MarketsMoney Market Funds (valued at amortized cost) 41,708,111 N/A N/A N/A
Total Money Market Funds by fair value 41,708,111
Total investments, pools and money markets 804,698,356$ 701,439,937$
Fair Value Measurements Using
All of the County's investments, other than investments in the local government investment pools and money market funds, are classified in Level 2 and are valued using proprietary valuation models which may consider market transactions in comparable securities and the various relationships between securities in determining value and/or market characteristics such as benchmark yield curves, option adjusted spreads, credit spreads, estimated default rates, coupon-rates, anticipated timing of principal repayments, underlying collateral, and other unique security features in order to estimate the relevant cash flows, which are then discounted to calculate the fair values. The County invests in the TexStar investment pool which maintains a stable net asset value (NAV) of $1 per share using the fair value method. The County has no unfunded commitments to this pool and may redeem investments at any time. As of September 30, 2018, the County's investments all were classified as Level 2 according to GASB Statement 72, except for the pools which are exempt from the level of fair value disclosure because they are valued either at NAV or amortized cost.

Bexar County, Texas NOTES TO BASIC FINANCIAL STATEMENTS
September 30, 2018
61
NOTE C –INVESTMENTS (Continued) Primary Government (Continued) As of September 30, 2018, the County’s investments had the following maturities:
Interest Rate Risk: In accordance with its investment policy, the County manages its exposure to declines in fair value by limiting the weighted average maturity of its investments to 365 days with a maximum investment length for any investment to not exceed more than 3 years. In addition, the timing of maturities is monitored to match anticipated cash flow requirements, thereby avoiding the need to sell securities on the open market prior to maturity at a lowered rate of return. Credit Risk: In accordance with its investment policies, the County limits its investments to the most conservative forms of investments. Investments in agency securities are limited to investments rated not less than A or its equivalent, and investments in investment pools are limited to AAA or AAA-m by a nationally recognized investment rating firm. All investments that are obligations explicitly guaranteed by the U.S. government are not considered to have credit risk. TexPool and TexStar are rated AAAm; the Amegy Bank of Texas Money Market Fund is rated AAAm; and Bank of America Money Market Fund is rated AAA.
Weighted PercentageFair Average Maturity of Total
Investment Type Value (Years) Fair Value
Federal Home Loan Bank Note (FHLB) 97,119,702$ 0.4613 12.07%Freddie Mac (FHLMC) 112,140,983 1.0417 13.94%Federal National Mortgage Association Note (FNMA) 31,306,939 0.9830 3.89%Federal Farm Credit Bank (FFCB) 19,428,552 0.9486 2.41%Corporate Commercial Paper 169,012,719 0.2415 21.00%US Treasury 144,712,856 0.3609 17.98%Money Market Fund 41,708,111 N/A 5.18%Municipal Bonds 124,195,547 0.5181 15.43%Local Government Commerical Paper 3,522,639 0.0005 0.44%Investment Pools 61,550,308 N/A 7.65%Total fair value 804,698,356$ 100.00%Portfolio weighted average maturity 0.4576
The weighted average maturity (WAM) expresses investment time horizons - the time when investments become due and payable weighted to reflect the dollar size of individual investments within an investment type. WAMs are computed for each investment type. The portfolio's WAM is derived by dollar-weighting the WAM for each investment type.

Bexar County, Texas NOTES TO BASIC FINANCIAL STATEMENTS
September 30, 2018
62
NOTE C – INVESTMENTS (Continued) Primary Government (Continued) As of September 30, 2018, the County’s investments had the following Investment Ratings:
Standard & Poor's Moody's Investment Rating Rating
Federal Home Loan Bank Note (FHLB) AA+ AaaFreddie Mac (FHLMC) AA+ AaaFederal National Mortgage Association Note (FNMA) AA+ AaaFederal Farm Credit Bank (FFCB) AA+ AaaCorporate Commercial Paper (TOYOTA MOTOR CORP) A-1+ P-1Corporate Commercial Paper (JP MORGAN) A-1 P-1Local Government Commericial Paper (ST OF TX REV ANTIC NOTES) AAA AaaUS Treasury AA+ Aaa
Municipal Bonds:City of Austin A-1 P-1Harvard University A-1+ P-1Northwestern University A-1+ P-1Texas A&M University AAA AaaUniversity of Texas Permanent Fund A-1+ P-1University of Texas System A-1+ P-1Yale University A-1+ P-1 Concentration of Credit Risk: Concentration of credit risk is the risk of loss attributed to the magnitude of a government’s investment in a single issuer. The County mitigates these risks by emphasizing the importance of a diversified portfolio. All funds must be sufficiently diversified to eliminate the risk of loss resulting from over-concentration of assets in a specific maturity, a specific issuer, or a specific class of securities. The following investments comprise more than 5% of the fair value of the County’s total portfolio that includes County and Community Venue investment types: Investment Pools (7.65%), Municipal Bonds (15.44%), Money Market Fund (5.18%), FHLB (12.07%), FHLMC (13.94%), Corporate Commercial Paper (21.00%) and US Treasury (17.99%). Custodial Credit Risk – Investment: The custodial credit risk for investments is the risk that, in the event of the failure of the counterparty to a transaction, the County will not be able to recover the value of its investments or collateral securities that are in the possession of another party. The County mitigates these risks since all investments owned by the County are held in the County’s name.

Bexar County, Texas NOTES TO BASIC FINANCIAL STATEMENTS
September 30, 2018
63
NOTE D – TAXES AND OTHER RECEIVABLES The following is a summary of the gross current and delinquent taxes receivable and the allowance for uncollectible taxes:
Allowance forUncollectible Net
Taxes Taxes TaxesPrimary GovernmentDelinquent taxes
General Fund 12,559,213$ 2,729,000$ 9,830,213$ Debt Service Fund 2,735,333 594,000 2,141,333 Capital Project Fund 546,236 118,000 428,236
Total Primary Government 15,840,782$ 3,441,000$ 12,399,782$
Other receivables as of year-end for the County’s General Fund, Capital Project Funds, and Nonmajor Funds in the aggregate, including the applicable allowances for uncollectible accounts, are as follows:
Nonmajor Capital Governmental
General Debt Service Project Funds Funds TotalCourt Fines and Fees 86,917,218$ - -$ -$ 86,917,218$ Accounts Receivable 4,427,660 - 1,737,752 58,790 6,224,202
Gross Receivables 91,344,878 - 1,737,752 58,790 93,141,420 Less: Allowance (74,486,024) - - - (74,486,024)
Net total receivables 16,858,854 - 1,737,752 58,790 18,655,396
Due from Other Governmental Unit 5,780,070 1,704,951 10,547,584 7,882,134 25,914,739 Total Accounts and Other 22,638,924$ 1,704,951$ 12,285,336$ 7,940,924$ 44,570,135$
Allowance forUncollectible Net
Taxes Taxes Taxes
The SystemCurrent taxes 208,047,124$ 4,334,985$ 203,712,139$ Delinquent taxes 15,084,583 6,020,697 9,063,886 Penalties and interest 8,959,335 5,958,185 3,001,150 Total System 232,091,042$ 16,313,867$ 215,777,175$

Bexar County, Texas NOTES TO BASIC FINANCIAL STATEMENTS
September 30, 2018
64
NOTE E – INTERFUND BALANCES AND TRANSFERS In the fund financial statements, interfund balances are the result of normal transactions between funds and will be liquidated in the subsequent fiscal year. The following is a summary of amounts due from and due to other funds: Receivable Fund Payable Fund Amount
General Nonmajor governmental fund 19,166$ Total 19,166$
The outstanding balances between funds result mainly from the time lag between the dates (1) interfund goods and services are provided or reimbursable expenditures occur, (2) transactions are recorded in the accounting systems, and (3) payments between funds are made. Balances between governmental funds and internal service funds, if any, are eliminated in the government-wide financial statements. Balances between governmental funds and enterprise funds, if any, are not eliminated in the government-wide financial statements.
Advances From / To Other Fund
Receivable Fund Payable Fund Amount
General Capital Project 4,330,184$ Nonmajor Governmental Fund 400,000 Fleet Maintenance * 110,000
Total 4,840,184$
* Internal Service Funds The amounts payable to the General Fund relate to working capital loans made to other funds that incur expenses before related revenues are received. They are not scheduled to be collected in the subsequent year.

Bexar County, Texas NOTES TO BASIC FINANCIAL STATEMENTS
September 30, 2018
65
NOTE E – INTERFUND BALANCES AND TRANSFERS (Continued) The following is a summary of the County’s transfers for the year ended September 30, 2018:
Debt Capital Nonmajor InternalGeneral Service Projects Governmental Enterprise Service Total
TRANSFERS OUTGeneral -$ 1,324,765$ -$ 3,001,909$ 158,610$ 7,370,597$ 11,855,881$ Capital Projects 180,000 15,130,400 - - - - 15,310,400 Nonmajor Governmental 125,043 231,666 260,380 6,895 - 100,000 723,984 Enterprise - 450,000 - - - - 450,000
Total Transfers 305,043$ 17,136,831$ 260,380$ 3,008,804$ 158,610$ 7,470,597$ 28,340,265$
The transfer of $180,000 from the Capital Projects Fund to the General Fund is to fund the budget shortfall of the San Antonio Symphony. The transfer of $125,043 from the Nonmajor Governmental Fund to the General Fund is for the build out costs associated with the new office space for the Family Justice Center in the Federal Reserve Building. The transfer of $1,324,765 from the General Fund to the Debt Service Fund is to pay debt service on bonds issued for roads. The transfer out of the Capital Projects Funds of $15,130,400 is for payment of County debt service related to pass-through financing funded by Advanced Transportation District revenues. The transfer of $231,666 from the Nonmajor Governmental Fund to the Debt Service Fund is to pay debt service on bonds issued to pay for a new Fire Marshal’s office building. The transfer of $450,000 from the Enterprise Fund to the Debt Service Fund is to pay a portion of the principal and interest due semi-annually on the outstanding bonds issued for the construction of the Bexar County parking garages. The transfer of $260,380 from the Nonmajor Governmental Fund to the Capital Project Fund is for the FY2017-18 replacements of County-owned vehicles. The transfer of $3,001,909 from the General Fund to Nonmajor Governmental Funds include $334,036 to the Courthouse Security Fund for salary expenses related to the Sheriff’s deputies stationed in the courthouse, $330,745 to the Law Library Fund to offset costs due to declining revenues within the fund, the transfer of $2,019,472 for the replacement of computers and laptops used by County employees, the transfer of $158,445 is a grant cash match for the Texas Indigent Defense Commission grant, and the remaining transfer of $159,211 is to sustain the expenses between funds. The transfer of $6,895 between the Nonmajor Governmental Funds is the result of normal transactions between funds. The transfer of $158,610 from the General Fund to the Enterprise Fund is to sustain the expenses of the Firing Range Fund, since fees have not been approved for the use of this facility to date. The transfer of $7,370,597 from the General Fund to Internal Services Funds was to offset an estimated shortfall for the year-ended September 30, 2018. The transfer of $100,000 between Nonmajor Governmental Fund and Internal Services Fund is to provide space to County Offices and Departments for the storage of records in accordance with the Local Government Records Act of 1989. NOTE F – COUNTY EXPENDITURES FOR ASSETS OWNED BY OTHER ENTITIES Bexar County has entered into or intends to enter into several inter-local agreements with various entities for the construction of infrastructure and facilities. The County will expend tax revenues and debt resources to complete the projects; however, once projects are substantially complete, ownership and maintenance requirements will be the responsibility of the other entities. These arrangements over time, will result in lowered total net position on the Statement of Net Position because the County will not own the capital assets related to the debt the County incurred to purchase and/or fund the assets. See Table 19 in the Statistical section for a detailed listing of the entities involved and the amount of County expenditures to date.

Bexar County, Texas NOTES TO BASIC FINANCIAL STATEMENTS
September 30, 2018
66
NOTE G – CAPITAL ASSETS Primary Government Capital asset activity for governmental activities for the year ended September 30, 2018 was as follows: Capital assets, not being depreciated:Land (row, bldg, parks) 83,192,193$ 3,829,948$ $ - 87,022,141$ Equipment in progress 52,726,955 5,899,108 (822,067) 57,803,996 Construction in progress 275,899,513 94,100,481 (22,493,878) 347,506,116 Total capital assets, not being depreciated 411,818,661 103,829,537 (23,315,945) 492,332,253
Capital assets, being depreciated:Buildings 549,352,463 10,998,879 - 560,351,342 Depreciable Land Assets 1,350,312 3,492,191 - 4,842,503 Machinery and Equipment 113,783,976 6,270,525 (2,570,214) 117,484,287 Infrastructure 1,535,256,141 119,118,044 - 1,654,374,185 Total capital assets being depreciated 2,199,742,892 139,879,639 (2,570,214) 2,337,052,317
Less accumulated depreciation for:Buildings (203,546,875) (19,243,592) - (222,790,467) Depreciable Land Assets (568,730) (127,756) - (696,486) Machinery and Equipment (95,119,825) (7,285,543) 2,570,214 (99,835,154) Infrastructure (633,556,687) (71,880,128) - (705,436,815) Total accumulated depreciation (932,792,117) (98,537,019) 2,570,214 (1,028,758,922)
Total capital assets, being depreciated, net 1,266,950,775 41,342,620 - 1,308,293,395
Governmental activities capital assets, net 1,678,769,436$ 145,172,157$ (23,315,945)$ 1,800,625,648$

Bexar County, Texas NOTES TO BASIC FINANCIAL STATEMENTS
September 30, 2018
67
NOTE G – CAPITAL ASSETS (Continued) Primary Government (Continued) Capital asset activity for business-type activities for the year ended September 30, 2018, was as follows:
Depreciation expense was charged to functions of the primary government and business-type activities as follows:
Business-type activities:
Balance at October 1, 2017 Increases Decreases
Balance at September 30,
2018Capital assets, being depreciated:Buildings and improvements 281,281,306$ $ - $ - 281,281,306$ Reference library 38,960 - - 38,960 Equipment 12,739,925 - - 12,739,925 Total capital assets, being depreciated 294,060,191 - - 294,060,191
Less accumulated depreciation for:Buildings and improvements (65,690,134) (7,064,904) - (72,755,038) Reference library (28,246) (1,948) - (30,194) Equipment (12,523,616) (58,681) - (12,582,297) Total accumulated depreciation (78,241,996) (7,125,533) - (85,367,529)
Business-type activities capital assets, net 215,818,195$ (7,125,533)$ -$ 208,692,662$
Governmental activities:General Government 10,349,687$ Judicial 2,244,262 Public Safety 11,017,899 Education and Recreation 840,983 Public Works 73,887,315 Health and Public Welfare 82,162 Unallocated 114,711
Total depreciation expense - governmental activities 98,537,019$
Business-type activities:Venue Fund 7,064,904$ Sheriff's Commissary Fund 60,629 Total depreciation expense - business-type activities 7,125,533$

Bexar County, Texas NOTES TO BASIC FINANCIAL STATEMENTS
September 30, 2018
68
NOTE G – CAPITAL ASSETS (Continued) Primary Government (Continued) Governmental Activities: Net investment in capital assets on page 31 is computed as follows:
The System The System’s capital asset activity for the year ended December 31, 2017 (in thousands) was as follows:
Balance at Balance at
January 1, Additions/ Retirements/ December 31,2017 Transfers Deletions 2017
Land and land improvements 20,864$ 42$ -$ 20,906$ Buildings and leasehold improvements 1,337,686 30,689 - 1,368,375
Equipment 413,108 45,555 (7,050) 451,613
Construction in progress 29,610 (23,627) - 5,983
Total capital assets 1,801,268$ 52,659$ (7,050)$ 1,846,877$
Less: accumulated depreciation (601,979) (82,526) 6,650 (677,855)
Total capital assets, net 1,199,289$ (29,867)$ (400)$ 1,169,022$
Net investment in capital assets:Fixed Assets, net of depreciation 1,800,625,648$ Total outstanding debt (1,871,352,702)$ Less expenditures for assets owned by other entities 865,232,378 Less unspent debt proceeds 218,146,258 (787,974,066)
Net investment in capital assets 1,012,651,582$

Bexar County, Texas NOTES TO BASIC FINANCIAL STATEMENTS
September 30, 2018
69
NOTE G – CAPITAL ASSETS (Continued) The District The District’s capital asset activity for year ended September 30, 2017 was as follows:
The cost of the District’s public improvements and construction projects includes $21,050,413 of cumulative interest incurred on the amount due to the Developer, of which includes $4,195,576 incurred in the current year.
Balance at Balance atOctober 1, September 30,
2016 Additions Deletions Transfers 2017Capital assets, being depreciated
Public improvementsUtility System Improvements 41,280,567$ 2,391,478$ -$ -$ 43,672,045$ Floodplains and Wetlands 5,211,577 41,956 - - 5,253,533 Roadways 32,686,081 1,762,142 - - 34,448,223
Total capital assets, being depreciated 79,178,225 4,195,576 - - 83,373,801
Less accumulated depreciation for:Public improvements
Utility System Improvements (2,114,135) (1,505,933) - - (3,620,068) Floodplains and Wetlands (335,872) (181,156) - - (517,028) Roadways (1,210,903) (1,187,870) - - (2,398,773)
Total accumulated depreciation (3,660,910) (2,874,959) - - (6,535,869)
Total capital assets, being depreciated, net 75,517,315 1,320,617 - - 76,837,932
Governmental Activities capital assets, net 75,517,315$ 1,320,617$ -$ -$ 76,837,932$

Bexar County, Texas NOTES TO BASIC FINANCIAL STATEMENTS
September 30, 2018
70
NOTE G – CAPITAL ASSETS (Continued) The Authority The Authority’s capital asset activity for year ended September 30, 2018 was as follows:
Balance at Balance atOctober 1, September 30,
2017 Additions Deletions 2018Capital assets, not being depreciated
Development in progress:US 281 North 3,243,821$ -$ -$ 3,243,821$ Loop 1604 EIS 11,722,275 1,061 - 11,723,336 Loop 1604 1,002,074 40,404 - 1,042,478 Blanco Rd Phase II 618,137 829,570 - 1,447,707 Evans Rd Phase I 5,963 36,400 - 42,363 Evans Rd Phase II 687,602 376,331 - 1,063,933 Foster Rd Phase III 578,090 353,408 - 931,498 Talley Road Phase I 36,548 644,428 - 680,976 West Military Drive 13,334 177,848 - 191,182 Fischer Road Phase II 2,453 341,027 - 343,480 Old FM 471/Talley Road 605 689 - 1,294 Candlemeadow - 54,039 - 54,039
Total development in progress 17,910,902 2,855,205 - 20,766,107
Total capital assets not being depreciated 17,910,902 2,855,205 - 20,766,107
Total capital assets 17,910,902$ 2,855,205$ -$ 20,766,107$

Bexar County, Texas NOTES TO BASIC FINANCIAL STATEMENTS
September 30, 2018
71
NOTE H – LONG-TERM DEBT Primary Government Long-term obligations of the County consist of bonds, certificates of obligation, and other liabilities which are payable from the general, debt service and enterprise funds. The changes in the County’s governmental and business-type activities long-term liabilities for fiscal year 2018 were as follows:
Balance Balance Outstanding Issued Retired Outstanding Amount DueOctober 1, During During September 30, Within One
2017 Year Year 2018 YearGovernmental Activities:Refunding Bonds
Limited Tax General Obligation Refunding Bonds, Series 2009Date Issued: May 15, 2009Interest Rate: 2.00 - 3.25Original Amount: $14,890,000Maturing Date: June 15, 2019 $ 580,000 $ - $ 285,000 $ 295,000 295,000$
Limited Tax General Obligation Refunding Bonds, Series 2010
Date Issued: August 18, 2010Interest Rate: 2.00 - 5.00Original Amount: $36,915,000Maturing Date: June 15, 2025 2,375,000 - 2,375,000 - -
Limited Tax General Obligation Refunding Bonds, Series 2011
Date Issued: October 11, 2011Interest Rate: 2.00 - 5.00Original Amount: $17,650,000Maturing Date: June 15, 2023 12,205,000 - 2,230,000 9,975,000 2,345,000
Limited Tax Refunding Bonds, Series 2013:Date Issued: December 19, 2013Interest Rate: 2.00 - 5.00Original Amount: $18,055,000Maturing Date: June 15, 2027 12,805,000 - 1,155,000 11,650,000 1,190,000
Unlimited Tax Refunding Bonds, Series 2013:Date Issued: December 19, 2013Interest Rate: 1.75 - 5.00Original Amount: $16,835,000Maturing Date: June 15, 2027 14,455,000 - 1,495,000 12,960,000 1,520,000
Limited Tax Refunding Bonds, Series 2013:Date Issued: December 19, 2013Interest Rate: 2.00 - 5.00Original Amount: $13,375,000Maturing Date: June 15, 2021 8,095,000 - 1,890,000 6,205,000 1,975,000

Bexar County, Texas NOTES TO BASIC FINANCIAL STATEMENTS
September 30, 2018
72
NOTE H – LONG-TERM DEBT (Continued) Primary Government (Continued)
Balance Balance Outstanding Issued Retired Outstanding Amount DueOctober 1, During During September 30, Within One
2017 Year Year 2018 YearGovernmental Activities:Refunding Bonds
Limited Tax Refunding Bonds, Series 2013:Date Issued: December 19, 2013Interest Rate: 4.00 - 5.00Original Amount: $16,790,000Maturing Date: June 15, 2021 11,680,000 - 2,710,000 8,970,000 2,845,000
Limited Tax Refunding Bonds, Series 2014:Date Issued: December 30, 2014Interest Rate: 3.00 - 5.00Original Amount: $54,575,000Maturing Date: June 15, 2028 54,050,000 - 2,770,000 51,280,000 5,375,000
Unlimited Tax Refunding Bonds, Series 2014:Date Issued: December 30, 2014Interest Rate: 1.50 - 5.00Original Amount: $9,360,000Maturing Date: June 15, 2028 9,360,000 - 660,000 8,700,000 670,000
Flood Control Tax Refunding Bonds, Series 2014:Date Issued: December 30, 2014Interest Rate: 4.00 - 5.00Original Amount: $111,810,000Maturing Date: June 15, 2038 110,870,000 - 2,625,000 108,245,000 2,760,000
Flood Control Tax Refunding Bonds, Series 2016:Date Issued: July 21, 2016Interest Rate: 3.00 - 5.00Original Amount: $101,740,000Maturing Date: June 15, 2035 101,740,000 - - 101,740,000 -
Limited Tax Refunding Bonds, Series 2016:Date Issued: July 21, 2016Interest Rate: 3.00 - 5.00Original Amount: $248,415,000Maturing Date: June 15, 2040 245,795,000 - 1,630,000 244,165,000 1,715,000
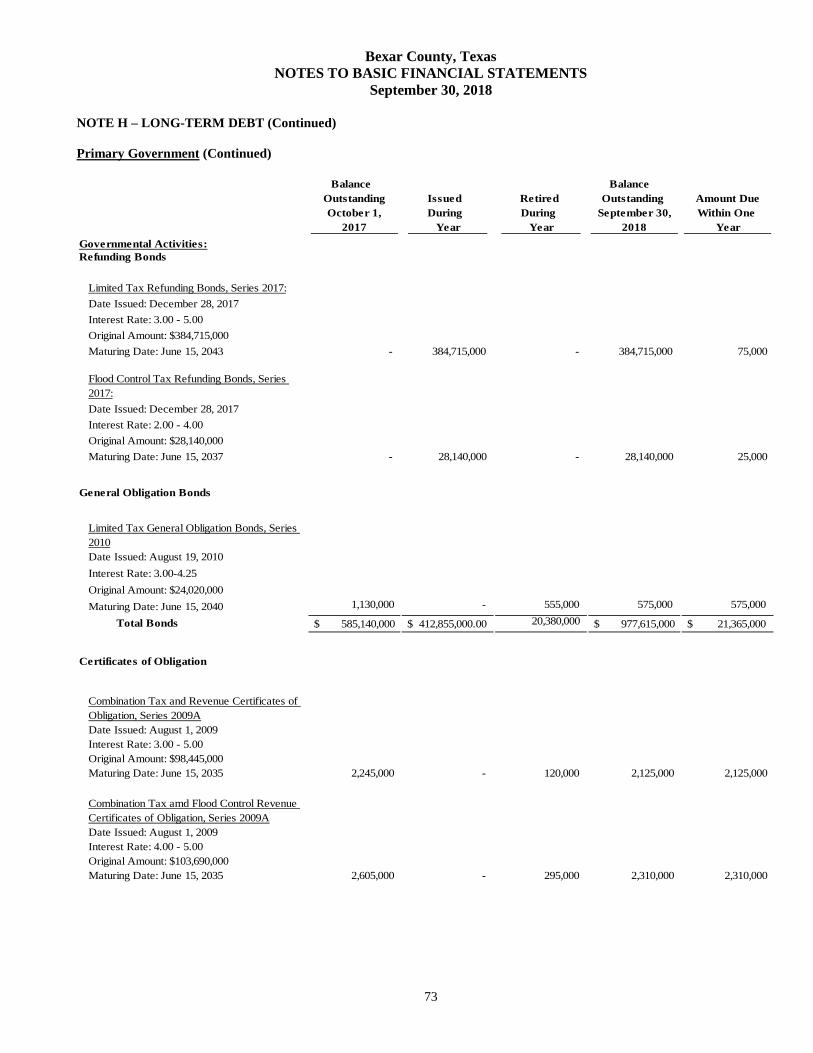
Bexar County, Texas NOTES TO BASIC FINANCIAL STATEMENTS
September 30, 2018
73
NOTE H – LONG-TERM DEBT (Continued) Primary Government (Continued)
Balance Balance Outstanding Issued Retired Outstanding Amount DueOctober 1, During During September 30, Within One
2017 Year Year 2018 YearGovernmental Activities:Refunding Bonds
Limited Tax Refunding Bonds, Series 2017:Date Issued: December 28, 2017Interest Rate: 3.00 - 5.00Original Amount: $384,715,000Maturing Date: June 15, 2043 - 384,715,000 - 384,715,000 75,000
Flood Control Tax Refunding Bonds, Series 2017:Date Issued: December 28, 2017Interest Rate: 2.00 - 4.00Original Amount: $28,140,000Maturing Date: June 15, 2037 - 28,140,000 - 28,140,000 25,000
General Obligation Bonds
Limited Tax General Obligation Bonds, Series 2010Date Issued: August 19, 2010Interest Rate: 3.00-4.25Original Amount: $24,020,000Maturing Date: June 15, 2040 1,130,000 - 555,000 575,000 575,000
Total Bonds $ 585,140,000 $ 412,855,000.00 20,380,000 $ 977,615,000 $ 21,365,000
Certificates of Obligation
Combination Tax and Revenue Certificates of Obligation, Series 2009ADate Issued: August 1, 2009Interest Rate: 3.00 - 5.00Original Amount: $98,445,000Maturing Date: June 15, 2035 2,245,000 - 120,000 2,125,000 2,125,000
Combination Tax amd Flood Control Revenue Certificates of Obligation, Series 2009ADate Issued: August 1, 2009Interest Rate: 4.00 - 5.00Original Amount: $103,690,000Maturing Date: June 15, 2035 2,605,000 - 295,000 2,310,000 2,310,000

Bexar County, Texas NOTES TO BASIC FINANCIAL STATEMENTS
September 30, 2018
74
NOTE H – LONG-TERM DEBT (Continued) Primary Government (Continued)
Balance Balance Outstanding Issued Retired Outstanding Amount DueOctober 1, During During September 30, Within One
2017 Year Year 2018 YearGovernmental Activities:
Combination Tax and Revenue Certificates of Obligation, Taxable Series 2009B, Direct Subsidy-Build America BondsDate Issued: August 1, 2009Interest Rate: 6.628Original Amount: $50,620,000Maturing Date: June 15, 2039 50,620,000 - - 50,620,000 -
Combination Tax and Flood Control Revenue Certificates of Obligation, Taxable Series 2009B, Direct Subsidy-Build America BondsDate Issued: August 1, 2009Interest Rate: 6.628Original Amount: $50,620,000Maturing Date: June 15, 2039 50,620,000 - - 50,620,000 -
Combination Tax and Revenue Certificates of Obligation, Taxable Series 2010B, Direct Subsidy-Build America BondsDate Issued: August 19, 2010Interest Rate: 5.75Original Amount: $30,325,000Maturing Date: June 15, 2039 30,325,000 - - 30,325,000 -
Combination Tax and Revenue Certificates of Obligation, Series 2010A
Date Issued: August 19, 2010Interest Rate: 3.00-5.00Original Amount: $97,455,000Maturing Date: June 15, 2036 5,580,000 - 2,720,000 2,860,000 2,860,000
Combination Tax and Revenue Certificates of Obligation, Series 2011
Date Issued: October 11, 2011Interest Rate: 3.00-5.00Original Amount: $59,330,000Maturing Date: June 15, 2040 1,625,000 - 815,000 810,000 810,000
Combination Tax and Revenue Certificates of Obligation, Series 2011A
Date Issued: December 27, 2011Interest Rate: 3.375-5.00Original Amount: $51,295,000Maturing Date: June 15, 2040 49,730,000 - 16,575,000 33,155,000 600,000

Bexar County, Texas NOTES TO BASIC FINANCIAL STATEMENTS
September 30, 2018
75
NOTE H – LONG-TERM DEBT (Continued) Primary Government (Continued)
Balance Balance Outstanding Issued Retired Outstanding Amount DueOctober 1, During During September 30, Within One
2017 Year Year 2018 YearGovernmental Activities:
Certificates of Obligation
Combination Tax and Revenue Certificates of Obligation, Series 2011A
Date Issued: December 27, 2011Interest Rate: 3.00-5.00Original Amount: $34,095,000Maturing Date: June 15, 2037 31,025,000 - 29,230,000 1,795,000 880,000
Combination Tax and Revenue Certificates of Obligation, Series 2013
Date Issued: February 14, 2013Interest Rate: 3.00-5.00Original Amount: $83,955,000Maturing Date: June 15, 2043 83,245,000 - 30,175,000 53,070,000 750,000
Combination Tax and Revenue Certificates of Obligation, Series 2013A
Date Issued: May 9, 2013Interest Rate: 1.00-5.00Original Amount: $115,040,000Maturing Date: June 15, 2040 113,840,000 - 29,150,000 84,690,000 500,000
Combination Tax and Revenue Certificates of Obligation, Series 2013B
Date Issued: August 22, 2013Interest Rate: 2.00-5.125Original Amount: $331,725,000Maturing Date: June 15, 2043 330,725,000 - 310,940,000 19,785,000 500,000
Pass-Through Revenue and Limited Tax Bonds, Series 2015A
Date Issued: August 13, 2015Interest Rate: 2.00 - 5.00Original Amount: $17,405,000Maturing Date: June 15, 2044 16,665,000 - 350,000 16,315,000 360,000
Pass-Through Revenue and Limited Tax Bonds, Series 2015B
Date Issued: August 13, 2015Interest Rate: 2.00 - 5.00Original Amount: $29,385,000Maturing Date: June 15, 2045 26,995,000 - 540,000 26,455,000 560,000

Bexar County, Texas NOTES TO BASIC FINANCIAL STATEMENTS
September 30, 2018
76
NOTE H – LONG-TERM DEBT (Continued) Primary Government (Continued)
Balance Balance Outstanding Issued Retired Outstanding Amount DueOctober 1, During During September 30, Within One
2017 Year Year 2018 YearGovernmental Activities:
Combination Tax and Revenue Certificates of Obligation, Series 2014
Date Issued: December 30, 2014Interest Rate: 3.00 - 5.00Original Amount: $87,130,000Maturing Date: June 15, 2040 86,630,000 - 500,000 86,130,000 500,000
Combination Tax and Revenue Certificates of Obligation, Series 2016Date Issued: August 25, 2016Interest Rate: 2.00 - 5.00Original Amount: $91,675,000Maturing Date: June 15, 2045 91,675,000 - 100,000 91,575,000 100,000
Combination Tax and Revenue Certificates of Obligation, Series 2016Date Issued: December 20, 2016Interest Rate: 3.00 -5.00Original Amount: $93,280,000Maturing Date: June 15, 2045 93,280,000 - 100,000 93,180,000 100,000
Combination Tax and Revenue Certificates of Obligation, Series 2016Date Issued: December 20, 2016Interest Rate: 3.00 - 5.00Original Amount: $20,330,000Maturing Date: June 15, 2031 20,330,000 - 1,040,000 19,290,000 1,090,000

Bexar County, Texas NOTES TO BASIC FINANCIAL STATEMENTS
September 30, 2018
77
NOTE H – LONG-TERM DEBT (Continued) Primary Government (Continued)
Balance Balance Outstanding Issued Retired Outstanding Amount DueOctober 1, During During September 30, Within One
2017 Year Year 2018 YearGovernmental Activities:
Certificates of Obligation Pass-Through Revenue and Limited Tax Bonds, Series 2017Date Issued: November 29, 2017Interest Rate: 4.00 - 5.00Original Amount: $40,840,000Maturing Date: June 15, 2043 - 40,840,000 - 40,840,000 -
Total Certificates of Obligation 1,087,760,000 40,840,000 422,650,000 705,950,000 14,045,000 Total Bonds, Certificates of Obligation $ 1,672,900,000 $ 453,695,000 $ 443,030,000 $ 1,683,565,000 $ 35,410,000
Balance Balance Outstanding Issued Retired Outstanding Amount DueOctober 1, During During September 30, Within One
2017 Year Year 2018 Year
Other LiabilitiesCompensated absences 40,928,803 14,990,239 10,232,201 45,686,841 11,421,710
Total Other Liabilities 40,928,803 14,990,239 10,232,201 45,686,841 11,421,710 Total Governmental Activities $ 1,713,828,803 $ 468,685,239 $ 453,262,201 $ 1,729,251,841 $ 46,831,710

Bexar County, Texas NOTES TO BASIC FINANCIAL STATEMENTS
September 30, 2018
78
NOTE H – LONG-TERM DEBT (Continued) Primary Government (Continued)
Balance Balance Outstanding Issued Retired Outstanding Amount DueOctober 1, During During September 30, Within One
2017 Year Year 2018 YearBusiness-type Activities:Revenue Bonds
Tax-Exempt Venue Project Revenue Refunding Bonds, Series 2008ADate Issued: September 4, 2008Interest Rate: 3.50 - 5.25Original Amount: $42,145,000Maturing Date: August 15, 2047 37,675,000 - 595,000 37,080,000 620,000
Taxable Venue Project Revenue Refunding Bonds, Series 2008BDate Issued: September 4, 2008Interest Rate: 3.77 - 6.98Original Amount: $50,810,000Maturing Date: August 15, 2032 39,100,000 - 1,610,000 37,490,000 1,705,000
Tax-Exempt Venue Project Revenue Bonds, Series 2008CDate Issued: September 4, 2008Interest Rate: 3.50 - 5.00Original Amount: $5,525,000Maturing Date: August 15, 2037 4,545,000 - 145,000 4,400,000 150,000
Tax-Exempt Venue Project Revenue Bonds, Series 2008DDate Issued: September 4, 2008Interest Rate: 3.50 - 5.00Original Amount: $5,985,000Maturing Date: August 15, 2037 4,925,000 - 155,000 4,770,000 165,000
Tax-Exempt Venue Project Revenue Bonds (MVRT), Series 2009Date Issued: December 17, 2009Interest Rate: 2.00 - 5.00Original Amount: $27,870,000Maturing Date: August 15, 2039 25,735,000 - 705,000 25,030,000 730,000

Bexar County, Texas NOTES TO BASIC FINANCIAL STATEMENTS
September 30, 2018
79
NOTE H – LONG-TERM DEBT (Continued) Primary Government (Continued)
Balance Balance Outstanding Issued Retired Outstanding Amount DueOctober 1, During During September 30, Within One
2017 Year Year 2018 YearBusiness-type Activities:Revenue Bonds
Tax-Exempt Venue Project Revenue Bonds (CVT), Series 2009Date Issued: December 17, 2009Interest Rate: 2.00 - 5.00Original Amount: $23,020,000Maturing Date: August 15, 2039 21,160,000 - 570,000 20,590,000 590,000
Tax-Exempt Venue Project Revenue Refunding Bonds (MVRT), Series 2010Date Issued: December 14, 2010Interest Rate: 3.00 - 5.50Original Amount: $27,365,000Maturing Date: August 15, 2049 25,600,000 - 340,000 25,260,000 360,000
Tax-Exempt Venue Project Revenue Refunding Bonds (CVT), Series 2010Date Issued: December 14, 2010Interest Rate: 3.00 - 5.50Original Amount: $39,695,000Maturing Date: August 15, 2049 37,135,000 - 495,000 36,640,000 520,000
Tax-Exempt Venue Project Revenue Refunding Bonds (CVT), Series 2013Date Issued: January 23, 2013Interest Rate: 2.00-5.00Original Amount: $92,190,000Maturing Date: August 15, 2049 91,190,000 - 250,000 90,940,000 250,000
Tax-Exempt Venue Project Revenue Refunding Bonds (MVRT), Series 2013Date Issued: January 23, 2013Interest Rate: 2.00-5.00Original Amount: $25,880,000Maturing Date: August 15, 2049 24,315,000 - 415,000 23,900,000 425,000
Tax-Exempt Venue Project Revenue Refunding Bonds, (CVT), Series 2015Date Issued: November 18, 2015Interest Rate: 3.00-5.00Original Amount: $78,935,000Maturing Date: August 15, 2051 76,330,000 - 1,025,000 75,305,000 1,070,000
Total Revenue Bonds $ 387,710,000 $ - $ 6,305,000 $ 381,405,000 $ 6,585,000
Total Business-type Activities 387,710,000$ -$ 6,305,000$ 381,405,000$ 6,585,000$

Bexar County, Texas NOTES TO BASIC FINANCIAL STATEMENTS
September 30, 2018
80
NOTE H - LONG-TERM DEBT (Continued) Primary Government (Continued) Annual debt service requirements as of September 30, 2018 are as follows:
Fiscal Total
Year Principal Interest Total Principal Interest Total All Debt
2019 35,410,000 77,324,879 112,734,879 6,585,000 18,927,768 25,512,768 138,247,647
2020 39,680,000 75,692,667 115,372,667 6,875,000 18,620,911 25,495,911 140,868,578
2021 41,915,000 73,751,617 115,666,617 7,210,000 18,293,465 25,503,465 141,170,082
2022 39,530,000 71,706,917 111,236,917 7,535,000 17,952,479 25,487,479 136,724,396
2023 42,335,000 69,821,567 112,156,567 7,905,000 17,578,725 25,483,725 137,640,292
2024-2028 274,755,000 313,854,333 588,609,333 46,035,000 81,392,864 127,427,864 716,037,197
2029-2033 362,840,000 243,727,868 606,567,868 57,605,000 67,995,153 125,600,153 732,168,021
2034-2038 432,455,000 159,652,597 592,107,597 68,585,000 52,351,325 120,936,325 713,043,922
2039-2043 383,975,000 58,906,995 442,881,995 68,435,000 35,419,813 103,854,813 546,736,808
2044-2048 30,670,000 1,881,500 32,551,500 80,265,000 17,604,925 97,869,925 130,421,425
2049-2051 - - - 24,370,000 1,599,225 25,969,225 25,969,225
1,683,565,000$ 1,146,320,940$ 2,829,885,940$ 381,405,000$ 347,736,653$ 729,141,653$ 3,559,027,593$
Governmental Activities Business-type Activities
In the government-wide financial statements, governmental activities, deferred charges on refundings of bonds (losses) are amortized over the life of the new debt or old debt, whichever is shorter; bond premiums, bond discounts, and prepaid insurance costs are amortized over the life of the debt. Bonds payable are reported net of the applicable bond premiums and bond discounts. Governmental Activities Capital assets, net of related debt, include land, equipment and construction in progress, buildings, depreciable land assets, machinery and equipment, and infrastructure, net of accumulated depreciation. The amount is reduced by outstanding bonds, certificates of obligation, net of unspent proceeds, related to improving, purchasing, or constructing capital assets and expenditures for assets owned by the entities. In prior years, the General Fund has been used to liquidate the liability for compensated absences and net pension obligation whereas the Internal Service Fund has been used to liquidate the net other post-employment benefit obligation.

Bexar County, Texas NOTES TO BASIC FINANCIAL STATEMENTS
September 30, 2018
81
NOTE H – LONG-TERM DEBT (Continued) Primary Government (Continued)
Business-type Activities In business-type activities, deferred charges on refundings of bonds (losses) are amortized over the life of the new debt or old debt, whichever is shorter; bond premiums, discounts, and the cost of prepaid insurance are amortized over the life of the bonds. Bonds payable are reported net of the applicable bond discount and premiums. Capital assets, net of related debt include buildings, improvements, and equipment, net of accumulated depreciation. This amount is reduced by the outstanding revenue bonds, net of unspent proceeds, related to constructing, purchasing, or improving capital assets.
Beginning Ending Due WithinBalance Additions Reductions Balance One Year
Governmental Activities:Bonds payable: Bonds 585,140,000$ 412,855,000$ 20,380,000$ 977,615,000$ 21,365,000$ Certificates of obligation 1,087,760,000 40,840,000 422,650,000 705,950,000 14,045,000
1,672,900,000 453,695,000 443,030,000 1,683,565,000 35,410,000 Unamortized premium 153,772,980 65,035,490 31,020,768 187,787,702 10,196,801 Total bonds payable 1,826,672,980 518,730,490 474,050,768 1,871,352,702 45,606,801 Other liabilities Compensated absences 40,928,803 14,990,239 10,232,201 45,686,841 11,421,711 Total other liabilities 40,928,803 14,990,239 10,232,201 45,686,841 11,421,711
Total Governmental Activities long-term liabilities 1,867,601,783$ 533,720,729$ 484,282,969$ 1,917,039,543$ 57,028,512$
Beginning Ending Due Within
Balance Additions Reductions Balance One YearBusiness-Type Activities: Tax-Exempt Rev Ref Bonds 37,675,000$ -$ 595,000$ 37,080,000$ 620,000$ Taxable Rev Ref Bonds 39,100,000 - 1,610,000 37,490,000 1,705,000 Tax-Exempt Revenue Bonds (CVT) 25,705,000 - 715,000 24,990,000 740,000 Tax-Exempt Revenue Bonds (MVRT) 30,660,000 - 860,000 29,800,000 895,000 Tax-Exempt Sub Lien Ref Rev Bonds 25,600,000 - 340,000 25,260,000 360,000 Tax-Exempt Sub Lien Ref Rev Bonds 37,135,000 - 495,000 36,640,000 520,000 Tax-Exempt Rev Ref Bonds (CVT) 91,190,000 - 250,000 90,940,000 250,000 Tax-Exempt Rev Ref Bonds (MVRT) 24,315,000 - 415,000 23,900,000 425,000 Tax-Exempt Sub Lien Rev Bonds (CVT) 76,330,000 - 1,025,000 75,305,000 1,070,000
387,710,000 - 6,305,000 381,405,000 6,585,000 Unamortized premium 8,872,900 - 278,838 8,594,062 278,838 Unamortized discount (1,587,792) - (52,337) (1,535,455) (52,337) Total revenue bonds payable 394,995,108 - 6,531,501 388,463,607 6,811,501 Total Business-Type Activities long-term liabilities 394,995,108$ -$ 6,531,501$ 388,463,607$ 6,811,501$

Bexar County, Texas NOTES TO BASIC FINANCIAL STATEMENTS
September 30, 2018
82
NOTE H – LONG-TERM DEBT (Continued) Primary Government (Continued) Fiscal Year 2017-2018 Debt Obligation Activity Governmental Activities In November 2017, the County issued $40,480,000 in Pass-Through Revenue and Limited Tax Bonds, Series 2017 at a premium of $6,289,621with the payments of the related principal and interest to be made from an annual ad valorem tax levied against all taxable property within the County. Proceeds from the sale of the Bonds will be used for paying the County's obligations arising under the Pass-Through Agreement with respect to constructing the Potranco Road Project to be made in partnership with TxDOT and to pay for the costs of issuing the Bonds. The annual interest rate on the bonds range from 4.00% - 5.00%. Interest accrues semiannually and the bonds mature in fiscal year 2043.
In December 2017, the County issued $384,715,000 in Limited Tax Refunding Bonds, Series 2017 at a premium of $56,768,870 to pay for the costs of issuing the Refunding Bonds and refund $15,980,000 in Combination Tax and Revenue Certificates of Obligation, Series 2011A; $29,675,000 in Combination Tax and Revenue Certificates of Obligation, Series 2013; $28,650,000 in Combination Tax and Revenue Certificates of Obligation, Series 2013A; $310,440,000 in Combination Tax and Revenue Certificates of Obligation, Series 2013B. The bond proceeds were placed in an irrevocable trust to provide for all debt service payments on the old bonds. The reacquisition price exceeded the net carrying amount of the old debt by $32,861,595. The current refunding was undertaken to reduce debt service payments over the next 26 years by $22,617,569 and resulted in an economic gain of $15,043,840. For the Series 2017 bonds, the payment of the principal and interest are to be made from an annual ad valorem tax levied against all taxable property within the County. The annual interest rates on the bonds range from 3.00% - 5.00%. Interest accrues semiannually and the bonds mature in fiscal year 2043.
In December 2017, the County issued $28,140,000 in Flood Control Tax Refunding Bonds, Series 2017 at a premium of $1,976,997 to pay for the costs of issuing the Refunding Bonds and to refund $28,385,000 in Combination Flood Control Tax and Revenue Certificates of Obligation, Series 2011. The bond proceeds were placed in an irrevocable trust to provide for all debt service on the old bonds. The reacquisition price exceeded the net carrying amount of the old debt by $645,000. The current refunding was undertaken to reduce debt service payments over the next 20 years by $1,955,538 and resulted in an economic gain of $1,498,982. For the Series 2017 bonds, the payment of the principal and interest are to be made from an annual ad valorem tax levied against all taxable property within the County. The annual interest rates on the bonds range from 2.00% - 4.00%. Interest accrues semiannually and Interest accrues semiannually and the bonds mature in fiscal year 2037.

Bexar County, Texas NOTES TO BASIC FINANCIAL STATEMENTS
September 30, 2018
83
NOTE H – LONG-TERM DEBT (Continued)
Primary Government (Continued)
Defeasance of Debt
The County has defeased certain general obligation bonds and certificates of obligation by placing the proceeds of the refunding bonds in an irrevocable trust to provide for all future debt service on the refunded bonds. The trust account assets and the liability for the defeased bonds are not included in the County’s financial statements.
At September 30, 2018, the outstanding principal balance of these defeased bonds was as follows: Governmental Activities:General Obligation Bonds:Limited Tax General Obligations Bonds, Series 2010 19,290,000 Total General Obligation Bonds 19,290,000$
Certificates of Obligation:Combination Flood Control Tax & Revenue, Series 2009A 100,525,000 Combination Tax & Revenue, Series 2009A 95,975,000 Combination Tax & Revenue, Series 2010A 74,855,000 Combination Tax & Revenue, Series 2011 56,010,000 Combination Tax & Revenue, Series 2011 28,385,000 Combination Tax & Revenue, Series 2011A 15,980,000 Combination Tax & Revenue, Series 2013 29,675,000 Combination Tax & Revenue, Series 2013A 28,650,000 Combination Tax & Revenue, Series 2013B 310,440,000 Total Certificates of Obligation 740,495,000 Total Defeased Debt 759,785,000$
Arbitrage Rebate The Tax Recovery Act of 1986 established regulations for the rebate to the federal government on arbitrage earnings on certain local government bonds issued after December 31, 1985, and all local governmental bonds issued after August 31, 1986. Issuing governments must calculate any rebate due on an annual basis and remit the amount due at least every five years. The County has no cumulative rebate amount due or payable as of September 30, 2018. Compensated Absences Changes in long-term compensated absences for the year ended September 30, 2018 were as follow: Governmental Activities:
Balance October 1, 2017 Additions Taken/Paid
Balance September 30, 2018
Due in One Year
40,928,803$ 14,990,239$ 10,232,201$ 45,686,841$ 11,421,711$
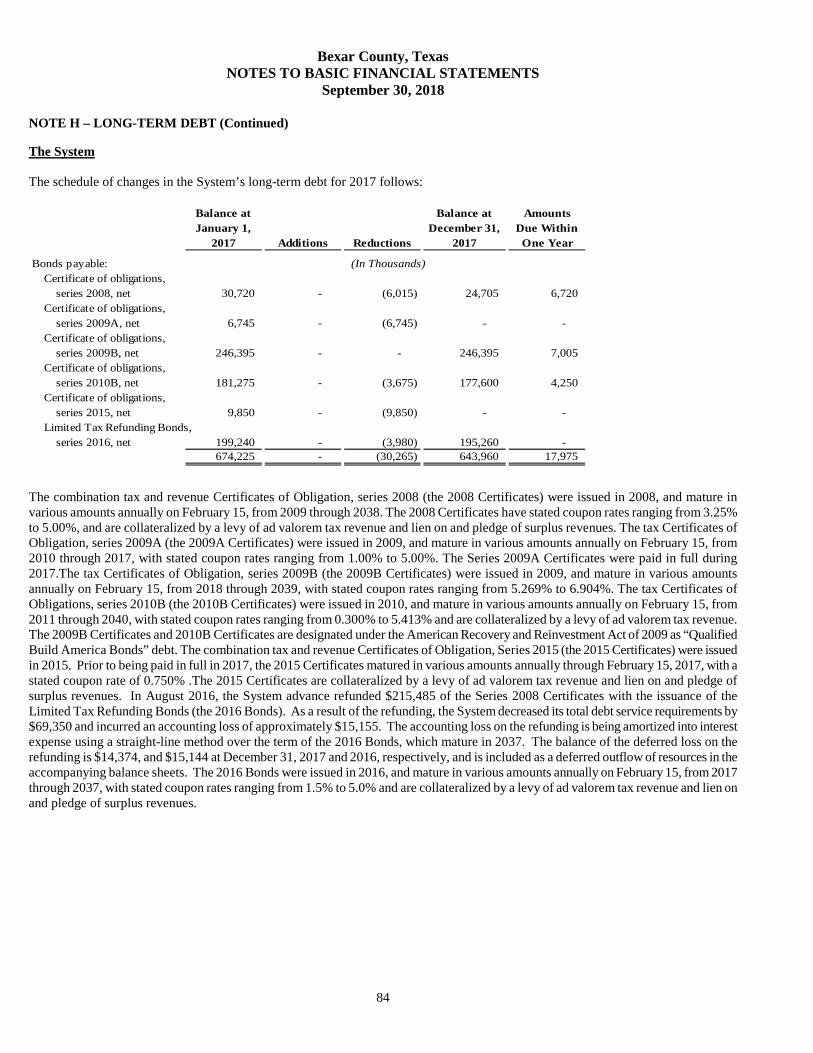
Bexar County, Texas NOTES TO BASIC FINANCIAL STATEMENTS
September 30, 2018
84
NOTE H – LONG-TERM DEBT (Continued)
The System The schedule of changes in the System’s long-term debt for 2017 follows:
Balance at January 1,
2017 Additions Reductions
Balance at December 31,
2017
Amounts Due Within One Year
Bonds payable: (In Thousands)Certificate of obligations,
series 2008, net 30,720 - (6,015) 24,705 6,720 Certificate of obligations,
series 2009A, net 6,745 - (6,745) - - Certificate of obligations,
series 2009B, net 246,395 - - 246,395 7,005 Certificate of obligations,
series 2010B, net 181,275 - (3,675) 177,600 4,250 Certificate of obligations,
series 2015, net 9,850 - (9,850) - - Limited Tax Refunding Bonds,
series 2016, net 199,240 - (3,980) 195,260 - 674,225 - (30,265) 643,960 17,975
The combination tax and revenue Certificates of Obligation, series 2008 (the 2008 Certificates) were issued in 2008, and mature in various amounts annually on February 15, from 2009 through 2038. The 2008 Certificates have stated coupon rates ranging from 3.25% to 5.00%, and are collateralized by a levy of ad valorem tax revenue and lien on and pledge of surplus revenues. The tax Certificates of Obligation, series 2009A (the 2009A Certificates) were issued in 2009, and mature in various amounts annually on February 15, from 2010 through 2017, with stated coupon rates ranging from 1.00% to 5.00%. The Series 2009A Certificates were paid in full during 2017.The tax Certificates of Obligation, series 2009B (the 2009B Certificates) were issued in 2009, and mature in various amounts annually on February 15, from 2018 through 2039, with stated coupon rates ranging from 5.269% to 6.904%. The tax Certificates of Obligations, series 2010B (the 2010B Certificates) were issued in 2010, and mature in various amounts annually on February 15, from 2011 through 2040, with stated coupon rates ranging from 0.300% to 5.413% and are collateralized by a levy of ad valorem tax revenue. The 2009B Certificates and 2010B Certificates are designated under the American Recovery and Reinvestment Act of 2009 as “Qualified Build America Bonds” debt. The combination tax and revenue Certificates of Obligation, Series 2015 (the 2015 Certificates) were issued in 2015. Prior to being paid in full in 2017, the 2015 Certificates matured in various amounts annually through February 15, 2017, with a stated coupon rate of 0.750% .The 2015 Certificates are collateralized by a levy of ad valorem tax revenue and lien on and pledge of surplus revenues. In August 2016, the System advance refunded $215,485 of the Series 2008 Certificates with the issuance of the Limited Tax Refunding Bonds (the 2016 Bonds). As a result of the refunding, the System decreased its total debt service requirements by $69,350 and incurred an accounting loss of approximately $15,155. The accounting loss on the refunding is being amortized into interest expense using a straight-line method over the term of the 2016 Bonds, which mature in 2037. The balance of the deferred loss on the refunding is $14,374, and $15,144 at December 31, 2017 and 2016, respectively, and is included as a deferred outflow of resources in the accompanying balance sheets. The 2016 Bonds were issued in 2016, and mature in various amounts annually on February 15, from 2017 through 2037, with stated coupon rates ranging from 1.5% to 5.0% and are collateralized by a levy of ad valorem tax revenue and lien on and pledge of surplus revenues.

Bexar County, Texas NOTES TO BASIC FINANCIAL STATEMENTS
September 30, 2018
85
NOTE H – LONG-TERM DEBT (Continued) The District In September 2009, the District issued $22,520,000 in Limited Ad Valorem Tax Utility System Bonds, Series 2009 for the purpose of reimbursing the Developer for authorized and approved construction costs it incurred within the District. The bonds will be paid over a twenty-five year period with a maturity date of August 15, 2034 and interest rates of ranging from 3.00% - 6.25%. The Limited Ad Valorem Tax Utility System Bonds, Series 2009 matures on August 15, 2034. In October 2014, the District issued $48,900,000 Hotel Tax and Sales and Use Tax Revenue Bonds Taxable, Series 2014 to reduce the Economic Development Grant from the Developer. The bonds will be paid over a twenty year period with a maturity date of August 15, 2034 and an interest rate of 7.00%. In December 2014, the District issued $8,965,000 Limited Ad Valorem Tax Road Bonds, Series 2014 to reimburse the Developer for public improvements. The bonds will be paid over a twenty year period with a maturity date of August 15, 2034 and an interest rate ranging from 3.00% - 4.10%.
Balance at October 1,
2016 Additions Reductions
Balance at Septermber 30,
2017
(Discount) / Premium
Balance at September 30,
2017
Amount Due Within One
Year
Bonds payable:Limited Ad Valorem Tax Utility System Bonds: Series 2009 18,715,000$ -$ 620,000$ 18,095,000$ (252,252)$ 655,000$ Limited Ad Valorem Tax Road Bonds: Series 2014 8,200,000 - 345,000 7,855,000 3,735 350,000 Limited Ad Valorem Tax Road Bonds: Series 2016 - 9,575,000 520,000 9,055,000 2,183 415,000
Subtotal 26,915,000 9,575,000 1,485,000 35,005,000 (246,334) 1,420,000
Hotel Tax and Sales and Use Tax Revenue Bonds Taxable: Series 2014 44,965,000 - 1,815,000 43,150,000 - 1,445,000
Total 71,880,000$ 9,575,000$ 3,300,000$ 78,155,000$ (246,334)$ 2,865,000$
On January 26, 2006, the District entered into an agreement, with the Developer, for the construction of public improvements and for certain public improvements that had already been undertaken by the Developer prior to the date of the agreement. Interest accumulates on unreimbursed costs at a rate of 9.75% per annum, compounded monthly, from the time the Developer requests reimbursement. As of September 30, 2017, the amount due to the Developer is $45,829,914, which includes $21,404,648 of accrued interest. A summary of changes in amounts due to developer for the year ended September 30, 2017 follows: Balance - October 1, 2016 43,069,338$ Interest Accrued in the Current Year 4,195,576 Current Year Payments (1,435,000) Balance - September 30, 2017 45,829,914$
Amount Due Within One Year -$

Bexar County, Texas NOTES TO BASIC FINANCIAL STATEMENTS
September 30, 2018
86
NOTE H – LONG-TERM DEBT (Continued) The Authority Long-term debt activity for the year ended September 30, 2018 is as follows:
On December 16, 2005, the Authority entered into a financial assistance agreement (FAA 1) with TxDOT to provide funding for the Authority’s participation in the procurement process for a proposed comprehensive development agreement. This agreement is not to exceed $1,000,000 and is noninterest-bearing. Funds were drawn down as authorized expenses were incurred. The amount outstanding at September 30, 2018 totaled $913,890. On January 23, 2006, the Authority entered into a financial assistance agreement (FAA 2) with TxDOT to provide funding for the development costs of certain toll projects. This agreement is not to exceed $7,500,000 and is noninterest-bearing. Funds were drawn down as authorized expenses were incurred. The amount outstanding at September 30, 2018 totaled $4,542,185. On September 11, 2007, the Authority entered into a financial assistance agreement (FAA 3) with TxDOT to provide funding for the development costs of certain toll projects. FAA 3 is being funded with remaining unused funds on the previous FAAs. Funds were drawn down as authorized expenses were incurred. This agreement is not to exceed $3,043,925 (the amount of unused funds from the previous FAAs) and is noninterest-bearing. $2,915,211 of FAA 3 was reduced by TxDOT during the fiscal year 2011 for accepted work product on Wurzbach Parkway and Bandera Road. The amount outstanding at September 30, 2016 totaled $128,714. On February 3, 2009, the Authority entered into a financial assistance agreement (FAA 5) with TxDOT to provide funding for the environmental impact statement and Loop 1604 predevelopment costs. TxDOT awarded $12,390,000 in the form of a loan to conduct feasibility studies, environmental studies, public involvement, schematics, and preliminary financial plans associated with the addition of toll lanes on identified projects. The amount outstanding at September 30, 2018 totaled $12,390,000. Any revenue used to repay the financial assistance agreements shall not exceed 10 percent of the revenue received in any calendar year. On June 15, 2016, the Authority issued $114,425,000 ($62,105,000 in Senior Lien and $52,320,000 in Junior Lien bonds) in Alamo Regional Mobility Authority Vehicle Registration Fee Revenue Bonds, Series 2016 (maturing in 2046) at a premium of $21,950,110 with the payment of the related principal and interest to be made from a pledge of net revenues from a $10 vehicle registration fee assessed on all vehicles registered in Bexar County. Interest on the debt varies between 4-5 percent. The proceeds from the debt will be used to (i) initiate construction on 14 local transportation projects spread-out across Bexar County (ii) funding for two debt service reserve insurance policies and (iii) pay for cost of issuance. The Authority purchased a surety policy in the amount of $239,356 at the time of closing which is recorded as a prepaid asset. The prepaid asset is amortized over the life of the bond and has a balance of $221,056 at September 30, 2018. Vehicle registration fees are projected to produce 255 percent of the debt service requirements over the life of the bonds. The total principal and interest remaining to be paid on the bonds is $208,255,600. Principal and interest paid in fiscal year 2018 and total vehicle registration fee revenue in fiscal year 2018 was $7,440,900 and $16,267,220, respectively.
Balance October 1,
2017 Additions Reductions
Balance September 30,
2018Due in One
Year
TxDot - FAA 1 913,890.00$ -$ -$ 913,890.00$ -$ TxDot - FAA 2 4,542,185 - - 4,542,185 - TxDot - FAA 3 128,714 - - 128,714 - TxDot - FAA 5 12,390,000 - - 12,390,000 - VRF Jr Lien 52,320,000 - - 52,320,000 - VRF Sr Lien 60,350,000 - 1,845,000 58,505,000 1,915,000 Premium 19,871,823 - 1,531,833 18,339,990 -
Total long-term liabilities 150,516,612$ -$ 3,376,833$ 147,139,779$ 1,915,000$

Bexar County, Texas NOTES TO BASIC FINANCIAL STATEMENTS
September 30, 2018
87
NOTE I – RESTRICTED ASSETS AND LIABILITIES Primary Government The government-wide and business-type activities financial statements utilize a net position presentation. Net position is categorized as net investment in capital assets, restricted or unrestricted. In the fund financial statements, nonspendable, restricted, and committed segregate portions of fund balance that are either not available or have been earmarked for specific purposes from unassigned balances. These designations and restrictions can be found on pages 31 and 34. The System Certain noncurrent Cash and Investments have been internally restricted by the Board of Managers, which may, at its discretion, later use the funds for other purposes. The composition of internally restricted cash is set forth in the following table:
2017(In Thousands)
Capital acquisitions and improvements 180,631$ Professional self-insurance held in trust 5,103 Contingency fund 255,216
Total assets limited as to use 440,950$
NOTE J – SELF INSURANCE Primary Government The County is self-insured for the majority of health, workers’ compensation, and third-party general and property liability claims. The self-insurance programs are administered by external third-party administrators whose primary function is to administer and pay claims. Self-insurance activities are accounted for as an internal service fund.
The County relies upon a combination of self-insurance and commercial coverage for workers’ compensation and third-party liability claims. Claims administration is managed by an external agency pursuant to contractual terms for the receipt, investigation, and resolution of claims either by injured employees or third-parties alleging damage to persons or property. From October 1, 2017 through March 31, 2018, the internal service funds provide coverage for up to $100,000 for most liability claims and up to $150,000 for claims arising out of law enforcement activities , and $150,000 for automobile liability claims. From April 1, 2018 through present, the internal service funds provide coverage for up to $100,000 for most liability claims, $200,000 for claims arising out of law enforcement related activities, and $100,000 for automobile liability claims. Claims which exceed this self-insured retention (SIR) are covered by a combination of primary and excess coverage up to $5,000,000. For workers’ compensation claims, for injuries from October 1, 2017 through present, the SIR would be $750,000 for most employees and $1,000,000 for most uniformed law enforcement personnel. Excess coverage that exceeds the SIR is afforded up to statutory limits by an excess commercial workers’ compensation policy.
Excess loss insurance is carried on the health program, which limits losses on claims within a calendar year. For calendar year 2017, this limit for losses on claims was $400,000 per occurrence and an annual aggregate of approximately $72.9 million. For calendar year 2018, this limit was $400,000 per occurrence and an annual aggregate of approximately $69.4 million. The provision for unpaid self-insurance health losses at year end is included in claims payable in the internal services fund. It is based upon actual prior claim cost experience and average time lags in settling such claims and actual claims paid after year end. There has been no significant reduction in insurance coverage from coverage in the prior year by major category of risk.
All funds of the County participate in the health program and make payments to the Self-Insurance Fund based on estimates computed by the County of the amounts needed to pay prior and current year claims. The claims liability of $9,591,839 reported at September 30, 2018 is based on the requirements of GASB Statement No. 10, Accounting and Financial Reporting for Risk Financing and Related Insurance Issues. This Statement requires a liability for claims be reported if information prior to the issuance of the financial statements indicates it is probable a liability has been incurred at the date of the financial statements and the amount of loss can be reasonably estimated

Bexar County, Texas NOTES TO BASIC FINANCIAL STATEMENTS
September 30, 2018
88
NOTE J – SELF INSURANCE (Continued) Primary Government (Continued) Changes in the fund’s claims liability for fiscal years ended September 30, 2017 and 2018 were:
Fiscal Year
Beginning Liability
Current Claims and Changes in
Estimates Claims Payment Ending Balance Due in One Year
2017 8,776,119$ 44,600,018$ 44,480,634$ 8,895,503$ 7,299,633$
2018 8,895,503$ 48,667,322$ 47,970,986$ 9,591,839$ 8,349,649$ NOTE K – CONTRACT BETWEEN BEXAR COUNTY AND THE SAN ANTONIO RIVER AUTHORITY In 1951, Bexar County voters authorized an ad valorem levy for flood control of fifteen cents per one hundred dollars of valuation of taxable property. A 1955 contract with the San Antonio River Authority (SARA) and subsequent amendments, have provided to SARA a portion of the proceeds with the remaining flood control tax collections being retained by the County. The last amendment to the contract, referred to as The 1999 Amendatory Contract, maintains that the County will set a tax rate, which at 90% current collections, will provide revenues sufficient to pay the annual principal and interest of SARA bonds which are payable from the proceeds of the County’s flood control tax. For the fiscal year ended September 30, 2018, the County transferred $3,102,341 to SARA as part of this agreement. NOTE L – LEASES Operating Leases The County has entered into several cancelable facilities and equipment leases which are accounted for as operating leases. Total operating lease expenditures for the year ended September 30, 2018 by fund type are as follows:
NOTE M – CHARITY CARE The System (in thousands) The System provides charity care to residents of Bexar County who qualify on a financial basis for the CareLink Program and to all others who qualify based on the System’s charity care policy. The System does not pursue collection of amounts in excess of the established guidelines for those patients who meet the charity criteria. Such excess is considered charity care and is not reported as revenue. The System’s CareLink Program is used to discount gross charges for medical services received in the System’s facilities. Under this program, residents of Bexar County have an established maximum family liability rather than a discount of total gross charges. Key factors in establishing a family’s maximum liability levels are: number of dependents, income, and the relationship of these factors to the current Poverty Index. The System does not pursue collection of amounts in excess of the maximum family liability. Such excess amounts are considered charity care and are not reported as revenue.
NonmajorGovernmental Business Internal
General Capital Projects Funds Type Activites Service Total
4,699,991$ 17,440$ 501,660$ 6,699$ 3,657$ 5,229,446$

Bexar County, Texas NOTES TO BASIC FINANCIAL STATEMENTS
September 30, 2018
89
NOTE M – CHARITY CARE (Continued) The System (Continued) Arrangements are made with residents of Bexar County to pay their reduced medical costs in installments. Any amounts designated as not being due prior to December 31 of the subsequent year are classified as long-term patient receivables and are presented net of applicable allowances. Non-CareLink patients meeting the financial and medical indigency criteria established in the charity policy receive a discount from gross charges for emergency and catastrophic medical services received in the System’s facilities. Charges for financial indigency are discounted based on family income compared to the Poverty Index. Charges for medical indigency are discounted when charges exceed a certain income and asset level. The System maintains records to identify and monitor the level of charity care it provides. These records include the amount of charges forgone for services and supplies furnished under its charity care policy. The charges forgone, based on established rates, were approximately $568,930 and $520,139 for the years ended December 31, 2017 and 2016, respectively. The costs of charity care provided under the System’s charity care policy were approximately $174,048 and $162,750 for 2017 and 2016, respectively. The cost of charity care is estimated by applying the ratio of cost to gross charges to the gross charity care charges. NOTE N – RETIREMENT PLAN Primary Government Plan Description The County provides retirement, disability, and death benefits for all of its eligible employees through a nontraditional defined benefit pension plan (the plan) in the statewide Texas County and District Retirement System (TCDRS). The Board of Trustees of TCDRS is responsible for the administration of the statewide agent multiple-employer public employee retirement system which consists of 738 nontraditional defined benefit pension plans. TCDRS, in the aggregate, issues a Comprehensive Annual Financial Report (CAFR) on a calendar year basis. The CAFR is available upon written request from the TCDRS Board of Trustees at P.O. Box 2034, Austin, Texas 78768-2034. The plan provisions are adopted and may be amended by the governing body of the County within the options available in the Texas State statutes governing TCDRS (TCDRS Act). Members can retire at ages 60 and above with eight or more years of service, with 20 years of service regardless of age, or when the sum of their age and years of service equals 75 or more. Members are vested after eight years of service but must leave their accumulated deposits in the plan to receive any employer-financed benefit. Members who withdraw their personal deposits in a lump sum and who are not eligible to retire are not entitled to any amounts contributed by their employer. Benefit amounts are determined by the sum of the employees’ deposits to the plan, with interest, and employer-financed monetary credits. The level of these monetary credits is adopted by the governing body of the County within the actuarial constraints imposed by the TCDRS Act, so that the resulting benefits can be expected to be adequately financed by the employer’s commitment to contribute. At retirement, death, or disability, the benefit is calculated by converting the sum of the employee’s accumulated deposits and the employer-financed monetary credits to a monthly annuity using annuity purchase rates prescribed by the TCDRS Act. At December 31, 2017, the following employees were covered by the benefit terms: Inactive employees or beneficiaries currently receiving benefits 2,553 Inactive employees entitled to but not yet receiving benefits 3,282 Active employees 5,362
11,197

Bexar County, Texas NOTES TO BASIC FINANCIAL STATEMENTS
September 30, 2018
90
NOTE N – RETIREMENT PLAN (Continued) Funding Policy The County has elected the Annually Determined Contribution Rate plan provisions of the TCDRS Act. The plan is funded by monthly contributions from both employee members and the employer based on the covered payroll of employee members. Under the TCDRS Act, the contribution rate of the employer is actuarially determined annually. The County contributed using the actuarially determined rate of 13.21% of covered payroll for the months of the calendar year in 2017, and 13.61% of covered payroll for the months of the calendar year in 2018. The deposit rate payable by all employee members for the calendar years 2017 and 2018 is 7% as adopted by the governing body of the County. The employee deposit rate and the employer contribution rate may be changed by the governing body of the employer within the options available in the TCDRS Act. The TCDRS board hires independent outside consulting actuaries to conduct an annual valuation to measure the funding status and to determine the required employer contribution rate for each employer plan. In order to calculate the employer contribution rate, the actuary does the following:
1. Studies each employer’s adopted plan of benefits and the profile of its plan participants, and uses assumptions established by the board to estimate future benefit payments.
2. Discounts the estimate of future benefit payments to the present based on the long-term rate of investment return to determine the present value of future benefits.
3. Compares the present value of future benefits with the plan’s assets to determine the difference that needs to be funded based on the funding policy.
Net Pension Liability The County’s net pension liability was measured as of December 31, 2017, and the total pension liability used to calculate the net pension liability was determined by an actuarial valuation as of that date. The total pension liability in the December 31, 2017 actuarial valuation was determined using the following actuarial assumptions, applied to all periods included in the measurement: Inflation 2.75%
Salary Increases 3.25%
Investment Rate of Return 8.10% Mortality rates for service retirees, as well as the beneficiaries of both service and disability retirees were based on the RP-2014 Healthy Annuitant Mortality Table with an age set forward of one year and Projection Scale AA for Males, and the RP-2014 Combined Female Table with no age adjustment and Projection Scale AA for Females. For disabled retirees, the RP- 2014 Disabled Male Table with no age adjustment and Projection Scale AA for Males, and the RP-2014 Disabled Female Table with an age set forward of two years and Projection Scale AA for Females are used. The actuarial assumptions that determined the total pension liability as of December 31, 2017 were based on the results of an actuarial experience study for the period January 1, 2013 - December 31, 2016, except where required to be different by GASB Statement No.68. The long-term expected rate of return on TCDRS assets is determined by adding expected inflation to expected long-term real returns, and reflecting expected volatility and correlation. The capital market assumptions and information shown below are provided by TCDRS’ investment consultant, Cliffwater LLC. The numbers shown are based on January 2018 information for a 10 year time horizon.

Bexar County, Texas NOTES TO BASIC FINANCIAL STATEMENTS
September 30, 2018
91
NOTE N – RETIREMENT PLAN (Continued) Net Pension Liability (Continued) Note that the valuation assumption for long-term expected return is re-assessed at a minimum of every four years, and is set based on a 30-year time horizon; the most recent analysis was performed in 2017.
Discount Rate/Depletion of Plan Assets The discount rate is the single rate of return that, when applied to all projected benefit payments results in an actuarial present value of projected benefit payments equal to the total of the following:
1. The actuarial present value of benefit payments projected to be made in future periods in which (a) the amount of the pension plan’s fiduciary net position is projected to be greater than the benefit payments that are projected to be made in that period and (b) pension plan assets up to that point are expected to be invested using a strategy to achieve the long-term rate of return, calculated using the long-term expected rate of return on pension plan investments.
2. The actuarial present value of projected benefit payments not included in (1), calculated using the municipal bond rate. Therefore, if plan investments in a given future year are greater than projected benefit payments in that year and are invested such that they are expected to earn the long-term rate of return, the discount rate applied to projected benefit payments in that year should be the long-term expected rate of return on plan investments. If future years exist where this is not the case, then an index rate reflecting the yield on a 20-year, tax-exempt municipal bond should be used to discount the projected benefit payments for those years. The determination of a future date when plan investments are not sufficient to pay projected benefit payments is often referred to as a depletion date projection. A depletion date projection compares projections of the pension plan’s fiduciary net position to projected benefit payments and aims to determine a future date, if one exists, when the fiduciary net position is projected to be less than projected benefit payments. If an evaluation of the sufficiency of the projected fiduciary net position compared to projected benefit payments can be made with sufficient reliability without performing a depletion date projection, alternative methods to determine sufficiency may be applied.
Asset Class Target AllocationGeometric Real Rate of Return
US Equities 11.50% 4.55%Private Equity 16.00% 7.55%Global Equities 1.50% 4.85%International Equities - Developed 11.00% 4.55%International Equities - Emerging 8.00% 5.55%Investment-Grade Bonds 3.00% 0.75%Strategic Credit 8.00% 4.12%Direct Lending 10.00% 8.06%Distressed Debt 2.00% 6.30%REIT Equities 2.00% 4.05%Master Limited Partnerships (MLPs) 3.00% 6.00%Private Real Estate Partnerships 6.00% 6.25%Hedge Funds 18.00% 4.10%

Bexar County, Texas NOTES TO BASIC FINANCIAL STATEMENTS
September 30, 2018
92
NOTE N – RETIREMENT PLAN (Continued) Discount Rate/Depletion of Plan Assets (Continued) In order to determine the discount rate to be used by the employer, TCDRS used an alternative method to determine the sufficiency of the fiduciary net position in all future years. The alternative method reflects the funding requirements under the County’s funding policy and the legal requirements under the TCDRS Act.
1. TCDRS has a funding policy where the Unfunded Actuarial Accrued Liability (UAAL) shall be amortized as a level percent of pay over 20-year closed layered periods.
2. Under the TCDRS Act, the employer is legally required to make the contribution specified in the funding policy.
3. The employer’s assets are projected to exceed its accrued liabilities in 20 years or less. When this point is reached, the employer is still required to contribute at least the normal cost.
4. Any increased cost due to the adoption of a COLA is required to be funded over a period of 15 years, if applicable.
Based on the above, the projected fiduciary net position is determined to be sufficient compared to projected benefit payments. Based on the expected level of cash flows and investment returns to the system, the fiduciary net position as a percentage of total pension liability is projected to increase from its current level in future years. Since the projected fiduciary net position is projected to be sufficient to pay projected benefit payments in all future years, the discount rate for purposes of calculating the total pension liability and net pension liability of the employer is equal to the long-term assumed rate of return on investments. This long-term assumed rate of return should be net of investment expenses, but gross of administrative expenses for GASB Statement No.68 purposes. Therefore, a discount rate of 8.10% was used. This rate reflects the long-term assumed rate of return on assets for funding purposes of 8.00%, net of all expenses, increased by 0.10% to be gross of administrative expenses. Changes in the Net Pension Liability
Primary Government
Total Pension Liability
(a)
Increase (Decrease)
Fiduciary Net Position(b)
Net Pension Liability / (Asset)
(a) - (b)
Balances as of December 31, 2016 1,223,447,992$ 1,057,477,031$ 165,970,961$ Changes for the year:
Service cost 31,847,959 - 31,847,959 Interest on total pension liability 98,279,663 - 98,279,663 Effect of plan changes 1,008,641 - 1,008,641 Effect of economic/demographic gains or losses 1,315,545 - 1,315,545 Effect of assumption changes or inputs 5,389,426 - 5,389,426 Refund of contributions (2,349,767) (2,349,767) - Benefit payments (54,981,287) (54,981,287) - Admnistrative expenses - (791,182) 791,182 Member contributions - 16,875,435 (16,875,435) Net investment income - 152,558,046 (152,558,046) Employer contributions - 32,431,852 (32,431,852) Other - (114,788) 114,788
Balances as of December 31, 2017 1,303,958,172$ 1,201,105,340$ 102,852,832$
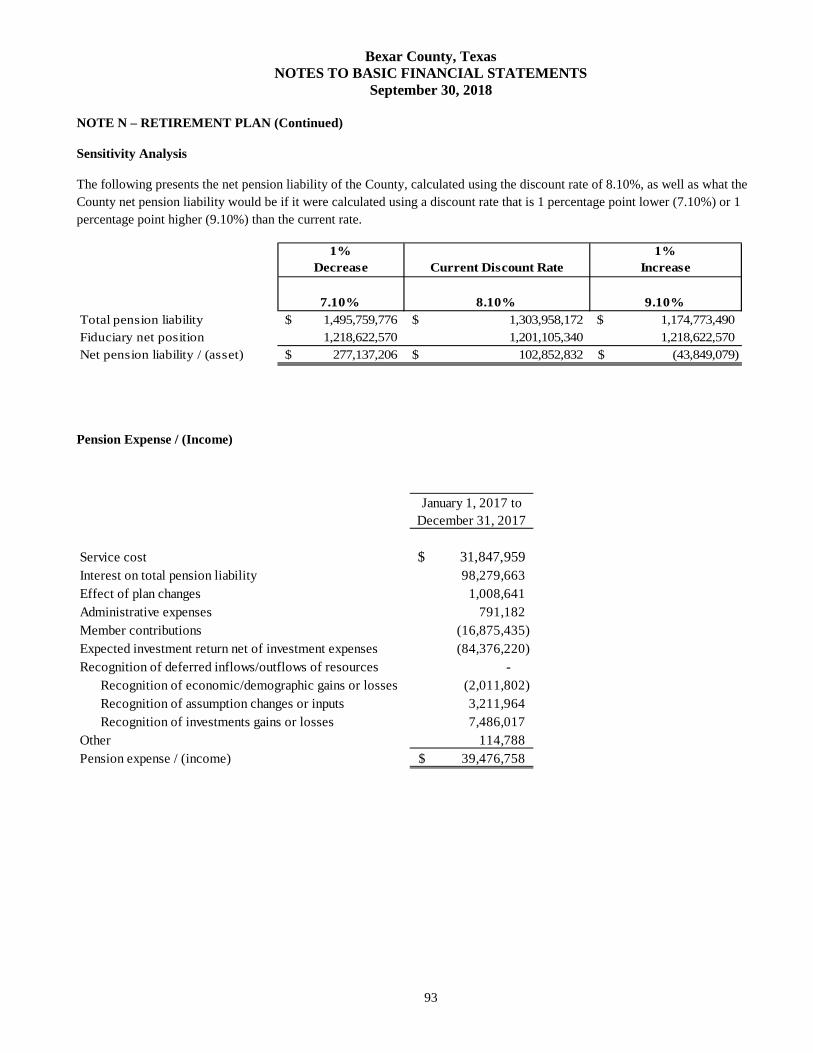
Bexar County, Texas NOTES TO BASIC FINANCIAL STATEMENTS
September 30, 2018
93
NOTE N – RETIREMENT PLAN (Continued) Sensitivity Analysis
The following presents the net pension liability of the County, calculated using the discount rate of 8.10%, as well as what the County net pension liability would be if it were calculated using a discount rate that is 1 percentage point lower (7.10%) or 1 percentage point higher (9.10%) than the current rate.
1% Decrease Current Discount Rate
1%Increase
7.10% 8.10% 9.10%Total pension liability 1,495,759,776$ 1,303,958,172$ 1,174,773,490$ Fiduciary net position 1,218,622,570 1,201,105,340 1,218,622,570 Net pension liability / (asset) 277,137,206$ 102,852,832$ (43,849,079)$
Pension Expense / (Income)
January 1, 2017 toDecember 31, 2017
Service cost 31,847,959$ Interest on total pension liability 98,279,663 Effect of plan changes 1,008,641 Administrative expenses 791,182 Member contributions (16,875,435) Expected investment return net of investment expenses (84,376,220) Recognition of deferred inflows/outflows of resources -
Recognition of economic/demographic gains or losses (2,011,802) Recognition of assumption changes or inputs 3,211,964 Recognition of investments gains or losses 7,486,017
Other 114,788 Pension expense / (income) 39,476,758$

Bexar County, Texas NOTES TO BASIC FINANCIAL STATEMENTS
September 30, 2018
94
NOTE N – RETIREMENT PLAN (Continued) Deferred Inflows / Outflows of Resources
As of December 31, 2017, the deferred inflows and outflows of resources are as follows:
Amounts currently reported as deferred outflows of resources and deferred inflows of resources related to pensions, excluding contributions made subsequent to the measurement date, will be recognized in pension expense as follows:
NOTE O – OTHER POST EMPLOYMENT BENEFITS (OPEB) Primary Government
Plan Description
The County is self-insured for employee and retiree healthcare and maintains two plans: Bexar County Premium PPO Plan and Bexar County Base PPO Plan. Participation in the Plan is elective by each retiree. Healthcare benefits include, but are not limited to, prescription drugs, hospitalization, and preventative care. To be eligible, the retiree must meet the requirements from TCDRS (see note N) and have been enrolled in the County’s Healthcare Plan for the year in which they retire. The OPEB Plan provides medical, dental, vision, and basic life insurance benefits to plan members. The benefits provided are not guaranteed. Additionally, the benefit provisions are subject to change at any time and to annual appropriation of funds by the Commissioners Court. Currently, the County is accounting for OPEB using an internal service fund. A separate financial report for the healthcare plan is not issued.
Summary of Significant Accounting Policies
The Plan's transactions are recorded using the accrual basis of accounting. Plan members’ and employer’s contributions are recognized in the period in which the contributions are due. Benefits and refunds are recognized when due and payable. Investments, if any, are reported at fair value which is the amount the Plan could reasonably expect to receive for it in a current sale between a willing buyer and a willing seller. Fair value, for financial reporting purposes, is measured by the market price unless such prices are not available, in which case, fair value is estimated. The assets of the OPEB plan are not accumulated in a trust, for the sole purpose of the OPEB plan.
Primary Government
Deferred Inflowsof Resources
Deferred Outflowsof Resources
Differences between expected and actual experience 5,641,903$ 1,171,155$ Changes of assumptions - 8,788,979 Net difference between projected and actual earnings 13,899,908 - Contributions made subsequent to measurement date - 26,357,311
19,541,811$ 36,317,446$
Year ended December 31:2018 8,897,429 2019 6,175,545 2020 (12,060,598) 2021 (12,594,053) 2022 -
Thereafter -

Bexar County, Texas NOTES TO BASIC FINANCIAL STATEMENTS
September 30, 2018
95
NOTE O – OTHER POST EMPLOYMENT BENEFITS (Continued) Primary Government (Continued)
Summary of Significant Accounting Policies (Continued)
The County is required by GASB Statement No. 75 to disclose additional information with regard to funding policy, the employer’s annual OPEB cost and contributions made, the funded status and funding progress of the employer’s individual plan, and actuarial methods and assumptions used. This Statement establishes standards for recognizing and measuring liabilities, deferred outflows of resources, deferred inflows of resources, and expense/expenditures.
Employees covered by benefit terms. At October 1, 2016, the following employees were covered by the benefit terms:
Inactive employees or beneficiaries currently receiving benefits 764Incative employees entitled to but not yet receiveding benefits 0Active employees 3,755Total 4,519
Total OPEB Liability
The County’s total OPEB liability of $190,671,163 is reported herein as of September 30, 2018 for the fiscal year and reporting period of October 1, 2017 to September 30, 2018. The values shown for this fiscal year and reporting period are based on a measurement date of October 1, 2017 and the corresponding measurement period of October 1, 2016 to September, 2017. The measurement of the total OPEB liability is based on a valuation date of October 1, 2016.
Funding Policy Commissioner Court has the authority to establish and amend contribution requirements of the plan members and the participation employer. The plan is funded on a pay-as-you-go basis and incurred $4,637,050 in total claims for the fiscal year ended September 30, 2018. The funds to pay these claims are derived from the employer contributions and retiree premiums. The following table presents the monthly premium amounts paid by retirees based on their classification and plan.
Contribution ContributionRetiree Without Medicare per Retiree Retiree With Medicare per Retiree
Premium PPO Plan Premium PPO PlanRetiree 302.54 Retiree N/ARetiree + 1 Dependent 494.46 Retiree + 1 Dependent 333.54Retiree + 2 or More 614.41 Retiree + 2 or More 453.49
Base PPO Plan Base PPO PlanRetiree 302.54 Retiree N/ARetiree + 1 Dependent 442.25 Retiree + 1 Dependent 281.32Retiree + 2 or More 529.43 Retiree + 2 or More 368.50
MAPD Plan MAPD PlanRetiree N/A Retiree 116.38Retiree + 1 Dependent N/A Retiree + 1 Dependent 232.76Retiree + 2 or More N/A Retiree + 2 or More 349.14
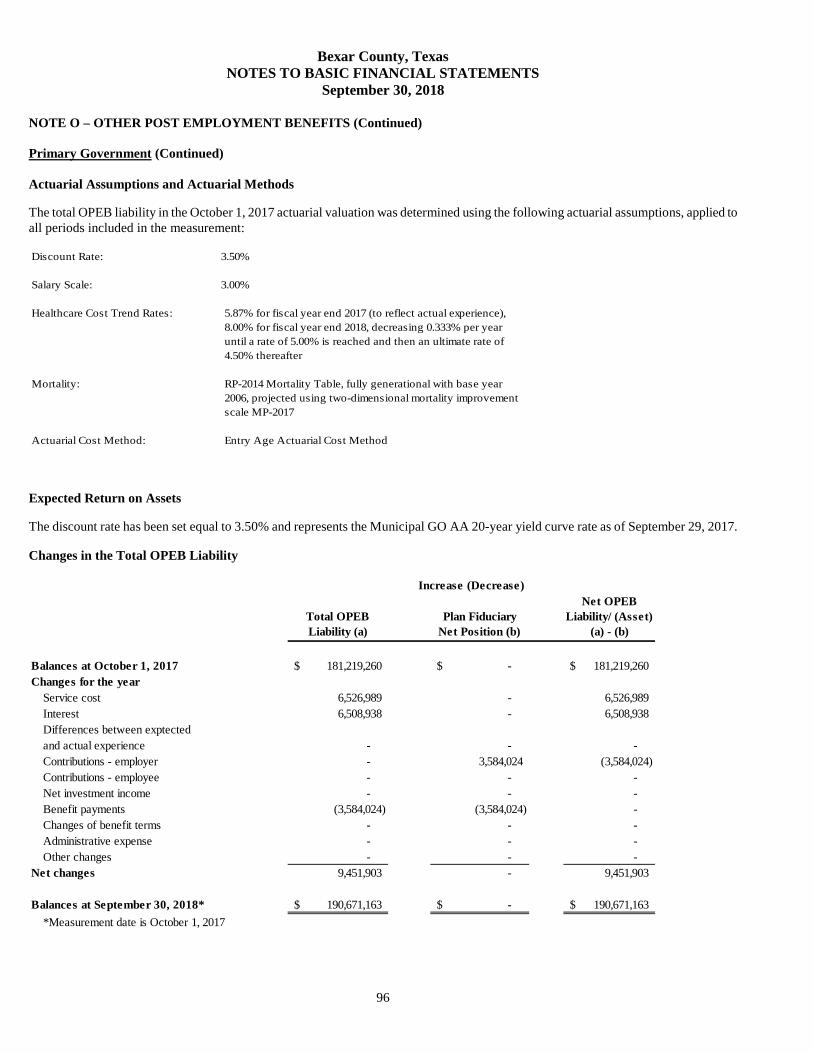
Bexar County, Texas NOTES TO BASIC FINANCIAL STATEMENTS
September 30, 2018
96
NOTE O – OTHER POST EMPLOYMENT BENEFITS (Continued) Primary Government (Continued) Actuarial Assumptions and Actuarial Methods
The total OPEB liability in the October 1, 2017 actuarial valuation was determined using the following actuarial assumptions, applied to all periods included in the measurement:
Discount Rate: 3.50%
Salary Scale: 3.00%
Healthcare Cost Trend Rates: 5.87% for fiscal year end 2017 (to reflect actual experience),8.00% for fiscal year end 2018, decreasing 0.333% per yearuntil a rate of 5.00% is reached and then an ultimate rate of 4.50% thereafter
Mortality: RP-2014 Mortality Table, fully generational with base year2006, projected using two-dimensional mortality improvementscale MP-2017
Actuarial Cost Method: Entry Age Actuarial Cost Method
Expected Return on Assets
The discount rate has been set equal to 3.50% and represents the Municipal GO AA 20-year yield curve rate as of September 29, 2017.
Changes in the Total OPEB Liability
Total OPEB Liability (a)
Plan Fiduciary Net Position (b)
Net OPEB Liability/ (Asset)
(a) - (b)
Balances at October 1, 2017 181,219,260$ -$ 181,219,260$ Changes for the year
Service cost 6,526,989 - 6,526,989 Interest 6,508,938 - 6,508,938 Differences between exptected and actual experience - - - Contributions - employer - 3,584,024 (3,584,024) Contributions - employee - - - Net investment income - - - Benefit payments (3,584,024) (3,584,024) - Changes of benefit terms - - - Administrative expense - - - Other changes - - -
Net changes 9,451,903 - 9,451,903
Balances at September 30, 2018* 190,671,163$ -$ 190,671,163$ *Measurement date is October 1, 2017
Increase (Decrease)

Bexar County, Texas NOTES TO BASIC FINANCIAL STATEMENTS
September 30, 2018
97
NOTE O – OTHER POST EMPLOYMENT BENEFITS (Continued) Primary Government (Continued) Sensitivity of the net OPEB liability to changes in the discount rate. The following presents the net OPEB liability/ (asset) of the employer as of the measurement date calculated using the discount rate, as well as what the employer’s net OPEB liability would be if it were calculated using a discount rate that is 1-percentage-point lower or 1-percentage-point higher than the current rate:
1% Decrease Current
Discount Rate 1% IncreaseEmployer's Net OPEB Liability/ (Asset) 228,867,278$ 190,671,163$ 161,177,260$
Sensitivity of the net OPEB liability to changes in the Trend rate. The following presents the net OPEB liability/ (asset) of the employer as of the measurement date calculated using the Health trend rate, as well as what the employer’s net OPEB liability would be if it were calculated using a discount rate that is 1-percentage-point lower or 1-percentage-point higher than the current rate:
1% Decrease Current
Discount Rate 1% IncreaseEmployer's Net OPEB Liability/ (Asset) 158,091,748$ 190,671,163$ 233,311,360$
OPEB Expense and Deferred Outflows of Resources and Deferred Inflows of Resources Related to OPEB
For the year ended September 30, 2018, under GASB 75 the County’s OPEB expense is $13,035,927. The Deferred Outflows of Resources and Deferred Inflows of Resources related to OPEB as of September 30, 2018 from various sources are as follows:
Deferred Outflows of Resources
Deferred Inflows of Resources
Differences between expected and actual experience -$ -$ Changes of assumptions - - Net differnece between projected and actual
earnings on OPEB plan investments - - Employer contributions after Measurement Date 4,637,050 -
but prior to fiscal year endTotal 4,637,050$ -$
Amounts reported as deferred outflows of resources and deferred inflows of resources related to OPEB will be recognized in OPEB expense as follows:
Year ended September 30: Amount:2019 -$ 2020 - 2021 - 2022 - 2023 -

Bexar County, Texas NOTES TO BASIC FINANCIAL STATEMENTS
September 30, 2018
98
NOTE O – OTHER POST EMPLOYMENT BENEFITS (Continued)
Primary Government (Continued)
Additional Disclosures
Texas Local Government Code, Chapter 175 allows counties to make available continued health benefits coverage under certain circumstances to retirees and their dependents beyond the end of an individual's employment with the County ("Continuation Coverage") by permitting covered employees to purchase continued health benefits coverage in retirement. Texas Law does not require counties to fund all or any portion of such coverage.
Because the County is given the authority to pay OPEB for its retired employees, it may incur a debt obligation to pay for OPEB so long as the County follows the constitutional requirement that it have sufficient taxing authority available at the time such debt is incurred to provide for the payment of the debt and has in fact levied a tax for such purpose concurrently with the incurrence of the debt. Any debt incurred in contravention of this constitutional requirement is considered void and payment will not be due. The County has not incurred a legal debt obligation for OPEB and has not levied a tax for the same. The County funds the cost associated with OPEB on a current “pay as you go” basis for a single fiscal year through an annual appropriation authorized by Commissioners Court during the County’s annual budget adoption process. GASB Statement No. 75 requires governmental organizations to recognize an actuarially calculated accrued liability for OPEB, even though it may not have a legally enforceable obligation to pay OPEB benefits. Accordingly, information and amounts presented in the County’s Comprehensive Annual Financial Report relative to OPEB expense/expenditures, related liabilities (assets), note disclosures, and supplementary information are only intended to achieve compliance with the requirements of generally accepted accounting principles and does not constitute or imply that the County has made a commitment or is legally obligated to provide the OPEB benefit. NOTE P – CONDUIT DEBT Primary Government The component unit, Bexar County Housing Finance Corporation (BCHFC), is authorized to finance residential housing by issuing its tax-exempt revenue bonds to acquire mortgage loans made to low or moderate income persons, and to pledge such mortgage loans as security for the payment of the principal and interest of such revenue bonds. The tax-exempt bonds issued by the BCHFC do not constitute a debt or a pledge of faith or credit of the BCHFC or the County, but are payable by the user pursuant to terms defined in the loan agreement underlying each issue. At September 30, 2018, the aggregate amount of conduit debt outstanding was $181,545,680. The component unit, Bexar County Health Facilities Development Corporation (BCHFDC), is authorized to acquire, construct, provide, improve, finance, and refinance health facilities to assist the maintenance of the public health by issuing its tax-exempt revenue bonds. The bonds are secured by the property financed. The tax-exempt bonds issued by the BCHFC do not constitute a debt or a pledge of faith or credit of the BCHFDC or the County, but are payable by the user pursuant to terms defined in the loan agreement underlying each issue. At September 30, 2018, the aggregate amount of conduit debt outstanding was $41,400,000.

Bexar County, Texas NOTES TO BASIC FINANCIAL STATEMENTS
September 30, 2018
99
NOTE Q – COMMITMENTS AND CONTINGENCIES Primary Government The County is committed under various contracts in connection with the renovation of the detention facilities and certain other County buildings, road and bridge improvements, flood control projects, and parks and recreational improvements. These commitments are $98,035,738. The Bexar County Housing Finance Corporation is committed to grant awards made to various agencies to aid in various housing development activities. Amounts committed at September 30, 2018 by the Corporation are $268,487 for grant commitments. In addition, the Corporation has designated $150,000 for administrative reserve. The Bexar County Health Facilities Development Corporation’s purpose is to acquire, construct, provide, improve, finance, and refinance health facilities to assist the maintenance of the public health. At September 30, 2018, the Corporation has designated $100,000 for administrative reserve. There are various lawsuits outstanding against the County at September 30, 2018 involving claims relating to jail, civil rights, and various other matters. A provision has been recorded for these contingencies in the Internal Services Fund for which the range of loss is estimated between $300,000 and $1,915,702. The County participates in several state and federal grant programs, which are governed by various rules and regulations of the grantor agencies. Costs charged to the respective grant programs are subject to audit and adjustment by the grantor agencies; therefore, to the extent that the County has not complied with the rules and regulations governing the grants, refunds of any money received may be required, and the collectability of any related receivable may be impaired. In the opinion of management, there are no significant contingent liabilities relating to compliance with the rules and regulations governing the respective grants; therefore, no provision has been recorded in the accompanying financial statements for such contingencies. During the fiscal year ended September 30, 2016, the County and the Deputy Sheriff’s Association of Bexar County executed a collective bargaining agreement effective from May 12, 2016 through September 30, 2020. The total estimated cumulative cost of the agreement over the three-year contact period is $42.6 million. The System The System is, from time to time, subject to allegations that may or do result in litigation. Some of these allegations are in areas not covered by the System’s self-insurance program or by commercial insurance; for example, allegations regarding employment practices or performance of contracts. The System evaluates such allegations by conducting investigations to determine the validity of each potential claim. Based upon the advice of legal counsel, management records an estimate of the amount of ultimate expected loss, if any, for each. Events could occur that would cause the estimate of ultimate loss to differ materially in the near term. The District As inducement for the development of the resort hotel, spa, and golf courses (the Project), the District agreed to grant to the Developer a development grant to be used as partial payment of the costs borne by the Developer in completing the Project. Under this amended agreement, the Project owner assigned its right to the Developer to receive, on a subordinate basis, available hotel and resort sales and use tax collections (development grant), after ten consecutive annual payments (senior HOT and sales tax grants) are made to the Project owner in an amount equal to the annual ad valorem tax it paid to the District. Monthly payments are required if hotel and resort sales and use tax collections are available. Bonds secured by sales and use tax revenues may be issued to pay the Developer in lieu of the monthly payments. The monthly payments under this agreement are dependent on several factors; such as, the amount of hotel and resort sales and use tax generated, and the ad valorem taxes imposed on the Project

Bexar County, Texas NOTES TO BASIC FINANCIAL STATEMENTS
September 30, 2018
100
NOTE Q – COMMITMENTS AND CONTINGENCIES (Continued) The District (Continued) owners. During the year, the District paid $465,000 in economic development expenses to the Developer, where $234,200 was applied to principal and $230,800 to interest. NOTE R – SUBSEQUENT EVENTS Governmental Activities
In December 2018, the County issued $198,035,000 in Combination Tax and Revenue Certificates of Obligation, Series 2018 at a premium of $18,640,750 with the payments of the related principal and interest to be made from an annual ad valorem tax levied against all taxable property within the County. Proceeds from the sale of the Series 2018 Certificates will be used for making permanent public improvements and for other public purposes, to-wit: designing, acquiring, constructing, renovating, improving and equipping the Bexar County Courthouse, Bexar County Jail, the “old” Bexar County Jail, Bexar County Adult Detention Facilities (Annex and Detention Center), Bexar County Juvenile Detention Facilities, Justice of the Peace/Constable Facilities, Forensic Science Center, Technology Centers, Bexar County Crime Lab, Bexar County Sheriff’s Department law enforcement facilities, Bexar County Justice Center, Bexar County District Court Facilities, Bexar County Data Center, Bexar County Public Works Facility, and other Bexar County-owned administrative facilities, recreational facilities, mental health services facilities, library facilities, and civil and criminal justice facilities; acquiring computer hardware and software and other technology (including information technology system and network upgrades and improvements), communication, and audio/visual equipment and the payment of professional fees related thereto, including the County-wide Integrated Justice System and Financial Management System; acquiring, constructing, renovating, improving, and equipping parks and recreational facilities and the purchase of park vehicles; acquiring vehicles and equipment for various County offices and departments; designing, constructing, repairing, and improving County roads (including utilities relocation and related bridge and drainage improvements); designing, acquiring, and constructing and equipping parking facilities; acquiring materials, supplies, equipment, machinery, land, easements, right-of-way and other interests in real property for authorized needs and purposes relating to any of the foregoing purposes; and the payment of professional services related to the design, construction, project management, and financing of the aforementioned projects. The annual interest rate on the bonds ranges from 4.00% - 5.00%. Interest accrues semiannually and the bonds mature in fiscal year 2045. NOTE S – FUND AND NET POSITION Net Position Classifications Net position in the proprietary fund financial statements and the government-wide financial statements are classified in three categories: 1) Net investment in capital assets, 2) Restricted net position, and 3) Unrestricted net position. Fund Balance Classifications Under GAAP, fund balance is divided into five classifications based upon the extent to which the County is bound to observe constraints imposed upon the use of the resources in the governmental funds. The classifications are as follows: Nonspendable -The nonspendable fund balance category includes amounts that cannot be spent because they are not in spendable form, or they are legally or contractually required to be maintained intact. The “not in spendable form” criterion includes items that are not expected to be converted to cash. It also includes the long-term amount of interfund loans. Restricted - Fund balance is reported as restricted when constraints placed on the use of resources are either externally imposed by creditors, grantors, constitutional provisions or enabling legislation. Enabling legislation authorizes the County to assess, levy, charge, or otherwise mandate payment of resources and includes a legally enforceable requirement that those resources be used only for the specific purposes stipulated in the legislation. Legal enforceability means that the County can be compelled by an external party such as citizens, public interest groups, or the judiciary to use resources created by enabling legislation only for the purposes specified by the legislation.

Bexar County, Texas NOTES TO BASIC FINANCIAL STATEMENTS
September 30, 2018
101
NOTE S – FUND AND NET POSITION (Continued) Committed -The committed fund balance classification includes amounts that can be used only for specific purposes imposed by formal action such as a resolution of Commissioners Court. Those committed amounts cannot be used for any other purpose unless Commissioners Court removes or changes the specified use by taking the same type of action it employed to previously commit those amounts. In contrast to fund balance that is restricted by enabling legislation, committed fund balance classification may be redeployed for other purposes with appropriate due process. Constraints imposed on the use of committed amounts are imposed by Commissioners Court, separate from the authorization to raise the underlying revenue; therefore, compliance with these constraints is not considered to be legally enforceable. Committed fund balance also incorporates contractual obligations to the extent that existing resources in the fund have been specifically committed for use in satisfying those contractual requirements. Assigned - Amounts in the assigned fund balance classification are intended to be used by the County for specific purposes but do not meet the criteria to be classified as restricted or committed. Such intent should be expressed by Commissioners Court or its designated officials to assign amounts to be used. The County Manager, by virtue of appointment to that office and as a normal function of that office, has the authority to assign fund balance to particular purposes. Assignments made by the County Manager can occur during the budget process or throughout the year in the normal course of business. Commissioners Court, at their discretion, may make assignments of fund balance or direct other County officials to do so. Constraints imposed on the use of the assigned amounts can be removed with no formal action. Unassigned - The unassigned fund balance is the residual classification for the general fund and includes all spendable amounts not contained in the other classifications. In other governmental funds, the unassigned classification is used only to report a deficit balance resulting from overspending for specific purposes for which amounts had been restricted, committed, or assigned. The remainder of this page intentionally left blank

Bexar County, Texas NOTES TO BASIC FINANCIAL STATEMENTS
September 30, 2018
102
NOTE S – FUND AND NET POSITION BALANCES (Continued) Fund balances by classification as of September 30, 2018 pursuant to GASB No. 54 are as follows:
General Fund Debt Service Capital Projects Special Revenue
Funds
Total Governmental
Funds Fund balances:
Nonspendable:Long-term receivable 4,840,184$ -$ -$ -$ 4,840,184$ Prepaid Assets 21,174 - - - 21,174 Inventories 316,393 - - - 316,393
Restricted for: - Debt service - 81,935,785 - - 81,935,785 Courthouse facilities - - 2,069,883 2,069,883 Roads and Bridges - - 9,576,798 - 9,576,798 Advanced Transportation District - - 77,715,352 - 77,715,352 Flood projects - - 220,474,057 - 220,474,057 Other capital projects - - 127,644,902 - 127,644,902 County Clerk Records Management - - - 28,014,461 28,014,461 County Records Management - - - 173,013 173,013 Courthouse Security - - - 5,386 5,386 Justice of Peace Technology - - - 168,008 168,008 Fire Code - - - 5,363,050 5,363,050 District Clerk Records Management - - - 384,265 384,265 Law Library - - - 57,620 57,620 County Wide Court Technology - - - 146,113 146,113 Dispute Resolution - - - 100,965 100,965 Justice of Peace Security - - - 572,593 572,593 Domestic Relations - - - 3 3 Probate Contribution - - - 386,849 386,849 LEOSE - - - 229,814 229,814 Child Abuse Prevention - - - 13,515 13,515 Drug Court Program - - - 11,388 11,388 District Court Records Technology - - - 113,260 113,260 Juvenile Case Manager - - - 9,956 9,956 Probate Guardianship - - - 202,281 202,281 Probate Education - - - 276,626 276,626 Juvenile Delinquency Prevention - - - 27,837 27,837 Grants - - - 12,552,709 12,552,709 Stormwater Mitigation - - - 7,056,008 7,056,008 Chapter 19 Voter Registration - - - 1,125 1,125 Election Contracting Services - - - 461,767 461,767 Tax Collector's Account Special Inventory - - - 13,682 13,682 District Attorney Programs - - - 548,091 548,091 Asset Forfeitures - - - 4,389,773 4,389,773 Housing Finance Corp - - - 1,855,684 1,855,684 Health Facilities Development Corp - - - 230,894 230,894 Industrial Development Corp - - - 1,779 1,779
Committed to:Technology Improvement - - - 920,864 920,864
Assigned: - - - - - Unassigned: 87,977,792 - - - 87,977,792
Total fund balances 93,155,543$ 81,935,785$ 437,480,992$ 64,289,379$ 676,861,699$
Major Funds

103
NOTE S – FUND AND NET POSITION BALANCES (Continued) The County applies restricted resources first when expenditures are incurred for purposes for which either restricted or unrestricted (committed, assigned, and unassigned) amounts are available. Similarly, within unrestricted fund balance, committed amounts are reduced first followed by assigned, and then unassigned amounts when expenditures are incurred for purposes for which amounts in any of the unrestricted fund balance classifications could be used. The County maintains a minimum fund balance reserve policy to maintain strong financial reserves and stability and to protect the County’s bond ratings. Key components of the reserve policy are as follows:
• Commissioners Court has set a policy to maintain a General Fund operating reserve of 15% of budgeted, annual, operating expenditures. The policy establishes sufficient working capital and margin of financial safety to address unforeseen, one-time emergency expenditures.
• Use of this reserve would occur after all other current budgetary resources of funding have been exhausted, and no other
category of fund balance is available to satisfy the funding needed. Commissioners Court authorization is required for fund balance to be appropriated from the Unassigned General Fund Reserve.
At September 30, 2018, the OPEB Fund (an internal service fund), the Self-Insurance Fund (an internal service fund), the Fleet Maintenance Fund (an internal service fund), and the Community Venue Fund (an enterprise fund) had deficit net positions of $184,278,339, $3,972,120, $41,993 and $61,864,777, respectively. Pursuant to GASB 75, a liability for other postemployment benefits obligations, knows as the net OPEB liability, is to be recognized on the balance sheets of participating employers. Changes in the net OPEB liability from year-to-year will be recognized as OPEB expense on the Statement of Activities and Statement of Revenues, Expenses, and Changes in Net Position or reported as deferred outflows/inflows of the resources depending on the type of change. Deferred inflows/outflows of resources are amounts that are not entirely recognized when they occur. They are recognized over a period of time. Therefore, the beginning net position on the following statements has been restated to reflect the deferred outflows of resources and the net OPEB liability that were incurred in prior years:
The OPEB Fund deficit is due to the accrual of the OPEB obligation. See Note O for more information. The County anticipates that a portion of the deficit in the OPEB Fund will be offset by revenue enhancements and expenditure reductions through changes to the County’s health plans and adjustments to health insurance premiums. In addition, the County will continue to transfer funds from the General Fund. The deficit balance in the Self-Insurance Fund is due to an increase in healthcare costs which correspond to a nationwide projected increase for the year ended September 30, 2018. For fiscal year 2018 County Commissioners increased the premiums for the Premium Preferred Provider Organization Plan and Base Preferred Provider Organization Plan to offset the increase in healthcare costs. The deficit balance in the Fleet Maintenance Fund is due to an increase in personnel costs. The deficit balance in the Community Venue Fund is primarily attributed to expenses for assets owned by other entities. The County issues bonds to finance these projects that do not get capitalized on the fund’s financial statements. The net effect of these transactions leaves a liability balance on the fund’s financial statements for the bonds the County is still obligated to pay. The total balance for
Governmental Activities
Net position - beginning 464,059,283$ Deferred outflows of resources 6,698,581 Net OPEB liability (109,680,057) Net position - restated 361,077,807$
Statement of Activities
Internal ServiceNet position - beginning (71,931,312)$ Deferred outflows of resources 6,698,581 Net OPEB liability (109,680,057) Net position - restated (174,912,788)$
Statement of Revenues, Expenses and Changes in Net Position

104
NOTE S – FUND AND NET POSITION BALANCES (Continued) expenses on assets owned by other entities is $215,367,813 at September 30, 2018. See Table 19 in the Statistical Section for detailed balances. NOTE T – JOINT VENTURES San Antonio Bexar County Soccer Public Facility Corporation (SABC PFC) was created in fiscal year 2016 as a joint venture between the County and the City of San Antonio to own Toyota Field, a professional soccer stadium. The SABC PFC is governed by a four member board comprised of two appointees from the County and two from the City. The County contributed $9,700,000 and whereas the City contributed $9,500,000 to SABC PFC; both the County and the City have an ongoing financial interest in SABC PFC. SABC PFC has entered into a lease with San Antonio Football Club Management (SA FC) for the use of Toyota Field for a term of 20 years at an annual lease rental of $100,000. As part of this agreement, there is a provision requiring reimbursement to the County and City of a combined $5,000,000 should no MLS franchise be awarded to SA FC. In future years, the financial statements can be obtained at the SABC PFC office at: 100 Military Plaza, San Antonio, TX 78205. NOTE U – TAX ABATEMENT PROGRAM
The County enters into property tax abatement agreements with businesses under the Property Redevelopment and Tax Abatement Act. Under this Act, the County may grant property tax abatements on ad valorem taxes for personal and/or real property as an economic development incentive for attracting and/or retaining businesses in order to create jobs and increase the tax base. Commitments under the tax abatement agreements include certain employment and capital investment levels. If the employment and/or capital investment level commitments are not met, taxes previously abated are subject to recapture by the County. For the fiscal year ended September 30, 2018, the County abated property taxes totaling $2,054,563 under this program, including the following tax abatement agreements that each exceeded $100,000 of the total amount abated:
• A 60 percent real property tax abatement to a residential apartment complex for capital investment in central Bexar County. The personal and property taxes abated for the fiscal year ended September 30, 2018 were $124,468.
• A 75 percent personal and real property tax abatement to a retail store chain for the construction of a distribution center in east Bexar County. The personal and property taxes abated for the fiscal year ended September 30, 2018 were $251,514.
• A 100 percent personal and real property tax abatement to a financial services company for the construction of a regional corporate campus in west Bexar County. The personal and property taxes abated for the fiscal year ended September 30, 2018 were $154,051.
• A 100 percent personal property tax abatement to a manufacturer of vehicles for the production of a specific type of vehicle. The personal property taxes abated for the fiscal year ended September 30, 2018 were $392,041.
NOTE V – INNER CITY CLINIC
The County has entered into an agreement with The Center for Health Care Services to build a multi-facility campus named the Inner City Center. The Inner City Center shall be owned by the County but shall be operated by the Center. The County has agreed to provide to the Center funding of up to approximately $23,000,000 to support the development and construction of the Inner City Center. This amount is a portion of the funding necessary to construct the Inner City Center and represents the proceeds received by the County through the issuance and sale of Combination Tax and Revenue Certificates of Obligation, Series 2016A. As of September 30, 2018, the County has provided $16,675,660 as its share of the funding for the construction of the Inner City Center. As of August 31, 2018, the Center has invested $15,098,563 toward the overall project development. Construction is anticipated to be substantially complete by the calendar year end in 2018. These costs have been capitalized and recorded as assets in each party’s respective financial statements. In consideration of the County’s agreement to finance the Inner City Center with the Obligations, the Center shall be obligated to pay the County for debt service on the Obligations. Since the County will benefit from the operation of the mental health services at the Inner City Center for the County’s Substance Use Jail Diversion Program and Youth Services Program, the County may, at its sole discretion, choose annually to offset all or any portion of the scheduled annual rental payments with in-kind services provided at the Inner City Clinic. Through fiscal year 2018, the Center was required to make a $2,590,400 rental payment in accordance with the Schedule of Annual Rental Payments; however, since $885,449 was provided in such in-kind services through September 30, 2018, a receivable for the difference, in the amount of $1,704,951 was recorded in the County’s financial statements.

105
The Alamo Photo by Robert Parker
Https://robert-parker.smugmug.com

106
This page intentionally left blank

107
Original Budget Final Budget Actual Amount Variance
REVENUESAd valorem taxes
Current 336,080,000$ 336,080,000$ 336,610,054$ 530,054$
Delinquent 2,000,000 2,000,000 1,295,430 (704,570)
Penalty and interest 1,975,070 1,975,070 2,162,793 187,723
Gross 340,055,070 340,055,070 340,068,277 13,207
- TIFs (3,800,000) (3,800,000) (3,592,409) 207,591
Net ad valorem taxes 336,255,070 336,255,070 336,475,868 220,798
Other taxes, licenses and permits 28,286,500 28,286,500 28,243,732 (42,768)
Intergovernmental revenues 7,590,185 7,590,185 9,002,943 1,412,758
Court cost and fines 15,140,000 15,140,000 14,498,101 (641,899)
Fees on motor vehicles 6,158,600 6,158,600 6,048,070 (110,530)
Other fees 24,640,475 24,640,475 25,768,778 1,128,303
Commissions from governmental units 5,071,619 5,071,619 5,041,751 (29,868)
Revenues from use of assets 18,302,200 18,302,200 18,326,513 24,313
Sales, refunds and miscellaneous 3,891,500 3,891,500 4,771,769 880,269
TOTAL REVENUES 445,336,149 445,336,149 448,177,525 2,841,376
EXPENDITURES
GENERAL GOVERNMENTCommissioners Court
Personnel cost 1,937,293 2,137,150 2,137,150 -
Remuneration for services 13,400 15,926 15,892 34
Operational costs 40,115 42,724 42,646 78
Supplies and materials 15,139 9,931 9,451 480
Total Commissioners Court 2,005,947 2,205,731 2,205,139 592
County Clerk
Personnel costs 7,832,167 7,848,630 7,848,628 2
Remuneration for services 7,370 7,370 6,798 572
Operational costs 153,626 153,626 133,074 20,552
Supplies and materials 228,500 212,037 177,442 34,595
Total County Clerk 8,221,663 8,221,663 8,165,942 55,721
(continued)
Bexar County, TexasGENERAL FUND
SCHEDULE OF REVENUES, EXPENDITURES AND CHANGES IN FUND BALANCEBUDGET AND ACTUAL
For Fiscal Year Ended September 30, 2018

108
Original Budget Final Budget Actual Amount Variance
County Auditor
Personnel costs 5,071,489 5,094,389 5,094,383 6
Remuneration for services 22,455 22,455 22,389 66
Operational costs 49,461 49,461 48,682 779
Supplies and materials 47,546 47,546 47,280 266
Total County Auditor 5,190,951 5,213,851 5,212,734 1,117
Information Technology
Personnel costs 12,952,508 12,952,508 11,610,794 1,341,714
Remuneration for services 212,000 212,000 203,708 8,292
Operational costs 9,230,712 9,230,712 8,608,680 622,032
Supplies and materials 251,000 262,739 205,090 57,649
Capital expenditures 20,000 8,261 - 8,261
Total Information Technology 22,666,220 22,666,220 20,628,272 2,037,948
Tax Assessor-Collector
Personnel costs 11,028,229 11,321,169 11,321,166 3
Remuneration for services 27,000 27,000 23,524 3,476
Operational costs 814,106 738,872 733,162 5,710
Supplies and materials 645,128 574,228 569,728 4,500
Capital expenditures 20,000 31,945 31,873 72
Total Tax Assessor-Collector 12,534,463 12,693,214 12,679,453 13,761
Purchasing
Personnel costs 1,251,517 1,251,517 1,237,952 13,565
Remuneration for services 14,211 14,211 11,635 2,576
Operational costs 85,310 85,310 79,123 6,187
Supplies and materials 17,900 17,900 15,407 2,493
Total Purchasing 1,368,938 1,368,938 1,344,117 24,821
County Manager
Personnel costs 1,055,008 1,117,100 1,117,100 -
Remuneration for services 12,000 14,950 14,943 7
Operational costs 58,956 44,656 44,449 207
Supplies and materials 10,650 4,450 3,871 579
Total County Manager 1,136,614 1,181,156 1,180,363 793
Budget
Personnel costs 778,153 817,441 817,440 1
Remuneration for services 15,000 17,500 16,022 1,478
Operational costs 8,408 7,408 6,272 1,136
Supplies and materials 10,000 8,500 5,980 2,520
Total Budget 811,561 850,849 845,714 5,135
Bexar County, TexasGENERAL FUND
SCHEDULE OF REVENUES, EXPENDITURES AND CHANGES IN FUND BALANCEBUDGET AND ACTUAL
For Fiscal Year Ended September 30, 2018

109
Original Budget Final Budget Actual Amount Variance
Management and Finance
Personnel costs 648,760 667,078 667,076 2
Remuneration for services 6,000 7,078 7,077 1
Operational costs 18,953 24,310 24,309 1
Supplies and materials 15,300 3,599 3,565 34
Total Management and Finance 689,013 702,065 702,027 38
Human Resources
Personnel costs 1,009,274 1,041,811 1,041,809 2
Remuneration for services 10,000 8,828 8,827 1
Operational costs 303,483 287,898 287,897 1
Supplies and materials 44,800 29,020 28,911 109
Total Human Resources 1,367,557 1,367,557 1,367,444 113
Elections
Personnel costs 1,710,070 1,710,070 1,659,969 50,101
Remuneration for services 3,050 3,050 1,104 1,946
Operational costs 1,540,454 1,726,862 1,316,041 410,821
Supplies and materials 479,250 526,064 526,061 3
Capital expenditures 25,000 25,000 - 25,000
Total Elections 3,757,824 3,991,046 3,503,175 487,871
Economic Development
Personnel costs 1,932,303 2,179,249 1,784,168 395,081
Remuneration for services 31,818 36,886 32,511 4,375
Operational costs 149,977 151,177 91,959 59,218
Supplies and materials 48,050 48,948 47,138 1,810
Total Economic Development 2,162,148 2,416,260 1,955,776 460,484
Facilities Management - Administration and Facilities Improvement Maintenance Program and Mail Room
Personnel costs 1,294,040 1,373,857 1,373,857 -
Remuneration for services 10,504 10,504 8,436 2,068
Operational costs 709,889 900,189 795,751 104,438
Supplies and materials 140,481 233,689 224,086 9,603
Capital expenditures 514,706 21,508 21,507 1
Total Facilities Management - Administration and Facilities Improvement Maintenance Program and Mail Room 2,669,620 2,539,747 2,423,637 116,110
Facilities Management - County Buildings
Personnel costs 1,575,990 1,575,990 1,482,519 93,471
Remuneration for services 12,380 12,380 12,014 366
Operational costs 2,948,475 2,652,544 2,555,541 97,003
Supplies and materials 266,646 276,446 228,328 48,118
Total Facilities Management - County Buildings 4,803,491 4,517,360 4,278,402 238,958
(continued)
BUDGET AND ACTUALFor Fiscal Year Ended September 30, 2018
Bexar County, TexasGENERAL FUND
SCHEDULE OF REVENUES, EXPENDITURES AND CHANGES IN FUND BALANCE

110
Original Budget Final Budget Actual Amount Variance
County Wide
Personnel costs 3,079,465 3,755,917 966,045 2,789,872
Remuneration for serives 15,000 15,000 4,633 10,367
Operational costs 26,873,296 27,654,374 26,206,286 1,448,088
Supplies and materials 182,150 182,150 133,359 48,791
Total County Wide 30,149,911 31,607,441 27,310,323 4,297,118
TOTAL GENERAL GOVERNMENT 99,535,921 101,543,098 93,802,518 7,740,580
JUDICIAL
Criminal District Attorney
Personnel costs 34,829,649 36,000,828 36,000,828 -
Remuneration for services 100,500 94,943 94,942 1
Operational costs 505,086 486,713 486,708 5
Supplies and materials 387,162 405,079 405,078 1
Total Criminal District Attorney 35,822,397 36,987,563 36,987,556 7
Central Magistration - District Clerk
Personnel costs 1,265,794 1,284,436 1,284,435 1
Operational costs 18,610 14,810 14,802 8
Supplies and materials 25,825 25,825 25,340 485
Total Central Magistration - District Clerk 1,310,229 1,325,071 1,324,577 494
Central Magistration - Criminal District Courts
Personnel costs 677,556 701,177 701,176 1
Remuneration for services 3,600 3,600 - 3,600
Operational costs 3,896,211 3,872,590 3,819,547 53,043
Supplies and materials 1,500 1,500 - 1,500
Total Central Magistration - District Courts 4,578,867 4,578,867 4,520,723 58,144
Trial Expenses
Remuneration for services - 2,294 2,294 -
Operational costs 1,837,054 1,943,374 1,943,373 1
Supplies and materials 195,182 194,198 194,198 -
Total Trial Expenses 2,032,236 2,139,866 2,139,865 1
District Clerk
Personnel costs 9,609,311 9,749,134 9,749,134 -
Remuneration for services 9,154 9,154 7,040 2,114
Operational costs 105,264 84,264 81,096 3,168
Supplies and materials 284,353 284,353 278,937 5,416
Capital expenditures 75,321 58,321 58,216 105
Total District Clerk 10,083,403 10,185,226 10,174,423 10,803
GENERAL FUNDSCHEDULE OF REVENUES, EXPENDITURES AND CHANGES IN FUND BALANCE
BUDGET AND ACTUALFor Fiscal Year Ended September 30, 2018

111
Original Budget Final Budget Actual Amount Variance
Jury Operations
Personnel costs 546,846 565,049 565,049 -
Remuneration for services 4,540 4,540 3,939 601
Operational costs 1,111,682 1,093,240 1,057,379 35,861
Supplies and materials 137,000 137,239 137,239 -
Total Jury Operations 1,800,068 1,800,068 1,763,606 36,462
County Courts at Law
Personnel costs 6,962,439 7,081,610 7,081,610 -
Remuneration for services 21,186 16,800 16,800 -
Operational costs 2,467,237 2,643,395 2,643,395 -
Supplies and materials 34,000 32,741 32,741 -
Total County Courts at Law 9,484,862 9,774,546 9,774,546 -
Probate Courts
Personnel costs 1,563,046 1,624,650 1,624,649 1
Operational costs 131,116 143,401 143,401 -
Supplies and materials 2,500 2,500 2,465 35
Total Probate Courts 1,696,662 1,770,551 1,770,515 36
Justices of the Peace, Precinct 1
Personnel costs 1,317,808 1,377,405 1,377,405 -
Remuneration for services 6,750 2,962 2,961 1
Operational costs 17,026 12,246 12,245 1
Supplies and materials 23,200 25,872 25,870 2
Total Justices of the Peace, Precinct 1 1,364,784 1,418,485 1,418,481 4
Justices of the Peace, Precinct 2
Personnel costs 930,325 950,206 950,206 -
Remuneration for services 4,500 5,505 5,504 1
Operational costs 285,825 270,828 270,828 -
Supplies and materials 34,550 33,568 33,568 -
Total Justices of the Peace, Precinct 2 1,255,200 1,260,107 1,260,106 1
Justices of the Peace, Precinct 3
Personnel costs 923,083 944,321 944,320 1
Remuneration for services 4,500 5,304 5,302 2
Operational costs 178,298 190,424 190,423 1
Supplies and materials 36,100 24,272 24,268 4
Total Justices of the Peace, Precinct 3 1,141,981 1,164,321 1,164,313 8
(continued)
For Fiscal Year Ended September 30, 2018
Bexar County, TexasGENERAL FUND
SCHEDULE OF REVENUES, EXPENDITURES AND CHANGES IN FUND BALANCEBUDGET AND ACTUAL

112
Original Budget Final Budget Actual Amount Variance
Justices of the Peace, Precinct 4
Personnel costs 982,053 1,008,051 1,008,051 -
Remuneration for services 4,750 4,750 3,333 1,417
Operational costs 285,316 259,318 253,940 5,378
Supplies and materials 33,350 33,350 28,058 5,292
Total Justices of the Peace, Precinct 4 1,305,469 1,305,469 1,293,382 12,087
District Courts - Criminal
Personnel costs 5,327,997 5,307,342 5,307,342 -
Remuneration for services 30,465 22,335 22,334 1
Operational costs 6,298,425 7,722,741 7,722,740 1
Supplies and materials 58,100 40,245 40,241 4
Total District Courts - Criminal 11,714,987 13,092,663 13,092,657 6
District Courts - Civil
Personnel costs 4,731,573 4,882,738 4,882,738 -
Remuneration for services 44,100 31,375 31,374 1
Operational costs 3,242,076 3,632,039 3,632,038 1
Supplies and materials 124,600 106,704 106,704 -
Total District Courts - Civil 8,142,349 8,652,856 8,652,854 2
District Courts - Juvenile
Personnel costs 2,281,661 2,301,623 2,301,623 -
Remuneration for services 15,330 15,330 12,304 3,026
Operational costs 771,070 750,949 740,687 10,262
Supplies and materials 32,300 32,459 32,457 2
Total District Courts - Juvenile 3,100,361 3,100,361 3,087,071 13,290
Judicial Services
Personnel costs 5,623,860 5,741,432 5,741,432 -
Remuneration for services 16,563 17,313 14,633 2,680
Operational costs 696,788 971,309 971,306 3
Supplies and materials 77,162 80,972 75,018 5,954
Capital expenditures - 18,740 - 18,740
Total Judicial Services 6,414,373 6,829,766 6,802,389 27,377
Bail Bond Board
Personnel costs 63,070 64,715 64,709 6
Remuneration for services 1,350 1,350 949 401
Operational costs 2,473 2,473 2,426 47
Supplies and materials 763 763 704 59
Total Bail Bond Board 67,656 69,301 68,788 513
Bexar County, TexasGENERAL FUND
SCHEDULE OF REVENUES, EXPENDITURES AND CHANGES IN FUND BALANCEBUDGET AND ACTUAL
For Fiscal Year Ended September 30, 2018

113
Original Budget Final Budget Actual Amount Variance
4th Court of Appeals
Personnel costs 83,639 83,674 83,673 1
Operational costs 1,212 1,177 1,174 3
Total 4th Court of Appeals 84,851 84,851 84,847 4
Public Defenders
Personnel costs 1,353,359 1,353,359 1,349,101 4,258
Remuneration for services 16,062 16,062 14,385 1,677
Operational costs 26,598 29,098 25,845 3,253
Supplies and materials 17,600 15,100 10,412 4,688
Total Public Defenders 1,413,619 1,413,619 1,399,743 13,876
D.P.S. Warrants
Personnel costs 109,106 111,876 111,867 9
Total D.P.S. Warrants 109,106 111,876 111,867 9
TOTAL JUDICIAL 102,923,460 107,065,433 106,892,309 173,124
PUBLIC SAFETY
Sheriff Law Enforcement
Personnel costs 65,246,028 66,695,778 66,695,777 1
Remuneration for services 506,974 507,558 507,555 3
Operational costs 3,054,598 3,451,336 3,451,331 5
Supplies and materials 2,378,474 2,368,097 2,368,097 -
Capital expenditures 295,716 96,319 96,318 1
Total Sheriff Law Enforcement 71,481,790 73,119,088 73,119,078 10
Adult Detention Center
Personnel costs 57,038,322 66,681,798 66,681,798 -
Remuneration for services 47,379 47,379 38,641 8,738
Operational costs 4,591,860 5,075,438 5,075,438 -
Supplies and materials 1,828,090 1,686,263 1,631,624 54,639
Capital expenditures 41,187 37,390 29,775 7,615
Total Adult Detention Center 63,546,838 73,528,268 73,457,276 70,992
Sheriff Support Services
Personnel costs 2,201,225 2,220,269 2,220,269 -
Remuneration for services 31,766 31,766 25,265 6,501
Operational costs 144,670 125,626 101,075 24,551
Supplies and materials 49,563 49,563 40,943 8,620
Total Sheriff Support Services 2,427,224 2,427,224 2,387,552 39,672
(continued)
Bexar County, TexasGENERAL FUND
SCHEDULE OF REVENUES, EXPENDITURES AND CHANGES IN FUND BALANCEBUDGET AND ACTUAL
For Fiscal Year Ended September 30, 2018

114
Original Budget Final Budget Actual Amount Variance
Juvenile Probation
Personnel costs 14,022,218 14,223,372 14,223,369 3
Remuneration for services 325,650 294,350 291,982 2,368
Operational costs 1,808,629 2,059,084 2,059,084 -
Supplies and materials 326,366 328,538 328,534 4
Capital expenditures - 137,724 137,723 1
Total Juvenile Probation 16,482,863 17,043,068 17,040,692 2,376
Juvenile Institutions
Personnel costs 15,862,605 15,862,605 15,486,098 376,507
Remuneration for services - 13 12 1
Operational costs 1,425,763 1,279,539 934,652 344,887
Supplies and materials 512,227 515,438 515,435 3
Total Juvenile Institutions 17,800,595 17,657,595 16,936,197 721,398
Child Support Probation
Personnel costs 468,872 499,538 499,537 1
Operational costs 3,858 1,658 1,603 55
Supplies and materials 450 2 - 2
Total Child Support Probation 473,180 501,198 501,140 58
Community Supervision & Correction
Operational costs 1,743,632 1,743,632 1,676,962 66,670
Supplies and materials 57,921 59,446 36,388 23,058
Capital expenditures 1,800 275 - 275
Total Community Supervision & Correction 1,803,353 1,803,353 1,713,350 90,003
Medical Examiner
Personnel costs 5,215,128 5,229,558 5,229,556 2
Remuneration for services 64,300 64,300 45,526 18,774
Operational costs 581,066 607,130 600,898 6,232
Supplies and materials 298,881 298,881 276,630 22,251 Capital expenditures 76,230 76,230 76,224 6
Total Medical Examiner 6,235,605 6,276,099 6,228,834 47,265
Crime Lab
Personnel costs 2,470,398 2,641,008 2,641,002 6
Remuneration for services 15,738 11,838 11,104 734
Operational costs 189,312 185,912 185,340 572
Supplies and materials 259,023 299,223 298,135 1,088
Total Crime Lab 2,934,471 3,137,981 3,135,581 2,400
Bexar County, TexasGENERAL FUND
SCHEDULE OF REVENUES, EXPENDITURES AND CHANGES IN FUND BALANCEBUDGET AND ACTUAL
For Fiscal Year Ended September 30, 2018

115
Original Budget Final Budget Actual Amount Variance
Constable Precinct 1
Personnel costs 1,872,585 1,954,207 1,954,207 -
Remuneration for services 1,965 479 478 1
Operational costs 89,015 85,736 85,735 1
Supplies and materials 103,677 104,482 104,481 1
Total Constable Precinct 1 2,067,242 2,144,904 2,144,901 3
Constable Precinct 2
Personnel costs 1,526,651 1,582,563 1,582,562 1
Remuneration for services 4,535 2,762 2,761 1
Operational costs 266,073 273,018 273,017 1
Supplies and materials 111,677 77,644 77,644 -
Total Constable Precinct 2 1,908,936 1,935,987 1,935,984 3
Constable Precinct 3
Personnel costs 1,413,606 1,414,626 1,390,302 24,324
Remuneration for services 5,895 5,895 3,487 2,408
Operational costs 194,536 191,262 182,045 9,217
Supplies and materials 87,800 90,054 90,053 1
Total Constable Precinct 3 1,701,837 1,701,837 1,665,887 35,950
Constable Precinct 4
Personnel costs 1,650,526 1,702,744 1,702,743 1
Remuneration for services 5,600 2,881 2,879 2
Operational costs 307,665 311,002 311,001 1
Supplies and materials 69,300 66,015 66,014 1
Total Constable Precinct 4 2,033,091 2,082,642 2,082,637 5
Facilities Management - Adult Detention Center
Personnel costs 2,047,450 2,163,982 2,163,981 1
Remuneration for services 15,174 15,174 11,883 3,291
Operational costs 1,311,158 1,223,198 1,171,669 51,529
Supplies and materials 411,252 429,023 429,023 -
Total Facilities Management - ADC 3,785,034 3,831,377 3,776,556 54,821
(continued)
Bexar County, TexasGENERAL FUND
SCHEDULE OF REVENUES, EXPENDITURES AND CHANGES IN FUND BALANCEBUDGET AND ACTUAL
For Fiscal Year Ended September 30, 2018

116
Original Budget Final Budget Actual Amount Variance
Facilities Management - Juvenile Institutions
Personnel costs 1,224,193 1,233,016 1,233,016 -
Remuneration for services 4,500 4,500 1,962 2,538
Operational costs 489,121 756,177 756,093 84
Supplies and materials 121,005 106,683 106,312 371
Capital expenditures - 5,500 5,500 -
Total Facilities Management - Juvenile Institutions 1,838,819 2,105,876 2,102,883 2,993
Facilities Management - Forensic Science Center
Operational costs 542,688 534,985 499,222 35,763
Supplies and materials 7,500 7,500 6,880 620
Total Facilities Management - FSC 550,188 542,485 506,102 36,383
Fire Marshal
Personnel costs 1,073,092 1,100,450 1,100,449 1
Remuneration for services 20,500 20,835 20,834 1
Operational costs 178,750 163,900 163,900 -
Supplies and materials 90,855 93,038 93,037 1
Total Fire Marshal 1,363,197 1,378,223 1,378,220 3
Emergency Management
Personnel costs 549,169 578,623 578,622 1
Remuneration for services 7,500 7,500 7,471 29
Operational costs 162,870 142,906 142,905 1
Supplies and materials 139,000 137,865 137,864 1
Total Emergency Management 858,539 866,894 866,862 32
Animal Control Services
Personnel costs 277,640 278,497 278,497 -
Remuneration for services 4,897 4,897 1,101 3,796
Operational costs 312,312 306,425 177,284 129,141
Supplies and materials 151,118 156,150 156,150 -
Total Animal Control Services 745,967 745,969 613,032 132,937
TOTAL PUBLIC SAFETY 200,038,769 212,830,068 211,592,764 1,237,304
For Fiscal Year Ended September 30, 2018
Bexar County, TexasGENERAL FUND
SCHEDULE OF REVENUES, EXPENDITURES AND CHANGES IN FUND BALANCEBUDGET AND ACTUAL

117
Original Budget Final Budget Actual Amount Variance
EDUCATION AND RECREATION
BiblioTech
Personnel costs 1,652,339 1,599,839 1,594,796 5,043
Remuneration for services 19,540 24,540 24,412 128
Operational costs 641,264 743,764 743,756 8
Supplies and materials 83,550 78,550 69,542 9,008
Capital expenditures 3,000 3,000 - 3,000
Total BiblioTech 2,399,693 2,449,693 2,432,506 17,187
AgriLife
Personnel costs 606,570 606,570 589,363 17,207
Remuneration for services 23,400 23,400 21,072 2,328
Operational costs 151,413 151,413 147,754 3,659
Supplies and materials 11,782 11,782 11,372 410
Total AgriLife 793,165 793,165 769,561 23,604
County Parks
Personnel costs 2,259,519 2,259,519 2,225,996 33,523
Operational costs 244,540 244,540 241,173 3,367
Supplies and materials 228,300 228,300 221,292 7,008
Capital expenditures 70,618 83,852 83,704 148
Total County Parks 2,802,977 2,816,211 2,772,165 44,046
Bexar Heritage
Personnel costs 610,569 651,749 651,743 6
Remuneration for services 7,300 10,550 9,383 1,167
Operational costs 226,176 257,176 256,890 286
Supplies and materials 8,250 5,750 4,475 1,275
Total Bexar Heritage 852,295 925,225 922,491 2,734
TOTAL EDUCATION AND RECREATION 6,848,130 6,984,294 6,896,723 87,571
PUBLIC WORKS
Facilities Mangement - Energy Services
Personnel costs 45,061 46,213 46,213 -
Operational costs 6,317,994 6,446,716 6,446,716 -
Total Facilities Management - Energy Services 6,363,055 6,492,929 6,492,929 -
TOTAL PUBLIC WORKS 6,363,055 6,492,929 6,492,929 -
(continued)
SCHEDULE OF REVENUES, EXPENDITURES AND CHANGES IN FUND BALANCEBUDGET AND ACTUAL
For Fiscal Year Ended September 30, 2018
Bexar County, TexasGENERAL FUND

118
Original Budget Final Budget Actual Amount Variance
HEALTH AND PUBLIC WELFARE
Environmental Services
Personnel costs 267,976 269,679 269,679 -
Remuneration for services 1,225 1,225 1,011 214
Operational costs 223,219 343,192 239,957 103,235
Supplies and materials 13,193 16,517 16,516 1
Total Environmental Services 505,613 630,613 527,163 103,450
Community Resources Administration
Personnel costs - 845 844 1
Remuneration for services - - - -
Operational costs - 930 930 -
Supplies and materials - - - -
Total Community Resources Administration - 1,775 1,774 1
Community Programs
Personnel costs - - - -
Operational costs - 7 5 2
Total Community Programs - 7 5 2
Mental Health Initiative
Personnel costs 288,736 305,756 305,748 8
Remuneration for services 3,508 3,508 3,483 25
Operational costs 178,172 164,172 163,539 633
Supplies and materials 2,100 2,100 1,914 186
Total Mental Health Initiative 472,516 475,536 474,684 852
Veterans Services
Personnel costs 320,534 577,708 465,374 112,334
Remuneration for services 11,176 15,576 9,515 6,061
Operational costs 16,535 89,510 71,713 17,797
Supplies and materials 3,700 69,151 29,621 39,530
Total Veterans Services 351,945 751,945 576,223 175,722
Child Welfare
Operational costs 1,221,443 1,156,060 1,130,826 25,234
Supplies and materials - 73,200 73,000 200
Total Child Welfare 1,221,443 1,229,260 1,203,826 25,434
GENERAL FUNDSCHEDULE OF REVENUES, EXPENDITURES AND CHANGES IN FUND BALANCE
BUDGET AND ACTUALFor Fiscal Year Ended September 30, 2018
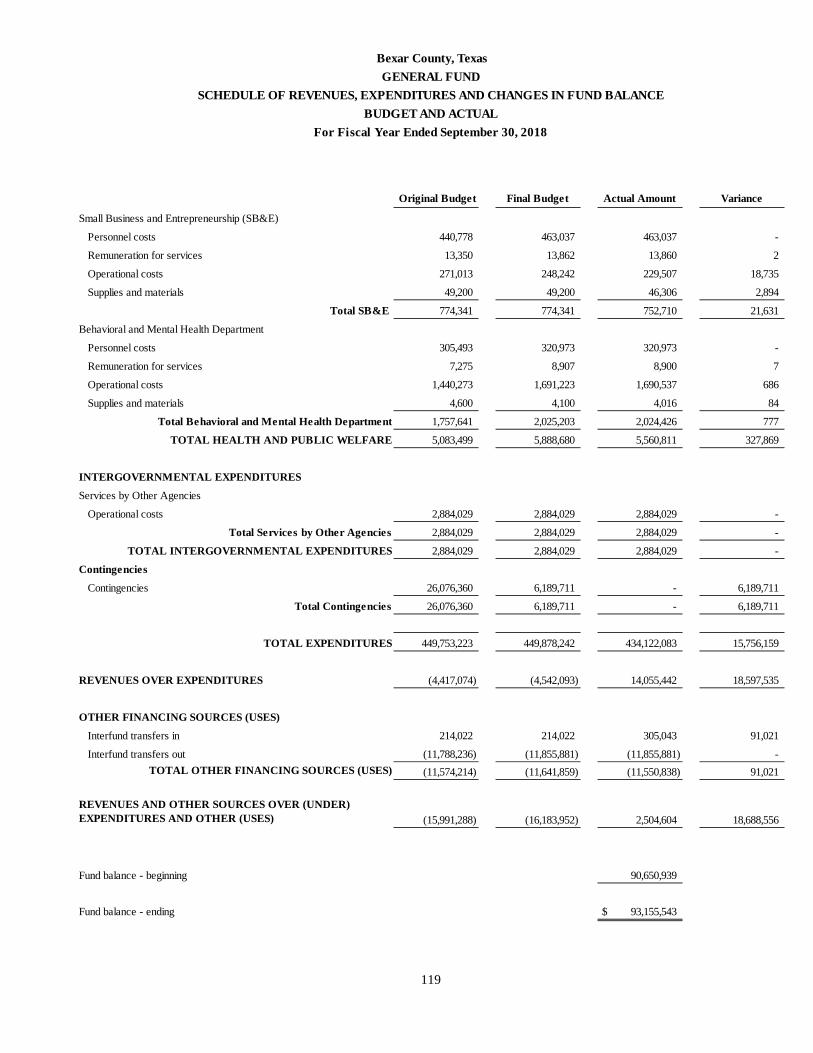
119
Original Budget Final Budget Actual Amount Variance
Small Business and Entrepreneurship (SB&E)
Personnel costs 440,778 463,037 463,037 -
Remuneration for services 13,350 13,862 13,860 2
Operational costs 271,013 248,242 229,507 18,735
Supplies and materials 49,200 49,200 46,306 2,894
Total SB&E 774,341 774,341 752,710 21,631
Behavioral and Mental Health Department
Personnel costs 305,493 320,973 320,973 -
Remuneration for services 7,275 8,907 8,900 7
Operational costs 1,440,273 1,691,223 1,690,537 686
Supplies and materials 4,600 4,100 4,016 84
Total Behavioral and Mental Health Department 1,757,641 2,025,203 2,024,426 777
TOTAL HEALTH AND PUBLIC WELFARE 5,083,499 5,888,680 5,560,811 327,869
INTERGOVERNMENTAL EXPENDITURES
Services by Other Agencies
Operational costs 2,884,029 2,884,029 2,884,029 -
Total Services by Other Agencies 2,884,029 2,884,029 2,884,029 -
TOTAL INTERGOVERNMENTAL EXPENDITURES 2,884,029 2,884,029 2,884,029 -
Contingencies
Contingencies 26,076,360 6,189,711 - 6,189,711
Total Contingencies 26,076,360 6,189,711 - 6,189,711
TOTAL EXPENDITURES 449,753,223 449,878,242 434,122,083 15,756,159
REVENUES OVER EXPENDITURES (4,417,074) (4,542,093) 14,055,442 18,597,535
OTHER FINANCING SOURCES (USES)
Interfund transfers in 214,022 214,022 305,043 91,021
Interfund transfers out (11,788,236) (11,855,881) (11,855,881) -TOTAL OTHER FINANCING SOURCES (USES) (11,574,214) (11,641,859) (11,550,838) 91,021
REVENUES AND OTHER SOURCES OVER (UNDER) EXPENDITURES AND OTHER (USES) (15,991,288) (16,183,952) 2,504,604 18,688,556
Fund balance - beginning 90,650,939
Fund balance - ending 93,155,543$
BUDGET AND ACTUALFor Fiscal Year Ended September 30, 2018
Bexar County, TexasGENERAL FUND
SCHEDULE OF REVENUES, EXPENDITURES AND CHANGES IN FUND BALANCE

120
Bexar County, Texas
NOTES TO REQUIRED SUPPLEMENTARY INFORMATION
September 30, 2018
General Fund Budget
The original expenditure category (appropriation only) budgets for the General Fund is adopted by the Commissioners Court and filed with the Bexar County Clerk by September 30. The total budget for the General Fund cannot be increased once the budget is adopted unless the County Auditor certifies a new revenue source not considered during the setting of the original budget. Amendments over $100,000 between expenditure categories are made during the year on approval by the Commissioners Court. The County Manager/Budget Officer shall approve all amendments in amounts up to $100,000.
State law requires the budget not be exceeded in any expenditure category. For the General Fund, an expenditure category is considered to be an activity (e.g., personnel, remuneration for services, etc.).

Bexar County, Texas
SCHEDULE OF FUNDING PROGRESS FOR RETIRED EMPLOYEE HEALTHCARE PLAN
September 30, 2018
121
The System
ActuarialActuarial Accrued Unfunded
Actuarial Value of Liability AALValuation Assets (AAL) (UAAL)
Date (a) (b) (b-a)01/01/2014 25,706$ 34,324$ (8,618)$ 01/01/2015 29,732$ 39,287$ (9,555)$ 01/01/2016 33,596$ 48,675$ (15,079)$
Schedule of Funding Progress for Bexar County Hospital DistrictRetired Employee Healthcare Plan
(in thousands)

Bexar County, Texas
SCHEDULE OF CHANGES IN NET PENSION LIABILITY AND RELATED RATIOS
September 30, 2018
122
Year Ended December 31, 2017 2016 2015 2014 2013 1 2012 1 2011 1 2010 1 2009 1 2008 1
Total Pension LiabilityService Cost 35,189,435$ 35,377,380$ 32,723,076$ 31,822,938$ -$ -$ -$ -$ -$ -$ Interest on total pension liability 108,591,128 101,382,339 95,976,741 90,065,880 - - - - - - Effect of plan changes 1,114,467 - (6,564,111) - - - - - - - Effect of assumption changes or inputs 5,954,882 - 11,789,927 - - - - - - - Effect of economic/demographic (gains) or losses 1,453,572 (4,288,764) (8,781,454) 502,253 - - - - - - Benefit payments/refunds of contributions (63,346,207) (59,368,612) (55,011,591) (49,928,994) - - - - - -
Net change in total pension liability 88,957,277 73,102,343 70,132,588 72,462,078 - - - - - -
Total pension liability, beginning 1,336,498,224 1,263,395,881 1,193,263,293 1,120,801,216 - - - - - - Total pension liability, ending (a) 1,425,455,501 1,336,498,224 1,263,395,881 1,193,263,293 - - - - - -
Fiduciary Net PositionEmployer contributions 35,834,589 32,896,371 31,710,094 30,757,771 - - - - - - Member contributions 18,645,999 17,640,625 16,873,121 16,190,301 - - - - - - Investment income net of investment expenses 168,565,593 80,420,624 (5,720,606) 70,225,240 - - - - - - Benefit payments/refunds of contributions (63,346,207) (59,368,612) (55,011,591) (49,928,994) - - - - - - Administrative expenses (874,192) (874,157) (787,023) (821,987) - - - - - - Other (126,832) (1,990,572) (577,718) 876,450 - - - - - -
Net change in fiduciary net position 158,698,950 68,724,279 (13,513,723) 67,298,781 - - - - - -
Fiduciary net position, beginning 1,155,811,853 1,087,087,574 1,100,601,297 1,033,302,516 - - - - - - Fiduciary net position, ending (b) 1,314,510,804 1,155,811,853 1,087,087,574 1,100,601,297 - - - - - -
Net pension liability / (asset), ending = (a) - (b) 110,944,697 180,686,371$ 176,308,307$ 92,661,996$ -$ -$ -$ -$ -$ -$
Fiduciary net position as a % of total pension liability 92.22% 86.48% 86.04% 92.23% - - - - - -
Pensionable covered payroll 265,871,892 251,255,949 240,592,521 231,087,684 - - - - - -
Net pension liability as a % of covered payroll 41.73% 71.91% 73.28% 40.10% - - - - - -
1 This schedule is presented to illustrate the requirement to show information for ten years. However, recalculations of prior years are not required; we accordingly are reporting only years for which GASB statements 68 and 71 have been implemented.
Schedule of Changes in Net Position Liability and Related Ratios
The above table includes information for four participating employers to the agent multiple-employer defined benefit pension plan administered by TCDRS. Three of the employers: Community Arenas Board (CAB), Metropolitan Planning Organization (MPO) and Community Supervision, are not considered departments or component units of the County; the net pension liabilities for these entities are $313,003, $490,776 and $8,824,260, respectively.

Bexar County, Texas
SCHEDULE OF EMPLOYER PENSION CONTRIBUTIONS
September 30, 2018
123
Primary Government
Year Ending September
30,
Actuarially Determined
ContributionActual Employer
ContributionContribution
Deficiency (Excess)Pensionable
Covered Payroll 1
Actual Contribution as a
% of Covered
2009 21,164,730 21,164,730 - 213,785,148 9.90%2010 22,528,989 22,528,989 - 212,137,370 10.62%2011 22,753,831 22,753,831 - 212,255,885 10.72%2012 23,560,331 23,560,331 - 208,498,502 11.30%2013 26,523,168 26,523,168 - 214,242,066 12.38%2014 29,784,031 29,784,031 - 223,771,834 13.31%2015 31,628,977 31,628,977 - 239,977,066 13.18%2016 32,499,498 32,499,498 - 248,467,114 13.08%2017 34,568,249 34,568,249 - 261,682,426 13.21%2018 37,426,409 37,426,409 - 283,318,764 13.21%
1 Payroll is calculated based on contributions as reported to the Texas County and District Retirement System (TCDRS).
Schedule of Employer Pension Contributions

Bexar County, Texas
NOTES TO REQUIRED SUPPLEMENTARY INFORMATION
September 30, 2018
124
Notes to Schedules:
Schedule of Changes in Net Pension Liability and Related Ratios and Schedule of Employer Pension Contributions
Valuation Date: Actuarially determined contribution rates are calculated as of December 31, two years prior to the end of the fiscal year in which the contributions are reported.
Methods and assumptions used to determine contribution rates:
Actuarial Cost Method Entry Age
Amortization Method Level percentage of payroll, closed
Amortization Period in Years 12.7 years (based on contribution rate calculated in 12/31/2017 valuation)
Asset Valuation Method 5-year smoothed market
Inflation 2.75%
Salary Increases Varies by age and service. 4.9% average over career including inflation.
Investment Rate of Return 8.00%, net of pension plan investment expenses, including inflation
Cost-of-Living Adjustments No assumption for future cost-of-living adjustments is included in the funding valuation.
Retirement Age Members eligible for service retirement are assumed to commence receiving benefit payments based on age. The average age at service retirement for recent retirees is 61.
Mortality 130%of the RP-2014 Healthy Annuitant Mortality Table for males and 110% of the RP-2014 Healthy Annuitant Mortality Table for females, both projected with 110% of the MP-2014 Ultimate scale after 2014.
Changes in Plan Provisions Reflected in the Schedule New Annuity Purchase Rates were reflected for benefits earned.

Bexar County, Texas
SCHEDULE OF CHANGES IN TOTAL OPEB LIABILITY AND RELATED RATIOS
September 30, 2018
125
Year Ended December 31, 2018 2017 1 2016 1 2015 1 2014 1 2013 1 2012 1 2011 1 2010 1 2007 1
Total OPEB liabilityService Cost 6,526,989$ -$ -$ -$ -$ -$ -$ -$ -$ -$ Interest 6,508,938 - - - - - - - - - Changes of benefit terms - - - - - - - - - - Differences between expected and actual experience - - - - - - - - - - Changes of assumptions - - - - - - - - - - Benefit payments/refunds of contributions (3,584,024) - - - - - - - - -
Net change in total OPEB liability 9,451,903 - - - - - - - - -
Total OPEB liability, beginning 181,219,260 - - - - - - - - - Total OPEB liability, ending (a) 190,671,163 - - - - - - - - -
Plan Fiduciary net positionContribution - employer 3,584,024 - - - - - - - - - Contribution - employee - - - - - - - - - - Net investment income - - - - - - - - - - Benefit payments/refunds of contributions (3,584,024) - - - - - - - - - Administrative expenses - - - - - - - - - - Other - - - - - - - - - -
Net change in plan fiduciary net position - - - - - - - - - -
Plan fiduciary net position, beginning - - - - - - - - - - Plan fiduciary net position, ending (b) - - - - - - - - - -
Employer's net OPEB liability, ending = (a) - (b) 190,671,163$ -$ -$ -$ -$ -$ -$ -$ -$ -$
Plan fiduciary net position as a % of total OPEB liability 0% - - - - - - - - -
Covered payroll 192,843,724$ - - - - - - - - -
Employer's net OPEB liability as a % of covered payroll 98.87% - - - - - - - - -
1 This schedule is presented to illustrate the requirement to show information for ten years. However, recalculations of prior years are not required;we accordingly are reporting only years for which GASB statement 75 has been implemented.
Note to schedule: Since this is the initial year of GASB 75 implementation trends regarding changes in benefit terms, the size of composition or the population covered by the benefit terms or assumptions have not been established.
Bexar County Premium and Base PPO Plan

126
This page intentionally left blank

127
NONMAJOR GOVERNMENTAL FUNDS are used to account for the proceeds of specific revenue sources that are legally restricted to expenditures for specified purposes.
COUNTY CLERK RECORDS MANAGEMENT FUND – to account for fee revenue and expenditures related to records management in the County Clerk’s Office.
COUNTY RECORDS MANAGEMENT FUND – to account for fee revenue and expenditures related to records management on a county wide basis.
COURTHOUSE SECURITY FUND – to account for fee revenue and expenditures related to security devices and services for the courthouse and other buildings housing courts.
JUSTICES OF PEACE TECHNOLOGY FUND – to account for fee revenue and expenditures related to technological improvements in the Justice of the Peace offices.
FIRE CODE FUND – to account for fee revenue and expenditures related to fire prevention.
DISTRICT CLERK RECORDS MANAGEMENT FUND – to account for fee revenue and expenditures related to records management in the District Clerk’s Office.
LAW LIBRARY FUND – to account for fee revenue and expenditures related to the operations of the law library.
COUNTY WIDE COURT TECHNOLOGY FUND – to account for fee revenue and expenditures related to the purchase, maintenance, continuing education, and training for technological enhancements of the courts.
DISPUTE RESOLUTION FUND – to account for fee revenue and expenditures related to the operations of the dispute mediation center.
JUSTICES OF PEACE SECURITY FUND – to account for revenue and expenditures related to security devices and services for buildings housing Justice of the Peace courts.
DOMESTIC RELATIONS FUND – to account for fee revenue and expenditures related to the operation of the domestic relations office.
PROBATE CONTRIBUTION FUND – to account for State revenue provided for Probate Court support and related expenditures.
LAW ENFORCEMENT OFFICERS SPECIAL EDUCATION FUND (LEOSE) – to account for State revenues provided for education of law enforcement officers and related expenditures.
CHILD ABUSE PREVENTION FUND – to account for fee revenue from court costs imposed on certain criminal convictions and expenditures for programs aimed at preventing child abuse.
DRUG COURT PROGRAM FUND – to account for fee revenue and expenditures related to operations of mandated programs for monitoring and rehabilitating violators of State drug laws.
N O N M A J O R G O V E R N M E N T A L F U N D S

128
NONMAJOR GOVERNMENTAL FUNDS are used to account for the proceeds of specific revenue sources that are legally restricted to expenditures for specified purposes.
FAMILY PROTECTION FEE FUND – to account for fee revenue imposed by the State on petitions for divorce to fund services to prevent family violence or child abuse.
DISTRICT COURT RECORDS TECHNOLOGY FUND – to account for fee revenue and expenditures related to the preservation and restoration of the District Court’s records.
JUVENILE CASE MANAGER FUND – to account for fee revenues and expenditures related to juvenile social workers in the Justices of the Peace offices.
PROBATE GUARDIANSHIP FUND – to account for fee revenues and expenditures related to the appointment of guardians for minors in Probate cases.
PROBATE EDUCATION FUND – to account for fee revenue and expenditures related to continuing education of the Probate Courts’ staff.
JUVENILE DELINQUENCY PREVENTION FUND – to account for fee revenue and expenditures related to graffiti eradication.
GRANTS FUND – to account for expenditures of funds received as grants-in-aid from various non-governmental sources and from Federal and State agencies for specific programs.
TECHNOLOGY IMPROVEMENT FUND – to account for costs associated with technology improvements.
STORMWATER MITIGATION FUND – to account for revenues and expenditures associated with preventing and repairing damages due to storm water runoff and for educating the public about flood hazards.
CHAPTER 19 VOTER REGISTRATION FUND – to account for revenues received from the State and expenditures associated with disseminating voting information to the public and registering new voters.
ELECTION CONTRACTING SERVICES FUND – to account for the receipt and disbursement of funds related to election contract service agreements.
TAX COLLECTOR’S SPECIAL INVENTORY FUND – to account for the receipt and disbursement of funds administered by the Tax Collector.
DISTRICT ATTORNEY PROGRAMS FUND – to account for the receipt and disbursement of discretionary funds maintained by the Criminal District Attorney.
ASSET FORFEITURES FUND – to account for receipt and disbursement of funds relating to forfeitures of certain property related to felony offenses.
BEXAR COUNTY HOUSING FINANCE CORPORATION – to account for revenue and expenditures related to the Bexar County Housing Finance Corporation.
BEXAR COUNTY HEALTH FACILITIES DEVELOPMENT CORPORATION – to account for revenue and expenditures related to the Bexar County Health Facilities Development Corporation.
BEXAR COUNTY INDUSTRIAL DEVELOPMENT CORPORATION – to account for revenue and expenditures related to the Bexar County Industrial Development Corporation.
N O N M A J O R G O V E R N M E N T A L F U N D S

129
County Clerk Records
Management
County Records
ManagementCourthouse
Security
Justices of Peace
Technology
ASSETS
Cash 2,151,571$ 22,045$ 1,042$ 12,140$
Investments 25,949,317 265,873 12,567 146,417
Receivables:
Accounts receivable - - 9,449 9,451
Due from other governmental units - - - -
TOTAL ASSETS 28,100,888$ 287,918$ 23,058$ 168,008$
LIABILITIES AND FUND BALANCES
LIABILITIES
Vouchers payable 64,381$ 100,466$ $ - $ -
Accrued liabilities 22,046 14,439 17,672 -
Due to other funds - - - -
Advances from other funds - - - -
Due to other governmental units - - - -
Unearned revenue - - - -
TOTAL LIABILITIES 86,427 114,905 17,672 -
FUND BALANCE
Restricted 28,014,461 173,013 5,386 168,008
Committed - - - -
TOTAL FUND BALANCE 28,014,461 173,013 5,386 168,008
TOTAL LIABILITIES AND FUND BALANCE 28,100,888$ 287,918$ 23,058$ 168,008$
(continued)
Bexar County, TexasCOMBINING BALANCE SHEET
NONMAJOR GOVERNMENTAL FUNDS September 30, 2018

130
Fire Code
District Clerk Records
Management Law Library
County Wide Court
Technology
ASSETS
Cash 416,302$ 29,422$ 8,803$ 11,187$
Investments 5,020,864 354,843 101,345 134,926
Receivables:
Accounts receivable - - 3,827 -
Due from other governmental units - - - -
TOTAL ASSETS 5,437,166$ 384,265$ 113,975$ 146,113$
LIABILITIES AND FUND BALANCES
LIABILITIES
Vouchers payable 44,082$ -$ 47,776$ -$
Accrued liabilities 30,034 - 7,886 -
Due to other funds - - - -
Advances from other funds - - - -
Due to other governmental units - - 693 -
Unearned revenue - - - -
TOTAL LIABILITIES 74,116 - 56,355 -
FUND BALANCE
Restricted 5,363,050 384,265 57,620 146,113
Committed - - - -
TOTAL FUND BALANCE 5,363,050 384,265 57,620 146,113
TOTAL LIABILITIES AND FUND BALANCE 5,437,166$ 384,265$ 113,975$ 146,113$
Bexar County, TexasCOMBINING BALANCE SHEET
NONMAJOR GOVERNMENTAL FUNDS September 30, 2018

131
Dispute Resolution
Justices of Peace
Security FundDomestic Relations
Probate Contribution LEOSE
Child Abuse Prevention
8,793$ 43,841$ 1,857$ 17,849$ 233,470$ 1,035$
106,048 528,752 22,396 215,275 - 12,480
- - - - - -
- - - 160,287 - -
114,841$ 572,593$ 24,253$ 393,411$ 233,470$ 13,515$
3,183$ -$ 13,579$ 4,766$ 50$ $ -
10,693 - 10,671 1,796 3,606 -
- - - - - -
- - - - - -
- - - - - -
- - - - - -
13,876 - 24,250 6,562 3,656 -
100,965 572,593 3 386,849 229,814 13,515
- - - - - -
100,965 572,593 3 386,849 229,814 13,515
114,841$ 572,593$ 24,253$ 393,411$ 233,470$ 13,515$
(continued)

132
Drug Court Program
Family Protection
Fee
District Court Records
Technology
Juvenile Case
Manager
ASSETS
Cash 889$ 3,031$ 12,631$ 5,845$
Investments 10,725 36,558 152,339 70,494
Receivables:
Accounts receivable - - - 13,798
Due from other governmental units - - - -
TOTAL ASSETS 11,614$ 39,589$ 164,970$ 90,137$
LIABILITIES AND FUND BALANCES
LIABILITIES
Vouchers payable $ - 39,589$ 51,710$ -$
Accrued liabilities 226 - - 80,181
Due to other funds - - - -
Advances from other funds - - - -
Due to other governmental units - - - -
Unearned revenue - - - -
TOTAL LIABILITIES 226 39,589 51,710$ 80,181
FUND BALANCE
Restricted 11,388 - 113,260 9,956
Committed - - - -
TOTAL FUND BALANCE 11,388 - 113,260 9,956
TOTAL LIABILITIES AND FUND BALANCE 11,614$ 39,589$ 164,970$ 90,137$
Bexar County, TexasCOMBINING BALANCE SHEET
NONMAJOR GOVERNMENTAL FUNDS September 30, 2018

133
Probate Gaurdianship
Probate Education
Juvenile Delinquency Prevention Grants
Technology Improvement
Stormwater Mitigation
15,906$ 21,204$ 2,131$ 707,338$ 111,978$ 549,396$
191,842 255,739 25,706 8,530,957 1,350,525 6,626,068
- - - - - -
- - - 7,721,442 - -
207,748$ 276,943$ 27,837$ 16,959,737$ 1,462,503$ 7,175,464$
5,467$ 21$ $ - 2,042,913$ 436,320$ 14,703$
- 296 - 2,114,115 105,319 104,753
- - - - - -
- - - 250,000 - -
- - - - - -
- - - - - -
5,467 317 - 4,407,028 541,639 119,456
202,281 276,626 27,837 12,552,709 - 7,056,008
- - - - 920,864 -
202,281 276,626 27,837 12,552,709 920,864 7,056,008
207,748$ 276,943$ 27,837$ 16,959,737$ 1,462,503$ 7,175,464$
(continued)

134
Chapter 19 Voter
Registration
Election Contracting
Services
Tax Collector's
Special Inventory
District Attorney Programs
ASSETS
Cash -$ 93,338$ 14,010$ 182,814$
Investments - 1,125,714 - 373,782
Receivables:
Accounts receivable 21,740 - - -
Due from other governmental units - - - -
TOTAL ASSETS 21,740$ 1,219,052$ 14,010$ 556,596$
LIABILITIES AND FUND BALANCES
LIABILITIES
Vouchers payable 1,398$ 412$ $ - -$
Accrued liabilities - 118 328 8,505
Due to other funds 19,166 - - -
Advances from other funds - 150,000 - -
Due to other governmental units - - - -
Unearned revenue 51 606,755 - -
TOTAL LIABILITIES 20,615 757,285 328 8,505
FUND BALANCE
Restricted 1,125 461,767 13,682 548,091
Committed - - - -
TOTAL FUND BALANCE 1,125 461,767 13,682 548,091
TOTAL LIABILITIES AND FUND BALANCE 21,740$ 1,219,052$ 14,010$ 556,596$
NONMAJOR GOVERNMENTAL FUNDS September 30, 2018
Bexar County, TexasCOMBINING BALANCE SHEET

135
Asset Forfeitures
Bexar County Housing Finance
Corporation
Bexar County Health
Facilities Development Corporation
Bexar County Industrial
Development Corporation Total
4,482,550$ 1,855,684$ 230,894$ 1,779$ 11,250,775$
- - - - 51,621,552
525 - - - 58,790
405 - - - 7,882,134
4,483,480$ 1,855,684$ 230,894$ 1,779$ 70,813,251$
52,413$ $ - $ - $ - 2,923,229$
41,294 - - - 2,573,978
- - - - 19,166
- - - - 400,000
- - - - 693
- - - - 606,806
93,707 - - - 6,523,872
4,389,773 1,855,684 230,894 1,779 63,368,515
- - - - 920,864
4,389,773 1,855,684 230,894 1,779 64,289,379
4,483,480$ 1,855,684$ 230,894$ 1,779$ 70,813,251$
Blended Component Units
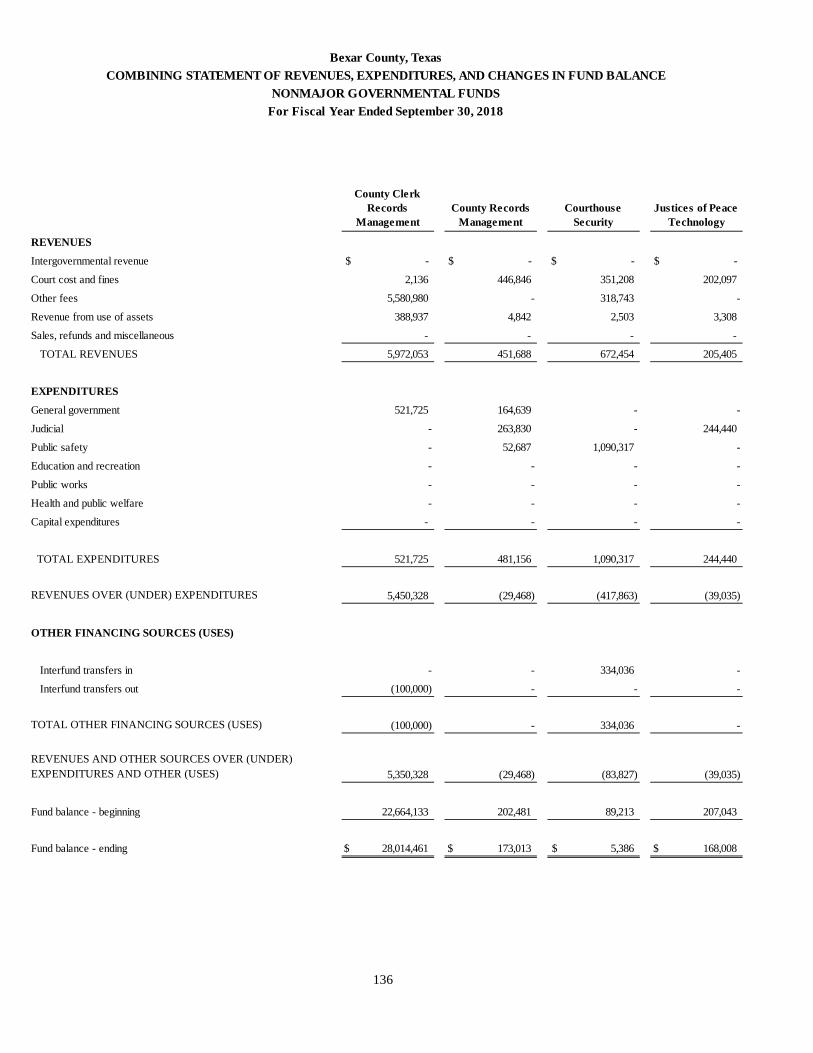
136
County Clerk Records
ManagementCounty Records
ManagementCourthouse
SecurityJustices of Peace
Technology
REVENUES
Intergovernmental revenue $ - $ - $ - $ -
Court cost and fines 2,136 446,846 351,208 202,097
Other fees 5,580,980 - 318,743 -
Revenue from use of assets 388,937 4,842 2,503 3,308
Sales, refunds and miscellaneous - - - -
TOTAL REVENUES 5,972,053 451,688 672,454 205,405
EXPENDITURES
General government 521,725 164,639 - -
Judicial - 263,830 - 244,440
Public safety - 52,687 1,090,317 -
Education and recreation - - - -
Public works - - - -
Health and public welfare - - - -
Capital expenditures - - - -
TOTAL EXPENDITURES 521,725 481,156 1,090,317 244,440
REVENUES OVER (UNDER) EXPENDITURES 5,450,328 (29,468) (417,863) (39,035)
OTHER FINANCING SOURCES (USES)
Interfund transfers in - - 334,036 -
Interfund transfers out (100,000) - - -
TOTAL OTHER FINANCING SOURCES (USES) (100,000) - 334,036 -
REVENUES AND OTHER SOURCES OVER (UNDER) EXPENDITURES AND OTHER (USES) 5,350,328 (29,468) (83,827) (39,035)
Fund balance - beginning 22,664,133 202,481 89,213 207,043
Fund balance - ending 28,014,461$ 173,013$ 5,386$ 168,008$
Bexar County, TexasCOMBINING STATEMENT OF REVENUES, EXPENDITURES, AND CHANGES IN FUND BALANCE
NONMAJOR GOVERNMENTAL FUNDSFor Fiscal Year Ended September 30, 2018

137
Fire Code
District Clerk Records
Management Law Library
County Wide Court
TechnologyDispute
ResolutionJustices of Peace
Security FundDomestic Relations
$ - $ - $ - $ - $ - $ - $ -
- 174 563,368 - 628,199 51,616 325,317
2,601,421 397,802 - 40,075 - - -
67,447 6,635 2,784 2,035 1,319 8,447 566
- - 113,321 - 135 - -
2,668,868 404,611 679,473 42,110 629,653 60,063 325,883
- - - - - - -
- 336,935 952,606 42,540 - 200 -
1,265,769 - - - - - -
- - - - - - -
- - - - - - -
- - - - 662,394 - 445,255
- - - - - - -
1,265,769 336,935 952,606 42,540 662,394 200 445,255
1,403,099 67,676 (273,133) (430) (32,741) 59,863 (119,372)
- - 330,745 - 32,953 - 126,258
(438,046) - - - - - (6,895)
(438,046) - 330,745 - 32,953 - 119,363
965,053 67,676 57,612 (430) 212 59,863 (9)
4,397,997 316,589 8 146,543 100,753 512,730 12
5,363,050$ 384,265$ 57,620$ 146,113$ 100,965$ 572,593$ 3$
(continued)

138
Probate Contribution LEOSE
Child Abuse Prevention
Drug Court Program
REVENUES
Intergovernmental revenue 240,287$ 101,691$ $ - $ -
Court cost and fines - - 3,133 -
Other fees - - - 119,959
Revenue from use of assets 4,760 321 185 831
Sales, refunds and miscellaneous - 100 - -
TOTAL REVENUES 245,047 102,112 3,318 120,790
EXPENDITURES
General government - - - -
Judicial 193,876 3,466 - 199,790
Public safety - 64,619 - -
Education and recreation - - - -
Public works - - - -
Health and public welfare - - - -
Capital expenditures - - - -
TOTAL EXPENDITURES 193,876 68,085 - 199,790
REVENUES OVER (UNDER) EXPENDITURES 51,171 34,027 3,318 (79,000)
OTHER FINANCING SOURCES (USES)
Interfund transfers in - - - -
Interfund transfers out - - - -
TOTAL OTHER FINANCING SOURCES (USES) - - - -
REVENUES AND OTHER SOURCES OVER (UNDER) EXPENDITURES AND OTHER (USES) 51,171 34,027 3,318 (79,000)
Fund balance - beginning 335,678 195,787 10,197 90,388
Fund balance - ending 386,849$ 229,814$ 13,515$ 11,388$
Bexar County, TexasCOMBINING STATEMENT OF REVENUES, EXPENDITURES, AND CHANGES IN FUND BALANCE
NONMAJOR GOVERNMENTAL FUNDSFor Fiscal Year Ended September 30, 2018

139
Family Protection Fee
District Court Records
TechnologyJuvenile Case
ManagerProbate
GaurdianshipProbate
Education
Juvenile Delinquency Prevention Grants
$ - $ - $ - $ - $ - $ - 34,094,473$
91,503 285,671 296,521 134,214 - 472 -
- - - - 33,005 - -
28 6,156 818 3,136 4,114 422 45,710
- - - - - - -
91,531 291,827 297,339 137,350 37,119 894 34,140,183
- - - - - - 910,171
- 472,884 - 179,063 21,412 - 4,255,514
- - 296,521 - - - 11,991,551
- - - - - - 1,231,408
- - - - - - 2,026,929
- - - - - - 14,332,123
- - - - - - 1,003,975
- 472,884 296,521 179,063 21,412 - 35,751,671
91,531 (181,057) 818 (41,713) 15,707 894 (1,611,488)
- - - - - - 165,340
(125,043) - - - - - -
(125,043) - - - - - 165,340
(33,512) (181,057) 818 (41,713) 15,707 894 (1,446,148)
33,512 294,317 9,138 243,994 260,919 26,943 13,998,857
-$ 113,260$ 9,956$ 202,281$ 276,626$ 27,837$ 12,552,709$
(continued)

140
Technology Improvement
Stormwater Mitigation
Chapter 19 Voter Registration
Election Contracting
Services
REVENUES
Intergovernmental revenue $ - $ - 296,860$ 2,150,028$
Court cost and fines - - - -
Other fees 959,824 2,468,322 - 372,558
Revenue from use of assets - 110,800 - -
Sales, refunds and miscellaneous 1,338 72,188 - -
TOTAL REVENUES 961,162 2,651,310 296,860 2,522,586
EXPENDITURES
General government 2,365,391 - 296,860 2,958,445
Judicial 201,529 - - -
Public safety 302,713 - - -
Education and recreation 662 - - -
Public works 3,002 1,903,986 - -
Health and public welfare 12,218 - - -
Capital expenditures - - - -
TOTAL EXPENDITURES 2,885,515 1,903,986 296,860 2,958,445
REVENUES OVER (UNDER) EXPENDITURES (1,924,353) 747,324 - (435,859)
OTHER FINANCING SOURCES (USES)
Interfund transfers in 2,019,472 - - -
Interfund transfers out - (54,000) - -
TOTAL OTHER FINANCING SOURCES (USES) 2,019,472 (54,000) - -
REVENUES AND OTHER SOURCES OVER (UNDER) EXPENDITURES AND OTHER (USES) 95,119 693,324 - (435,859)
Fund balance - beginning 825,745 6,362,684 1,125 897,626
Fund balance - ending 920,864$ 7,056,008$ 1,125$ 461,767$
Bexar County, TexasCOMBINING STATEMENT OF REVENUES, EXPENDITURES, AND CHANGES IN FUND BALANCE
NONMAJOR GOVERNMENTAL FUNDSFor Fiscal Year Ended September 30, 2018
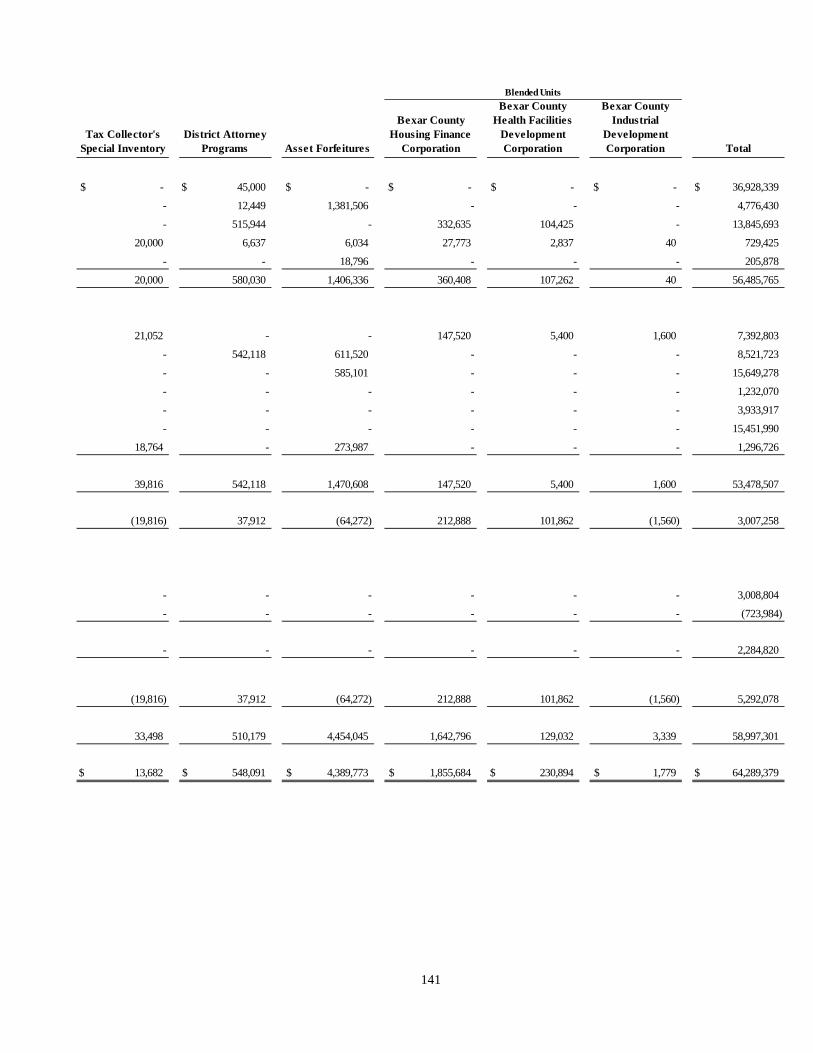
141
Tax Collector's Special Inventory
District Attorney Programs Asset Forfeitures
Bexar County Housing Finance
Corporation
Bexar County Health Facilities
Development Corporation
Bexar County Industrial
Development Corporation Total
$ - 45,000$ $ - $ - $ - $ - 36,928,339$
- 12,449 1,381,506 - - - 4,776,430
- 515,944 - 332,635 104,425 - 13,845,693
20,000 6,637 6,034 27,773 2,837 40 729,425
- - 18,796 - - - 205,878
20,000 580,030 1,406,336 360,408 107,262 40 56,485,765
21,052 - - 147,520 5,400 1,600 7,392,803
- 542,118 611,520 - - - 8,521,723
- - 585,101 - - - 15,649,278
- - - - - - 1,232,070
- - - - - - 3,933,917
- - - - - - 15,451,990
18,764 - 273,987 - - - 1,296,726
39,816 542,118 1,470,608 147,520 5,400 1,600 53,478,507
(19,816) 37,912 (64,272) 212,888 101,862 (1,560) 3,007,258
- - - - - - 3,008,804
- - - - - - (723,984)
- - - - - - 2,284,820
(19,816) 37,912 (64,272) 212,888 101,862 (1,560) 5,292,078
33,498 510,179 4,454,045 1,642,796 129,032 3,339 58,997,301
13,682$ 548,091$ 4,389,773$ 1,855,684$ 230,894$ 1,779$ 64,289,379$
Blended Units

142
Final BudgetActual
Amount Variance
REVENUES
Property tax 97,010,000$ 97,036,904$ 26,904$
Intergovernmental revenue 2,755,189 2,769,806 14,617
Revenue from use of assets - interest 3,500,000 7,977,220 4,477,220
Sales, refunds and miscellaneous - 2,535,510 2,535,510
TOTAL REVENUES 103,265,189 110,319,440 7,054,251
EXPENDITURES Debt service:
Principal 30,000,000 29,900,000 100,000
Interest 80,110,304 77,536,864 2,573,440
Bond issuance cost 1,870,000 3,321,972 (1,451,972)
Debt service SARA 2,993,290 3,102,341 (109,051)
TOTAL EXPENDITURES 114,973,594 113,861,177 1,112,417
REVENUES OVER (UNDER) EXPENDITURES (11,708,405) (3,541,737) 8,166,668
OTHER FINANCING SOURCES (USES)
Transfers in 17,863,656 17,136,831 (726,825)
Issuance of refunding bonds - 412,855,000 412,855,000
Payment to refunded debt paying agent - (469,913,894) (469,913,894)
Premium on bond issues - 64,916,885 64,916,885
TOTAL OTHER FINANCING SOURCES (USES) 17,863,656 24,994,822 7,131,166
REVENUES AND OTHER SOURCES OVER EXPENDITURES AND OTHER (USES) 6,155,251$ 21,453,085 15,297,834$
Fund balance - beginning 60,482,700
Fund balance - ending 81,935,785$
Bexar County, TexasDEBT SERVICE FUND
SCHEDULE OF REVENUES, EXPENDITURES AND CHANGES IN FUND BALANCEBUDGET AND ACTUAL
For Fiscal Year Ended September 30, 2018

143
Final BudgetActual
Amount Variance
REVENUES
Court cost and fines 2,200$ 2,136$ (64)$
Other fees 5,500,000 5,580,980 80,980
Revenue from use of assets 100,000 388,937 288,937
TOTAL REVENUES 5,602,200 5,972,053 369,853
EXPENDITURESGENERAL GOVERNMENT
Remuneration for services 10,725 7,655 3,070
Operational costs 8,364,361 409,477 7,954,884
Supplies and materials 155,500 104,593 50,907
TOTAL GENERAL GOVERNMENT 8,530,586 521,725 8,008,861
TOTAL EXPENDITURES 8,530,586 521,725 8,008,861
REVENUES OVER (UNDER) EXPENDITURES (2,928,386) 5,450,328 8,378,714
OTHER FINANCING SOURCES (USES)
Interfund transfers out (100,000) (100,000) -
TOTAL OTHER FINANCING (USES) (100,000) (100,000) -
REVENUES OVER (UNDER) EXPENDITURES AND OTHER (USES) (3,028,386)$ 5,350,328 8,378,714$
Fund balance - beginning 22,664,133
Fund balance - ending 28,014,461$
Bexar County, TexasSPECIAL REVENUE FUNDS
SCHEDULE OF REVENUES, EXPENDITURES AND CHANGES IN FUNDBALANCE - BUDGET AND ACTUAL
COUNTY CLERK RECORDS MANAGEMENT FUNDFor Fiscal Year Ended September 30, 2018

144
Final BudgetActual
Amount Variance
REVENUES
Court cost and fines 400,000$ 446,846$ 46,846$
Revenue from use of assets 600 4,842 4,242
TOTAL REVENUES 400,600 451,688 51,088
EXPENDITURES
GENERAL GOVERNMENT
Operational costs 170,000 164,639 5,361
TOTAL GENERAL GOVERNMENT 170,000 164,639 5,361
JUDICIAL
Operational costs 266,000 263,830 2,170
TOTAL JUDICIAL 266,000 263,830 2,170
PUBLIC SAFETY
Operational costs 53,000 52,687 313
TOTAL PUBLIC SAFETY 53,000 52,687 313
TOTAL EXPENDITURES 489,000 481,156 7,844
REVENUES OVER (UNDER) EXPENDITURES (88,400)$ (29,468) 58,932$
Fund balance - beginning 202,481
Fund balance - ending 173,013$
For Fiscal Year Ended September 30, 2018
Bexar County, TexasSPECIAL REVENUE FUNDS
SCHEDULE OF REVENUES, EXPENDITURES AND CHANGES IN FUNDBALANCE - BUDGET AND ACTUAL
COUNTY RECORDS MANAGEMENT FUND
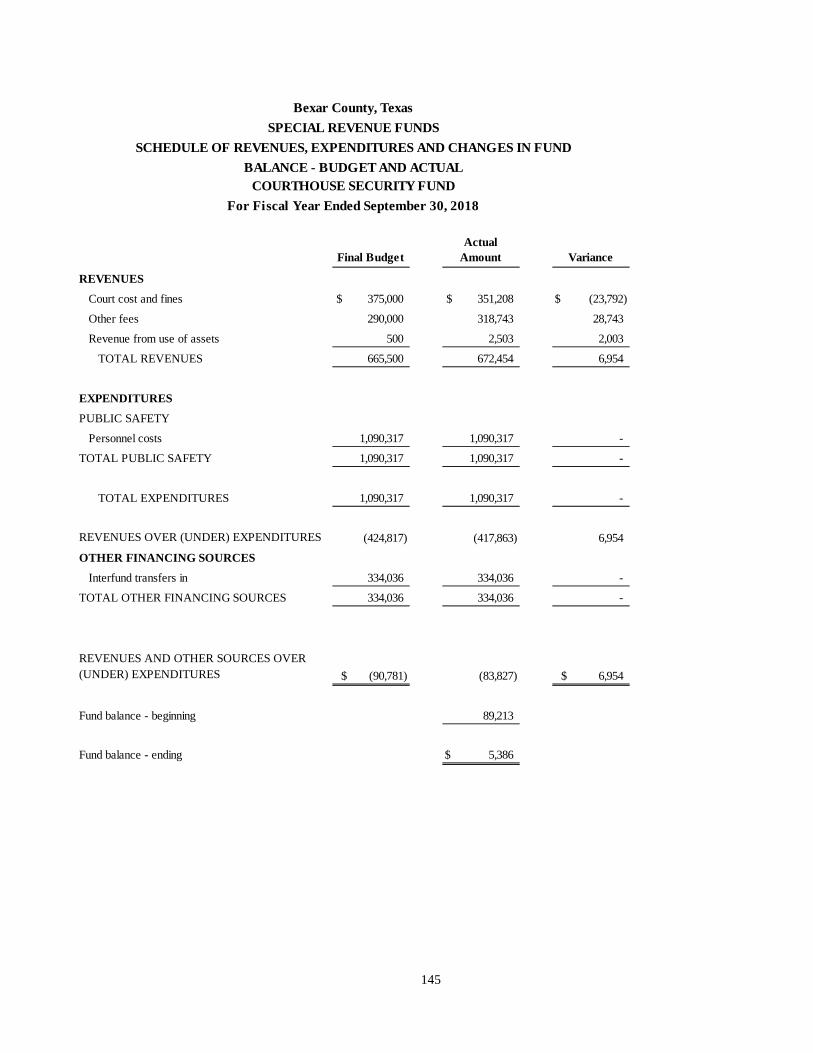
145
Final BudgetActual
Amount Variance
REVENUES
Court cost and fines 375,000$ 351,208$ (23,792)$
Other fees 290,000 318,743 28,743
Revenue from use of assets 500 2,503 2,003
TOTAL REVENUES 665,500 672,454 6,954
EXPENDITURES
PUBLIC SAFETY
Personnel costs 1,090,317 1,090,317 -
TOTAL PUBLIC SAFETY 1,090,317 1,090,317 -
TOTAL EXPENDITURES 1,090,317 1,090,317 -
REVENUES OVER (UNDER) EXPENDITURES (424,817) (417,863) 6,954
OTHER FINANCING SOURCES
Interfund transfers in 334,036 334,036 -
TOTAL OTHER FINANCING SOURCES 334,036 334,036 -
REVENUES AND OTHER SOURCES OVER (UNDER) EXPENDITURES (90,781)$ (83,827) 6,954$
Fund balance - beginning 89,213
Fund balance - ending 5,386$
For Fiscal Year Ended September 30, 2018
Bexar County, TexasSPECIAL REVENUE FUNDS
SCHEDULE OF REVENUES, EXPENDITURES AND CHANGES IN FUNDBALANCE - BUDGET AND ACTUAL
COURTHOUSE SECURITY FUND

146
Final BudgetActual
Amount Variance
REVENUES
Court cost and fines 240,000$ 202,097$ (37,903)$
Revenue from use of assets 1,500 3,308 1,808
TOTAL REVENUES 241,500 205,405 (36,095)
EXPENDITURES
JUDICIAL
Operational costs 259,650 244,440 15,210
TOTAL JUDICIAL 259,650 244,440 15,210
TOTAL EXPENDITURES 259,650 244,440 15,210
REVENUES OVER (UNDER) EXPENDITURES (18,150)$ (39,035) (20,885)$
Fund balance - beginning 207,043
Fund balance - ending 168,008$
For Year Ended September 30, 2018
Bexar County, TexasSPECIAL REVENUE FUNDS
SCHEDULE OF REVENUES, EXPENDITURES AND CHANGES IN FUNDBALANCE - BUDGET AND ACTUAL
JUSTICES OF PEACE TECHNOLOGY FUND

147
Final BudgetActual
Amount Variance
REVENUES
Other fees 1,300,000$ 2,601,421$ 1,301,421$
Revenue from use of assets 20,000 67,447 47,447
TOTAL REVENUES 1,320,000 2,668,868 1,348,868
EXPENDITURESPUBLIC SAFETY
Personnel costs 980,126 943,483 36,643
Remuneration for services 34,463 33,178 1,285
Operational costs 194,558 194,558 -
Supplies and materials 121,279 94,550 26,729
TOTAL PUBLIC SAFETY 1,330,426 1,265,769 64,657
CAPITAL EXPENDITURES 1,026 - 1,026
TOTAL EXPENDITURES 1,331,452 1,265,769 65,683
REVENUES OVER (UNDER) EXPENDITURES (11,452) 1,403,099 1,414,551
OTHER FINANCING (USES)
Interfund transfers out (438,046) (438,046) -
TOTAL OTHER FINANCING (USES) (438,046) (438,046) -
REVENUES OVER (UNDER) EXPENDITURES AND OTHER (USES) (449,498)$ 965,053 1,414,551$
Fund balance - beginning 4,397,997
Fund balance - ending 5,363,050$
Bexar County, TexasSPECIAL REVENUE FUNDS
SCHEDULE OF REVENUES, EXPENDITURES AND CHANGES IN FUNDBALANCE - BUDGET AND ACTUAL
FIRE CODE FUNDFor Fiscal Year Ended September 30, 2018

148
Final BudgetActual
Amount Variance
REVENUES
Court cost and fines 150$ 174$ 24$
Other fees 350,000 397,802 47,802
Revenue from use of assets 1,000 6,635 5,635
TOTAL REVENUES 351,150 404,611 53,461
EXPENDITURES
JUDICIAL
Operational costs 394,450 331,485 62,965 Supplies and materials 5,550 5,450 100
TOTAL JUDICIAL 400,000 336,935 63,065
TOTAL EXPENDITURES 400,000 336,935 63,065
REVENUES OVER (UNDER) EXPENDITURES (48,850)$ 67,676 116,526$
Fund balance - beginning 316,589
Fund balance - ending 384,265$
For Fiscal Year Ended September 30, 2018
Bexar County, TexasSPECIAL REVENUE FUNDS
SCHEDULE OF REVENUES, EXPENDITURES AND CHANGES IN FUNDBALANCE - BUDGET AND ACTUAL
DISTRICT CLERK RECORDS MANAGEMENT FUND

149
Final BudgetActual
Amount Variance
REVENUES
Court cost and fines 530,000$ 563,368$ 33,368$
Revenue from use of assets 300 2,784 2,484
Sales, refunds and miscellaneous 90,000 113,321 23,321
TOTAL REVENUES 620,300 679,473 59,173
EXPENDITURES
JUDICIAL
Personnel costs 373,752 373,752 -
Operational costs 441,561 441,561 -
Supplies and materials 137,293 137,293 -
TOTAL JUDICIAL 952,606 952,606 -
TOTAL EXPENDITURES 952,606 952,606 -
REVENUES OVER (UNDER) EXPENDITURES (332,306) (273,133) 59,173
OTHER FINANCING SOURCES (USES)
Interfund transfers in 330,745 330,745 -TOTAL OTHER FINANCING SOURCES 330,745 330,745 -
REVENUES AND OTHER SOURCES OVER (UNDER) EXPENDITURES (1,561)$ 57,612 59,173$
Fund balance - beginning 8
Fund balance - ending 57,620$
For Fiscal Year Ended September 30, 2018
Bexar County, TexasSPECIAL REVENUE FUNDS
SCHEDULE OF REVENUES, EXPENDITURES AND CHANGES IN FUNDBALANCE - BUDGET AND ACTUAL
LAW LIBRARY FUND

150
Final BudgetActual
Amount Variance
REVENUES
Other fees 30,000$ 40,075 10,075$
Revenue from use of assets 600 2,035 1,435
TOTAL REVENUES 30,600 42,110 11,510
EXPENDITURES
JUDICIAL
Supplies and materials 44,158 42,540 1,618
TOTAL JUDICIAL 44,158 42,540 1,618
TOTAL EXPENDITURES 44,158 42,540 1,618
REVENUES (UNDER) EXPENDITURES (13,558)$ (430) 13,128$
Fund balance - beginning 146,543
Fund balance - ending 146,113$
For Fiscal Year Ended September 30, 2018
Bexar County, TexasSPECIAL REVENUE FUNDS
SCHEDULE OF REVENUES, EXPENDITURES AND CHANGES IN FUNDBALANCE - BUDGET AND ACTUAL
COUNTY WIDE COURT TECHNOLOGY FUND

151
Final BudgetActual
Amount Variance
REVENUES
Court cost and fines 570,000$ 628,199$ 58,199$
Revenue from use of assets - 1,319 1,319
Sales, refunds and miscellaneous - 135 135
TOTAL REVENUES 570,000 629,653 59,653
EXPENDITURES
HEALTH AND PUBLIC WELFARE
Personnel costs 615,438 615,431 7
Remuneration for services 23,890 21,442 2,448
Operational costs 15,690 15,002 688
Supplies and materials 11,300 10,519 781
TOTAL HEALTH AND PUBLIC WELFARE 666,318 662,394 3,924
TOTAL EXPENDITURES 666,318 662,394 3,924
REVENUES OVER (UNDER) EXPENDITURES (96,318) (32,741) 63,577
OTHER FINANCING SOURCES (USES)
Interfund transfers in 32,953 32,953 -
TOTAL OTHER FINANCING SOURCES 32,953 32,953 -
REVENUES AND OTHER SOURCES OVER (UNDER) EXPENDITURES (63,365)$ 212 63,577$
Fund balance - beginning 100,753
Fund balance - ending 100,965$
For Fiscal Year Ended September 30, 2018
Bexar County, TexasSPECIAL REVENUE FUNDS
SCHEDULE OF REVENUES, EXPENDITURES AND CHANGES IN FUNDBALANCE - BUDGET AND ACTUAL
DISPUTE RESOLUTION FUND

152
Final BudgetActual
Amount Variance
REVENUES
Court cost and fines 60,000$ 51,616$ (8,384)$
Revenue from use of assets 2,500 8,447 5,947
TOTAL REVENUES 62,500 60,063 (2,437)
EXPENDITURES
JUDICIAL
Operational costs 40,000 200 39,800
TOTAL JUDICIAL 40,000 200 39,800
TOTAL EXPENDITURES 40,000 200 39,800
REVENUES OVER EXPENDITURES 22,500$ 59,863 37,363$
Fund balance - beginning 512,730
Fund balance - ending 572,593$
Bexar County, TexasSPECIAL REVENUE FUNDS
SCHEDULE OF REVENUES, EXPENDITURES AND CHANGES IN FUNDBALANCE - BUDGET AND ACTUAL
JUSTICES OF PEACE SECURITY FUNDFor Fiscal Year Ended September 30, 2018

153
Final BudgetActual
Amount Variance
REVENUES
Court cost and fines 346,000$ 325,317$ (20,683)$
Revenue from use of assets - 566 566
TOTAL REVENUES 346,000 325,883 (20,117)
EXPENDITURES
HEALTH AND PUBLIC WELFARE
Personnel costs 307,767 306,803 964
Remuneration for services 700 22 678
Operational costs 138,338 138,337 1
Supplies and materials 700 93 607
TOTAL HEALTH AND PUBLIC WELFARE 447,505 445,255 2,250
TOTAL EXPENDITURES 447,505 445,255 2,250
REVENUES (UNDER) EXPENDITURES (101,505) (119,372) (17,867)
OTHER FINANCING SOURCES (USES)
Interfund transfers in 109,430 126,258 16,828
Interfund transfers out (7,925) (6,895) 1,030
TOTAL OTHER FINANCING SOURCES (USES) 101,505 119,363 17,858
REVENUES AND OTHER SOURCES (UNDER) EXPENDITURES AND OTHER (USES) -$ (9) (9)$
Fund balance - beginning 12
Fund balance - ending 3$
For Fiscal Year Ended September 30, 2018
Bexar County, TexasSPECIAL REVENUE FUNDS
SCHEDULE OF REVENUES, EXPENDITURES AND CHANGES IN FUNDBALANCE - BUDGET AND ACTUAL
DOMESTIC RELATIONS FUND

154
Final BudgetActual
Amount Variance
REVENUES
Intergovernmental revenue 80,000$ 240,287$ 160,287$
Revenue from use of assets 1,000 4,760 3,760
TOTAL REVENUES 81,000 245,047 164,047
EXPENDITURES
JUDICIAL
Personnel costs 137,000 132,933 4,067
Remuneration for services 21,050 8,484 12,566
Operational costs 231,350 51,369 179,981
Supplies and materials 9,900 1,090 8,810
TOTAL JUDICIAL 399,300 193,876 205,424
CAPITAL EXPENDITUES 9,000 - 9,000
TOTAL EXPENDITURES 408,300 193,876 214,424
REVENUES OVER (UNDER) EXPENDITURES (327,300)$ 51,171 378,471$
Fund balance - beginning 335,678
Fund balance - ending 386,849$
For Fiscal Year Ended September 30, 2018
Bexar County, TexasSPECIAL REVENUE FUNDS
SCHEDULE OF REVENUES, EXPENDITURES AND CHANGES IN FUNDBALANCE - BUDGET AND ACTUALPROBATE CONTRIBUTION FUND

155
Final BudgetActual
Amount Variance
REVENUES
Intergovernmental revenue 210,414$ 101,691$ (108,723)$
Revenue from use of assets 283 321 38
Sales, refunds and miscellaneous - 100 100
TOTAL REVENUES 210,697 102,112 (108,585)
EXPENDITURESJUDICIAL
Remuneration for services 3,700 3,466 234
TOTAL JUDICIAL 3,700 3,466 234
PUBLIC SAFETY
Remuneration for service 140,446 64,619 75,827
Operational costs 55,405 - 55,405
Supplies and materials 63,233 - 63,233
TOTAL PUBLIC SAFETY 259,084 64,619 194,465
TOTAL EXPENDITURES 262,784 68,085 194,699
REVENUES OVER (UNDER) EXPENDITURES (52,087)$ 34,027 86,114$
Fund balance - beginning 195,787
Fund balance - ending 229,814$
Bexar County, TexasSPECIAL REVENUE FUNDS
SCHEDULE OF REVENUES, EXPENDITURES AND CHANGES IN FUNDBALANCE - BUDGET AND ACTUAL
LAW ENFORCEMENT OFFICER SPECIAL EDUCATION (LEOSE) FUNDFor Fiscal Year Ended September 30, 2018
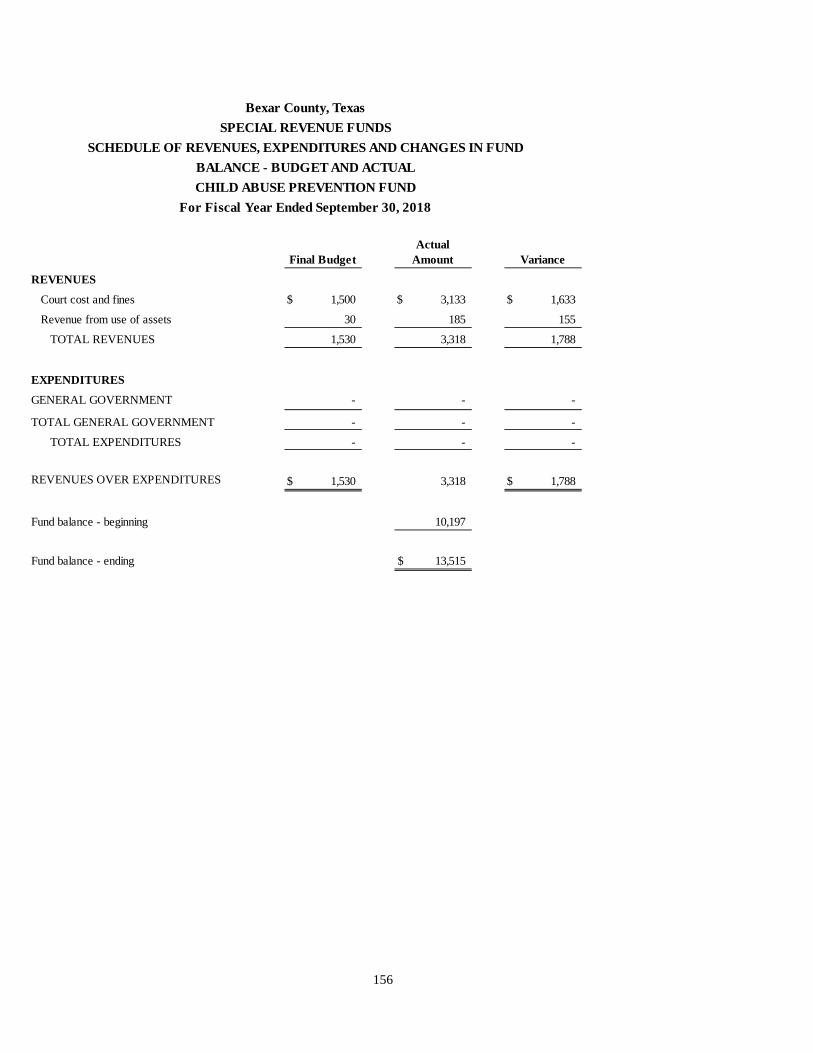
156
Final BudgetActual
Amount Variance
REVENUES
Court cost and fines 1,500$ 3,133$ 1,633$
Revenue from use of assets 30 185 155
TOTAL REVENUES 1,530 3,318 1,788
EXPENDITURES
GENERAL GOVERNMENT - - -
TOTAL GENERAL GOVERNMENT - - -
TOTAL EXPENDITURES - - -
REVENUES OVER EXPENDITURES 1,530$ 3,318 1,788$
Fund balance - beginning 10,197
Fund balance - ending 13,515$
Bexar County, TexasSPECIAL REVENUE FUNDS
SCHEDULE OF REVENUES, EXPENDITURES AND CHANGES IN FUNDBALANCE - BUDGET AND ACTUALCHILD ABUSE PREVENTION FUND
For Fiscal Year Ended September 30, 2018
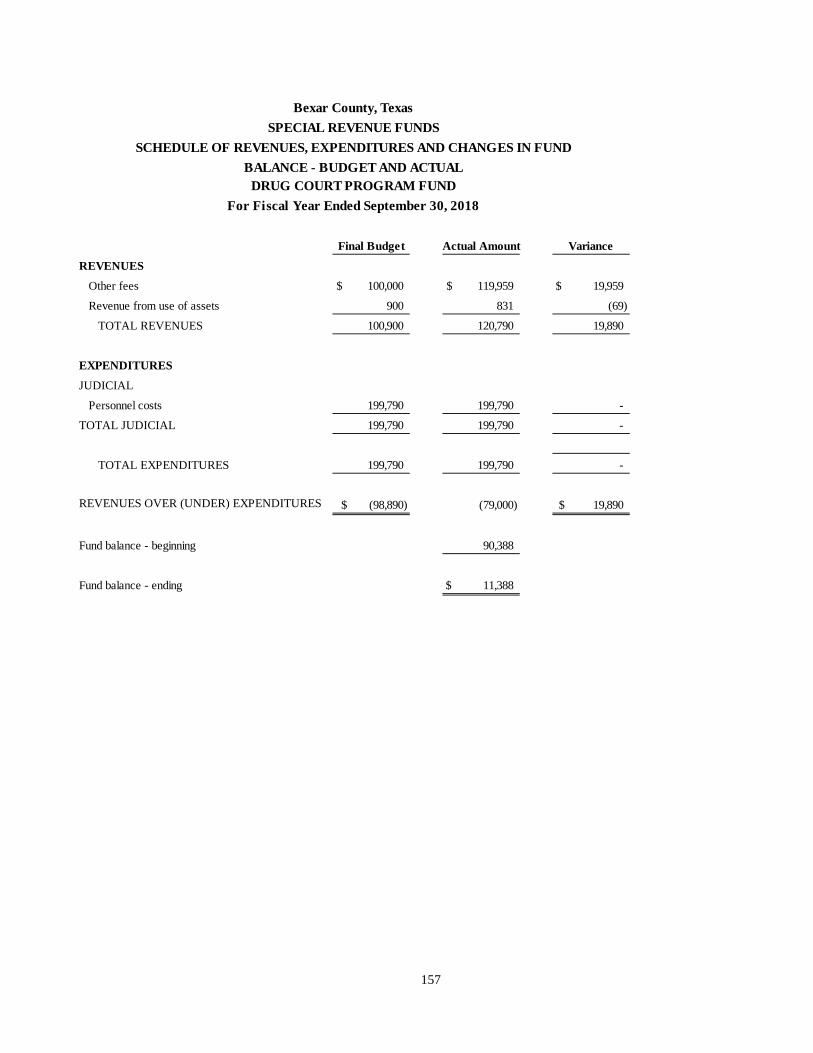
157
Final Budget Actual Amount Variance
REVENUES
Other fees 100,000$ 119,959$ 19,959$
Revenue from use of assets 900 831 (69)
TOTAL REVENUES 100,900 120,790 19,890
EXPENDITURES
JUDICIAL
Personnel costs 199,790 199,790 -
TOTAL JUDICIAL 199,790 199,790 -
TOTAL EXPENDITURES 199,790 199,790 -
REVENUES OVER (UNDER) EXPENDITURES (98,890)$ (79,000) 19,890$
Fund balance - beginning 90,388
Fund balance - ending 11,388$
For Fiscal Year Ended September 30, 2018
Bexar County, TexasSPECIAL REVENUE FUNDS
SCHEDULE OF REVENUES, EXPENDITURES AND CHANGES IN FUNDBALANCE - BUDGET AND ACTUAL
DRUG COURT PROGRAM FUND

158
Final BudgetActual
Amount Variance
REVENUES
Court cost and fines 114,000$ 91,503$ (22,497)$
Revenue from use of assets - 28 28
Sales, refunds and miscellaneous 40,000 - (40,000)
TOTAL REVENUES 154,000 91,531 (62,469)
EXPENDITURESJUDICIAL - - -
TOTAL JUDICIAL - - -
TOTAL EXPENDITURES - - -
REVENUES OVER (UNDER) EXPENDITURES 154,000 91,531 (62,469)
OTHER FINANCING SOURCES (USES)
Interfund transfers out (214,022) (125,043) 88,979
TOTAL OTHER FINANCING (USES) (214,022) (125,043) 88,979
REVENUES OVER (UNDER) EXPENDITURES AND OTHER (USES) (60,022)$ (33,512) 26,510$
Fund balance - beginning 33,512
Fund balance - ending $ -
Bexar County, TexasSPECIAL REVENUE FUNDS
SCHEDULE OF REVENUES, EXPENDITURES AND CHANGES IN FUNDBALANCE - BUDGET AND ACTUAL
FAMILY PROTECTION FEEFor Fiscal Year Ended September 30, 2018

159
Final BudgetActual
Amount Variance
REVENUES
Court cost and fines 260,000$ 285,671$ 25,671$
Revenue from use of assets 700 6,156 5,456
TOTAL REVENUES 260,700 291,827 31,127
EXPENDITURES
JUDICIAL
Operational cost 492,143 472,884 19,259
TOTAL JUDICIAL 492,143 472,884 19,259
TOTAL EXPENDITURES 492,143 472,884 19,259
REVENUES OVER (UNDER) EXPENDITURES (231,443)$ (181,057) 50,386$
Fund balance - beginning 294,317
Fund balance - ending 113,260$
For Fiscal Year Ended September 30, 2018
Bexar County, TexasSPECIAL REVENUE FUNDS
SCHEDULE OF REVENUES, EXPENDITURES AND CHANGES IN FUNDBALANCE - BUDGET AND ACTUAL
DISTRICT COURT RECORDS TECHNOLOGY FUND

160
Final BudgetActual
Amount Variance
REVENUES
Court cost and fines 340,000$ 296,521$ (43,479)$
Revenue from use of assets 400 818 418
TOTAL REVENUES 340,400 297,339 (43,061)
EXPENDITURES
PUBLIC SAFETY
Operational costs 340,400 296,521 43,879
TOTAL PUBLIC SAFETY 340,400 296,521 43,879
TOTAL EXPENDITURES 340,400 296,521 43,879
REVENUES OVER EXPENDITURES -$ 818 818$
Fund balance - beginning 9,138
Fund balance - ending 9,956$
For Fiscal Year Ended September 30, 2018
Bexar County, TexasSPECIAL REVENUE FUNDS
SCHEDULE OF REVENUES, EXPENDITURES AND CHANGES IN FUNDBALANCE - BUDGET AND ACTUALJUVENILE CASE MANAGER FUND

161
Final BudgetActual
Amount Variance
REVENUES
Court cost and fines 130,000$ 134,214$ 4,214$
Revenue from use of assets 1,200 3,136 1,936
TOTAL REVENUES 131,200 137,350 6,150
EXPENDITURES
JUDICIAL
Personnel costs 24,057 22,088 1,969
Remuneration for services 750 550 200
Operational costs 180,150 156,425 23,725
Supplies and materials 150 - 150
TOTAL JUDICIAL 205,107 179,063 26,044
TOTAL EXPENDITURES 205,107 179,063 26,044
REVENUES (UNDER) EXPENDITURES (73,907)$ (41,713) 32,194$
Fund balance - beginning 243,994
Fund balance - ending 202,281$
For Fiscal Year Ended September 30, 2018
Bexar County, TexasSPECIAL REVENUE FUNDS
SCHEDULE OF REVENUES, EXPENDITURES AND CHANGES IN FUNDBALANCE - BUDGET AND ACTUALPROBATE GUARDIANSHIP FUND

162
Final BudgetActual
Amount Variance
REVENUES
Other fees 30,000$ 33,005$ 3,005$
Revenue from use of assets 1,000 4,114 3,114
TOTAL REVENUES 31,000 37,119 6,119
EXPENDITURESJUDICIAL
Remuneration for services 61,500 18,029 43,471
Operational costs 8,000 2,400 5,600
Supplies and materials 10,000 983 9,017
TOTAL JUDICIAL 79,500 21,412 58,088
TOTAL EXPENDITURES 79,500 21,412 58,088
REVENUES OVER (UNDER) EXPENDITURES (48,500)$ 15,707 64,207$
Fund balance - beginning 260,919
Fund balance - ending 276,626$
Bexar County, TexasSPECIAL REVENUE FUNDS
SCHEDULE OF REVENUES, EXPENDITURES AND CHANGES IN FUNDBALANCE - BUDGET AND ACTUAL
PROBATE EDUCATION FUNDFor Fiscal Year Ended September 30, 2018

163
Final BudgetActual
Amount Variance
REVENUES
Court cost and fines 250$ 472$ 222$
Revenue from use of assets 120 422 302
TOTAL REVENUES 370 894 524
EXPENDITURES
GENERAL GOVERNMENT - - -
TOTAL GENERAL GOVERNMENT - - -
TOTAL EXPENDITURES - - -
REVENUES OVER EXPENDITURES 370$ 894 524$
Fund balance - beginning 26,943
Fund balance - ending 27,837$
Bexar County, TexasSPECIAL REVENUE FUNDS
SCHEDULE OF REVENUES, EXPENDITURES AND CHANGES IN FUNDBALANCE - BUDGET AND ACTUAL
JUVENILE DELINQUENCY PREVENTION FUNDFor Fiscal Year Ended September 30, 2018

164
Final BudgetActual
Amount Variance
REVENUES
Intergovernmental revenue 35,100,000$ 34,094,473$ (1,005,527)$
Revenue from use of assets 46,000 45,710 (290)
TOTAL REVENUES 35,146,000 34,140,183 (1,005,817)
EXPENDITUESGENERAL GOVERNMENT
Operational costs 915,000 910,171 4,829
TOTAL GENERAL GOVERNMENT 915,000 910,171 4,829
JUDICIAL
Personnel costs 1,805,870 1,803,654 2,216
Operational costs 2,454,130 2,451,860 2,270
TOTAL JUDICIAL 4,260,000 4,255,514 4,486
PUBLIC SAFETY
Personnel costs 7,415,000 7,403,244 11,756
Operational costs 4,600,000 4,588,307 11,693
TOTAL PUBLIC SAFETY 12,015,000 11,991,551 23,449
EDUCATION AND RECREATION
Personnel costs 16,500 16,414 86
Operational costs 1,122,000 1,121,395 605
Supplies and materials 94,000 93,599 401
TOTAL EDUCATION AND RECREATION 1,232,500 1,231,408 1,092
PUBLIC WORKS
Operational costs 2,027,000 2,026,929 71
TOTAL PUBLIC WORKS 2,027,000 2,026,929 71
(continued)
Bexar County, TexasSPECIAL REVENUE FUNDS
SCHEDULE OF REVENUES, EXPENDITURES AND CHANGES IN FUNDBALANCE - BUDGET AND ACTUAL
GRANTS FUNDFor Fiscal Year Ended September 30, 2018

165
Final Budget
Amount Variance
HEALTH AND PUBLIC WELFARE
Personnel costs 1,900,000$ 1,896,241$ 3,759$
Operational costs 12,440,000 12,435,882 4,118
TOTAL HEALTH AND PUBLIC WELFARE 14,340,000 14,332,123 7,877
CAPITAL EXPENDITURES 1,005,000 1,003,975 1,025
TOTAL EXPENDITURES 35,794,500 35,751,671 42,829
REVENUES (UNDER) EXPENDITURES (648,500) (1,611,488) (962,988)
OTHER FINANCING SOURCES (USES)
Interfund transfers in (150,000) (165,340) 15,340
TOTAL OTHER FINANCING (USES) (150,000) (165,340) 15,340
REVENUES (UNDER) EXPENDITURES AND OTHER (USES) (498,500)$ (1,446,148) (947,648)$
Fund balance - beginning 13,998,857
Fund balance - ending 12,552,709$
For Fiscal Year Ended September 30, 2018
Bexar County, TexasSPECIAL REVENUE FUNDS
SCHEDULE OF REVENUES, EXPENDITURES AND CHANGES IN FUNDBALANCE - BUDGET AND ACTUAL
GRANTS FUND

166
Final BudgetActual
Amount Variance
REVENUES
Other fees 827,604$ 959,824$ 132,220$
Sales, refunds and miscellaneous - 1,338 1,338
TOTAL REVENUES 827,604 961,162 133,558
EXPENDITURESGENERAL GOVERNMENT
Personnel costs 199,046 129,223 69,823
Supplies and materials 2,296,272 2,236,168 60,104
TOTAL GENERAL GOVERNMENT 2,495,318 2,365,391 129,927
JUDICIAL
Supplies and materials 278,481 201,529 76,952
TOTAL JUDICIAL 278,481 201,529 76,952
PUBLIC SAFETY
Supplies and materials 472,695 302,713 169,982
TOTAL PUBLIC SAFETY 472,695 302,713 169,982
EDUCATION AND RECREATION
Supplies and materials 22,152 662 21,490
TOTAL EDUCATION AND RECREATION 22,152 662 21,490
PUBLIC WORKS
Supplies and materials 17,250 3,002 14,248
TOTAL PUBLIC WORKS 17,250 3,002 14,248
HEALTH AND PUBLIC WELFARE
Supplies and materials 18,592 12,218 6,374
TOTAL HEALTH AND PUBLIC WELFARE 18,592 12,218 6,374
TOTAL EXPENDITURES 3,304,488 2,885,515 418,973
REVENUES (UNDER) EXPENDITURES (2,476,884) (1,924,353) 552,531
(continued)
Bexar County, TexasSPECIAL REVENUE FUNDS
SCHEDULE OF REVENUES, EXPENDITURES AND CHANGES IN FUNDBALANCE - BUDGET AND ACTUAL
TECHNOLOGY IMPROVEMENT FUNDFor Fiscal Year Ended September 30, 2018

167
Final BudgetActual
Amount Variance
OTHER FINANCING SOURCES
Interfund transfers in 2,019,472$ 2,019,472$ -$
TOTAL OTHER FINANCING SOURCES 2,019,472$ 2,019,472$ -
REVENUES AND OTHER SOURCES (UNDER) EXPENDITURES (457,412)$ 95,119 552,531$
Fund balance - beginning 825,745
Fund balance - ending 920,864$
For Fiscal Year Ended September 30, 2018
Bexar County, TexasSPECIAL REVENUE FUNDS
SCHEDULE OF REVENUES, EXPENDITURES AND CHANGES IN FUNDBALANCE - BUDGET AND ACTUAL
TECHNOLOGY IMPROVEMENT FUND

168
Final BudgetActual
Amount Variance
REVENUES
Other fees 2,275,000$ 2,468,322$ 193,322$
Revenue from use of assets 40,000 110,800 70,800
Sales, refunds and miscellaneous - 72,188 72,188
TOTAL REVENUES 2,315,000 2,651,310 336,310
EXPENDITURES
PUBLIC WORKS
Personnel costs 1,152,645 1,142,392 10,253
Remuneration for services 22,791 20,377 2,414
Operational costs 890,734 705,276 185,458
Supplies and materials 256,601 35,941 220,660
TOTAL PUBLIC WORKS 2,322,771 1,903,986 418,785
CAPITAL EXPENDITURES 234,188 - 234,188
TOTAL EXPENDITURES 2,556,959 1,903,986 652,973
REVENUES OVER (UNDER) EXPENDITURES (241,959) 747,324 989,283
OTHER FINANCING (USES)
Interfund transfers out (144,000) (54,000) 90,000
TOTAL OTHER FINANCING (USES) (144,000) (54,000) 90,000
REVENUES OVER (UNDER) EXPENDITURES AND OTHER (USES) (385,959)$ 693,324 1,079,283$
Fund balance - beginning 6,362,684
Fund balance - ending 7,056,008$
For Fiscal Year Ended September 30, 2018
Bexar County, TexasSPECIAL REVENUE FUNDS
SCHEDULE OF REVENUES, EXPENDITURES AND CHANGES IN FUNDBALANCE - BUDGET AND ACTUALSTORMWATER MITIGATION FUND

169
Final BudgetActual
Amount Variance
REVENUES
Intergovernmental revenue 169,842$ 296,860$ 127,018$
TOTAL REVENUES 169,842 296,860 127,018
EXPENDITURES
GENERAL GOVERNMENT
Remuneration for services 10,750 - 10,750
Operational costs 308,000 293,231 14,769
Supplies and materials 62,000 3,629 58,371
TOTAL GENERAL GOVERNMENT 380,750 296,860 83,890
TOTAL EXPENDITURES 380,750 296,860 83,890
REVENUES OVER (UNDER) EXPENDITURES (210,908)$ - 210,908$
Fund balance - beginning 1,125
Fund balance - ending 1,125$
Bexar County, TexasSPECIAL REVENUE FUNDS
SCHEDULE OF REVENUES, EXPENDITURES AND CHANGES IN FUNDBALANCE - BUDGET AND ACTUAL
CHAPTER 19 VOTER REGISTAR FUNDFor Fiscal Year Ended September 30, 2018

170
Final BudgetActual
Amount Variance
REVENUES
Intergovernmental revenue 464,148$ 2,150,028$ 1,685,880$
Other fees 14,975 372,558 357,583
TOTAL REVENUES 479,123 2,522,586 2,043,463
EXPENDITURESGENERAL GOVERNMENT
Administration costs 959,860 435,860 519,000
Jurisdictional elections costs 2,525,000 2,522,585 2,415
TOTAL GENERAL GOVERNMENT 3,484,860 2,958,445 521,415
TOTAL EXPENDITURES 3,484,860 2,958,445 521,415
REVENUES (UNDER) EXPENDITURES (3,005,737)$ (435,859) 2,564,878$
Fund balance - beginning 897,626
Fund balance - ending 461,767$
Bexar County, TexasSPECIAL REVENUE FUNDS
SCHEDULE OF REVENUES, EXPENDITURES AND CHANGES IN FUNDBALANCE - BUDGET AND ACTUAL
ELECTIONS CONTRACTING SERVICES FUNDFor Fiscal Year Ended September 30, 2018

171
Final BudgetActual
Amount Variance
REVENUES
Revenue from use of assets 110,000$ 20,000$ (90,000)$
TOTAL REVENUES 110,000 20,000 (90,000)
EXPENDITURESGENERAL GOVERNMENT
Personnel costs 141,148 17,543 123,605
Operational costs 4,485 - 4,485
Supplies and materials 10,500 3,509 6,991
TOTAL GENERAL GOVERNMENT 156,133 21,052 135,081
CAPITAL EXPENDITUES 18,765 18,764 1
TOTAL EXPENDITURES 174,898 39,816 135,082
REVENUES OVER (UNDER) EXPENDITURES (64,898)$ (19,816) 45,082$
Fund balance - beginning 33,498
Fund balance - ending 13,682$
Bexar County, TexasSPECIAL REVENUE FUNDS
SCHEDULE OF REVENUES, EXPENDITURES AND CHANGES IN FUNDBALANCE - BUDGET AND ACTUAL
TAX COLLECTOR'S SPECIAL INVENTORY FUNDFor Fiscal Year Ended September 30, 2018

172
Final BudgetActual
Amount Variance
REVENUES
Intergovenmental revenue -$ 45,000$ 45,000$
Court cost and fines - 12,449 12,449
Other fees 380,834 515,944 135,110
Revenue from use of assets 1,500 6,637 5,137
TOTAL REVENUES 382,334 580,030 197,696
EXPENDITURESJUDICIAL
Personnel costs 498,309 517,466 (19,157)
Operational costs 24,652 24,652 -
TOTAL JUDICIAL 522,961 542,118 (19,157)
TOTAL EXPENDITURES 522,961 542,118 (19,157)
REVENUES OVER (UNDER) EXPENDITURES (140,627)$ 37,912 178,539$
Fund balance - beginning 510,179
Fund balance - ending 548,091$
Bexar County, TexasSPECIAL REVENUE FUNDS
SCHEDULE OF REVENUES, EXPENDITURES AND CHANGES IN FUNDBALANCE - BUDGET AND ACTUAL
DISTRICT ATTORNEY PROGRAMS FUNDFor Fiscal Year Ended September 30, 2018

173
Final BudgetActual
Amount Variance
REVENUES
Court cost and fines 491,916$ 1,381,506$ 889,590$
Revenue from use of assets - 6,034 6,034
Sales, refunds and miscellaneous - 18,796 18,796
TOTAL REVENUES 491,916 1,406,336 914,420
EXPENDITURESJUDICIAL
Personnel costs 464,236 387,180 77,056
Remuneration for services 54,496 6,284 48,212
Operational costs 188,118 129,319 58,799
Supplies and materials 275,496 88,737 186,759
TOTAL JUDICIAL 982,346 611,520 370,826
PUBLIC SAFETY
Personnel costs 24,834 13,269 11,565
Remuneration for services 213,196 101,752 111,444
Operational costs 330,976 195,711 135,265
Supplies and materials 445,430 274,369 171,061
TOTAL PUBLIC SAFETY 1,014,436 585,101 429,335
CAPITAL EXPENDITURES 452,010 273,987 178,023
TOTAL EXPENDITURES 2,448,792 1,470,608 978,184
REVENUES OVER (UNDER) EXPENDITURES (1,956,876)$ (64,272) 1,892,604$
Fund balance - beginning 4,454,045
Fund balance - ending 4,389,773$
Bexar County, TexasSPECIAL REVENUE FUNDS
SCHEDULE OF REVENUES, EXPENDITURES AND CHANGES IN FUNDBALANCE - BUDGET AND ACTUAL
ASSET FORFEITURE FUNDFor Fiscal Year Ended September 30, 2018

174
San Antonio River Improvements Project San Antonio Riverwalk at Camden Street Bridge
F.I.S.H. Artist: Donald Lipski
Photo by Robert Parker Https://robert-parker.smugmug.com

175
PROPRIETARY FUND TYPE
ENTERPRISE FUNDS – are established to account for operations that are financed and operated in a manner similar to private business enterprises where the intent of the governing body is that the costs (expenses, including depreciation) of providing the goods or services to the general public on a continuing basis be financed or recovered primarily through user charges.
SHERIFF’S COMMISSARY FUND – This fund is used to account for the operation of a commissary for jail inmates. The Commissary is funded primarily through profits on sales of commissary items to inmates.
PARKING FACILITIES FUND – This fund is used to account for the operation and maintenance of parking facilities. The facilities are intended to be financed primarily through user charges.
FIRING RANGE FUND – This fund is used to account for the operation and maintenance of the firing range. The facilities are intended to be financed primarily through user charges.
N O N M A J O R
E N T E R P R I S E
F U N D S

176
Sheriff's
CommissaryParking
Facilities Firing Range TotalASSETSCurrent assets: Cash, cash equivalents 138,003$ 131,359$ 3,585$ 272,947$ Investments 1,664,403 1,438,943 43,233 3,146,579 Receivables: Accounts 97,173 - - 97,173 TOTAL CURRENT ASSETS 1,899,579 1,570,302 46,818 3,516,699
Noncurrent assets:Restricted assets:Capital assets: Equipment 565,559 - - 565,559 Reference library 38,960 - - 38,960 Less: Accumulated depreciation (438,125) - - (438,125) TOTAL NONCURRENT ASSETS 166,394 - - 166,394 TOTAL ASSETS 2,065,973 1,570,302 46,818 3,683,093
DEFERRED OUTFLOWS OF RESOURCES
Pension 206,102 33,753 12,090 251,945
TOTAL DEFERRED OUTFLOWS OF RESOURCES 206,102$ 33,753$ 12,090$ 251,945$
LIABILITIESCurrent liabilities: Accounts payable 134,189$ 19,905$ 6,255$ 160,349$ Accrued liabilities 79,831 12,270 7,420 99,521 Due to other governmental units - 9,175 - 9,175 TOTAL CURRENT LIABILITIES 214,020 41,350 13,675 269,045
Noncurrent liabilities:
Net pension liability 583,372 95,526 34,221 713,119 TOTAL NONCURRENT LIABILITIES 583,372 95,526 34,221 713,119
TOTAL LIABILITIES 797,392 136,876 47,896 982,164
DEFERRED INFLOWS OF RESOURCES
Pension 110,763 18,135 6,498 135,396
TOTAL DEFERRED INFLOWS OF RESOURCES 110,763 18,135 6,498 135,396
NET POSITION
Net investment in capital assets 166,393 - - 166,393Unrestricted 1,197,527 1,449,044 4,514 2,651,085
TOTAL NET POSITION 1,363,920$ 1,449,044$ 4,514$ 2,817,478$
Bexar County, TexasCOMBINING STATEMENT OF NET POSITION
NONMAJOR ENTERPRISE FUNDS September 30, 2018

177
Sheriff's Commissary
Parking Facilities Firing Range Total
OPERATING REVENUES
Commissary sales 5,737,097$ - - 5,737,097$
User fees - 1,304,811 1,500 1,306,311
Other income - 645 - 645
TOTAL OPERATING REVENUES 5,737,097 1,305,456 1,500 7,044,053
OPERATING EXPENSES
Personnel costs 2,015,188 348,388 118,157 2,481,733
Purchased services 3,063,414 277,377 60,704 3,401,495
Supplies 223,793 45,835 13,369 282,997
Repairs and maintenance 5,310 56,422 8,816 70,548
Depreciation and amortization 60,629 - - 60,629
TOTAL OPERATING EXPENSES 5,368,334 728,022 201,046 6,297,402
Operating income (loss) 368,763 577,434 (199,546) 746,651
NON-OPERATING REVENUES (EXPENSES)
Investment income 26,657 20,640 2,182 49,479
TOTAL NON-OPERATING REVENUES 26,657 20,640 2,182 49,479
Income (loss) before transfers 395,420 598,074 (197,364) 796,130
Interfund transfers in - - 158,610 158,610
Interfund transfers out - (450,000) - (450,000)
TOTAL TRANSFERS - (450,000) 158,610 (291,390)
Changes in net position 395,420 148,074 (38,754) 504,740
Total net position-beginning 968,500 1,300,970 43,268 2,312,738
Total net position-ending 1,363,920$ 1,449,044$ 4,514$ 2,817,478$
Bexar County, TexasCOMBINING STATEMENT OF REVENUES, EXPENSES AND
CHANGES IN NET POSITION - NONMAJOR ENTERPRISE FUNDSFor Fiscal Year Ended September 30, 2018

178
Sheriff's Commissary
Parking Facilities Firing Range Total
CASH FLOWS FROM OPERATING ACTIVITIESCash received for commissary sales 5,741,602$ -$ -$ 5,741,602$ Cash received for parking fees - 1,305,456 - 1,305,456 Cash received for firing range fees - - 1,500 1,500 Receipts from other governmental units - 224 - 224 Payments to suppliers (3,372,099) (397,963) (83,398) (3,853,460) Payments to employees for services (1,989,115) (354,733) (114,427) (2,458,275) Net cash provided (used) for operating activities 380,388 552,984 (196,325) 737,047
CASH FLOWS FROM NONCAPITALFINANCING ACTIVITIESTransfer from other funds - - 158,610 158,610 Net cash provided by noncapital financing activities - - 158,610 158,610
CASH FLOWS FROM CAPITAL AND RELATEDFINANCING ACTIVITIESTransfer to other funds - (450,000) - (450,000) Net cash (used) for capital and related financing activities - (450,000) - (450,000)
CASH FLOWS FROM INVESTING ACTIVITIESInvestment purchases (472,932) (213,943) - (686,875) Investment sales - - 27,085 27,085 Investment earnings 26,657 20,640 2,182 49,479 Net cash provided (used) by investing activities (446,275) (193,303) 29,267 (610,311)
Net (decrease) in cash and cash equivalents (65,887) (90,319) (8,448) (164,654)
Cash and cash equivalents - beginning of year 203,890 221,678 12,033 437,601
Cash and cash equivalents - end of year 138,003$ 131,359$ 3,585$ 272,947$
Bexar County, TexasSTATEMENT OF CASH FLOWS
NONMAJOR ENTERPRISE FUNDSFor Fiscal Year Ended September 30, 2018
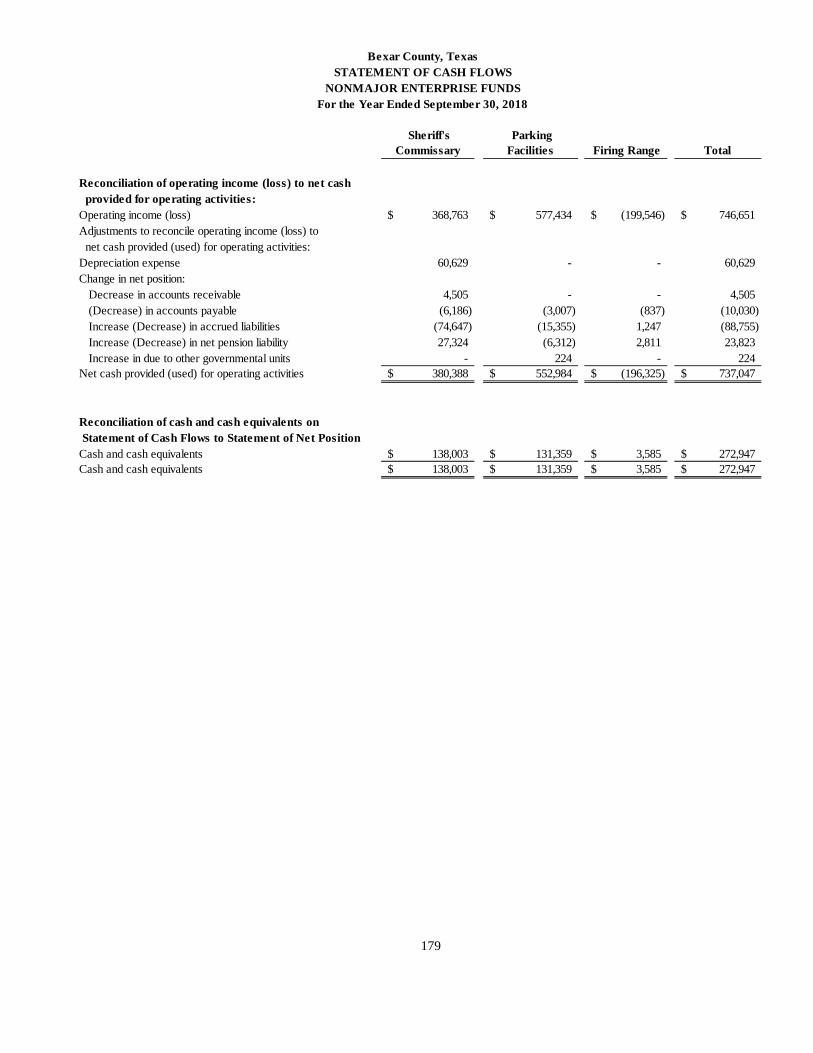
179
Sheriff's Commissary
Parking Facilities Firing Range Total
Reconciliation of operating income (loss) to net cash provided for operating activities:Operating income (loss) 368,763$ 577,434$ (199,546)$ 746,651$ Adjustments to reconcile operating income (loss) to net cash provided (used) for operating activities:Depreciation expense 60,629 - - 60,629 Change in net position: Decrease in accounts receivable 4,505 - - 4,505 (Decrease) in accounts payable (6,186) (3,007) (837) (10,030) Increase (Decrease) in accrued liabilities (74,647) (15,355) 1,247 (88,755) Increase (Decrease) in net pension liability 27,324 (6,312) 2,811 23,823 Increase in due to other governmental units - 224 - 224 Net cash provided (used) for operating activities 380,388$ 552,984$ (196,325)$ 737,047$
Reconciliation of cash and cash equivalents on Statement of Cash Flows to Statement of Net PositionCash and cash equivalents 138,003$ 131,359$ 3,585$ 272,947$ Cash and cash equivalents 138,003$ 131,359$ 3,585$ 272,947$
NONMAJOR ENTERPRISE FUNDSFor the Year Ended September 30, 2018
Bexar County, TexasSTATEMENT OF CASH FLOWS

180
This page intentionally left blank
181
PROPRIETARY FUND TYPE
INTERNAL SERVICE FUNDS - are established to account for the financing of goods or services provided by one department to other departments of the County on a cost-reimbursement basis.
FLEET MAINTENANCE FUND - to account for the maintenance of County vehicles.
OTHER POST EMPLOYMENT BENEFITS FUND – to account for revenues and expenses related to retirement benefits for retirees and their beneficiaries.
SELF-INSURANCE FUND - to account for the receipt of insurance premiums collected from employees and various funds as well as the expense for services and expenses.
RECORDS MANAGEMENT CENTER FUND – to account for the expenses of the records management center facility.
I N T E R N A L
S E R V I C E
F U N D S

182
Fleet Maintenance
Other Post Employment
BenefitsSelf
Insurance
Records Management
Center TotalASSETSCurrent assets: Cash and cash equivalents 144,457$ 135,993$ 5,942,392$ 151,582$ 6,374,424$
Investments - 1,640,166 - - 1,640,166 Inventories 193,998 - - - 193,998 Deposits - - 10,000 - 10,000 Prepaid insurance 413 - - - 413TOTAL CURRENT ASSETS 338,868 1,776,159 5,952,392 151,582 8,219,001
Noncurrent assets
Capital assets:
Buildings and improvements - - 125,708 - 125,708
Equipment - - - 1,087,589 1,087,589
Less: Accumulated depreciation - - (15,714) (719,365) (735,079)
TOTAL NONCURRENT ASSETS - - 109,994 368,224 478,218 TOTAL ASSETS 338,868 1,776,159 6,062,386 519,806 8,697,219
DEFERRED OUTFLOWS OF RESOURCES
Pension 90,015 - 44,822 19,989 154,826
OPEB - 4,637,050 - - 4,637,050TOTAL DEFERRED OUTFLOWS OF RESOURCES 90,015 4,637,050 44,822 19,989 4,791,876
LIABILITIESCurrent liabilities: Accounts payable 41,690$ 20,385$ 326,349$ 4,632$ 393,056$ Claims payable - - 8,349,649 - 8,349,649
Accrued liabilities 16,018 - 10,173 8,488 34,679
TOTAL CURRENT LIABILITIES 57,708 20,385 8,686,171 13,120 8,777,384
Noncurrent liabilities
Advance from other funds 110,000 - - - 110,000
Net pension liability 254,791 - 126,876 56,575 438,242Claims payable - - 1,242,190 - 1,242,190OPEB obligation - 190,671,163 - - 190,671,163TOTAL NONCURRENT LIABILITIES 364,791 190,671,163 1,369,066 56,575 192,461,595
TOTAL LIABILITIES 422,499 190,691,548 10,055,237 69,695 201,238,979
DEFERRED INFLOWS OF RESOURCES
Pension 48,377 - 24,091 10,741 83,209TOTAL DEFERRED INFLOWS OF RESOURCES 48,377 - 24,091 10,741 83,209
NET POSITION
Net investment in capital assets - - 109,994 368,215 478,209
Unrestricted (41,993) (184,278,339) (4,082,114) 91,144 (188,311,302)
TOTAL NET POSITION (41,993)$ (184,278,339)$ (3,972,120)$ 459,359$ (187,833,093)$
Bexar County, TexasINTERNAL SERVICE FUNDS
COMBINING STATEMENT OF NET POSITIONFor Fiscal Year Ended September 30, 2018

183
Fleet Maintenance
Other Post Employment
BenefitsSelf-
Insurance
Records Management
Center Total
OPERATING REVENUES
Premiums $ - 2,806,543$ 51,852,498$ $ - 54,659,041$
Records management storage fees - - - 100,000 100,000
Employee clinic fees - - 16,635 - 16,635
Fleet maintenance sales 855,444 - - - 855,444
Other income 1,997 - 1,878,564 - 1,880,561
TOTAL OPERATING REVENUES 857,441 2,806,543 53,747,697 100,000 57,511,681
OPERATING EXPENSES
Administrative fees - 262,990 2,667,939 - 2,930,929
Claims expenses - 7,180,604 48,667,322 - 55,847,926
Insurance expenses - - 1,459,555 - 1,459,555
OPEB costs - 11,513,434 - - 11,513,434
Personnel costs 859,485 - 446,864 203,307 1,509,656
Rent and utilities 13,382 - 277 55,548 69,207
Purchased services 11,438 - 236,318 19,048 266,804
Supplies 43,893 - 2,686 6,030 52,609
Repairs and maintenance 53,610 - - 28,125 81,735
Depreciation and amortization - - 6,285 105,322 111,607
TOTAL OPERATING EXPENSES 981,808 18,957,028 53,487,246 417,380 73,843,462
Operating income (loss) (124,367) (16,150,485) 260,451 (317,380) (16,331,781)
NON-OPERATING REVENUES (EXPENSES)
Investment income - 59,763 - - 59,763
TOTAL NON-OPERATING REVENUES - 59,763 - - 59,763
Income (loss) before transfers (124,367) (16,090,722) 260,451 (317,380) (16,272,018)
Interfund transfers in 120,000 6,725,171 525,426 100,000 7,470,597
TOTAL TRANSFERS 120,000 6,725,171 525,426 100,000 7,470,597
Changes in net position (4,367) (9,365,551) 785,877 (217,380) (8,801,421)
Total net position-beginning (Restated - See Note S) (37,626) (174,912,788) (4,757,997) 676,739 (179,031,672)
Total net position-ending (41,993)$ (184,278,339)$ (3,972,120)$ 459,359$ (187,833,093)$
Bexar County, TexasINTERNAL SERVICE FUNDS
COMBINING STATEMENT OF REVENUES, EXPENSES AND CHANGES IN FUND NET POSITIONFor Fiscal Year Ended September 30, 2018

184
Fleet Maintenance OPEB Self-Insurance
Records Management
Center Total
CASH FLOWS FROM OPERATING ACTIVITIES Cash received for premiums -$ 2,415,033$ 53,731,063$ -$ 56,146,096$ Cash received for employee clinic fees - - 16,635 16,635 Cash received for fleet maintenance services 857,441 - - - 857,441 Cash received for records management storage - - - 100,000 100,000 Payments to vendors, suppliers, and contractors (245,307) (243,213) (4,180,538) (104,394) (4,773,452) Payments to employees for services (844,604) - (430,449) (204,328) (1,479,381) Claims paid - (7,180,604) (47,970,986) - (55,151,590) Net cash provided (used) by operating activities (232,470) (5,008,784) 1,165,725 (208,722) (4,284,251)
CASH FLOWS FROM NONCAPITAL FINANCING ACTIVITIES Transfers from other funds 120,000 6,725,171 525,426 100,000 7,470,597Net cash provided by noncapital financing activities 120,000 6,725,171 525,426 100,000 7,470,597
CASH FLOWS FROM CAPITAL FINANCING ACTIVITIESPurchase of capital assets - - - (14,939) (14,939)Net cash (used) by capital financing activities - - - (14,939) (14,939)
CASH FLOWS FROM INVESTING ACTIVITIESInvestment purchases - (1,640,158) - - (1,640,158)Investment earnings - 59,763 - - 59,763Net cash (used) by investing activities - (1,580,395) - - (1,580,395)
Net increase (decrease) in cash and cash equivalents (112,470) 135,992 1,691,151 (123,661) 1,591,012
Cash and cash equivalents - beginning of year 256,927 1 4,251,241 275,243 4,783,412
Cash and cash equivalents - end of year 144,457$ 135,993$ 5,942,392$ 151,582$ 6,374,424$
Bexar County, TexasCOMBINING STATEMENT OF CASH FLOWS
INTERNAL SERVICE FUNDSFor Fiscal Year Ended September 30, 2018

185
Fleet Maintenance OPEB Self-Insurance
Records Management
Center Total
provided (used) by operating activities:Operating income (loss) (124,367)$ (16,150,485) 260,451$ (317,380)$ (16,331,781)$ Adjustments to reconcile operating income (loss) to net cash provided (used) for operating activities:Depreciation expense - - 6,285 105,322 111,607Change in net position: (Increase) in inventories (22,494) - - - (22,494) Decrease in prepaid insurance 1,803 - - - 1,803 Increase (decrease) in accounts payable (85,083) 19,777 207,002 4,256 145,952 Increase in claims payable - - 696,336 - 696,336 Increase in OPEB obligation - 11,513,434 - - 11,513,434 (Decrease) in accrued liabilities (19,583) - (18,326) (305) (38,214) Increase (decrease) in net pension liability 17,254 - 13,977 (615) 30,616 (Decrease) in due to other funds - (391,510) - - (391,510)Net cash provided (used) by operating activities (232,470)$ (5,008,784)$ 1,165,725$ (208,722)$ (4,284,251)$
Reconciliation of cash and cash equivalents on Statement of Cash Flows to Statement of Net PositionCash and cash equivalents 144,457$ 135,993$ 5,942,392$ 151,582$ 6,374,424$ Cash and cash equivalents 144,457$ 135,993$ 5,942,392$ 151,582$ 6,374,424$
Reconciliation of operating income (loss) to net cash
Bexar County, TexasCOMBINING STATEMENT OF CASH FLOWS
INTERNAL SERVICE FUNDSFor Fiscal Year Ended September 30, 2018

186
This page intentionally left blank

187
FIDUCIARY FUND TYPE
AGENCY FUNDS – are used to account for assets held by the County as an agent for individuals, private organizations, other governments and other funds. They are custodial in nature (assets equal liabilities) and do not involve measurements of results of operations.
SECONDARY RECIPIENT GRANTS FUND – to account for the receipt and disbursement of grant funds for which the County serves only as a conduit.
OFFICERS’ SPECIAL FUNDS – to account for the receipt and disbursement of funds held by various County officers pending disposition.
CLERKS’ TRUST FUNDS – to account for funds held in the registry of the courts by the County Clerk and District Clerk pending a court order directing payment.
FLEXIBLE SPENDING ACCOUNTS FUND – to account for deposits and disbursements related to the County’s employees flexible spending accounts.
BAIL BOND SECURITY FUND – to account for deposits that attorneys place with the County in order to post bond for defendants.
TAX COLLECTOR’S ACCOUNTS FUNDS – to account for the receipt of tax collections and the distribution to County funds and other taxing jurisdictions.
COMMUNITY CORRECTIONS FUNDS – to account for the receipt and disbursement of funds administered by the Community Supervision and Corrections Department.
INMATE BANKING FUND – to account for the receipt and disbursement of the personal funds of inmates confined in the County jail.
UNCLAIMED MONEY FUND – to account for funds the County holds that rightfully belong to another party.
DISTRICT ATTORNEY SEIZED ASSETS – to account for assets seized pursuant to the state and federal forfeiture laws (Chapter 59, Code of Criminal Procedure) but still awaiting judicial determination.
A G E N C Y F U N D S

Bexar County, Texas AGENCY FUNDS
COMBINING NET POSITION September 30, 2018
188
Secondary Flexible BailRecipient Officers' Clerks' Spending Bond
Grants Special Trust Accounts Security
ASSETS
Cash and cash equivalents -$ 5,033,085$ 42,859,685$ 152,451$ 2,177,818$ Accounts receivable 773,881 517,952 4,699 8,985 - Deferred outflows of resources - pension 168,711 - - - - Due from other governmental units 353,455 - - - -
TOTAL ASSETS 1,296,047$ 5,551,037$ 42,864,384$ 161,436$ 2,177,818$
LIABILITIES
Vouchers payable 22,108$ -$ -$ 137,401$ 382,829$ Accrued liabilities 1,176,738 - - 24,035 - Due to participants 6,454 687,556 42,864,384 - 1,794,989 Deferred inflows of resources - pension 90,667 - - - - Due to other governmental units 80 4,863,481 - - -
TOTAL LIABILITIES 1,296,047$ 5,551,037$ 42,864,384$ 161,436$ 2,177,818$

189
TaxCollector's Community Inmate Unclaimed DA SeizedAccounts Corrections Banking Money Assets Total
48,048,907$ 7,702,085$ 261,349$ 128,227$ 4,482,510$ 110,846,117$ - 6,047,289 - - - 7,352,806 - 2,554,014 - - - 2,722,725 - - - - - 353,455
48,048,907$ 16,303,388$ 261,349$ 128,227$ 4,482,510$ 121,275,103$
-$ 27,821$ -$ -$ -$ 570,159$ - 7,647,566 - - - 8,848,339 - 7,255,654 261,349 - 4,482,510 57,352,896 - 1,372,347 - - - 1,463,014
48,048,907 - - 128,227 - 53,040,695
48,048,907$ 16,303,388$ 261,349$ 128,227$ 4,482,510$ 121,275,103$

Bexar County, Texas AGENCY FUNDS
COMBINING NET POSITION September 30, 2018
190
Balance Balance
October 1, 2017 Additions Deletions September 30, 2018
ASSETS
Cash and cash equivalents 108,447,121$ 110,846,117$ 108,447,121$ 110,846,117$ Accounts receivable 7,213,414 7,352,806 7,213,414 7,352,806 Deferred outflows of resources - pension 7,991,439 2,722,725 7,991,439 2,722,725 Due from other governmental units 707,030 353,455 707,030 353,455
TOTAL ASSETS 124,359,004$ 121,275,103$ 124,359,004$ 121,275,103$
LIABILITIES
Vouchers payable 581,309$ 570,159$ 581,309$ 570,159$ Accrued liabilities 16,070,833 8,848,339 16,070,833 8,848,339 Due to participants 60,217,718 57,352,896 60,217,718 57,352,896 Deferred inflows of resources - pension 681,510 1,463,014 681,510 1,463,014 Due to other governmental units 46,807,634 53,040,695 46,807,634 53,040,695
TOTAL LIABILITIES 124,359,004$ 121,275,103$ 124,359,004$ 121,275,103$

Bexar County, Texas AGENCY FUNDS
COMBINING NET POSITION September 30, 2018
191
Balance Balance October 1, 2017 Additions Deletions September 30, 2018
Secondary Recipient of GrantsASSETS
Accounts receivable 404,467$ 773,881$ 404,467$ 773,881$ Deferred outflows of resources - pension 446,416 168,711 446,416 168,711 Due from other governmental units 707,030 353,455 707,030 353,455
TOTAL ASSETS 1,557,913$ 1,296,047$ 1,557,913$ 1,296,047$
LIABILITIESVouchers payable 145,554$ 22,108$ 145,554$ 22,108$ Accrued liabilities 1,367,755 1,176,738 1,367,755 1,176,738 Due to participants 6,454 6,454 6,454 6,454 Deferred inflows of resources - pension 38,070 90,667 38,070 90,667 Due to other governmental units 80 80 80 80
TOTAL LIABILITIES 1,557,913$ 1,296,047$ 1,557,913$ 1,296,047$
Officers' Special FundsASSETS
Cash and cash equivalents 5,634,823$ 5,033,085$ 5,634,823$ 5,033,085$ Accounts receivable 330,733 517,952 330,733 517,952
TOTAL ASSETS 5,965,556$ 5,551,037$ 5,965,556$ 5,551,037$
LIABILITIESDue to participants 1,102,075$ 687,556$ 1,102,075$ 687,556$ Due to other governmental units 4,863,481 4,863,481 4,863,481 4,863,481
TOTAL LIABILITIES 5,965,556$ 5,551,037$ 5,965,556$ 5,551,037$
Clerks' Trust FundsASSETS
Cash and cash equivalents 46,918,518$ 42,859,685$ 46,918,518$ 42,859,685$ Accounts receivable 7,201 4,699 7,201 4,699
TOTAL ASSETS 46,925,719$ 42,864,384$ 46,925,719$ 42,864,384$
LIABILITIESDue to participants 46,925,719$ 42,864,384$ 46,925,719$ 42,864,384$
TOTAL LIABILITIES 46,925,719$ 42,864,384$ 46,925,719$ 42,864,384$

Bexar County, Texas AGENCY FUNDS
COMBINING NET POSITION September 30, 2018
192
Balance Balance October 1, 2017 Additions Deletions September 30, 2018
Flexible Spending AccountsASSETS
Cash and cash equivalents 153,382$ 152,451$ 153,382$ 152,451$ Accounts receivable 8,985 8,985 8,985 8,985
TOTAL ASSETS 162,367$ 161,436$ 162,367$ 161,436$
LIABILITIESVouchers payable 101,331$ 137,401$ 101,331$ 137,401$ Accrued liabilities 61,036 24,035 61,036 24,035
TOTAL LIABILITIES 162,367$ 161,436$ 162,367$ 161,436$
Bail Bond Security FundASSETS
Cash and cash equivalents 1,977,158$ 2,177,818$ 1,977,158$ 2,177,818$
TOTAL ASSETS 1,977,158$ 2,177,818$ 1,977,158$ 2,177,818$
LIABILITIESVouchers payable 214,100$ 382,829$ 214,100$ 382,829$ Due to participants 1,763,058 1,794,989 1,763,058 1,794,989
TOTAL LIABILITIES 1,977,158$ 2,177,818$ 1,977,158$ 2,177,818$
Tax Collector's AccountsASSETS
Cash and cash equivalents 41,826,614$ 48,048,907$ 41,826,614$ 48,048,907$
TOTAL ASSETS 41,826,614$ 48,048,907$ 41,826,614$ 48,048,907$
LIABILITIESDue to other governmental units 41,826,614$ 48,048,907$ 41,826,614$ 48,048,907$
TOTAL LIABILITIES 41,826,614$ 48,048,907$ 41,826,614$ 48,048,907$

Bexar County, Texas AGENCY FUNDS
COMBINING NET POSITION September 30, 2018
193
Balance Balance October 1, 2017 Additions Deletions September 30, 2018
Community CorrectionsASSETS
Cash and cash equivalents 7,069,170$ 7,702,085$ 7,069,170$ 7,702,085$ Accounts receivable 6,462,028 6,047,289 6,462,028 6,047,289 Deferred outflows of resources - pension 7,545,023 2,554,014 7,545,023 2,554,014
TOTAL ASSETS 21,076,221$ 16,303,388$ 21,076,221$ 16,303,388$
LIABILITIESVouchers payable 120,324$ 27,821$ 120,324$ 27,821$ Accrued liabilities 14,642,042 7,647,566 14,642,042 7,647,566 Deferred inflows of resources - pension 643,440 1,372,347 643,440 1,372,347 Due to participants 5,670,415 7,255,654 5,670,415 7,255,654
TOTAL LIABILITIES 21,076,221$ 16,303,388$ 21,076,221$ 16,303,388$
Inmate BankingASSETS
Cash and cash equivalents 272,362$ 261,349$ 272,362$ 261,349$
TOTAL ASSETS 272,362$ 261,349$ 272,362$ 261,349$
LIABILITIESDue to participants 272,362$ 261,349$ 272,362$ 261,349$
TOTAL LIABILITIES 272,362$ 261,349$ 272,362$ 261,349$
Unclaimed Money
ASSETSCash and cash equivalents 117,459$ 128,227$ 117,459$ 128,227$
TOTAL ASSETS 117,459$ 128,227$ 117,459$ 128,227$
LIABILITIESDue to other governmental units 117,459$ 128,227$ 117,459$ 128,227$
TOTAL LIABILITIES 117,459$ 128,227$ 117,459$ 128,227$
DA Seized Assets
ASSETSCash and cash equivalents 4,477,635$ 4,482,510$ 4,477,635$ 4,482,510$
TOTAL ASSETS 4,477,635$ 4,482,510$ 4,477,635$ 4,482,510$
LIABILITIESDue to participants 4,477,635$ 4,482,510$ 4,477,635$ 4,482,510$
TOTAL LIABILITIES 4,477,635$ 4,482,510$ 4,477,635$ 4,482,510$

194
San Pedro Creek Project Segment 1 De Todos Caminos Somos Todos Uno
From All Roads, We Are All One Artist: Adriana M. Garcia
Photo by Peter Petroff

Bexar County, Texas STATISTICAL SECTION OVERVIEW
September 30, 2018
195
The statistical section is organized in six sections:
• Financial Trends – Compiles information reported in the Comprehensive Annual Financial Report over the past ten years. These schedules report how the County’s financial position and well-being have changed over time.
Table 1 – Net Position by Component Table 2 – Changes in Net Position Table 3 – Net Changes in Fund Balance, Governmental Funds Table 4 – Fund Balances, Governmental Funds
• Revenue Capacity Information – Provides information regarding the County’s major own-source revenue (property taxes) and the stability/growth of that revenue.
Table 5 – Assessed Value and Estimated Actual Value of Taxable Property Table 6 – Direct and Overlapping Property Tax Rates by Tax Year Table 7 – Principal Property Taxpayers Table 8 – Property Tax Levies and Collections
• Debt Capacity Information – Provides information on the County’s outstanding debt, the ability to repay the debt, and the ability to issue additional debt.
Table 9 – Ratio of Outstanding Debt by Type Table 10 – Ratio of Outstanding General Bonded County Debt Table 11 – Ratio of Annual Debt Service for General Bonded Debt to Total Expenditures All
Governmental Fund Types Table 12 – Direct and Overlapping Governmental Activities Debt Table 13 – Pledged-Revenue Coverage Table 14 – Motor Vehicle Rental Tax Collections Table 15 – Hotel Occupancy Tax Net Collections Table 16 – Hotel Occupancy Tax Collections – Top Ten Hotels Table 17 – Convention Statistics Table 18 – San Antonio Hotel Occupancies and Average Daily Rates/History Table 19 – County Expenditures for Assets Owned by Other Entities
• Demographic and Economic Information – Provides information regarding the County’s socioeconomic environment; specifically, its taxpayers, employers, and the changes to those groups over the past ten years.
Table 20 – Demographic and Economic Statistics Table 21 – Principal Employers
• Operating Information – Provides information on its employees, operation, and facilities Table 22 – Operating Indicators by Function/Program Table 23 – Capital Asset Statistics by Function/Program Table 24 – Full-Time Equivalent County Government Employees by Function/Program
• Miscellaneous Information – Provides detailed information on the County’s Rates Table 25 – Analysis of Funding Progress and Contribution Rates Table 26 – Legal Debt Margin Information Table 27 – Miscellaneous Information
Over the past ten years Bexar County has experienced an increase in the population of taxpayers. This growth has led to increased development, and accordingly, the tax base has increased. The County has also increased its operating, debt, and capital expenditures to meet the demand of the growing population and provide adequate services.

Table 1
Bexar County, Texas NET POSITION BY COMPONENT, LAST TEN YEARS
For Fiscal Years Ended September 30, (Unaudited)
196
2018 2017 2016 2015 2014Governmental activities (Restated)
Net investment in capital assets $1,012,651,582 $ 965,387,857 $ 934,396,266 $ 894,124,992 $ 860,081,979 Restricted for:
Debt service 81,352,856 60,506,401 39,793,717 32,839,512 50,483,099 Grants and special revenues 12,552,709 13,998,857 14,994,930 14,990,484 13,580,285 Capital projects 129,236,402 183,002,698 145,327,592 69,577,989 121,632,446 Legislative 50,815,806 44,172,699 39,064,271 40,752,062 32,904,826
Unrestricted (943,175,051) (803,009,229) (620,083,745) (444,153,476) (441,770,656)Total governmental activities net position $ 343,434,304 $ 464,059,283 $ 553,493,031 $ 608,131,563 $ 636,911,979
Business-type activitiesNet investment in capital assets $ 61,511,565 $ 65,978,076 $ 67,413,044 $ 129,774,372 $ 48,009,070 Restricted for:
Debt Service 25,820,995 24,458,709 24,478,767 27,281,811 24,198,644 Unrestricted (146,379,859) (154,272,031) (158,904,249) (218,711,772) (150,985,175)
Total business-type activities net position $ (59,047,299) $ (63,835,246) $ (67,012,438) $ (61,655,589) $ (78,777,461)
Primary governmentNet investment in capital assets $1,074,163,147 $1,031,365,933 $1,001,809,310 $1,023,899,364 $ 908,091,049 Restricted 299,778,768 326,139,364 263,659,277 185,441,858 242,799,300 Unrestricted (1,089,554,910) (957,281,260) (778,987,994) (662,865,248) (592,755,831)
Total primary government net position $ 284,387,005 $ 400,224,037 $ 486,480,593 $ 546,475,974 $ 558,134,518
Source: Comprehensive Annual Financial Reports (CAFR).

Table 1 (Continued)
197
2013 2012 2011 2010 2009
$ 890,541,511 $ 855,395,328 $ 830,351,671 667,452,063$ 552,659,899$
54,407,649 70,322,846 71,270,325 72,590,214 58,544,093 9,006,848 10,580,293 12,565,983 6,450,008 7,010,763 48,998,893 36,381,015 14,139,934 7,180,849 29,460,809 30,621,078 27,361,998 24,984,690 22,097,507 21,092,719 (336,108,071) (169,515,206) (87,278,102) 14,448,995 11,672,815 $ 697,467,908 $ 830,526,274 $ 866,034,501 790,219,636$ 680,441,098$
$ 50,287,916 $ 53,683,820 $ 55,333,951 58,475,790$ 55,037,943$
20,189,790 16,283,647 16,844,006 11,778,600 27,873,483 (107,025,370) (46,741,238) (6,211,870) 20,268,109 24,948,302 $ (36,547,664) $ 23,226,229 $ 65,966,087 90,522,499$ 107,859,728$
$ 940,829,427 $ 909,079,148 $ 885,685,622 725,927,853$ 607,697,842$ 163,224,258 160,929,799 139,804,938 120,097,178 143,981,867 (443,133,441) (216,256,444) (93,489,972) 34,717,104 36,621,117 $ 660,920,244 $ 853,752,503 $ 932,000,588 880,742,135$ 788,300,826$

Table 2
Bexar County, Texas CHANGES IN NET POSITION, LAST TEN YEARS
For Fiscal Years Ended September 30, (Unaudited and accrual basis accounting)
198
2018 2017 2016 2015 2014Expenses (Restated)Governmental activities:
General government 143,816,856$ 138,112,719$ 130,047,303$ 110,745,934$ 107,772,965$ Judicial 118,945,194 113,574,714 104,620,926 93,563,195 89,143,802 Public safety 243,887,769 239,226,903 222,339,298 211,423,049 199,517,541 Education and recreation 9,910,149 7,712,093 8,120,117 6,334,976 5,803,910 Public works 188,397,391 225,090,295 206,348,816 156,484,523 134,049,117 Health and public welfare 20,902,695 26,302,915 26,081,172 28,287,807 24,694,078 Interest and other fees 82,019,470 77,974,335 84,878,028 72,808,687 68,474,001 Unallocated depreciation 114,711 114,711 114,711 114,711 114,711
Total governmental activities 807,994,235 828,108,685 782,550,371 679,762,882 629,570,125 Business-type activities:
Venue Fund 28,050,246 29,423,382 34,080,868 10,680,025 68,628,840 Commissary Fund 5,364,084 4,954,319 4,439,412 3,734,031 3,434,758 Firing Range Fund 201,046 183,283 194,346 183,278 156,842 Parking Facilities Fund 728,022 762,507 842,589 769,832 607,739
Total business-type activities 34,343,398 35,323,491 39,557,215 15,367,166 72,828,179 Total primary government 842,337,633$ 863,432,176$ 822,107,586$ 695,130,048$ 702,398,304$ Program RevenuesGovernmental activities: Charges for service:
General government 35,693,180$ 35,859,657$ 36,315,150$ 34,514,356$ 33,242,843$ Judicial 18,437,622 16,021,342 18,830,998 12,043,502 19,740,552 Public safety 33,172,774 33,508,474 31,798,026 34,563,781 34,088,157 Education and recreation 119 548 691 1,020 788 Public works 20,083,431 19,581,006 20,327,240 19,345,148 18,300,625 Health and public welfare 1,734,751 744,661 404,185 345,758 343,109
Operating grants and contributions:General government 635,021 631,563 3,086,022 4,927,006 5,762,280 Judicial 8,343,200 6,704,154 5,748,936 5,215,747 6,496,804 Public safety 14,438,664 13,385,549 12,810,807 11,891,397 14,721,238 Education and recreation 1,327,655 322,723 224,725 125,000 211,000 Public works 1,202,096 3,480,417 7,700 97,480 2,520 Health and public welfare 14,531,656 20,124,961 17,651,399 19,972,362 18,245,249
Capital grants and contributions:Public Works 139,498,994 115,519,024 148,270,339 126,167,667 112,011,234
Total governmental activities 289,099,163$ 265,884,079$ 295,476,218$ 269,210,224$ 263,166,399$
Source: Comprehensive Annual Financial Reports (CAFR) for applicable years.

Table 2 (Continued)
199
2013 2012 2011 2010 2009
$ 101,135,305 $ 92,955,003 $ 88,844,727 $ 79,241,599 $ 79,952,880 86,567,259 85,766,375 89,523,783 84,233,142 82,775,317 194,156,366 192,289,893 186,374,799 191,453,779 186,516,533 6,521,027 8,964,869 10,838,874 10,215,955 9,767,900 254,058,915 166,817,829 159,386,468 90,456,200 77,045,904 25,646,248 33,613,676 29,164,474 32,396,181 31,435,262 57,190,164 46,034,776 42,552,731 35,272,177 22,115,394 114,711 114,711 114,711 114,711 114,711 725,389,995 626,557,132 606,800,567 523,383,744 489,723,901
82,836,919 66,119,373 47,297,341 38,312,586 24,051,523 3,099,136 3,132,808 3,349,848 3,214,752 3,387,512 112,046 - - - - 633,636 519,977 307,949 - - 86,681,737 69,772,158 50,955,138 41,527,338 27,439,035 $ 812,071,732 $ 696,329,290 $ 657,755,705 $ 564,911,082 $ 517,162,936
$ 33,949,799 $ 30,742,789 $ 29,315,903 $ 27,395,795 $ 27,939,525 10,415,106 11,590,304 13,189,094 14,205,997 11,703,776 34,983,339 34,016,987 28,563,454 29,883,485 26,389,811 1,500 1,500 333,200 285,668 217,990 17,765,629 17,007,799 15,791,488 15,526,491 14,663,986 344,410 56,145 935,617 943,697 993,796
3,933,230 3,451,222 4,156,702 1,942,725 1,670,749 5,185,664 4,695,937 4,470,725 4,783,113 6,336,138 12,221,127 14,514,051 18,847,341 20,321,533 13,482,071 200,000 - 1,369,585 107,665 715,796 - - 2,505,065 129,294 59,943 20,630,393 25,468,653 27,755,036 17,984,327 14,058,173
114,740,142 106,463,221 201,984,356 157,728,121 112,841,904
$ 254,370,339 $ 248,008,608 $ 349,217,566 $ 291,237,911 $ 231,073,658

Table 2 (Continued)
Bexar County, Texas CHANGES IN NET POSITION, LAST TEN YEARS
For Fiscal Years Ended September 30, (Unaudited and accrual basis of accounting)
200
2018 2017 2016 2015 2014(Restated)
Business-type activities:Charges for services 8,343,408$ 7,853,831$ 6,820,264$ 6,543,340$ 6,322,469$ Capital grants and contributions -$ 2,089,354$ -$ -$ -$
Total business-type activities 8,343,408 9,943,185 6,820,264 6,543,340 6,322,469 Total primary government $ 297,442,571 $ 275,827,264 $ 302,296,482 $ 275,753,564 $ 269,488,868 Net ExpensesGovernmental activities (518,895,072)$ (562,224,606)$ (487,074,153)$ (410,552,658)$ (366,403,726)$ Business-type activities (25,999,990) (25,380,306) (32,736,951) (8,823,826) (66,505,710) Total primary government (544,895,062)$ (587,604,912)$ (519,811,104)$ (419,376,484)$ (432,909,436)$
General Revenues and Other Changes in Net PositionGovernmental Activities:
Taxes:Property taxes 416,955,334$ 394,856,774$ 365,595,459$ 312,595,952$ 305,381,502$ Flood control taxes 19,336,934 22,119,090 21,878,200 34,107,565 31,923,865 Bingo taxes 1,579,557 1,124,906 1,499,237 1,451,055 1,280,993 Motor vehicle taxes 15,820,056 16,399,324 16,272,869 14,979,416 13,956,172 Mixed drink taxes 10,552,989 9,785,281 9,423,643 8,833,088 8,353,717 Unrestricted investment earnings 13,392,740 8,295,219 5,188,258 4,621,801 2,124,784 Miscellaneous 22,991,436 19,980,840 12,308,641 4,948,018 7,826,124 Gain on disposal of assets 331,133 - - - - Transfers between governmental and business-type activities 291,390 229,424 269,314 235,347 293,196
Total governmental activities 501,251,569 472,790,858 432,435,621 381,772,242 371,140,353 Business-type Activities:
Motor vehicle taxes 9,924,336 9,673,817 9,754,326 9,175,855 8,644,849 Occupancy taxes 19,351,541 18,237,592 17,475,219 16,913,746 16,322,866 Unrestricted investment earnings 1,802,805 864,943 347,395 69,024 43,993 Miscellaneous 645 10,570 72,476 22,420 3,000 Transfers between governmental and business-type activities (291,390) (229,424) (269,314) (235,347) (293,196)
Total business-type activities 30,787,937 28,557,498 27,380,102 25,945,698 24,721,512 Total Primary Government 532,039,506$ 501,348,356$ 459,815,723$ 407,717,940$ 395,861,865$
Change in Net PositionGovernmental activities (17,643,503)$ (89,433,748)$ (54,638,532)$ (28,780,416)$ 4,736,627$ Business-type activities 4,787,947 3,177,192 (5,356,849) 17,121,872 (41,784,198) Total primary government (12,855,556)$ (86,256,556)$ (59,995,381)$ (11,658,544)$ (37,047,571)$
Source: Comprehensive Annual Financial Reports (CAFR) for applicable years.

Table 2 (Continued)
201
2013 2012 2011 2010 2009
$ 5,774,948 $ 5,121,101 $ 4,882,504 $ 4,682,544 $ 4,555,635 $ - $ - $ - $ - $ -
5,774,948 5,121,101 4,882,504 4,682,544 4,555,635 $ 260,145,287 $ 253,129,709 $ 354,100,070 295,920,455$ 235,629,293$
$(467,461,236) $(378,548,524) $(257,583,001) $(232,145,833) $ (258,650,243) (79,494,685) (64,651,057) (46,072,634) (36,849,243) (22,883,400) $(546,955,921) $(443,199,581) $(303,655,635) (268,995,076)$ (281,533,643)$
289,003,130$ 286,918,075$ 281,355,998$ 285,110,519$ 275,869,660$ 30,111,625 29,298,076 28,976,192 29,213,225 34,620,600 1,149,925 1,095,392 1,034,600 928,749 905,780
12,512,742 10,594,249 9,216,992 8,470,889 10,031,273 6,393,077 5,770,200 6,527,575 6,482,878 6,228,156 1,601,732 2,528,607 2,499,439 2,777,878 7,340,211 5,366,849 6,399,746 7,206,835 8,826,902 12,145,918
- - (2,831,146) 113,331 123,790
341,068 435,952 453,070 - - 346,480,148 343,040,297 334,439,555 341,924,371 347,265,388
8,302,881 7,927,555 7,395,457 7,017,695 6,731,847 15,543,139 14,402,231 13,519,585 12,320,625 11,564,549
19,538 17,365 21,247 167,173 336,802 10 - 9,373 2,072 2,834
(341,068) (435,952) (453,070) - - 23,524,500 21,911,199 20,492,592 19,507,565 18,636,032
370,004,648$ 364,951,496$ 354,932,147$ 361,431,936$ 365,901,420$
(124,539,508)$ (35,508,227)$ 76,856,554$ 109,778,538$ 88,615,145$ (57,382,289) (42,739,858) (25,580,043) (17,337,229) (4,247,368)
(181,921,797)$ (78,248,085)$ 51,276,511$ 92,441,309$ 84,367,777$

Table 3
Bexar County, Texas NET CHANGES IN FUND BALANCE, GOVERNMENTAL FUNDS
Last Ten Years (Modified accrual basis of accounting)
(Unaudited)
202
2018 2017 2016 2015Revenues Ad valorem taxes 435,014,178$ 416,185,808$ 387,534,025$ 346,870,065$ Other taxes, licenses, and permits 45,927,299 44,771,993 43,949,171 41,366,167 Intergovernmental revenue 52,164,833 73,512,073 70,825,628 69,317,626 Court costs and fines 19,847,313 20,942,708 20,532,249 29,685,296 Fees on motor vehicles 22,315,190 21,843,855 23,566,635 22,382,580 Other fees 40,357,549 38,236,799 35,545,865 27,376,884 Commissions from governmental units 5,041,751 4,850,594 4,678,422 4,383,707 Revenues from use of assets 28,740,544 24,555,514 20,936,751 20,868,387 Sales, refunds, and miscellaneous 22,604,614 19,176,269 11,701,866 4,579,824
Total Revenues 672,013,271 664,075,613 619,270,612 566,830,536
ExpendituresGeneral government 114,879,026 111,280,331 104,585,060 90,074,738 Judicial 115,414,816 104,101,581 98,337,542 92,606,334 Public safety 227,017,424 211,764,721 199,907,962 199,834,826 Education and recreation 8,907,589 6,995,572 16,136,266 5,881,290 Public works 111,236,307 152,194,087 135,874,326 88,893,619 Health and public welfare 21,078,152 25,947,472 25,792,646 28,369,035 Capital expenditures 104,268,694 77,613,158 67,535,925 68,919,071 Debt service:
Principal 29,900,000 27,430,000 29,520,000 25,725,000 Interest 77,536,864 74,023,589 73,782,125 70,799,866 Bond issuance cost 3,321,972 1,043,539 3,477,898 2,626,246 Debt service SARA 3,102,341 3,081,120 3,086,790 2,846,408
Total Expenditures 816,663,185 795,475,170 758,036,540 676,576,433
Excess (deficiency) of revenues overexpenditures (144,649,914) (131,399,557) (138,765,928) (109,745,897)
Other Financing Sources (Uses)Interfund transfers in 20,711,058 23,510,048 21,742,360 18,461,275 Interfund transfers out (27,890,265) (35,696,933) (29,634,190) (26,387,072) Issuance of long term debt 40,840,000 113,610,000 91,675,000 133,920,000 Issuance of refunding bonds 412,855,000 - 350,155,000 175,745,000 Payment to refunded debt paying agent (469,913,894) - (392,499,089) (205,501,225) Premium on bond issues 65,035,489 12,362,400 54,235,769 48,954,002
Total Other Financing Sources (Uses) 41,637,388 113,785,515 95,674,850 145,191,980
Net Change in Fund Balances (103,012,526)$ (17,614,042)$ (43,091,078)$ 35,446,083$
Debt service as a percentage of noncapital expenditures 15.1% 14.1% 15.0% 15.9%
Source: Comprehensive Annual Financial Reports (CAFR).

Table 3 (Continued)
203
2014 2013 2012 2011 2010 2009
337,320,246$ 319,716,213$ 312,328,560$ 309,879,849$ 312,626,778$ 308,919,094$ 39,520,903 34,774,586 35,384,613 25,751,912 23,588,288 23,105,524 66,332,349 77,221,430 63,600,138 69,776,671 52,477,680 39,935,873 31,564,405 29,002,601 28,286,612 28,636,474 28,723,501 27,989,595 21,499,603 20,802,047 20,395,853 23,101,681 23,280,134 24,228,958 24,986,300 24,897,062 21,483,624 17,520,617 18,017,567 17,630,868 4,184,550 4,006,304 4,244,598 4,779,636 4,423,514 3,632,217
17,444,065 16,324,000 17,339,699 14,677,230 16,981,610 19,769,465 6,818,230 4,440,392 5,548,406 7,798,411 9,643,909 15,200,828
549,670,651 531,184,635 508,612,103 501,922,481 489,762,981 480,412,422
89,594,893 82,373,919 79,850,671 72,372,014 70,265,609 72,125,092 87,362,147 84,556,591 82,126,315 84,136,746 81,547,606 81,372,423
188,260,671 182,665,115 176,643,544 174,264,394 179,697,609 178,449,602 5,326,751 5,873,245 8,618,453 10,252,009 10,937,115 9,680,173
75,373,089 195,489,744 111,367,011 115,084,358 55,372,105 46,923,748 24,763,525 26,873,015 33,113,146 28,958,430 31,545,348 31,366,407 79,325,538 50,306,999 94,469,871 83,128,036 87,500,585 86,289,068
28,465,000 29,790,000 30,920,000 30,425,000 25,285,000 28,177,246 68,319,100 50,339,550 44,068,795 42,292,081 32,546,245 19,904,430
782,639 4,055,869 1,637,339 142,341 1,801,640 3,192,902 3,309,055 4,387,134 4,900,000 5,000,000 4,700,000 4,700,000
650,882,408 716,711,181 667,715,145 646,055,409 581,198,862 562,181,091
(101,211,757) (185,526,546) (159,103,042) (144,132,928) (91,435,881) (81,768,669)
11,986,733 12,129,547 15,136,590 16,457,750 15,931,474 7,489,827 (20,424,235) (17,694,800) (20,993,626) (17,835,144) (15,981,005) (7,489,827)
- 530,720,000 144,719,999 - 151,800,000 339,720,000 65,055,000 - 17,650,000 - 36,915,000 14,890,000
(72,555,312) - (20,417,103) - (39,384,000) (14,925,453) 8,166,796 40,480,868 9,066,853 - 11,423,782 7,034,116
(7,771,018) 565,635,615 145,162,713 (1,377,394) 160,705,251 346,718,663
(108,982,775)$ 380,109,069$ (13,940,329)$ (145,510,322)$ 69,269,370$ 264,949,994$
16.9% 12.0% 13.1% 12.9% 11.7% 10.1%

Table 4
Bexar County, Texas FUND BALANCES, GOVERNMENTAL FUNDS
Last Ten Years (Modified accrual basis of accounting)
(Unaudited)
204
2018 2017 2016 2015 2014General Fund
Nonspendable 5,177,751$ 5,209,672$ 5,170,575$ 5,178,405$ 5,515,600$ Unassigned 87,977,792 85,441,267 78,999,256 72,810,880 75,441,449
Total general fund 93,155,543$ 90,650,939$ 84,169,831$ 77,989,285$ 80,957,049$
All Other Governmental FundsDebt Service
Restricted 81,935,785$ 60,482,700$ 39,908,543$ 31,967,772$ 50,695,263$ Capital Projects
Nonspendable - - - - 2,664,181 Restricted 437,480,992 569,743,285 617,713,129 673,110,865 623,954,823
Nonmajor Governmental FundsRestricted 63,368,515 58,171,556 54,059,201 55,742,546 46,485,111 Committed 920,864 825,745 1,637,563 1,768,877 376,835
Total all other governmental funds 583,706,156$ 689,223,286$ 713,318,436$ 762,590,060$ 724,176,213$
2013 2012 2011 2010 1 2009 1
General FundNonspendable 5,178,657$ 5,158,860$ 5,279,320$ -$ -$ Unassigned 67,281,583 62,222,223 55,724,026 - -
Total general fund 72,460,240$ 67,381,083$ 61,003,346$ -$ -$
All Other Governmental FundsDebt Service
Committed 66,694,458$ 70,281,380$ 71,160,124$ -$ -$ Capital Projects
Nonspendable 2,645,022 2,614,406 2,000,000 - - Restricted 732,492,566 355,586,673 376,020,003 - -
Nonmajor Governmental FundsNonspendable - - - - - Restricted 39,627,926 37,942,291 37,550,673 - - Committed 195,825 201,135 213,151 - -
Total all other governmental funds 841,655,797$ 466,625,885$ 486,943,951$ -$ -$
Source: Comprehensive Annual Financial Reports (CAFR).Note: 1 Due to implementation of GASB statement No. 54 in fiscal year 2011, fund balance
classification have changed. See historical fund balance classifications on the next page.

Table 4 (Continued)
Bexar County, Texas FUND BALANCES, GOVERNMENTAL FUNDS
Last Ten Years (Modified accrual basis of accounting)
(Unaudited)
205
2018 2 2017 2 2016 2 2015 2 2014 2
General Fund Reserved 1 -$ -$ -$ -$ -$ Unreserved - - - - - Total general fund -$ -$ -$ -$ -$
All Other Governmental Funds Reserved 1 -$ -$ -$ -$ -$ Unreserved, designated, for: Capital projects fund - - - - - Special revenue funds 2 - - - - - Unreserved, Special Revenue Funds - - - - - Total all other governmental funds -$ -$ -$ -$ -$
2013 2 2012 2 2011 2 2010 2009General Fund Reserved 1 -$ -$ -$ 744,722$ 573,247$ Unreserved - - - 53,965,492 48,061,941 Total general fund -$ -$ -$ 54,710,214$ 48,635,188$
All Other Governmental Funds Reserved 1 -$ -$ -$ 153,409,448$ 157,340,992$ Unreserved, designated, for: Capital projects fund - - - 467,633,270 396,000,394 Special revenue funds 2 - - - 866,492 575,446 Unreserved, Special Revenue Funds - - - 17,879,884 22,677,918 Total all other governmental funds -$ -$ -$ 639,789,094$ 576,594,750$
Source: Comprehensive Annual Financial Reports (CAFR).Note: 1 Includes encumbrances, debt service, legislative and long-term receivables.
2 Due to the implementation of GASB statement No. 54 in fiscal year 2011, fundbalance classifications have changed. See new fund balance classifications on the previous page.

Table 5
Bexar County, Texas ASSESSED VALUE AND ESTIMATED ACTUAL VALUE OF TAXABLE PROPERTY
Last Ten Years (Unaudited)
206
Estimated Market ValueFiscal Real Personal Less: Tax Exempt Total Taxable Total Direct Year 1 Property Property Property Assessed Value Tax Rate
2009 96,098,030,762 10,879,880,752 10,037,665,304 96,940,246,210 0.326866
2010 96,935,894,115 10,793,289,797 9,417,396,606 98,311,787,306 0.326866
2011 95,758,509,873 10,260,182,144 9,074,438,799 96,944,253,218 0.326866
2012 95,525,388,954 10,509,046,368 9,042,113,650 96,992,321,672 0.326866
2013 96,828,757,445 11,078,331,512 9,145,325,077 98,761,763,880 0.326866
2014 101,555,514,321 12,095,102,326 9,433,068,676 104,217,547,971 0.326866
2015 108,988,074,386 12,741,542,079 9,861,803,919 111,867,812,546 0.314500
2016 123,522,194,440 13,947,775,890 10,194,687,680 127,275,282,650 0.314500
2017 135,790,796,909 14,202,156,160 10,713,085,748 139,279,867,321 0.308950
2018 146,719,004,010 14,698,658,965 11,164,572,615 150,253,090,360 0.304097
Sources: Bexar County Tax Assessor-Collector Certified Roll Reports (For FY 2009-2018). Note: 1 Tax figures represent the fiscal year not the Ad Valorem Tax Year.

207
BEXAR COUNTY COURTHOUSE
Photo by Peter Petroff
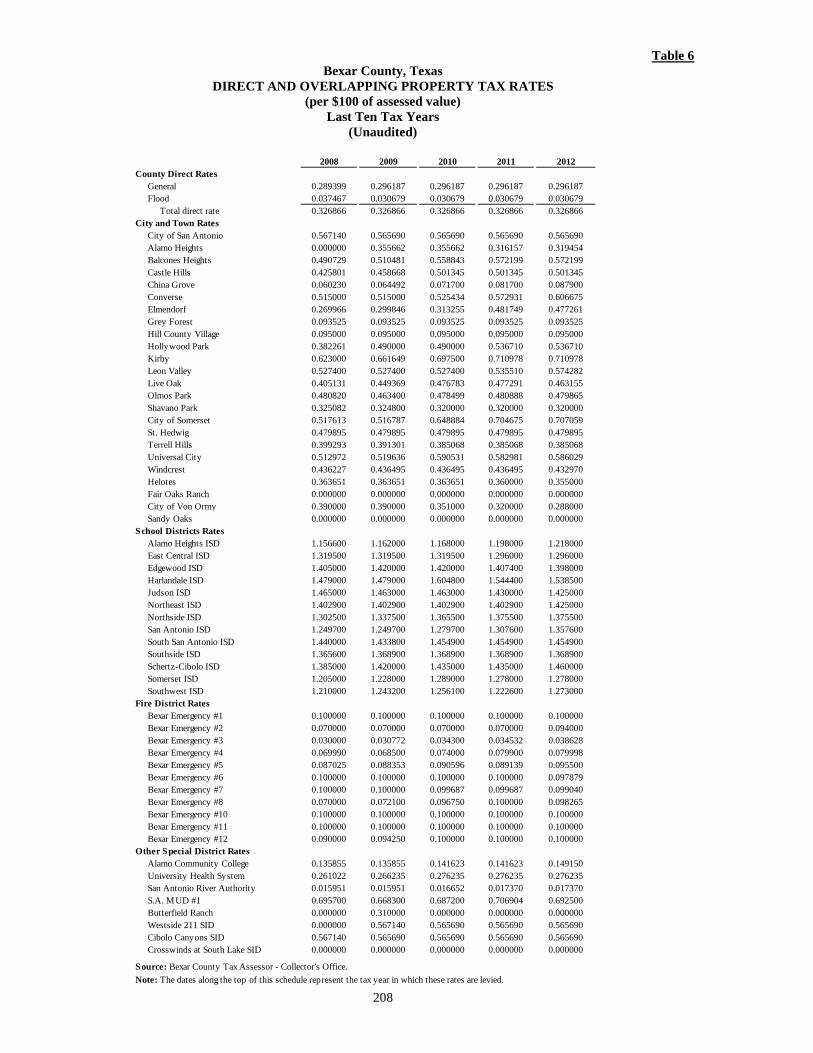
Table 6 Bexar County, Texas
DIRECT AND OVERLAPPING PROPERTY TAX RATES (per $100 of assessed value)
Last Ten Tax Years (Unaudited)
208
2008 2009 2010 2011 2012County Direct Rates
General 0.289399 0.296187 0.296187 0.296187 0.296187Flood 0.037467 0.030679 0.030679 0.030679 0.030679
Total direct rate 0.326866 0.326866 0.326866 0.326866 0.326866City and Town Rates
City of San Antonio 0.567140 0.565690 0.565690 0.565690 0.565690Alamo Heights 0.000000 0.355662 0.355662 0.316157 0.319454Balcones Heights 0.490729 0.510481 0.558843 0.572199 0.572199Castle Hills 0.425801 0.458668 0.501345 0.501345 0.501345China Grove 0.060230 0.064492 0.071700 0.081700 0.087900Converse 0.515000 0.515000 0.525434 0.572931 0.606675Elmendorf 0.269966 0.299846 0.313255 0.481749 0.477261Grey Forest 0.093525 0.093525 0.093525 0.093525 0.093525Hill County Village 0.095000 0.095000 0.095000 0.095000 0.095000Hollywood Park 0.382261 0.490000 0.490000 0.536710 0.536710Kirby 0.623000 0.661649 0.697500 0.710978 0.710978Leon Valley 0.527400 0.527400 0.527400 0.535510 0.574282Live Oak 0.405131 0.449369 0.476783 0.477291 0.463155Olmos Park 0.480820 0.463400 0.478499 0.480888 0.479865Shavano Park 0.325082 0.324800 0.320000 0.320000 0.320000City of Somerset 0.517613 0.516787 0.648884 0.704675 0.707059St. Hedwig 0.479895 0.479895 0.479895 0.479895 0.479895Terrell Hills 0.399293 0.391301 0.385068 0.385068 0.385068Universal City 0.512972 0.519636 0.590531 0.582981 0.586029Windcrest 0.436227 0.436495 0.436495 0.436495 0.432970Helotes 0.363651 0.363651 0.363651 0.360000 0.355000Fair Oaks Ranch 0.000000 0.000000 0.000000 0.000000 0.000000
0.390000 0.390000 0.351000 0.320000 0.288000Sandy Oaks 0.000000 0.000000 0.000000 0.000000 0.000000
School Districts RatesAlamo Heights ISD 1.156600 1.162000 1.168000 1.198000 1.218000East Central ISD 1.319500 1.319500 1.319500 1.296000 1.296000Edgewood ISD 1.405000 1.420000 1.420000 1.407400 1.398000Harlandale ISD 1.479000 1.479000 1.604800 1.544400 1.538500Judson ISD 1.465000 1.463000 1.463000 1.430000 1.425000Northeast ISD 1.402900 1.402900 1.402900 1.402900 1.425000Northside ISD 1.302500 1.337500 1.365500 1.375500 1.375500San Antonio ISD 1.249700 1.249700 1.279700 1.307600 1.357600South San Antonio ISD 1.440000 1.433800 1.454900 1.454900 1.454900Southside ISD 1.365600 1.368900 1.368900 1.368900 1.368900Schertz-Cibolo ISD 1.385000 1.420000 1.435000 1.435000 1.460000Somerset ISD 1.205000 1.228000 1.289000 1.278000 1.278000Southwest ISD 1.210000 1.243200 1.256100 1.222600 1.273000
Fire District RatesBexar Emergency #1 0.100000 0.100000 0.100000 0.100000 0.100000Bexar Emergency #2 0.070000 0.070000 0.070000 0.070000 0.094000Bexar Emergency #3 0.030000 0.030772 0.034300 0.034532 0.038628Bexar Emergency #4 0.069990 0.068500 0.074000 0.079900 0.079998Bexar Emergency #5 0.087025 0.088353 0.090596 0.089139 0.095500Bexar Emergency #6 0.100000 0.100000 0.100000 0.100000 0.097879Bexar Emergency #7 0.100000 0.100000 0.099687 0.099687 0.099040Bexar Emergency #8 0.070000 0.072100 0.096750 0.100000 0.098265Bexar Emergency #10 0.100000 0.100000 0.100000 0.100000 0.100000Bexar Emergency #11 0.100000 0.100000 0.100000 0.100000 0.100000Bexar Emergency #12 0.090000 0.094250 0.100000 0.100000 0.100000
Other Special District RatesAlamo Community College 0.135855 0.135855 0.141623 0.141623 0.149150University Health System 0.261022 0.266235 0.276235 0.276235 0.276235San Antonio River Authority 0.015951 0.015951 0.016652 0.017370 0.017370S.A. MUD #1 0.695700 0.668300 0.687200 0.706904 0.692500Butterfield Ranch 0.000000 0.310000 0.000000 0.000000 0.000000Westside 211 SID 0.000000 0.567140 0.565690 0.565690 0.565690Cibolo Canyons SID 0.567140 0.565690 0.565690 0.565690 0.565690Crosswinds at South Lake SID 0.000000 0.000000 0.000000 0.000000 0.000000
Source: Bexar County Tax Assessor - Collector's Office. Note: The dates along the top of this schedule represent the tax year in which these rates are levied.
City of Von Ormy

Table 6 (Continued)
209
2013 2014 2015 2016 2017
0.296187 0.283821 0.297500 0.293250 0.2912290.030679 0.030679 0.017000 0.015700 0.0128680.326866 0.314500 0.314500 0.308950 0.304097
0.565690 0.565690 0.558270 0.558270 0.5582700.325762 0.390262 0.390262 0.389900 0.3864390.572199 0.572199 0.539300 0.551000 0.5830000.501345 0.501345 0.501345 0.501345 0.5013450.089000 0.085330 0.086207 0.084000 0.0830000.606675 0.585518 0.540198 0.502660 0.5026600.477261 0.442316 0.400000 0.370000 0.3880610.093525 0.093525 0.088441 0.088441 0.0884410.095000 0.095000 0.145000 0.145000 0.1450000.511000 0.511000 0.510081 0.510081 0.5100810.729376 0.729376 0.729376 0.729376 0.7293760.582915 0.575507 0.561615 0.556599 0.5565990.445401 0.510000 0.467691 0.446837 0.4434750.470000 0.442785 0.442785 0.442785 0.4327850.320000 0.309617 0.287742 0.287742 0.2877420.707059 0.698171 0.670920 0.663852 0.6638520.479895 0.479895 0.443633 0.424091 0.4106320.371729 0.370525 0.345906 0.339538 0.3476730.564043 0.560492 0.543828 0.562804 0.5617520.415231 0.340900 0.334100 0.308093 0.3080920.350000 0.350000 0.350000 0.350000 0.3500000.000000 0.000000 0.000000 0.000000 0.3295000.255000 0.249935 0.231232 0.000000 0.0000000.000000 0.000000 0.250000 0.241250 0.241250
1.218000 1.205000 1.195000 1.195000 1.2000001.275000 1.275000 1.265000 1.285000 1.3350001.382600 1.362700 1.355900 1.355900 1.3851781.528800 1.528800 1.528800 1.528800 1.5288001.425000 1.425000 1.420000 1.470000 1.4250001.440600 1.440600 1.415000 1.385000 1.3650001.375500 1.375500 1.375500 1.375500 1.3755001.357600 1.382600 1.382600 1.512600 1.5326001.451500 1.451500 1.451500 1.451500 1.4515001.368900 1.368900 1.368900 1.368900 1.6071001.490000 1.490000 1.490000 1.470000 1.4900001.278000 1.278000 1.278000 1.278000 1.4507001.401622 1.465282 1.414900 1.473000 1.473000
0.100000 0.100000 0.100000 0.099571 0.1000000.098007 0.098945 0.098945 0.100000 0.1000000.050877 0.051408 0.047763 0.045730 0.0479670.082025 0.077727 0.072674 0.056994 0.0548310.100000 0.100000 0.100000 0.100000 0.1000000.100000 0.100000 0.100000 0.100000 0.1000000.100000 0.099510 0.098506 0.100000 0.1000000.100000 0.100000 0.100000 0.100000 0.0992300.100000 0.100000 0.100000 0.096820 0.0968200.099131 0.100000 0.100000 0.100000 0.1000000.100000 0.100000 0.100000 0.100000 0.100000
0.149150 0.149150 0.149150 0.149150 0.1491500.276235 0.276235 0.276235 0.276235 0.2762350.017798 0.017500 0.017290 0.017290 0.0172900.703200 0.687700 0.627700 0.634500 0.6377000.000000 0.000000 0.000000 0.000000 0.0000000.565690 0.565690 0.558270 0.558270 0.5582700.565690 0.565690 0.558270 0.558270 0.5582700.000000 0.000000 0.000000 0.000000 0.558270

Table 7
Bexar County, Texas PRINCIPAL PROPERTY TAXPAYERS
Current and Nine Years Ago (Unaudited)
210
2018Percent of Total
Market Value Taxable Value
H. E. Butt Grocery Company 1,438,403,939$ 0.96%
Microsoft Corporation 906,777,580 0.60%
Methodist Healthcare System 804,220,545 0.54%
Walmart Stores Inc. 750,514,830 0.50%
Baptist (VHS San Antonio Partners LP) 538,674,377 0.36%
Toyota Motor MFG Texas Inc. 764,277,476 0.51%
Well Svcs A Div of Schlumberger Tech Corp 355,025,390 0.24%
Southwestern Bell Telephone 343,012,099 0.23%
USAA 332,200,530 0.22%
Frankel Family Trust 313,777,350 0.21%6,546,884,116$ 4.37%
2009Percent of Total
Market Value Taxable Value
H.E. Butt Grocery Company 926,841,969$ 0.96%
Methodist Healthcare System 459,806,611 0.48%
AT&T 408,854,755 0.42%
Walmart Stores Inc. 392,639,185 0.41%
Baptist (VHS San Antonio Partners LP) 375,476,876 0.39%
USAA 343,756,700 0.36%
La Cantera Retail LTD Partnership 263,640,000 0.27%
Frost National Bank 209,948,288 0.22%
Frankel Family Trust 199,812,310 0.21%
SA Real Estate LLP 171,986,360 0.18%3,752,763,054$ 3.90%
Source: Bexar Appraisal District

Table 8
Bexar County, Texas PROPERTY TAX LEVIES AND COLLECTIONS
Last Ten Fiscal Years (Unaudited)
211
County Tax Rate - General and Debt
SubsequentCollections Receivable
Fiscal Year
Taxes Levied for Fiscal Year 1 Amount
Percent of Levy
Taxes from Prior Year Levy 2 Amount
Percent of Current Levy
Outstanding Taxes from Prior
Years 1
2009 275,433,604 270,493,314 98.2 3,312,200 273,805,514 99.4 12,359,490 2010 285,746,736 279,982,520 98.0 3,151,479 283,133,999 99.1 13,953,925 2011 282,346,706 277,373,606 98.2 3,133,018 280,506,624 99.3 14,306,351 2012 283,055,152 278,676,422 98.5 2,961,991 281,638,413 99.5 13,760,990 2013 288,449,751 284,572,346 98.7 1,795,353 286,367,699 99.3 13,399,256 2014 303,646,918 300,176,637 98.9 757,675 300,934,312 99.1 12,891,611 2015 312,332,006 309,128,544 99.0 700,400 309,828,944 99.2 12,486,407 2016 367,074,411 363,253,615 99.0 1,054,438 364,308,053 99.2 12,777,394 2017 396,044,482 391,792,920 98.9 (444,501) 391,348,419 98.8 13,542,280 2018 420,791,069 416,023,201 98.9 - 416,023,201 98.9 14,748,317
County Tax Rate - Flood and Debt
SubsequentCollections Receivable
Fiscal Year
Taxes Levied for Fiscal Year Amount
Percent of Levy
Taxes from Prior Year Levy 2 Amount
Percent of Current Levy
Outstanding Taxes from Prior
Years 1
2009 34,968,389 34,354,457 98.2 422,035 34,776,492 99.5 1,100,234 2010 29,500,683 28,908,352 98.0 329,148 29,237,500 99.1 1,245,183 2011 29,242,522 28,733,381 98.3 320,200 29,053,581 99.4 1,288,486 2012 29,461,328 29,005,583 98.5 309,770 29,315,353 99.5 1,265,205 2013 30,143,855 29,736,667 98.6 185,510 29,922,177 99.3 1,256,623 2014 31,892,713 31,526,569 98.9 83,638 31,610,207 99.1 1,216,575 2015 34,212,269 33,856,775 99.0 79,632 33,936,407 99.2 1,203,514 2016 21,854,015 21,614,187 98.9 66,934 21,681,121 99.2 1,086,536 2017 22,157,732 21,904,585 98.9 (22,194) 21,882,391 98.8 1,077,136 2018 19,515,953 19,275,734 98.8 - 19,275,734 98.8 1,089,329
Source: Bexar County Tax Assessor - Collector TC-168 Reports. Note: 1 Outstanding taxes from prior years consists of all delinquent taxes
from tax year 2017 - 1978 for County, and tax year 2017 - 1988 for Flood.2 Negative figures represent refund adjustments on prior year collections done in FY18.
Collected Within theFiscal Year of the Levy
Collected Within theFiscal Year of the Levy
Total Collections to Date
Total Collections to Date

Table 9
Bexar County, Texas RATIO OF OUTSTANDING DEBT BY TYPE
Last Ten Fiscal Years (Unaudited)
212
YearRefunding
Bonds
General Obligation
BondsCertificates of
ObligationOther
Obligations
Unamortized Premiums and Discounts, net3
Total Bonds Payable
2009 49,525,000 47,665,000 619,220,000 39,384,000 12,688,804 768,482,804 2010 78,765,000 69,105,000 731,970,000 - 23,237,728 903,077,728 2011 69,580,000 66,430,000 713,405,000 - 21,926,641 871,341,641 2012 76,410,000 58,035,000 828,265,000 - 27,369,278 990,079,278 2013 68,195,000 55,325,000 1,340,120,000 - 66,262,529 1,529,902,529 2014 121,255,000 35,725,000 1,275,495,000 - 71,923,731 1,504,398,731 2015 265,870,000 23,715,000 1,237,700,000 - 114,088,111 1,641,373,111 2016 598,380,000 2,360,000 985,980,000 - 149,402,014 1,736,122,014 2017 584,010,000 1,130,000 1,087,760,000 - 153,772,980 1,826,672,980 2018 977,040,000 575,000 705,950,000 - 187,787,701 1,871,352,701
Note: 1 Figures for 2018 were not available for personal income.2 Debt per capita uses the estimated population figures from 2009 - 2018.3 Deferred Charges were not included in FY14 to present per GASB 65. Deferred charges are included in the previous fiscal years.
Governmental Activities

Table 9 (Continued)
213
Revenue Bonds
Unamortized Premiums and Discounts, net
Total Bonds Payable
Total Primary Government
Percentage of Personal Income Debt Per Capita2
103,050,000 (11,773,982) 91,276,018 859,758,822 8.23% 522.55212,885,000 (6,875,165) 206,009,835 1,109,087,563 8.02% 646.78217,330,000 (7,886,202) 209,443,798 1,080,785,439 7.97% 630.28331,100,000 (6,920,659) 324,179,341 1,314,258,619 7.97% 766.43329,805,000 634,972 330,439,973 1,860,342,502 7.57% 1,023.51325,700,000 6,066,180 331,766,180 1,836,164,911 7.57% 989.38396,490,000 5,890,987 402,380,987 2,043,754,098 5.61% 1,076.93393,760,000 7,511,608 401,271,608 2,137,393,622 5.53% 1,127.86387,710,000 7,285,108 394,995,108 2,221,668,088 2.93% 1,151.91381,405,000 7,058,607 388,463,607 2,259,816,308 N/A 1 1,153.80
Business-type Activities

Table 10
Bexar County, Texas RATIO OF OUTSTANDING GENERAL BONDED COUNTY DEBT
Last Ten Fiscal Years (Unaudited)
214
Fiscal Year
Refunding Bonds
General Obligation
BondsCertificates of
Obligation
Unamortized Premiums and Discounts, net
Restricted for Debt Service Total
Percentage of Actual
Taxable Value of Property
Per Capita
2009 49,525,000 47,665,000 619,220,000 12,688,804 (58,544,093) 670,554,711 0.70% 4352010 78,765,000 69,105,000 731,970,000 23,237,728 (72,590,214) 830,487,514 0.85% 5132011 69,580,000 66,430,000 713,405,000 21,926,641 (71,270,325) 800,071,316 0.83% 4952012 76,410,000 58,035,000 828,265,000 27,369,278 (70,322,846) 919,756,432 0.95% 5392013 68,195,000 55,325,000 1,340,120,000 66,262,529 (66,484,927) 1,463,417,602 1.49% 8052014 121,255,000 35,725,000 1,275,495,000 71,923,731 (50,483,099) 1,453,915,632 1.40% 7832015 265,870,000 23,715,000 1,237,000,000 114,088,113 (31,967,772) 1,608,705,341 1.45% 8482016 598,380,000 2,360,000 985,980,000 149,402,014 (39,908,543) 1,696,213,471 1.35% 8942017 584,010,000 1,130,000 1,087,760,000 153,772,980 (60,506,401) 1,766,166,579 1.27% 9162018 977,040,000 575,000 705,950,000 187,787,701 (81,352,856) 1,789,999,845 1.19% 914
Source: Comprehensive Annual Financial Reports (CAFR).
General Bonded Debt Outstanding
GOVERNMENTAL ACTIVITIES

Table 11
Bexar County, Texas RATIO OF ANNUAL DEBT SERVICE FOR GENERAL
BONDED DEBT TO TOTAL EXPENDITURES ALL GOVERNMENTAL FUND TYPES
Last Ten Fiscal Years (Unaudited)
215
Ratio of Debt ServiceTotal Total to total
Fiscal Year Debt Service 1 Expenditures 2 Expenditures
2009 51,174,407 557,481,091 9.18%
2010 59,632,885 576,498,862 10.34%
2011 72,859,422 641,055,409 11.37%
2012 74,988,795 662,815,145 11.31%
2013 80,129,550 712,324,047 11.25%
2014 96,784,100 647,573,353 14.95%
2015 96,524,866 673,730,025 14.33%
2016 103,302,125 754,949,750 13.68%
2017 101,453,589 792,394,050 12.80%
2018 107,436,864 813,560,844 13.21%
Source: Comprehensive Annual Financial Reports (CAFR).
Note: 1 Does not include SARA flood control debt payment and bond issuance costs. 2 Does not include SARA flood control debt payment.

Table 12
Bexar County, Texas DIRECT AND OVERLAPPING GOVERNMENTAL ACTIVITIES DEBT
Current Year (Unaudited)
216
Governmental Unit Debt OutstandingApplicable to Bexar County
Estimated Share of Overlapping Debt
Cities:Alamo Heights 7,565,000$ 100.00% 7,565,000$ Converse 24,825,000 100.00% 24,825,000Fair Oaks Ranch 5,755,000 60.73% 3,495,012Balcones Heights 197,000 100.00% 197,000Elmendorf 12,065,820 99.56% 12,012,730Helotes 9,490,000 100.00% 9,490,000Hill Country Village 291,000 100.00% 291,000Kirby 7,060,000 100.00% 7,060,000Leon Valley 9,100,000 100.00% 9,100,000Live Oak 16,620,000 100.00% 16,620,000Lytle 1,445,000 1.06% 15,317Olmos Park 1,780,000 100.00% 1,780,000St. Hedwig 230,000 100.00% 230,000San Antonio 1,879,155,000 100.00% 1,879,155,000Schertz 80,845,000 10.38% 8,391,711Selma 17,515,000 59.50% 10,421,425Shavano Park 3,650,000 100.00% 3,650,000Terrell Hills 8,300,000 100.00% 8,300,000Universal City 22,269,000 100.00% 22,269,000
School Districts:Alamo Heights ISD 190,160,000 100.00% 190,160,000Boerne ISD 328,204,650 29.72% 97,542,422Comal ISD 767,165,107 16.89% 129,574,187East Central ISD 129,513,479 100.00% 129,513,479Edgewood ISD 72,540,000 100.00% 72,540,000Floresville ISD 62,499,990 0.12% 75,000Harlandale ISD 207,353,187 100.00% 207,353,187Judson ISD 620,852,521 100.00% 620,852,521Medina Valley ISD 116,317,147 34.42% 40,036,362Northeast ISD 1,358,550,000 100.00% 1,358,550,000Northside ISD 2,228,010,000 99.66% 2,220,434,766San Antonio ISD 894,329,988 100.00% 894,329,988Schertz-Cibolo-Universal City ISD 417,456,092 12.32% 51,430,591South San Antonio ISD 156,586,899 100.00% 156,586,899Southside ISD 94,435,000 100.00% 94,435,000Southwest ISD 222,253,272 100.00% 222,253,272Somerset ISD 35,396,755 76.44% 27,057,280
Special Districts:Alamo Community College District 479,445,000 100.00% 479,445,000Bexar Co Hosp Dist 891,565,000 100.00% 891,565,000San Antonio MUD #1 845,000 100.00% 845,000Cibolo Canyons Special Improvement District 33,585,000 100.00% 33,585,000
Total Overlapping 11,415,221,907 9,943,033,149 Bexar County 1,871,352,702 100.00% 1,871,352,702
Total Direct and Overlapping Debt 13,286,574,609$ 11,814,385,851$
Source: Municipal Advisory Council of Texas, as of September 30, 2018 Overlapping percentages are derived from the 2018 market values provided by the appraisal districts.
Note: Overlapping governments are those that coincide, at least in part, with geographic boundaries of the County. This table estimates the portion of the outstanding debt of those overlapping governments that is borne by theproperty taxpayers of Bexar County. This process recognizes that, when considering the County's ability to issueand repay long-term debt, the entire burden borne by the taxpayers should be taken into account. However, this doesnot imply that every taxpayer is a resident, and therefore responsible for the debt, of each overlapping government.

Table 13
Bexar County, Texas PLEDGED-REVENUE COVERAGE
Last Ten Fiscal Years (Unaudited)
217
Venue Project Revenue Bonds
Fiscal Year
Total Revenues 1
Less: Operating Expenses 2
Net Available Revenue
Annual Minimum
Requirement 3
Ratio Available to
Annual Requirement
Additional Mandatory
Special Redemption 4
2009 5 19,924,705 686,531 19,238,174 7,493,210 2.57 - 2010 5 20,803,473 619,347 20,184,126 70,741,787 0.29 - 2011 22,244,006 762,268 21,481,738 14,264,596 1.51 - 2012 23,642,911 649,204 22,993,707 131,402,052 0.17 - 2013 25,162,903 653,099 24,509,804 20,981,046 1.17 - 2014 26,307,877 390,845 25,917,032 21,120,777 1.23 - 2015 27,467,611 972,509 26,495,102 97,109,629 0.27 - 2016 28,915,349 1,611,848 27,303,501 25,537,981 1.07 - 2017 30,061,964 3,208,091 26,853,873 25,519,029 1.05 - 2018 32,329,207 1,233,518 31,095,689 25,512,768 1.22 -
Source: Comprehensive Annual Financial Reports (CAFR).Note: 1 Includes operating and non-operating revenues.
2 Includes operating expenses minus depreciation plus transfers out.3 Figures are minimum principal and interest added together. 4 Amount is equal to total principal paid less the minimum required payment. Effective 2009, due to fiscal year 2008 refunds, there will be no mandatory special redemption.5 Amounts were adjusted to exclude Commissary Fund transactions.

Table 14
Bexar County, Texas MOTOR VEHICLE RENTAL TAX COLLECTIONS
Current Year and Nine Years Ago (Unaudited)
218
2009 6,646,7692010 7,017,6942011 7,394,3482012 7,927,5542013 8,302,8812014 8,644,8492015 9,175,8552016 9,754,3262017 9,662,4362018 9,935,597
Source: Comprehensive Annual Financial Reports (CAFR).
Motor Vehicle Rental Tax Collections

Table 15
Bexar County, Texas HOTEL OCCUPANCY TAX NET COLLECTIONS
Current Year and Nine Years Ago
(Unaudited)
219
2009 11,568,3572010 12,270,9982011 13,466,8922012 14,352,3022013 15,493,2062014 16,227,7872015 16,796,6542016 17,363,9572017 18,122,7992018 19,256,791
Source: Comprehensive Annual Financial Reports (CAFR).
Hotel Occupancy Tax Net Collections
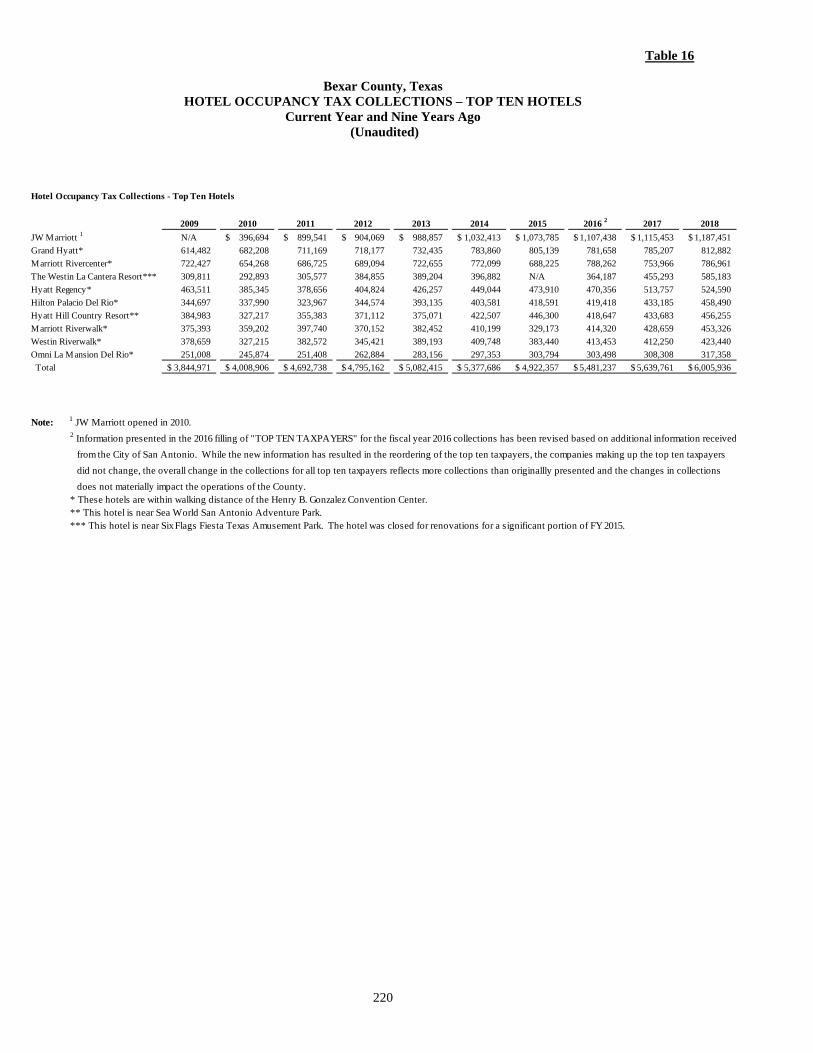
Table 16
Bexar County, Texas HOTEL OCCUPANCY TAX COLLECTIONS – TOP TEN HOTELS
Current Year and Nine Years Ago
(Unaudited)
220
Hotel Occupancy Tax Collections - Top Ten Hotels
2009 2010 2011 2012 2013 2014 2015 2016 2 2017 2018JW Marriott 1 N/A 396,694$ 899,541$ 904,069$ 988,857$ 1,032,413$ 1,073,785$ 1,107,438$ 1,115,453$ 1,187,451$ Grand Hyatt* 614,482 682,208 711,169 718,177 732,435 783,860 805,139 781,658 785,207 812,882 Marriott Rivercenter* 722,427 654,268 686,725 689,094 722,655 772,099 688,225 788,262 753,966 786,961 The Westin La Cantera Resort*** 309,811 292,893 305,577 384,855 389,204 396,882 N/A 364,187 455,293 585,183 Hyatt Regency* 463,511 385,345 378,656 404,824 426,257 449,044 473,910 470,356 513,757 524,590 Hilton Palacio Del Rio* 344,697 337,990 323,967 344,574 393,135 403,581 418,591 419,418 433,185 458,490 Hyatt Hill Country Resort** 384,983 327,217 355,383 371,112 375,071 422,507 446,300 418,647 433,683 456,255 Marriott Riverwalk* 375,393 359,202 397,740 370,152 382,452 410,199 329,173 414,320 428,659 453,326 Westin Riverwalk* 378,659 327,215 382,572 345,421 389,193 409,748 383,440 413,453 412,250 423,440 Omni La Mansion Del Rio* 251,008 245,874 251,408 262,884 283,156 297,353 303,794 303,498 308,308 317,358 Total 3,844,971$ 4,008,906$ 4,692,738$ 4,795,162$ 5,082,415$ 5,377,686$ 4,922,357$ 5,481,237$ 5,639,761$ 6,005,936$
Note: 1 JW Marriott opened in 2010. 2 Information presented in the 2016 filling of "TOP TEN TAXPAYERS" for the fiscal year 2016 collections has been revised based on additional information received from the City of San Antonio. While the new information has resulted in the reordering of the top ten taxpayers, the companies making up the top ten taxpayers did not change, the overall change in the collections for all top ten taxpayers reflects more collections than originallly presented and the changes in collections does not materially impact the operations of the County. * These hotels are within walking distance of the Henry B. Gonzalez Convention Center. ** This hotel is near Sea World San Antonio Adventure Park. *** This hotel is near Six Flags Fiesta Texas Amusement Park. The hotel was closed for renovations for a significant portion of FY 2015.

Table 17
Bexar County, Texas CONVENTION STATISTICS
Current Year and Nine Years Ago (Unaudited)
221
Hotel Occupancy
(%)
Revenue Per Available Room
($)Room Nights
SoldConvention Attendance1
Convention Room Nights1
Convention Delegate
Expenditures ($ Millions)1
2009 57.1 55.94 7,167,603 399,408 660,736 474.52010 59.3 57.02 7,768,002 535,400 736,325 636.12011 61.3 58.08 8,236,019 499,171 637,593 593.02012 63.5 60.79 8,651,826 449,202 635,829 533.72013 63.1 63.44 8,610,676 712,577 734,190 846.62014 65.3 67.03 8,874,090 652,443 725,333 775.12015 65.7 69.55 8,913,575 699,662 773,569 831.22016 65.9 71.12 9,116,363 637,658 676,501 N/A 2
2017 66.0 73.45 9,268,901 823,561 816,582 N/A 2
2018 67.1 77.88 9,568,119 672,288 882,650 N/A 2
Source: San Antonio Convention and Visitors Bureau and the Smith Travel Research end of year historical reports.
Note: 1 Reflects only those conventions booked by the San Antonio Convention and Visitors Bureau. 2 The Convention Delegate Expenditures for 2016 - 2018 are not currently available from Visit San Antonio. Visit San Antonio is in the process of reviewing and recalibrating the methodology for calculating the Convention Delegate Expenditures and the County can make no representation as to when, or if, such calculations will again be made available to the County.

Table 18
Bexar County, Texas SAN ANTONIO HOTEL OCCUPANCIES AND AVERAGE DAILY RATES/HISTORY
Current Year and Nine Years Ago
(Unaudited)
222
San Antonio Hotel Occupancies and Average Daily Rates/History
Room Count
Increase/Decrease (%)
Average Daily Room
Rate ($)Increase/Decrease
(%)
Hotel Occupancy
(%)Increase/Decrease
(%)2009 40,406 6.6 95.48 (10.2) 56.2 (12.3)2010 43,307 7.2 95.85 0.4 58.2 3.62011 43,979 1.6 95.65 (0.2) 61.0 4.82012 44,310 0.8 97.01 1.4 63.4 3.92013 44,845 1.2 101.82 5.0 62.9 (0.8)2014 43,928 (2.0) 103.57 1.7 64.9 3.22015 45,228 3.0 106.83 3.1 64.9 0.02016 46,061 1.8 108.42 1.5 64.7 (0.3)2017 46,833 1.7 111.41 2.8 65.0 0.52018 47,455 1.3 115.72 3.9 66.0 1.5
Source: Smith Travel Research end of year historical reports.

223
Photo by Peter Petroff

Table 19
Bexar County, Texas COUNTY EXPENDITURES FOR ASSETS OWNED BY OTHER ENTITIES
Current and Nine Years Ago1 (Unaudited)
224
Prior Years 2010 2011 2012Description Ownership Expenditure Expenditure Expenditure Expenditure
Governmental Activities
Mission Trails MPO City of SA 42,586$ -$ -$ -$ Mid-Beitel Creek City of SA 168,960 814 1,112,551 196,228 Perrin Beitel & Briar Glenn City of SA 183,133 26,668 295,983 91,569 Ingram Road Low Water Crossing City of SA 325,911 796,628 6,283,912 1,927,084 Hausman Road Drainage City of SA 261,450 3,088,008 542,150 251,355 Hausman Road Drainage Phase II City of SA - - - 272,234 Huebner Creek at Prue Road City of SA 61,351 36,706 31,994 478,110 Huebner Creek Enhanced Conveyance City of SA 261,069 7,093,016 2,757,133 1,983,581 Laddie Place City of SA 204,997 293,753 16,997,001 1,886,706 Shane Road Low Water Crossing City of SA 185,344 237,401 718,060 968,982 Rock Creek Enhanced Conveyance City of SA 159,723 - 377,288 94,645 San Pedro Huisache Phase II City of SA 205,000 838,744 914,353 6,982,214 Olmos Dam Repair City of SA 910,568 677,999 4,382,301 20,260 Balcone Heights Storm Water City of SA 137,828 46,393 - - Rossillo Tributary City of SA 97,200 135,237 504,542 302,186 Roland Avenue Bridge City of SA 307,649 249,535 668,339 1,983,172 Huebner Creek at Hollyhock City of SA 37,716 25,270 184,487 143,812 Broadway Drainage Improvements City of SA - 42,616 389,864 395,270 Six Mile Creek Drainage Improvements City of SA - 40,270 752,275 1,863,596 Elmendorf Lake City of SA - 223,386 262,791 185 French Creek Drainage Study City of SA - - 73,342 94,333 French Creek Tributary City of SA - - 28,990 237,751 Barbara Drive City of SA - - 157,172 375,155 New Braunfels City of SA - - - 310,874 Science Park City of SA - - 28,561 326,011 San Pedro Huisache Phase III City of SA - - 155,236 509,509 Hausman Phase II City of SA - - 138,631 - VFW Drainage City of SA - - 252,271 672,694 Concepcion Creek Drainage Improvement City of SA - - 84,014 332,936 Knoll Creek City of SA - - 204,111 3,660,236 Jones Maltsberger at Elm Creek City of SA - - - 167,140 Prue Road at French Creek City of SA - - - - North Verde Road LWC City of SA - - - - Salado Creek Tributary City of SA - - - - San Pedro Creek Restoration City of SA - - - - Applewhite Road City of SA 7,552 - - - Woodlawn at 36th Street Drain City of SA - - - - Seeling Channel Phase II-Flood City of SA - - - - Mission Trails City of SA 166,691 - - - Menger Creek Linear Park City of SA - - - - Botanical Garden City of SA - - - - Mission Road City of SA - - - - Cimarron Subdivision City of Converse - - 35,983 108,973 CentroMedWellness Facility Non Profit - - - - Hertberg Historic Center Non Profit 250,000 - - - The DoSeum Non Profit - - - - Family Service Center Association Non Profit - - - - Crosspoint, Inc. Non Profit - - - - Tobin Center Parking Garage Non Profit - - - - Alameda Theatre Non Profit - - - - Confluence Park SA River Auth. - - - - Mission Reach Restoration SA River Auth. 28,403,479 5,214,150 43,762,188 37,807,831 Mission Reach Restoration - Betterments SA River Auth. - 415,605 527,957 18,285,205 Museum Reach Restoration SA River Auth. 10,531,030 - 133,228 3,809 Calaveras 8 Increase Detention SA River Auth. 201,669 118,047 171,678 40,975 Calaveras Dam 6 SA River Auth. - 181,912 656,426 63,801 Calaveras Dam 10 SA River Auth. - - - 159,551

Table 19 (Continued)
225
2013 2014 2015 2016 2017 2018 Ending Expenditure Expenditure Expenditure Expenditure Expenditure Expenditure Balance
-$ -$ -$ -$ -$ -$ 42,586$ 21,487 7,503 12,879 302,366 35,859 - 1,858,647
501,635 149,374 35,285 95,209 4,059,203 1,467,557 6,905,616 116,634 - - - - - 9,450,169
7,836,030 11,686 6,500 15,000 30,500 3,000 12,045,679 7,997,794 - - - - - 8,270,028
154,432 50,232 374,750 2,614,907 221,196 - 4,023,678 457,507 4,152,351 5,875,807 1,017,153 5,341,057 - 28,938,674
1,663,443 3,390,754 2,535,750 317,451 179,382 3,249 27,472,486 5,000 8,855 - - - - 2,123,642
450,072 1,102,722 1,117,611 72,105 - - 3,374,166 1,698,806 58,737 - - - - 10,697,854
- - - - - - 5,991,128 - - - - - - 184,221
2,099,778 2,207,920 2,324,070 2,087,792 199,272 153,878 10,111,875 2,112,994 1,915,240 302,609 9,480 279 - 7,549,297
2,970 254,500 720,626 153,280 - - 1,522,661 - 74,719 9,431 - - - 911,900
1,161,909 1,731,639 466,257 16,483 7,643 114,878 6,154,950 - 631,097 3,068,760 3,126,068 174,075 - 7,486,362 - - - - - - 167,675
215,683 637,515 120,198 792,457 1,381,660 969,828 4,384,082 26,344 - 8,500,000 - - - 9,058,671
184,667 316,347 - - - - 811,888 22,209 - - - - - 376,781
102,420 952,784 668,124 - - - 2,388,073 - - - - - - 138,631
1,119,425 2,210,054 876,308 - - - 5,130,752 11,122 - - - - - 428,072
527,197 248,699 2,296,611 2,283,540 146,754 - 9,367,148 100 1,090,913 - - - - 1,258,153
345,185 216,635 236,148 2,953,316 1,534,027 - 5,285,311 107,504 317,122 42,695 2,185,942 12,312 - 2,665,575
70,340 265,808 1,608 80,077 1,876,987 1,292,475 3,587,295 674,575 3,696,636 7,079,651 6,428,934 32,060,698 40,164,449 90,104,943
- - - - - - 7,552 - 240,794 158,602 18,816 754,731 277,189 1,450,132 - - 4,000,000 - - - 4,000,000 - - - - - - 166,691 - - - 3,143,133 66,455 94,330 3,303,918 - - - - - 500,000 500,000 - - - - - 1,660 1,660
203,364 74,730 14,762 10,763 222,245 43,562 714,382 - - - - 728,125 2,271,875 3,000,000 - - - - - - 250,000 - - 740,000 - - - 740,000 - - - - - 1,507,500 1,507,500 - - - - - 325,000 325,000 - - - 658,179 9,270,779 1,679,388 11,608,346 - - - 1,138 8,762 458,703 468,603 - - - - 1,000,000 700,000 1,700,000
37,504,393 7,534,075 771,737 663,750 90,434 23,296 161,775,333 8,401,528 558,648 - - - - 28,188,943
- - - - - - 10,668,067 964,032 7,507 - - - - 1,503,908
51,074 6,137 - - - - 959,350 167,550 482,952 786,627 651,672 686,115 - 2,934,467

Table 19 (Continued)
Bexar County, Texas COUNTY EXPENDITURES FOR ASSETS OWNED BY OTHER ENTITIES
Current and Nine Years Ago1 (Unaudited)
226
Prior Years 2010 2011 2012Description Ownership Expenditure Expenditure Expenditure Expenditure
Governmental Activities (Continued)
Eagleland Reach - Betterments SA River Auth. - 450,334 312,920 1,605,355 Eagleland Reach SA River Auth. - 142,346 147,129 629,052 Martinez Dams SA River Auth. - - - 318,755 Park Reach SA River Auth. - - - 503 Millrace and Mulberry SA River Auth. - - - - St. Mary's Drainage Project St. Mary's Univ. - - 107,751 996,925 Sewer Halliburton Economic Development SA Water System - - - - State Highway 211 Right of Way STATE 550,195 10,600 - - Culebra Road STATE 2,725,312 4,795,213 783,547 1,503,206 Blanco Road STATE 18,748,796 7,560,445 1,350,504 10,812 Loop 1604 - Lower Sequin Road STATE - - - 1,409,664 Culebra Road FM 471 STATE - - - 256,627 Potranco Road FM 1957 STATE - - - 75,556 US Highway 281 and Loop 1604 STATE - - - - School of Osteopathic Medicine Univ. of Incarnate Word - - - - Haven for Hope Homeless Campus Haven for Hope 6,248,663 4,751,337 - - Medina Lake Dam Bexar/Medina/Atascosa - - - 1,134,963 Jefferson H.S. Drainage-Flood San Antonio ISD - - - -
Total Governmental Activities 71,383,872$ 37,492,433$ 86,286,663$ 90,939,391$
Business-type Activities
Mission Reach 3,108,167$ 3,298,092$ 335,451$ -$ Eagleland Reach 677 - - - Park Reach 677 - - - Veteran's Memorial Plaza - - 110,917 591,455 Briscoe River Portal - - 934,734 1,695,749 UTSA Soccer/Track 677 - 446,519 5,713,829 NISD National Swim Center 677 52,122 567,473 5,642,643 Hartman/Soar Soccer 4,643,393 356,607 - - Brooks City Soccer 677 - - 307,851 Mission Concepcion Athletic Co. 198,347 1,025,236 5,145,558 9,643,981 Culebra Creek Soccer 89,552 1,373,782 3,766,665 - St. Mary's Athletic Comp. 677 - - 5,999,323 Classics Elite Soccer 90,102 1,109,853 - - Wheatly Heights Athletic Comp. 105,439 581,163 4,687,977 2,122,565 McAllister Little League 182,364 2,487,636 - - S E Skyline Baseball 1,471,963 1,666,029 138,354 16,800 Texas Fencing Center 677 - - 900,396 Missions Baseball Academy 677 - 1,767,334 1,303,489 Community Multi Purpose 677 5,599,323 - 964,432 Performing Arts Center 2,010,241 6,366,448 9,930,624 17,742,395 Almeda Theater 156,360 62,878 - 958,905 Briscoe Western Art Foundation 677 1,410,746 2,588,576 -
Total Business-type Activities 12,062,698 25,389,915 30,420,182 53,603,813 Total County Expenditures forAssets Owned by Others 83,446,570$ 62,882,348$ 116,706,845$ 144,543,205$
Note: 1 The information will be presented on a prospective basis. Further, expenses related to business-type activitiesbegan in 2009.

Table 19 (Continued)
227
2013 2014 2015 2016 2017 2018 Ending Expenditure Expenditure Expenditure Expenditure Expenditure Expenditure Balance
404,672 - - - - - 2,773,281 34,718 - - - - - 953,245
324,509 761,723 691,446 1,100,455 907,175 316,945 4,421,008 1,343,895 4,204 - - - - 1,348,602
- - - 854,793 - - 854,793 630,451 661 - - - - 1,735,788 749,364 - - - - - 749,364
- - - - - 130,172 690,967 32,068 - 600,000 - - - 10,439,346
3,900 - - - - - 27,674,457 905,553 11,326,891 14,645,785 650,397 25,710 3,673 28,967,673
1,307,556 256,172 117,218 1,232,678 7,472,900 7,405,947 18,049,098 59,814 259,183 24,419 7,388,218 11,340,450 13,299,778 32,447,418
92,000,000 - - 60,919,967 39,080,033 - 192,000,000 - - - - - 1,500,000 1,500,000
760,925 57,799 681,275 - - - 12,499,999 97,387 12,410 20,528 25,810 21,272 22,447 1,334,817
- - 750,000 - - - 750,000 175,634,015$ 47,283,728$ 60,674,077$ 101,871,329$ 118,936,090$ 74,730,779$ 865,232,377$
-$ -$ -$ -$ -$ -$ 6,741,710$ - - - - - - 677 - - - 886,926 148,084 - 1,035,687
2,037,602 5,260,026 - - - - 8,000,000 - - - - - - 2,630,483
8,428,717 410,259 - - - - 15,000,001 737,085 - - - - - 7,000,000
- - - - - 5,000,000 4,538,400 146,629 - - - - 4,993,557
61,493 - - - - - 16,074,615 - - - - - - 5,229,999 - - - - - - 6,000,000 - - - - - - 1,199,955 - - - - - - 7,497,144 - - - - - - 2,670,000 - - - - - - 3,293,146
1,098,927 - - - - - 2,000,000 914,159 11,380 - - - - 3,997,039
1,196,407 7,343,351 2,151,204 - - - 17,255,394 34,669,770 19,026,112 - - - - 89,745,590
4,532,780 289,077 2,814 - - - 6,002,814 - - - - - - 3,999,999
58,215,340 32,486,834 2,154,018 886,926 148,084 - 215,367,810
233,849,355$ 79,770,562$ 62,828,095$ 102,758,255$ 119,084,174$ 74,730,779$ 1,080,600,187$

Table 20
Bexar County, Texas DEMOGRAPHIC AND ECONOMIC STATISTICS
Last Ten Fiscal Years (Unaudited)
228
Personal Per Income Capita
Estimated (thousands Personal Unemployment School University Year Population 1 of dollars) 2 Income 3 Rate 4 Enrollment 5 Enrollment 6
2009 1,645,301 60,220,178 36,465 7.2% 314,801 113,3072010 1,714,773 59,911,913 34,761 7.3% 324,015 119,2832011 1,756,153 63,532,926 36,177 8.1% 330,259 119,3522012 1,785,704 68,567,177 38,398 6.1% 338,933 119,7102013 1,817,610 70,896,476 39,005 6.2% 334,351 120,2732014 1,855,866 75,825,317 40,857 4.8% 344,548 119,4822015 1,897,753 81,038,194 42,702 3.7% 350,256 120,2422016 1,928,680 84,122,309 43,617 4.0% 353,621 123,5842017 1,958,578 85,782,196 43,798 3.2% 354,665 126,5702018 1,958,578 N/A N/A 3.3% 354,828 126,616
Source: 1 Source for Fiscal Year 2009 - 2017 - U.S. Census Bureau (www.census.gov).Source for Fiscal Year 2009 -EDIS www.edis commerce.statenc.us/docs/countyprofile/old/Tx/48029.pdf.
The population for Fiscal Year 2018 will not be made available until April. 2 Per capita personal income was computed using Census Bureau midyear population estimates.
6 Figures represent Fall enrollment for the calendar year.
5 School Enrollment for schools located in Bexar County -Texas Education Agency.
4 Unemployment rates - Texas Workforce Commission September 2018, Quarterly Report.
3 Personal Income and Per Capita Personal Income Figures - Bureau of Economic Analysis (2009 - 2017).Figures for 2018 were not available for personal income and per capita personal income.
Enrollment figures are for grades Pre-K through 12th grade. University enrollment figures are not included.

Table 21
Bexar County, Texas PRINCIPAL EMPLOYERS
Current Year and Nine Years Ago2 (Unaudited)
229
2018
Principal Employers Category TotalPercent of County
Employment
Joint Base San Antonio 1 Government 86,497 9.99H.E.B. Grocery Company Retail 22,053 2.55
USAA 3 Finance/ Insurance 18,305 2.11Northside Independent School District Services 13,996 1.62
City of San Antonio Government 11,462 1.32Methodist Healthcare System Medical 9,851 1.14
Northeast Independent School District Services 9,292 1.07University Health System Medical 8,798 1.02
San Antonio Independent School District Services 7,703 0.89Baptist Health System Medical 6,371 0.74
TOTAL 194,328 22.45Total County Employment for 2018 2 865,587
2009
Principal Employers Category TotalPercent of County
EmploymentJoint Base San Antonio1 Government 69,593 9.86
H.E.B. Grocery Company Retail 20,500 2.90Northside Independent School District Services 15,925 2.26
USAA Finance/Insurance 14,589 2.07City of San Antonio Government 9,000 1.27
Northeast Independent School District Services 8,507 1.20San Antonio Independent School District Services 7,547 1.07
Methodist Healthcare System Medical 7,154 1.01UT Health Science Center at San Antonio Medical 6,217 0.88
Baptist Health System Medical 6,190 0.88
TOTAL 165,222 23.40Total County Employment for 2009 2 705,976
Source: San Antonio Business Journal Book of Lists 2018-19, Greater San Antonio Chamber of Commerce and confirmation from individual corporate human resource offices.
Note: 1 Under the BRAC Joint Basing Recommendation for San Antonio, installation support functions at thethe Army's Fort Sam Houston were combined with those at Randolph and Lackland Air Force Bases under a single organization (Joint Base San Antonio). Includes military personnel and civilian personnel.Figures for 2018 will not be made available until April 2019. Figures for 2017 were used for 2018.
2 Total County Employment figure for 2009 and 2018 -Texas Workforce Commission website. 3 Figures for 2017 were used for 2018 as responses to inquiries would not be met by deadline.

Table 22
Bexar County, Texas OPERATING INDICATORS BY FUNCTION/PROGRAM
Last Ten Fiscal Years (Unaudited)
230
2018 2017 2016 2015Function/Program
PUBLIC SAFETYSheriff-Adult Detention Average Daily Inmate Population
Male 3579 3378 2946 3131Female 651 616 576 594
Number of Prisoners Booked 62,684 58,530 53,002 58,986Number of Prisoners Released 58,456 56,052 52,782 58,970Number of Uniformed Officers 871 870 870 868
Sheriff-Law Enforcement Number of Patrol Deputies 1 262 236 254 235Patrol Number of Law Enforcement Officers 2 389 376 371 385
JUDICIALDistrict Courts
Criminal Cases Filed During the Year 3 13,464 13,416 12,180 12,249Civil Cases Filed During the Year 3 45,929 45,482 47,296 43,190Juvenile Cases Filed During the Year 3 1,846 1,944 1,789 2,006
County Courts-At LawCriminal Cases Filed During the Year 3 29,359 27,129 25,417 29,573Civil Cases Filed During the Year 3 9,948 9,730 9,250 9,527Probate Cases Filed During the Year 3 5,075 4,949 4,806 4,937Mental Health Cases Filed During the Year 3 7,247 7,102 8,178 7,981
Justice of the Peace Courts Civil and Criminal Cases Filed During the Year 3 144,603 154,728 162,478 168,906
HEALTH & PUBLIC WELFARENumber of Grants Federal 30 39 60 73
State 139 131 74 30Local 2 2 0 0Private 44 46 17 25
Child Welfare Board Children in DFPS legal responsibility 4 3,631 3,719 4,834 5,002Children in Substitute Care 4 2,049 2,367 1,910 1,562Children in Foster Care 4 3,835 3,587 3,155 3,158
PUBLIC WORKS Number of Work Orders for Road Maintenance 4,500 4,200 4,000 3,402Number of Work Orders for Traffic Maintenance 6,250 6,200 6,100 6,043Number of Capital Projects in Design 13 17 18 19Number of Capital Projects in Construction 15 13 12 14Number of Capital Projects Completed 16 14 13 11
GENERAL GOVERNMENTCommissioners Court Number of Official Public Meetings
Regular Sessions 23 24 24 29Special Sessions (Work Sessions) 6 4 8 6
Source: Bexar County Annual Budget.
Note: 1 Includes only officers from the patrol division. 2 Total now includes law enforcement officers from all divisions except Adult Detention. 3 Totals are from the Texas Office of Court Administration. 4 Totals are from the Texas Department of Family and Protective Services website. The Texas Department of Family and Protective Services Children in Foster Care figures were updated in 2016 for 2008 - 2016.

Table 22 (Continued)
231
2014 2013 2012 2011 2010 2009
3,253 3,149 3,209 3,341 3,681 3,957574 521 477 433 476 449
61,378 62,031 57,267 59,322 66,893 68,51360,871 61,653 57,308 59,298 66,587 68,308
912 866 753 853 849 855
N/A N/A N/A N/A N/A N/A533 532 530 519 519 531
11,651 11,930 11,043 11,859 12,612 13,45939,269 42,749 42,718 42,955 31,925 35,1612,062 3,213 2,152 2,855 3,343 3,323
32,452 33,174 31,474 30,589 34,834 38,2748,567 9,145 8,807 9,302 8,490 9,2274,789 4,677 4,629 5,328 3,966 4,2917,802 7,265 5,744 5,335 2,754 3,201
205,553 204,041 153,438 155,272 185,653 170,192
44 46 47 51 41 8556 40 69 61 66 360 0 0 0 0 0
18 9 15 11 8 8
5,445 5,571 5,761 5,238 4,608 4,5791,887 1,877 2,164 5,184 4,589 4,5013,379 3,413 3,672 3,444 3,154 3,159
2,800 2,400 8,812 8,723 8,723 8,7891,250 1,250 2,800 2800 2,800 4,150
12 13 6 11 11 139 9 13 9 9 88 2 8 3 3 6
25 24 24 24 24 248 9 10 9 8 17
4 (continued) Texas Department of Family and Protective Services (DFPS) works with the Bexar County Child Welfare Board to facilitate
implementation and administration of the Children's Protective Services Program. Children in foster care are placed in foster
homes or institutions; children in substitute care are placed in treatment facilities, hospitals, adoptive homes, or independent
living arrangements. Children in the legal responsibility of DFPS are those whom the courts have awarded legal responsibility by temporary or permanent managing conservatorship or other court ordered legal basis. Children may reside in an out of home placement or were returned to their home of origin.

Table 23
Bexar County, Texas CAPTIAL ASSET STATISTICS BY FUNCTION/PROGRAM
Last Ten Fiscal Years (Unaudited)
232
2018 2017 2016 2015 2014Function/Program
PUBLIC SAFETYSheriff-Adult Detention Number of inmate beds 4,563 4,563 4,563 4,563 4,563
Sheriff-Law Enforcement Number of patrol vehicles 266 252 164 152 135
JUDICIALDistrict Courts
Criminal Number of elected judges 13 13 13 13 12Civil Number of elected judges 14 14 14 14 14Juvenile Number of elected judges 3 3 3 3 3
County Courts-At-LawCriminal Number of elected judges 13 13 13 13 13Civil Number of elected judges 2 2 2 2 2Probate Number of elected judges 2 2 2 2 2
Justice of the Peace CourtsNumber of elected judges 7 7 8 8 8
EDUCATION & RECREATIONCounty Parks Number of acres maintained 481 481 481 481 481
Number of county parks 11 11 11 11 11Number of civic centers 3 3 3 3 3
PUBLIC WORKS Road Miles Maintained 1,375 1,350 1,310 1,270 1,270Road Resurfaced (miles) 114 118 80 76 97Heavy Trucks/Equipment 290 273 261 280 278
GENERAL GOVERNMENTNumber of Light Vehicles 1 895 870 894 925 911
Source: Bexar County Annual Budget. Note: 1 Light vehicles have a carrying capacity of one ton and under. This includes cars used by every department except the Sheriff Department.

Table 23 (Continued)
233
2013 2012 2011 2010 2009
4,563 4,596 4,596 4,596 4,598
132 136 132 171 171
12 11 11 11 1114 14 14 14 13
3 3 3 3 3
13 13 13 13 132 2 2 2 22 2 2 2 2
8 6 6 6 6
481 481 247 1,135 57011 11 11 11 11
3 3 3 3 3
1,231 1,200 1,200 1,004 1,030122 93 78 103 117312 312 308 329 311
670 670 784 690 692

Table 24
Bexar County, Texas FULL-TIME EQUIVALENT COUNTY GOVERNMENT EMPLOYEES BY FUNCTION/PROGRAM
Last Ten Fiscal Years (Unaudited)
234
Function/Program 2009 2010 2011 2012 2013 2014 2015 2016 2017 2018General Government/ Administrative 1,057 988 1,039 960 932 925 888 935 948 948
Judicial 736 754 707 689 692 686 729 754 778 789
Public safetyOfficers 1,948 1,935 2,048 1,943 1,849 1,899 2,056 2,065 2,054 2,042Civilians 595 610 509 492 659 717 622 659 688 666
Education and recreation 16 67 14 14 71 70 79 81 86 87
Public works 259 267 268 259 256 264 264 264 267 274
Health and public welfare 155 119 207 194 109 109 91 87 98 68
Total 4,766 4,740 4,792 4,551 4,568 4,670 4,729 4,845 4,919 4,874
Source: Bexar County Adopted Budget.

Table 25
Bexar County, Texas Texas County and District Retirement System
ANALYSIS OF FUNDING PROGRESS AND CONTRIBUTION RATES Last Ten Fiscal Years
(Unaudited)
235
Fiscal Year
Actuarial Value of Assets
Actuarial Accrued Liability
Funded Ratio
Unfunded Actuarial Accrued Liability
Annual Covered Payroll 1
UAAL as a Percentage of
Covered Payroll
Total TCDRS Required
Contribution Rate
2009 587,887,756 685,350,890 85.78% 97,463,134 214,085,357 45.53% 9.90%2010 615,705,829 726,801,815 84.71% 111,095,986 217,066,212 51.18% 10.62%2011 3 643,782,380 775,163,006 83.05% 131,380,626 210,826,765 62.32% 10.72%2012 4 666,871,683 821,494,429 81.18% 154,622,746 213,634,303 72.38% 11.30%2013 5 718,024,251 869,092,086 82.62% 151,067,835 220,622,466 68.47% 12.38%2014 758,367,617 904,435,389 83.85% 146,067,772 231,087,684 63.21% 13.31%2015 796,582,916 973,093,924 81.86% 176,511,008 240,592,521 73.37% 13.18%2016 1,180,704,918 1,368,562,738 86.27% 187,857,820 251,255,949 74.77% 13.08%2017 1,265,883,701 1,459,022,626 86.76% 193,138,925 265,871,892 72.64% 13.21%2018 2 N/A N/A N/A N/A N/A N/A 13.61%
Note: 1 The annual covered payroll is based on the employee contribution received by TCDRS for the year ending with the valuation date.2 Fiscal Year 2018 figures will not be available from TCDRS until April or May 2019.3 Funding information for 2011 may differ from prior year compliance due to plan changes effective January 1, 2013.4 Funding information for 2012 may differ from prior year compliance due to plan changes effective January 1, 2014.5 Funding information for 2013 may differ from prior year compliance due to plan changes effective January 1, 2014.

Table 26
Bexar County, Texas LEGAL DEBT MARGIN INFORMATION
Last Ten Fiscal Years (Unaudited)
236
Legal Debt Margin Calculation for Fiscal Year 2018Assessed Value of All Taxable Property 150,253,090,360$ Assessed Value of Real Property 135,554,431,395$ Roads Debt Limit (25% of Assessed Value of Real Property)A 33,888,607,849$ Amount of Debt Applicable to ConstitutionalDebt Limit:
Total Bonded Debt Applicable 62,500,000 Less: Debt Service Available Funds 1 5,184,325$ 57,315,675
Legal Debt Margin, Bonds Issued under Article 3,Section 52 of the Texas Constitution 33,831,292,174$
Year Debt Limit
Total Net Debt Applicable to
Limit Legal Debt Margin
Total Net Debt Applicable to the
Limit as a Percentage of Debt
Limit2009 22,294,858,899 35,778,296 22,292,803,785 0.16%2010 22,867,713,689 34,265,846 22,866,310,393 0.15%2011 22,463,790,333 32,681,736 22,462,089,487 0.15%2012 22,641,570,765 31,036,511 22,639,979,029 0.14%2013 23,084,641,277 29,321,566 23,083,557,632 0.13%2014 24,444,710,084 27,292,098 24,417,417,986 0.11%2015 24,781,567,617 24,691,199 24,756,876,418 0.10%2016 28,331,876,690 22,661,612 24,758,906,005 0.08%2017 31,269,427,790 20,612,362 28,311,264,328 0.07%2018 33,888,607,849 57,315,675 33,831,292,174 0.17%
A Bonds Issued Under Article 3, Section 52 of the Texas Constitution
Bonds Issued Under Article 8, Section 9 and Article 11, Section 2 of the Texas Constitution
The County is authorized under Article 3, Section 52 of the State Constitution to issue bonds payable from ad valorem taxes for the construction and maintenance of roads. There is no constitutional or statutory limit as to rate on bonds issued pursuant to such constitutional provision. However, the amount of bonds which may be issued is limited to 25% of the assessed valuation of real property in the County.
In addition to unlimited tax bonds the County may issue bonds payable from the proceeds of a limited ad valorem tax provided for in Article 8, Section 9 of the State Constitution. Such constitutional provision provides that a county is limited to an ad valorem tax rate of $0.80 per $100 of assessed valuation for General Fund purposes.
Certain of the County's bonds payable from such limited tax may be issued under the provisions of Article 722, Vernon's Texas Civil Statutes. The principal amount of all bonds which may be issued under the provisions of such Statute is limited in the aggregate to 5% of all taxable property. The debt limit under Article 722 is approximately $7,512,654,518 compared to applicable bonds outstanding at September 30, 2018 of $1,683,565,000.
1 Amount estimated based on the subsquent year debt requirement assumed to be available from the Debt Service Fund balance of $81,935,785.
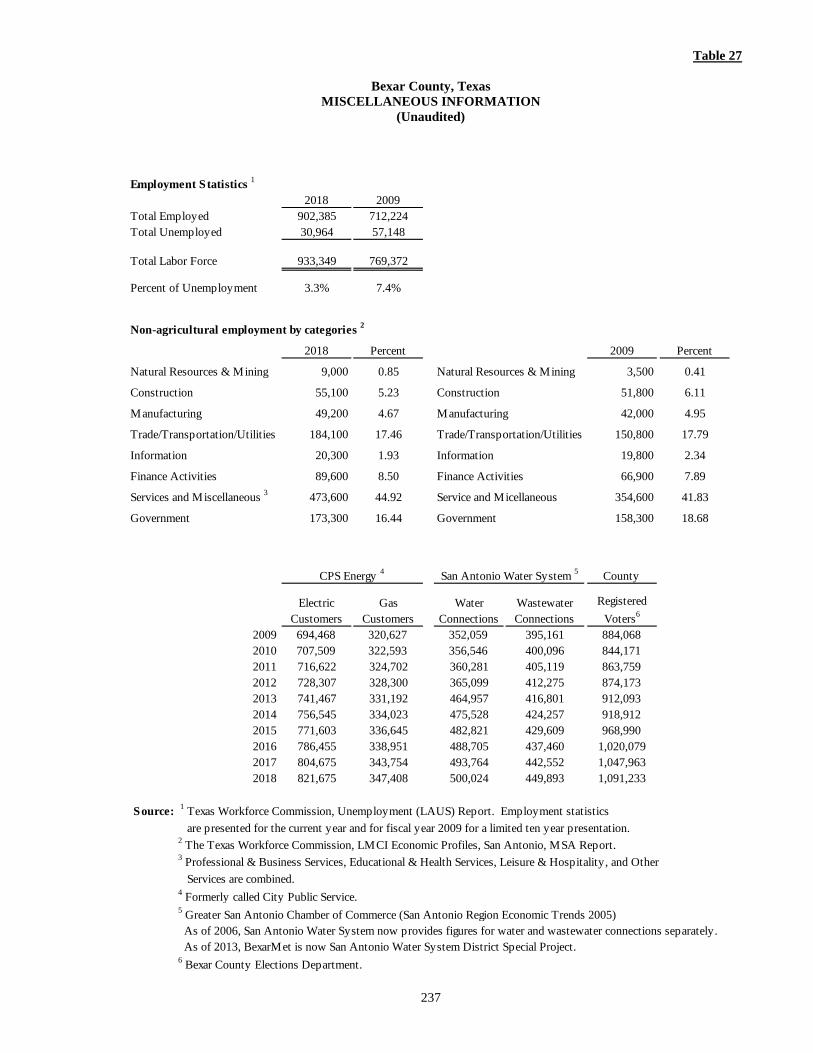
Table 27
Bexar County, Texas MISCELLANEOUS INFORMATION
(Unaudited)
237
Employment Statistics 1
2018 2009Total Employed 902,385 712,224Total Unemployed 30,964 57,148
Total Labor Force 933,349 769,372
Percent of Unemployment 3.3% 7.4%
Non-agricultural employment by categories 2
2018 Percent 2009 Percent
Natural Resources & Mining 9,000 0.85 3,500 0.41
Construction 55,100 5.23 51,800 6.11
Manufacturing 49,200 4.67 42,000 4.95
Trade/Transportation/Utilities 184,100 17.46 150,800 17.79
Information 20,300 1.93 19,800 2.34
Finance Activities 89,600 8.50 66,900 7.89
Services and Miscellaneous 3 473,600 44.92 354,600 41.83
Government 173,300 16.44 158,300 18.68
County
Electric Customers
Gas Customers
Water Connections
Wastewater Connections
Registered Voters6
2009 694,468 320,627 352,059 395,161 884,0682010 707,509 322,593 356,546 400,096 844,1712011 716,622 324,702 360,281 405,119 863,7592012 728,307 328,300 365,099 412,275 874,1732013 741,467 331,192 464,957 416,801 912,0932014 756,545 334,023 475,528 424,257 918,9122015 771,603 336,645 482,821 429,609 968,9902016 786,455 338,951 488,705 437,460 1,020,0792017 804,675 343,754 493,764 442,552 1,047,9632018 821,675 347,408 500,024 449,893 1,091,233
Source: 1 Texas Workforce Commission, Unemployment (LAUS) Report. Employment statistics are presented for the current year and for fiscal year 2009 for a limited ten year presentation. 2 The Texas Workforce Commission, LMCI Economic Profiles, San Antonio, MSA Report. 3 Professional & Business Services, Educational & Health Services, Leisure & Hospitality, and Other
Services are combined. 4 Formerly called City Public Service. 5 Greater San Antonio Chamber of Commerce (San Antonio Region Economic Trends 2005) As of 2006, San Antonio Water System now provides figures for water and wastewater connections separately. As of 2013, BexarMet is now San Antonio Water System District Special Project. 6 Bexar County Elections Department.
San Antonio Water System 5CPS Energy 4
Natural Resources & Mining
Construction
Manufacturing
Trade/Transportation/Utilities
Information
Finance Activities
Service and Micellaneous
Government
238
Photo by Peter Petroff

Garza/Gonzalez & Associates
CERTIFIED PUBLIC ACCOUNTANTS
INDEPENDENT AUDITOR’S REPORT ON INTERNAL CONTROL OVER FINANCIAL REPORTING AND ON
COMPLIANCE AND OTHER MATTERS BASED ON AN AUDIT OF FINANCIAL STATEMENTS
PERFORMED IN ACCORDANCE WITH GOVERNMENT AUDITING STANDARDS
The Honorable County Judge and Commissioners
Bexar County, Texas
We have audited, in accordance with the auditing standards generally accepted in the United States of America and the
standards applicable to financial audits contained in Government Auditing Standards issued by the Comptroller General
of the United States, the financial statements of the governmental activities, the business-type activities, the aggregate
discretely presented component units, each major fund, and the aggregate remaining fund information of Bexar County,
Texas (the County), as of and for the year ended September 30, 2018, and the related notes to the financial statements,
which collectively comprise the County’s basic financial statements, and have issued our report thereon dated March 29,
2019. We did not audit the financial statements of the University Health System (the System), the Cibolo Canyons
Special Improvement District (the District), and the Alamo Regional Mobility Authority (the Authority), discretely
presented component units. Those financial statements were audited by other auditors whose report thereon has been
furnished to us, and our opinion, insofar as it relates to the amounts included for the System, the District, and the
Authority, is based solely on the report of the other auditors.
Our report includes a reference to other auditors who audited the financial statements of the System, the District, and the
Authority, as described in our report on the County’s financial statements. This report does not include the results of the
other auditors’ testing of internal control over financial reporting or compliance and other matters that are reported on
separately by those auditors. The financial statements of the District audited by other auditors were not audited in
accordance with Government Auditing Standards.
Internal Control over Financial Reporting
In planning and performing our audit of the financial statements, we considered the County’s internal control over
financial reporting (internal control) to determine the audit procedures that are appropriate in the circumstances for the
purpose of expressing our opinions on the financial statements, but not for the purpose of expressing an opinion on the
effectiveness of the County’s internal control. Accordingly, we do not express an opinion on the effectiveness of the
County’s internal control.
A deficiency in internal control exists when the design or operation of a control does not allow management
or employees, in the normal course of performing their assigned functions, to prevent, or detect and correct,
misstatements on a timely basis. A material weakness is a deficiency, or a combination of deficiencies, in
internal control, such that there is a reasonable possibility that a material misstatement of the County’s
financial statements will not be prevented, or detected and corrected on a timely basis. A significant deficiency
is a deficiency, or a combination of deficiencies, in internal control that is less severe than a material
weakness, yet important enough to merit attention by those charged with governance.
207 Arden Grove San Antonio, TX 78215 210/227-1389 Fax 227-0716
239

240
Our consideration of internal control over financial reporting was for the limited purpose described in the first
paragraph of this section and was not designed to identify all deficiencies in internal control that might be material
weaknesses or significant deficiencies. Given these limitations, during our audit we did not identify any deficiencies
in internal control that we consider to be material weaknesses. However, material weaknesses may exist that have not
been identified.
Compliance and Other Matters
As part of obtaining reasonable assurance about whether the County’s financial statements are free from material
misstatement, we performed tests of its compliance with certain provisions of laws, regulations, contracts, and grant
agreements, noncompliance with which could have a direct and material effect on the determination of financial
statement amounts. However, providing an opinion on compliance with those provisions was not an objective of our
audit, and accordingly, we do not express such an opinion. The results of our tests disclosed no instances of
noncompliance or other matters that are required to be reported under Government Auditing Standards.
We noted certain matters that we reported to management of the County in a separate letter dated March 29, 2019.
Purpose of this Report
The purpose of this report is solely to describe the scope of our testing of internal control and compliance and the
results of that testing, and not to provide an opinion on the effectiveness of the County’s internal control or on
compliance. This report is an integral part of an audit performed in accordance with Government Auditing Standards
in considering the County’s internal control and compliance. Accordingly, this communication is not suitable for any
other purpose.
March 29, 2019

Garza/Gonzalez & Associates
CERTIFIED PUBLIC ACCOUNTANTS
INDEPENDENT AUDITOR’S REPORT ON COMPLIANCE FOR EACH MAJOR PROGRAM AND
ON INTERNAL CONTROL OVER COMPLIANCE REQUIRED BY THE UNIFORM GUIDANCE AND
THE STATE OF TEXAS SINGLE AUDIT CIRCULAR
The Honorable County Judge and Commissioners
Bexar County, Texas
Report on Compliance for Each Major Federal and State Program
We have audited Bexar County, Texas (the County)’s compliance with the types of compliance requirements described
in the OMB Compliance Supplement and the State of Texas Single Audit Circular that could have a direct and material
effect on each of the County’s major federal and state programs for the year ended September 30, 2018. The County’s
major federal and state programs are identified in the summary of auditor’s results section of the accompanying schedule
of findings and questioned costs.
Management’s Responsibility
Management is responsible for compliance with federal and state statutes, regulations, and the terms and conditions of
its federal and state awards applicable to its federal and state programs.
Auditor’s Responsibility
Our responsibility is to express an opinion on compliance for each of the County’s major federal and state programs
based on our audit of the types of compliance requirements referred to above. We conducted our audit of compliance in
accordance with auditing standards generally accepted in the United States of America; the standards applicable to
financial audits contained in Government Auditing Standards, issued by the Comptroller General of the United States;
the audit requirements of Title 2 U.S. Code of Federal Regulations Part 200, Uniform Administrative Requirements, Cost
Principles, and Audit Requirements for Federal Awards (Uniform Guidance), and the State of Texas Single Audit
Circular. Those standards, the Uniform Guidance, and the State of Texas Single Audit Circular require that we plan and
perform the audit to obtain reasonable assurance about whether noncompliance with the types of compliance
requirements referred to above that could have a direct and material effect on a major federal and state program occurred.
An audit includes examining, on a test basis, evidence about the County’s compliance with those requirements and
performing such other procedures as we considered necessary in the circumstances.
We believe that our audit provides a reasonable basis for our opinion on compliance for each major federal and state
program. However, our audit does not provide a legal determination of the County’s compliance.
Opinion on Each Major Federal and State Program
In our opinion, the County, complied, in all material respects, with the types of compliance requirements referred to
above that could have a direct and material effect on each of its major federal and state programs for the year ended
September 30, 2018.
207 Arden Grove San Antonio, TX 78215 210/227-1389 Fax 227-0716
241
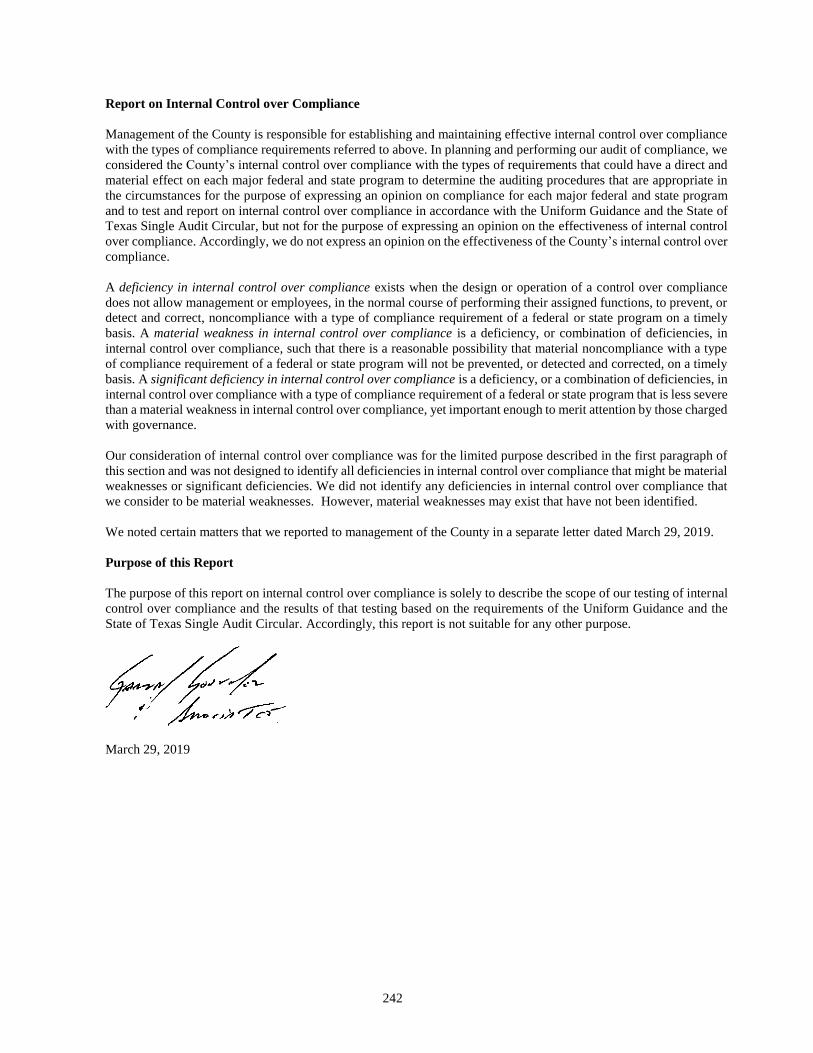
242
Report on Internal Control over Compliance
Management of the County is responsible for establishing and maintaining effective internal control over compliance
with the types of compliance requirements referred to above. In planning and performing our audit of compliance, we
considered the County’s internal control over compliance with the types of requirements that could have a direct and
material effect on each major federal and state program to determine the auditing procedures that are appropriate in
the circumstances for the purpose of expressing an opinion on compliance for each major federal and state program
and to test and report on internal control over compliance in accordance with the Uniform Guidance and the State of
Texas Single Audit Circular, but not for the purpose of expressing an opinion on the effectiveness of internal control
over compliance. Accordingly, we do not express an opinion on the effectiveness of the County’s internal control over
compliance.
A deficiency in internal control over compliance exists when the design or operation of a control over compliance
does not allow management or employees, in the normal course of performing their assigned functions, to prevent, or
detect and correct, noncompliance with a type of compliance requirement of a federal or state program on a timely
basis. A material weakness in internal control over compliance is a deficiency, or combination of deficiencies, in
internal control over compliance, such that there is a reasonable possibility that material noncompliance with a type
of compliance requirement of a federal or state program will not be prevented, or detected and corrected, on a timely
basis. A significant deficiency in internal control over compliance is a deficiency, or a combination of deficiencies, in
internal control over compliance with a type of compliance requirement of a federal or state program that is less severe
than a material weakness in internal control over compliance, yet important enough to merit attention by those charged
with governance.
Our consideration of internal control over compliance was for the limited purpose described in the first paragraph of
this section and was not designed to identify all deficiencies in internal control over compliance that might be material
weaknesses or significant deficiencies. We did not identify any deficiencies in internal control over compliance that
we consider to be material weaknesses. However, material weaknesses may exist that have not been identified.
We noted certain matters that we reported to management of the County in a separate letter dated March 29, 2019.
Purpose of this Report
The purpose of this report on internal control over compliance is solely to describe the scope of our testing of internal
control over compliance and the results of that testing based on the requirements of the Uniform Guidance and the
State of Texas Single Audit Circular. Accordingly, this report is not suitable for any other purpose.
March 29, 2019

243
Grantor orFund/ Pass-through PassedAgency/ Grantor's Program Through toOrganization Grantor/Program Title CFDA Number Expenditures Sub-recipients
FEDERAL FUNDS
U.S. Department of AgriculturePassed ThroughTexas Department of Agriculture Commission
100-4001-40534 National School Lunch Program Commodities - 10.555 TX-015-2048 $ 253,187 - Juvenile Probation
Total U.S. Department of Agriculture 253,187 -
U.S. Department of Interior National Park SevicePassed ThroughTexas Parks and Wildlife Department
MS1705502301 Hot Wells County Park 15.916 4801147 414,371 -
Total U.S. Department of Interior National Park Service 414,371 -
U.S. Department of Health and Human Services
812-AR17 HIV Emergency Relief Project Part A, 2017 - 2018 93.914 6 H89HA00041-23-01 1,174,001 1,108,683 812-AM17 HIV Emergency Relief Project Part A - Minority AIDS 93.914 6 H89HA00041-23-01 260,399 237,451
Initiative Programs 2017 - 2018812-AS17 HIV Emergency Relief Project Part A - Minority AIDS 93.914 6 H89HA00041-23-01 1,077,570 902,143
Initiative Programs 2017 - 2018SA1844 B.C. Adult Treatment Court Collaborative 93.243 5H79TI026078-02 299,912 - SA1845 Bexar County Recovery Partnership Program 93.243 1H79SM063519-01 1,046,047 979,958
Passed ThroughTexas Attorney GeneralChild Support Enforcement Program
100-4001-40561 Title IV-D - Community Supervision 93.563 14-C0048 380,045 - 100-4001-41004 Title IV-D - Child Support Enforcement 93.563 12-C0014 1,281,149 -
Texas Department of Housing and Community AffairsComprehensive Energy Assistance Program
CEAP17102 CEAP17 - CEAP Program Services 93.568 58170002574 180,829 - CEAP17103 CEAP17 - Training/Travel Allowance 93.568 58170002574 316 - CEAP17105 CEAP17 - CEAP "Assurance 17"� 93.568 58170002574 13,451 - CEAP17106 CEAP17 - Utility Assistance Program 93.568 58170002574 1,099,242 - CEAP17199 CEAP17 - CEAP Administration 93.568 58170002574 131,442 - CEAP18102 CEAP18 - CEAP Program Services 93.568 58180002771 382,928 - CEAP18103 CEAP18 - Training/Travel Allowance 93.568 58180002771 87 - CEAP18105 93.568 58180002771 480,786 - CEAP18106 CEAP18 - Utility Assistance Program 93.568 58180002771 3,035,304 - CEAP18199 CEAP18 - CEAP Administration 93.568 58180002771 243,995 -
Bexar County, TexasSCHEDULE OF EXPENDITURES OF FEDERAL AND STATE AWARDS
As of September 30, 2018
CEAP18 - CEAP "Assurance 18"
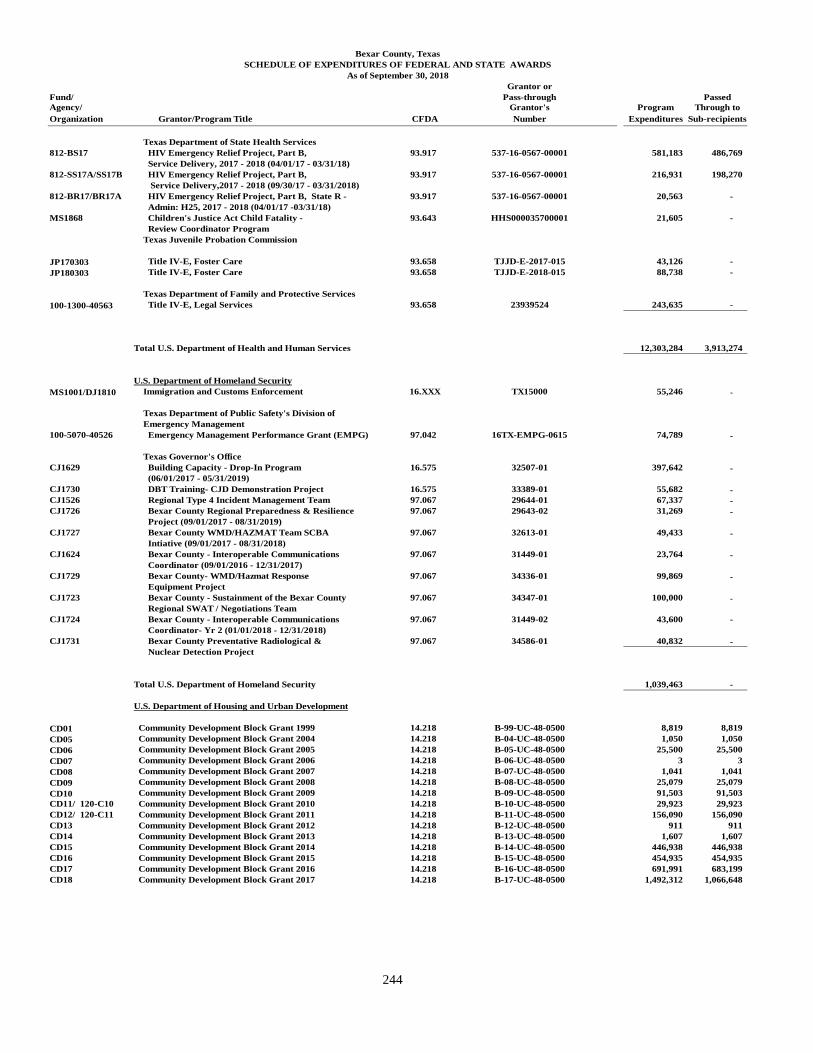
244
Grantor orFund/ Pass-through PassedAgency/ Grantor's Program Through toOrganization Grantor/Program Title CFDA Number Expenditures Sub-recipients
Texas Department of State Health Services812-BS17 HIV Emergency Relief Project, Part B, 93.917 537-16-0567-00001 581,183 486,769
Service Delivery, 2017 - 2018 (04/01/17 - 03/31/18)812-SS17A/SS17B HIV Emergency Relief Project, Part B, 93.917 537-16-0567-00001 216,931 198,270
Service Delivery,2017 - 2018 (09/30/17 - 03/31/2018)812-BR17/BR17A HIV Emergency Relief Project, Part B, State R - 93.917 537-16-0567-00001 20,563 -
Admin: H25, 2017 - 2018 (04/01/17 -03/31/18)MS1868 Children's Justice Act Child Fatality - 93.643 HHS000035700001 21,605 -
Review Coordinator ProgramTexas Juvenile Probation Commission
JP170303 Title IV-E, Foster Care 93.658 TJJD-E-2017-015 43,126 - JP180303 Title IV-E, Foster Care 93.658 TJJD-E-2018-015 88,738 -
Texas Department of Family and Protective Services100-1300-40563 Title IV-E, Legal Services 93.658 23939524 243,635 -
Total U.S. Department of Health and Human Services 12,303,284 3,913,274
U.S. Department of Homeland SecurityMS1001/DJ1810 Immigration and Customs Enforcement 16.XXX TX15000 55,246 -
Texas Department of Public Safety's Division of Emergency Management
100-5070-40526 Emergency Management Performance Grant (EMPG) 97.042 16TX-EMPG-0615 74,789 -
Texas Governor's OfficeCJ1629 Building Capacity - Drop-In Program 16.575 32507-01 397,642 -
(06/01/2017 - 05/31/2019)CJ1730 DBT Training- CJD Demonstration Project 16.575 33389-01 55,682 - CJ1526 Regional Type 4 Incident Management Team 97.067 29644-01 67,337 - CJ1726 Bexar County Regional Preparedness & Resilience 97.067 29643-02 31,269 -
Project (09/01/2017 - 08/31/2019)CJ1727 Bexar County WMD/HAZMAT Team SCBA 97.067 32613-01 49,433 -
Intiative (09/01/2017 - 08/31/2018)CJ1624 Bexar County - Interoperable Communications 97.067 31449-01 23,764 -
Coordinator (09/01/2016 - 12/31/2017)CJ1729 Bexar County- WMD/Hazmat Response 97.067 34336-01 99,869 -
Equipment ProjectCJ1723 Bexar County - Sustainment of the Bexar County 97.067 34347-01 100,000 -
Regional SWAT / Negotiations TeamCJ1724 Bexar County - Interoperable Communications 97.067 31449-02 43,600 -
Coordinator- Yr 2 (01/01/2018 - 12/31/2018)CJ1731 Bexar County Preventative Radiological & 97.067 34586-01 40,832 -
Nuclear Detection Project
Total U.S. Department of Homeland Security 1,039,463 -
U.S. Department of Housing and Urban Development
CD01 Community Development Block Grant 1999 14.218 B-99-UC-48-0500 8,819 8,819 CD05 Community Development Block Grant 2004 14.218 B-04-UC-48-0500 1,050 1,050 CD06 Community Development Block Grant 2005 14.218 B-05-UC-48-0500 25,500 25,500 CD07 Community Development Block Grant 2006 14.218 B-06-UC-48-0500 3 3 CD08 Community Development Block Grant 2007 14.218 B-07-UC-48-0500 1,041 1,041 CD09 Community Development Block Grant 2008 14.218 B-08-UC-48-0500 25,079 25,079 CD10 Community Development Block Grant 2009 14.218 B-09-UC-48-0500 91,503 91,503 CD11/ 120-C10 Community Development Block Grant 2010 14.218 B-10-UC-48-0500 29,923 29,923 CD12/ 120-C11 Community Development Block Grant 2011 14.218 B-11-UC-48-0500 156,090 156,090 CD13 Community Development Block Grant 2012 14.218 B-12-UC-48-0500 911 911 CD14 Community Development Block Grant 2013 14.218 B-13-UC-48-0500 1,607 1,607 CD15 Community Development Block Grant 2014 14.218 B-14-UC-48-0500 446,938 446,938 CD16 Community Development Block Grant 2015 14.218 B-15-UC-48-0500 454,935 454,935 CD17 Community Development Block Grant 2016 14.218 B-16-UC-48-0500 691,991 683,199 CD18 Community Development Block Grant 2017 14.218 B-17-UC-48-0500 1,492,312 1,066,648
Bexar County, TexasSCHEDULE OF EXPENDITURES OF FEDERAL AND STATE AWARDS
As of September 30, 2018

245
Grantor orFund/ Pass-through PassedAgency/ Grantor's Program Through toOrganization Grantor/Program Title CFDA Number Expenditures Sub-recipientsHM14 HOME Investment Partnership Agreement 2013 14.239 M13-UC-48-0500 22,801 22,801 HM15 HOME Investment Partnership Agreement 2014 14.239 M14-UC-48-0500 9,115 9,115 HM16 HOME Investment Partnership Agreement 2015 14.239 M15-UC-48-0500 42,058 31,801.52 HM17 HOME Investment Partnership Agreement 2016 14.239 M16-UC-48-0500 281,281 253,519 HM18 HOME Investment Partnership Agreement 2017 14.239 M17-UC-48-0500 98,881 98,155
ESG17 Emergency Solutions Grant Program - 2016 (HESG) 14.231 E-16-UC-48-0500 124,972 116,095 ESG18 Emergency Solutions Grant Program - 2017 (HESG) 14.231 E-17-UC-48-0500 767 -
Passed ThroughTexas Department of State Health Services
812-BH17 HIV Emergency Relief Project, Part B, HOPWA, 14.241 537-16-0505-00001 110,920 110,920 2016- 2017 (02/01/17 - 3/31/18)
Total U.S. Department of Housing and Urban Development 4,118,497 3,635,652
U.S. Department of JusticeJA16 Justice Assistance Grant - 2015 16.738 2015-DJ-BX-0993 3,123 - JA17 Justice Assistance Grant - 2016 16.738 2016-DJ-BX-0205 21,610 - MS0501/DJ1803 Organized Crime Drug Enforcement Task Force (OCDETF) 16.XXX 16,846 -
DeadMan WorkingMS0501/DJ1804 Organized Crime Drug Enforcement Task Force (OCDETF) 16.XXX SWTXW0503H 14,831 -
City SlangersMS0503/DJ1805 DEA - Sheriff 16.579 N/A 16,501 - MS0504/DJ1801 U.S. Marshals Service - Sheriff 16.XXX N/A 8,423 - DJ1809 Joint Law Enforcement Operation Task Force 16,547 - DJ1601 MIND (Males In Need of Direction) Court 16.745 2015-MO-BX-0004 174,706 - DJ1602 Bexar County PREA Prevention Program 16.735 2015-RP-BX-0002 65,086 - DJ1706 BexarCounty Felony Drug Court Discretionary Grant 16.585 2016-DC-BX-0018 118,687 - DJ1807 Bexar County DWI Court 16.585 2017-DC-BX-0013 135,341 - DJ1808 Bexar County Forensic Pathology Fellowship Program 16.560 2017-DN-BX-0147 22,673 -
Passed ThroughTexas Governor's Office
CJ1721 Human Trafficking Unit Program 16.738 26795-05 98,386 - CJ1821 Human Trafficking Unit Program 16.588 35957-01 1,552 - CJ1720 New Life Project 16.575 27612-04 248,202 - CJ1710 Bexar County PEARLS Court 16.575 30512-01 123,473 - CJ1718 Victim Assistance Early Intervention 16.575 32476-01 256,430 - CJ1732 Active Shooter Preparedness Equipment 16.738 32981-01 72,548 -
Texas Attorney GeneralOA182201 Access and Visitation Program - Title IV-D 93.597 17-C0128 69,388 - OA192201 Access and Visitation Program - Title IV-D 93.597 17-C0128 6,403 - OA1830 Internet Crimes Against Children 16.543 1885540/2015-MC-FX-K049 9,655 -
Total U.S. Department of Justice 1,500,411 -
Bexar County, TexasSCHEDULE OF EXPENDITURES OF FEDERAL AND STATE AWARDS
As of September 30, 2018

246
Grantor orFund/ Pass-through PassedAgency/ Grantor's Program Through toOrganization Grantor/Program Title CFDA Number Expenditures Sub-recipients
U.S. Department of TransportationPassed Through
Texas Department of TransportationHighway Safety Cluster
DT1818230001 Texas Traffic Safety - S.T.E.P 2018 Comprehensive 20.600 2018-BexarCoS-S-1YG-0005 467,728 - DT1826130001 No-Refusal Initiative (D.W.I.) - 2018 20.616 2018-BexarCoD-G-1YG-0149 17,910 -
Total Highway Safety Cluster 485,638
Total U.S. Department of Transportation 485,638 -
U.S. Department of the Treasury313-2001-42010 Sheriff Asset Forfeitures Program 21.XXX N/A 268,363 - 308-1300-42010 District Attorney Asset Forfeitures Program 21.XXX N/A 202,265 -
Total U.S. Department of the Treasury 470,628 -
U.S. Social Security Administration100-4001-40516 SSA Incentive 96.001 N/A 30,800 -
Total U.S. Social Security Administration 30,800 -
Total Federal Funds 20,616,279 7,548,925
STATE FUNDS
Texas Comptroller of Public Accounts320-1100-40542 State Chapter 19 Vote N/A N/A 296,860 - 100-4001-40500 County Courts Cases - Section 51 N/A N/A 1,260,000 - 100-1300-40502 Prosecutor Longevity Pay N/A N/A 273,559 - 100-1300-40506 DA Witness Reimbursement N/A N/A 63,075 - 100-4001-40530 Jury Pay Supplemental (State SB 1704) N/A N/A 490,314 - 302-4600-40529 Probate Supplemental N/A N/A 80,000 -
Total Texas Comptroller of Public Accounts 2,463,808 -
Texas Governor's OfficeCJ1622 Bexar County Body Worn Camera Program N/A 30492-01 14,986 - CJ1706 Bexar County Adult Drug Court N/A 20470-10 371,959 - CJ1806 Bexar County Adult Drug Court N/A 20470-11 17,565 - CJ1707 Bexar County Veterans Court N/A 23902-08 101,331 - CJ1807 Bexar County Veterans Court N/A 23902-09 14,785 - CJ1708 Bexar County Family Drug Treatment Court N/A 17367-14 331,146 - CJ1808 Bexar County Family Drug Treatment Court N/A 17367-15 12,437 - CJ1709 Bexar County Prostitution Prevention Program N/A 27603-04 220,527 - CJ1809 Bexar County Prostitution Prevention Program N/A 27603-05 6,516 - CJ1728 Project Connect at Lanier H.S. N/A 28710-03 87,161 - CJ1719 Bexar County Juvenile Drug Court N/A 16922-15 94,596 - CJ1819 Bexar County Juvenile Drug Court N/A 16922-16 3,879 - CJ1625 Border Prosecution Unit-TAG N/A 31695-01 9,274 - CJ1725 Border Prosecution Unit-TAG N/A 31695-02 132,137 - CJ1825 Border Prosecution Unit-TAG N/A 31695-03 12,588 - CJ1833 Bexar County Body Armor Progam N/A 34504-01 349,700 - 100-4001-40540 4th Court of Appeals N/A N/A 70,000 -
Passed through Texas Military Prepardness Commission
MS1702 Defense Economic Assistance Adjustment Grant N/A Project # 1701-01-01 1,202,096 -
Total Texas Governor's Office 3,052,683 -
Bexar County, TexasSCHEDULE OF EXPENDITURES OF FEDERAL AND STATE AWARDS
As of September 30, 2018

247
Grantor orFund/ Pass-through PassedAgency/ Grantor's Program Through toOrganization Grantor/Program Title CFDA Number Expenditures Sub-recipients
Texas Department of State Health Services812-SR17 HIV Emergency Relief Project, Part B, State Services N/A 2016-003759-00 - 575,614
(09/01/2016-08/31/2017)812-SR18 HIV Emergency Relief Project, Part B, State Services N/A 537-18-0008-00001 327,463 327,463
(09/01/2017-08/31/2018)812-RF18 HIV Emergency Relief Project, Part B, State Rebate Funds N/A 537-18-0008-00001 211,316 211,316
(09/01/2017 - 08/31/2018)812-RS18 HIV Emergency Relief Project, Part B, State Rebate Eligible Staff N/A 537-18-0008-00001 48,071 48,071
(09/01/2017 - 08/31/2018)Passed Through
Texas State University - San MarcosDT1731230001 Tobacco Enforcement Program - Tobacco Compliance N/A N/A 10,575 -
- Sheriff Office
Total Texas Department of State Health Services 597,425 1,162,464
Texas Health and Human Service CommissionMS1867 Texas Veterans + Family Alliance Grant Program N/A HHS000125400002 4,952 -
Passed throughTexas Department of Family Protective Services
MS1801 Early Intervention Program for Toddler: N/A 24358716 259,782 - Baby Court Services
MS1901 Early Intervention Program for Toddler: N/A 24358716 14,036 - Baby Court Services
Total Texas Health and Human Services Commision 278,770 -
Texas Department of TransportationPassed ThroughCity of San Antonio
MS1804230001 Regional Auto Crimes Team N/A SA-T04-10063-18 78,243 - MS1904230001 Regional Auto Crimes Team N/A ABTPA 608-19-SPD0000 8,666 -
Total Texas Department of Transportation 86,909 -
Texas Commission on Environmental Quality100-4001-40555 Texas Commission on Environmental Quality N/A N/A 19,061 -
Total Texas Commission on Environmental Quality 19,061 -
Texas Indigent Defense CommissionMS1865490401 FY17 Discretionary Grant - Early Representation of N/A 212-68-D04 105,631 -
Defendants with Mental Illness 100-4001-40504 FY17 Formula Grant Program N/A N/A 2,059,965 -
Total Texas Indigent Defense Commission 2,165,596 -
Texas Parks and WildlifeHot Wells County Park N/A 4801147 549,283 -
Total Texas Parks & Wildlife 549,283 -
Texas Veterans Commission MS1712470601 Veteran Texas Commission - General Assistance N/A FVA_17_0476 139,296 -
FY2017 - 2018MS1812470601 Veteran Texas Commission - General Assistance N/A FVA_18_0595 46,561 -
FY2018 - 2019MS1811390101 Veteran Texas Commission- Veterans Treatment N/A VTC_18_0594 458 -
Felony Court
Total Texas Veterans Commission 186,315 -
Total State Funds 9,399,850 1,162,464
Total Federal and State Funds $ 30,016,127 8,711,391
Bexar County, TexasSCHEDULE OF EXPENDITURES OF FEDERAL AND STATE AWARDS
As of September 30, 2018

248
Bexar County, Texas NOTES TO THE SCHEDULE OF EXPENDITURES OF FEDERAL AND STATE AWARDS
Year Ended September 30, 2018 1. GENERAL
The accompanying schedule presents the activity of the federal and state award programs of Bexar County, Texas (the “County”), except for the federal and state award programs for the System and the Authority, the discretely presented component units of the County, which have been excluded. The System and the Authority are audited by other auditors and are separately reported for compliance with federal and/or state compliance. The County’s reporting entity is defined in Note A.1. to the County’s basic financial statements. 2. BASIS OF ACCOUNTING
The accounting and financial reporting treatment applied to a fund is determined by its measurement focus. The governmental funds are accounted for using a current financial resources measurement focus. All federal and state grant funds were accounted for in the General Fund, Capital Projects Fund or various special revenue funds, which comprise the “Nonmajor Governmental Funds” column in the governmental funds financial statements. With this measurement focus, only current assets, deferred outflows of resources, current liabilities, and deferred inflows of resources generally are included on the balance sheet. Statements of Revenues and Expenditures and Changes in Fund Balances of these funds present increases (i.e., revenues and other financing sources) and decreases (i.e., expenditures and other financing uses). The modified accrual basis of accounting is used in the governmental funds financial statements. This basis of accounting recognizes revenues in the accounting period in which they become susceptible to accrual (i.e., both measurable and available) and expenditures in the accounting period in which the fund liability is incurred, if measurable, except for un-matured interest on long-term debt, which is recognized when due, and certain compensated absences and claims and judgments, which are recognized when the obligations are expected to be liquidated with expendable available financial resources. Federal and state grant funds are considered to be earned to the extent of expenditures made under the provisions of the grant, and accordingly, when such funds are received in advance, they are recorded as unearned revenues until earned. Expenditures for some programs are not specifically attributable to the federal revenue source and are shown on the schedule in amount equal to the federal and/or state revenue. 3. INDIRECT COST
Indirect costs are those that have been incurred for common or joint purposes. These costs benefit more than one cost objective and cannot be readily identified with a particular final cost objective without effort disproportionate to the results achieved. After direct costs have been determined and assigned directly to Federal awards and other activities as appropriate, indirect costs are those remaining to be allocated to benefited cost objectives. The County has elected to charge only direct costs to state and federal programs.
4. CONTINGENT LIABILITIES RELATED TO COMPLIANCE
The County participates in numerous state and federal grant programs that are governed by various rules and regulations of the grantor agencies. Costs charged to the respective grant programs are subject to audit and adjustment by the grantor agencies; therefore, to the extent that the County has not complied with the rules and regulations governing the grants, if any, refunds of any money received may be required, and the collectability of any related receivable at September 30, 2018 may be impaired.

BEXAR COUNTY, TEXAS SCHEDULE OF FINDINGS AND QUESTIONED COSTS
Year Ended September 30, 2018
249
SECTION I -- SUMMARY OF AUDITORS’ RESULTS
Financial Statements
Type of auditor’s report issued: Unmodified
Internal control over financial reporting:
Material weakness(es) identified?
Yes
X No
Significant deficiency(ies) identified not considered
to be material weaknesses?
Yes
X None Reported
Noncompliance material to financial statements
noted?
Yes
X No
Federal and State Awards
Internal control over major programs:
Material weakness(es) identified?
Yes
X No
Significant deficiency(ies) identified not considered
to be material weaknesses?
Yes
X None Reported
Type of auditor’s report issued on compliance for major
programs:
Unmodified
Any audit findings disclosed that are required to be
reported in accordance with 2 CFR 200.516(a)?
Yes
X No
Identification of Major Programs
CFDA Number(s)
Name of Federal or State Program
Federal
14.218 Community Development Block Grant 15.916 Hot Wells County Park (Outdoor Recreation Acquisition, Development and Planning) 16.575 Crime Victim Assistance Grant 93.243 Substance Abuse and Mental Health Services Projects State N/A State Indigent Defense Program N/A Family Drug Treatment Court N/A Hot Wells County Park N/A Body Armor Program

BEXAR COUNTY, TEXAS SCHEDULE OF FINDINGS AND QUESTIONED COSTS
Year Ended September 30, 2018
250
SECTION I -- SUMMARY OF AUDITORS’ RESULTS (Continued)
Dollar Threshold used to distinguish between Type A and Type B programs:
Federal – $750,000
State – $300,000
Auditee qualified as low-risk auditee?
X Yes
No
SECTION II --- FINANCIAL STATEMENT FINDINGS There are no financial statement findings required to be reported in accordance with Government Auditing Standards for the year ended September 30, 2018. SECTION III --- FEDERAL AND STATE AWARD FINDINGS AND QUESTIONED COSTS There are no federal or state award findings and questioned required to be reported in accordance with 2 CFR 200.516(a) for the year ended September 30, 2018.
SECTION IV --- PRIOR YEAR FEDERAL AND STATE AWARD FINDINGS AND QUESTIONED COSTS There are no prior year federal or state award findings for the year ended September 30, 2018.


