Between BlackRock and a Hard Place - ETC Group...Between BlackRock and a Hard Place Is the...
22
Between BlackRock and a Hard Place Is the Industrial Food Chain Unraveling…or Rewinding? Communique #116, October 2018 Caught between powerful new financial actors, shifting socio-environmental, consumer and regulatory pressures and a game-changing new Big Data platform, nothing is normal for the Industrial Food Chain. ISSUE: From agro-inputs to food retailers, the biggest companies in the Industrial Food Chain are merging, but not necessarily gaining (or even keeping) market control. New actors, big and small, are moving in to take advantage of game-changing developments that include new technologies and changing consumer preferences, and behind the newcomers and the old guard are a handful of vastly more powerful asset managers and investment brokers. Through all these changes, government regulators, consumers, and the people who provide our food know less about the Industrial Food Chain than ever. ACTORS: We can no longer talk about the “Top 10” or even the Top Four” companies in each sector. Each “link” in the Industrial Food Chain is not only moving toward duopolies, but some of the links themselves are also merging. Aside from the multinational companies we’ve known for decades, famous but unexpected giants like Amazon, Alibaba, Google, Microsoft and Tencent are shaking the chain and soldering the links. Behind the scene, financial players like BlackRock and Blackstone are using new trading mechanisms like blockchains and Dark Pools, shifting shares and – though they claim otherwise – calling the shots. AT STAKE: Not only is control of the $7.5 trillion Industrial Food Chain at stake (which, of course, only feeds 30% of the world’s people, and badly), but also global food security and the need to reduce agribusiness’ $4.8 trillion socio-environmental damages. With everything in flux and nobody happy with the commercial food system as it is, the risks are enormous, but the opportunity to move toward a better food system has never been greater. FORA: Under citizen pressure, some governments (e.g. Canada) and regions (e.g. European Union) are developing National Food Policies where the weaknesses of the Industrial Food Chain and the strengths of its alternatives are being debated. At the UN, the Food and Agriculture Organization (FAO) is hoping to build on its 2018 Agroecology Conference by posing practical solutions and a way forward when its Committee on Agriculture convenes October 1–5. The positive agroecology option will also be on the agenda of the UN’s influential Committee on World Food Security (CFS) in Rome October 15–19. Notably, the issue of corporate concentration has been a smouldering concern of the CFS for the last two years and Southern governments will want it to consider further mergers and the threats posed by the Big Data platform. After Rome, the battleground shifts to Egypt (November 17–29) where the UN Convention on Biological Diversity will hold its biennial meeting with new biological technologies front and centre in the agenda.
Transcript of Between BlackRock and a Hard Place - ETC Group...Between BlackRock and a Hard Place Is the...
Between BlackRock and a Hard Place Is the Industrial Food Chain Unraveling…or Rewinding?
Communique #116, October 2018 Caught between powerful new financial actors, shifting socio-environmental, consumer and regulatory pressures and a game-changing new Big Data platform, nothing is normal for the Industrial Food Chain.
ISSUE: From agro-inputs to food retailers, the biggest companies in the Industrial Food Chain are merging, but not necessarily gaining (or even keeping) market control. New actors, big and small, are moving in to take advantage of game-changing developments that include new technologies and changing consumer preferences, and behind the newcomers and the old guard are a handful of vastly more powerful asset managers and investment brokers. Through all these changes, government regulators, consumers, and the people who provide our food know less about the Industrial Food Chain than ever.
ACTORS: We can no longer talk about the “Top 10” or even the Top Four” companies in each sector. Each “link” in the Industrial Food Chain is not only moving toward duopolies, but some of the links themselves are also merging. Aside from the multinational companies we’ve known for decades, famous but unexpected giants like Amazon, Alibaba, Google, Microsoft and Tencent are shaking the chain and soldering the links. Behind the scene, financial players like BlackRock and Blackstone are using new trading mechanisms like blockchains and Dark Pools, shifting shares and – though they claim otherwise – calling the shots.
AT STAKE: Not only is control of the $7.5 trillion Industrial Food Chain at stake (which, of course, only feeds 30% of the world’s people, and badly), but also global food security and the need to reduce agribusiness’ $4.8 trillion socio-environmental damages. With everything in flux and nobody happy with the commercial food system as it is, the risks are enormous, but the opportunity to move toward a better food system has never been greater.
FORA: Under citizen pressure, some governments (e.g. Canada) and regions (e.g. European Union) are developing National Food Policies where the weaknesses of the Industrial Food Chain and the strengths of its alternatives are being debated. At the UN, the Food and Agriculture Organization (FAO) is hoping to build on its 2018 Agroecology Conference by posing practical solutions and a way forward when its Committee on Agriculture convenes October 1–5. The positive agroecology option will also be on the agenda of the UN’s influential Committee on World Food Security (CFS) in Rome October 15–19. Notably, the issue of corporate concentration has been a smouldering concern of the CFS for the last two years and Southern governments will want it to consider further mergers and the threats posed by the Big Data platform. After Rome, the battleground shifts to Egypt (November 17–29) where the UN Convention on Biological Diversity will hold its biennial meeting with new biological technologies front and centre in the agenda.

2
INTRODUCTION – Black Swans Everywhere Recent years have seen a series of so-called “Black Swan” events (unanticipated shocks) that have baffled the entire Food Chain. Just as the Gutenberg printing press changed everything from writing to religion,1 the sudden appearance of the Big Data platform is changing everything from agriculture and banking to medicine and media. The platform of digital information has been accompanied by other stunning technological changes in genomics and synthetic biology (enabling scientists to gene-edit life as easily as Gutenberg set type), as well as in neurosciences (artificial intelligence, or AI), surveillance (from sensors to satellites) and, particularly, the ability to manipulate and manage data through algorithms and blockchains. Each of these technological Black Swans is already having a major impact on the Industrial Food Chain.
And, the technological changes are leading to other Black Swan events in the marketplace. The Big Data platform can hold a lot. The company that has the algorithms to manipulate the data can cut across a wide range of industries and capture markets once thought entirely foreign. Suddenly, Facebook’s technologies are being used by BASF to identify weeds2; Cargill is brewing a sweetener crop from Paraguay called Stevia in a vat in Switzerland; Amazon has bought Whole Foods, an organic food retailer (and, rumours suggest, much more soon) while Google and China’s Alibaba are advising farmers and delivering groceries to customers.3
Ominously, the Big Data platform’s algorithms – increasingly linked to blockchains – are driving the investment and acquisition strategies of companies that give CEOs at Bayer, Cargill and Nestlé nightmares. With trillions of dollars to move around, asset management firms and investment houses with names most farmers and food policymakers have never heard of (e.g., Blackrock, Vanguard, State Street and Capital Group) are picking up shares in companies in each of the links in the Food Chain, affording them insider knowledge of all the competing corporations.
TECHNOLOGY – Crowding onto the Big Data Platform In early 2018, the “best and brightest” at the World Economic Forum were told of the Earth Bank of Codes: a plan to digitally map the genome of every known species, store the data in the Cloud and make it available to researchers via blockchain with payment by a cryptocurrency. The Davos crowd didn’t realize that the future was behind them – BGI, a Chinese genomics company was already canvassing the world’s largest crop gene banks for duplicates of their seven-million-plus seed accessions to digitize the DNA and sell it to plant breeders.4 Elsewhere in 2018, the world’s largest farm machinery companies are selling tractors and combines that come with more lines of computer code than a space shuttle.5 Another agribusiness is taking a leaf from Facebook to map and zap suspected weeds, while one of the world’s leading grain traders is using blockchains to move soybeans from a silo on the US east coast through the Panama Canal to a feed mill in China; Walmart is tracking the journey of its fruits and vegetables from farms in South and Central America to its shops in the USA6 and Amazon is using its sensors and digital

3
markers for the world’s first “till-free” walk-through grocery store.10 This is the Big Data platform.
Historically, a “platform” technology is a broad and highly-disruptive technology that has implications for several (even all) industrial sectors. This includes the steam engine, electricity, telecommunications, and the computer. “Big Data” is described as a platform because it represents the massive capacity of computer-related technologies to amass and analyse incredible quantities of data to extract commercially-relevant information. In the case of agriculture, Big Data – quite remarkably – incorporates the digital manipulation of biology (editing the A, C, G, and T of DNA) with the “1” and “0” of computer programs, simultaneously interpreting current and historic weather, market, yield, production information and beyond.
The big deal about the Big Data platform is that the technology suddenly shifts the commercial advantage to the companies that have the most data and are most able to manipulate it. As outlined in this report, the consequences are extraordinary: Alibaba and Google are advising Chinese farmers on hog breeding and markets; Amazon is not just delivering food but buying grocery chains; global farm machinery companies (John Deere, AGCO and Kubota) are using their storehouse of field data to team up with the newly-merged seed/chemical companies (Bayer, Corteva Agriscience, Syngenta and BASF) and at the other end of the food chain, Walmart, Carrefour, Unilever and Nestlé are using their Big Data to slide along the food chain and negotiate directly with farmers. Caught in the middle, commodity traders like Cargill and ADM and fertilizer manufacturers like Nutrien and Yara no longer have the unique market information and resources that gave them so much influence in the past. Disruptive platform technologies may not be new, but agriculture hasn’t experienced anything like this in at least 100 years.
Big-data enabled technologies explained... Blockchains: Often described as a digital ledger, blockchains allow parties to a transaction to track the progress of that transaction and confirm that all the steps have been completed and specific criteria met. Blockchains remove intermediaries and make processes digital. Commodity traders, for example, believe they can reduce transaction costs by 10-30% using blockchains to keep track of commodities, and retailers believe blockchains can help food safety by tracking the journey of each head of lettuce.7 However, recent experience shows that the integrity of the blockchain can be compromised,8 and a single blockchain transaction uses the same energy as one week in a US household.9 Cryptocurrencies: Cryptocurrencies are, essentially, artificial money. Their value and transactions are ensured via encrypted blockchains. They may ultimately have some benefit to agribusiness and financial institutions, but they are not reliable for farmers. The unregulated price of the most famous cryptocurrency – bitcoins – has oscillated by 45% during 2018; hundreds of millions of dollars in coins have been stolen; billions have been lost; and, again, the energy cost is eye-watering. Dark Pools: Dark Pools are opaque Internet trading platforms that often use blockchain contracts and (sometimes) cryptocurrency payments. Dark Pools have been around for several years, but new financial technology tools have made them popular with trading companies to strike private deals for agricultural, energy or metal commodities and disguise the trader and the value of trades until after the sale. Dark Pools aren’t conventionally regulated by stock exchanges and make it difficult for companies and countries to monitor commodity movements and safeguard their food security.

4
In Blocking the Chain, a forthcoming report co-published with the Rosa Luxembourg Foundation, Global Change – Local Conflict, and INKOTA-netzwerk e. V., ETC Group lays out the most recent agricultural technological changes including the use of blockchains and crypto currencies in conjunction with robots, drones, satellites along with synthetic biology and gene editing. For further information, visit www.etcgroup.org.
CONCENTRATION – Unraveling or Rewinding? Technological disruption is sweeping through global corporations via a remarkable succession of double-digit-billion-dollar mergers and acquisitions (M&As) led or backed by asset management firms and investors including BlackRock, Vanguard, State Street, Blackstone, KKR, Carlyle Group and others whose names never come up when policymakers discuss food security. Nervously, financial observers note that there hasn’t been so much buyout activity since the eve of the 2008 financial crisis. Still, in mid-2018, these financial behemoths are reported to still have more than $1 trillion to invest (preferably) this year. 2017 was a record-setter for global takeovers: companies and their backers plunked down $4.3 trillion and, stunningly, increased corporate concentration in every economic sector. With a global trade war gearing up in mid-2018, the future is far from certain, but the pace of mergers in the year’s early months were well ahead of 2017. The takeover binge that is impacting IT, pharmaceuticals and biotech is also impacting the food chain.
In a recent review of global corporate trends and mergers and acquisitions, the OECD concluded that new technologies are a major driver of concentration. 2018 is witnessing both the convergence of disruptive new platform technologies with disruptive new financial tools and actors. Microsoft is not only developing microbials for agriculture and yeast for brewers, it is moving into driverless vehicles – as is Google. Amazon is not only packing groceries, but also buying healthcare companies and film studios. The forces of change are roughly the same everywhere, and their impact is global. With more data comes more power and with more power comes more opportunities for companies to diversify their activities. But this does not always create greater market concentration – at least, not immediately. Technology is not the sole determinant of concentration. The most recent round of mergers has broken all the barriers and persuaded companies and their investors that antiquated national antitrust laws and distracted policymakers will allow vertical and horizontal mergers once considered unacceptable. Historically, competition rules have been tough on horizontal takeovers (e.g. Bayer buying Monsanto and Dow merging with DuPont), fearing that such moves would reduce competition and lower the incentive for innovation. Vertical takeovers, however, (e.g. Cargill buying a fish processor or Walmart buying a food delivery company) were thought to be less threatening. Now, it seems the gloves are off and every kind of takeover is acceptable. Where regulators once reacted when the four-firm concentration reached 40% in a market, opposition to oligopoly is turned into acceptance of duopolies. From one economic sector to another, it is not unusual for just two or three companies to control half – sometimes 90% – of the market.
5
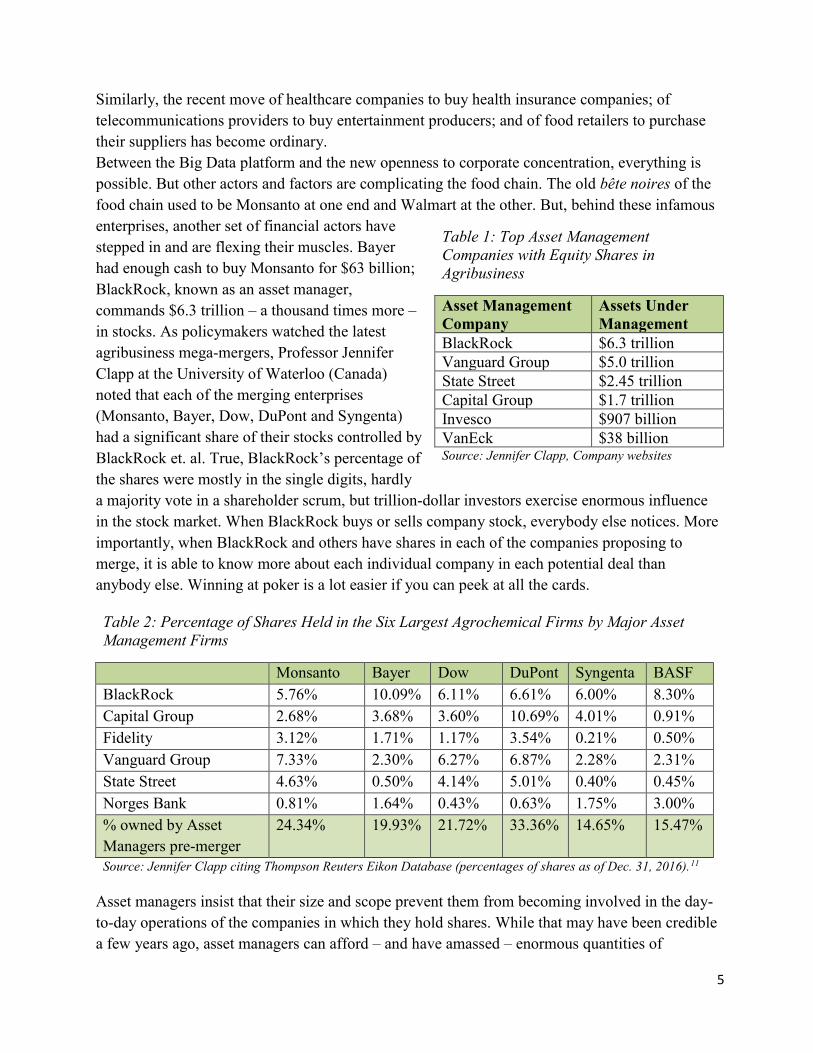
Similarly, the recent move of healthcare companies to buy health insurance companies; of telecommunications providers to buy entertainment producers; and of food retailers to purchase their suppliers has become ordinary. Between the Big Data platform and the new openness to corporate concentration, everything is possible. But other actors and factors are complicating the food chain. The old bête noires of the food chain used to be Monsanto at one end and Walmart at the other. But, behind these infamous enterprises, another set of financial actors have stepped in and are flexing their muscles. Bayer had enough cash to buy Monsanto for $63 billion; BlackRock, known as an asset manager, commands $6.3 trillion – a thousand times more – in stocks. As policymakers watched the latest agribusiness mega-mergers, Professor Jennifer Clapp at the University of Waterloo (Canada) noted that each of the merging enterprises (Monsanto, Bayer, Dow, DuPont and Syngenta) had a significant share of their stocks controlled by BlackRock et. al. True, BlackRock’s percentage of the shares were mostly in the single digits, hardly a majority vote in a shareholder scrum, but trillion-dollar investors exercise enormous influence in the stock market. When BlackRock buys or sells company stock, everybody else notices. More importantly, when BlackRock and others have shares in each of the companies proposing to merge, it is able to know more about each individual company in each potential deal than anybody else. Winning at poker is a lot easier if you can peek at all the cards.
Asset managers insist that their size and scope prevent them from becoming involved in the day-to-day operations of the companies in which they hold shares. While that may have been credible a few years ago, asset managers can afford – and have amassed – enormous quantities of
Table 1: Top Asset Management Companies with Equity Shares in Agribusiness
Asset Management Company
Assets Under Management
BlackRock $6.3 trillion Vanguard Group $5.0 trillion State Street $2.45 trillion Capital Group $1.7 trillion Invesco $907 billion VanEck $38 billion Source: Jennifer Clapp, Company websites
Table 2: Percentage of Shares Held in the Six Largest Agrochemical Firms by Major Asset Management Firms
Monsanto Bayer Dow DuPont Syngenta BASF BlackRock 5.76% 10.09% 6.11% 6.61% 6.00% 8.30% Capital Group 2.68% 3.68% 3.60% 10.69% 4.01% 0.91% Fidelity 3.12% 1.71% 1.17% 3.54% 0.21% 0.50% Vanguard Group 7.33% 2.30% 6.27% 6.87% 2.28% 2.31% State Street 4.63% 0.50% 4.14% 5.01% 0.40% 0.45% Norges Bank 0.81% 1.64% 0.43% 0.63% 1.75% 3.00% % owned by Asset Managers pre-merger
24.34% 19.93% 21.72% 33.36% 14.65% 15.47%
Source: Jennifer Clapp citing Thompson Reuters Eikon Database (percentages of shares as of Dec. 31, 2016).11
6
information they can run through the algorithms on their Big Data platform to identify key pressure points and opportunities. BlackRock, for example, not only had almost 6% of Monsanto’s shares and more than 10% of Bayer’s but it also held more than 8% of the shares of BASF – the company that arguably benefited most from their merger. Today, it is almost universally accepted that these major financial actors can make or break any company and any deal.
The asset managers are big, but they aren’t alone. Speculators and investment companies like Blackstone, KKR and Carlyle Group are more aggressive and nimbler, and are very public about swinging their weight in shareholder meetings. They too are spreading out along the Food Chain looking for profits for their shareholders. Sometimes the best profits can be made from old-guard agribusinesses (Bayer, Deere & Co., Nestlé or Carrefour); in other cases, the best profits might come from backing new start-ups employing new technologies in ways the old guard never considered. THE FIRST LINKS IN THE FOOD CHAIN For four decades, ETC Group has been tracking corporate concentration all along the Food Chain from seeds to salad bars, and – with rare exceptions – the trendline in every sector has been greater concentration. In the sections below, we examine the state of each part of the Food Chain, but the big picture is harder to decipher.
At the beginning of the Chain, the concentration trend continues: after the 2017-2018 mega-mergers, just four companies control 66% of corporate seed sales worldwide and four companies control about 70% of global agrochemical sales. Most importantly, three of the four companies in seeds and pesticides are the same – Bayer (now owning Monsanto) Corteva Agriscience (formerly Dow-DuPont) and Syngenta (owned by ChemChina and likely to be taken over by Sinochem12). The livestock genetics sector is also hyper-concentrated: just three companies collectively control virtually all the world’s commercial poultry breeding stock – the leading animal protein species.
But, the pattern isn’t consistent everywhere in the input sector. Despite colossal mergers in the fertilizer sector in the last few months (with the joining of the number two and number four companies), that sector is seemingly less concentrated than before. However, market share is a very incomplete (and inadequate) measure of corporate power. In the case of fertilizers, concentration is made even more opaque because assets are constantly being shifted among the major players – they regularly sell off regional assets when prices are low, invest in rival companies or launch joint ventures. Likewise, the farm machinery industry continues to be dominated by six companies and each of these is branching out with joint ventures and buying start-ups even as their market share appears to be eroding.

7
SEEDS The just-completed bout of mergers in the seed sector has left the listing of top tier companies slightly uncertain for 2017. To the dismay of competitors, BASF (Germany) benefited most from Bayer’s divestitures during the Bayer-Monsanto merger. BASF has not been an active player in the seed trade, although it has been active in both crop chemicals and crop genetics. A second beneficiary of the mergers was FMC in the USA, which received some of the seed and agrochemical technologies developed by DuPont prior to its merger with Dow. Some competitors believe FMC won access to DuPont’s higher-end R&D and that it may become a bigger player in both seeds and chemicals in the future.13 According to Phillips McDougall, the value of the “global traded crop seed market” (which does not include farmer-saved seed or seed supplied by governments/institutions) increased by 3.9% in 2017 to reach $38.4 billion. The genetically modified (GM) seed market accounted for an estimated $21.4 billion, or 56% of the total market by value.
Table 4: Seed and Trait Sales of the Leading Seed Companies, 2017
2017 Ranking
Company (Headquarters)
2017 Sales (US millions)
% Market share (pro forma)
1 Monsanto + Bayer14 10,913 + 1,769 = 12,682
33%
2 DowDuPont 8,20015 21.3% 3 Syngenta 2,82616 7.3% 4 Limagrain (Vilmorin) 1,84217 4.8% Total Top Four
25,550 66.4%
5 KWS 1,49718
3.9%
6 DLF (Denmark) 51419 1.3% Total Top Six
27,561 71.6%
2017 Global Seeds Sales (estimate)
38,429 100%
Note: The precise market share for each company is not yet certain because some seed assets are still being sold in the wake of recent mergers. However, most of the assets are being sold to top tier seed companies. Source: ETC Group, based on information from AGROW/INFORMA.
Table 3: Seed Market Concentration Trendline, 1994 -2014
Year 4-firm concentration ratio (%)
1994 21.1 2000 32.5 2009 53.9 2014 57.4 2018 (pro forma)
66.4%
Source: ETC Group, based on information from AGROW/INFORMA
8
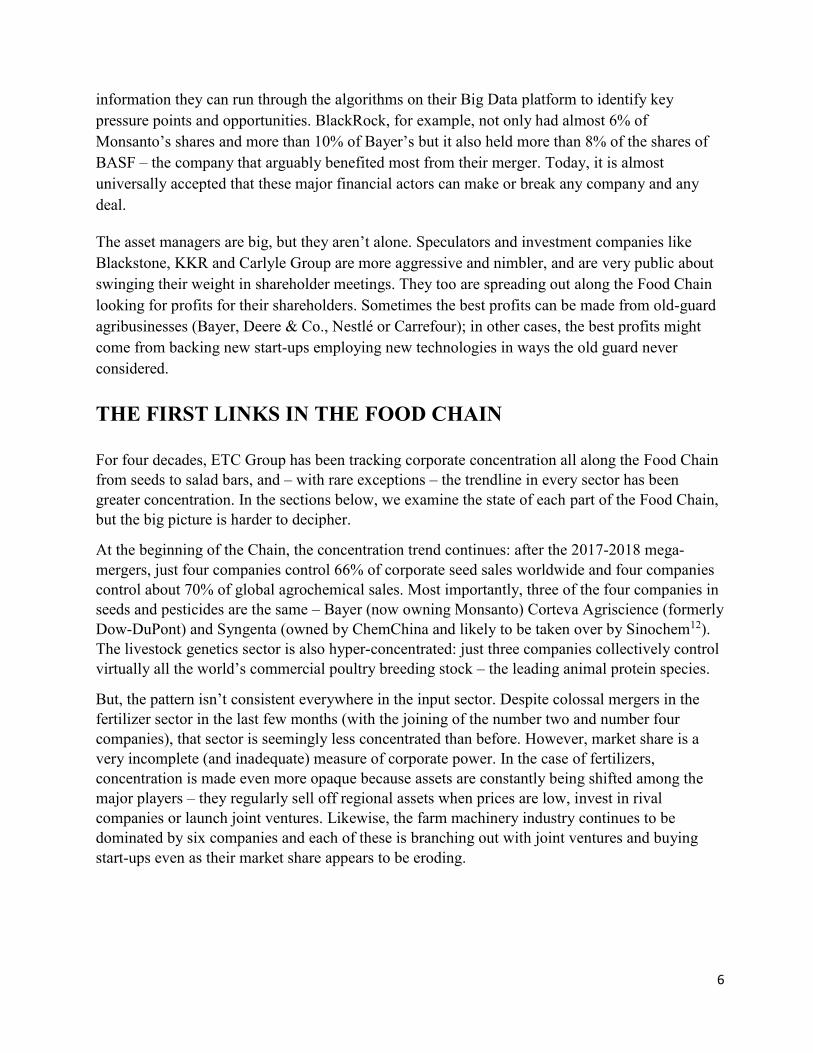
AGROCHEMICALS Over a span of 12 months, six agrochemical giants sealed three mega-mergers: Syngenta and ChemChina, Dow and Dupont (now Corteva Agriscience), and finally, with Bayer’s takeover of Monsanto in June 2018, the “Big Six” become a foursome. In both the seed and agrochemical sectors, the recent mergers have made it impossible to disassociate the two “links” in the Food Chain. ETC Group has tried, at this early moment, to sort through the leading four companies. The agrochemical company that would be fifth in line – FMC – may be working its way up after receiving some of the best R&D material from DuPont.
Table 6: Agrochemical Sales of the Leading Agrochemical Companies, 2017
2017 Ranking
Company (Headquarters)
2017 Sales (US millions)
% Market share (pro forma)
1 Syngenta + ChemChina
9,244 + 3,52320 = 12,767
23.5%
2 Bayer Crop Science + Monsanto
8,713 + 3,727= 12,440
23%
3 BASF 6,704 12.3% 4 Dow + DuPont (as
agriculture division Corteva Agriscience)
6,100
11.2%
Total Top Four
38,011 70%
2017 Global Agrochemical Sales
54,219 100%
Note: The actual market share is unknown because some assets are still being sold in the wake of recent mergers. However, most of the assets are being sold to top tier companies. Source: ETC Group, based on information from AGROW/INFORMA.
Table 5: Agrochemical Market Concentration Trend line, 1994–2017
Year 4-firm concentration ratio (%)
1994 28.5 2000 41.0 2009 53.0 2014 61.6 2017 (pro forma)
70
Source: ETC Group, based on information from AGROW/INFORMA
9
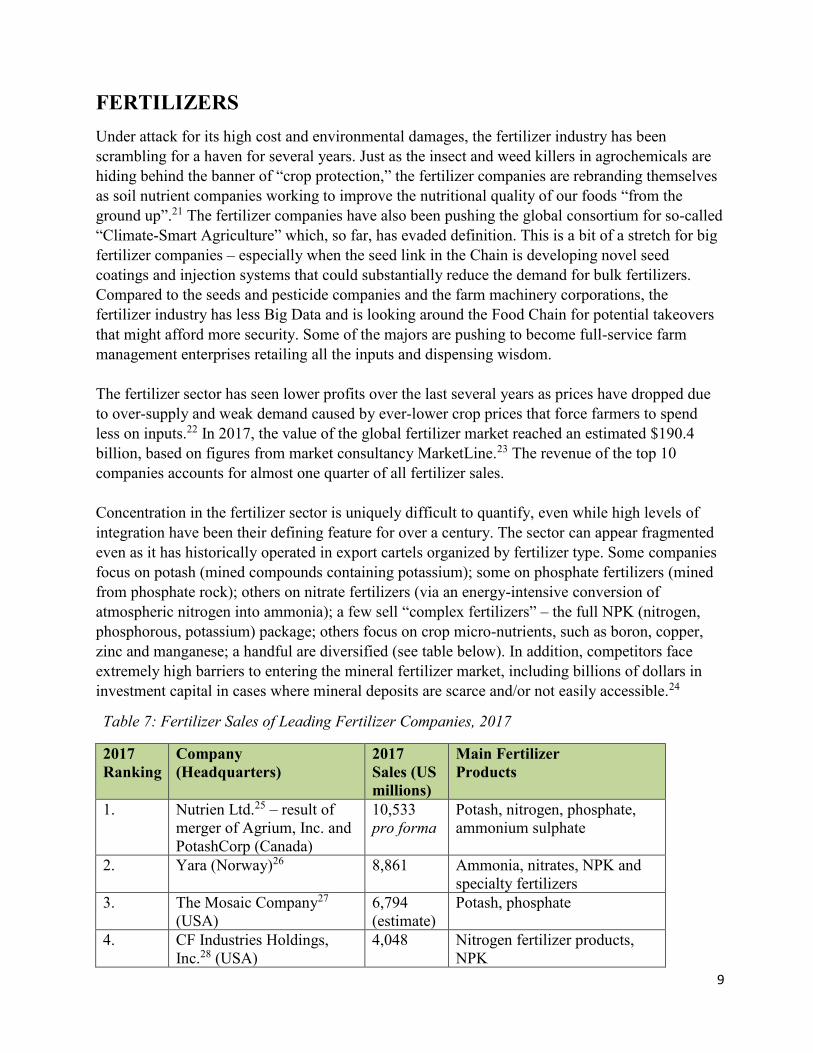
FERTILIZERS Under attack for its high cost and environmental damages, the fertilizer industry has been scrambling for a haven for several years. Just as the insect and weed killers in agrochemicals are hiding behind the banner of “crop protection,” the fertilizer companies are rebranding themselves as soil nutrient companies working to improve the nutritional quality of our foods “from the ground up”.21 The fertilizer companies have also been pushing the global consortium for so-called “Climate-Smart Agriculture” which, so far, has evaded definition. This is a bit of a stretch for big fertilizer companies – especially when the seed link in the Chain is developing novel seed coatings and injection systems that could substantially reduce the demand for bulk fertilizers. Compared to the seeds and pesticide companies and the farm machinery corporations, the fertilizer industry has less Big Data and is looking around the Food Chain for potential takeovers that might afford more security. Some of the majors are pushing to become full-service farm management enterprises retailing all the inputs and dispensing wisdom. The fertilizer sector has seen lower profits over the last several years as prices have dropped due to over-supply and weak demand caused by ever-lower crop prices that force farmers to spend less on inputs.22 In 2017, the value of the global fertilizer market reached an estimated $190.4 billion, based on figures from market consultancy MarketLine.23 The revenue of the top 10 companies accounts for almost one quarter of all fertilizer sales. Concentration in the fertilizer sector is uniquely difficult to quantify, even while high levels of integration have been their defining feature for over a century. The sector can appear fragmented even as it has historically operated in export cartels organized by fertilizer type. Some companies focus on potash (mined compounds containing potassium); some on phosphate fertilizers (mined from phosphate rock); others on nitrate fertilizers (via an energy-intensive conversion of atmospheric nitrogen into ammonia); a few sell “complex fertilizers” – the full NPK (nitrogen, phosphorous, potassium) package; others focus on crop micro-nutrients, such as boron, copper, zinc and manganese; a handful are diversified (see table below). In addition, competitors face extremely high barriers to entering the mineral fertilizer market, including billions of dollars in investment capital in cases where mineral deposits are scarce and/or not easily accessible.24
Table 7: Fertilizer Sales of Leading Fertilizer Companies, 2017
2017 Ranking
Company (Headquarters)
2017 Sales (US millions)
Main Fertilizer Products
1. Nutrien Ltd.25 – result of merger of Agrium, Inc. and PotashCorp (Canada)
10,533 pro forma
Potash, nitrogen, phosphate, ammonium sulphate
2. Yara (Norway)26 8,861 Ammonia, nitrates, NPK and specialty fertilizers
3. The Mosaic Company27 (USA)
6,794 (estimate)
Potash, phosphate
4. CF Industries Holdings, Inc.28 (USA)
4,048 Nitrogen fertilizer products, NPK
10
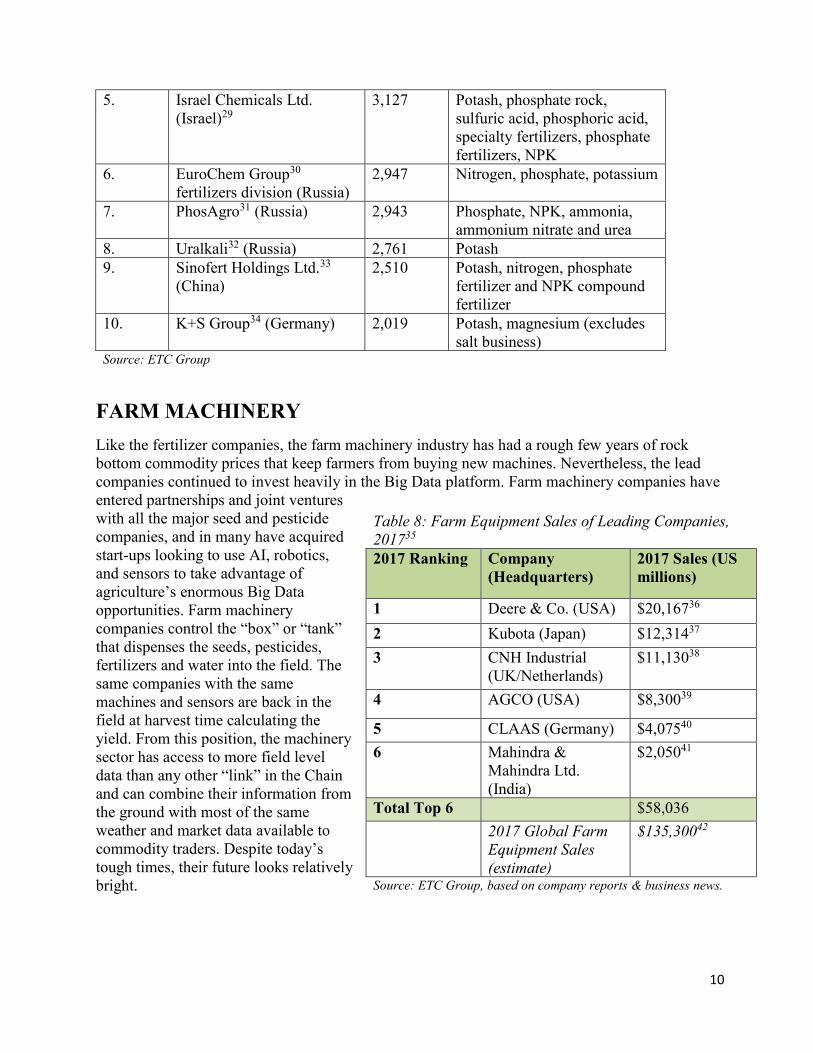
5. Israel Chemicals Ltd. (Israel)29
3,127 Potash, phosphate rock, sulfuric acid, phosphoric acid, specialty fertilizers, phosphate fertilizers, NPK
6. EuroChem Group30 fertilizers division (Russia)
2,947 Nitrogen, phosphate, potassium
7. PhosAgro31 (Russia) 2,943 Phosphate, NPK, ammonia, ammonium nitrate and urea
8. Uralkali32 (Russia) 2,761 Potash 9. Sinofert Holdings Ltd.33
(China) 2,510 Potash, nitrogen, phosphate
fertilizer and NPK compound fertilizer
10. K+S Group34 (Germany) 2,019 Potash, magnesium (excludes salt business)
Source: ETC Group
FARM MACHINERY Like the fertilizer companies, the farm machinery industry has had a rough few years of rock bottom commodity prices that keep farmers from buying new machines. Nevertheless, the lead companies continued to invest heavily in the Big Data platform. Farm machinery companies have entered partnerships and joint ventures with all the major seed and pesticide companies, and in many have acquired start-ups looking to use AI, robotics, and sensors to take advantage of agriculture’s enormous Big Data opportunities. Farm machinery companies control the “box” or “tank” that dispenses the seeds, pesticides, fertilizers and water into the field. The same companies with the same machines and sensors are back in the field at harvest time calculating the yield. From this position, the machinery sector has access to more field level data than any other “link” in the Chain and can combine their information from the ground with most of the same weather and market data available to commodity traders. Despite today’s tough times, their future looks relatively bright.
Table 8: Farm Equipment Sales of Leading Companies, 201735 2017 Ranking Company
(Headquarters) 2017 Sales (US millions)
1 Deere & Co. (USA) $20,16736 2 Kubota (Japan) $12,31437 3 CNH Industrial
(UK/Netherlands) $11,13038
4 AGCO (USA) $8,30039
5 CLAAS (Germany) $4,07540 6 Mahindra &
Mahindra Ltd. (India)
$2,05041
Total Top 6 $58,036 2017 Global Farm
Equipment Sales (estimate)
$135,30042
Source: ETC Group, based on company reports & business news.

11
ANIMAL PHARMACEUTICALS There are fewer, bigger companies vying for the top tier animal pharma firms, all of which are subsidiaries, or spin-offs, of Big Pharma. In 2017, Boehringer Ingelheim completed its acquisition of Merial, becoming the second largest animal health company globally, and #1 ranking Zoetis became the first animal pharma company to exceed $5 billion in annual turnover. In July 2018, fourth-place Eli Lilly announced plans to spin off its Elanco animal-pharma business into a separate, publicly traded company. More changes are coming.
Animal pharma companies are drooling over a Big Data market for animal health (genetics, biodevices, diagnostics and data analytics) that is valued at $150 billion today according to market leader Zoetis,43 but is expected to double by 2030.44
Given ongoing mergers among the largest firms in the animal pharma sector, why are we seeing a decrease in market share held by the largest 4-firms and 8-firms between 2014 and 2017? Although ETC Group obtained the world market figures from the same industry analysts (Animal Pharm), the market figure for 2014 did not include the sale of diagnostic products. The 2017 figure includes diagnostics, and thus reflects a larger world market. We believe the decrease in concentration among the largest firms does not reflect reality on the ground.
Table 10: Animal Pharma Sales of the Leading Companies, 2017
2017 Ranking
Company (Headquarters)
2017 Sales (US millions)
1 Zoetis 5,300 2 Boehringer Ingelheim
Animal Health 4,75045
3 Merck/MSD 3,900 4 Eli Lilly (Elanco) 3,086 5 IDEXX Laboratories 1,969 6 Bayer Animal Health 1,70246 7 Ceva Santé Animale 1,19147 8 Virbrac S.A. 93448 Top 8 Companies 22,832 2017 Global Animal
Pharma Sales 35,000
Source: ETC Group
Table 9: Animal Pharma Market concentration trendline, 1994-2017
Year 4-firm concentration ratio (%)
8-firm concentration ratio (%)
1994 32.4 57.4
2000 41.8 67.4
2009 50.6 72.0
2014 56.0 78.2
2017 48.6 65.2
Source: ETC Group
12
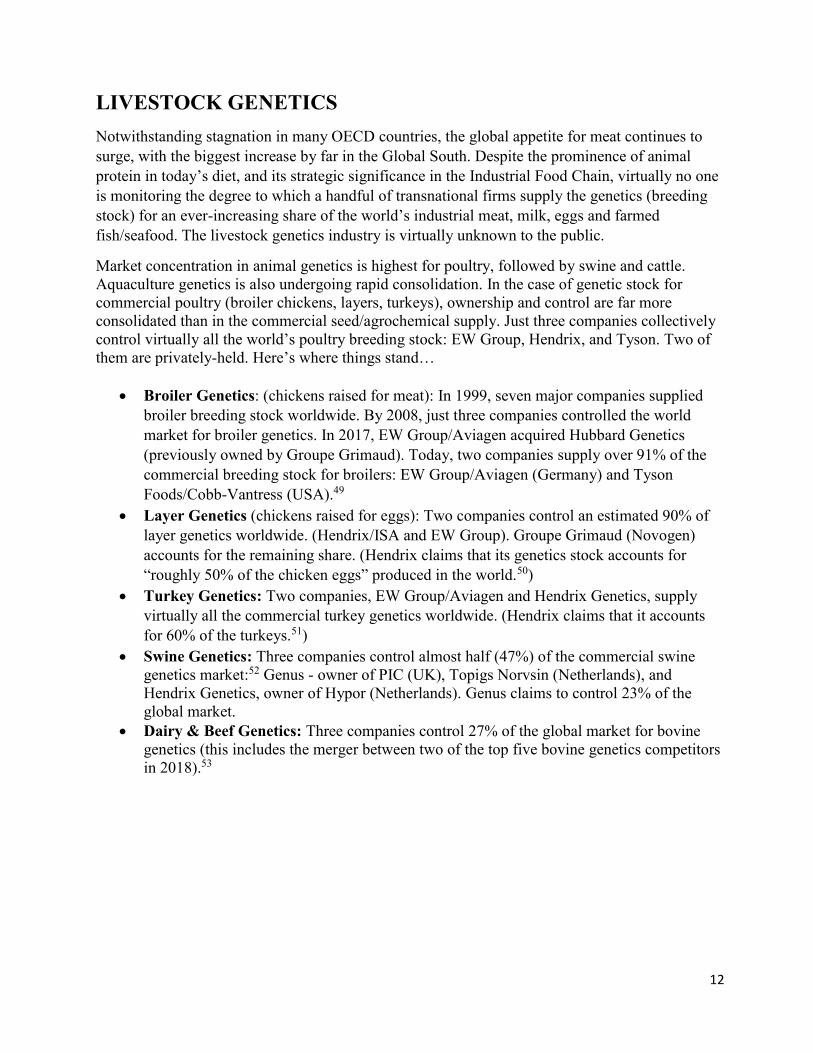
LIVESTOCK GENETICS Notwithstanding stagnation in many OECD countries, the global appetite for meat continues to surge, with the biggest increase by far in the Global South. Despite the prominence of animal protein in today’s diet, and its strategic significance in the Industrial Food Chain, virtually no one is monitoring the degree to which a handful of transnational firms supply the genetics (breeding stock) for an ever-increasing share of the world’s industrial meat, milk, eggs and farmed fish/seafood. The livestock genetics industry is virtually unknown to the public.
Market concentration in animal genetics is highest for poultry, followed by swine and cattle. Aquaculture genetics is also undergoing rapid consolidation. In the case of genetic stock for commercial poultry (broiler chickens, layers, turkeys), ownership and control are far more consolidated than in the commercial seed/agrochemical supply. Just three companies collectively control virtually all the world’s poultry breeding stock: EW Group, Hendrix, and Tyson. Two of them are privately-held. Here’s where things stand…
• Broiler Genetics: (chickens raised for meat): In 1999, seven major companies supplied broiler breeding stock worldwide. By 2008, just three companies controlled the world market for broiler genetics. In 2017, EW Group/Aviagen acquired Hubbard Genetics (previously owned by Groupe Grimaud). Today, two companies supply over 91% of the commercial breeding stock for broilers: EW Group/Aviagen (Germany) and Tyson Foods/Cobb-Vantress (USA).49
• Layer Genetics (chickens raised for eggs): Two companies control an estimated 90% of layer genetics worldwide. (Hendrix/ISA and EW Group). Groupe Grimaud (Novogen) accounts for the remaining share. (Hendrix claims that its genetics stock accounts for “roughly 50% of the chicken eggs” produced in the world.50)
• Turkey Genetics: Two companies, EW Group/Aviagen and Hendrix Genetics, supply virtually all the commercial turkey genetics worldwide. (Hendrix claims that it accounts for 60% of the turkeys.51)
• Swine Genetics: Three companies control almost half (47%) of the commercial swine genetics market:52 Genus - owner of PIC (UK), Topigs Norvsin (Netherlands), and Hendrix Genetics, owner of Hypor (Netherlands). Genus claims to control 23% of the global market.
• Dairy & Beef Genetics: Three companies control 27% of the global market for bovine genetics (this includes the merger between two of the top five bovine genetics competitors in 2018).53
13
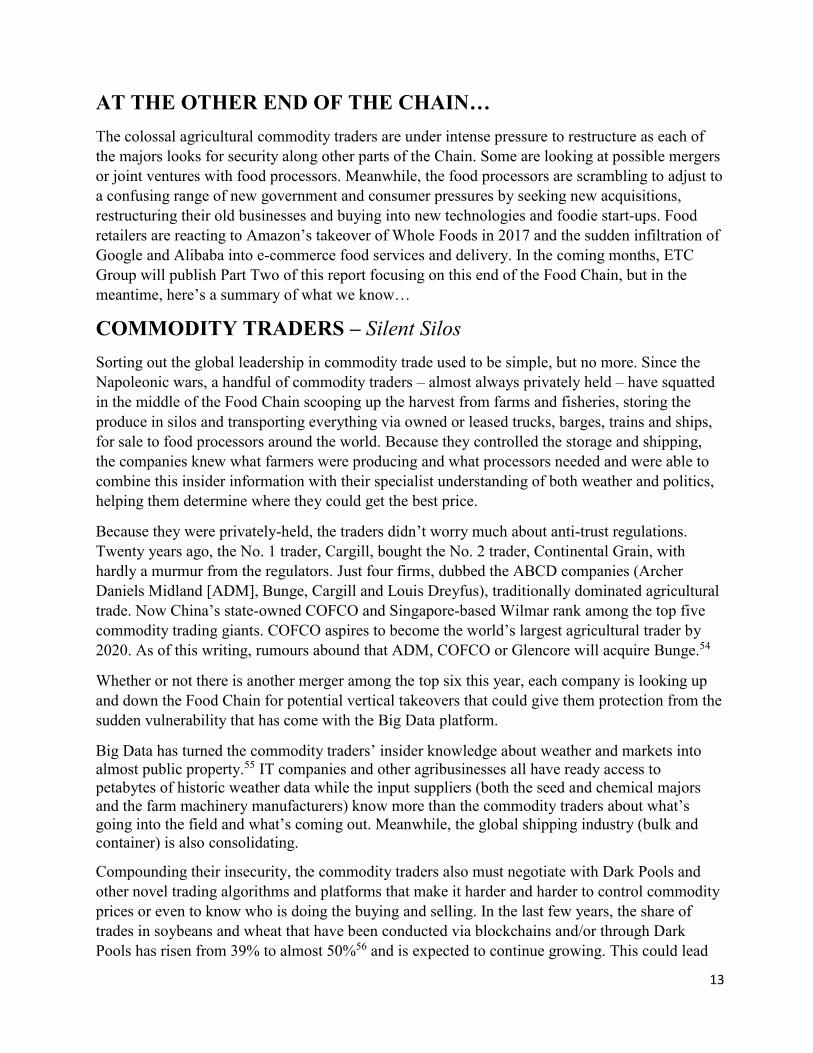
AT THE OTHER END OF THE CHAIN… The colossal agricultural commodity traders are under intense pressure to restructure as each of the majors looks for security along other parts of the Chain. Some are looking at possible mergers or joint ventures with food processors. Meanwhile, the food processors are scrambling to adjust to a confusing range of new government and consumer pressures by seeking new acquisitions, restructuring their old businesses and buying into new technologies and foodie start-ups. Food retailers are reacting to Amazon’s takeover of Whole Foods in 2017 and the sudden infiltration of Google and Alibaba into e-commerce food services and delivery. In the coming months, ETC Group will publish Part Two of this report focusing on this end of the Food Chain, but in the meantime, here’s a summary of what we know…
COMMODITY TRADERS – Silent Silos Sorting out the global leadership in commodity trade used to be simple, but no more. Since the Napoleonic wars, a handful of commodity traders – almost always privately held – have squatted in the middle of the Food Chain scooping up the harvest from farms and fisheries, storing the produce in silos and transporting everything via owned or leased trucks, barges, trains and ships, for sale to food processors around the world. Because they controlled the storage and shipping, the companies knew what farmers were producing and what processors needed and were able to combine this insider information with their specialist understanding of both weather and politics, helping them determine where they could get the best price.
Because they were privately-held, the traders didn’t worry much about anti-trust regulations. Twenty years ago, the No. 1 trader, Cargill, bought the No. 2 trader, Continental Grain, with hardly a murmur from the regulators. Just four firms, dubbed the ABCD companies (Archer Daniels Midland [ADM], Bunge, Cargill and Louis Dreyfus), traditionally dominated agricultural trade. Now China’s state-owned COFCO and Singapore-based Wilmar rank among the top five commodity trading giants. COFCO aspires to become the world’s largest agricultural trader by 2020. As of this writing, rumours abound that ADM, COFCO or Glencore will acquire Bunge.54
Whether or not there is another merger among the top six this year, each company is looking up and down the Food Chain for potential vertical takeovers that could give them protection from the sudden vulnerability that has come with the Big Data platform.
Big Data has turned the commodity traders’ insider knowledge about weather and markets into almost public property.55 IT companies and other agribusinesses all have ready access to petabytes of historic weather data while the input suppliers (both the seed and chemical majors and the farm machinery manufacturers) know more than the commodity traders about what’s going into the field and what’s coming out. Meanwhile, the global shipping industry (bulk and container) is also consolidating.
Compounding their insecurity, the commodity traders also must negotiate with Dark Pools and other novel trading algorithms and platforms that make it harder and harder to control commodity prices or even to know who is doing the buying and selling. In the last few years, the share of trades in soybeans and wheat that have been conducted via blockchains and/or through Dark Pools has risen from 39% to almost 50%56 and is expected to continue growing. This could lead

14
to a meltdown at the middle link in the Food Chain. For example, BayWa, a German agricultural trader, has linked up with a US “quant” digital specialist and Quantumrock Capital (Germany) to figure out what’s happening.57 While the small “Ma and Pa” traders accuse the ABCDs of gaming the market, the big four see blockchains and Dark Pools as a way for processors and retailers to exercise greater control over their supply chain by going directly to producers or at least marginalizing the old-time traders. They’re right to worry. Nestlé is working directly with coffee growers in Mexico and Central America and cocoa producers in West Africa,58 and Walmart is experimenting with blockchains to source at least 30 commodities directly from Latin American farmers.59 If the future isn’t BlackRock and Blackstone it could be Dark Pools
FOOD PROCESSORS – Cold Sellers Life, too, is complicated for the world’s giant food and beverage processors. Companies like Nestlé, Unilever, Coke, Pepsi, JBS, Tysons and Mondelez have a lot of technology and customer data – they’re just short on customers. Caught flat-footed by the organic and fresh food trend among millennials and the growing government and consumer aversion to sugar, salt and fats, the processors are losing ground to Silicon Valley start-up foodies as well as community-based farmers’ markets. Fresh vegetables are “in,” and highly-processed foods – especially soft drinks and snacks – are “out.” Since ETC Group’s last report, major US food processors have lost billions to fresh produce or new (and presumably healthier) food ideas. There are no giant new players, but a lot of start-ups are capturing niche markets.
The trendline is significant: the organic food sector in the USA is up about 10%, the market for plant-based “dairy” products is up more than 61% since 2012 and consumer demand for actual dairy has dipped 15% over the same period.60 In tandem, US purchases of less processed foods has increased 15% since 2014.61 The bottom line for US processors is that they have lost $15 billion to smaller companies in the last five years.62 Most observers think the losses are even greater in Europe. The demand for “fake meat” (also plant-based), currently less than 1% of the market, nevertheless climbed 24.5% last year.63 In the UK, the number of vegetarians is growing significantly, and the ranks of the “flexitarians” – those edging toward vegetarianism – is at 22 million people and counting.64
These figures make for jittery processors. Tysons – one of the world’s largest meat processors – has bought into Beyond Meat, another plant-based fake meat start-up, while Nestlé, Unilever, Pepsi, Coke, General Mills, Kellogg, Hershey’s and ConAgra have gone on buying sprees, picking up niche market start-ups with a reputation for nutritional quality. AB InBev, the world’s largest brewer with 30% of global beer sales, is snapping up craft beers from Argentina to Belgium.65
The big processors may be losing sleep over losing market share in OECD countries, but they continue to gain ground in the Global South where the old brands are still popular, and obesity is booming. Even in the North, the processors are learning new tricks. Championing the fight against obesity, processors have nobly cut the size of their soft drink cans and pumped more air into chocolate bars without cutting prices. Madison Avenue has captured “niche” and “craft” the same way they captured “wholesome” and “natural” decades ago. For example, of the 10 largest-selling beers in the USA (by volume), six are so-called “craft,” some with annual sales in the
15
billions.66 Among older customers and/or those who can’t afford fresh produce, the sale of ultra-processed foods is climbing. In the UK for example, more than half of all foods purchased rank in the ultra-processed category and Germany and Ireland are close behind.67
Shifting consumer preferences and government regulators are not the food processors only concerns. Big Data is changing the DNA of dinner. Processors have long understood that their primary task is to make consumers feel full and relatively content. To get there, producers must provide bulk calories, good mouth feel, and a variety of flavours. Historically, the bulk calories are sourced from rice, maize, wheat, potatoes, soybeans, and palm oil. The mouth feel can be manufactured. The flavours are either embodied in – or extracted from – about 250 other plant and livestock species. All these ingredients are sourced from diverse climates and countries under unreliable political and climatic conditions, meaning uncertain prices and unpredictable qualities. This is why, over the last dozen years, the processors and start-ups have been experimenting with synthetic biology and, most recently, using gene editing to adjust the DNA of our food supply. The “Holy Grail” of the food processors is to remove the fluctuations of the marketplace – including geography, climate and politics – with the certainty of factory-produced, scientifically-controlled food manufacturing. Major agribusinesses from Coke to Cargill are hoping to produce flavours and fragrances in vats much in the way that brewers make beer, using bacteria and yeast to grow so-called “natural” foods they can totally control.68
FOOD RETAILERS – Who’s Mining the Store? The retail “link” in the Chain has never had the same kind of concentration experienced by the other links. Even the bulk commodity-based fertilizer industry has managed to cobble cartels out of its geographically diverse potash and phosphate mines and nitrogen stocks. This is not so easily done for retailers who have lived and died on their proximity to consumers. Since the 1960s, retailers have succeeded in creating sub-national and even national oligopolies and duopolies, but few companies have done well crossing borders. Two companies that have tried – Walmart and Carrefour – have seen mixed results. Walmart’s ventures into the UK and continental Europe have not done well and the company appears to be retreating. Likewise, its ventures into Brazil have had poor results. Despite this, Walmart, in 2018, is suddenly moving energetically into India and looking for other opportunities throughout Asia. Its closest rival, France’s Carrefour, is restructuring and has just built an alliance with the UK’s largest food retailer, Tesco, committing the two companies to jointly strongarm suppliers and force down the already-meagre returns to farmers.
The need to have brick-and-mortar stores everywhere has meant that even the biggest retailers can’t have the same kind of market domination as global input and trading companies. At the same time, however, that which has kept them small has also kept them independent… until Big Data came in to mine the store. In 2017, IT began moving into food retail. Consumers, it goes without saying, “use” food every day – and buy it every other day. While Amazon was selling customers perhaps a book a month and a couple of products every week, acclimatizing their clientele to purchasing food online – and having it delivered – brings Amazon in almost daily contact with consumers who may get into the habit of going online to Amazon to buy more of everything else from drugs to dresses. Food doesn’t even need to make companies like Amazon money if customers fill their carts with other “stuff.”
16
The Big Data platform’s ability to mine petabytes of production and consumer information is, for the first time, making global food retail a possibility. The outcome may well be (initially) lower prices for consumers in industrialized countries and for the middle class in China and the Global South,69 but the implications for farmers and fishers around the world – at least those who participate to some degree in the Industrial Food Chain – is immediately alarming. The “trickle down” impact on land-use, local markets and biodiversity is also alarming. Peasants continue to feed 70% of the world. It is not what happens to Amazon or Walmart that matters – it’s what happens to food security.
CONCLUSIONS – Time for a Long Food Movement Market economists are fans of “creative disruption” – those periods along economic cycles where new factors portend enormous and uncertain change. Usually, the transformative force comes from new technologies. The level of disruption has never been higher than today – but the forces of change have also never been wider. Consider…
Technological disruptions:
• The ability of agribusiness to amass and manipulate vast quantities of data fundamentally alters the significance of “scale” – the transaction costs of working with short production lines or small producers in diverse markets is no longer a determining factor (i.e. if “small isn’t beautiful,” it’s at least easy.)
• Digital DNA (theoretically) may give agribusiness input companies and/or processors mastery over all the biological products and processes that feed us.
Marketplace disruptions: There is growing general concern about health, environment, and fair trade that is making it difficult for agribusiness to control public policy and manipulate consumer demand. This plays out in at least two ways…
• High-value consumers and public policies (North and South) are moving toward less-processed, healthier, increasingly organic, and diverse foods70;
• For a variety of reasons, dietitians and consumers are shifting away from meat and dairy products.
Simultaneously, governments are alarmed by the potential impact of climate change on food production and are still galvanized by the demands of growing population for more meat and dairy products, leading them to depend on the biggest companies to provide the latest technologies…
• Anti-trust regulators are accepting both vertical and horizontal mergers (because they don’t have the tools or policies to stop them) and are giving corporations the global scale and financial clout required to introduce new technologies;
• Meaning that Big Data could solidify the input end of the Food Chain, merging seeds, pesticides, fertilizers, and farm machinery into a duopoly dominated by the machinery companies;
• The Commodity traders may be sidelined or absorbed by the processors and retailers;

17
• And the entire Industrial Food Chain and each of its remaining links may ultimately be determined by the new financial actors such as BlackRock and Blackstone.
Disruption, however, can move in any direction. Each link in the Chain is fighting its internal battles among the major players, and each of these is concerned about the machinations in other links. Agribusiness can’t be certain about public policy directions or consumer trends, and no one can be certain that the new technologies will function even adequately. In this environment of uncertainty, civil society has some encouraging possibilities…
• Peasant producers, led by La Via Campesina and other social movements including the International Union of Food and Agricultural Workers have become alarmed by the level of concentration along the Food Chain – especially in the input sector where they don’t trust seed, pesticide or fertilizer companies. Both academics and anti-trust regulators are also alarmed that the level of concentration is discouraging innovation and destroying the marketplace, and some at least are looking for stronger regulatory controls.
• The public also generally distrusts the old-line food processors and retailers and recognizes that the health damages and waste in the system has been caused by these companies.
• Some among the public and policymakers are coming to recognize that alternative food strategies are possible, and that agroecology can feed the world better than the Industrial Food Chain.
As we stated at the beginning of this report, great change means great vulnerability. Civil society has never had a better opportunity to move the world toward Food Sovereignty.
In the immediate and long-term, the critical battle is at the national and regional level around the world. Amazingly, most governments don’t have National Food Policies. This policy loophole is being filled by civil society organizations outflanking the various links in the Food Chain to demand the formation of national policies. Governments are finding it hard to say no. If strong coalitions of producers and consumers can work together, the creation of National Food Policies and the formation of Food Policy Councils could provide a profound institutional change that will move us in a much better direction.
Within this wider movement, the strong push for agroecology as the food production model is attracting, once again, both producers and consumers. Although every link in the Industrial Food Chain is either attacking or trying to co-opt agroecology, the trendline is upward and growing stronger.
Anti-trust or competition policies are also determined nationally. There is no WTO rule covering M&As. Every country has the sovereign right to accept or reject every merger that has consequences within its borders. Since no politician wants to be a defender of giant corporations, public pressure on policymakers to strengthen competition policies may find less resistance than expected. National policies need to change now before the next wave of M&As can gather strength.
18
Internationally, there are some immediate steps in the months ahead that could make a difference…
In April 2018, the UN Food and Agriculture Organization (FAO) held its second Agroecology Conference in Rome. By everybody’s definition – and to the FAO’s astonishment – the meeting was a success. The challenge now is for FAO to provide the staff and financial resources to build on its success and translate the words into action locally, regionally and nationally. The report of the Agroecology Conference goes to the FAO’s biennial Committee on Agriculture when it meets in Rome October 1–5 this year. Agribusiness and some OECD countries will do their best to marginalize the conference and starve it of funds and personnel. Civil society must act immediately to prevent this and to determine a very clear way forward.
Importantly, agroecology is also an issue being addressed by the High-Level Panel of Experts to the UN Committee on World Food Security (CFS) that is also meeting from October 15–19 this year. Not only is the CFS considering agroecology, it also has an ongoing concern about corporate concentration in the food system. For the last two years, the CFS Chairs and most governments have fought to place the issue of concentration on the formal agenda. The USA, Canada, Australia and France have used procedural rules to block the debate. Civil society and concerned governments should make sure the CFS discusses the implications of the recent mega-mergers – and future mergers – this October as they also discuss agroecology.
Then, from 17-29 November 2018, the UN Convention on Biological Diversity (CBD) will hold its biennial conference in Sharm El-Sheikh, Egypt. One of the hottest topics at the CBD for some years now has been synthetic biology and gene editing. The issue of powerful new biological technologies will be up front in the debate in Egypt and civil society will be there to work with governments to share information on the implications of the new technologies.
Beyond these immediate steps, civil society organizations in several countries are talking with UN bodies – especially the United Nations Conference on Trade and Development (UNCTAD) and the new UN (Science, Technology and Innovation) (STI) Forum in New York – about the negotiation of a UN Treaty on Competition, and/or a UN Treaty on Technology Assessment. There is a serious possibility that this could gain traction at the UN in the next couple of years as the world witnesses more vertical and horizontal mergers and reels from the tentacles of Big Data platforms across industries and sectors.
For further information on these international initiatives please see Too Big to Feed by IPES – Food, and the forthcoming Blocking the Chain report published by the Rosa Luxembourg Foundation, ETC Group et. al.71
19
ENDNOTES
1 The Gutenburg press was the first movable printing press, developed in the 15th century, which revolutionized the spread of knowledge and information.
2 See: https://www.agricentre.basf.co.uk/agroportal/uk/en/services_1/mobile_tools/weed_id_app_3/weed_id_app.html
3 Bay McLaughlin, “This Week in China Tech: Alibaba Brings AI to Pig Farming and Retail Tech on the Rise,” Forbes, 14 February 2018, https://www.forbes.com/sites/baymclaughlin/2018/02/14/this-week-in-china-tech-alibaba-brings-ai-to-pig-farming-and-retail-tech-on-the-rise/#de9c14135e1e
Liza Lin, “Google invests $550 million in Chinese online shopping site JD.com,” The Wall Street Journal, 18 June 2018, https://www.wsj.com/articles/google-invests-550-million-in-chinese-online-shopping-site-jd-com-1529310027
4 Confidential personal communication to Pat Mooney, 2018. 5 Lydia Mulvany, Susan Decker, Christopher Yasiejko, “Deere Legal Battle Highlights Race for $240 Billion Farm
Tech Market,” Bloomberg, 20 June 2018. https://www.bloomberg.com/news/articles/2018-06-20/deere-suit-sheds-light-on-race-for-240-billion-farm-tech-market
6 Kim S. Nash, “Business interest in blockchain picks up while cryptocurrency causes conniptions,” The Wall Street Journal, 6 February 2018, https://blogs.wsj.com/cio/2018/02/06/business-interest-in-blockchain-picks-up-while-cryptocurrency-causes-conniptions/
7 Molly Jane Zuckerman, “Walmart, IBM Blockchain Initiative Aims to Track Global Food Supply Chain,” Cointelegraph, 28 June 2018, https://cointelegraph.com/news/walmart-ibm-blockchain-initiative-aims-to-track-global-food-supply-chain
8 For example, see: Katia Moskvitch, “Another week, another bitcoin hack, another huge price drop,” Wired, 12 June 2018, https://www.wired.co.uk/article/coinrail-hacked-bitcoin-exchange-price
See also: Gideon Lewis Kraus, “Inside the Crypto World’s Biggest Scandal,” Wired, 19 June 2018. https://www.wired.com/story/tezos-blockchain-love-story-horror-story/
9 Christopher Munro, “One Bitcoin Transaction Consumes as Much Energy as Your House Uses in a Week,” VICE MotherBoard, 1 November 2017, https://motherboard.vice.com/en_us/article/ywbbpm/bitcoin-mining-electricity-consumption-ethereum-energy-climate-change
10 Chris Johnston, “Amazon opens a supermarket with no checkouts,” BBC News, 22 January 2018, https://www.bbc.com/news/business-42769096
11 Jennifer Clapp, “Bigger is not always better: drivers and implications of the recent agribusiness mega-mergers,” Global Food Politics Group, University of Waterloo, Ontario, March 2017, https://uwaterloo.ca/global-food-politics-group/sites/ca.global-food-politics-group/files/uploads/files/bigger_is_not_always_better_-_with_metadata_march_2018_for_posting.pdf
12 Lucy Hornby and Sherry Feiju, “ChemChina executive reshuffle paves way for merger,” Financial Times, 1 July 2018: https://www.ft.com/content/3e464e9a-7cc7-11e8-bc55-50daf11b720d
13 Personal communication from a knowledgeable industry source, 17 June 2018. 14 Figures come from AGROW/INFORMA. Monsanto and Bayer’s combined 2017 sales = $12,682 billion (pro
forma). The actual market share is unknown because some seed assets are still being sold. 15 Figure comes from AGROW/INFORMA. Pro forma results as if DuPont and Dow Chemical merged on 1 January
2016. 16 Figure comes from AGROW/INFORMA. 17 Reported in Euros. €1,715 converted to USD using average annual exchange rate of 0.931. (1,715 / 0.931 = $1,842
million.) 18 Personal email communication with Wolf-Gebhard von der Wense, Head of Investor Relations at KWS, 1 June
2018. Reported in Euros. Complete sales of KWS in 2016/2017 were €1,394.0 million, although this does not include
AgReliant Genetics (joint venture with Vilmorin, and third-largest corn seed company in US). Converted to USD using average annual exchange rate of 0.931. (1,394 / 0.931 = $1,497 million.)
19 DLF Limited, DLF 2016/17: We turn science into growth, p. 6, http://ipaper.ipapercms.dk/DLF/DLFCOM/Corporate/Annualreport/english-2016-17/?page=6
Reported in Danish Kroner. Net revenues (including turf grass) reported at 3,527 million DKK. Converted to USD using 2017 average annual exchange rate of 6.864. (3,527 / 6.864 = $513.8 million.)

20
20 ADAMA Agricultural Solutions Ltd. and Hubei Sanonda Co. Ltd. combined and became the first global crop
protection company to be publicly traded on the Chinese stock market. ADAMA is the generic business of state-owned ChemChina. https://www.adama.com/en/media/press-releases/2018-landing-page/q4-fy-2017-financial-results
21 FAO Agroecology Conference side event, April 2018. 22 Rod Nickel, Diane Bartz, “Potash Corp, Agrium talk merger; competition scrutiny expected,” Reuters, 30 August
201,: https://www.reuters.com/article/us-agrium-m-a-potashcorp-idUSKCN1151UT Jeff Daniels, “Tough times in the heartland as some farmers hit by losses weigh exiting the business,” CNBC, 27
December 2017, https://www.cnbc.com/2017/12/27/some-crop-growers-hit-by-losses-are-weighing-exits-from-agriculture.html.
23 The value of the global market was calculated at a Compound Annual Growth Rate of 2.1% from 2013 to 2017. In October 2014, MarketLine reported global fertilizer revenues of $175,244.2 million for 2013: https://store.marketline.com/report/ohip0520--global-fertilizer/ .
24 Israel Chemicals Limited, Annual Report for the Period Ended December 31, 2017, p. 47, http://iclgroupv2.s3.amazonaws.com/corporate/wp-content/uploads/sites/1004/2018/03/ICL-2017-Annual-Report-20-F.pdf.
25 Excludes Agrium’s seed, crop protection and services revenue and PotashCorp’s non-fertilizer phosphate revenue. Agrium Inc, 2017 Annual Report, 20 February 2018, p. 6, https://www.nutrien.com/sites/default/files/uploads/2018-
02/2017%20AGRIUM%20Annual%20Report%20FINAL.pdf Potash Corp, Management’s Discussion and Analysis of Operations and Financial Conditions for the Fiscal Year
Ended December 31, 2017, 2017, pp. 20-40, https://www.nutrien.com/sites/default/files/uploads/2018-02/2017%20PotashCorp%20MD%26A.pdf
26 Yara, Change of presentation currency from NOK to USD: Re-presentation of comparative periods, 2017, p. 10, https://www.yara.com/siteassets/investors/057-reports-and-presentations/other/2018/financial_statements_in_usd_2017.pdf/
27 Excludes sales of animal feed ingredients and industrial potash. Mosaic, 2017 Annual Report, 2018, mosaicco.com/2017AnnualReport
28 A small percentage of revenue in two reporting segments (AN, Other) come from non-fertilizer related sales. Those two segments accounted for $816 million in revenue in 2017. ETC Group estimates that 10% ($82 million) of sales in those segments comes from non-fertilizer related product. Total revenue in 2017 was $4,130 million.
CF, More Ways to Win: 2017 Annual Report, 2018, p. 28, https://www.snl.com/Cache/1001234503.PDF?O=PDF&T=&Y=&D=&FID=1001234503&iid=4533245
29 Israel Chemicals Limited, Annual Report for the Period Ended December 31, 2017, p. 59, http://iclgroupv2.s3.amazonaws.com/corporate/wp-content/uploads/sites/1004/2018/03/ICL-2017-Annual-Report-20-F.pdf
30 Eurochem Group, Consolidated Financial Statements and Independent Auditor’s Report, 31 December 2017, p. 26, http://www.eurochemgroup.com/wp-content/uploads/2016/02/EuroChem-Group-AG-Consolidated-Financial-Statements-31-December-2017.pdf
31 PhosAgro’s 2017 revenue was $3,108 million. See: PhosAgro, “Key Financial Figures,” https://www.phosagro.com/investors/indicators/
PhosAgro produces some MCP (monocalcium phosphate) for animal feed. In 2015, 5.3% of Phosagro’s total revenue came from MCP, according to p. 90 of this report: https://www.phosagro.com/upload/docs/2017/Apple%202017%20-%20Final%20Prospectus.pdf,. We therefore
reduced the total 2017 revenue by 5.3%. (2017 average exchange rate per IRS: 1 RMB → $7.030.) 32 Uralkali, “Uralkali Announces IFRS 2017 Financial Results,” 3 April 2018,
https://www.uralkali.com/press_center/press_releases/item40099/ 33 Sinofert Holdings Limited, Annual Results Announcement For the Year Ended 31 December 2017, 28 March
2018, p. 25, http://www.sinofert.com/Portals/54/Uploads/Files/2018/3-28/636578370385818662.pdf Reported in RMB. Converted to USD using 2017 average exchange rate of 7.030 (17,643 / 7.030 = $2,510 million). 34 K+S, K+S Q4/17 Facts and Figures, 15 March 2018, p. 1, http://www.k-plus-s.com/en/pdf/2017/q4_facts-and-
figures.pdf. Revenue from Potash and Magnesium products unit + complementary activities = €1863.4. Converted to USD using
2017 average exchange rate of 0.923 (1863.4/0.923 = $2,019 million). 35 Neither the lead companies nor the analysts that follow them would share estimates for the value of the 2017 world market for farm machinery. ETC was, therefore, obliged to make its own conservative, and realistic estimates. 36 Deere & Co., Deere & Company 2017 Annual Report, 2018. (Does not include construction and forestry revenues.)
21
37 Kubota, “Management and Business Report: Financial Highlights,” 2017,
https://www.kubota.com/report/pdf/digest2018_07.pdf. Reported in Yen. Total Farm & Industrial Machinery revenue 2017 was 1,436.6 billion yen. Converted to USD based
on average 2017 exchange rate of 116.667. (1,436.6 billion yen/116.667 = $12,314 million.) 38 Agricultural equipment only. CNH Industrial, Annual Report at December 31, 2017, 2018, p. 31, http://www.cnhindustrial.com/en-
us/investor_relations/shareholder_meetings/shareholder_documents/2018/CNHI_Annual_report_2017.pdf 39 AGCO reported net sales of $8.3 billion in 2017, an increase of 12.1% over 2016. AGCO, 2017 Annual Report, 2018, https://ar2017.agcocorp.com/assets/pdfs/AGCO_2017_Annual-Report.pdf 40 CLAAS Group generated net sales of €3,761 million in FY 2017 (only 19% of the total revenues were outside of
Europe). Converted to USD using average annual exchange rate of 0.923 (3,761 / 0.923 = $4,074.7 million). 41 Mahindra & Mahindra Limited, Annual Report 2016-17, 2018, p. 217,
http://www.mahindra.com/resources/investor-reports/FY18/Announcements/M-M-Annual-Report-2016-17.pdf Mahindra Farm Equipment sector 2017 revenues were reported at 13,901 rupees crores. Converted to USD using
2017 annual conversion rate of 67.809. (13,901/67.809 = 205 x 10 million = $2,050 million). 42 Our estimate of farm equipment market worldwide sales in 2017: According to estimates of VDMA Agriculture
Machinery Association, the global agriculture and farm equipment market was valued at $137 billion in 2015 declined by 3% in 2016. In 2014, the market was $114 billion; in 2015, $137 billon; in 2016, declined 3% = $132.9 billion. For 2017, “the market is anticipated to expand at a compound annual growth rate of 1.8% over the forecast period i.e. 2016-2024.” 2017 estimate (based on 1.8% increase over 2016) = $135.29 billion.
Source: AB Newswire, “Agricultural tractors market 2018 – global industry analysis, size, share, growth, trends and forecast 2024,” 14 June 2018, http://www.abnewswire.com/pressreleases/agricultural-tractors-market-2018-global-industry-analysis-size-share-growth-trends-and-forecast-2024_228620.html
43 Zoetis, 2017 Annual Report, 2018, http://investor.zoetis.com/sites/zoetis.investorhq.businesswire.com/files/doc_library/file/Zoetis_2017_10-KWrap.pdf
44 Hubertus von Baumach, “Slide 28: Animal Health: Using Collective Power,” Boehringer Ingelheim Annual Press Conference, 25 April 2018, https://www.boehringer-ingelheim.com/sites/default/files/APC/APC_2018/Speeches_APC_2018.pdf
45 Boehringer reported 2017 revenues of €3,901. According to Animal Pharm analyst, Joseph Harvey, the figure is US$4.75 billion. See: Joseph Harvey, “Boehringer underlines ascent to the top with more-than-doubled annual sales,” Animal Pharm, 25 April 2018, https://animalpharm.agribusinessintelligence.informa.com/AP013998/Boehringer-underlines-ascent-to-the-top-with-morethandoubled-annual-sales
46 Bayer Animal Health reported 2017 revenues of €1,571 million. Converted to USD using 2017 average annual exchange rate of 0.923 = $1,702 million.
Bayer, “Animal Health,” Annual Report 2017, Augmented Version, http://www.annualreport2017.bayer.com/management-report-annexes/report-on-economic-position/business-development-by-segment/animal-health.html
47 Ceva Sante reported 2017 revenues of €1.1 billion. Converted to USD using 2017 average annual exchange rate of 0.923 = $1,191 billion.
Ceva, “Ceva consolidates its position as the leading French player in the global animal health market,” Ceva Press Release, 8 February 2018, https://www.ceva.com/en/News-Media/Press-releases/Ceva-consolidates-its-position-as-the-leading-French-player-in-the-global-animal-health-market
48 Virbrac reported 2017 revenues of €862 million. Based on average annual conversion rate 0.923 = $934 million. Virbac, “Management Report,” Annual Report 2017, https://corporate.virbac.com/files/live/sites/corp-
public/files/contributed/ra2017/Annual_report_2017.pdf 49 Extrapolated from: Alberto Torres, Ph.D. (Tyson Foods), “Comparatmentalization and its Impact on trade.”
Presentation to Animal Health Emergency Management NIAA: Columbus, OH, 4 April 2017, https://www.animalagriculture.org/resources/Pictures/Torres-Rodriguez,%20Alberto.pdf
50 Karen Dallimore, “The genetic revolution: a look back and what’s next,” Canadian Poultry, 28 December 2017, https://www.canadianpoultrymag.com/research/genetics/the-genetic-revolution-30450
51 Ibid. 52 Genus, “Capital Markets Event,” Company presentation, 20 June 2018, p. 9,
https://www.genusplc.com/media/1474/genus-capital-markets-full-presentation-final.pdf 53 Ibid.
22
54 Arvin Donley, “From the Editor: Big grain traders caught in the middle,” World-Grain.com, 26 June 2018,
https://www.world-grain.com/articles/10506-from-the-editor-big-grain-traders-caught-in-the-middle 55 Emiko Terazono, “Resources traders seek data wizards to combat squeeze on margins,” Financial Times, 12 July
2018, http://www.ftchinese.com/story/001078443/en 56 Ibid. 57 Ibid. 58 Jude Webber, " Lab-grown plants to ‘sow wealth’ for poorer coffee producers", Financial Times, 24 September
2017, https://www.ft.com/content/d4cfa114-51ca-11e7-a1f2-db19572361bb 59 Kim S. Nash, “Business Interest in Blockchain Picks Up While Cryptocurrency Causes Conniptions,” The Wall
Street Journal, 6 February 2018, https://blogs.wsj.com/cio/2018/02/06/business-interest-in-blockchain-picks-up-while-cryptocurrency-causes-conniptions/
60 Bee Wilson, "Soy, almond, pea or oat? The reinvention of milk," The Wall Street Journal, 11 May 2018, https://www.wsj.com/articles/soy-almond-pea-or-oat-the-reinvention-of-milk-1526051201
61 Annie Gasparro and Anthony Shevlin, "Flavor Giant IFF Goes Natural in $6.4 Billion Deal," The Wall Street Journal, 7 May 2018, https://www.wsj.com/articles/flavors-giant-adds-israeli-spice-in-6-4-billion-deal-1525696525
62 Ibid. 63 Jacob Bunge and Heather Haddon, “A Stampede of Meatless Products Overrun Grocery Store Meat Cases,” The
Wall Street Journal, 10 June 2018, https://www.wsj.com/articles/a-stampede-of-meatless-products-overrun-grocery-store-meat-cases-1528653236
64 Rebecca Smithers, “Sainsbury's to sell vegan 'fake meats' next to real thing in trial,” The Guardian, 11 June 2018, https://www.theguardian.com/lifeandstyle/2018/jun/11/sainsburys-to-sell-vegan-fake-meats-next-to-real-thing-in-trial.
65 Scheherazade Daneshkhu, “How millennials’ taste for ‘authenticity’ is disrupting powerful food brands,” Financial Times, 18 June 2018, https://www.ft.com/content/09271178-6f29-11e8-92d3-6c13e5c92914
66 Robert Glennon, “’Craft’ Beer Turns Out to Be a Big Business,” The Wall Street Journal, 1 April 2018, https://www.wsj.com/articles/craft-beer-turns-out-to-be-a-big-business-1522604996
67 Sarah Boseley, “‘Ultra-processed’ products now half of all UK family food purchases,” The Guardian, 2 February 2018, https://www.theguardian.com/science/2018/feb/02/ultra-processed-products-now-half-of-all-uk-family-food-purchases
68 See: African Centre for Biodiversity, ETC Group and Third World Network, “Synthetic Biology and AI-enabled Biosynthesis – the Implications for Biodiversity and Farmer Livelihoods,” 2018, http://www.synbiogovernance.org/synthetic-biology-and-ai-enabled-biosynthesis-the-implications-for-biodiversity-and-farmer-livelihoods/
69 Tom Hancock, “Healthy nutrition trends shake up Chinese consumer market,” Financial Times, 7 August 2018, https://www.ft.com/content/eca4a158-94a5-11e8-b67b-b8205561c3fe 70 See for example: Tom Hancock, “Healthy nutrition trends shake up Chinese consumer market,” Financial Times, 7 August 2018, https://www.ft.com/content/eca4a158-94a5-11e8-b67b-b8205561c3fe 71 IPES-Food, Too Big to Feed: Exploring the impacts of mega-mergers, consolidation and concentration of power in
the agri-food sector, 2017, http://www.ipes-food.org/images/Reports/Concentration_FullReport.pdf The forthcoming “Blocking the Chain” publication will be published at www.etcgroup.org in 2018.