Better STRONGER Together Mr. Mohammad Jehanzeb Khan Director Mr. Hamed Yaqoob Sheikh Director...
50
Better STRONGER Together JANUARY - SEPTEMBER 2017 (Un-audited) QUARTERLY REPORT
Transcript of Better STRONGER Together Mr. Mohammad Jehanzeb Khan Director Mr. Hamed Yaqoob Sheikh Director...

BetterSTRONGERTogether
JANUARY - SEPTEMBER 2017 (Un-audited)
QUARTERLY REPORT

1Third Quarterly Report January - September 2017
Corporate Information 2
Directors’ Review 3
Unconsolidated Condensed Interim Financial Information of The Bank of Punjab 5
Consolidated Condensed Interim Financial Information of The Bank of Punjab and its subsidiary Punjab Modaraba Services (Pvt) Ltd. 27
CONTENTS

2
Board of DirectorsDr. Pervez Tahir ChairmanMr. Naeemuddin Khan President / CEOMr. Mohammad Jehanzeb Khan DirectorMr. Hamed Yaqoob Sheikh DirectorKhawaja Farooq Saeed DirectorMr. Saeed Anwar DirectorDr. Umar Saif DirectorSyed Maratib Ali DirectorMr. Mohammed Afzaal Bhatti DirectorDr. Muhammad Amjad Saqib DirectorMr. Raza Saeed Secretary to the Board
Central Audit Committee (CAC) Khawaja Farooq Saeed ChairmanMr. Mohammed Afzaal Bhatti MemberMr. Saeed Anwar Member
Board Risk Management Committee (BRMC)Syed Maratib Ali ChairmanMr. Saeed Anwar Member
Human Resource & Remuneration Committee (HR&RC)Mr. Mohammad Jehanzeb Khan ChairmanSyed Maratib Ali MemberMr. Mohammed Afzaal Bhatti MemberMr. Naeemuddin Khan Ex-officio Member
Auditors EY Ford Rhodes, Chartered Accountants
Registered OfficeBOP Tower, 10-B, Block-E-II, Main Boulevard, Gulberg-III, Lahore. Telephones: +92 - 042-35783700-10 Fax No. +92 - 042 - 35783975 UAN: 111-200-100
Website www.bop.com.pk
RegistrarM/s. Corplink (Pvt) Limited Wings Arcade, 1-K, Commercial, Model Town, Lahore. Telephones: +92 42 35916714, 35916719, 35839182Fax No. +92 042 35869037
Corporate Information

3Third Quarterly Report January - September 2017
Directors’ ReviewQuarterly Financial Statements – September 30, 2017
On behalf of the Board of Directors, I am pleased to present Un-audited Condensed Interim Financial Statements of The Bank of Punjab for the nine months period ended September 30, 2017.
As per recently issued Monetary Policy Statement of SBP, credit to private sector recorded year-on-year growth of 21.1% on 15th September 2017 as compared to 7.7% on 16th September 2016, reflecting an increase of Rs. 892 billion during the year. Led by historic low interest rates on the one hand and growing construction activity and consumer durables on the other, demand for credit picked up. At the same time, healthy deposit growth has improved supply of loanable funds with the banking sector and market rates remained stable. Accordingly, the Policy Rate has been maintained at 5.75% by SBP.
Going forward, there are anticipations of gain in exports on account of favorable global economic conditions, improvement in domestic energy supplies, and incentives given to exporting industry. Signs of improvement are visible in the exports growth of the first quarter of FY18. However, imports are also expected to rise due to ongoing CPEC related investments and domestic economic activities. This will accelerate economic growth. External account is likely to improve as a result of regulatory duties imposed on luxury imports and non-tariff barriers to food items. Foreign exchange reserve improvement depends on timely realization of official financial inflows along with thoughtful adoption of structural reforms for trade competitiveness in the medium term.
Financial Highlights: Rs. in Million
Profit before taxation 5,283.3Taxation 2,122.7Profit after taxation 3,160.6Earnings per share (Rupees) 1.70
During Jan-Sep 2017, Bank’s Net Interest Margin significantly improved to Rs. 11,026 million as against Rs. 8,905 million for corresponding period last year. Non Mark-up/Interest Income and Non Mark-up/Interest Expenses remained at Rs. 3,744 million and Rs. 7,497 million, respectively. Accordingly, the Bank was able to post a pre-tax profit of Rs. 5,283 million and the Earnings per Share remained at Rs. 1.70. As on September 30, 2017, the Deposits increased to Rs. 505.2 billion as against Rs. 453.2 billion as of December 31, 2016, while Total Assets increased to Rs. 614.4 billion as against Rs. 545.2 billion as on December 31, 2016. Investments and Gross Advances stood at Rs. 228.3 billion and Rs. 333.1 billion, respectively. The Tier-I Equity also improved to Rs. 33.4 billion as against Rs. 24.2 billion as on December 31, 2016.
In order to support the business growth and to further strengthen capital structure of the Bank for complying with Basel-III Capital Requirements, the Board of Directors approved issue of 70% right shares in March 2017, which has been successfully completed in 3rd quarter 2017.
The Bank has been assigned long term entity rating of “AA” by M/s PACRA with short term rating being at the highest rank of “A1+”. Further, the Bank now has a nationwide network of 465 online branches, including 4 sub-branches, and the Bank has planned to further expand its outreach during the year with a branch network of 542 Branches as on December 31, 2017.
The arrangements regarding the relaxations granted by the State Bank of Pakistan from provisioning against certain advances and capital regulatory requirements, based on the LOCs issued by the Government of the Punjab, have been fully explained in Note 1.2 to the Condensed Interim Financial Statements.
I am thankful to our valued clients and shareholders for their continuous support and confidence and assure that the Bank would continue its efforts to accelerate the current growth trends. I wish to extend my gratitude to the Government of the Punjab and the State Bank of Pakistan for their constant support and guidance. I also appreciate the valuable contribution of the Bank’s management and staff in strengthening the financial position of the Bank.
For and on behalf of the Board
Dr. Pervez Tahir Chairman

4

5Third Quarterly Report January - September 2017
Unconsolidated Condensed InterimFinancial Informationfor the period ended September 30, 2017

6
Unconsolidated Condensed Interim Statement of Financial Position As at September 30, 2017
President Director
(Un-audited) (Audited) September 30, December 31, 2017 2016 Note Rupees in ‘000’
ASSETS Cash and balances with treasury banks 33,453,616 35,756,024 Balances with other banks 5,805,268 3,765,867 Lendings to financial institutions 6 14,080,577 11,562,133 Investments - net 7 228,285,769 199,741,990 Advances - net 8 299,339,280 262,067,924 Operating fixed assets 9 7,926,101 7,692,675 Deferred tax assets - net 10 6,872,523 6,480,256 Other assets - net 18,673,115 18,147,262
614,436,249 545,214,131 LIABILITIES Bills payable 3,573,844 4,183,480 Borrowings from financial institutions 11 48,199,981 39,829,134 Deposits and other accounts 12 505,203,575 453,219,740 Sub-ordinated loans 4,499,500 4,500,000 Liabilities against assets subject to finance lease - - Deferred tax liabilities - net - - Other liabilities 16,913,264 15,627,279
578,390,164 517,359,633 NET ASSETS 36,046,085 27,854,498 REPRESENTED BY Share capital 13 26,436,924 15,551,132 Share deposit money 14 - 7,000,000 Discount on issue of shares (263,158) (263,158)Reserves 3,477,831 1,300,673 Unappropriated profit 3,705,776 658,938 33,357,373 24,247,585 Surplus on revaluation of assets - net of tax 15 2,688,712 3,606,913 36,046,085 27,854,498 Contingencies and commitments 16 The annexed notes from 1 to 21 and Annexure - I form an integral part of this unconsolidated condensed interim financial information.

7Third Quarterly Report January - September 2017
President Director
Unconsolidated Condensed Interim Profit and Loss Account (Un-audited)For the Nine Months Ended September 30, 2017
Three Months Nine Months Three Months Nine Months Ended Ended Ended Ended September 30, September 30, September 30, September 30, 2017 2017 2016 2016 Rupees in ‘000’ Mark-up / return / interest earned 8,745,484 24,747,659 7,328,050 21,930,613 Mark-up / return / interest expensed 4,879,530 13,721,468 4,371,674 13,025,201
Net mark-up / return / interest income 3,865,954 11,026,191 2,956,376 8,905,412 Provision / (Reversal of provision) against non-performing advances - net 492,186 1,944,629 (252,609) 883,713 Provision for diminution in the value of investments - net 47,388 45,853 - 97,987 Bad debts written off directly - - - -
539,574 1,990,482 (252,609) 981,700
Net mark-up / return / interest income after provisions 3,326,380 9,035,709 3,208,985 7,923,712 NON MARK-UP / INTEREST INCOME Fee, commission and brokerage income 269,389 839,837 204,762 732,221 Dividend income 17,064 59,816 11,952 42,406 (Loss) / Income from dealing in foreign currencies (3,201) 44,246 9,760 51,060 Gain on sale and redemption of securities - net 116,811 1,301,673 268,422 2,013,748 Unrealized gain / (loss) on revaluation of investments classified as held for trading 2,409 1,470 (11,050) (11,668) Other income 333,824 1,497,396 250,879 1,137,648
Total non-markup / interest income 736,296 3,744,438 734,725 3,965,415
4,062,676 12,780,147 3,943,710 11,889,127 NON MARK-UP / INTEREST EXPENSES Administrative expenses 2,577,989 7,419,007 2,149,135 6,243,236 Provision / (Reversal of provision) against other assets 2,493 35,875 (593) 30,042 Reversal of provision against off balance sheet obligations - - - (453,394) Other charges - 42,003 3,855 33,386
Total non-markup / interest expenses 2,580,482 7,496,885 2,152,397 5,853,270
1,482,194 5,283,262 1,791,313 6,035,857 Extra ordinary / unusual items - - - -
PROFIT BEFORE TAXATION 1,482,194 5,283,262 1,791,313 6,035,857
Taxation - Current 436,034 1,812,691 344,252 712,172 - Prior years - 264,576 - - - Deferred 74,984 45,456 283,476 1,393,183
511,018 2,122,723 627,728 2,105,355
PROFIT AFTER TAXATION 971,176 3,160,539 1,163,585 3,930,502
Earnings per share - basic and diluted (Rupees) - Note 17 0.52 1.70 0.75 2.53 The annexed notes from 1 to 21 and Annexure - I form an integral part of this unconsolidated condensed interim financial information.

8
President Director
Unconsolidated Condensed Interim Statement of Comprehensive Income (Un-audited)For the Nine Months Ended September 30, 2017
Three Months Nine Months Three Months Nine Months Ended Ended Ended Ended September 30, September 30, September 30, September 30, 2017 2017 2016 2016 Rupees in ‘000’ Profit after taxation for the period 971,176 3,160,539 1,163,585 3,930,502 Other comprehensive income not to be reclassified to profit and loss account in subsequent periods: Remeasurement adjustments on employee benefits - net of tax - - - - Comprehensive income transferred to equity 971,176 3,160,539 1,163,585 3,930,502 Components of comprehensive income not reflected in equity: Items to be reclassified to profit and loss in subsequent periods: Surplus on revaluation of investments - net of tax (207,711) (804,987) (310,004) 501,587 Total comprehensive income for the period 763,465 2,355,552 853,581 4,432,089 The annexed notes from 1 to 21 and Annexure - I form an integral part of this unconsolidated condensed interim financial information.

9Third Quarterly Report January - September 2017
Unconsolidated Condensed Interim Cash Flow Statement (Un-audited)For the Nine Months Ended September 30, 2017
Nine Months Ended September 30, September 30, 2017 2016 Rupees in ‘000’
CASH FLOWS FROM OPERATING ACTIVITIES Profit before taxation 5,283,262 6,035,857 Less: Dividend income (59,816) (42,406) 5,223,446 5,993,451 Adjustments for: Depreciation on property and equipment 578,295 507,298 Depreciation on non banking assets acquired in satisfaction of claims 65,315 82,861 Depreciation on ijarah assets under IFAS - 2 237,274 53,332 Amortization on intangible assets 18,604 17,584 Amortization of premium on debt securities 637,018 513,157 Unrealized (gain) / loss on revaluation of investments classified as held for trading (1,470) 11,668 Provision against non-performing loans and advances - net 1,944,629 883,713 Provision for diminution in the value of investments - net 45,853 97,987 Provision for employees compensated absences 20,150 7,003 Provision for gratuity 119,465 58,026 Provision against other assets 35,875 30,042 Reversal of provision against off balance sheet obligations - (453,394) Net profit on sale of property and equipment (19,758) (17,295) Net profit on sale of non-banking assets acquired in satisfaction of claims (12,175) - Gain on sale and redemption of securities - net (1,301,673) (2,013,748)
2,367,402 (221,766) 7,590,848 5,771,685 (Increase) / Decrease in operating assets: Lendings to financial institutions 2,063,507 (2,311,980) Net investments in held for trading securities (6,018,612) (22,012,764) Advances - net (39,453,259) (23,046,578) Other assets - net (1,061,049) 6,570,285
(44,469,413) (40,801,037)Increase / (Decrease) in operating liabilities: Bills payable (609,636) 1,615,578 Borrowings from financial institutions 8,416,545 2,671,518 Deposits and other accounts 51,983,835 45,503,289 Other liabilities 1,146,370 530,109
60,937,114 50,320,494 24,058,549 15,291,142 Income tax paid (1,902,359) (826,065)Net cash flow from operating activities 22,156,190 14,465,077

10
Nine Months Ended September 30, September 30, 2017 2016
Rupees in ‘000’
CASH FLOWS FROM INVESTING ACTIVITIES Net investments in available for sale securities (23,143,337) (23,877,417)Net investments in held to maturity securities - 15,000,000 Dividend received 50,346 53,199 Investments in operating fixed assets (927,576) (563,293)Sale proceeds of property and equipment disposed-off 117,000 22,397 Sale proceeds of non-banking assets disposed-off 280,750 -
Net cash used in investing activities (23,622,817) (9,365,114) CASH FLOWS FROM FINANCING ACTIVITIES Redemption of subordinated term finance certificates (500) - Issue of right shares at premium during the period 6,062,950 - Right share issue cost (231,181) -
Net cash flow from financing activities 5,831,269 - Net increase in cash and cash equivalents 4,364,642 5,099,963 Cash and cash equivalents at beginning of the period 39,437,081 30,627,855 Cash and cash equivalents at end of the period 43,801,723 35,727,818 Cash and cash equivalents: Cash and balances with treasury banks 33,453,616 30,796,480 Balances with other banks 5,805,268 4,931,537 Call money lendings 4,581,951 - Overdrawn nostro accounts (39,112) (199) 43,801,723 35,727,818
The annexed notes from 1 to 21 and Annexure - I form an integral part of this unconsolidated condensed interim financial information.
President Director

11Third Quarterly Report January - September 2017
Pr
esid
ent
Dire
ctor
Rev
enue
C
apita
l Res
erve
Rese
rve
S
hare
Sh
are
Dis
coun
t on
Sta
tuto
ry
Sha
re
Una
ppro
pria
ted
T
otal
cap
ital
depo
sit
is
sue
of
rese
rve
p
rem
ium
p
rofit
/
m
oney
sh
ares
(a
ccum
ulat
ed
lo
sses
)
R
u p
e e
s
i n
‘
000’
Ba
lanc
e as
at J
anua
ry 1
, 201
6 1
5,55
1,13
2
7,0
00,0
00
(263
,158
) 2
,291
,119
3
7,88
2
(5,2
20,2
76)
19,
396,
699
To
tal c
ompr
ehen
sive
inco
me
for t
he n
ine
mon
ths
ende
d Se
ptem
ber 3
0, 2
016
-
-
-
-
-
3,9
30,5
02
3,9
30,5
02
Tran
sfer
from
sur
plus
on
reva
luat
ion
of fi
xed
asse
ts to
una
ppro
priat
ed p
rofit
/
(acc
umul
ated
loss
es) -
net
of t
ax
-
-
-
-
-
40,
979
4
0,97
9 Tr
ansf
er to
una
ppro
priat
ed p
rofit
/ (a
ccum
ulat
ed lo
sses
) -
-
-
(2
,000
,000
) -
2
,000
,000
-
Bala
nce
as a
t Sep
tem
ber 3
0, 2
016
15,
551,
132
7
,000
,000
(2
63,1
58)
291
,119
3
7,88
2
751
,205
2
3,36
8,18
0
Tota
l com
preh
ensiv
e in
com
e fo
r the
thre
e m
onth
s en
ded
Dece
mbe
r 31,
201
6 -
-
-
-
-
8
63,2
32
863
,232
Tr
ansf
er fr
om s
urpl
us o
n re
valu
atio
n of
fixe
d as
sets
to u
napp
ropr
iated
pro
fit /
(a
ccum
ulat
ed lo
sses
) - n
et o
f tax
-
-
-
-
-
1
3,66
0
13,
660
Tran
sfer
from
sur
plus
on
reva
luat
ion
of n
on b
ankin
g as
sets
to u
napp
ropr
iated
pro
fit /
(a
ccum
ulat
ed lo
sses
) - n
et o
f tax
-
-
-
-
-
2
,513
2
,513
Tr
ansf
er to
sta
tuto
ry re
serv
e -
-
-
9
71,6
72
-
(971
,672
) -
Bala
nce
as a
t Dec
embe
r 31,
201
6 1
5,55
1,13
2
7,0
00,0
00
(263
,158
) 1
,262
,791
3
7,88
2
658
,938
2
4,24
7,58
5
Tota
l com
preh
ensiv
e in
com
e fo
r the
nin
e m
onth
s en
ded
Sept
embe
r 30,
201
7 -
-
-
-
-
3,
160,
539
3
,160
,539
Tran
sfer
from
sur
plus
on
reva
luat
ion
of fi
xed
asse
ts to
una
ppro
priat
ed p
rofit
- ne
t of t
ax
-
-
-
-
-
38,
587
3
8,58
7 Tr
ansf
er fr
om s
urpl
us o
n re
valu
atio
n of
fixe
d as
sets
to u
napp
ropr
iated
pro
fit o
n di
spos
al -
-
-
-
-
6
9,04
2
69,
042
Tran
sfer
from
sur
plus
on
reva
luatio
n of
non
ban
king
asse
ts to
una
ppro
priat
ed p
rofit
- ne
t of t
ax
-
-
-
-
-
1,7
85
1,7
85
Tran
sfer f
rom
sur
plus
on
reva
luatio
n of
non
ban
king
asse
ts to
una
ppro
priat
ed p
rofit
on d
ispos
al -
-
-
-
-
8
,066
8
,066
Iss
ue o
f rig
ht s
hare
s at
pre
miu
m d
urin
g th
e pe
riod
1
0,88
5,79
2
(7,0
00,0
00)
-
-
2,1
77,1
58
-
6,0
62,9
50
Righ
t sha
re is
sue
cost
-
-
-
-
-
(2
31,1
81)
(231
,181
)
Bala
nce
as a
t Sep
tem
ber 3
0, 2
017
26,
436,
924
-
(2
63,1
58)
1,2
62,7
91
2,2
15,0
40
3,70
5,77
6 33
,357
,373
The
anne
xed
note
s fro
m 1
to 2
1 an
d An
nexu
re -
I for
m a
n in
tegr
al pa
rt of
this
unco
nsol
idat
ed c
onde
nsed
inte
rim fi
nanc
ial in
form
atio
n.
Un
con
solid
ated
Co
nd
ense
d In
teri
m S
tate
men
t of C
han
ges
in E
quit
y (U
n-a
ud
ited
)Fo
r th
e N
ine
Mo
nth
s E
nd
ed S
epte
mbe
r 30
, 20
17

12
1. STATUS AND NATURE OF BUSINESS
1.1 The Bank of Punjab (the Bank) was constituted pursuant to The Bank of Punjab Act, 1989 and was given the status of a scheduled bank by the State Bank of Pakistan (SBP) on September 19, 1994. The Bank is principally engaged in commercial banking and related services with its registered office at BOP Tower, 10-B, Block E-2, Main Boulevard, Gulberg III, Lahore. The Bank operates 465 branches including 04 sub branches and 53 Islamic banking branches (2016: 453 branches including 03 sub branches and 48 Islamic banking branches) in Pakistan and Azad Jammu and Kashmir as at the period end. The Bank is listed on Pakistan Stock Exchange. The majority shares of the Bank are held by Government of the Punjab (GoPb).
1.2 As at September 30, 2017, paid-up capital, reserves (net of losses) including share deposit money, as allowed by SBP, of the Bank amounts to Rs. 33,357,373 thousand. The Capital Adequacy Ratio (CAR) also remained above the required level. As at the close of the period, net advances aggregating to Rs. 14,363,810 thousand (December 31, 2016: Rs. 17,529,757 thousand) requiring additional provision of Rs. 13,368,304 thousand (December 31, 2016: Rs. 16,505,482 thousand) there against have not been subjected to provisioning criteria as prescribed in SBP prudential regulations in view of the relaxation provided by SBP till December 31, 2017 vide letter No.OSED/Div-01/SEU-03/010(01)-2017/005967 dated March 09, 2017, on the basis of two Letters of Comfort (LOCs) issued by the GoPb as explained in below paragraph.
The GoPb being the majority shareholder, has issued two LOCs on behalf of the Bank, undertaking to inject necessary funds to make good the capital shortfall to the satisfaction of SBP up to a maximum amount of Rs. 3,580,000 thousand (net of tax @ 35%) and Rs. 10,570,000 thousand (net of tax @ 35%) within a period of 90 days after close of the year ending December 31, 2018 if the Bank fails to make provision of Rs. 21,770,000 thousand or if there is a shortfall in meeting the prevailing regulatory capital requirements as a result of the said provisioning. In addition, in terms of aforesaid LOCs, the GoPb being majority shareholder and sponsor of the Bank, has also extended its commitment to support and assist the Bank in ensuring that it remains compliant with the regulatory requirements at all times.
SBP vide above referred letter advised the Bank to record provisioning against exposures covered under LOCs in a staggered manner as follows:
• Staggering of provision at an aggregate rate of 25%, i.e.12.5% by June 30, 2017 and additional 12.5% by December 31, 2017 against exposure covered under LOCs as of December 31, 2016. The condition of recording of provision of 12.5 % by June 30, 2017 has been complied with by the Bank along with proportionate charge required up till September 30, 2017.
• Going forward, exposure covered under LOCs at the beginning of 2018 would be subject to 25% provision staggering by June 30, 2018 and remaining balance by December 31, 2018.
On the basis of enduring support of GoPb and the arrangements as outlined above, the Board is of the view that the Bank would have adequate resources to continue its business on a sustainable basis in the foreseeable future.
2. STATEMENT OF COMPLIANCE
2.1 This unconsolidated condensed interim financial information has been prepared in accordance with the directives issued by the SBP, requirements of the Bank of Punjab Act, 1989, the Banking Companies Ordinance, 1962, the Companies Ordinance, 1984 (repealed - note 2.1.1) and approved accounting standards as applicable in Pakistan. Approved accounting standards comprise of such International Financial Reporting Standards (IFRS) issued by the International Accounting Standard Board and Islamic Financial Accounting Standards (IFAS) issued by the Institute of Chartered Accountants of Pakistan as are notified under the provisions of the Companies Ordinance, 1984 (repealed - note 2.1.1). Wherever the requirements of the directives issued by the SBP and Securities and Exchange Commission of Pakistan (SECP), the Bank of Punjab Act, 1989, the Banking Companies Ordinance, 1962 and the Companies Ordinance, 1984 (repealed - note 2.1.1) differ with the requirements of these standards, the requirements of the said directives, the Bank of Punjab Act, 1989, the Banking Companies Ordinance, 1962 and the Companies Ordinance, 1984 (repealed - note 2.1.1) take precedence.
Notes to the Unconsolidated Condensed Interim Financial Information (Un-audited)For the Nine Months Ended September 30, 2017

13Third Quarterly Report January - September 2017
2.1.1 The Companies Ordinance, 1984 has been repealed after the enactment of Companies Act, 2017. However, as allowed by the SECP vide its Circular No. 23 dated October 04, 2017 read with related press release, this unconsolidated condensed interim financial information has been prepared in accordance with the provisions of the repealed Companies Ordinance, 1984.
2.2 SBP as per BSD Circular No. 10, dated August 26, 2002 has deferred the applicability of International Accounting Standard (IAS) 39, “Financial Instruments: Recognition and Measurement” and International Accounting Standard (IAS) 40, “Investment Property” for banking companies till further instructions. Further, according to the notification of SECP dated April 28, 2008, the IFRS – 7 “Financial Instruments: Disclosures” has not been made applicable for banks. Accordingly, the requirements of these Standards have not been considered in the preparation of this unconsolidated condensed interim financial information.
2.3 This unconsolidated condensed interim financial information is separate interim financial information of the Bank in which the investment in subsidiary is stated at cost less provision for impairment (if any) and has not been accounted for on the basis of reported results and net assets of the investee.
2.4 The financial results of Islamic banking business have been consolidated in this unconsolidated condensed interim financial information for reporting purposes, after eliminating inter-branch transactions / balances. Key financial figures of the Islamic banking business are disclosed in Annexure-I to this unconsolidated condensed interim financial information.
2.5 The disclosures made in this unconsolidated condensed interim financial information have, however, been limited based on the format prescribed by the SBP vide BSD Circular letter No. 2 dated May 12, 2004, BSD Circular letter No. 7 dated April 20, 2010 and International Accounting Standard – 34 Interim Financial Reporting. They do not include all of the disclosures required for annual financial statements, and this unconsolidated condensed interim financial information should be read in conjunction with the annual financial statements of the Bank for the year ended December 31, 2016. This unconsolidated condensed interim financial information is being submitted to the shareholders in accordance with the listing regulations of Pakistan Stock Exchange and Section 245 of the Companies Ordinance, 1984 (repealed).
3. BASIS OF MEASUREMENT
This unconsolidated condensed interim financial information has been prepared under the historical cost convention, except for revaluation of free hold land and buildings on free hold land, revaluation of non banking assets acquired in satisfaction of claims, valuation of certain investments and commitments in respect of forward exchange contracts at fair value and certain staff retirement benefits at present value.
These unconsolidated financial statements are presented in Pak Rupees, which is the Bank’s functional and presentation currency.
4. SUMMARY OF SIGNIFICANT ACCOUNTING POLICIES, ESTIMATES AND JUDGMENTS
The accounting policies, underlying estimates and judgments and methods of computation followed in the preparation of this unconsolidated condensed interim financial information are consistent with those applied in the preparation of annual financial statements of the Bank for the year ended December 31, 2016.
5. FINANCIAL RISK MANAGEMENT
The financial risk management objectives and policies of the Bank are consistent with those disclosed in the annual financial statements of the Bank for the year ended December 31, 2016.
(Un-audited) (Audited) September 30, December 31, 2017 2016 Note Rupees in ‘000’ 6. LENDINGS TO FINANCIAL INSTITUTIONS Sukuk Bai - Muajjal 6.1 767,000 - Call money lending 4,581,951 - Reverse repurchase agreement lendings 6.2 366,626 6,162,133 Placements 8,365,000 5,400,000 14,080,577 11,562,133

14
6.1 This represent outright purchase of Government Ijarah Sukuks by SBP on deferred payment basis (Bai-Muajjal) at returns ranging from 5.65 % to 5.75% per annum (2016: Nil).
6.2 Securities held as collateral against lendings to financial institutions
(Un-audited) (Audited) September 30, 2017 December 31, 2016 Held by Further Held by Further bank given as Total bank given as Total collateral collateral R u p e e s i n ‘ 0 0 0 ’ Market treasury bills 146,626 - 146,626 3,302,133 - 3,302,133 Pakistan investment bonds 220,000 - 220,000 2,860,000 - 2,860,000 366,626 - 366,626 6,162,133 - 6,162,133 Market value of securities held as collateral as at September 30, 2017 amounted to Rs. 371,687 thousand (December 31, 2016: Rs.
6,225,139 thousand). These carry mark-up at the rate of 6.25% per annum (December 31, 2016: 5.90% to 6.25% per annum).
7. INVESTMENTS - NET (Un-audited) (Audited) September 30, 2017 December 31, 2016 Held by Given as Total Held by Given as Total bank collateral bank collateral Note R u p e e s i n ‘ 0 0 0 ’ Held for trading securities: Market treasury bills 29,316,269 - 29,316,269 23,298,833 - 23,298,833 Available for sale securities: Market treasury bills 126,998,382 27,081,376 154,079,758 80,885,259 9,925,825 90,811,084 Pakistan investment bonds 28,783,533 4,000,472 32,784,005 59,242,027 15,979,961 75,221,988 Ordinary shares / certificates of listed companies and modarabas 1,779,182 - 1,779,182 1,305,364 - 1,305,364 Preference shares 401,739 - 401,739 401,739 - 401,739 Ordinary shares of unlisted company 25,000 - 25,000 25,000 - 25,000 Government of Pakistan ijarah sukuk 5,037,374 - 5,037,374 2,885,472 - 2,885,472 Listed term finance certificates 1,387,358 - 1,387,358 1,193,277 - 1,193,277 Unlisted term finance certificates / sukuks / commercial paper 6,105,166 - 6,105,166 5,954,475 - 5,954,475
170,517,734 31,081,848 201,599,582 151,892,613 25,905,786 177,798,399 Held to maturity securities: Pakistan investment bonds 7.1 252,582 - 252,582 253,867 - 253,867 WAPDA bonds 400 - 400 400 - 400 252,982 - 252,982 254,267 - 254,267 Subsidiary: Punjab modaraba services (private) limited 164,945 - 164,945 164,945 - 164,945 Total investments at cost 200,251,930 31,081,848 231,333,778 175,610,658 25,905,786 201,516,444 Provision for diminution in the value of investments - net (3,105,842) - (3,105,842) (3,068,083) - (3,068,083) Investments net of provision 197,146,088 31,081,848 228,227,936 172,542,575 25,905,786 198,448,361 Surplus on revaluation of available for sale securities 37,772 18,591 56,363 1,264,948 29,857 1,294,805 Deficit on revaluation of held for trading securities 1,470 - 1,470 (1,176) - (1,176) Total investments at market value 197,185,330 31,100,439 228,285,769 173,806,347 25,935,643 199,741,990
7.1 Market value of held to maturity investments is Rs. 259,862 thousand (December 31, 2016: Rs. 263,326 thousand).

15Third Quarterly Report January - September 2017
(Un-audited) (Audited) September 30, December 31, 2017 2016 Note Rupees in ‘000’ 8. ADVANCES - NET Loans, cash credits, running finances, etc. - In Pakistan 268,484,379 237,926,509 Net investment in finance lease - In Pakistan 35,920,719 39,519,683 Net book value of assets in ijarah under IFAS 2 - In Pakistan 858,069 517,073 Islamic financing and related assets 10,033,781 8,419,676 Bills discounted and purchased (excluding treasury bills) -Payable in Pakistan 16,297,417 6,043,018 -Payable outside Pakistan 1,541,278 1,495,896
17,838,695 7,538,914 Advances - gross 333,135,643 293,921,855 Provision for non-performing advances : -Specific 8.1 & 8.2 (33,380,967) (31,462,960) -General 8.3 (415,396) (390,971)
(33,796,363) (31,853,931) Advances - net of provision 299,339,280 262,067,924 8.1 Provision against certain net advances amounting to Rs. 14,363,810 thousand (December 31, 2016:
Rs. 17,529,757 thousand) requiring additional provisioning of Rs. 13,368,304 thousand (December 31, 2016: Rs. 16,505,482 thousand) has not been considered necessary in this unconsolidated condensed interim financial information on the basis of undertaking given by GoPb as stated in Note 1.2. Further, during the period, in order to meet the SBP’s provision staggering requirement, an additional provision, against exposures covered under LOCS, net off recoveries amounting to Rs. 1,777,966 thousand (December 31, 2016: Rs. 1,143,817 thousand) has been recognized.
8.2 Advances include Rs. 53,747,028 thousand (December 31, 2016: Rs. 54,953,553 thousand) which
have been placed under non-performing status as on September 30, 2017 as detailed below:
September 30, 2017 (Un-audited) Category of classification Domestic Overseas Total Provision Provision Required Held Rupees in ‘000’ Other assets especially mentioned 123,454 - 123,454 4,987 4,987 Substandard 2,162,804 - 2,162,804 235,351 235,351 Doubtful 7,313,355 - 7,313,355 3,495,303 3,495,303 Loss 44,147,415 - 44,147,415 29,645,326 29,645,326
53,747,028 - 53,747,028 33,380,967 33,380,967 December 31, 2016 (Audited) Category of classification Domestic Overseas Total Provision Provision Required Held Rupees in ‘000’ Other assets especially mentioned 337,806 - 337,806 2,042 2,042 Substandard 1,585,906 - 1,585,906 80,564 80,564 Doubtful 7,450,320 - 7,450,320 3,609,147 3,609,147 Loss 45,579,521 - 45,579,521 27,771,207 27,771,207
54,953,553 - 54,953,553 31,462,960 31,462,960

16
8.3 General provision represents provision against consumer and SME financing portfolio as required by the prudential regulations issued by the SBP.
8.4 The SBP amended the prudential regulations vide BSD Circular No.1 of 2011 dated October 21,
2011 in relation to provision for loans and advances there by allowing benefit of Forced Sale Value (FSV) of pledged stocks, mortgaged residential, commercial and industrial properties (land and buildings only) and plant and machinery under charge held as collateral against non-performing advances. The FSV benefit availed in last years have been reduced by Rs. Nil (net of FSV benefit availed during the period) (September 30, 2016: Rs. 152,409 thousand), which has resulted in increased charge for specific provision for the period ended by the same amount. The FSV benefit is not available for cash or stock dividend. Had the FSV benefit not recognized, before and after tax profits for the nine months ended would have been higher by Rs. Nil (September 30, 2016: Rs. 152,409 thousand) and Rs. Nil (September 30, 2016: higher by Rs. 99,066 thousand) respectively.
9. OPERATING FIXED ASSETS During the period, additions to / disposals (at cost) from operating fixed assets amounted to Rs.
927,576 thousand (September 30, 2016: Rs. 563,293 thousand) and Rs. 171,472 thousand (September 30, 2016: Rs. 54,987 thousand), respectively.
(Un-audited) (Audited) September 30, December 31, 2017 2016 Note Rupees in ‘000’
10. DEFERRED TAX ASSETS - NET Taxable temporary differences: Surplus on revaluation of operating fixed assets (532,021) (556,582) Surplus on revaluation of non banking assets (24,266) (25,712) Surplus on available for sale securities (19,727) (453,182) Accelerated tax depreciation (209,320) (225,104) Deductible temporary differences: Loan loss provision 7,657,857 7,740,836 6,872,523 6,480,256 11. BORROWINGS FROM FINANCIAL INSTITUTIONS Secured Borrowings from SBP: -Export refinance (ERF) 9,226,002 10,282,058 -Long term financing facility (LTFF) 5,120,175 3,163,460 -Finance facility for storage of agricultural produce (FFSAP) 17,121 12,834 Repurchase agreement borrowings 1,496,876 15,879,035 Call borrowings 11.1 29,470,368 9,911,835 45,330,542 39,249,222 Unsecured Call borrowings 992,695 495,102 Foreign placement 1,837,632 - Overdrawn nostro accounts 39,112 84,810 48,199,981 39,829,134 11.1 These represent secured interbank borrowings, carrying markup rate ranging from 5.75% to 5.83%
per annum (2016: 5.77% to 5.80 % per annum) maturing on various dates, latest by September 21, 2018.

17Third Quarterly Report January - September 2017
(Un-audited) (Audited) September 30, December 31, 2017 2016 Rupees in ‘000’ 12. DEPOSITS AND OTHER ACCOUNTS
Customers Fixed deposits 145,800,668 129,533,881 Savings deposits 219,230,452 193,301,179 Current accounts - non-remunerative 119,467,564 117,973,360 Sundry deposits, margin accounts, etc. 16,057,290 6,399,769
500,555,974 447,208,189 Financial Institutions Remunerative deposits 2,691,699 4,722,171 Non-remunerative deposits 1,955,902 1,289,380
4,647,601 6,011,551 505,203,575 453,219,740 12.1 Particulars of deposits
In local currency 497,884,560 445,571,885 In foreign currencies 7,319,015 7,647,855 505,203,575 453,219,740
13. SHARE CAPITAL
(Un-audited) (Audited) (Un-audited) (Audited) September 30, December 31, September 30, December 31, 2017 2016 2017 2016 (No. of shares) Rupees in ‘000’ 13.1 Authorized capital
Ordinary or preference shares of 5,000,000,000 5,000,000,000 Rs. 10/- each 50,000,000 50,000,000 The authorized capital of the Bank is fifty thousand million rupees divided into five thousand million ordinary or
preference shares of rupees ten each.
13.2 Issued, subscribed and paid up capital
(Un-audited) (Audited) (Un-audited) (Audited) September 30, December 31, September 30, December 31, 2017 2016 2017 2016 (No. of shares) Rupees in ‘000’ Opening balance 519,333,340 519,333,340 Ordinary shares of Rs. 10/- each 5,193,333 5,193,333 paid in cash 526,315,789 526,315,789 Ordinary shares of Rs. 10/- each 5,263,158 5,263,158 issued at discount 509,464,036 509,464,036 Issued as bonus shares 5,094,641 5,094,641 1,555,113,165 1,555,113,165 15,551,132 15,551,132 Movement during the period 1,088,579,215 - Issuance of right shares during the period 10,885,792 -
Closing balance 1,607,912,555 519,333,340 Ordinary shares of Rs. 10/- each paid in cash 16,079,125 5,193,333 526,315,789 526,315,789 Ordinary shares of Rs. 10/- each issued at discount 5,263,158 5,263,158 509,464,036 509,464,036 Issued as bonus shares 5,094,641 5,094,641 2,643,692,380 1,555,113,165 26,436,924 15,551,132

18
13.3 GoPb held 57.47% shares in the Bank as at September 30, 2017 (December 31, 2016: 57.47%). Further, during the period the Bank has issued 1,088,579,215 (70%) right shares at a price of Rs. 12.00 per share including premium of Rs. 2.00 per share.
(Un-audited) (Audited) September 30, December 31, 2017 2016 Rupees in ‘000’
14. SHARE DEPOSIT MONEY Opening balance 7,000,000 7,000,000 Right shares issued during the year (7,000,000) - Closing balance - 7,000,000
15. SURPLUS ON REVALUATION OF ASSETS - NET OF TAX Surplus on revaluation of operating fixed assets 2,037,990 2,141,837 Surplus on non banking assets acquired in satisfaction of claims 614,086 623,453 Surplus on revaluation of available for sale securities 36,636 841,623 2,688,712 3,606,913 16. CONTINGENCIES AND COMMITMENTS 16.1 Direct credit substitutes These include general guarantees of indebtedness, bank acceptance guarantees and standby
letters of credit serving as financial guarantees for loans and securities issued in favor of:
(Un-audited) (Audited) September 30, December 31, 2017 2016 Rupees in ‘000’ Government 86,930 - Financial institutions - - Others 7,208,286 2,209,896 7,295,216 2,209,896 16.2 Transaction related contingent liabilities These include performance bonds, bid bonds, warranties, advance payment guarantees, shipping
guarantees and standby letters of credit related to particular transactions issued in favor of:
(Un-audited) (Audited) September 30, December 31, 2017 2016 Rupees in ‘000’
Government 570,083 601,271 Financial institutions 4,917,707 8,564,597 Others 38,940,854 23,878,852 44,428,644 33,044,720

19Third Quarterly Report January - September 2017
(Un-audited) (Audited) September 30, December 31, 2017 2016 Note Rupees in ‘000’
16.3 Trade related contingent liabilities These include letters of credit issued in favour of: Government 15,348,787 6,719,311 Financial institutions - - Others 19,336,868 20,163,620 34,685,655 26,882,931 16.4 Other contingencies Claims against the Bank not acknowledged as debts 16.4.1 30,008,984 29,750,928 16.4.1 The amount involved in the claims filed against the Bank are yet to be adjudicated by the concerned
courts as the same have been filed as outburst to our recovery suits. Up till now, in no case, any claim has been adjudicated, determined or decreed by the courts against the Bank. Moreover, there is no likelihood of decreeing the suits against the Bank because the claims are frivolous.
16.5 Income tax related contingency For the tax years 2010, 2011 & 2012 Income Tax Department has amended the assessment orders
on the issues of separate taxation of dividend income against which the Bank had filed appeals before the Commissioner Inland Revenue Appeals (CIR(A)). CIR(A) provided relief to the Bank on issue of separate taxation of dividend income. Now, the tax department has filed appeal against the decision of CIR(A) with the Appellate Tribunal Inland Revenue (ATIR). The expected tax liability in respect of aforesaid tax years amounts to Rs. 162,772 thousand. The management of the Bank, as per the opinion of its tax consultant, is confident that the decision for the aforementioned tax years will be decided in Bank’s favour.
16.6 Commitments to extend credit The Bank makes commitments to extend credit in the normal course of business but these being
revocable commitments do not attract any significant penalty or expense if the facility is unilaterally withdrawn.
(Un-audited) (Audited) September 30, December 31, 2017 2016 Rupees in ‘000’
16.7 Commitments in respect of forward exchange contracts Purchase 11,309,530 9,594,731 Sale 6,276,454 6,997,174 17,585,984 16,591,905 16.8 Commitments for the acquisition of operating fixed assets 198,880 27,095

20
17. EARNINGS PER SHARE - BASIC AND DILUTED (Un-audited)
Three Months Nine Months Three Months Nine Months Ended Ended Ended Ended September 30, September 30, September 30, September 30, 2017 2017 2016 2016 Rupees in ‘000’ Profit after taxation (Rupees in thousand) 971,176 3,160,539 1,163,585 3,930,502 Weighted average number of ordinary shares (thousand) 1,854,173 1,854,173 1,555,113 1,555,113 Earnings per share - basic and diluted (Rupees) 0.52 1.70 0.75 2.53 17.1 During the period, the Bank issued (70%) right shares at a price of Rs. 12.00 per share including
premium of Rs. 2.00 per share. However, in the absence of element of bonus, earning per share for comparative period has not been restated.
18. SEGMENT DETAILS WITH RESPECT TO BUSINESS ACTIVITIES
The segment analysis with respect to business activity is as follows:-
Trading & Retail Commercial Payment & Agency Total Sales Banking Banking Settlement Services
Rupees in ‘000’ Nine Months Ended September 30, 2017 (Un-audited) Total income 11,632,319 3,374,427 12,936,750 457,547 91,054 28,492,097 Total expenses 1,094,603 2,988,583 19,125,649 - - 23,208,835 Inter segment transfer (cost) / revenue (5,118,471) 734,336 4,384,135 - - - Income taxes - - - - - 2,122,723
Net income / (loss) 5,419,245 1,120,180 (1,804,764) 457,547 91,054 3,160,539 Segment assets (gross) 280,440,700 51,471,281 311,390,228 - - 643,302,209 Segment non performing advances / investments 3,105,842 2,460,355 51,286,673 - - 56,852,870 Segment specific provision required 3,105,842 1,744,599 31,636,368 - - 36,486,809 Segment liabilities 38,458,393 79,970,742 459,961,029 - - 578,390,164 Segment return on net assets (ROA) (%) 7.24% 10.42% 8.26% Segment cost of funds (%) 5.44% 5.88% 5.66%

21Third Quarterly Report January - September 2017
Trading & Retail Commercial Payment & Agency Total Sales Banking Banking Settlement Services
Rupees in ‘000’
Nine Months Ended September 30, 2016 (Un-audited) Total income 11,523,089 3,303,947 10,657,677 348,443 62,872 25,896,028 Total expenses 1,578,760 2,652,838 15,628,573 - - 19,860,171 Inter segment transfer (cost) / revenue (4,461,117) 659,840 3,801,277 - - - Income taxes - - - - - 2,105,355
Net income / (loss) 5,483,212 1,310,949 (1,169,619) 348,443 62,872 3,930,502 Segment assets (gross) 251,559,530 49,972,096 249,207,698 - - 550,739,324 Segment non performing advances / investments 3,135,169 2,302,301 54,008,531 - - 59,446,001 Segment specific provision required 3,087,782 1,641,848 29,796,726 - - 34,526,356 Segment liabilities 50,475,114 69,732,027 379,255,842 - - 499,462,983 Segment return on net assets (ROA) (%) 8.78% 10.07% 8.95% Segment cost of funds (%) 6.10% 6.37% 5.94%
19. RELATED PARTY TRANSACTIONS
Related parties comprise subsidiary, key management personnel and entities in which key management personnel are office holders / members. The Bank in the normal course of business carries out transactions with various related parties on arm’s length basis. Amounts due from and due to related parties are shown under receivables and payables. In addition key management personnel are paid terminal and short-term terminal benefits.
September 30, 2017 (Un-audited) December 31, 2016 (Audited) Key Subsidiary Employee Others Key Subsidiary Employee Others management company funds management company funds personnel and personnel and managed managed modaraba modaraba Rupees in ‘000’ Rupees in ‘000’ Advances Opening balance 114,850 1,078,614 - - 117,456 855,445 - - Loans granted during the period 93,879 588,240 - - 38,064 932,466 - - Repayments received during the period (42,007) (579,778) - - (40,670) (709,297) - -
Closing balance 166,722 1,087,076 - - 114,850 1,078,614 - - Deposits Opening balance 28,730 56,238 2,459,349 51,488 18,544 52,651 2,317,942 262,770 Placements made during the period 420,323 868,429 513,518 5,089,041 305,191 1,157,283 455,520 1,324,912 Withdrawals during the period (416,583) (920,250) (229,870) (4,861,496) (295,005) (1,153,696) (314,113) (1,536,194)
Closing balance 32,470 4,417 2,742,997 279,033 28,730 56,238 2,459,349 51,488 Placements - 400,000 - - - 300,000 - -
September 30, 2017 (Un-audited) September 30, 2016 (Un-audited) Rupees in ‘000’ Rupees in ‘000’ Transactions during the period : Mark-up/return earned 5,189 68,096 - - 5,280 51,818 - - Mark-up/interest expensed 578 - 109,093 3,032 497 - 102,218 338 Contribution to employees funds - - 98,294 - - - 68,515 -
22
19.1 Balances pertaining to parties that were related at the beginning of the period but ceased to be so related during any part of the current period are not reflected as part of the closing balance. The same are accounted for through movement presented above.
19.2 The GoPb holds controlling interest (57.47% shareholding) in the Bank and therefore entities which
are owned and / or controlled by the GoPb, or where the GoPb may exercise significant influence, are related parties of the Bank.
The Bank in the ordinary course of business enters into transaction with Government-related entities.
Such transactions include lending to, deposits from and provision of other banking services to Government-related entities.
As at Statement of Financial Position date the loans and advances, deposits and contingencies
relating to GoPb and its related entities amounted to Rs. 45,365,732 thousand (December 31, 2016: Rs. 40,923,548 thousand), Rs. 268,819,057 thousand (December 31, 2016: Rs. 212,000,928 thousand) and Rs. 27,398,137 thousand (December 31, 2016: Rs. 11,373,982 thousand) respectively. Further, during the period, the Bank has incurred markup expense of Rs. 93,493 thousand (September 30, 2016: Rs. 95,438 thousand) on subordinated loan of Rs. 2,000,000 thousand received from GoPb in year 2014.
20. DATE OF AUTHORIZATION FOR ISSUE This unconsolidated condensed interim financial information was authorized for issuance on October
25, 2017 by the Board of Directors of the Bank. 21. GENERAL 21.1 The corresponding figures have been reclassified or rearranged, wherever necessary, for the purpose
of comparison. However, no significant reclassification or rearrangement has been made during the period.
21.2 Figures have been rounded off to the nearest thousand, unless otherwise stated.
President Director

23Third Quarterly Report January - September 2017
The Bank of PunjabIslamic Banking Business - Statement of Financial Position As at September 30, 2017The Bank is operating 53 Islamic banking branches and 02 sub Islamic banking branches at close of September 30, 2017 (December 31, 2016: 48 branches and 02 sub Islamic banking branches).
(Un-audited) (Audited) September 30, December 31, 2017 2016 Note Rupees in ‘000’
ASSETS Cash and balances with treasury banks 2,062,739 2,302,273 Balance with other banks 1,858,666 1,755,658 Due from financial institutions 8,732,000 5,100,000 Investments 7,630,799 5,512,287 Islamic financing and related assets A 10,841,429 8,936,749 Operating fixed assets 252,817 272,007 Deferred tax assets - - Other assets 489,072 251,092
TOTAL ASSETS 31,867,522 24,130,066 LIABILITIES Bills payable 193,739 227,700 Due to financial institutions - - Deposit and other accounts - Current accounts 6,629,237 6,126,472 - Saving accounts 21,104,294 14,680,150 - Term deposits 716,923 813,678 - Others 36,655 225,814 - Deposits from financial institutions - remunerative 82,733 - - Deposits from financial institutions - non - remunerative 3,101 - Due to head office 1,600,836 684,727 Other liabilities 118,669 62,053
30,486,187 22,820,594 NET ASSETS 1,381,335 1,309,472 REPRESENTED BY Islamic banking fund 1,000,000 1,000,000 Reserves - - Unappropriated profit 335,452 230,200
1,335,452 1,230,200 Surplus on revaluation of assets 45,883 79,272 1,381,335 1,309,472 Remuneration to Shariah Advisor / Board 3,854 3,944
Annexure - I
24
(Un-audited) (Audited) September 30, December 31, 2017 2016
Note Rupees in ‘000’
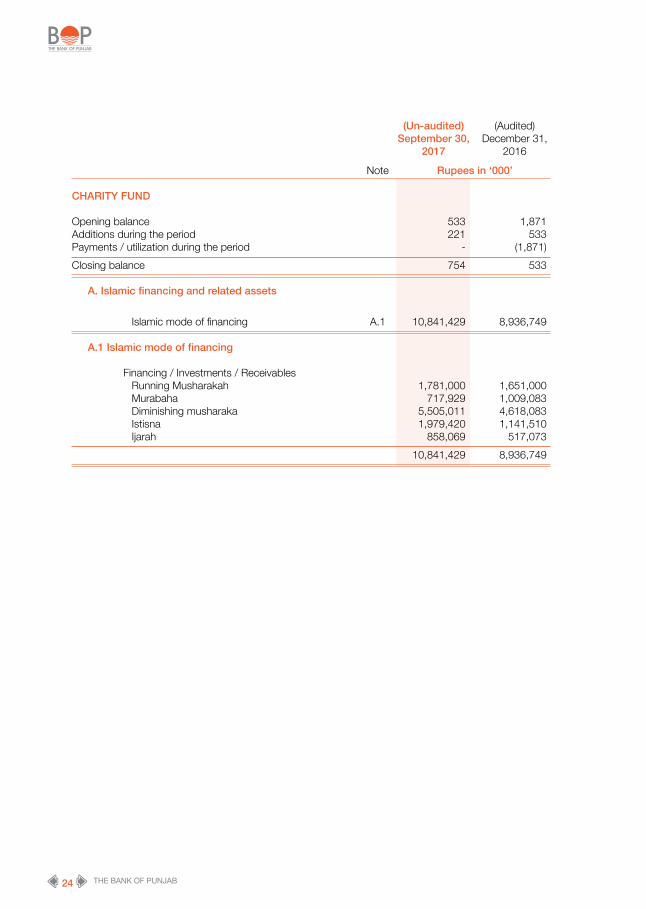
CHARITY FUND Opening balance 533 1,871 Additions during the period 221 533 Payments / utilization during the period - (1,871)Closing balance 754 533
A. Islamic financing and related assets Islamic mode of financing A.1 10,841,429 8,936,749 A.1 Islamic mode of financing Financing / Investments / Receivables Running Musharakah 1,781,000 1,651,000 Murabaha 717,929 1,009,083 Diminishing musharaka 5,505,011 4,618,083 Istisna 1,979,420 1,141,510 Ijarah 858,069 517,073 10,841,429 8,936,749

25Third Quarterly Report January - September 2017
The Bank of PunjabIslamic Banking Business - Profit and Loss Account For the Nine Months Ended September 30, 2017 (Un-audited)
Annexure - I
Three Months Nine Months Three Months Nine Months Ended Ended Ended Ended September 30, September 30, September 30, September 30, 2017 2017 2016 2016 (Rupees in thousand) Profit / Return earned on financing, investment and placements 487,993 1,314,512 299,765 740,654 Return on deposits and other dues expensed 182,504 455,492 94,482 220,784
Net spread earned 305,489 859,020 205,283 519,870 Provision against non-performing advances 50,421 50,421 - - Provision against consumer financings - - - - Provision for diminution in the value of investments - - - - Bad debts written off directly - - - -
50,421 50,421 - -
Income after provisions 255,068 808,599 205,283 519,870 Other income Fee, commission and brokerage income 4,003 17,975 2,636 11,731 Dividend income - - - - (Loss) / Income from dealing in foreign currencies 840 865 (177) (155) Gain on sale and redemption of securities - - - - Unrealized gain / (loss) on revaluation of investments classified as held for trading - - - - Other income 8,020 24,400 4,108 18,295
Total other income 12,863 43,240 6,567 29,871
267,931 851,839 211,850 549,741 Other expenses Administrative expenses 289,261 746,587 174,965 470,807 Other provisions/write offs/reversals - - - - Other charges - - - 19
Total other expenses 289,261 746,587 174,965 470,826 (21,330) 105,252 36,885 78,915 Extra ordinary / unusual items - - - -
PROFIT BEFORE TAXATION (21,330) 105,252 36,885 78,915

26
27Third Quarterly Report January - September 2017
Consolidated Condensed InterimFinancial Information
for the period ended September 30, 2017(The Bank of Punjab & Modaraba Services (Pvt) Ltd.)

28 THE BANK OF PUNJAB GROUP
Consolidated Condensed Interim Statement of Financial Position As at September 30, 2017
President Director
(Un-audited) (Audited) September 30, December 31, 2017 2016 Note Rupees in ‘000’
ASSETS Cash and balances with treasury banks 33,453,616 35,756,024 Balances with other banks 5,805,268 3,765,867 Lendings to financial institutions 6 14,080,577 11,562,133 Investments - net 7 228,328,042 199,784,353 Advances - net 8 299,290,025 262,025,131 Operating fixed assets 9 7,926,101 7,692,675 Deferred tax assets - net 10 6,872,523 6,480,256 Other assets - net 18,681,694 18,152,867
614,437,846 545,219,306 LIABILITIES Bills payable 3,573,844 4,183,480 Borrowings from financial institutions 11 48,199,981 39,829,134 Deposits and other accounts 12 505,203,575 453,219,740 Sub-ordinated loans 4,499,500 4,500,000 Liabilities against assets subject to finance lease - - Deferred tax liabilities - net - - Other liabilities 16,913,476 15,627,465
578,390,376 517,359,819 NET ASSETS 36,047,470 27,859,487 REPRESENTED BY Share capital 13 26,436,924 15,551,132 Share deposit money 14 - 7,000,000 Discount on issue of shares (263,158) (263,158)Reserves 3,477,831 1,300,673 Unappropriated profit 3,707,161 663,927 33,358,758 24,252,574 Surplus on revaluation of assets - net of tax 15 2,688,712 3,606,913 36,047,470 27,859,487 Contingencies and commitments 16 The annexed notes from 1 to 21 and Annexure - I form an integral part of this consolidated condensed interim financial information.

29Third Quarterly Report January - September 2017
President Director
Consolidated Condensed Interim Profit and Loss Account (Un-audited)For the Nine Months Ended September 30, 2017
Three Months Nine Months Three Months Nine Months Ended Ended Ended Ended September 30, September 30, September 30, September 30, 2017 2017 2016 2016 Rupees in ‘000’ Mark-up / return / interest earned 8,744,672 24,745,457 7,327,270 21,928,388 Mark-up / return / interest expensed 4,879,530 13,721,468 4,371,674 13,025,201
Net mark-up / return / interest income 3,865,142 11,023,989 2,955,596 8,903,187 Provision / (Reversal of provision) against non-performing advances - net 492,186 1,944,629 (252,609) 883,713 Provision / (Reversal of provision) for diminution in the value of investments - net 45,430 45,941 (4,835) 90,261 Bad debts written off directly - - - - 537,616 1,990,570 (257,444) 973,974
Net mark-up / return / interest income after provisions 3,327,526 9,033,419 3,213,040 7,929,213 NON MARK-UP / INTEREST INCOME Fee, commission and brokerage income 272,061 842,509 206,478 733,937 Dividend income 17,064 59,816 11,952 42,406 (Loss) / Income from dealing in foreign currencies (3,201) 44,246 9,760 51,060 Gain on sale and redemption of securities - net 116,811 1,301,673 268,422 2,013,748 Unrealized gain / (loss) on revaluation of investments classified as held for trading 2,409 1,470 (11,050) (11,668) Other income 333,902 1,497,474 249,979 1,137,648
Total non-markup / interest income 739,046 3,747,188 735,541 3,967,131
4,066,572 12,780,607 3,948,581 11,896,344 NON MARK-UP / INTEREST EXPENSES Administrative expenses 2,578,963 7,423,043 2,150,161 6,246,603 Provision / (Reversal of provision) against other assets 2,493 35,875 (593) 30,042 Reversal of provision against off balance sheet obligations - - - (453,394) Other charges - 42,003 3,855 33,386 Total non-markup / interest expenses 2,581,456 7,500,921 2,153,423 5,856,637
1,485,116 5,279,686 1,795,158 6,039,707 Extra ordinary / unusual items - - - -
PROFIT BEFORE TAXATION 1,485,116 5,279,686 1,795,158 6,039,707
Taxation - Current 436,062 1,812,719 344,260 712,189 - Prior years - 264,576 - - - Deferred 74,984 45,456 283,476 1,393,183 511,046 2,122,751 627,736 2,105,372
PROFIT AFTER TAXATION 974,070 3,156,935 1,167,422 3,934,335
Earnings per share - basic and diluted (Rupees) - Note 17 0.53 1.70 0.75 2.53
The annexed notes from 1 to 21 and Annexure - I form an integral part of this consolidated condensed interim financial information.

30 THE BANK OF PUNJAB GROUP
President Director
Consolidated Condensed Interim Statement of Comprehensive Income (Un-audited)For the Nine Months Ended September 30, 2017
Three Months Nine Months Three Months Nine Months Ended Ended Ended Ended September 30, September 30, September 30, September 30, 2017 2017 2016 2016 Rupees in ‘000’ Profit after taxation for the period 974,070 3,156,935 1,167,422 3,934,335 Other comprehensive income not to be reclassified to profit and loss account in subsequent periods: Remeasurement adjustments on employee benefits - net of tax - - - - Comprehensive income transferred to equity 974,070 3,156,935 1,167,422 3,934,335 Components of comprehensive income not reflected in equity: Items to be reclassified to profit and loss in subsequent periods: Surplus on revaluation of investments - net of tax (207,711) (804,987) (310,004) 501,587 Total comprehensive income for the period 766,359 2,351,948 857,418 4,435,922 The annexed notes from 1 to 21 and Annexure - I form an integral part of this consolidated condensed interim financial information.

31Third Quarterly Report January - September 2017
Consolidated Condensed Interim Cash Flow Statement (Un-audited)For the Nine Months Ended September 30, 2017
Nine Months Ended September 30, September 30, 2017 2016 Rupees in ‘000’
CASH FLOWS FROM OPERATING ACTIVITIES Profit before taxation 5,279,686 6,039,707 Less: Dividend income (59,816) (42,406) 5,219,870 5,997,301 Adjustments for: Depreciation on property and equipment 578,295 507,298 Depreciation on non banking assets acquired in satisfaction of claims 65,315 82,861 Depreciation on ijarah assets under IFAS - 2 237,274 53,332 Amortization on intangible assets 18,604 17,584 Amortization of premium on debt securities 637,018 513,157 Unrealized (gain) / loss on revaluation of investments classified as held for trading (1,470) 11,668 Provision against non-performing loans and advances - net 1,944,629 883,713 Provision for diminution in the value of investments - net 45,941 90,261 Provision for employees compensated absences 20,150 7,003 Provision for gratuity 119,465 58,026 Provision against other assets 35,875 30,042 Reversal of provision against off balance sheet obligations - (453,394) Net profit on sale of property and equipment (19,758) (17,295) Net profit on sale of non-banking assets acquired in satisfaction of claims (12,175) - Gain on sale and redemption of securities - net (1,301,673) (2,013,748)
2,367,490 (229,492) 7,587,360 5,767,809 (Increase) / Decrease in operating assets: Lendings to financial institutions 2,063,507 (2,311,980) Net investments in held for trading securities (6,018,612) (22,012,764) Advances - net (39,446,797) (23,040,684) Other assets - net (1,064,023) 6,568,467
(44,465,925) (40,796,961)Increase / (Decrease) in operating liabilities: Bills payable (609,636) 1,615,578 Borrowings from financial institutions 8,416,545 2,671,518 Deposits and other accounts 51,983,835 45,503,399 Other liabilities 1,146,396 529,816
60,937,140 50,320,311 24,058,575 15,291,159 Income tax paid (1,902,387) (826,082)Net cash flow from operating activities 22,156,188 14,465,077

32 THE BANK OF PUNJAB GROUP
Nine Months Ended September 30, September 30, 2017 2016
Rupees in ‘000’
CASH FLOWS FROM INVESTING ACTIVITIES Net investments in available for sale securities (23,143,335) (23,877,417)Net investments in held to maturity securities - 15,000,000 Dividend received 50,346 53,199 Investments in operating fixed assets (927,576) (563,293)Sale proceeds of property and equipment disposed-off 117,000 22,397 Sale proceeds of non-banking assets disposed-off 280,750 -
Net cash used in investing activities (23,622,815) (9,365,114) CASH FLOWS FROM FINANCING ACTIVITIES Redemption of subordinated term finance certificates (500) - Issue of right shares at premium during the period 6,062,950 - Right share issue cost (231,181) -
Net cash flow from financing activities 5,831,269 - Net increase in cash and cash equivalents 4,364,642 5,099,963 Cash and cash equivalents at beginning of the period 39,437,081 30,627,855 Cash and cash equivalents at end of the period 43,801,723 35,727,818 Cash and cash equivalents: Cash and balances with treasury banks 33,453,616 30,796,480 Balances with other banks 5,805,268 4,931,537 Call money lendings 4,581,951 - Overdrawn nostro accounts (39,112) (199) 43,801,723 35,727,818 The annexed notes from 1 to 21 and Annexure - I form an integral part of this consolidated condensed interim financial information.
President Director

33Third Quarterly Report January - September 2017
Pr
esid
ent
Dire
ctor
Rev
enue
C
apita
l Res
erve
Rese
rve
S
hare
Sh
are
Dis
coun
t on
Sta
tuto
ry
Sha
re
Una
ppro
pria
ted
T
otal
cap
ital
depo
sit
is
sue
of
rese
rve
p
rem
ium
p
rofit
/
m
oney
sh
ares
(a
ccum
ulat
ed
lo
sses
)
R
u p
e e
s
i n
‘
000’
Ba
lanc
e as
at J
anua
ry 1
, 201
6 1
5,55
1,13
2
7,0
00,0
00
(263
,158
) 2
,291
,119
3
7,88
2
(5,2
20,8
53)
19,
396,
122
To
tal c
ompr
ehen
sive
inco
me
for t
he n
ine
mon
ths
ende
d Se
ptem
ber 3
0, 2
016
-
-
-
-
-
3,9
34,3
35
3,9
34,3
35
Tran
sfer
from
sur
plus
on
reva
luat
ion
of fi
xed
asse
ts to
una
ppro
priat
ed p
rofit
/
(acc
umul
ated
loss
es) -
net
of t
ax
-
-
-
-
-
40,
979
4
0,97
9 Tr
ansf
er to
una
ppro
priat
ed p
rofit
/ (a
ccum
ulat
ed lo
sses
) -
-
-
(2
,000
,000
) -
2
,000
,000
-
Bala
nce
as a
t Sep
tem
ber 3
0, 2
016
15,
551,
132
7
,000
,000
(2
63,1
58)
291
,119
3
7,88
2
754
,461
2
3,37
1,43
6
Tota
l com
preh
ensiv
e in
com
e fo
r the
thre
e m
onth
s en
ded
Dece
mbe
r 31,
201
6 -
-
-
-
-
8
64,9
65
864
,965
Tr
ansf
er fr
om s
urpl
us o
n re
valu
atio
n of
fixe
d as
sets
to u
napp
ropr
iated
pro
fit /
(a
ccum
ulat
ed lo
sses
) - n
et o
f tax
-
-
-
-
-
1
3,66
0
13,
660
Tran
sfer
from
sur
plus
on
reva
luat
ion
of n
on b
ankin
g as
sets
to u
napp
ropr
iated
pro
fit /
(a
ccum
ulat
ed lo
sses
) - n
et o
f tax
-
-
-
-
-
2
,513
2
,513
Tr
ansf
er to
sta
tuto
ry re
serv
e -
-
-
9
71,6
72
-
(971
,672
) -
Bala
nce
as a
t Dec
embe
r 31,
201
6 1
5,55
1,13
2
7,0
00,0
00
(263
,158
) 1
,262
,791
3
7,88
2
663
,927
2
4,25
2,57
4
Tota
l com
preh
ensiv
e in
com
e fo
r the
nin
e m
onth
s en
ded
Sept
embe
r 30,
201
7 -
-
-
-
-
3,
156,
935
3
,156
,935
Tran
sfer
from
sur
plus
on
reva
luat
ion
of fi
xed
asse
ts to
una
ppro
priat
ed p
rofit
- ne
t of t
ax
-
-
-
-
-
38,
587
3
8,58
7 Tr
ansf
er fr
om s
urpl
us o
n re
valu
atio
n of
fixe
d as
sets
to
unap
prop
riate
d pr
ofit o
n di
spos
al -
-
-
-
-
6
9,04
2
69,
042
Tran
sfer
from
sur
plus
on
reva
luat
ion
of n
on b
ankin
g as
sets
to u
napp
ropr
iated
pro
fit -
net o
f tax
-
-
-
-
-
1
,785
1
,785
Tr
ansf
er fr
om s
urpl
us o
n re
valu
atio
n of
non
ban
king
asse
ts to
una
ppro
priat
ed p
rofit
on
disp
osal
-
-
-
-
-
8,0
66
8,0
66
Issue
of r
ight
sha
res
at p
rem
ium
dur
ing
the
perio
d
10,
885,
792
(7
,000
,000
) -
-
2
,177
,158
-
6
,062
,950
Ri
ght s
hare
issu
e co
st
-
-
-
-
-
(231
,181
) (2
31,1
81)
Ba
lanc
e as
at S
epte
mbe
r 30,
201
7 2
6,43
6,92
4
-
(263
,158
) 1
,262
,791
2
,215
,040
3,
707,
161
3
3,35
8,75
8
The
anne
xed
note
s fro
m 1
to 2
1 an
d An
nexu
re -
I for
m a
n in
tegr
al pa
rt of
this
cons
olid
ated
con
dens
ed in
terim
fina
ncial
info
rmat
ion.
Co
nso
lidat
ed C
on
den
sed
Inte
rim
Sta
tem
ent o
f Ch
ange
s in
Equ
ity
(Un
-au
dit
ed)
For t
he
Nin
e M
on
ths
En
ded
Sep
tem
ber 3
0, 2
017

34 THE BANK OF PUNJAB GROUP
1. STATUS AND NATURE OF BUSINESS
1.1 The Bank of Punjab Group comprises The Bank of Punjab (the Bank) and Punjab Modaraba Services (Private) Limited. The Bank of Punjab (the Bank) was constituted pursuant to The Bank of Punjab Act, 1989 and was given the status of a scheduled bank by the State Bank of Pakistan (SBP) on September 19, 1994. The Bank is principally engaged in commercial banking and related services with its registered office at BOP Tower, 10-B, Block E-2, Main Boulevard, Gulberg III, Lahore. The Bank operates 465 branches including 04 sub branches and 53 Islamic banking branches (2016: 453 branches including 03 sub branches and 48 Islamic banking branches) in Pakistan and Azad Jammu and Kashmir as at the period end. The Bank is listed on Pakistan Stock Exchange. The majority shares of the Bank are held by Government of the Punjab (GoPb).
Punjab Modaraba Services (Private) Limited is a wholly owned subsidiary of the Bank and is primarily engaged in the business floating and managing modarabas.
1.2 As at September 30, 2017, paid-up capital, reserves (net of losses) including share deposit money, as allowed by SBP, of the Group amounts to Rs. 33,358,758 thousand. The Capital Adequacy Ratio (CAR) also remained above the required level. As at the close of the period, net advances aggregating to Rs. 14,312,867 thousand (December 31, 2016: Rs. 17,486,964 thousand) requiring additional provision of Rs. 13,317,361 thousand (December 31, 2016: Rs. 16,462,689 thousand) there against have not been subjected to provisioning criteria as prescribed in SBP prudential regulations in view of the relaxation provided by SBP till December 31, 2017 vide letter No.OSED/Div-01/SEU-03/010(01)-2017/005967 dated March 09, 2017, on the basis of two Letters of Comfort (LOCs) issued by the GoPb as explained in below paragraph.
The GoPb being the majority shareholder, has issued two LOCs on behalf of the Bank, undertaking to inject necessary funds to make good the capital shortfall to the satisfaction of SBP up to a maximum amount of Rs. 3,580,000 thousand (net of tax @ 35%) and Rs. 10,570,000 thousand (net of tax @ 35%) within a period of 90 days after close of the year ending December 31, 2018 if the Bank fails to make provision of Rs. 21,770,000 thousand or if there is a shortfall in meeting the prevailing regulatory capital requirements as a result of the said provisioning. In addition, in terms of aforesaid LOCs, the GoPb being majority shareholder and sponsor of the Bank, has also extended its commitment to support and assist the Bank in ensuring that it remains compliant with the regulatory requirements at all times.
SBP vide above referred letter advised the Bank to record provisioning against exposures covered under LOCs in a staggered manner as follows:
• Staggering of provision at an aggregate rate of 25%, i.e.12.5% by June 30, 2017 and additional 12.5% by December 31, 2017 against exposure covered under LOCs as of December 31, 2016. The condition of recording of provision of 12.5 % by June 30, 2017 has been complied with by the Bank along with proportionate charge required up till September 30, 2017.
• Going forward, exposure covered under LOCs at the beginning of 2018 would be subject to 25% provision staggering by June 30, 2018 and remaining balance by December 31, 2018.
On the basis of enduring support of GoPb and the arrangements as outlined above, the Board is of the view that the Bank would have adequate resources to continue its business on a sustainable basis in the foreseeable future.
2. STATEMENT OF COMPLIANCE
2.1 This consolidated condensed interim financial information has been prepared in accordance with the directives issued by the SBP, requirements of the Bank of Punjab Act, 1989, the Banking Companies Ordinance, 1962, the Companies Ordinance, 1984 (repealed - note 2.1.1) and approved accounting standards as applicable in Pakistan. Approved accounting standards comprise of such International Financial Reporting Standards (IFRS) issued by the International Accounting Standard Board and Islamic Financial Accounting Standards (IFAS) issued by the Institute of Chartered Accountants of Pakistan as are notified under the provisions of the Companies Ordinance, 1984 (repealed - note 2.1.1). Wherever the requirements of the directives issued by the SBP and Securities and Exchange Commission of Pakistan (SECP), the Bank of Punjab Act, 1989, the Banking Companies Ordinance, 1962 and the Companies Ordinance, 1984 (repealed - note 2.1.1) differ with the requirements of these standards, the
Notes to the Consolidated Condensed Interim Financial Information (Un-audited)For the Nine Months Ended September 30, 2017

35Third Quarterly Report January - September 2017
requirements of the said directives, the Bank of Punjab Act, 1989, the Banking Companies Ordinance, 1962 and the Companies Ordinance, 1984 (repealed - note 2.1.1) take precedence.
2.1.1 The Companies Ordinance, 1984 has been repealed after the enactment of Companies Act, 2017. However, as allowed by the SECP vide its Circular No. 23 dated October 04, 2017 read with related press release, this consolidated condensed interim financial information has been prepared in accordance with the provisions of the repealed Companies Ordinance, 1984.
2.2 SBP as per BSD Circular No. 10, dated August 26, 2002 has deferred the applicability of International Accounting Standard (IAS) 39, “Financial Instruments: Recognition and Measurement” and International Accounting Standard (IAS) 40, “Investment Property” for banking companies till further instructions. Further, according to the notification of SECP dated April 28, 2008, the IFRS – 7 “Financial Instruments: Disclosures” has not been made applicable for banks. Accordingly, the requirements of these Standards have not been considered in the preparation of this consolidated condensed interim financial information.
2.3 The financial results of Islamic banking business have been consolidated in this consolidated condensed interim financial information for reporting purposes, after eliminating inter-branch transactions / balances. Key financial figures of the Islamic banking business are disclosed in Annexure-I to this consolidated condensed interim financial information.
2.4 The disclosures made in this consolidated condensed interim financial information have, however, been limited based on the format prescribed by the SBP vide BSD Circular letter No. 2 dated May 12, 2004, BSD Circular letter No. 7 dated April 20, 2010 and International Accounting Standard – 34 Interim Financial Reporting. They do not include all of the disclosures required for annual financial statements, and this consolidated condensed interim financial information should be read in conjunction with the annual financial statements of the Group for the year ended December 31, 2016. This consolidated condensed interim financial information is being submitted to the shareholders in accordance with the listing regulations of Pakistan Stock Exchange and Section 245 of the Companies Ordinance, 1984 (repealed).
3. BASIS OF MEASUREMENT
This consolidated condensed interim financial information has been prepared under the historical cost convention, except for revaluation of free hold land and buildings on free hold land, revaluation of non banking assets acquired in satisfaction of claims, valuation of certain investments and commitments in respect of forward exchange contracts at fair value and certain staff retirement benefits at present value.
These consolidated financial statements are presented in Pak Rupees, which is the Group’s functional and presentation currency.
4. SUMMARY OF SIGNIFICANT ACCOUNTING POLICIES, ESTIMATES AND JUDGMENTS
The accounting policies, underlying estimates and judgments and methods of computation followed in the preparation of this consolidated condensed interim financial information are consistent with those applied in the preparation of annual financial statements of the Group for the year ended December 31, 2016.
5. FINANCIAL RISK MANAGEMENT
The financial risk management objectives and policies of the Group are consistent with those disclosed in the annual financial statements of the Group for the year ended December 31, 2016.
(Un-audited) (Audited) September 30, December 31, 2017 2016 Note Rupees in ‘000’ 6. LENDINGS TO FINANCIAL INSTITUTIONS Sukuk Bai - Muajjal 6.1 767,000 - Call money lending 4,581,951 - Reverse repurchase agreement lendings 6.2 366,626 6,162,133 Placements 8,365,000 5,400,000 14,080,577 11,562,133

36 THE BANK OF PUNJAB GROUP
6.1 This represent outright purchase of Government Ijarah Sukuks by SBP on deferred payment basis (Bai-Muajjal) at returns ranging from 5.65 % to 5.75% per annum (2016: Nil).
6.2 Securities held as collateral against lendings to financial institutions
(Un-audited) (Audited) September 30, 2017 December 31, 2016 Held by Further Held by Further group given as Total group given as Total collateral collateral R u p e e s i n ‘ 0 0 0 ’ Market treasury bills 146,626 - 146,626 3,302,133 - 3,302,133 Pakistan investment bonds 220,000 - 220,000 2,860,000 - 2,860,000 366,626 - 366,626 6,162,133 - 6,162,133 Market value of securities held as collateral as at September 30, 2017 amounted to Rs. 371,687 thousand (December 31, 2016: Rs.
6,225,139 thousand). These carry mark-up at the rate of 6.25% per annum (December 31, 2016: 5.90% to 6.25% per annum).
7. INVESTMENTS - NET (Un-audited) (Audited) September 30, 2017 December 31, 2016 Held by Given as Total Held by Given as Total group collateral group collateral Note R u p e e s i n ‘ 0 0 0 ’ Held for trading securities: Market treasury bills 29,316,269 - 29,316,269 23,298,833 - 23,298,833 Available for sale securities: Market treasury bills 126,998,382 27,081,376 154,079,758 80,885,259 9,925,825 90,811,084 Pakistan investment bonds 28,783,533 4,000,472 32,784,005 59,242,027 15,979,961 75,221,988 Ordinary shares / certificates of listed companies and modarabas 1,944,125 - 1,944,125 1,470,307 - 1,470,307 Preference shares 401,739 - 401,739 401,739 - 401,739 Ordinary shares of unlisted company 25,000 - 25,000 25,000 - 25,000 Government of Pakistan ijarah sukuk 5,037,374 - 5,037,374 2,885,472 - 2,885,472 Listed term finance certificates 1,387,358 - 1,387,358 1,193,277 - 1,193,277 Unlisted term finance certificates / sukuks / commercial paper 6,105,166 - 6,105,166 5,954,475 - 5,954,475
170,682,677 31,081,848 201,764,525 152,057,556 25,905,786 177,963,342 Held to maturity securities: Pakistan investment bonds 7.1 252,582 - 252,582 253,867 - 253,867 WAPDA bonds 400 - 400 400 - 400
252,982 - 252,982 254,267 - 254,267 Total investments at cost 200,251,928 31,081,848 231,333,776 175,610,656 25,905,786 201,516,442 Provision for diminution in the value of investments - net (3,063,567) - (3,063,567) (3,025,718) - (3,025,718) Investments net of provision 197,188,361 31,081,848 228,270,209 172,584,938 25,905,786 198,490,724 Surplus on revaluation of available for sale securities 37,772 18,591 56,363 1,264,948 29,857 1,294,805 Deficit on revaluation of held for trading securities 1,470 - 1,470 (1,176) - (1,176) Total investments at market value 197,227,603 31,100,439 228,328,042 173,848,710 25,935,643 199,784,353 7.1 Market value of held to maturity investments is Rs. 259,862 thousand (December 31, 2016: Rs. 263,326 thousand).

37Third Quarterly Report January - September 2017
(Un-audited) (Audited) September 30, December 31, 2017 2016 Note Rupees in ‘000’ 8. ADVANCES - NET Loans, cash credits, running finances, etc. - In Pakistan 268,435,124 237,883,716 Net investment in finance lease - In Pakistan 35,920,719 39,519,683 Net book value of assets in ijarah under IFAS 2 - In Pakistan 858,069 517,073 Islamic financing and related assets 10,033,781 8,419,676 Bills discounted and purchased (excluding treasury bills) -Payable in Pakistan 16,297,417 6,043,018 -Payable outside Pakistan 1,541,278 1,495,896
17,838,695 7,538,914 Advances - gross 333,086,388 293,879,062 Provision for non-performing advances: -Specific 8.1 & 8.2 (33,380,967) (31,462,960) -General 8.3 (415,396) (390,971)
(33,796,363) (31,853,931) Advances - net of provision 299,290,025 262,025,131 8.1 Provision against certain net advances amounting to Rs. 14,312,867 thousand (December 31, 2016:
Rs. 17,486,964 thousand) requiring additional provisioning of Rs. 13,317,361 thousand (December 31, 2016: Rs. 16,462,689 thousand) has not been considered necessary in this consolidated condensed interim financial information on the basis of undertaking given by GoPb as stated in Note 1.2. Further, during the period, in order to meet the SBP’s provision staggering requirement, an additional provision, against exposures covered under LOCS, net off recoveries amounting to Rs. 1,777,966 thousand (December 31, 2016: Rs. 1,143,817 thousand) has been recognized.
8.2 Advances include Rs. 53,696,085 thousand (December 31, 2016: Rs. 54,910,760 thousand) which
have been placed under non-performing status as on September 30, 2017 as detailed below:
September 30, 2017 (Un-audited) Category of classification Domestic Overseas Total Provision Provision Required Held Rupees in ‘000’ Other assets especially mentioned 123,454 - 123,454 4,987 4,987 Substandard 2,162,804 - 2,162,804 235,351 235,351 Doubtful 7,313,355 - 7,313,355 3,495,303 3,495,303 Loss 44,096,472 - 44,096,472 29,645,326 29,645,326
53,696,085 - 53,696,085 33,380,967 33,380,967 December 31, 2016 (Audited) Category of classification Domestic Overseas Total Provision Provision Required Held Rupees in ‘000’ Other assets especially mentioned 337,806 - 337,806 2,042 2,042 Substandard 1,585,906 - 1,585,906 80,564 80,564 Doubtful 7,450,320 - 7,450,320 3,609,147 3,609,147 Loss 45,536,728 - 45,536,728 27,771,207 27,771,207
54,910,760 - 54,910,760 31,462,960 31,462,960
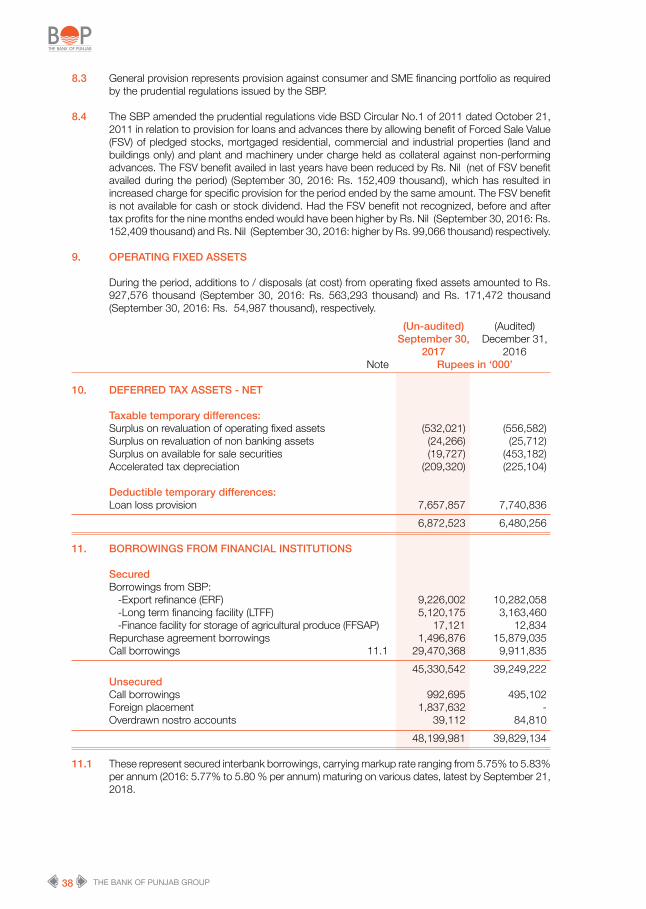
38 THE BANK OF PUNJAB GROUP
8.3 General provision represents provision against consumer and SME financing portfolio as required by the prudential regulations issued by the SBP.
8.4 The SBP amended the prudential regulations vide BSD Circular No.1 of 2011 dated October 21,
2011 in relation to provision for loans and advances there by allowing benefit of Forced Sale Value (FSV) of pledged stocks, mortgaged residential, commercial and industrial properties (land and buildings only) and plant and machinery under charge held as collateral against non-performing advances. The FSV benefit availed in last years have been reduced by Rs. Nil (net of FSV benefit availed during the period) (September 30, 2016: Rs. 152,409 thousand), which has resulted in increased charge for specific provision for the period ended by the same amount. The FSV benefit is not available for cash or stock dividend. Had the FSV benefit not recognized, before and after tax profits for the nine months ended would have been higher by Rs. Nil (September 30, 2016: Rs. 152,409 thousand) and Rs. Nil (September 30, 2016: higher by Rs. 99,066 thousand) respectively.
9. OPERATING FIXED ASSETS During the period, additions to / disposals (at cost) from operating fixed assets amounted to Rs.
927,576 thousand (September 30, 2016: Rs. 563,293 thousand) and Rs. 171,472 thousand (September 30, 2016: Rs. 54,987 thousand), respectively.
(Un-audited) (Audited) September 30, December 31, 2017 2016 Note Rupees in ‘000’
10. DEFERRED TAX ASSETS - NET Taxable temporary differences: Surplus on revaluation of operating fixed assets (532,021) (556,582) Surplus on revaluation of non banking assets (24,266) (25,712) Surplus on available for sale securities (19,727) (453,182) Accelerated tax depreciation (209,320) (225,104) Deductible temporary differences: Loan loss provision 7,657,857 7,740,836 6,872,523 6,480,256 11. BORROWINGS FROM FINANCIAL INSTITUTIONS Secured Borrowings from SBP: -Export refinance (ERF) 9,226,002 10,282,058 -Long term financing facility (LTFF) 5,120,175 3,163,460 -Finance facility for storage of agricultural produce (FFSAP) 17,121 12,834 Repurchase agreement borrowings 1,496,876 15,879,035 Call borrowings 11.1 29,470,368 9,911,835 45,330,542 39,249,222 Unsecured Call borrowings 992,695 495,102 Foreign placement 1,837,632 - Overdrawn nostro accounts 39,112 84,810 48,199,981 39,829,134 11.1 These represent secured interbank borrowings, carrying markup rate ranging from 5.75% to 5.83%
per annum (2016: 5.77% to 5.80 % per annum) maturing on various dates, latest by September 21, 2018.

39Third Quarterly Report January - September 2017
(Un-audited) (Audited) September 30, December 31, 2017 2016 Rupees in ‘000’ 12. DEPOSITS AND OTHER ACCOUNTS
Customers Fixed deposits 145,800,668 129,533,881 Savings deposits 219,230,452 193,301,179 Current accounts - non-remunerative 119,467,564 117,973,360 Sundry deposits, margin accounts, etc. 16,057,290 6,399,769
500,555,974 447,208,189 Financial Institutions Remunerative deposits 2,691,699 4,722,171 Non-remunerative deposits 1,955,902 1,289,380
4,647,601 6,011,551 505,203,575 453,219,740 12.1 Particulars of deposits
In local currency 497,884,560 445,571,885 In foreign currencies 7,319,015 7,647,855 505,203,575 453,219,740
13. SHARE CAPITAL
(Un-audited) (Audited) (Un-audited) (Audited) September 30, December 31, September 30, December 31, 2017 2016 2017 2016 (No. of shares) Rupees in ‘000’ 13.1 Authorized capital Ordinary or preference shares of 5,000,000,000 5,000,000,000 Rs. 10/- each 50,000,000 50,000,000 The authorized capital of the Bank is fifty thousand million rupees divided into five thousand million ordinary or
preference shares of rupees ten each.
13.2 Issued, subscribed and paid up capital
(Un-audited) (Audited) (Un-audited) (Audited) September 30, December 31, September 30, December 31, 2017 2016 2017 2016 (No. of shares) Rupees in ‘000’ Opening balance 519,333,340 519,333,340 Ordinary shares of Rs. 10/- each 5,193,333 5,193,333 paid in cash 526,315,789 526,315,789 Ordinary shares of Rs. 10/- each 5,263,158 5,263,158 issued at discount 509,464,036 509,464,036 Issued as bonus shares 5,094,641 5,094,641 1,555,113,165 1,555,113,165 15,551,132 15,551,132 Movement during the period 1,088,579,215 - Issuance of right shares during the period 10,885,792 -
Closing balance 1,607,912,555 519,333,340 Ordinary shares of Rs. 10/- each paid in cash 16,079,125 5,193,333 526,315,789 526,315,789 Ordinary shares of Rs. 10/- each issued at discount 5,263,158 5,263,158 509,464,036 509,464,036 Issued as bonus shares 5,094,641 5,094,641 2,643,692,380 1,555,113,165 26,436,924 15,551,132

40 THE BANK OF PUNJAB GROUP
13.3 GoPb held 57.47% shares in the Bank as at September 30, 2017 (December 31, 2016: 57.47%). Further, during the period the Bank has issued 1,088,579,215 (70%) right shares at a price of Rs. 12.00 per share including premium of Rs. 2.00 per share.
(Un-audited) (Audited) September 30, December 31, 2017 2016 Rupees in ‘000’
14. SHARE DEPOSIT MONEY Opening balance 7,000,000 7,000,000 Right shares issued during the year (7,000,000) - Closing balance - 7,000,000
15. SURPLUS ON REVALUATION OF ASSETS - NET OF TAX Surplus on revaluation of operating fixed assets 2,037,990 2,141,837 Surplus on non banking assets acquired in satisfaction of claims 614,086 623,453 Surplus on revaluation of available for sale securities 36,636 841,623 2,688,712 3,606,913 16. CONTINGENCIES AND COMMITMENTS 16.1 Direct credit substitutes These include general guarantees of indebtedness, bank acceptance guarantees and standby
letters of credit serving as financial guarantees for loans and securities issued in favor of:
(Un-audited) (Audited) September 30, December 31, 2017 2016 Rupees in ‘000’ Government 86,930 - Financial institutions - - Others 7,208,286 2,209,896 7,295,216 2,209,896 16.2 Transaction related contingent liabilities These include performance bonds, bid bonds, warranties, advance payment guarantees, shipping
guarantees and standby letters of credit related to particular transactions issued in favor of:
(Un-audited) (Audited) September 30, December 31, 2017 2016 Rupees in ‘000’
Government 570,083 601,271 Financial institutions 4,917,707 8,564,597 Others 38,940,854 23,878,852 44,428,644 33,044,720

41Third Quarterly Report January - September 2017
(Un-audited) (Audited) September 30, December 31, 2017 2016 Note Rupees in ‘000’
16.3 Trade related contingent liabilities These include letters of credit issued in favour of: Government 15,348,787 6,719,311 Financial institutions - - Others 19,336,868 20,163,620 34,685,655 26,882,931 16.4 Other contingencies Claims against the Bank not acknowledged as debts 16.4.1 30,008,984 29,750,928 16.4.1 The amount involved in the claims filed against the Bank are yet to be adjudicated by the concerned
courts as the same have been filed as outburst to our recovery suits. Up till now, in no case, any claim has been adjudicated, determined or decreed by the courts against the Bank. Moreover, there is no likelihood of decreeing the suits against the Bank because the claims are frivolous.
16.5 Income tax related contingency For the tax years 2010, 2011 & 2012 Income Tax Department has amended the assessment orders
on the issues of separate taxation of dividend income against which the Bank had filed appeals before the Commissioner Inland Revenue Appeals (CIR(A)). CIR(A) provided relief to the Bank on issue of separate taxation of dividend income. Now, the tax department has filed appeal against the decision of CIR(A) with the Appellate Tribunal Inland Revenue (ATIR). The expected tax liability in respect of aforesaid tax years amounts to Rs. 162,772 thousand. The management of the Bank, as per the opinion of its tax consultant, is confident that the decision for the aforementioned tax years will be decided in Bank’s favour.
The Punjab Modaraba Services (Private) Limited (PMSL) filed a complaint before the Federal Tax
Ombudsman, Lahore (FTO) for the non-issuance of income tax refunds in respect of tax year 2007, 2008 and 2009. Based on the complaint, the FTO recommended the Federal Board of Revenue, through order dated September 23, 2016 to dispose of the Company’s refund claims and pay off compensation, if any, and report compliance within 21 days, which is pending to date.
The PMSL filed the income tax return for the tax year 2013 on January 30, 2014 which was selected
for audit in terms of section 214C of the Ordinance. After the conclusion of the audit proceedings, the Inland Revenue Officer issued his order dated January 20, 2017 and has raised income tax demand amounting to Rs. 4.586 million. Being aggrieved, the Company has filed an appeal with CIR(Appeals), which is pending adjudication.
16.6 Commitments to extend credit The Bank makes commitments to extend credit in the normal course of business but these being
revocable commitments do not attract any significant penalty or expense if the facility is unilaterally withdrawn.
(Un-audited) (Audited) September 30, December 31, 2017 2016 Rupees in ‘000’ 16.7 Commitments in respect of forward exchange contracts Purchase 11,309,530 9,594,731 Sale 6,276,454 6,997,174 17,585,984 16,591,905 16.8 Commitments for the acquisition of operating fixed assets 198,880 27,095

42 THE BANK OF PUNJAB GROUP
17. EARNINGS PER SHARE - BASIC AND DILUTED (Un-audited)
Three Months Nine Months Three Months Nine Months Ended Ended Ended Ended September 30, September 30, September 30, September 30, 2017 2017 2016 2016 Rupees in ‘000’ Profit after taxation (Rupees in thousand) 974,070 3,156,935 1,167,422 3,934,335 Weighted average number of ordinary shares (thousand) 1,854,173 1,854,173 1,555,113 1,555,113 Earnings per share - basic and diluted (Rupees) 0.53 1.70 0.75 2.53 17.1 During the period, the Bank issued (70%) right shares at a price of Rs. 12.00 per share including
premium of Rs. 2.00 per share. However, in the absence of element of bonus, earning per share for comparative period has not been restated.
18. SEGMENT DETAILS WITH RESPECT TO BUSINESS ACTIVITIES
The segment analysis with respect to business activity is as follows:-
Trading & Retail Commercial Payment & Agency Total Sales Banking Banking Settlement Services
Rupees in ‘000’ Nine Months Ended September 30, 2017 (Un-audited) Total income 11,632,319 3,377,177 12,934,548 457,547 91,054 28,492,645 Total expenses 1,094,691 2,988,583 19,129,685 - - 23,212,959 Inter segment transfer (cost) / revenue (5,118,471) 734,336 4,384,135 - - - Income taxes - - - - - 2,122,751
Net income / (loss) 5,419,157 1,122,930 (1,811,002) 457,547 91,054 3,156,935 Segment assets (gross) 280,440,700 51,475,976 311,338,504 - - 643,255,180 Segment non performing advances / investments 3,063,567 2,460,355 51,235,730 - - 56,759,652 Segment specific provision required 3,063,567 1,744,599 31,636,368 - - 36,444,534 Segment liabilities 38,458,393 79,970,742 459,961,241 - - 578,390,376 Segment return on net assets (ROA) (%) 7.24% 10.42% 8.26% Segment cost of funds (%) 5.44% 5.88% 5.66%

43Third Quarterly Report January - September 2017
Trading & Retail Commercial Payment & Agency Total Sales Banking Banking Settlement Services
Rupees in ‘000’
Nine Months Ended September 30, 2016 (Un-audited) Total income 11,523,089 3,303,947 10,657,168 348,443 62,872 25,895,519 Total expenses 1,571,034 2,652,838 15,631,940 - - 19,855,812 Inter segment transfer (cost) / revenue (4,461,117) 659,840 3,801,277 - - - Income taxes - - - - - 2,105,372 Net income / (loss) 5,490,938 1,310,949 (1,173,495) 348,443 62,872 3,934,335 Segment assets (gross) 251,559,530 49,972,096 249,159,191 - - 550,690,817 Segment non performing advances / investments 3,090,694 2,302,301 53,960,026 - - 59,353,021 Segment specific provision required 3,043,307 1,641,848 29,796,726 - - 34,481,881 Segment liabilities 50,475,114 69,732,027 379,255,911 - - 499,463,052 Segment return on net assets (ROA) (%) 8.78% 10.07% 8.95% Segment cost of funds (%) 6.10% 6.37% 5.94% 19. RELATED PARTY TRANSACTIONS
Related parties comprise modaraba floated by the wholly owned subsidiary of the Bank, key
management personnel and entities in which key management personnel are office holders / members. The Group in the normal course of business carries out transactions with various related parties on arm’s length basis. Amounts due from and due to related parties are shown under receivables and payables. In addition key management personnel are paid terminal and short-term terminal benefits.
September 30, 2017 (Un-audited) December 31, 2016 (Audited) Key Modaraba Employee Others Key Modaraba Employee Others management floated by funds management floated by funds personnel the wholly personnel the wholly owned subsidiary owned subsidiary of the Bank of the Bank Rupees in ‘000’ Rupees in ‘000’ Advances Opening balance 121,393 1,035,922 - - 129,294 812,834 - - Loans granted during the period 93,879 579,486 - - 38,064 924,735 - - Repayments received during the period (42,406) (579,275) - - (45,965) (701,647) - -
Closing balance 172,866 1,036,133 - - 121,393 1,035,922 - - Deposits Opening balance 28,732 56,238 2,459,349 51,488 18,572 52,542 2,317,942 262,770 Placements made during the period 422,902 868,279 513,518 5,089,041 305,765 1,155,514 455,520 1,324,912 Withdrawals during the period (419,153) (920,100) (229,870) (4,861,496) (295,605) (1,151,818) (314,113) (1,536,194)
Closing balance 32,481 4,417 2,742,997 279,033 28,732 56,238 2,459,349 51,488 Placements - 400,000 - - - 300,000 - -
September 30, 2017 (Un-audited) September 30, 2016 (Un-audited) Rupees in ‘000’ Rupees in ‘000’ Transactions during the period : Mark-up/return earned 5,402 65,894 - - 5,692 49,593 - - Mark-up/interest expensed 579 - 109,093 3,032 498 - 102,218 338 Contribution to employees funds - - 98,294 - - - 68,515 -

44 THE BANK OF PUNJAB GROUP
19.1 Balances pertaining to parties that were related at the beginning of the period but ceased to be so related during any part of the current period are not reflected as part of the closing balance. The same are accounted for through movement presented above.
19.2 The GoPb holds controlling interest (57.47% shareholding) in the Bank and therefore entities which
are owned and / or controlled by the GoPb, or where the GoPb may exercise significant influence, are related parties of the Bank.
The Bank in the ordinary course of business enters into transaction with Government-related entities.
Such transactions include lending to, deposits from and provision of other banking services to Government-related entities.
As at Statement of Financial Position date the loans and advances, deposits and contingencies
relating to GoPb and its related entities amounted to Rs. 45,365,732 thousand (December 31, 2016: Rs. 40,923,548 thousand), Rs. 268,819,057 thousand (December 31, 2016: Rs. 212,000,928 thousand) and Rs. 27,398,137 thousand (December 31, 2016: Rs. 11,373,982 thousand) respectively. Further, during the period, the Bank has incurred markup expense of Rs. 93,493 thousand (September 30, 2016: Rs. 95,438 thousand) on subordinated loan of Rs. 2,000,000 thousand received from GoPb in year 2014.
20. DATE OF AUTHORIZATION FOR ISSUE This consolidated condensed interim financial information was authorized for issuance on October
25, 2017 by the Board of Directors of the Bank. 21. GENERAL 21.1 The corresponding figures have been reclassified or rearranged, wherever necessary, for the purpose
of comparison. However, no significant reclassification or rearrangement has been made during the period.
21.2 Figures have been rounded off to the nearest thousand, unless otherwise stated.
President Director

45Third Quarterly Report January - September 2017
Annexure - I
The Bank of Punjab GroupIslamic Banking Business - Statement of Financial Position As at September 30, 2017The Bank is operating 53 Islamic banking branches and 02 sub Islamic banking branches at close of September 30, 2017 (December 31, 2016: 48 branches and 02 sub Islamic banking branches).
(Un-audited) (Audited) September 30, December 31, 2017 2016 Note Rupees in ‘000’
ASSETS Cash and balances with treasury banks 2,062,739 2,302,273 Balance with other banks 1,858,666 1,755,658 Due from financial institutions 8,732,000 5,100,000 Investments 7,630,799 5,512,287 Islamic financing and related assets A 10,841,429 8,936,749 Operating fixed assets 252,817 272,007 Deferred tax assets - - Other assets 489,072 251,092
TOTAL ASSETS 31,867,522 24,130,066 LIABILITIES Bills payable 193,739 227,700 Due to financial institutions - - Deposit and other accounts - Current accounts 6,629,237 6,126,472 - Saving accounts 21,104,294 14,680,150 - Term deposits 716,923 813,678 - Others 36,655 225,814 - Deposits from financial institutions - remunerative 82,733 - - Deposits from financial institutions - non - remunerative 3,101 - Due to head office 1,600,836 684,727 Other liabilities 118,669 62,053
30,486,187 22,820,594 NET ASSETS 1,381,335 1,309,472 REPRESENTED BY Islamic banking fund 1,000,000 1,000,000 Reserves - - Unappropriated profit 335,452 230,200
1,335,452 1,230,200 Surplus on revaluation of assets 45,883 79,272 1,381,335 1,309,472 Remuneration to Shariah Advisor / Board 3,854 3,944

46 THE BANK OF PUNJAB GROUP
(Un-audited) (Audited) September 30, December 31, 2017 2016
Note Rupees in ‘000’
CHARITY FUND Opening balance 533 1,871 Additions during the period 221 533 Payments / utilization during the period - (1,871)Closing balance 754 533
A. Islamic financing and related assets Islamic mode of financing A.1 10,841,429 8,936,749 A.1 Islamic mode of financing Financing / Investments / Receivables Running Musharakah 1,781,000 1,651,000 Murabaha 717,929 1,009,083 Diminishing musharaka 5,505,011 4,618,083 Istisna 1,979,420 1,141,510 Ijarah 858,069 517,073 10,841,429 8,936,749

47Third Quarterly Report January - September 2017
Annexure - I
The Bank of Punjab GroupIslamic Banking Business - Profit and Loss Account For the Nine Months Ended September 30, 2017 (Un-audited)
Three Months Nine Months Three Months Nine Months Ended Ended Ended Ended September 30, September 30, September 30, September 30, 2017 2017 2016 2016 (Rupees in thousand) Profit / Return earned on financing, investment and placements 487,993 1,314,512 299,765 740,654 Return on deposits and other dues expensed 182,504 455,492 94,482 220,784
Net spread earned 305,489 859,020 205,283 519,870 Provision against non-performing advances 50,421 50,421 - - Provision against consumer financings - - - - Provision for diminution in the value of investments - - - - Bad debts written off directly - - - -
50,421 50,421 - -
Income after provisions 255,068 808,599 205,283 519,870 Other income Fee, commission and brokerage income 4,003 17,975 2,636 11,731 Dividend income - - - - (Loss) / Income from dealing in foreign currencies 840 865 (177) (155) Gain on sale and redemption of securities - - - - Unrealized gain / (loss) on revaluation of investments classified as held for trading - - - - Other income 8,020 24,400 4,108 18,295
Total other income 12,863 43,240 6,567 29,871
267,931 851,839 211,850 549,741 Other expenses Administrative expenses 289,261 746,587 174,965 470,807 Other provisions/write offs/reversals - - - - Other charges - - - 19
Total other expenses 289,261 746,587 174,965 470,826 (21,330) 105,252 36,885 78,915 Extra ordinary / unusual items - - - -
PROFIT BEFORE TAXATION (21,330) 105,252 36,885 78,915

48 THE BANK OF PUNJAB GROUP

Head O�ceBOP Tower, 10-B block E/II,Main boulevard, Gulberg-III, LahoreUAN: 111-200-100www.bop.com.pk
BetterSTRONGERTogether