BETTER RETURNS PROGRAMME
64
1 Feeding the Ewe A manual for consultants, vets and producers BETTER RETURNS PROGRAMME
Transcript of BETTER RETURNS PROGRAMME
1
Feeding the EweA manual for consultants, vets and producers
BETTER RETURNS PROGRAMME
2
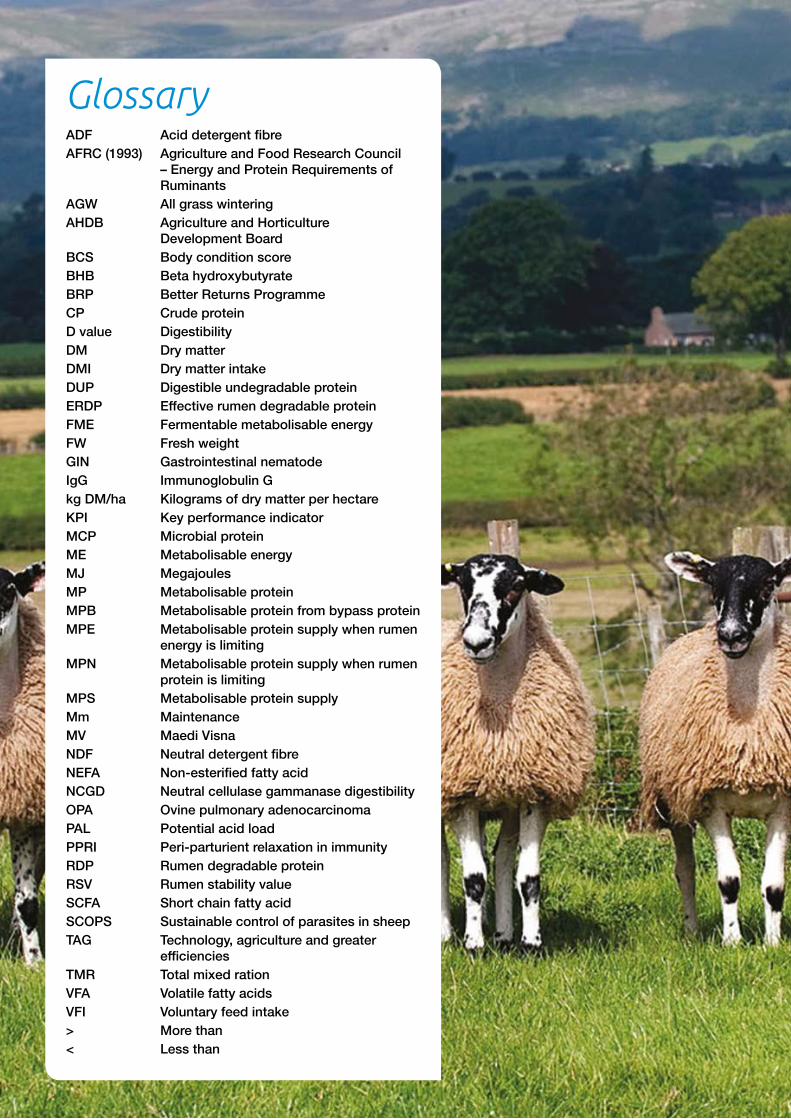
GlossaryADF AciddetergentfibreAFRC (1993) Agriculture and Food Research Council
– Energy and Protein Requirements of Ruminants
AGW All grass winteringAHDB Agriculture and Horticulture Development BoardBCS Body condition scoreBHB BetahydroxybutyrateBRP Better Returns ProgrammeCP Crude proteinDvalue DigestibilityDM Dry matterDMI Dry matter intakeDUP DigestibleundegradableproteinERDP EffectiverumendegradableproteinFME FermentablemetabolisableenergyFW Fresh weightGIN Gastrointestinal nematodeIgG ImmunoglobulinGkg DM/ha Kilograms of dry matter per hectareKPI Key performance indicatorMCP MicrobialproteinME MetabolisableenergyMJ MegajoulesMP MetabolisableproteinMPB MetabolisableproteinfrombypassproteinMPE Metabolisableproteinsupplywhenrumen
energy is limitingMPN Metabolisableproteinsupplywhenrumen
protein is limitingMPS MetabolisableproteinsupplyMm MaintenanceMV Maedi VisnaNDF NeutraldetergentfibreNEFA Non-esterifiedfattyacidNCGD NeutralcellulasegammanasedigestibilityOPA Ovine pulmonary adenocarcinomaPAL Potential acid loadPPRI Peri-parturient relaxation in immunityRDP RumendegradableproteinRSV RumenstabilityvalueSCFA Short chain fatty acidSCOPS SustainablecontrolofparasitesinsheepTAG Technology, agriculture and greater efficienciesTMR Total mixed rationVFA Volatile fatty acidsVFI Voluntary feed intake> More than< Less than
3
Foreword
This manual was commissioned by AHDB Beef & Lamb to update the highly regarded ‘Feeding the Ewe’ booklet that was published by the MLC in 1988. It has been written by Gill Povey, Lesley Stubbings and Kate Phillips and is intended for use by consultants, vets and progressive sheep producers. Cost effective feeding systems that support optimum output are paramount to the profitability of a breeding flock. The overriding objective of the authors was to ensure that the potential contribution of grazed and conserved forage is maximised to ensure both minimal cost and optimal rumen function. Over the last 30 years our knowledge of the nutritional requirements and management of sheep has improved. Most notably in 1993, the AFRC published energy and protein requirements based on a system that calculates microbial protein production rather than relying on crude protein and digestible crude protein.
There have also been changes in the genetics of our sheep and management systems, and our ability to measure responses has been vastly enhanced with the introduction of electronic identification (EID) and associated recording. Before writing this document a full literature review was conducted and this is available on the AHDB website beefandlamb.ahdb.org.uk.The AHDB KPI project also underlines the huge importance of Body Condition Scoring (BCS) when considering the nutrition and performance of ewes. Preliminary data suggest that the impact of BCS and changes in BCS are highly significant and much longer term than previously thought. As more results become available this manual will be updated.
Dr Gill PoveyLesley Stubbings
OBE FRAgsKate Phillips
Contents 2 Glossary
4 Chapter 1: Introduction
7 Chapter 2: Principles of ruminant nutrition
15 Chapter 3: Feeding period: weaning to mating
20 Chapter 4: Feeding period: mating to the end of third month of pregnancy (day 0 to 90)
24 Chapter5: Feedingperiod:finaltwomonthsofpregnancy(day90to145)
44 Chapter 6: Feeding period: lambing to weaning (lactation)
52 Chapter 7: Feeding the replacement ewe
57 Appendix 1: Feed intakes – a guide for twin-bearing ewes
57 Appendix2: Relativefeedvaluesofstraightfeedstuffs
58 Appendix 3: Feed database – proximate analysis
59 Appendix 4: Body condition scoring
59 Appendix5: Therole,effectofdeficiencyandrequirementsforkeyvitamins
60 Appendix 6: Guide to estimated ewe mature liveweight by UK breed
61 Appendix7: Theroleofindividualmineralelements,theeffectofdeficiencyandrequirements
62 Appendix 8: Interpreting silage analysis
Photography: Beltex Sheep Society, Kelvin Cave, Kate Phillips, Lesley Stubbings, NADIS, North Country Mule Society, Swaledale Sheep Society.
4
1.1Objectivesofewenutrition
It is important to consider the longer-term impacts of nutrition, the foetal stage to first mating and the longer-term effects of ewe body condition score (BCS) within and between production cycles.The objectives of ewe nutrition are to:
● Optimise conception rate and embryo survival ● Increase lamb numbers and improve survival rate ● Produce stronger, more viable lambs ● Ensure good quality and quantity of colostrum and
milk ● Optimise lamb growth rate and the weight of lamb
weaned per ewe ● Finish lambs when they are growing most efficiently ● Ensure ewes are healthy and to minimise losses ● Reduce flock replacement costs ● Improve flock profitability
The most cost-effective way to meet the nutrient requirements of the ewe is to maximise the contribution of forage, including grazed and conserved grass, brassicas and roots. When nutrient demands are high, the best quality forage should be offered, as this will maximise intake and reduce the need for supplementation.Nutrition influences ewe productivity at all levels and stages. Both underfeeding and overfeeding have potential negative impacts on productivity, so it is essential to have a thorough understanding of nutrient requirements and the practical application of rationing.
1.2KeyperformanceindicatorsandprofitabilityMonitoring key performance indicators (KPIs) can help sheep producers benchmark performance compared with previous years and other similar flocks. KPIs are important to guide decisions to maximise the profitability of the flock by showing where improvements can be made, as well as monitoring the cost-effectiveness of any changes made. AHDB Beef & Lamb, Sheep BRP Manual 4 – Managing ewes for Better Returns lists the key data to collect and suggests calculating the following KPIs:
● Ewe to ram ratio – number of ewes each ram serves – target more than 60 ● Scanning percentage ● Empty ewes at pregnancy scanning – target less than 2% ● Lambs born alive per 100 ewes put to the ram ● Lambs turned out per 100 ewes put to the ram ● Lambs reared per 100 ewes put to the ram ● Ewe mortality – target less than 4% ● Lamb losses from scanning to weaning – target less than 15% ● Lamb eight week and weaning (90 days) weight
The AHDB cost of production publications gives figures for different systems to compare performance. A sheep KPI calculator is available in tools in the Better Returns Programme Section of the AHDB Beef & Lamb website at beefandlamb.ahdb.org.uk
Chapter 1: Introduction
Good nutrition is fundamental to ewe performance through all stages of the production cycle, with nutrientrequirementschangingthroughtheyear
5
1.3Theimportanceofbodyconditionscoring
Body condition scoring is a vital tool in nutrition planning. It is also a predictor of ewe and lamb performance
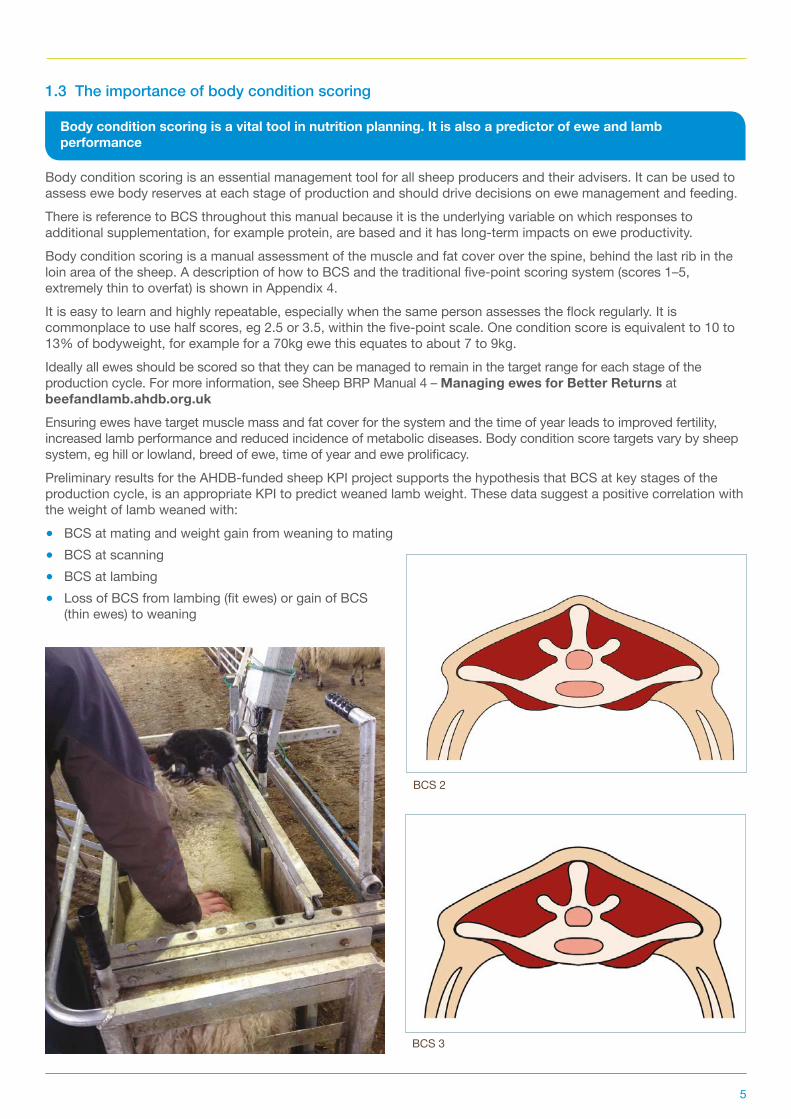
Body condition scoring is an essential management tool for all sheep producers and their advisers. It can be used to assess ewe body reserves at each stage of production and should drive decisions on ewe management and feeding. There is reference to BCS throughout this manual because it is the underlying variable on which responses to additional supplementation, for example protein, are based and it has long-term impacts on ewe productivity.Body condition scoring is a manual assessment of the muscle and fat cover over the spine, behind the last rib in the loin area of the sheep. A description of how to BCS and the traditional five-point scoring system (scores 1–5, extremely thin to overfat) is shown in Appendix 4. It is easy to learn and highly repeatable, especially when the same person assesses the flock regularly. It is commonplace to use half scores, eg 2.5 or 3.5, within the five-point scale. One condition score is equivalent to 10 to 13% of bodyweight, for example for a 70kg ewe this equates to about 7 to 9kg. Ideally all ewes should be scored so that they can be managed to remain in the target range for each stage of the production cycle. For more information, see Sheep BRP Manual 4 – Managing ewes for Better Returns at beefandlamb.ahdb.org.ukEnsuring ewes have target muscle mass and fat cover for the system and the time of year leads to improved fertility, increased lamb performance and reduced incidence of metabolic diseases. Body condition score targets vary by sheep system, eg hill or lowland, breed of ewe, time of year and ewe prolificacy.Preliminary results for the AHDB-funded sheep KPI project supports the hypothesis that BCS at key stages of the production cycle, is an appropriate KPI to predict weaned lamb weight. These data suggest a positive correlation with the weight of lamb weaned with:
● BCS at mating and weight gain from weaning to mating ● BCS at scanning ● BCS at lambing ● Loss of BCS from lambing (fit ewes) or gain of BCS
(thin ewes) to weaning
BCS 2
BCS 3
6
1.4Contributionofgrazing
Grazingmanagementshouldaimtomatchsheeprequirements.Supplementsshouldonlybeprovided tofillanypredictedgaps
Grass is the most important feed resource in sheep production in the UK, providing over 90% of the energy and protein requirements in most sheep systems. Grass is also the most economic feed throughout the year and can typically supply 11.5 megajoules per kg dry matter (MJ/kg DM) of metabolisable energy (ME) and 17% crude protein. However, its management and utilisation is often overlooked.Well-managed grassland provides high yields of dry matter (DM) of high digestibility per hectare, with differences in yield of more than two tonnes of dry matter per ha (DM/ha) between lax and controlled management regimes.
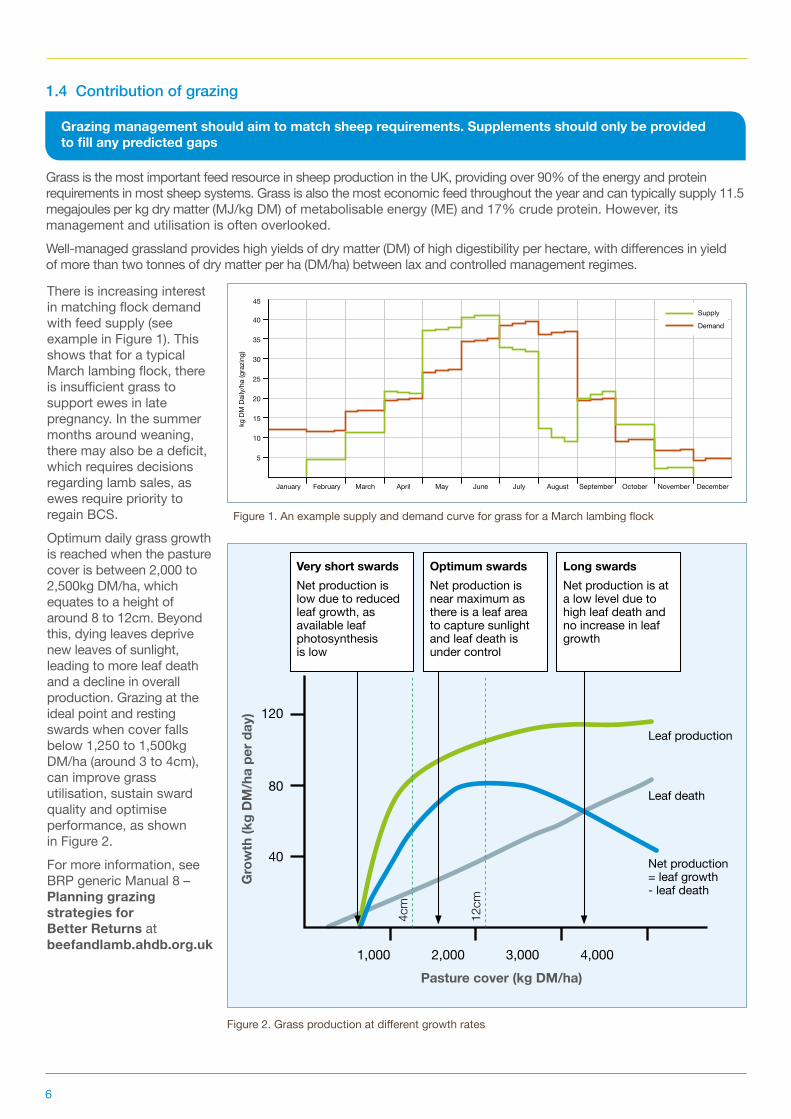
There is increasing interest in matching flock demand with feed supply (see example in Figure 1). This shows that for a typical March lambing flock, there is insufficient grass to support ewes in late pregnancy. In the summer months around weaning, there may also be a deficit, which requires decisions regarding lamb sales, as ewes require priority to regain BCS.Optimum daily grass growth is reached when the pasture cover is between 2,000 to 2,500kg DM/ha, which equates to a height of around 8 to 12cm. Beyond this, dying leaves deprive new leaves of sunlight, leading to more leaf death and a decline in overall production. Grazing at the ideal point and resting swards when cover falls below 1,250 to 1,500kg DM/ha (around 3 to 4cm), can improve grass utilisation, sustain sward quality and optimise performance, as shown in Figure 2.For more information, see BRP generic Manual 8 – Planning grazing strategies for Better Returns at beefandlamb.ahdb.org.uk
Gro
wth
(kg
DM
/ha
per d
ay)
Pasture cover (kg DM/ha)1,000
120
80
40
2,000 3,000 4,000
Net production = leaf growth - leaf death
Leaf death
Leaf production
Very short swardsNet production is low due to reduced leaf growth, as available leaf photosynthesis is low
Optimum swardsNet production is near maximum as there is a leaf area to capture sunlight and leaf death is under control
Long swardsNet production is at a low level due to high leaf death and no increase in leaf growth
4cm
12cm
Figure 1. An example supply and demand curve for grass for a March lambing flock
January
5
10
15
20
25
30
35
40
45
March May July September NovemberFebruary April June August
Supply
Demand
October December
kg D
M D
aily
/ha
(gra
zing)
Figure 2. Grass production at different growth rates

7
2.1 Rumen function
Good rumen function is fundamental to the health and productivity of the ewe at all stages of the production cycle
Rumen function depends on a mutually beneficial relationship between the animal and the microbial population in its rumen. Feed (mixture of fibre, protein, starch and sugar) is consumed by the animal, digested and fermented by the rumen microbes to produce the short chain fatty acids (SCFA) propionic acid, acetic acid and butyric acid, plus microbial protein, carbon dioxide and methane. Short chain fatty acids are absorbed through the rumen wall and are used by the sheep for energy and the microbial protein is digested and absorbed in the small intestine. The microbes provide the host with energy, protein, vitamins and other nutrients, which are essential for cell maintenance and production. A diagram of the ruminant digestive tract is shown in Figure 3.The digestion process relies on a diverse and stable rumen microbial population. Saliva plays a vital role in this relationship both to dilute the food and ease swallowing. Saliva also buffers the rumen to maintain the optimum pH for microbial fermentation. Copious quantities of saliva, about 10 litres a day in the adult sheep, are produced to maintain a near neutral pH of 5.5 to 6.5 in the rumen. Without saliva, rumen pH would fall to pH 2.5 to 3.0.Rumination, or chewing the cud, is vital for efficient rumen function. It involves food from the rumen being drawn back up the oesophagus to the mouth, where it is chewed again before returning to the rumen. This often occurs when sheep are lying down. The time spent will be proportionate to the fibre content of the diet, the more fibre, the longer the ewe will ruminate.
2.2 Factorsaffecting rumen function
Stablerumenfunctionisimportantforthewell-beingoftheewe.Anychangeinfeedtypeorquantityshould be gradual and feeding should be at the same time each day
To maintain stable rumen function: ● Avoid any sudden changes in food type, eg introduction of concentrates, change of forage or feed quality ● Maintain constant frequency and timing of feeding ● Feed whole grain, rather than crushed or ground cereals to slow fermentation in the rumen. This allows the
microbes more time to digest the starch ● Minimise stress by planning events, such as handling or transportation, to avoid periods of fasting which affect the
microbes ● Maintain good health, eg effective and timely treatment of lameness, because this can lead to periods of low feed
intake or even fasting ● Ensure all ewes have adequate access to feed to reduce the number of ewes overeating and others not having
sufficient food
Chapter 2: Principles of ruminant nutrition
Rumen
Reticulum
Omasum
Caecum
Rectum
Large intestineSmall intestine
Abomasum
Figure 3. The ruminant digestive tract of a mature sheep
8
2.3 EnergyAll feeds have a gross energy value and ruminants are typically rationed on the metabolisable energy system developed by the Agriculture and Food Research Council (AFRC) in 1993. Metabolisable energy is the proportion of the energy available to the animal expressed as:
Metabolisable energy (ME) = gross energy – (energy in faeces + energy in urine + energy in gases)
All feeds have an ME value and a list of some commonly used feeds and their analysis is given in Appendix 3.It is important to recognise the difference between ME and fermentable metabolisable energy (FME) when rationing for sheep. Fermentable metabolisable energy is that part of the ME that is used by the rumen microbes and is linked directly to the production of microbial protein. Energy and protein digestion in ruminants are linked and should not be thought of as separate systems (Figure 5). The microbes use the protein available for digestion in the rumen and FME to produce SCFA, which are absorbed from the rumen and metabolised in the liver to support maintenance and production in the tissues. The extent of energy breakdown and the proportions of SCFA produced are determined by the nature of the food.
● Mature fibrous forages, such as hay, lead to SCFA mixtures in the rumen containing a high proportion of acetic acid ● Less mature forages, eg grass or silage, tend to lead to a higher proportion of propionic acid and a lower proportion
of acetic acid ● The addition of concentrates to a forage-based diet will increase the proportion of propionic acid at the expense of
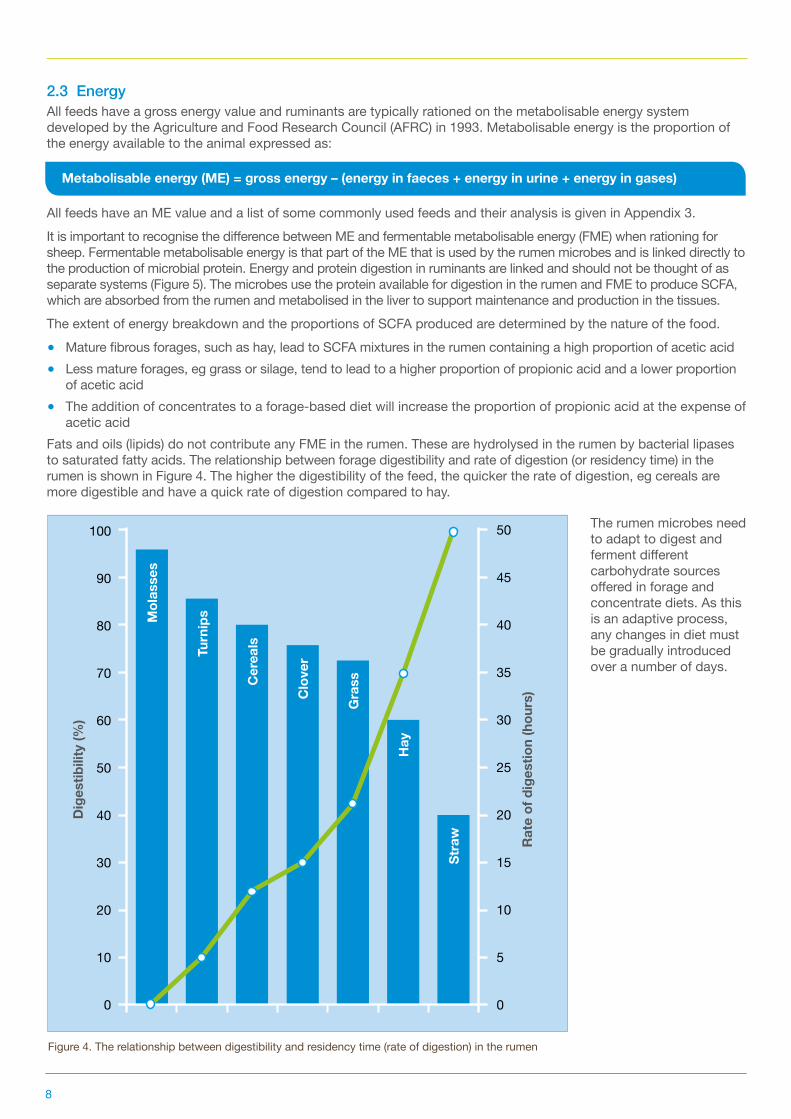
acetic acidFats and oils (lipids) do not contribute any FME in the rumen. These are hydrolysed in the rumen by bacterial lipases to saturated fatty acids. The relationship between forage digestibility and rate of digestion (or residency time) in the rumen is shown in Figure 4. The higher the digestibility of the feed, the quicker the rate of digestion, eg cereals are more digestible and have a quick rate of digestion compared to hay.
Dig
estib
ility
(%)
Mol
asse
s
Turn
ips
Cer
eals
Clo
ver
Gra
ss
Hay
Stra
w
100 50
90 45
80 40
70 35
60 30
50 25
40 20
30 15
20 10
10 5
0 0
Figure 4. The relationship between digestibility and residency time (rate of digestion) in the rumen
Rat
e of
dig
estio
n (h
ours
)The rumen microbes need to adapt to digest and ferment different carbohydrate sources offered in forage and concentrate diets. As this is an adaptive process, any changes in diet must be gradually introduced over a number of days.

9
2.4Themetabolisableproteinsystem(AFRC,1993)
Feed provides two types of crude protein (CP) to the ruminant. Both types of protein are important to the animal: ● Rumen degradable protein (RDP), which is broken down in the rumen. The portion that is used by the microbes to
produce microbial protein is called effective rumen degradable protein (ERDP) ● Digestible undegradable protein (DUP) or bypass protein, which passes through the rumen undigested
Effective rumen degradable protein feeds the microbes in the rumen and DUP is absorbed in the small intestine, supplying the sheep directly with protein. The effective rumen degradable protein is hydrolysed in the rumen to peptides and then to amino acids. The microbes use FME to achieve this and use the nitrogen released to produce microbial protein. Microbial protein (MCP) passes from the rumen to the abomasum and small intestine where it is digested and absorbed, along with DUP. The total protein supply to the ewe is referred to as metabolisable protein (MP) and is the sum of these two sources, with microbial protein (MCP) forming the greater part.
Metabolisable protein (MP) = microbial protein (MCP) + digestible undegradable protein (DUP)
Microbial protein yield in the rumen is a function of the level of feeding and increases as feeding level rises above maintenance. For example, maintenance feeding equals 1.0 (see Table 1) and the MCP yield will be 8.8g per MJ of FME supplied. During lactation, feeding level will increase to 3.0, so the MCP yield will be 10.9g per MJ of FME supplied.Table 1. Level of feeding and microbial protein yield in the rumen (AFRC, 1993)
Level of feeding 1.0 2.0 3.0 3.5
Microbial protein yield (gMCP/MJ of FME) 8.8 9.9 10.9 11.2
Notes: See glossary on page 2 for definitions of abbreviations. In AFRC (1993), level of feeding is referred to as L and microbial protein yield is referred to as y.
Microbial protein (MCP) meets the ewe’s needs for metabolisable protein during most of the production cycle. The exceptions are very late pregnancy and early lactation
ME FME Microbes SCFA
SCFA absorbed across rumen wall into bloodstream
as an energy source
Feed enters rumen
Saliva secreted during rumination to maintain
rumen pH
Lipids/SCFA
FME + RDP leads to microbial growth
Abomasum
EnergyProtein
KEY
Protein
MCP Small intestineDUP
RDP
Figure 5. Energy and protein metabolism in the rumen
10
2.4.1CalculatingmetabolisableproteinsupplyThe MP supplied by a diet is calculated from its ERDP, FME and DUP contents. These vary with the outflow rate of the feed from the rumen, which in turn is influenced by whether the ewe is pregnant or not. Rumen outflow rates appropriate for the physiological state of the ewe and her level of feeding are used to calculate the MP supplied by the feed. For sheep AFRC (1993) uses outflow rates of:
● Low level of feeding (1 x maintenance) = 0.02 (2%) per hour ● Medium feeding levels (up to 2 x maintenance) = 0.05 (5%) per hour ● Current thinking would suggest at higher feeding levels (up to 3 x maintenance) = 0.08 (8%) per hour
Usearumenoutflowrateof0.08(8%)perhourtocalculaterationsforewesinverylatepregnancy and early lactation
These figures mean that 0.02 (2%) to 0.08 (8%) of the total rumen contents leave the rumen each hour. The faster the outflow rate, the lower the degradability of the protein due to the reduced retention time in the rumen. Outflow rate is determined by quantity of feed consumed, type of feed, the degradability of the feed and the stage of production of the sheep. For example, hipro soya bean meal has a DUP content of 140g/kg DM at 0.05 outflow rate; at 0.08 outflow rate this increases to 245g/kg DM. In contrast, the ERDP content falls from 325 at 0.05 to 265g/kg DM at 0.08 outflow rate. See Appendix 3 for more information.
Inlatepregnancy,eweshaveamodifiedmaternaldigestivesystem.Thisincreasestheefficiencywithwhich they utilise protein reaching the small intestine by an estimated 15%. This is not factored into AFRC (1993) and may explain a lack of response to feeding additional protein over and above AFRC recommendations to ewes in good condition in late pregnancy
2.5FactorsaffectingdrymatterintakeThe key factors affecting dry matter intake (DMI) are:
● Forage digestibility – the higher the digestibility of the feed, the higher the intake, because food is broken down more quickly and has a faster rate of passage through the rumen. For example, good grass silage is more digestible and promotes higher intake compared to straw or poor hay
● Chop length of forage – short chop forages tend to have higher intake potential than longer or unchopped material ● Access to feed – feeding space, competition, freshness and quality of feed, timing and frequency of feeding ● Shy feeders – some ewes, especially young animals, will need to be penned separately to ensure they are not
prevented from feeding by older or larger ewes or ensure enough access for ewes to all feed at the same time (when feed not ad-lib)
● Mineral/traceelementdeficiency – for example, deficiencies of phosphorus and cobalt can reduce the activity of the rumen microbes and feed intake
● Rumen turnover rate – in the late stages of pregnancy, the effective volume of the rumen is reduced as the foetuses increase in size. This can lead to a reduction in intake if the diet is based on poorer quality forage. However, with good quality forages, the rate of passage of feed through the rumen increases, so intake does not fall significantly
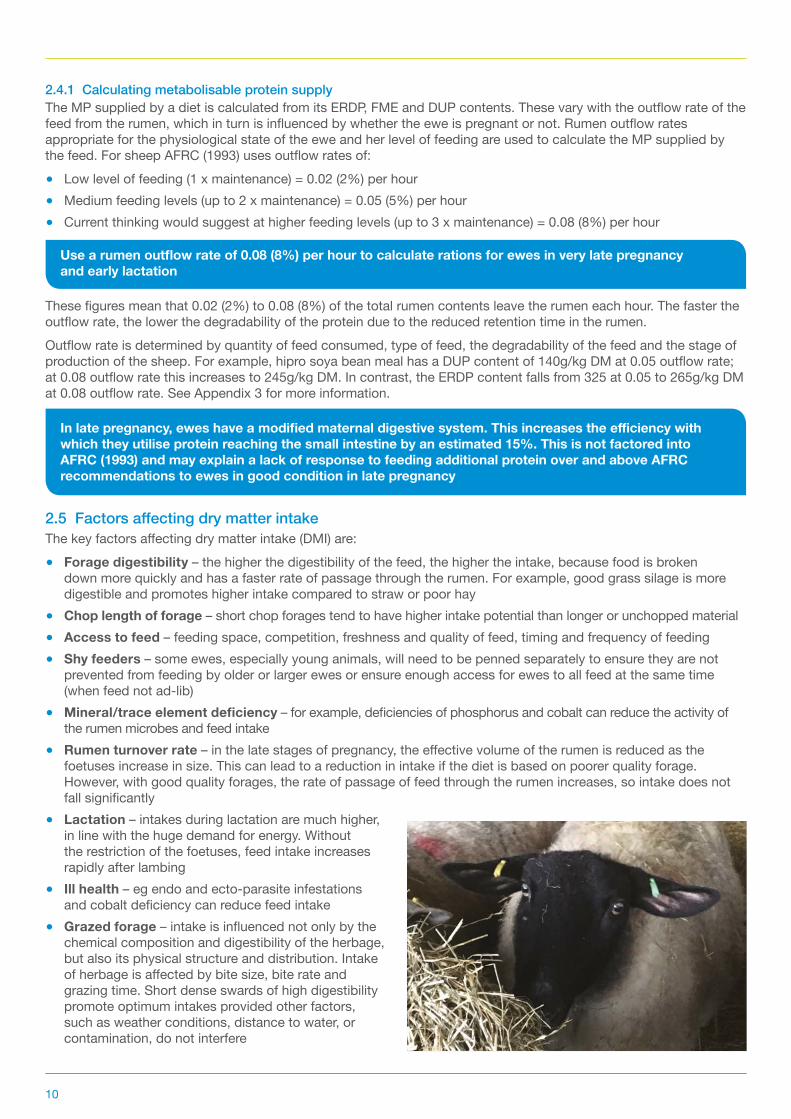
● Lactation – intakes during lactation are much higher, in line with the huge demand for energy. Without the restriction of the foetuses, feed intake increases rapidly after lambing
● Ill health – eg endo and ecto-parasite infestations and cobalt deficiency can reduce feed intake
● Grazed forage – intake is influenced not only by the chemical composition and digestibility of the herbage, but also its physical structure and distribution. Intake of herbage is affected by bite size, bite rate and grazing time. Short dense swards of high digestibility promote optimum intakes provided other factors, such as weather conditions, distance to water, or contamination, do not interfere
11
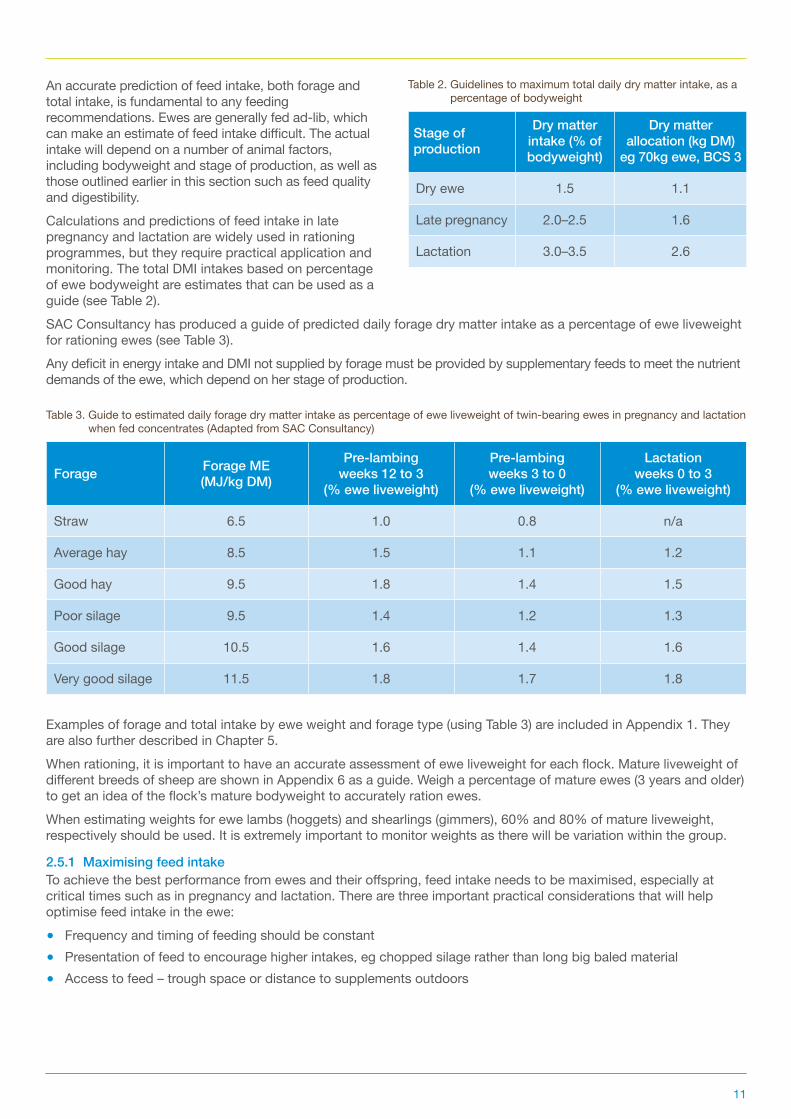
An accurate prediction of feed intake, both forage and total intake, is fundamental to any feeding recommendations. Ewes are generally fed ad-lib, which can make an estimate of feed intake difficult. The actual intake will depend on a number of animal factors, including bodyweight and stage of production, as well as those outlined earlier in this section such as feed quality and digestibility. Calculations and predictions of feed intake in late pregnancy and lactation are widely used in rationing programmes, but they require practical application and monitoring. The total DMI intakes based on percentage of ewe bodyweight are estimates that can be used as a guide (see Table 2).SAC Consultancy has produced a guide of predicted daily forage dry matter intake as a percentage of ewe liveweight for rationing ewes (see Table 3). Any deficit in energy intake and DMI not supplied by forage must be provided by supplementary feeds to meet the nutrient demands of the ewe, which depend on her stage of production. Table 3. Guide to estimated daily forage dry matter intake as percentage of ewe liveweight of twin-bearing ewes in pregnancy and lactation
when fed concentrates (Adapted from SAC Consultancy)
Forage Forage ME (MJ/kg DM)
Pre-lambing weeks 12 to 3
(% ewe liveweight)
Pre-lambing weeks 3 to 0
(% ewe liveweight)
Lactation weeks 0 to 3
(% ewe liveweight)
Straw 6.5 1.0 0.8 n/a
Average hay 8.5 1.5 1.1 1.2
Good hay 9.5 1.8 1.4 1.5
Poor silage 9.5 1.4 1.2 1.3
Good silage 10.5 1.6 1.4 1.6
Very good silage 11.5 1.8 1.7 1.8
Examples of forage and total intake by ewe weight and forage type (using Table 3) are included in Appendix 1. They are also further described in Chapter 5. When rationing, it is important to have an accurate assessment of ewe liveweight for each flock. Mature liveweight of different breeds of sheep are shown in Appendix 6 as a guide. Weigh a percentage of mature ewes (3 years and older) to get an idea of the flock’s mature bodyweight to accurately ration ewes.When estimating weights for ewe lambs (hoggets) and shearlings (gimmers), 60% and 80% of mature liveweight, respectively should be used. It is extremely important to monitor weights as there will be variation within the group.
2.5.1 Maximising feed intakeTo achieve the best performance from ewes and their offspring, feed intake needs to be maximised, especially at critical times such as in pregnancy and lactation. There are three important practical considerations that will help optimise feed intake in the ewe:
● Frequency and timing of feeding should be constant ● Presentation of feed to encourage higher intakes, eg chopped silage rather than long big baled material ● Access to feed – trough space or distance to supplements outdoors
Table 2. Guidelines to maximum total daily dry matter intake, as a percentage of bodyweight
Stage of production
Dry matter intake (% of bodyweight)
Dry matter allocation (kg DM)
eg 70kg ewe, BCS 3
Dry ewe 1.5 1.1
Late pregnancy 2.0–2.5 1.6
Lactation 3.0–3.5 2.6
12
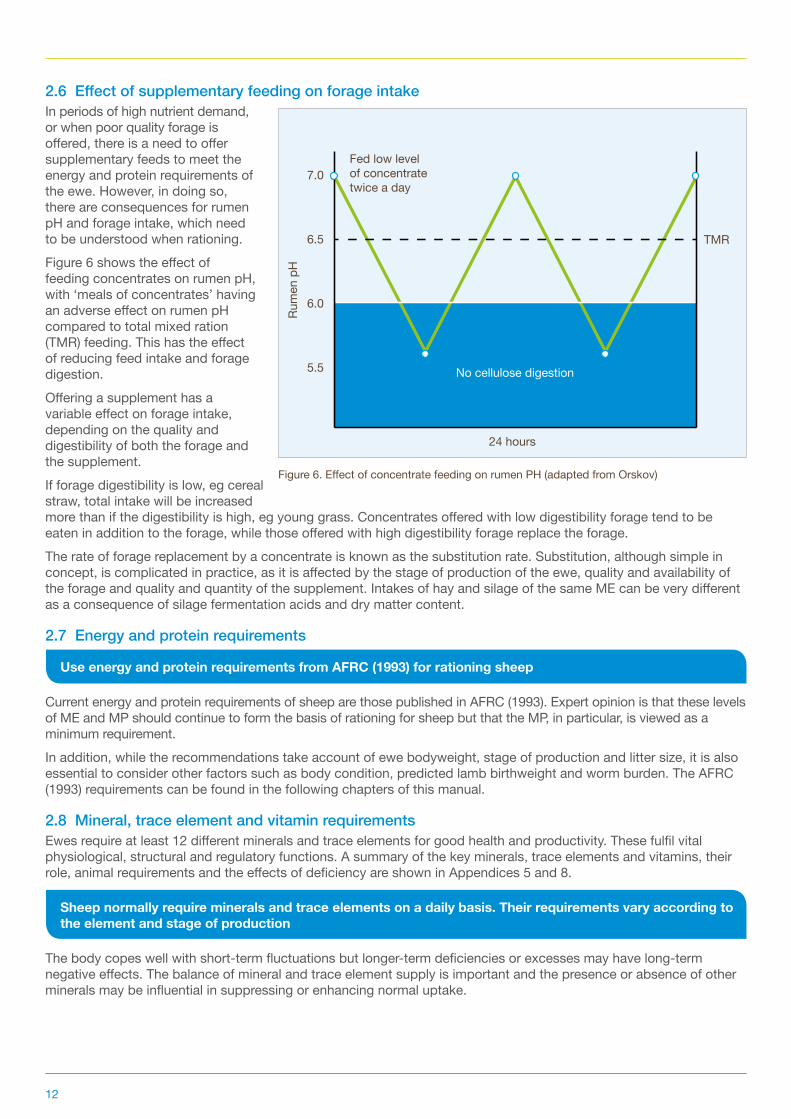
2.6EffectofsupplementaryfeedingonforageintakeIn periods of high nutrient demand, or when poor quality forage is offered, there is a need to offer supplementary feeds to meet the energy and protein requirements of the ewe. However, in doing so, there are consequences for rumen pH and forage intake, which need to be understood when rationing. Figure 6 shows the effect of feeding concentrates on rumen pH, with ‘meals of concentrates’ having an adverse effect on rumen pH compared to total mixed ration (TMR) feeding. This has the effect of reducing feed intake and forage digestion. Offering a supplement has a variable effect on forage intake, depending on the quality and digestibility of both the forage and the supplement. If forage digestibility is low, eg cereal straw, total intake will be increased more than if the digestibility is high, eg young grass. Concentrates offered with low digestibility forage tend to be eaten in addition to the forage, while those offered with high digestibility forage replace the forage. The rate of forage replacement by a concentrate is known as the substitution rate. Substitution, although simple in concept, is complicated in practice, as it is affected by the stage of production of the ewe, quality and availability of the forage and quality and quantity of the supplement. Intakes of hay and silage of the same ME can be very different as a consequence of silage fermentation acids and dry matter content.
2.7 Energy and protein requirements
UseenergyandproteinrequirementsfromAFRC(1993)forrationingsheep
Current energy and protein requirements of sheep are those published in AFRC (1993). Expert opinion is that these levels of ME and MP should continue to form the basis of rationing for sheep but that the MP, in particular, is viewed as a minimum requirement. In addition, while the recommendations take account of ewe bodyweight, stage of production and litter size, it is also essential to consider other factors such as body condition, predicted lamb birthweight and worm burden. The AFRC (1993) requirements can be found in the following chapters of this manual.
2.8 Mineral, trace element and vitamin requirementsEwes require at least 12 different minerals and trace elements for good health and productivity. These fulfil vital physiological, structural and regulatory functions. A summary of the key minerals, trace elements and vitamins, their role, animal requirements and the effects of deficiency are shown in Appendices 5 and 8.
Sheepnormallyrequiremineralsandtraceelementsonadailybasis.Theirrequirementsvaryaccordingtothe element and stage of production
The body copes well with short-term fluctuations but longer-term deficiencies or excesses may have long-term negative effects. The balance of mineral and trace element supply is important and the presence or absence of other minerals may be influential in suppressing or enhancing normal uptake.
Figure 6. Effect of concentrate feeding on rumen PH (adapted from Orskov)
Fed low level of concentrate twice a day
No cellulose digestion
24 hours
Rum
en p
H
7.0
6.5 TMR
6.0
5.5
13
2.8.1 Major minerals
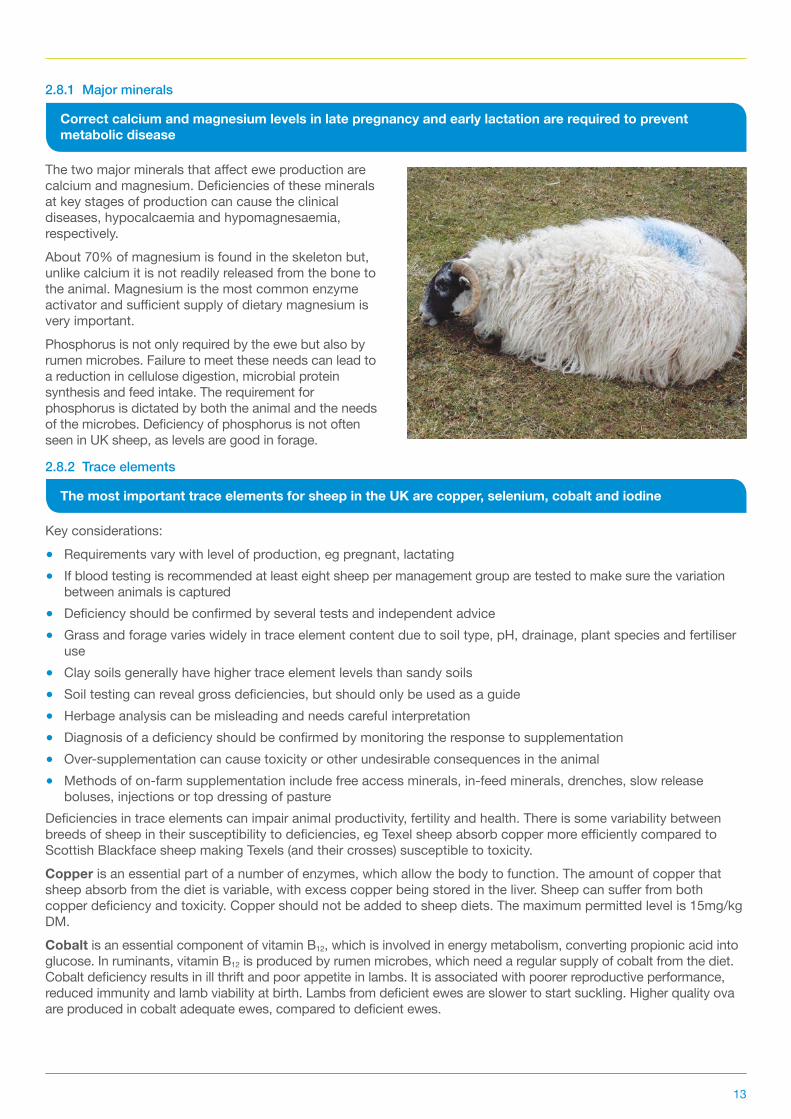
Correctcalciumandmagnesiumlevelsinlatepregnancyandearlylactationarerequiredtopreventmetabolic disease
The two major minerals that affect ewe production are calcium and magnesium. Deficiencies of these minerals at key stages of production can cause the clinical diseases, hypocalcaemia and hypomagnesaemia, respectively.About 70% of magnesium is found in the skeleton but, unlike calcium it is not readily released from the bone to the animal. Magnesium is the most common enzyme activator and sufficient supply of dietary magnesium is very important.Phosphorus is not only required by the ewe but also by rumen microbes. Failure to meet these needs can lead to a reduction in cellulose digestion, microbial protein synthesis and feed intake. The requirement for phosphorus is dictated by both the animal and the needs of the microbes. Deficiency of phosphorus is not often seen in UK sheep, as levels are good in forage.
2.8.2 Trace elements
The most important trace elements for sheep in the UK are copper, selenium, cobalt and iodine
Key considerations: ● Requirements vary with level of production, eg pregnant, lactating ● If blood testing is recommended at least eight sheep per management group are tested to make sure the variation
between animals is captured ● Deficiency should be confirmed by several tests and independent advice ● Grass and forage varies widely in trace element content due to soil type, pH, drainage, plant species and fertiliser
use ● Clay soils generally have higher trace element levels than sandy soils ● Soil testing can reveal gross deficiencies, but should only be used as a guide ● Herbage analysis can be misleading and needs careful interpretation ● Diagnosis of a deficiency should be confirmed by monitoring the response to supplementation ● Over-supplementation can cause toxicity or other undesirable consequences in the animal ● Methods of on-farm supplementation include free access minerals, in-feed minerals, drenches, slow release
boluses, injections or top dressing of pastureDeficiencies in trace elements can impair animal productivity, fertility and health. There is some variability between breeds of sheep in their susceptibility to deficiencies, eg Texel sheep absorb copper more efficiently compared to Scottish Blackface sheep making Texels (and their crosses) susceptible to toxicity.Copper is an essential part of a number of enzymes, which allow the body to function. The amount of copper that sheep absorb from the diet is variable, with excess copper being stored in the liver. Sheep can suffer from both copper deficiency and toxicity. Copper should not be added to sheep diets. The maximum permitted level is 15mg/kg DM. Cobalt is an essential component of vitamin B12, which is involved in energy metabolism, converting propionic acid into glucose. In ruminants, vitamin B12 is produced by rumen microbes, which need a regular supply of cobalt from the diet. Cobalt deficiency results in ill thrift and poor appetite in lambs. It is associated with poorer reproductive performance, reduced immunity and lamb viability at birth. Lambs from deficient ewes are slower to start suckling. Higher quality ova are produced in cobalt adequate ewes, compared to deficient ewes.

14
Iodine is a component of the hormone thyroxine, which controls energy metabolism. It is essential for foetal growth and development. Deficiency is typically associated with an enlarged thyroid, known as a goitre. Typical signs are late abortions, presented as stillborn or weak lambs, and neonatal mortality.Selenium acts with vitamin E to protect tissues against oxidation and breakdown of cell membranes. It is also important for immune function. Animals with adequate levels of selenium and vitamin E show the expected increase in antibodies after vaccination. Suboptimal levels can lead to ineffective vaccination with low antibody response. Requirements for vitamin E and selenium also depend on the level of stress that the ewe is under, which is a reflection of environmental conditions and flock management. An inadequate supply of iodine, cobalt and selenium during pregnancy can have adverse consequences for lamb vigour and mortality. The potential for response depends on several factors, but maternal status for the elements is important. Evidence for responses to supplementation above requirements is either non-existent (for cobalt), adverse in terms of the absorption of colostral immunoglobulins and the acquisition of passive immunity in the newborn lamb (iodine) or has no effect (selenium).Based on current knowledge, the recommended levels of all minerals and trace elements for sheep are shown in Appendix 7, based on AFRC (1991). These levels should be used in practice.For more information, see BRP+ Trace element supplementation of beef cattle and sheep at beefandlamb.ahdb.org.uk
2.8.3 Vitamin requirements
An additional 100mg/day of vitamin E in concentrate feed is recommended
Natural forage-based sheep diets usually contain a good supply of vitamins A, D and E. The B vitamins and vitamin K are synthesised by the rumen microbes. Vitamin C is synthesised in the tissues of the sheep and vitamin A can be stored in the liver for many months. Conversely, vitamin E is poorly stored in the body and a daily intake is required. Generally, diets are only supplemented with vitamins at times of high demand, eg late pregnancy and lactation and when conserved forages and concentrates are offered. Compound feeds generally just contain vitamins A, D and E, then occasionally B vitamins. Appendix 5 shows the role of key vitamins and the effects of deficiency.The publication ARC (1980) ‘The nutrient requirements of ruminant livestock’, is considered to give adequate requirements for vitamins for sheep, with more recent research not giving cause to change these recommendations. This is except for vitamin E, where research has shown supplementation in late pregnancy can improve lamb vigour and viability with an additional 100mg/day of vitamin E in concentrate feed being recommended.
1515
Chapter 3: Feeding period: weaning to mating
SU
MM
AR
Y
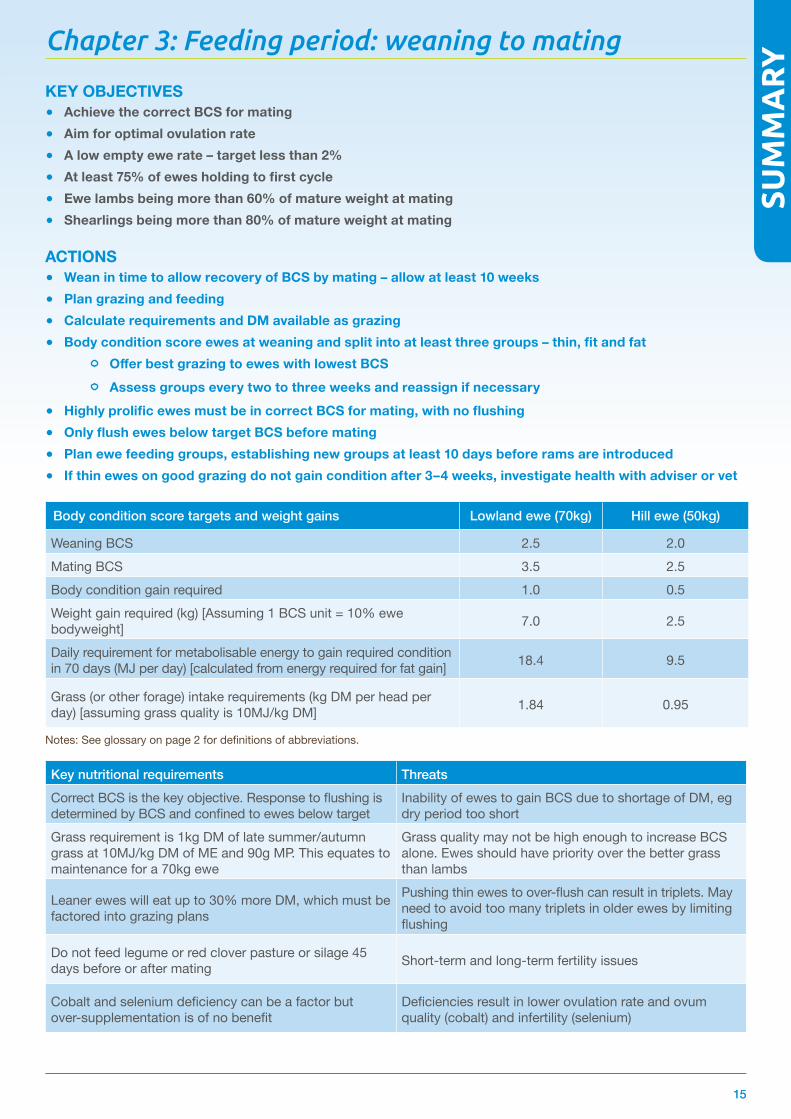
KEY OBJECTIVES ● Achieve the correct BCS for mating ● Aim for optimal ovulation rate ● A low empty ewe rate – target less than 2% ● Atleast75%ofewesholdingtofirstcycle ● Ewe lambs being more than 60% of mature weight at mating ● Shearlings being more than 80% of mature weight at mating
ACTIONS ● Wean in time to allow recovery of BCS by mating – allow at least 10 weeks ● Plan grazing and feeding ● CalculaterequirementsandDMavailableasgrazing ● Bodyconditionscoreewesatweaningandsplitintoatleastthreegroups–thin,fitandfat
OfferbestgrazingtoeweswithlowestBCS
Assess groups every two to three weeks and reassign if necessary ● HighlyprolificewesmustbeincorrectBCSformating,withnoflushing ● OnlyflushewesbelowtargetBCSbeforemating ● Plan ewe feeding groups, establishing new groups at least 10 days before rams are introduced ● If thin ewes on good grazing do not gain condition after 3–4 weeks, investigate health with adviser or vet
Body condition score targets and weight gains Lowland ewe (70kg) Hill ewe (50kg)
Weaning BCS 2.5 2.0Mating BCS 3.5 2.5Body condition gain required 1.0 0.5Weight gain required (kg) [Assuming 1 BCS unit = 10% ewe bodyweight] 7.0 2.5
Daily requirement for metabolisable energy to gain required condition in 70 days (MJ per day) [calculated from energy required for fat gain] 18.4 9.5
Grass (or other forage) intake requirements (kg DM per head per day) [assuming grass quality is 10MJ/kg DM] 1.84 0.95
Notes: See glossary on page 2 for definitions of abbreviations.
Key nutritional requirements ThreatsCorrect BCS is the key objective. Response to flushing is determined by BCS and confined to ewes below target
Inability of ewes to gain BCS due to shortage of DM, eg dry period too short
Grass requirement is 1kg DM of late summer/autumn grass at 10MJ/kg DM of ME and 90g MP. This equates to maintenance for a 70kg ewe
Grass quality may not be high enough to increase BCS alone. Ewes should have priority over the better grass than lambs
Leaner ewes will eat up to 30% more DM, which must be factored into grazing plans
Pushing thin ewes to over-flush can result in triplets. May need to avoid too many triplets in older ewes by limiting flushing
Do not feed legume or red clover pasture or silage 45 days before or after mating Short-term and long-term fertility issues
Cobalt and selenium deficiency can be a factor but over-supplementation is of no benefit
Deficiencies result in lower ovulation rate and ovum quality (cobalt) and infertility (selenium)

16
Other considerations ● Very low BCS at weaning is likely to affect ovulation rate, even if BCS target is reached by mating ● If ewes are below BCS 2 at weaning, explore other reasons such as poor teeth, lameness or ill health, eg Johne’s
disease, ovine pulmonary adenocaricarnoma (OPA) or Maedi Visna (MV) ● Deal with any lameness before rams go in to minimise disruption and optimise conception rate
3.1NutritionaleffectsonovulationrateAs well as the shorter-term effects of nutrition on ovulation rate and fertility in the current season, there are longer-term impacts of poor nutrition on the potential output of a flock for the whole season
3.1.1Effectsonovulationrate
Very low BCS at weaning (<2) has a negative impact on ovulation rate
Nutritional effects on ovulation rate are mediated through a combination of longer-term nutrition as reflected in BCS and current levels of feeding, eg the flushing diet. In most cases, the former should be considered as the most important factor, with the latter acting as an additional tool for those ewes that are in less than ideal BCS in the final run-up to mating.The ewe’s ovary has cycles of follicular development and maturation. There is a longer-term, underlying four to five monthly maturation cycle, which means that nutrition and BCS has an influence on ovulation rate for as much as six months before mating. This can be seen in ewes that are in very low condition, typically BCS 2 or below at weaning, as reported in preliminary results of the sheep KPI project. Despite achieving BCS 3 by mating, these ewes still tend to have a lower than expected scanning result.The implications on flock management are very important. Traditionally, the dry period from weaning to mating is 10 to 12 weeks and it takes six to eight weeks to gain one unit of BCS if ewes are on high-quality grass. Where ewes are lean (BCS less than 2) or resources are limited, there is a need to consider early weaning and prioritisation of the ewe at a much earlier stage. By 12 weeks of age, lambs are not drinking a significant amount of milk from the ewe and if they are offered adequate grazing, they will perform well, if weaned. This not only allows the ewe more than 18 weeks of recovery time, but also encourages better pasture prioritisation and utilisation.
3.1.2 Gaining BCS from weaning to mating
Dry matter intake can be as much as 30% higher in ewes of BCS 2 compared to BCS 3
Ewes should be grouped by BCS at weaning and allocated to an appropriate grazing or supplementary feeding regime. Restriction may be necessary for ewes in high BCS (more than 3.5). Table 4 shows typical ME and DM requirements for lowland and hill type ewes depending on the BCS to be regained from weaning to mating. As well as the energy requirements for maintenance and for weight/BCS gain and the quantity of DM needed to achieve this.
17
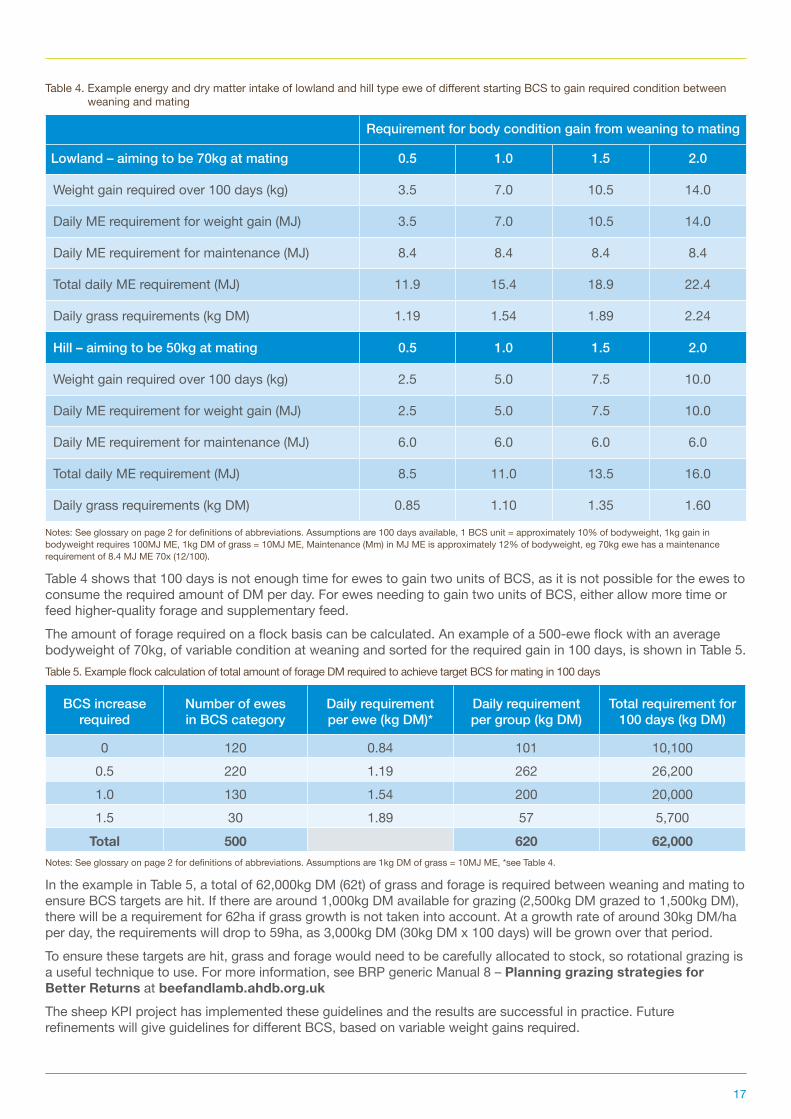
Table 4. Example energy and dry matter intake of lowland and hill type ewe of different starting BCS to gain required condition between weaning and mating
Requirementforbodyconditiongainfromweaningtomating
Lowland–aimingtobe70kgatmating 0.5 1.0 1.5 2.0
Weight gain required over 100 days (kg) 3.5 7.0 10.5 14.0
Daily ME requirement for weight gain (MJ) 3.5 7.0 10.5 14.0
Daily ME requirement for maintenance (MJ) 8.4 8.4 8.4 8.4
Total daily ME requirement (MJ) 11.9 15.4 18.9 22.4
Daily grass requirements (kg DM) 1.19 1.54 1.89 2.24
Hill–aimingtobe50kgatmating 0.5 1.0 1.5 2.0
Weight gain required over 100 days (kg) 2.5 5.0 7.5 10.0
Daily ME requirement for weight gain (MJ) 2.5 5.0 7.5 10.0
Daily ME requirement for maintenance (MJ) 6.0 6.0 6.0 6.0
Total daily ME requirement (MJ) 8.5 11.0 13.5 16.0
Daily grass requirements (kg DM) 0.85 1.10 1.35 1.60
Notes: See glossary on page 2 for definitions of abbreviations. Assumptions are 100 days available, 1 BCS unit = approximately 10% of bodyweight, 1kg gain in bodyweight requires 100MJ ME, 1kg DM of grass = 10MJ ME, Maintenance (Mm) in MJ ME is approximately 12% of bodyweight, eg 70kg ewe has a maintenance requirement of 8.4 MJ ME 70x (12/100).
Table 4 shows that 100 days is not enough time for ewes to gain two units of BCS, as it is not possible for the ewes to consume the required amount of DM per day. For ewes needing to gain two units of BCS, either allow more time or feed higher-quality forage and supplementary feed.The amount of forage required on a flock basis can be calculated. An example of a 500-ewe flock with an average bodyweight of 70kg, of variable condition at weaning and sorted for the required gain in 100 days, is shown in Table 5.Table 5. Example flock calculation of total amount of forage DM required to achieve target BCS for mating in 100 days
BCS increase required
Numberofewes in BCS category
Daily requirement per ewe (kg DM)*
Daily requirement per group (kg DM)
Total requirement for 100 days (kg DM)
0 120 0.84 101 10,1000.5 220 1.19 262 26,2001.0 130 1.54 200 20,0001.5 30 1.89 57 5,700
Total 500 620 62,000Notes: See glossary on page 2 for definitions of abbreviations. Assumptions are 1kg DM of grass = 10MJ ME, *see Table 4.
In the example in Table 5, a total of 62,000kg DM (62t) of grass and forage is required between weaning and mating to ensure BCS targets are hit. If there are around 1,000kg DM available for grazing (2,500kg DM grazed to 1,500kg DM), there will be a requirement for 62ha if grass growth is not taken into account. At a growth rate of around 30kg DM/ha per day, the requirements will drop to 59ha, as 3,000kg DM (30kg DM x 100 days) will be grown over that period. To ensure these targets are hit, grass and forage would need to be carefully allocated to stock, so rotational grazing is a useful technique to use. For more information, see BRP generic Manual 8 – Planning grazing strategies for Better Returns at beefandlamb.ahdb.org.ukThe sheep KPI project has implemented these guidelines and the results are successful in practice. Future refinements will give guidelines for different BCS, based on variable weight gains required.

18
More information regarding the weight differences per unit of BCS will come from the sheep KPI project data. For example, estimates of how much weight one BCS unit represents vary from 10 to 13% of ewe bodyweight to 1kg per 0.2 units in BCS. Indications are that it will vary according to the actual BCS, with more weight associated with a very lean ewe gaining BCS as she will need to lay down protein as well as fat, but a fitter ewe is simply laying down fat.In practice, this means that lean ewes need to add more as a percentage of bodyweight or BCS unit than fitter ones and this should be taken into account when calculating DM requirements. The fact that lean ewes have up to 30% greater appetite than ewes in BCS 3 or more, is extremely useful during this period.
Priority should be given to thin ewes over lambs post weaning, if dry matter supply is limited
Ewes that are in fit condition at weaning should be managed separately to avoid them becoming overfat (BCS >4). Attempts to try to slim ewes can be counterproductive due to a potential negative impact on follicular development. If they are subjected to a below maintenance level of nutrition in the six weeks pre-mating, there is a risk of reducing early foetal development.
Set up ewe mating groups at least 10 days before rams are introduced, to minimise stress and maximise conception rates
3.1.3 Flushing just prior to mating
Flushingshouldbeviewedasashort-term‘fix’whenewesfailtoreachtheirtargetBCSformating
The shorter-term four to five day follicular cycle within the oestrous cycle, which brings follicles to their final maturity and ovulation, is then triggered by hormonal changes. It is this shorter cycle that is being worked with, when increasing the plane of nutrition or flushing, in the period just prior to mating.There are varying recommendations with respect to how long ewes should be flushed, ranging from two to six weeks. The critical factor is what level of nutritional restriction the ewes have been under before the start of flushing, as reflected in their BCS. Ewes in good condition, at least the lower end of the target range, have good ovulation rates that will not be improved by a further rise in the level of nutrition. Conversely, ewes in less than the target BCS have a reduction in ovulation rate of 0.45 per one unit reduction in BCS, unless they are flushed on a rising plane of nutrition.
TheresponsetoflushingisdependentoneweBCS
Ensuring ewes are in the correct BCS at mating is clearly the priority, with flushing being a secondary tool for those that fail to hit the targets. Sheep producers can be under considerable commercial pressure to buy supplements for ‘flushing’. These range from compounds to free access buckets and blocks and it can be difficult to make a decision based on cost-effectiveness. Historically, many producers would have tried to reduce ewe BCS in the dry period so they can then be flushed. But this is inefficient and requires a boost of nutrition at a time when this may require expensive supplementation. Also, maintaining that level through the implantation stage of the embryo can be difficult and the negative impacts of any changes in level or type of nutrition can be counterproductive. There is the potential to push lean ewes, particularly older ones, to high ovulation rates, resulting in triplets with consequent problems later in pregnancy.

19
3.2Effectofdietarycomponentsonfertility
Do not graze red clover in the 45 days before and after mating
Ovarian function can be impaired by some dietary factors, most notably the phytoestrogens that are found in legumes. For example, in Western Australia, feeding red clover is estimated to cause permanent subclinical infertility in about four million ewes a year. Red clover has the highest level of phytoestrogens and it is generally accepted that grazing pastures containing red clover 45 days before and after mating, can reduce fertility either permanently or temporarily. Diseased white clover can have the same effect.AHDB Beef & Lamb funded a review on the impact of legumes on ewe fertility and it can be found in the research Section of beefandlamb.ahdb.org.uk
3.3Effectofawormburden
Only treat lean or young ewes pre-mating with a wormer
Mature ewes, in common with most adult ruminants, have an acquired (adapted) immunity to gastrointestinal nematodes (excluding Haemonchus). This immune response involves the rejection of incoming immature larvae from the gut and a reduction in egg output of mature worms in the gut. The ewe’s ability to mount an immune response is affected by nutritional status and is less effective if the ewe is having to partition nutrients towards her own requirements, eg low BCS. On this basis, and to avoid unnecessary use of anthelmintics, SCOPS advise that only lean or young (up to 18 months of age) ewes are treated with a wormer pre-mating.For more information, see Sheep BRP Manual 8 – Worm control in sheep for Better Returns at beefandlamb.ahdb.org.uk or the technical manual at scops.org.uk
3.4Careofhighlyprolificewes
Donotflushhighlyprolificewes.TheymustreachtargetBCSbeforemating
It is vital that highly prolific ewes, eg Aberdale, Belclare and Lleyn, reach the BCS target well before mating to avoid excessive ovulation rates. Flushing should be avoided to help prevent excessive embryo numbers developing. If ewes are lean, be aware of the potential for an increased appetite, which can create a ‘flush’ unintentionally. The BCS target for prolific ewes at tupping would be 3.0.
2020
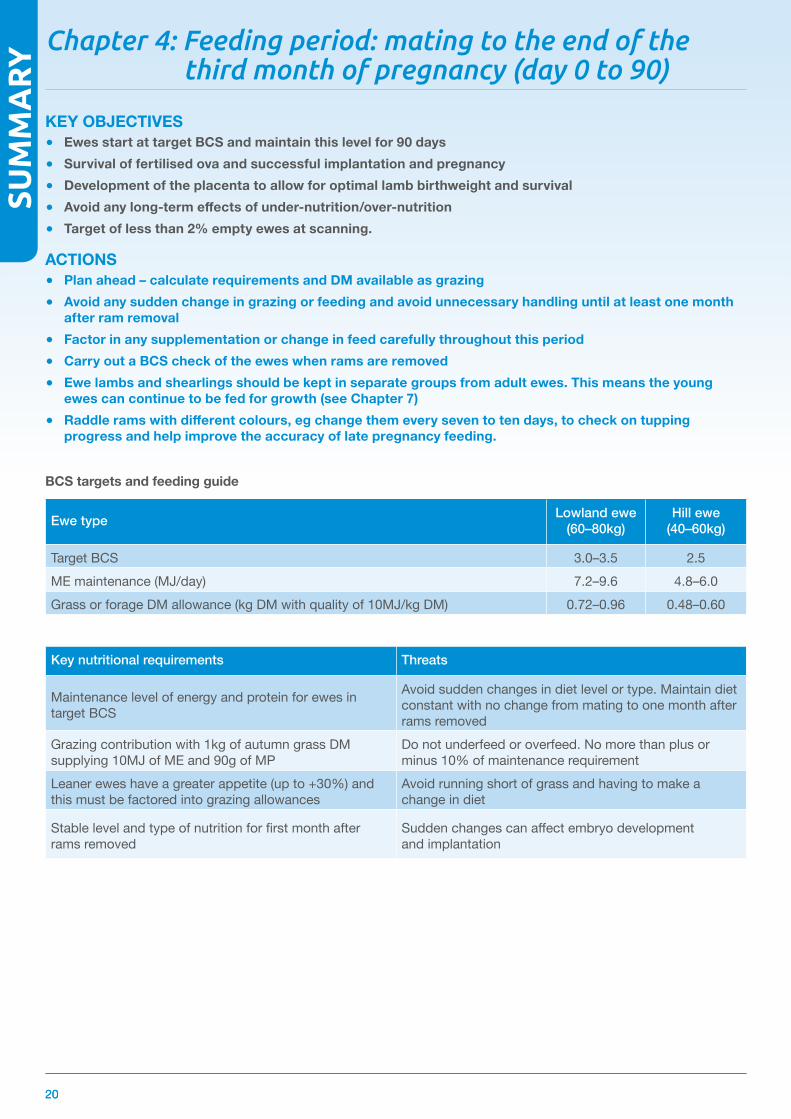
KEY OBJECTIVES ● Ewes start at target BCS and maintain this level for 90 days ● Survival of fertilised ova and successful implantation and pregnancy ● Development of the placenta to allow for optimal lamb birthweight and survival ● Avoidanylong-termeffectsofunder-nutrition/over-nutrition ● Target of less than 2% empty ewes at scanning.
ACTIONS ● Planahead–calculaterequirementsandDMavailableasgrazing ● Avoid any sudden change in grazing or feeding and avoid unnecessary handling until at least one month
after ram removal ● Factor in any supplementation or change in feed carefully throughout this period ● Carry out a BCS check of the ewes when rams are removed ● Ewe lambs and shearlings should be kept in separate groups from adult ewes. This means the young
ewes can continue to be fed for growth (see Chapter 7) ● Raddleramswithdifferentcolours,egchangethemeveryseventotendays,tocheckontupping
progress and help improve the accuracy of late pregnancy feeding.
BCS targets and feeding guide
Ewe type Lowland ewe (60–80kg)
Hill ewe (40–60kg)
Target BCS 3.0–3.5 2.5ME maintenance (MJ/day) 7.2–9.6 4.8–6.0Grass or forage DM allowance (kg DM with quality of 10MJ/kg DM) 0.72–0.96 0.48–0.60
Key nutritional requirements Threats
Maintenance level of energy and protein for ewes in target BCS
Avoid sudden changes in diet level or type. Maintain diet constant with no change from mating to one month after rams removed
Grazing contribution with 1kg of autumn grass DM supplying 10MJ of ME and 90g of MP
Do not underfeed or overfeed. No more than plus or minus 10% of maintenance requirement
Leaner ewes have a greater appetite (up to +30%) and this must be factored into grazing allowances
Avoid running short of grass and having to make a change in diet
Stable level and type of nutrition for first month after rams removed
Sudden changes can affect embryo development and implantation
Chapter 4: Feeding period: mating to the end of the third month of pregnancy (day 0 to 90)
SU
MM
AR
Y
21
4.1 First month of pregnancy (day 0 to 30)Research carried out on the effects of nutrition on survival of the fertilised ova and subsequent implantation concludes that, for optimal results, ewes should be fed a diet to maintain BCS and bodyweight during this period.Foetal growth is minimal during the first month of gestation and the nutrient requirements for pregnancy are very small. Both excessive underfeeding and overfeeding have detrimental effects at this stage of pregnancy. Research supports a maintenance level of nutrition without any abrupt changes as the ideal. This underlines the need for ewes to be in target BCS at mating.
Feedtomaintenancerequirements,underfeedingoroverfeedingcanhavedetrimentaleffectsinearlypregnancy
Survival of the fertilised ova and their subsequent implantation into the lining of the uterus are the critical events in this period. Implantation starts on day 19, when the blastocyst (very early embryo) starts to invade the uterine lining. Nutrition at this time has an influence on the composition of the oviductal and uterine secretions that nourish and support these early cell divisions. Hormonal levels also have an effect. As early as day six after fertilisation, hormonal levels can influence foetal growth and subsequent birthweight, but embryos are most vulnerable between days 11 and 12. For example, abrupt changes in diet composition or rapid fluctuations in feeding level or pattern of feeding can disrupt rumen function and metabolic homeostasis with adverse consequences for embryo survival. In practice, to avoid any changes in diet until post-implantation, ewes need to have enough grazing in front of them to keep them at maintenance for their first four weeks after mating. For a group of ewes, this means at least two 17-day oestrous cycles.
Avoid any changes in type or level of feeding. Plan ahead for two oestrous cycles
Progesterone has a vital influence in these very early stages. High feeding levels are known to reduce progesterone levels and this can compromise embryo survival. Reduced uterine pH is also a factor. The nutritional environment of the pre-implanted embryo can alter gene expression and distort the relationship between the size of the foetus and the placenta.Research into the effects of nutrition during very early pregnancy points very clearly to ewe lambs being more sensitive to the effects of under-nutrition or over-nutrition, compared with mature ewes (see Chapter 7).Raddle colours provide valuable feedback on the progress of mating and help plan grazing requirements, in addition to their use to guide late pregnancy feeding.
Changing raddle colours every seven to ten days is a good guide for feeding in late pregnancy, it indicates any problems with ram fertility at mating and allows for planning labour at lambing time
4.2 Second and third months of pregnancy (day 30 to 90)
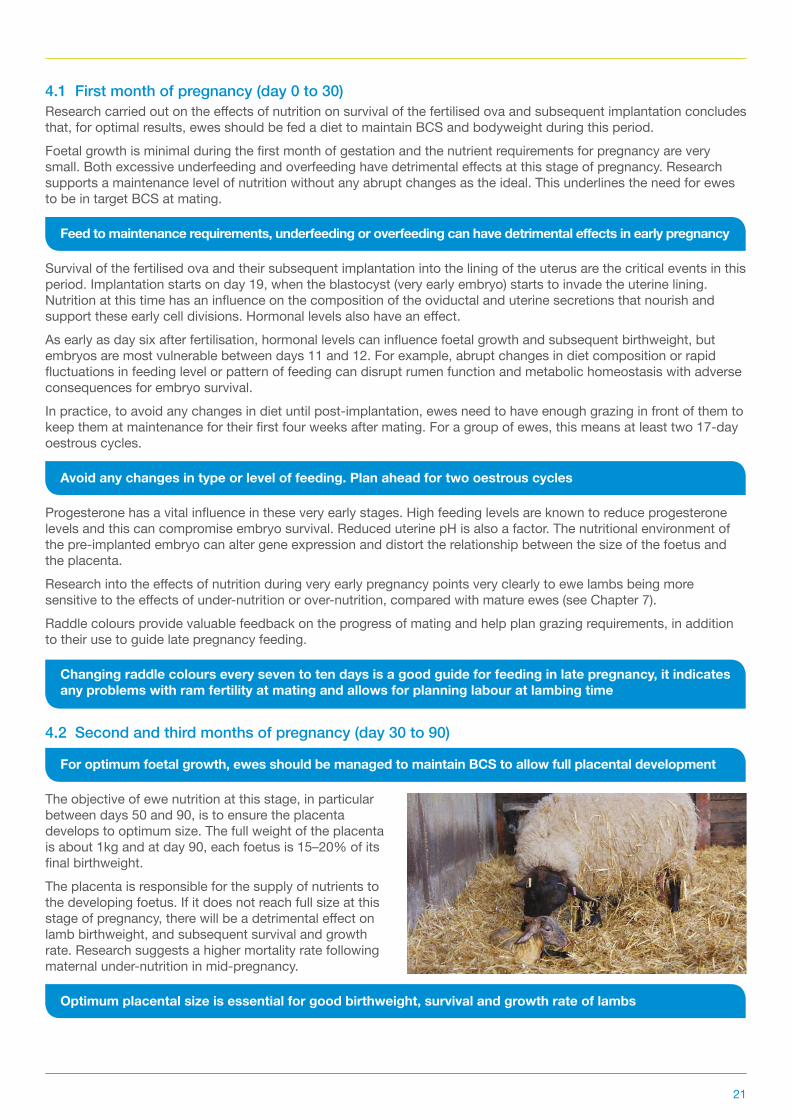
For optimum foetal growth, ewes should be managed to maintain BCS to allow full placental development
The objective of ewe nutrition at this stage, in particular between days 50 and 90, is to ensure the placenta develops to optimum size. The full weight of the placenta is about 1kg and at day 90, each foetus is 15–20% of its final birthweight. The placenta is responsible for the supply of nutrients to the developing foetus. If it does not reach full size at this stage of pregnancy, there will be a detrimental effect on lamb birthweight, and subsequent survival and growth rate. Research suggests a higher mortality rate following maternal under-nutrition in mid-pregnancy.
Optimum placental size is essential for good birthweight, survival and growth rate of lambs
22
The response of the placenta to restricted levels of nutrition between days 50 and 90 is dependent on the BCS of the ewe. There has been some evidence to support an enhancement of placental growth and lamb birthweight with a loss of up to 0.5 BCS in mid-pregnancy in fit ewes. The mechanism is thought to be associated with higher haemoglobin and thyroid hormone levels, which increase the rate blood flows between the smaller placenta and the foetus. However, this relies on ewes being fit and there being a high level of feeding in late pregnancy (in months four and five) to compensate for this BCS loss.Preliminary data from the sheep KPI project and similar work in Wales through the technology, agriculture and greater efficiencies (TAG) project have shown significant improvements in scanning percentage, where ewes continue to gain weight and BCS in the period from mating to scanning. This suggests that a small increase over maintenance feeding in ewes at all BCS may be beneficial. In practice, when calculating grazing allowances, a slight margin above maintenance should be factored in.
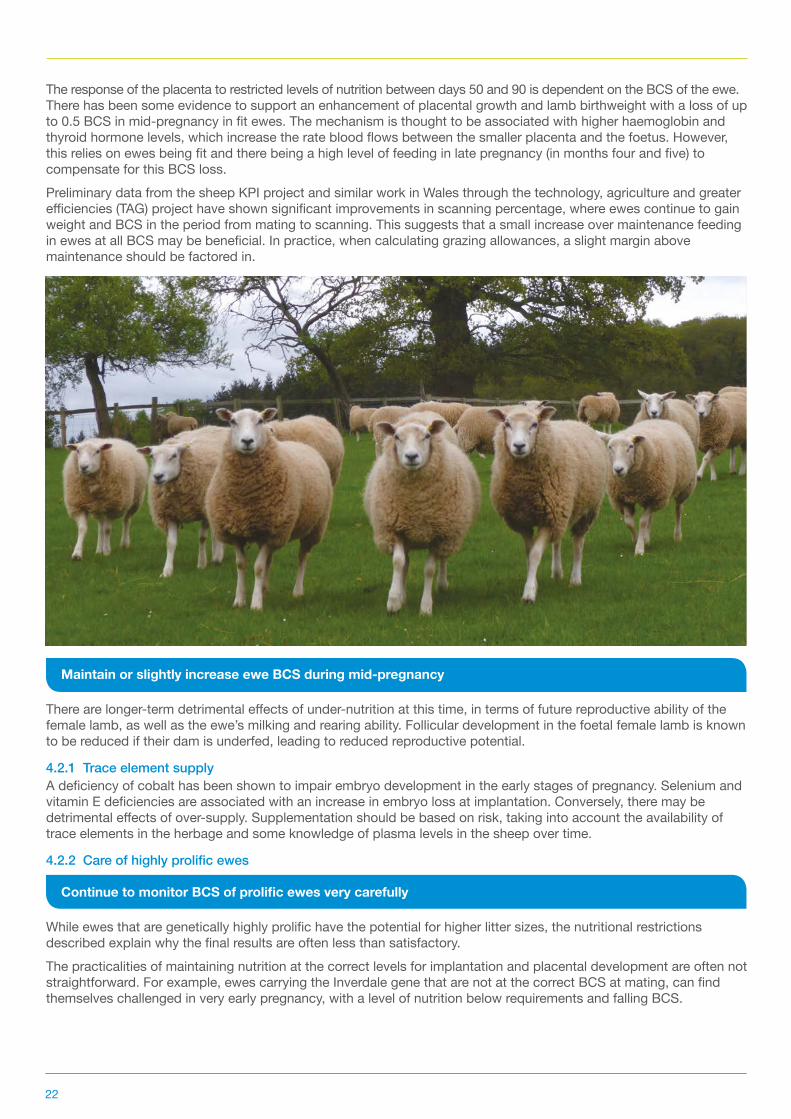
Maintain or slightly increase ewe BCS during mid-pregnancy
There are longer-term detrimental effects of under-nutrition at this time, in terms of future reproductive ability of the female lamb, as well as the ewe’s milking and rearing ability. Follicular development in the foetal female lamb is known to be reduced if their dam is underfed, leading to reduced reproductive potential.
4.2.1 Trace element supplyA deficiency of cobalt has been shown to impair embryo development in the early stages of pregnancy. Selenium and vitamin E deficiencies are associated with an increase in embryo loss at implantation. Conversely, there may be detrimental effects of over-supply. Supplementation should be based on risk, taking into account the availability of trace elements in the herbage and some knowledge of plasma levels in the sheep over time.
4.2.2Careofhighlyprolificewes
ContinuetomonitorBCSofprolificewesverycarefully
While ewes that are genetically highly prolific have the potential for higher litter sizes, the nutritional restrictions described explain why the final results are often less than satisfactory. The practicalities of maintaining nutrition at the correct levels for implantation and placental development are often not straightforward. For example, ewes carrying the Inverdale gene that are not at the correct BCS at mating, can find themselves challenged in very early pregnancy, with a level of nutrition below requirements and falling BCS.

23
4.2.3Pregnancyscanningandsubsequentmanagement
Pregnancyscanewesatday70anduseresultstomanagetheflock
Pregnancy scanning normally takes place around day 70 of pregnancy (range 40 to 90 days) and is a vital tool for setting up feeding plans in late pregnancy. It offers a valuable opportunity to reassess the BCS of ewes, remove empty ewes and make adjustments to groups and the grazing required.Scanning is a good time to separate triplet-bearing ewes and any twin-bearing ewe lambs for early, preferential feeding and management.
4.2.4PlanningforageDMavailabilityForage DM availability must be planned for the first three months of pregnancy to feed the ewes to maintenance requirements and maintain BCS. As described in Chapter 3, the maintenance requirements of the ewe by weight (see guide to mature weights in Appendix 6) should be calculated and multiplied by the number of ewes in the flock and the period of feeding in days. The grass or forage crops need to be planned to meet the quantity of herbage DM required.For more information on calculating autumn and winter grazing, see BRP generic Manual 8 – Planning grazing strategies for Better Returns and BRP+ All Grass Wintering at beefandlamb.ahdb.org.uk
Example:From day 0 to 90 of pregnancyA 65kg ewe will require 720MJ of ME (8MJ ME per day) for maintenance feeding.A flock of 600 x 65kg ewes feeding will require 432,000MJ of ME [720 x 600] for maintenance feeding.To supply this from grass, with an energy value of 10MJ/kg DM, will require 43,200kg DM over 90 days, or 480kg DM per day.
24
KEY OBJECTIVES ● TargetBCSatlambingtohavefiteweswithgoodmotheringability ● High foetal survival rate and minimal lamb losses ● Goodudderdevelopmentwithplentifulsupplyofgoodqualitycolostrumandmilk ● Minimal ewe losses due to metabolic disease, prolapse or dystocia ● Good lamb birthweights and vigour. Target <10% losses from scanning to lambs being turned out
ACTIONS ● Plan grazing for late pregnancy and lactation ● Have forage analysed and choose appropriate feed supplements ● Formulate rations and purchase feed ● Monitor BCS and make adjustments if necessary ● Group ewes for feeding by litter size, BCS or raddle colour ● Plan changes to amounts fed as lambing approaches ● Monitorintakesagainstpredictionforforageandadjustifrequired
BCS targets
Ewe type Lowland ewe (60–80kg) Hill ewe (40–60kg) Ewelambs
Target BCS at lambing 3.0–3.5 2.5 3.0
Key nutritional requirements Threats
Ration to ME and MP requirements according to litter size (AFRC 1993). Adjust for ewe BCS, if necessary
Inadequate energy and protein supply leads to poor ewe body condition, small weak lambs and poor yields of colostrum and, subsequently milk
Easy access to feed with minimal competition so ewes all receive their fair share and intakes are stable
Poor access to feed leads to pregnancy toxaemia and widening variance in body condition as lambing approaches. Also physical trauma due to pushing or jumping on backs
Feed offered at the same time of day with no sudden changes in feed type or quality
Sudden changes in diet lead to pregnancy toxaemia, hypocalcaemia, poor rumen function and lack of rumination time
Good quality forage available at all times. Intakes monitored
Poor quality or inadequate supply of forage leads to low intake and high concentrate use
Concentrates of high quality and offered in small meals (less than 0.5kg per feed)
Feeding more than 0.5kg of concentrates in one feed increases the risk of acidosis and pregnancy toxaemia
Chapter 5: Feeding period: final two months of pregnancy (day 90 to 145)
SU
MM
AR
Y
25
5.1Effectofunder-nutritionorover-nutritioninlatepregnancy
During late pregnancy around 75% of foetal growth takes place, with a corresponding increase in the ewe’s requirementsforenergyandprotein
Considerable research has been undertaken on the effects of under-nutrition of ewes in late pregnancy. There are also a number of negative impacts of over-nutrition, as shown in Table 6.Table 6. Effects of under-nutrition and over-nutrition of ewes in late pregnancy
Under-nutrition Over-nutrition
Low lamb birthweight and survival rate Over-sized lambs and dystocia
Reduced udder weight and mammary development Prolapse
Weakened ewe/lamb bond Weakened ewe/lamb bond
Pregnancy toxaemia Pregnancy toxaemia
Delayed onset of lactation and lower colostrum and milk yield Lambing difficulties causing delayed onset of lactation
Impact on the long-term performance of the ewe Potential for a high BCS to impact on future performance
Reduced lamb growth rate Reduced lamb vigour
5.1.1LambbirthweightandsurvivalratesLamb mortality is a vital aspect of flock productivity (targets are shown in Table 7). In reality, many flocks lose more and recording should be encouraged.Table 7. Targets for lamb losses by period
Lamblosses(%)byperiod Lowland ewes Upland ewes Hill ewes Ewelambs
Scanning – birth 6% 5% 3% 5%Birth – turnout* 6% 6% 7% 5%Turnout – weaning 2% 3% 3% 5%Total from scanning 14% 14% 13% 15%
Notes: *Flocks lambing outdoors may have a percentage loss to tagging/first handling from birth of 5%.
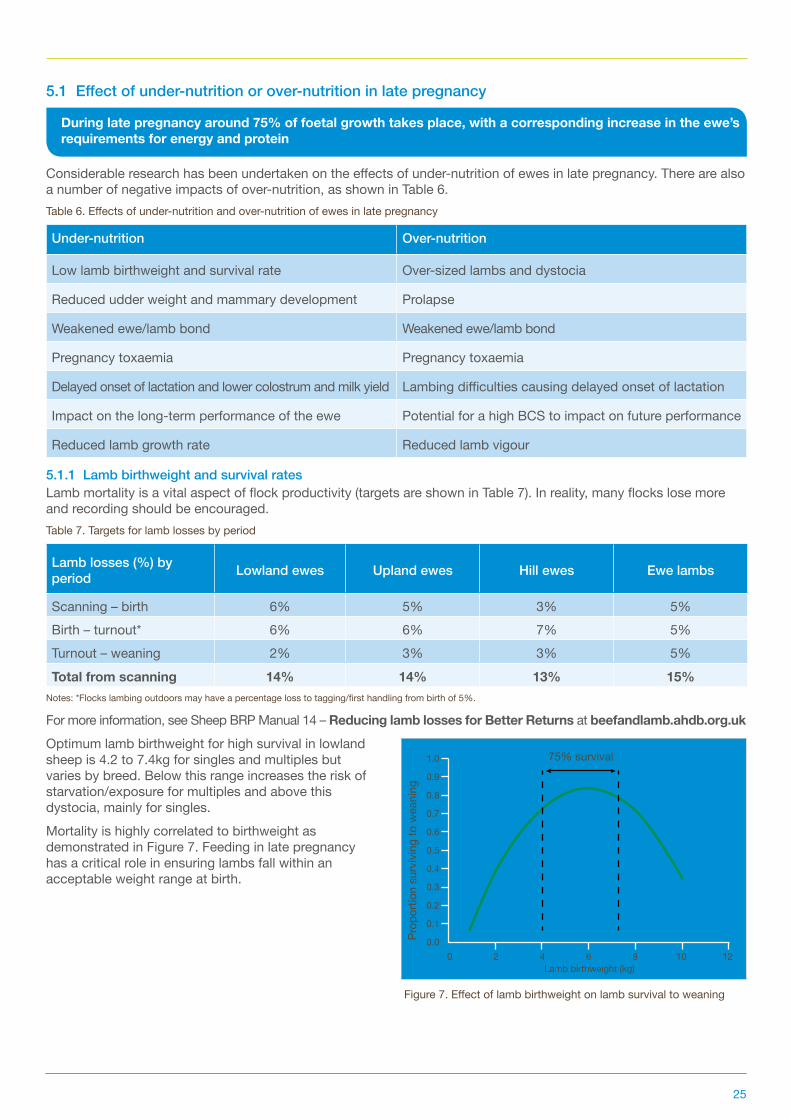
For more information, see Sheep BRP Manual 14 – Reducing lamb losses for Better Returns at beefandlamb.ahdb.org.uk Optimum lamb birthweight for high survival in lowland sheep is 4.2 to 7.4kg for singles and multiples but varies by breed. Below this range increases the risk of starvation/exposure for multiples and above this dystocia, mainly for singles. Mortality is highly correlated to birthweight as demonstrated in Figure 7. Feeding in late pregnancy has a critical role in ensuring lambs fall within an acceptable weight range at birth.
Lamb birthweight (kg)
75% survival
0 2 4 6 8 10 12
Figure 7. Effect of lamb birthweight on lamb survival to weaning
Prop
ortio
n su
rviv
ing
to w
eani
ng
0.0
0.1
0.2
0.3
0.4
0.5
0.6
0.7
0.8
0.9
1.0
26
Birthweight is a major determinant of birth survival
For each breed of sheep, there is an optimum birthweight range, linked to mature weight, outside of which mortality is likely to be higher. For example, for the Scottish Blackface (SBF) optimal birthweight lies between 3kg and 5kg, with mortality increasing rapidly in lambs born at less than 3kg and greater than 5kg. As a general rule, the optimum birthweight of single, twin and triplet lambs from lowland breeds is 6kg, 5kg and 4.5kg, respectively.Low birthweight lambs tend to have lower glucose levels, reduced brown fat stores and increased surface area to weight ratio, all of which reduce their ability to keep warm and ‘get up and go’ at birth. Getting up and sucking colostrum is crucial to their future survival. Low birthweight lambs are slower to stand and suck less frequently than heavier lambs.Body condition has a vital role in this period of pregnancy. Fitter ewes are able to mobilise their body reserves to sustain foetal and udder growth. Where thin and fat ewes are fed the same diet, there is a positive correlation between the fat content of the lamb and the fat content of the ewe. This brown fat in lambs is critical to heat production and hence, lamb survival. Ewes that mobilise less body fat during pregnancy produce lambs that stand and suck quicker and are more active over the first three days of life. In general, there are no benefits in lamb birthweight, lamb mortality or daily liveweight gain in lambs born to ewes that are overfat in late pregnancy, although there is an effect on BCS. Overfat ewes tend to have a higher risk of prolapse and pregnancy toxaemia and they may experience a prolonged or difficult lambing due to having over-size lambs. They are then slower to groom their lambs, show reduced bonding behaviour, make fewer bleats and are more prone to rejecting their lambs. Lambs may also be less vigorous. Overfeeding thin ewes in late pregnancy to try to gain BCS can result in thin ewes having excessively large lambs, as they partition nutrients to the foetuses and have a higher appetite than fitter ewes.
The higher appetite of thin ewes can lead to large lambs and dystocia
Metabolisable protein supply in late pregnancy has a direct effect on lamb birthweight and also on nutrient partitioning in the ewe. There is a positive correlation between energy, under-nutrition and intake of DUP and MP. As the level of energy in the diet decreases, the requirement for protein in the diet in the form of DUP increases to meet the needs of the growing foetuses.Where the status of ewes is marginal for cobalt, selenium and vitamin E, supplementation has been shown to improve lamb survival. There is little evidence of any benefits of supplying trace elements in excess of requirements. See Appendix 5 and 8 for requirements.
5.1.2Eweandlambbond
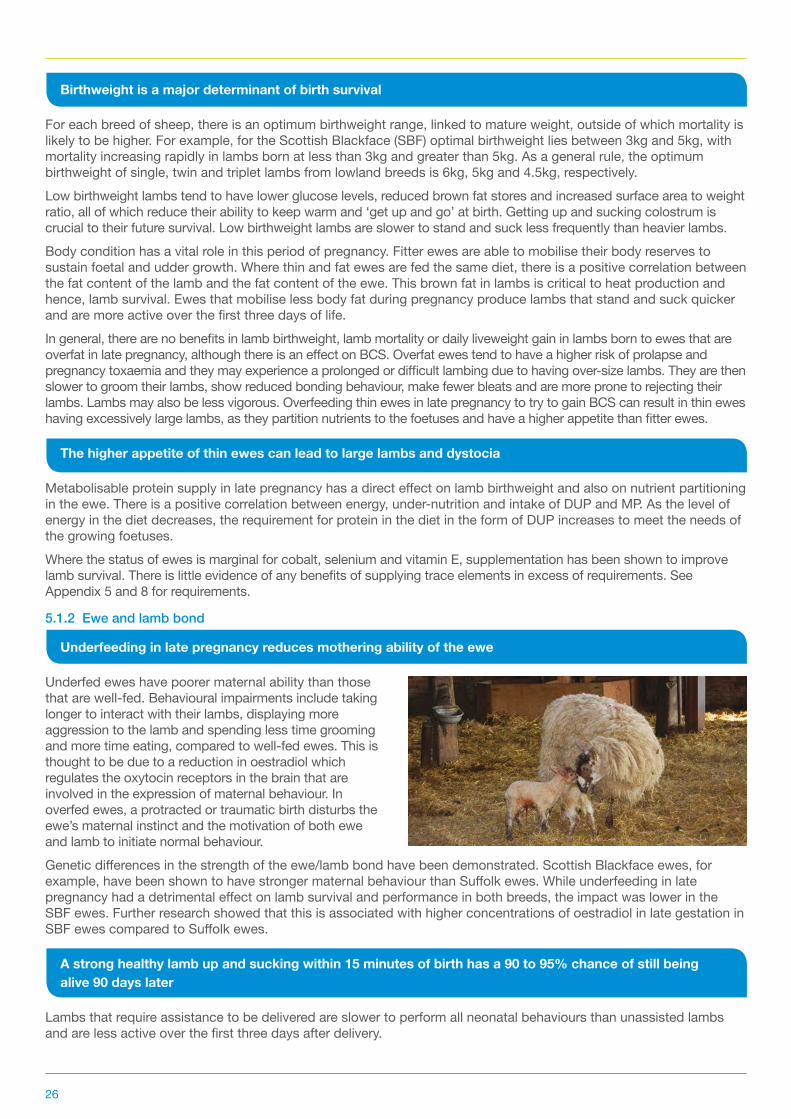
Underfeeding in late pregnancy reduces mothering ability of the ewe
Underfed ewes have poorer maternal ability than those that are well-fed. Behavioural impairments include taking longer to interact with their lambs, displaying more aggression to the lamb and spending less time grooming and more time eating, compared to well-fed ewes. This is thought to be due to a reduction in oestradiol which regulates the oxytocin receptors in the brain that are involved in the expression of maternal behaviour. In overfed ewes, a protracted or traumatic birth disturbs the ewe’s maternal instinct and the motivation of both ewe and lamb to initiate normal behaviour.Genetic differences in the strength of the ewe/lamb bond have been demonstrated. Scottish Blackface ewes, for example, have been shown to have stronger maternal behaviour than Suffolk ewes. While underfeeding in late pregnancy had a detrimental effect on lamb survival and performance in both breeds, the impact was lower in the SBF ewes. Further research showed that this is associated with higher concentrations of oestradiol in late gestation in SBF ewes compared to Suffolk ewes.
A strong healthy lamb up and sucking within 15 minutes of birth has a 90 to 95% chance of still being alive 90 days later
Lambs that require assistance to be delivered are slower to perform all neonatal behaviours than unassisted lambs and are less active over the first three days after delivery.

27
5.1.3 Reduced udder weight and mammary development Most mammary gland development takes place during the last month of pregnancy. There is a clear relationship between the ewe’s energy intake over the last three weeks of pregnancy and colostrum production. Under-nutrition pre-lambing not only reduces the quantity of colostrum and milk produced, but also delays the onset of lactation and increases the viscosity of colostrum. Since viscosity and volume of colostrum are inversely related, this is a major issue for the newborn lamb. In addition, the lamb may find it more difficult to extract thick colostrum from the teat.The mechanism is related to the change in hormone levels in late pregnancy. Under-nutrition delays the fall in progesterone and the udder is deprived of the blood flow it needs to access the substrates for colostrum production.Lambs are born hypo-immunocompetent, with only a small store of energy (in the form of brown fat) for heat production and metabolism. So they are completely dependent on colostrum to supply energy and immunoglobulins. Make sure lambs receive 50ml/kg of colostrum within the first four to six hours of life and continue to consume it during the first 24 hours of life. In 24 hours, a newborn lamb must receive the equivalent of 200ml/kg bodyweight in colostrum. For example, a 5kg lamb needs 1 litre of colostrum in the first day of life. An increase may be necessary in wet and windy conditions in outdoor lambing systems.After six hours, the lamb’s ability to absorb the immunoglobulins into its bloodstream has reduced, which is why it is important to get colostrum in quickly.The primary immunoglobulin in colostrum is immunoglobulin G (IgG). Its concentration in milk decreases rapidly after parturition, at approximately 3.3mg/ml per hour, diminishing to zero by about 23 hours post-lambing.
Lambsrequire50mlcolostrum/kgbodyweightperfeedamountingto200ml/kgbodyweightinthefirst 24 hours of life
For optimum colostrum production, research shows that the ewe must have the correct balance of protein and energy and that the level of protein required is dependent on the energy available to the ewe. If there is insufficient energy available, the rumen cannot fully utilise the RDP supply for microbial protein synthesis, leading to high levels of ammonia and excess urea production. Conversely, if low levels of protein are fed in pregnancy, this may reduce the utilisation of starch for colostrum synthesis in ewes supplemented with high-energy diets. Cereal grains such as maize, barley or wheat have a high ME and starch content and when used as supplements in the last week of pregnancy, have been shown to enhance colostrum production. The amount of energy, especially glucose, available at the end of pregnancy plays a major role in colostrum synthesis.
Provide the correct balance of dietary energy and protein to optimise colostrum and IgG production
There is some evidence to support a detrimental effect of over-supplementation of ewes with minerals and trace elements in late pregnancy, eg the effect of excessive iodine on the absorption of IgG by the lamb. There are reports of excess selenium causing higher lamb mortality, through increased respiratory and gastrointestinal disease.Ewe nutrition in late pregnancy affects the future reproductive performance of lambs. Low maternal nutrition can affect the development of the foetal ovaries, resulting in lower follicle production. There can also be effects on the structure of the foetal testes.
Provideadequate,butnotexcessive,levelsofmineralsandtraceelementstopregnantewes
28
5.2 Ewe requirements
UseAFRC(1993)energyandproteinrequirementstorationewesinlatepregnancy
Based on the current information and the consensus of a workshop attended by a group of industry experts in April 2016, it was agreed that the energy and protein requirements published in AFRC (1993) for ewes in late pregnancy continue to be used, but that for protein these should be viewed as a minimum requirement. Demands for energy and protein increase rapidly in the last two months of pregnancy for the development of the foetus and mammary gland. The ewes demand for ME increases with ewe liveweight, number of lambs carried and as lambing approaches. For a 70kg ewe carrying twins, there is a 60% increase in ME requirement between seven and one-week pre-lambing.
Duringpregnancy,thehighertheMEconcentrationofthediet,themoreefficientlyitisutilisedbytheewe
The calculated ME requirements for housed pregnant ewes are shown in Table 8.Table 8. Metabolisable energy (MJ/day) requirements of housed* pregnant ewes (based on a diet of 11MJ/kg DM, assuming no ewe weight
loss^) (AFRC, 1993)
Ewe liveweight (kg) NumberoflambsTimetolambing
Seven weeks Five weeks Three weeks One week
501 7.9 8.7 9.8 11.2
2 8.8 10.1 11.9 14.2
601 9.1 10.0 11.2 12.8
2 10.1 11.6 13.7 16.3
70
1 10.2 11.2 12.6 14.4
2 11.4 13.1 15.3 18.3
3 12.0 14.0 16.7 20.3
80
1 11.3 12.4 13.9 15.9
2 12.6 14.4 17.0 20.2
3 13.3 15.5 18.5 22.5Notes: *For ewes outdoors, increase ME requirements by 0.11MJ for each 10kg bodyweight and 0.24MJ for each 10kg bodyweight, for lowland and hill ewes, respectively. ^For ewes gaining 50g per day gain add 2.5MJ of ME.
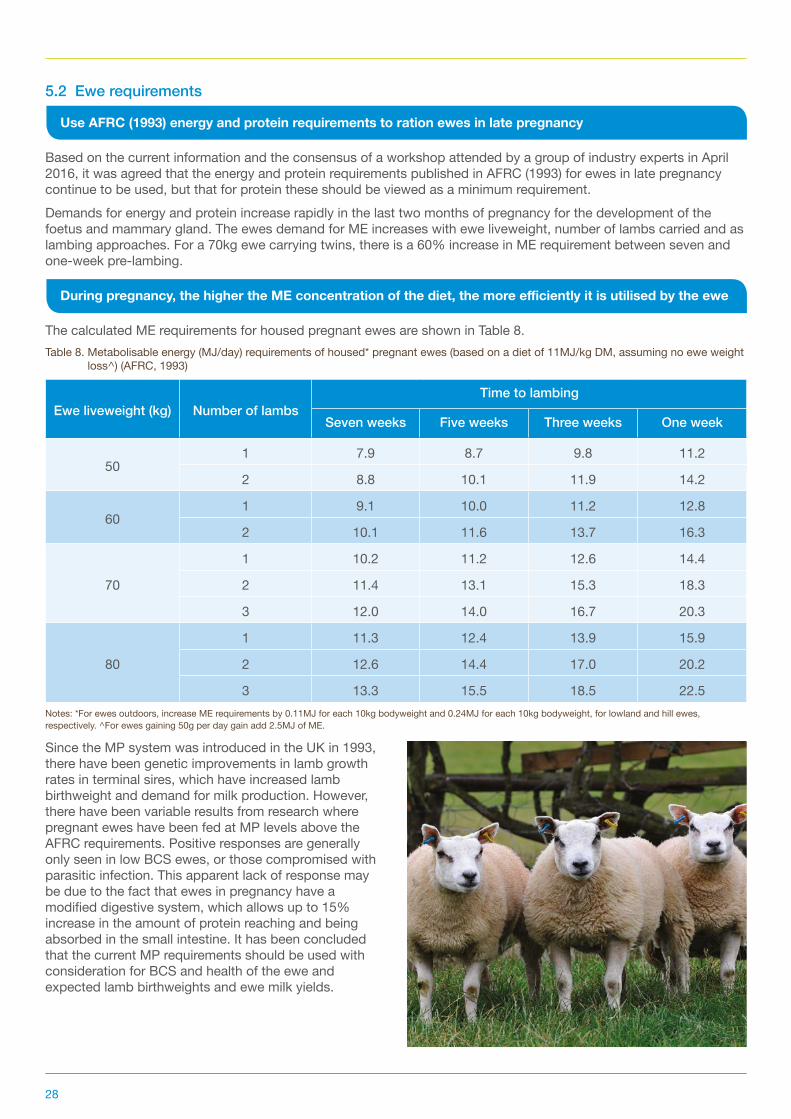
Since the MP system was introduced in the UK in 1993, there have been genetic improvements in lamb growth rates in terminal sires, which have increased lamb birthweight and demand for milk production. However, there have been variable results from research where pregnant ewes have been fed at MP levels above the AFRC requirements. Positive responses are generally only seen in low BCS ewes, or those compromised with parasitic infection. This apparent lack of response may be due to the fact that ewes in pregnancy have a modified digestive system, which allows up to 15% increase in the amount of protein reaching and being absorbed in the small intestine. It has been concluded that the current MP requirements should be used with consideration for BCS and health of the ewe and expected lamb birthweights and ewe milk yields.
29
Ewes on low levels of dietary protein in late pregnancy lose protein and fat from the carcase tissues and fat from the internal organs, compared to ewes on adequate dietary protein diets. This muscle proteolysis is only one of the many pregnancy-induced metabolic adaptations in maternal tissues. Ewes offered diets of adequate protein gain protein in both carcase tissues and maternal organs and this contributes to the future productivity of the ewe.Metabolisable protein requirements for housed pregnant ewes are shown in Table 9. Requirements for MP rise during the last seven weeks of pregnancy with an increased demand in the last three weeks. For a 70kg ewe carrying twins, there is a 60% increase in MP requirement between seven and one week pre-lambing.Table 9. Metabolisable protein (g/day) requirements of housed pregnant ewes (based on a diet of 11MJ/kg DM, assuming no ewe weight
loss*) (AFRC, 1993)
Ewe liveweight (kg) NumberoflambsTimetolambing
Seven weeks Five weeks Three weeks One week
501 72 76 81 88
2 77 83 92 103
601 80 84 90 98
2 85 92 102 115
70
1 87 92 98 107
2 93 101 112 126
3 96 106 119 136
80
1 94 99 107 116
2 100 109 122 137
3 104 115 129 148Notes: *For ewes gaining 50g per day add 7g of MP.
5.2.1Factorsaffectinginterpretationoftherequirements
RequirementsforenergyandproteinaredeterminedbyeweweightandBCS,numberoflambscarriedandwhether the ewe is gaining, losing or maintaining weight
Appendix 6 gives a guide to mature weight by ewe breed. In practice, ewes should be fed according to the number of lambs carried and their BCS from six weeks pre-lambing. Thin, single bearing ewes can be fed with the twin-bearing ewes and thin, twin-bearing ewes can be fed with triplet-bearing ewes to meet extra nutrient demands of low condition score animals. Young first-time lambers (ewe lambs or shearlings) should be fed in separate groups, by litter size, to adult ewes.There are many other factors that need to be taken into account when preparing rations to ensure the diet offered meets the requirements of the ewe. Rumen function and maximising the contribution from forage are important to maximise feed intake as described in Chapter 2.The following factors must be considered when preparing rations to ensure the required levels of energy and protein are supplied:
● BCS, weight, age and litter size of the ewes ● Forage type and quality ● Nutritional value of supplements available ● Frequency and timing of feeding ● Presentation of feeds, for example TMR ● Access and feeding space ● Effect of the environment, including winter shearing

30
5.2.2 Peri-parturient relaxation of immunity
Around lambing the higher worm egg output from some ewes is a source of pasture contamination for lambs
During the peri-parturient period, before and just after lambing, the ewe’s immune system is put under pressure. As protein supplies are partitioned, the immune system is given a lower priority than milk production. This is known as the peri-parturient relaxation in immunity (PPRI). In practice, this means the ewe may struggle to control her previously low worm burden and her faecal egg output rises significantly. As a consequence, the ewe can become a significant source of contamination for grazing lambs.To reduce this impact, research supports the need for ewes to maintain good levels of body condition up to lambing with an adequate MP supply. In recent years, research has looked at the effects of increased DUP supply on the PPRI with variable results. Where ewes are in lower than ideal BCS or receiving a ration where energy is limiting there may be a response to additional DUP over requirements.Current advice is to only worm ewes that are thin or carrying or rearing multiple lambs but dependent on the MP content of the diet.Monitoring the faecal egg counts of ewes at or around lambing can provide farmers with the information to decide if they need to administer anthelmintic treatment or not. Some flocks experience an increase in egg output, while others do not.For more information, see Sheep BRP Manual 8 – Worm control in sheep for Better Returns at beefandlamb.ahdb.org.uk or technical manual at scops.org.uk
5.3 Practical aspects of feedingFrequencyandtimingoffeedingForage, including grazing, should be available at all times to maintain stable rumen function. In a housed situation, conserved forage must be offered daily. Turning over or pushing up forage encourages sheep to come to feed and increases intake.When feeding concentrates and certainly when feeding more than 0.5kg per head per day, this should be divided into two feeds, or included in a TMR, to help maintain a stable rumen pH.
Large feeds of concentrates (more than 0.5kg) reduce rumen pH and forage intake and cause acidosis
Erratic feeding times, particularly with concentrates, can destabilise rumen microflora and function by interfering with saliva production. Ewes anticipate feeding times and adjust their grazing or forage intake and accompanying saliva flow. They should therefore be fed at the same times every day.
Presentation and access to feedFeed offered to ewes should be of high quality and digestible, fresh and free from mould and contamination. Troughs and feeders should be cleaned out regularly to avoid the build-up of stale, unpalatable food. If feeding outdoors, troughs should be moved regularly or be on a dry standing. Any changes, for example to a new batch of forage or concentrates should be done gradually, over a few days, to allow the rumen microflora to adjust.
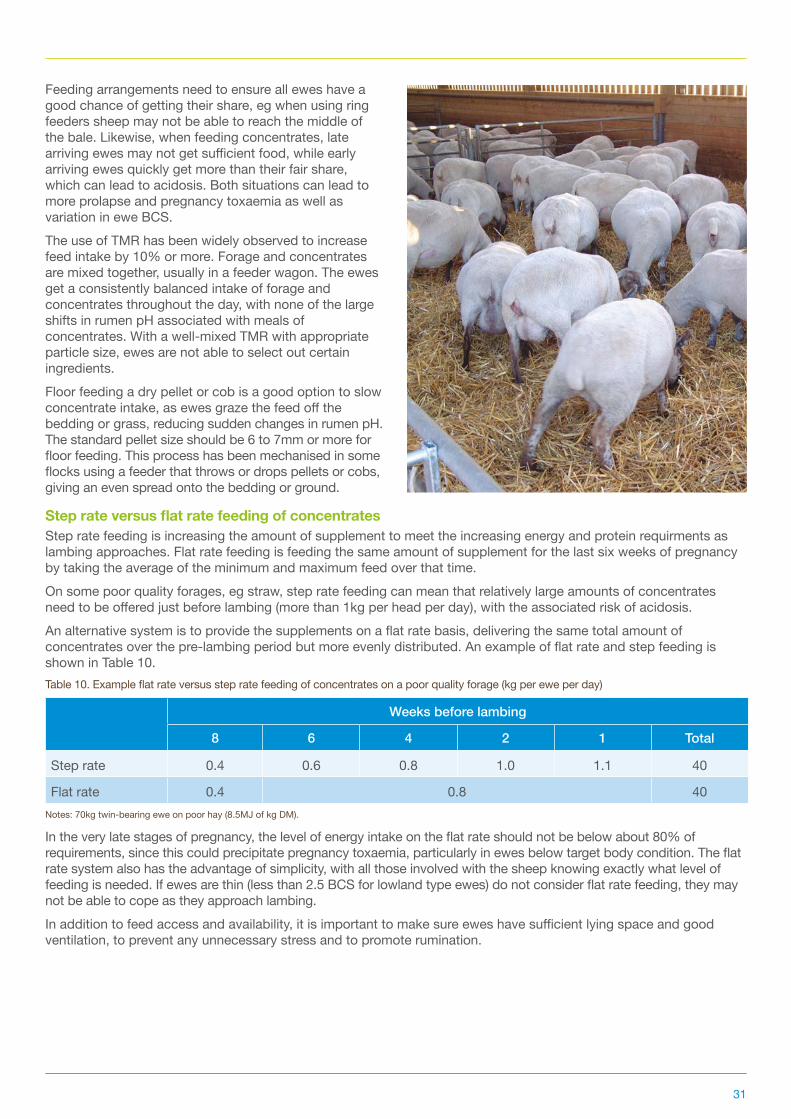
31
Feeding arrangements need to ensure all ewes have a good chance of getting their share, eg when using ring feeders sheep may not be able to reach the middle of the bale. Likewise, when feeding concentrates, late arriving ewes may not get sufficient food, while early arriving ewes quickly get more than their fair share, which can lead to acidosis. Both situations can lead to more prolapse and pregnancy toxaemia as well as variation in ewe BCS.The use of TMR has been widely observed to increase feed intake by 10% or more. Forage and concentrates are mixed together, usually in a feeder wagon. The ewes get a consistently balanced intake of forage and concentrates throughout the day, with none of the large shifts in rumen pH associated with meals of concentrates. With a well-mixed TMR with appropriate particle size, ewes are not able to select out certain ingredients. Floor feeding a dry pellet or cob is a good option to slow concentrate intake, as ewes graze the feed off the bedding or grass, reducing sudden changes in rumen pH. The standard pellet size should be 6 to 7mm or more for floor feeding. This process has been mechanised in some flocks using a feeder that throws or drops pellets or cobs, giving an even spread onto the bedding or ground.
SteprateversusflatratefeedingofconcentratesStep rate feeding is increasing the amount of supplement to meet the increasing energy and protein requirments as lambing approaches. Flat rate feeding is feeding the same amount of supplement for the last six weeks of pregnancy by taking the average of the minimum and maximum feed over that time.On some poor quality forages, eg straw, step rate feeding can mean that relatively large amounts of concentrates need to be offered just before lambing (more than 1kg per head per day), with the associated risk of acidosis.An alternative system is to provide the supplements on a flat rate basis, delivering the same total amount of concentrates over the pre-lambing period but more evenly distributed. An example of flat rate and step feeding is shown in Table 10.Table 10. Example flat rate versus step rate feeding of concentrates on a poor quality forage (kg per ewe per day)
Weeksbeforelambing
8 6 4 2 1 Total
Step rate 0.4 0.6 0.8 1.0 1.1 40
Flat rate 0.4 0.8 40Notes: 70kg twin-bearing ewe on poor hay (8.5MJ of kg DM).
In the very late stages of pregnancy, the level of energy intake on the flat rate should not be below about 80% of requirements, since this could precipitate pregnancy toxaemia, particularly in ewes below target body condition. The flat rate system also has the advantage of simplicity, with all those involved with the sheep knowing exactly what level of feeding is needed. If ewes are thin (less than 2.5 BCS for lowland type ewes) do not consider flat rate feeding, they may not be able to cope as they approach lambing.In addition to feed access and availability, it is important to make sure ewes have sufficient lying space and good ventilation, to prevent any unnecessary stress and to promote rumination.
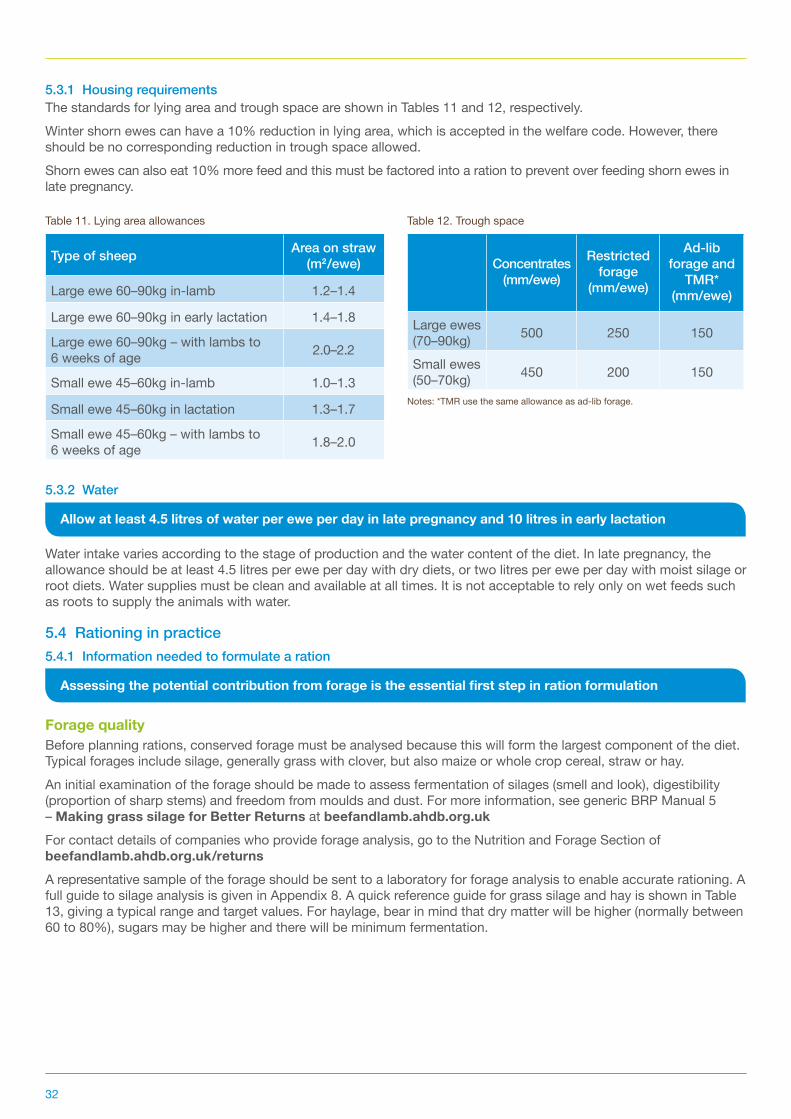
32
5.3.1 Housing requirementsThe standards for lying area and trough space are shown in Tables 11 and 12, respectively.Winter shorn ewes can have a 10% reduction in lying area, which is accepted in the welfare code. However, there should be no corresponding reduction in trough space allowed.Shorn ewes can also eat 10% more feed and this must be factored into a ration to prevent over feeding shorn ewes in late pregnancy.
5.3.2 Water
Allow at least 4.5 litres of water per ewe per day in late pregnancy and 10 litres in early lactation
Water intake varies according to the stage of production and the water content of the diet. In late pregnancy, the allowance should be at least 4.5 litres per ewe per day with dry diets, or two litres per ewe per day with moist silage or root diets. Water supplies must be clean and available at all times. It is not acceptable to rely only on wet feeds such as roots to supply the animals with water.
5.4 Rationing in practice5.4.1 Information needed to formulate a ration
Assessingthepotentialcontributionfromforageistheessentialfirststepinrationformulation
ForagequalityBefore planning rations, conserved forage must be analysed because this will form the largest component of the diet. Typical forages include silage, generally grass with clover, but also maize or whole crop cereal, straw or hay. An initial examination of the forage should be made to assess fermentation of silages (smell and look), digestibility (proportion of sharp stems) and freedom from moulds and dust. For more information, see generic BRP Manual 5 – Making grass silage for Better Returns at beefandlamb.ahdb.org.ukFor contact details of companies who provide forage analysis, go to the Nutrition and Forage Section of beefandlamb.ahdb.org.uk/returnsA representative sample of the forage should be sent to a laboratory for forage analysis to enable accurate rationing. A full guide to silage analysis is given in Appendix 8. A quick reference guide for grass silage and hay is shown in Table 13, giving a typical range and target values. For haylage, bear in mind that dry matter will be higher (normally between 60 to 80%), sugars may be higher and there will be minimum fermentation.
Table 11. Lying area allowances
Type of sheep Area on straw (m2/ewe)
Large ewe 60–90kg in-lamb 1.2–1.4
Large ewe 60–90kg in early lactation 1.4–1.8
Large ewe 60–90kg – with lambs to 6 weeks of age 2.0–2.2
Small ewe 45–60kg in-lamb 1.0–1.3
Small ewe 45–60kg in lactation 1.3–1.7
Small ewe 45–60kg – with lambs to 6 weeks of age 1.8–2.0
Table 12. Trough space
Concentrates (mm/ewe)
Restricted forage
(mm/ewe)
Ad-libforage and
TMR* (mm/ewe)
Large ewes (70–90kg) 500 250 150
Small ewes (50–70kg) 450 200 150
Notes: *TMR use the same allowance as ad-lib forage.
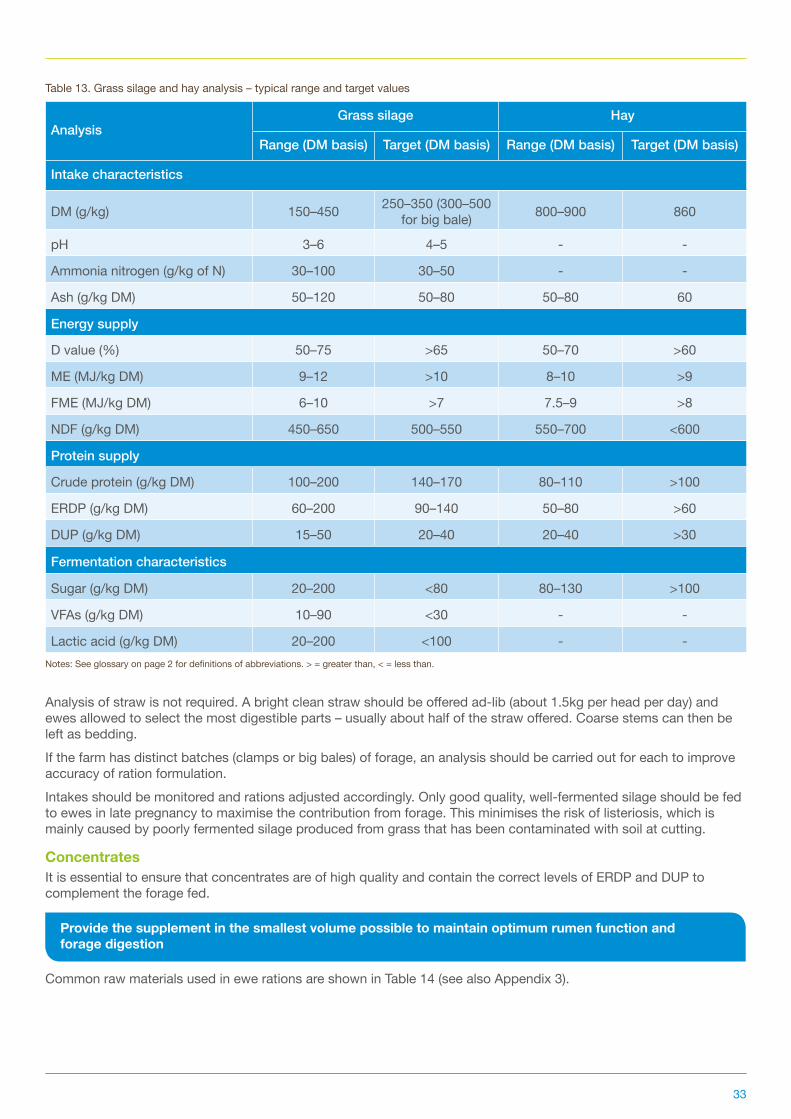
33
Table 13. Grass silage and hay analysis – typical range and target values
AnalysisGrass silage Hay
Range(DMbasis) Target(DMbasis) Range(DMbasis) Target(DMbasis)
Intake characteristics
DM (g/kg) 150–450 250–350 (300–500 for big bale) 800–900 860
pH 3–6 4–5 - -
Ammonia nitrogen (g/kg of N) 30–100 30–50 - -
Ash (g/kg DM) 50–120 50–80 50–80 60
Energy supply
D value (%) 50–75 >65 50–70 >60
ME (MJ/kg DM) 9–12 >10 8–10 >9
FME (MJ/kg DM) 6–10 >7 7.5–9 >8
NDF (g/kg DM) 450–650 500–550 550–700 <600
Protein supply
Crude protein (g/kg DM) 100–200 140–170 80–110 >100
ERDP (g/kg DM) 60–200 90–140 50–80 >60
DUP (g/kg DM) 15–50 20–40 20–40 >30
Fermentation characteristics
Sugar (g/kg DM) 20–200 <80 80–130 >100
VFAs (g/kg DM) 10–90 <30 - -
Lactic acid (g/kg DM) 20–200 <100 - -Notes: See glossary on page 2 for definitions of abbreviations. > = greater than, < = less than.
Analysis of straw is not required. A bright clean straw should be offered ad-lib (about 1.5kg per head per day) and ewes allowed to select the most digestible parts – usually about half of the straw offered. Coarse stems can then be left as bedding. If the farm has distinct batches (clamps or big bales) of forage, an analysis should be carried out for each to improve accuracy of ration formulation. Intakes should be monitored and rations adjusted accordingly. Only good quality, well-fermented silage should be fed to ewes in late pregnancy to maximise the contribution from forage. This minimises the risk of listeriosis, which is mainly caused by poorly fermented silage produced from grass that has been contaminated with soil at cutting.
ConcentratesIt is essential to ensure that concentrates are of high quality and contain the correct levels of ERDP and DUP to complement the forage fed.
Provide the supplement in the smallest volume possible to maintain optimum rumen function and forage digestion
Common raw materials used in ewe rations are shown in Table 14 (see also Appendix 3).
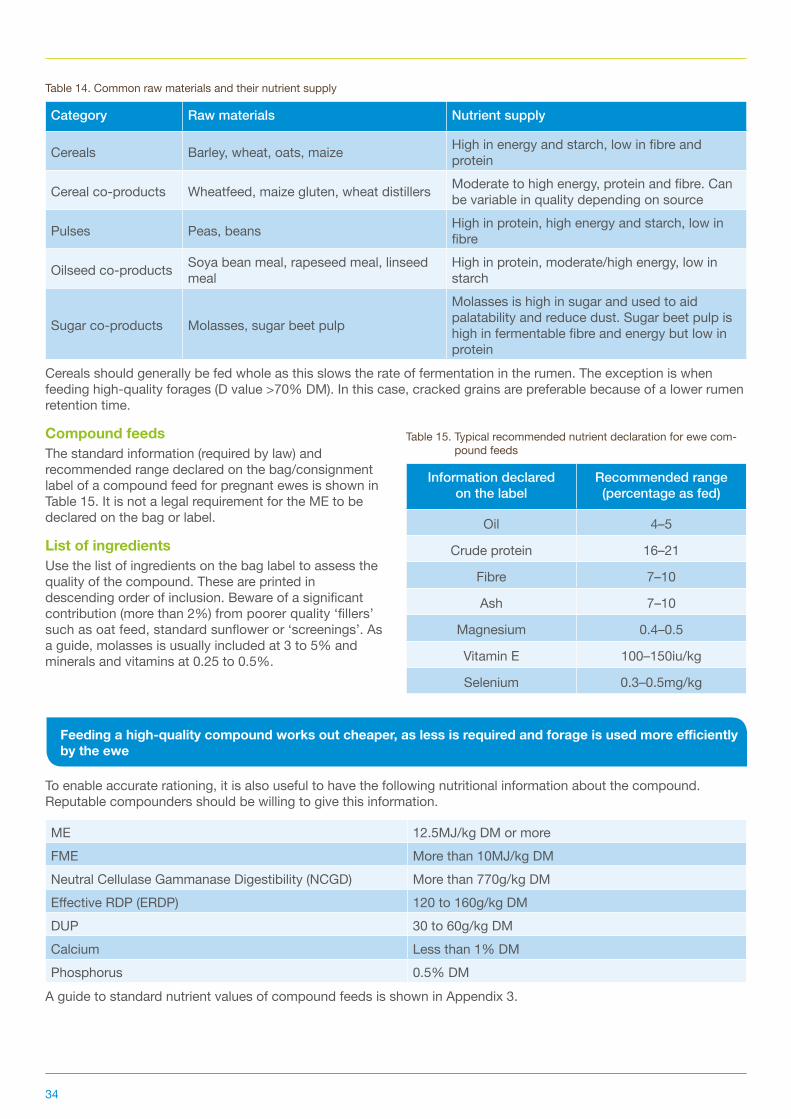
34
Table 14. Common raw materials and their nutrient supply
Category Raw materials Nutrient supply
Cereals Barley, wheat, oats, maize High in energy and starch, low in fibre and protein
Cereal co-products Wheatfeed, maize gluten, wheat distillers Moderate to high energy, protein and fibre. Can be variable in quality depending on source
Pulses Peas, beans High in protein, high energy and starch, low in fibre
Oilseed co-products Soya bean meal, rapeseed meal, linseed meal
High in protein, moderate/high energy, low in starch
Sugar co-products Molasses, sugar beet pulp
Molasses is high in sugar and used to aid palatability and reduce dust. Sugar beet pulp is high in fermentable fibre and energy but low in protein
Cereals should generally be fed whole as this slows the rate of fermentation in the rumen. The exception is when feeding high-quality forages (D value >70% DM). In this case, cracked grains are preferable because of a lower rumen retention time.
Compound feedsThe standard information (required by law) and recommended range declared on the bag/consignment label of a compound feed for pregnant ewes is shown in Table 15. It is not a legal requirement for the ME to be declared on the bag or label.
List of ingredientsUse the list of ingredients on the bag label to assess the quality of the compound. These are printed in descending order of inclusion. Beware of a significant contribution (more than 2%) from poorer quality ‘fillers’ such as oat feed, standard sunflower or ‘screenings’. As a guide, molasses is usually included at 3 to 5% and minerals and vitamins at 0.25 to 0.5%.
Feedingahigh-qualitycompoundworksoutcheaper,aslessisrequiredandforageisusedmoreefficientlyby the ewe
To enable accurate rationing, it is also useful to have the following nutritional information about the compound. Reputable compounders should be willing to give this information.
ME 12.5MJ/kg DM or moreFME More than 10MJ/kg DMNeutral Cellulase Gammanase Digestibility (NCGD) More than 770g/kg DM Effective RDP (ERDP) 120 to 160g/kg DMDUP 30 to 60g/kg DMCalcium Less than 1% DMPhosphorus 0.5% DM
A guide to standard nutrient values of compound feeds is shown in Appendix 3.
Table 15. Typical recommended nutrient declaration for ewe com-pound feeds
Information declared onthelabel
Recommended range (percentage as fed)
Oil 4–5
Crude protein 16–21
Fibre 7–10
Ash 7–10
Magnesium 0.4–0.5
Vitamin E 100–150iu/kg
Selenium 0.3–0.5mg/kg
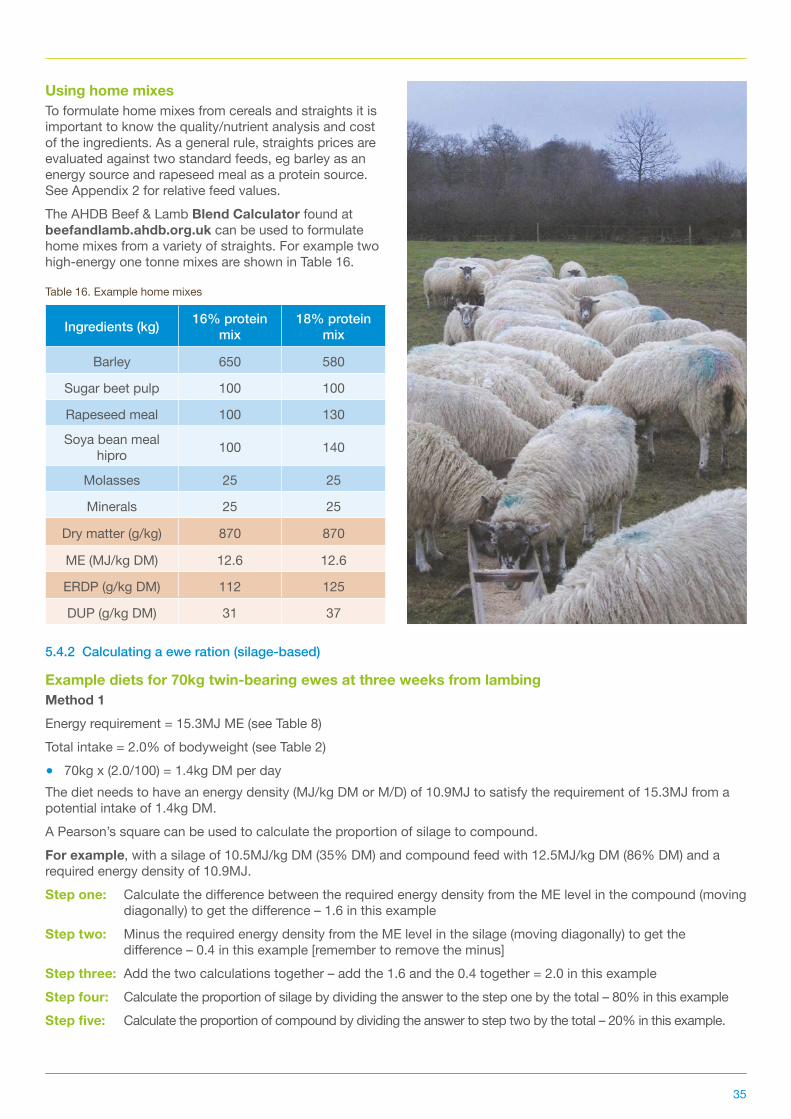
35
Using home mixesTo formulate home mixes from cereals and straights it is important to know the quality/nutrient analysis and cost of the ingredients. As a general rule, straights prices are evaluated against two standard feeds, eg barley as an energy source and rapeseed meal as a protein source. See Appendix 2 for relative feed values.The AHDB Beef & Lamb Blend Calculator found at beefandlamb.ahdb.org.uk can be used to formulate home mixes from a variety of straights. For example two high-energy one tonne mixes are shown in Table 16.
5.4.2Calculatingaeweration(silage-based)
Example diets for 70kg twin-bearing ewes at three weeks from lambingMethod 1Energy requirement = 15.3MJ ME (see Table 8)Total intake = 2.0% of bodyweight (see Table 2)
● 70kg x (2.0/100) = 1.4kg DM per dayThe diet needs to have an energy density (MJ/kg DM or M/D) of 10.9MJ to satisfy the requirement of 15.3MJ from a potential intake of 1.4kg DM.A Pearson’s square can be used to calculate the proportion of silage to compound.For example, with a silage of 10.5MJ/kg DM (35% DM) and compound feed with 12.5MJ/kg DM (86% DM) and a required energy density of 10.9MJ.Step one: Calculate the difference between the required energy density from the ME level in the compound (moving
diagonally) to get the difference – 1.6 in this exampleStep two: Minus the required energy density from the ME level in the silage (moving diagonally) to get the
difference – 0.4 in this example [remember to remove the minus]Step three: Add the two calculations together – add the 1.6 and the 0.4 together = 2.0 in this example Step four: Calculate the proportion of silage by dividing the answer to the step one by the total – 80% in this exampleStepfive: Calculate the proportion of compound by dividing the answer to step two by the total – 20% in this example.
Table 16. Example home mixes
Ingredients (kg) 16% protein mix
18% protein mix
Barley 650 580
Sugar beet pulp 100 100
Rapeseed meal 100 130
Soya bean meal hipro 100 140
Molasses 25 25
Minerals 25 25
Dry matter (g/kg) 870 870
ME (MJ/kg DM) 12.6 12.6
ERDP (g/kg DM) 112 125
DUP (g/kg DM) 31 37
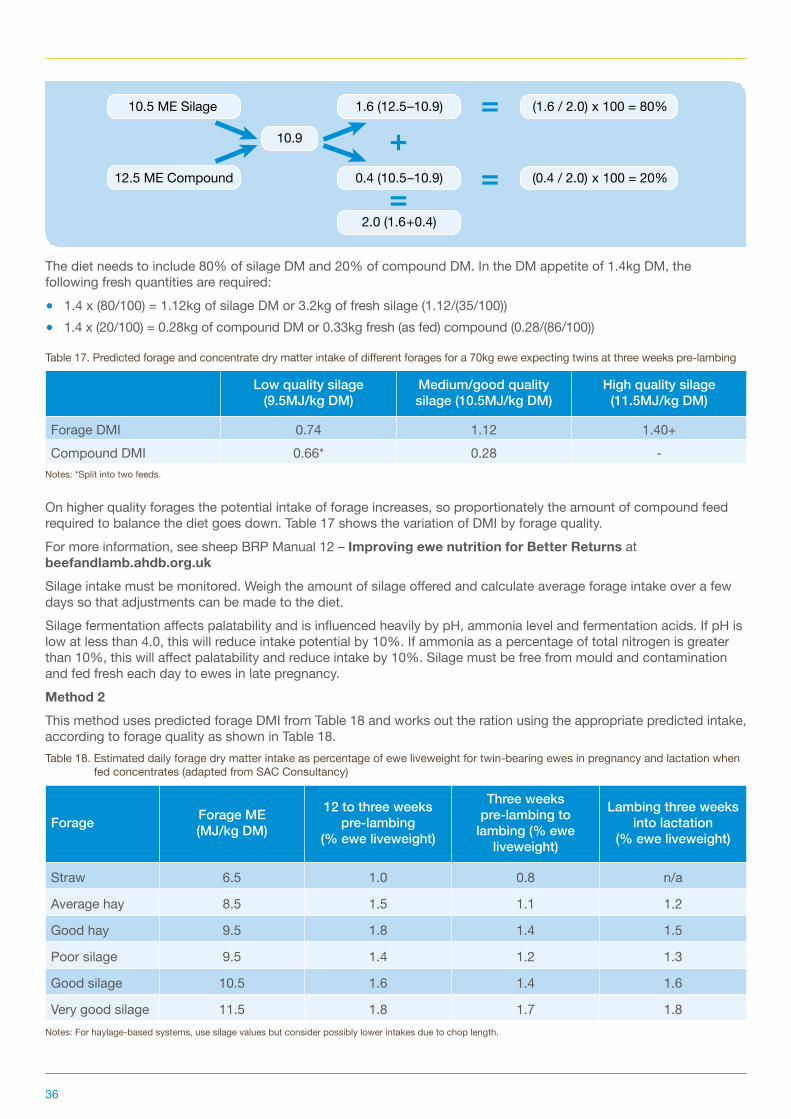
36
Table 17. Predicted forage and concentrate dry matter intake of different forages for a 70kg ewe expecting twins at three weeks pre-lambing
Low quality silage (9.5MJ/kg DM)
Medium/good quality silage (10.5MJ/kg DM)
High quality silage (11.5MJ/kg DM)
Forage DMI 0.74 1.12 1.40+Compound DMI 0.66* 0.28 -
Notes: *Split into two feeds.
The diet needs to include 80% of silage DM and 20% of compound DM. In the DM appetite of 1.4kg DM, the following fresh quantities are required:
● 1.4 x (80/100) = 1.12kg of silage DM or 3.2kg of fresh silage (1.12/(35/100)) ● 1.4 x (20/100) = 0.28kg of compound DM or 0.33kg fresh (as fed) compound (0.28/(86/100))
On higher quality forages the potential intake of forage increases, so proportionately the amount of compound feed required to balance the diet goes down. Table 17 shows the variation of DMI by forage quality.For more information, see sheep BRP Manual 12 – Improving ewe nutrition for Better Returns at beefandlamb.ahdb.org.ukSilage intake must be monitored. Weigh the amount of silage offered and calculate average forage intake over a few days so that adjustments can be made to the diet. Silage fermentation affects palatability and is influenced heavily by pH, ammonia level and fermentation acids. If pH is low at less than 4.0, this will reduce intake potential by 10%. If ammonia as a percentage of total nitrogen is greater than 10%, this will affect palatability and reduce intake by 10%. Silage must be free from mould and contamination and fed fresh each day to ewes in late pregnancy.Method 2This method uses predicted forage DMI from Table 18 and works out the ration using the appropriate predicted intake, according to forage quality as shown in Table 18.Table 18. Estimated daily forage dry matter intake as percentage of ewe liveweight for twin-bearing ewes in pregnancy and lactation when
fed concentrates (adapted from SAC Consultancy)
Forage Forage ME (MJ/kg DM)
12 to three weeks pre-lambing
(% ewe liveweight)
Three weeks pre-lambingtolambing(%ewe
liveweight)
Lambingthreeweeksinto lactation
(% ewe liveweight)
Straw 6.5 1.0 0.8 n/a
Average hay 8.5 1.5 1.1 1.2
Good hay 9.5 1.8 1.4 1.5
Poor silage 9.5 1.4 1.2 1.3
Good silage 10.5 1.6 1.4 1.6
Very good silage 11.5 1.8 1.7 1.8Notes: For haylage-based systems, use silage values but consider possibly lower intakes due to chop length.
10.5 ME Silage
12.5 ME Compound
1.6 (12.5–10.9)
0.4 (10.5–10.9)
2.0 (1.6+0.4)
10.9 +
=
=
=
(1.6 / 2.0) x 100 = 80%
(0.4 / 2.0) x 100 = 20%
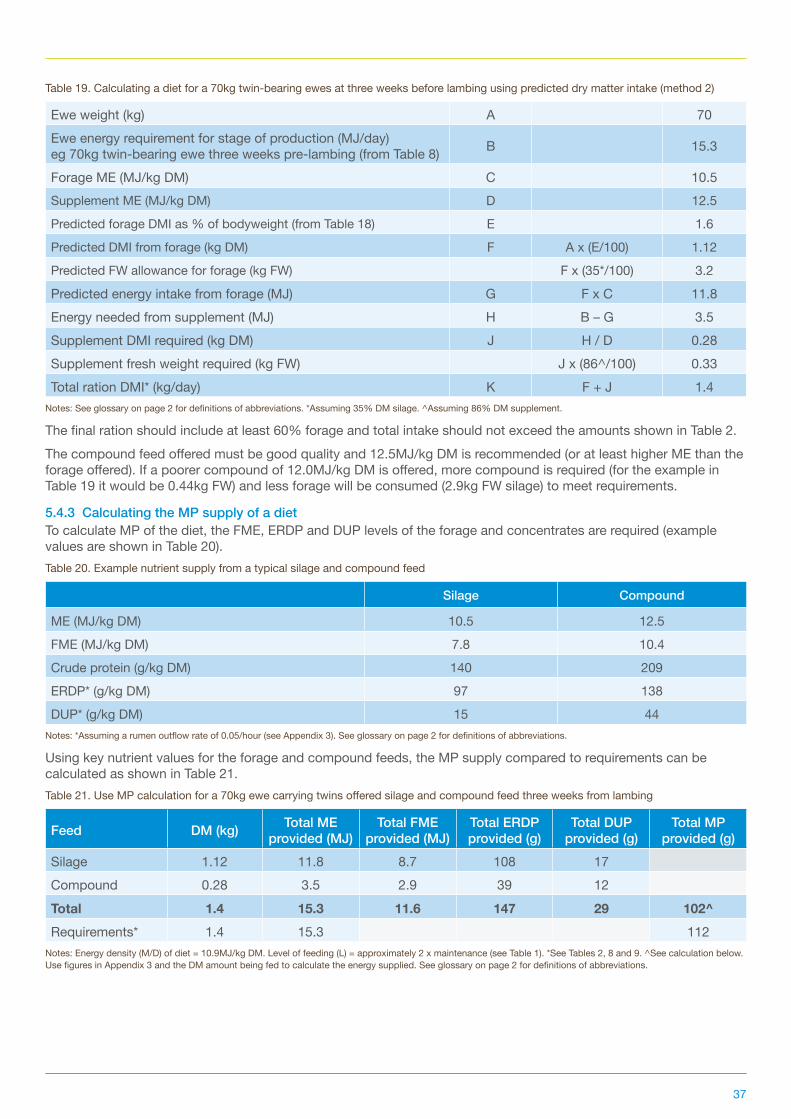
37
Table 19. Calculating a diet for a 70kg twin-bearing ewes at three weeks before lambing using predicted dry matter intake (method 2)
Ewe weight (kg) A 70Ewe energy requirement for stage of production (MJ/day) eg 70kg twin-bearing ewe three weeks pre-lambing (from Table 8) B 15.3
Forage ME (MJ/kg DM) C 10.5Supplement ME (MJ/kg DM) D 12.5Predicted forage DMI as % of bodyweight (from Table 18) E 1.6Predicted DMI from forage (kg DM) F A x (E/100) 1.12Predicted FW allowance for forage (kg FW) F x (35*/100) 3.2
Predicted energy intake from forage (MJ) G F x C 11.8Energy needed from supplement (MJ) H B – G 3.5Supplement DMI required (kg DM) J H / D 0.28Supplement fresh weight required (kg FW) J x (86^/100) 0.33Total ration DMI* (kg/day) K F + J 1.4
Notes: See glossary on page 2 for definitions of abbreviations. *Assuming 35% DM silage. ^Assuming 86% DM supplement.
The final ration should include at least 60% forage and total intake should not exceed the amounts shown in Table 2.The compound feed offered must be good quality and 12.5MJ/kg DM is recommended (or at least higher ME than the forage offered). If a poorer compound of 12.0MJ/kg DM is offered, more compound is required (for the example in Table 19 it would be 0.44kg FW) and less forage will be consumed (2.9kg FW silage) to meet requirements.
5.4.3 Calculating the MP supply of a diet To calculate MP of the diet, the FME, ERDP and DUP levels of the forage and concentrates are required (example values are shown in Table 20).Table 20. Example nutrient supply from a typical silage and compound feed
Silage Compound
ME (MJ/kg DM) 10.5 12.5
FME (MJ/kg DM) 7.8 10.4
Crude protein (g/kg DM) 140 209
ERDP* (g/kg DM) 97 138
DUP* (g/kg DM) 15 44Notes: *Assuming a rumen outflow rate of 0.05/hour (see Appendix 3). See glossary on page 2 for definitions of abbreviations.
Using key nutrient values for the forage and compound feeds, the MP supply compared to requirements can be calculated as shown in Table 21.Table 21. Use MP calculation for a 70kg ewe carrying twins offered silage and compound feed three weeks from lambing
Feed DM (kg) Total ME provided (MJ)
Total FME provided (MJ)
Total ERDP provided (g)
Total DUP provided (g)
Total MP provided (g)
Silage 1.12 11.8 8.7 108 17Compound 0.28 3.5 2.9 39 12Total 1.4 15.3 11.6 147 29 102^Requirements* 1.4 15.3 112
Notes: Energy density (M/D) of diet = 10.9MJ/kg DM. Level of feeding (L) = approximately 2 x maintenance (see Table 1). *See Tables 2, 8 and 9. ^See calculation below. Use figures in Appendix 3 and the DM amount being fed to calculate the energy supplied. See glossary on page 2 for definitions of abbreviations.
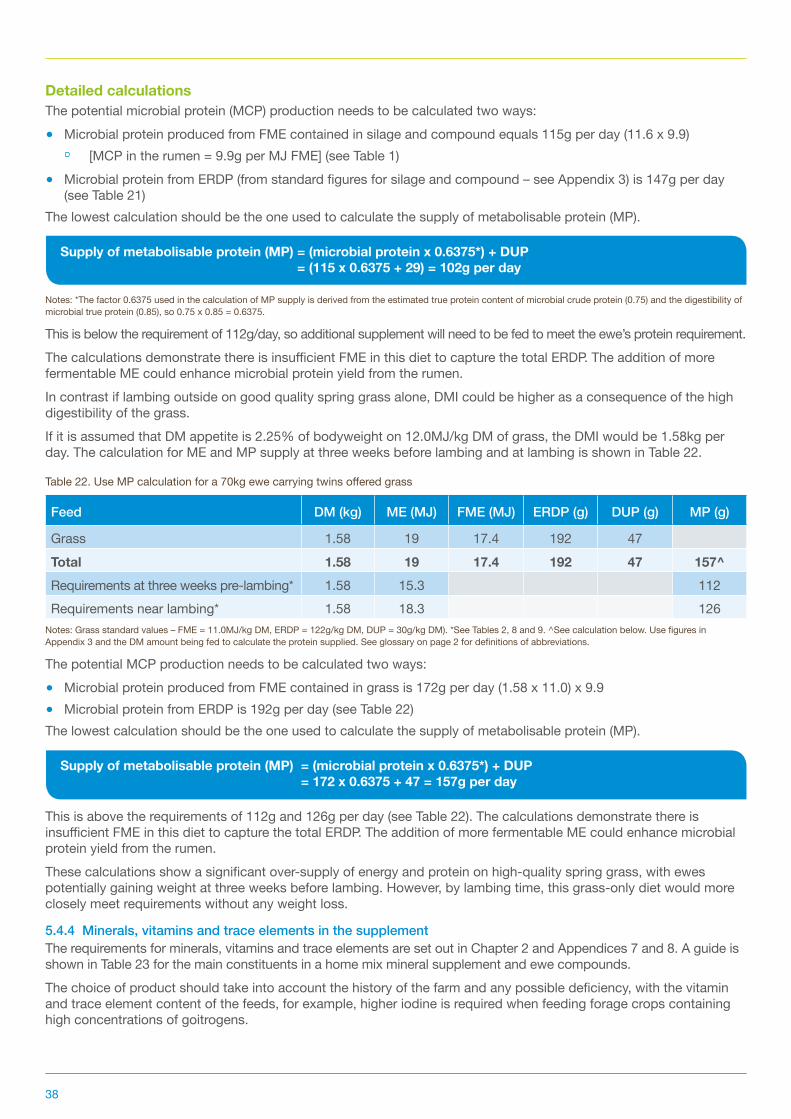
38
Detailed calculations The potential microbial protein (MCP) production needs to be calculated two ways:
● Microbial protein produced from FME contained in silage and compound equals 115g per day (11.6 x 9.9) [MCP in the rumen = 9.9g per MJ FME] (see Table 1)
● Microbial protein from ERDP (from standard figures for silage and compound – see Appendix 3) is 147g per day (see Table 21)
The lowest calculation should be the one used to calculate the supply of metabolisable protein (MP).
Supply of metabolisable protein (MP) = (microbial protein x 0.6375*) + DUP = (115 x 0.6375 + 29) = 102g per day
Notes: *The factor 0.6375 used in the calculation of MP supply is derived from the estimated true protein content of microbial crude protein (0.75) and the digestibility of microbial true protein (0.85), so 0.75 x 0.85 = 0.6375.
This is below the requirement of 112g/day, so additional supplement will need to be fed to meet the ewe’s protein requirement.The calculations demonstrate there is insufficient FME in this diet to capture the total ERDP. The addition of more fermentable ME could enhance microbial protein yield from the rumen. In contrast if lambing outside on good quality spring grass alone, DMI could be higher as a consequence of the high digestibility of the grass.If it is assumed that DM appetite is 2.25% of bodyweight on 12.0MJ/kg DM of grass, the DMI would be 1.58kg per day. The calculation for ME and MP supply at three weeks before lambing and at lambing is shown in Table 22.
Table 22. Use MP calculation for a 70kg ewe carrying twins offered grass
Feed DM (kg) ME (MJ) FME (MJ) ERDP (g) DUP (g) MP (g)
Grass 1.58 19 17.4 192 47Total 1.58 19 17.4 192 47 157^Requirements at three weeks pre-lambing* 1.58 15.3 112Requirements near lambing* 1.58 18.3 126
Notes: Grass standard values – FME = 11.0MJ/kg DM, ERDP = 122g/kg DM, DUP = 30g/kg DM). *See Tables 2, 8 and 9. ^See calculation below. Use figures in Appendix 3 and the DM amount being fed to calculate the protein supplied. See glossary on page 2 for definitions of abbreviations.
The potential MCP production needs to be calculated two ways: ● Microbial protein produced from FME contained in grass is 172g per day (1.58 x 11.0) x 9.9 ● Microbial protein from ERDP is 192g per day (see Table 22)
The lowest calculation should be the one used to calculate the supply of metabolisable protein (MP).
Supply of metabolisable protein (MP) = (microbial protein x 0.6375*) + DUP = 172 x 0.6375 + 47 = 157g per day
This is above the requirements of 112g and 126g per day (see Table 22). The calculations demonstrate there is insufficient FME in this diet to capture the total ERDP. The addition of more fermentable ME could enhance microbial protein yield from the rumen. These calculations show a significant over-supply of energy and protein on high-quality spring grass, with ewes potentially gaining weight at three weeks before lambing. However, by lambing time, this grass-only diet would more closely meet requirements without any weight loss.
5.4.4 Minerals, vitamins and trace elements in the supplementThe requirements for minerals, vitamins and trace elements are set out in Chapter 2 and Appendices 7 and 8. A guide is shown in Table 23 for the main constituents in a home mix mineral supplement and ewe compounds. The choice of product should take into account the history of the farm and any possible deficiency, with the vitamin and trace element content of the feeds, for example, higher iodine is required when feeding forage crops containing high concentrations of goitrogens.

39
Bespoke supplements are available and at competitive prices. There is no evidence to support any advantages from over-supply. Indeed, with calcium, there are clear indications that excess can predispose ewes to hypocalcaemia.Table 23. Low and high range levels for key mineral, trace element and vitamin levels in supplement and compound feed
Calcium (%)
Phosphorus (%)
Magnesium (%)
Vitamin E (iu/kg)
Selenium (mg/kg)
Iodine (mg/kg)
Home mix mineral (included @25kg/t) 12–18 5–8 3–8 4,000–5,000 20–30 300–400
Compound feed 0.7–1.0 0.4–0.6 0.3–0.7 80–150 0.5–1.0 6.5
5.4.5 Checking the major mineral content of a rationIt is good practice to check the balance of major minerals in ewe diets both for late pregnancy and lactation. Use information from forage analysis, straights and compound feeds. Too little or too much, or an imbalance of the major minerals can precipitate problems with hypocalcaemia and hypomagnesaemia. The major mineral content of a typical silage and a compound feed are shown in Table 24.An example of a ration for twin-bearing ewes in late pregnancy offered a typical silage and compound diet is shown in Table 24.
Table 25. Major mineral calculation for late pregnancy ration for 70kg twin-bearing ewes three weeks before lambing
DMI(kg)
Calcium(g)
Phosphorus (g)
Magnesium (g)
Silage 1.0 6 4 2
Compound feed (value from Table 24 x proportion) 0.4 4.4 (11 x 0.4) 2.4 (6 x 0.4) 2 (5 x 0.4)
Total supplied by diet (g/day) 10.4 6.4 4
Ewe requirements (g/day) [ARC, 1980] 11.2 7.3 1.9
The figures in Table 25 show that this diet is marginally low in calcium and phosphorus but is over-supplying magnesium. In practice, this is likely to be satisfactory (see Section 5.8 for further information).Using the same silage and a higher magnesium compound, Table 26 shows the supply and requirements for a ewe in early lactation.
Table 26. Major mineral calculation for lactation ration for 70kg ewe rearing twins three weeks post-lambing giving three litres of milk
DMI (kg) Calcium (g) Phosphorus (g) Magnesium (g)
Grass 1.59 9.4 6.2 2.7
Compound feed (values from Table 24 x proportion in diet) 0.86 9.5 (11g x 0.86) 5.2 (6g x 0.86) 6 (7g x 0.86)
Total supplied (g/day) 2.45 18.9 11.4 8.7
Ewe requirements (g/day) [ARC, 1980] 18.9 12.6 4.9Notes: See glossary on page 2 for definitions of abbreviations.
As greater quantities of compound are fed in lactation, this diet is satisfactory. The example figures in Table 26 show an over-supply of magnesium, but this is acceptable, given the high risk of grass staggers on some farms in spring (see Section 6.10 for further information).
Table 24. Example major mineral composition of silage and com-pound feeds
Calcium (g/kg DM)
Phosphorus (g/kg DM)
Magnesium (g/kg DM)
Silage/grass 6 4 2Compound pre-lambing 11 6 5
Compound post-lambing 11 6 7
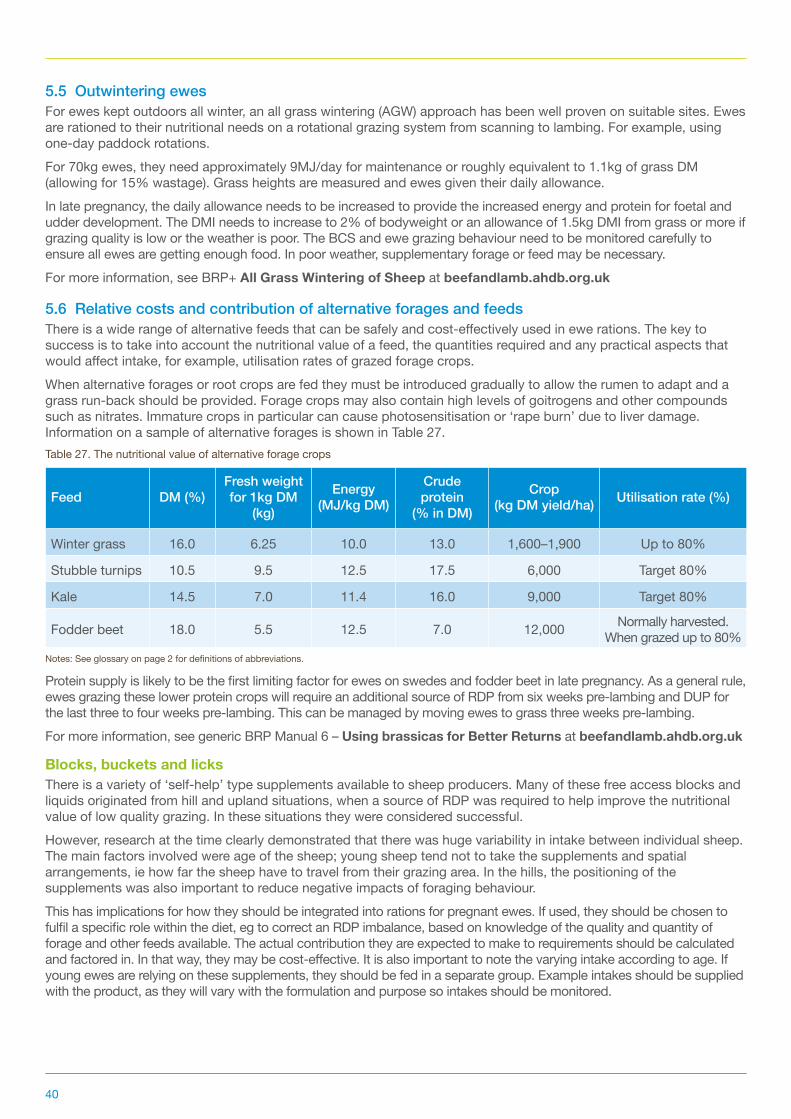
40
5.5 Outwintering ewesFor ewes kept outdoors all winter, an all grass wintering (AGW) approach has been well proven on suitable sites. Ewes are rationed to their nutritional needs on a rotational grazing system from scanning to lambing. For example, using one-day paddock rotations.For 70kg ewes, they need approximately 9MJ/day for maintenance or roughly equivalent to 1.1kg of grass DM (allowing for 15% wastage). Grass heights are measured and ewes given their daily allowance. In late pregnancy, the daily allowance needs to be increased to provide the increased energy and protein for foetal and udder development. The DMI needs to increase to 2% of bodyweight or an allowance of 1.5kg DMI from grass or more if grazing quality is low or the weather is poor. The BCS and ewe grazing behaviour need to be monitored carefully to ensure all ewes are getting enough food. In poor weather, supplementary forage or feed may be necessary.For more information, see BRP+ All Grass Wintering of Sheep at beefandlamb.ahdb.org.uk
5.6RelativecostsandcontributionofalternativeforagesandfeedsThere is a wide range of alternative feeds that can be safely and cost-effectively used in ewe rations. The key to success is to take into account the nutritional value of a feed, the quantities required and any practical aspects that would affect intake, for example, utilisation rates of grazed forage crops.When alternative forages or root crops are fed they must be introduced gradually to allow the rumen to adapt and a grass run-back should be provided. Forage crops may also contain high levels of goitrogens and other compounds such as nitrates. Immature crops in particular can cause photosensitisation or ‘rape burn’ due to liver damage. Information on a sample of alternative forages is shown in Table 27.Table 27. The nutritional value of alternative forage crops
Feed DM (%)Fresh weight for 1kg DM
(kg)
Energy (MJ/kg DM)
Crude protein
(% in DM)
Crop (kg DM yield/ha) Utilisation rate (%)
Winter grass 16.0 6.25 10.0 13.0 1,600–1,900 Up to 80%
Stubble turnips 10.5 9.5 12.5 17.5 6,000 Target 80%
Kale 14.5 7.0 11.4 16.0 9,000 Target 80%
Fodder beet 18.0 5.5 12.5 7.0 12,000 Normally harvested. When grazed up to 80%
Notes: See glossary on page 2 for definitions of abbreviations.
Protein supply is likely to be the first limiting factor for ewes on swedes and fodder beet in late pregnancy. As a general rule, ewes grazing these lower protein crops will require an additional source of RDP from six weeks pre-lambing and DUP for the last three to four weeks pre-lambing. This can be managed by moving ewes to grass three weeks pre-lambing.For more information, see generic BRP Manual 6 – Using brassicas for Better Returns at beefandlamb.ahdb.org.uk
Blocks, buckets and licksThere is a variety of ‘self-help’ type supplements available to sheep producers. Many of these free access blocks and liquids originated from hill and upland situations, when a source of RDP was required to help improve the nutritional value of low quality grazing. In these situations they were considered successful. However, research at the time clearly demonstrated that there was huge variability in intake between individual sheep. The main factors involved were age of the sheep; young sheep tend not to take the supplements and spatial arrangements, ie how far the sheep have to travel from their grazing area. In the hills, the positioning of the supplements was also important to reduce negative impacts of foraging behaviour.This has implications for how they should be integrated into rations for pregnant ewes. If used, they should be chosen to fulfil a specific role within the diet, eg to correct an RDP imbalance, based on knowledge of the quality and quantity of forage and other feeds available. The actual contribution they are expected to make to requirements should be calculated and factored in. In that way, they may be cost-effective. It is also important to note the varying intake according to age. If young ewes are relying on these supplements, they should be fed in a separate group. Example intakes should be supplied with the product, as they will vary with the formulation and purpose so intakes should be monitored.
41
Other additivesEvidence for the cost-effectiveness of feed additives in diets for ewes is sparse.
● Protected fats (eg Megalac) have been shown to have no benefit for ewes pre-lambing, having no action in the rumen, but they do appear to increase the fat content of milk (see lactation)
● Dietary fish oil has been shown to benefit lamb vigour at birth but has a negative impact on colostrum output and fat concentration. Research suggests that these may only be useful at relatively low inclusion rates
● Long chain fatty acids, such as docosahexaenoic acid (DHA) supplement, has been show to improve neonatal vigour
● Mannan-oligosaccharides, which act as prebiotics, have recently been studied as alternatives to antibiotics in livestock diets. They improve the immunological system of animals but more research is required in sheep
5.7 Winter shearing
Shorn ewes eat 10 to 15% more forage than unshorn ewes and their lambs are 0.4 to 0.6kg heavier at birth
Winter shearing is generally considered to increase forage DMI and increase lamb birthweight and survival. Shearing allows more ewes to be housed at once, which can be beneficial on farms with limited housing. It is critical that ewes are not shorn too close to lambing, since bare-skinned ewes are more susceptible to cold, once turned out after lambing and the risk of mastitis increases. In the UK, it is recommended to shear no closer than eight weeks pre-lambing to allow sufficient regrowth of wool before turnout.
5.8 Hypocalcaemia
Diets should not contain excess calcium, phosphorus or magnesium
Hypocalcaemia can occur in late pregnancy, especially in ewes carrying multiple lambs. It is caused by the sudden increase in demand for calcium by the ewe to make colostrum and milk, which is not immediately met by a release of calcium from the bones. Mobilisation of calcium from bone is in response to a fall in circulating blood calcium. High dietary supply of calcium or antagonistic effects of excess phosphorus or magnesium interfere with this process. Older ewes tend to be more susceptible to calcium deficiency, due to the loss of receptors for calcium absorption in their intestines and calcium mobilisation in their bones.Symptomatically, hypocalcaemia resembles pregnancy toxaemia, being most likely to occur in older, twin-bearing ewes exposed to a change in, or shortage of food, with or without stress. Symptoms include uncoordinated movements, tremors and rapid breathing, progressing to paralysis, coma and death if not treated rapidly. In the early stages of the disease, treatment by intravenous injection with calcium borogluconate is generally effective and ewes will stand and eat in about one hour from treatment. Often diagnosis is the response to treatment but, if time allows, blood results will show low calcium levels and this will determine whether the ewe has hypocalcaemia or pregnancy toxaemia.In late pregnancy, ewes should be offered diets with calcium levels close to, or slightly below, requirements to maintain the ability of the ewe to mobilise bone calcium. Sudden changes in diet and stress such as movement and transport in late pregnancy should also be avoided.
5.9 Pregnancy toxaemia
Minimise any form of stress in late pregnancy to reduce the risk of hypocalcaemia and pregnancy toxaemia
During late pregnancy, rapidly increasing energy demands of the growing foetuses, combined with hormonal interactions of insulin and prolactin, have an impact on lipid metabolism, putting the ewe at risk of developing pregnancy toxaemia (also known as ketosis or twin lamb disease). It is characterised by hypoglycaemia and hyperketonaemia, resulting from the inability of the ewe to maintain adequate energy balance in the last five to six weeks of pregnancy.
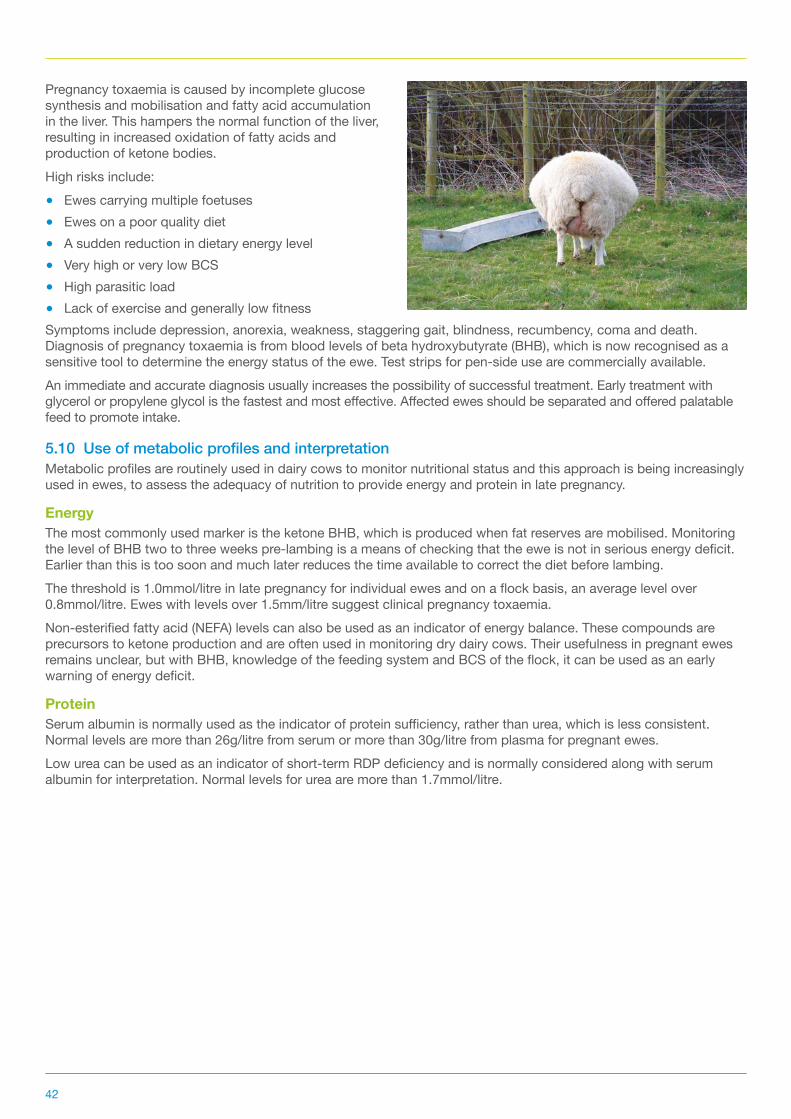
42
Pregnancy toxaemia is caused by incomplete glucose synthesis and mobilisation and fatty acid accumulation in the liver. This hampers the normal function of the liver, resulting in increased oxidation of fatty acids and production of ketone bodies.High risks include:
● Ewes carrying multiple foetuses ● Ewes on a poor quality diet ● A sudden reduction in dietary energy level ● Very high or very low BCS ● High parasitic load ● Lack of exercise and generally low fitness
Symptoms include depression, anorexia, weakness, staggering gait, blindness, recumbency, coma and death. Diagnosis of pregnancy toxaemia is from blood levels of beta hydroxybutyrate (BHB), which is now recognised as a sensitive tool to determine the energy status of the ewe. Test strips for pen-side use are commercially available. An immediate and accurate diagnosis usually increases the possibility of successful treatment. Early treatment with glycerol or propylene glycol is the fastest and most effective. Affected ewes should be separated and offered palatable feed to promote intake.
5.10UseofmetabolicprofilesandinterpretationMetabolic profiles are routinely used in dairy cows to monitor nutritional status and this approach is being increasingly used in ewes, to assess the adequacy of nutrition to provide energy and protein in late pregnancy.
EnergyThe most commonly used marker is the ketone BHB, which is produced when fat reserves are mobilised. Monitoring the level of BHB two to three weeks pre-lambing is a means of checking that the ewe is not in serious energy deficit. Earlier than this is too soon and much later reduces the time available to correct the diet before lambing. The threshold is 1.0mmol/litre in late pregnancy for individual ewes and on a flock basis, an average level over 0.8mmol/litre. Ewes with levels over 1.5mm/litre suggest clinical pregnancy toxaemia. Non-esterified fatty acid (NEFA) levels can also be used as an indicator of energy balance. These compounds are precursors to ketone production and are often used in monitoring dry dairy cows. Their usefulness in pregnant ewes remains unclear, but with BHB, knowledge of the feeding system and BCS of the flock, it can be used as an early warning of energy deficit.
ProteinSerum albumin is normally used as the indicator of protein sufficiency, rather than urea, which is less consistent. Normal levels are more than 26g/litre from serum or more than 30g/litre from plasma for pregnant ewes. Low urea can be used as an indicator of short-term RDP deficiency and is normally considered along with serum albumin for interpretation. Normal levels for urea are more than 1.7mmol/litre.

43
5.11 Prolapse
Prolapse occurs most often in older ewes, fatter ewes and ewes carrying multiple lambs
Prolapse is the posterior displacement and exterior protrusion of one or more of the vagina, uterus or rectum. It generally occurs in the last month of pregnancy and affects about 1% of pregnant sheep in the UK. The welfare of sheep affected by prolapse is compromised and the prolapse needs to be replaced quickly and hygienically.Some predisposing factors are thought to be:
● Excessive BCS, greater than 4 ● Carrying multiple foetuses that are well grown ● Energy and protein imbalance in the diet ● Large meals of concentrates ● Limited exercise ● Lameness, leading to prolonged periods of sternal
recumbency ● Very short tail docking
To prevent prolapse, ewes must be kept at the correct BCS and fed according to their condition and number of lambs carried. Feeding ad-lib forage, making sure trough space allowances are met and only small meals of concentrates, most ideally in a TMR, help reduce the incidence of prolapse. Hypocalcaemia and pregnancy toxaemia may be a subsequent consequence of prolapse in the ewe.
Cull ewes that prolapse after weaning as likely to reoccur the following year

44
KEY OBJECTIVES ● High milk yield to support optimal lamb growth, ie 20kg at eight weeks for lowland lambs ● Maximum contribution from grass and forage ● Supplementaryfeedingtobridgeanygapbetweenrequirementsandforagesupply ● Low rate of mastitis ● Minimise the risk of hypomagnesaemia (grass staggers)
ACTIONS ● Plan grazing for lactation. Monitor sward height and kg/DM per ha available and supplement accordingly ● Group ewes for feeding by lamb numbers and BCS if practical ● Group young ewes together for preferential feeding where possible ● Considercreepforlambsifgrazingquality/quantityislimitingtheirintake ● Monitor ewe BCS and lamb growth ● Lamb eight-week weight is a KPI of ewe performance
BCS targets
Ewe type Lowland ewe (60–80kg) Hill ewe (40–60kg)
Target BCS at lambing 3.0–3.5 2.5
Target BCS at weaning 2.0–2.5 2
Bodyweight lost (kg) 6–8 2–3
Energy released (1MJ/50g weight loss) 120–160 40–60
Key nutritional requirements ThreatsRation to ME and MP requirements (AFRC 1993), as a minimum, by ewe BCS, number of lambs being reared and predicted milk yield
Inadequate energy and protein leads to rapid loss of ewe BCS and then poor milk yield and small weak lambs that fall short of the eight-week target
Good quality forage available at all times, including for lambs when they graze from three to four weeks old
Poor quality forage leads to low intake and higher concentrate use or loss of ewe BCS
Use sward height and DM estimates to plan grazing and need for supplementary feeding
Poor planning can lead to higher use of supplements, or poorer lamb growth and increased ewe BCS loss
Feed offered at the same times and with no sudden changes in feed type or quality
Sudden changes can create poor rumen function, hypomagnesaemia
Supplement with magnesium if high risk Hypomagnesaemia, poor milk yield
Supply adequate water close to grazing area. A 70kg ewe in peak lactation requires more than seven litres per day Reduced milk yield, poor lamb growth
Milk yield increases rapidly after lambing peaking at three to four weeks into lactation. Nutrient requirements double after lambing to meet the demands of milk production, sending the ewe into negative energy balance as her feed intake lags behind her nutritional requirements.
Chapter 6: Feeding period: lambing to weaning (lactation)
SUM
MA
RY
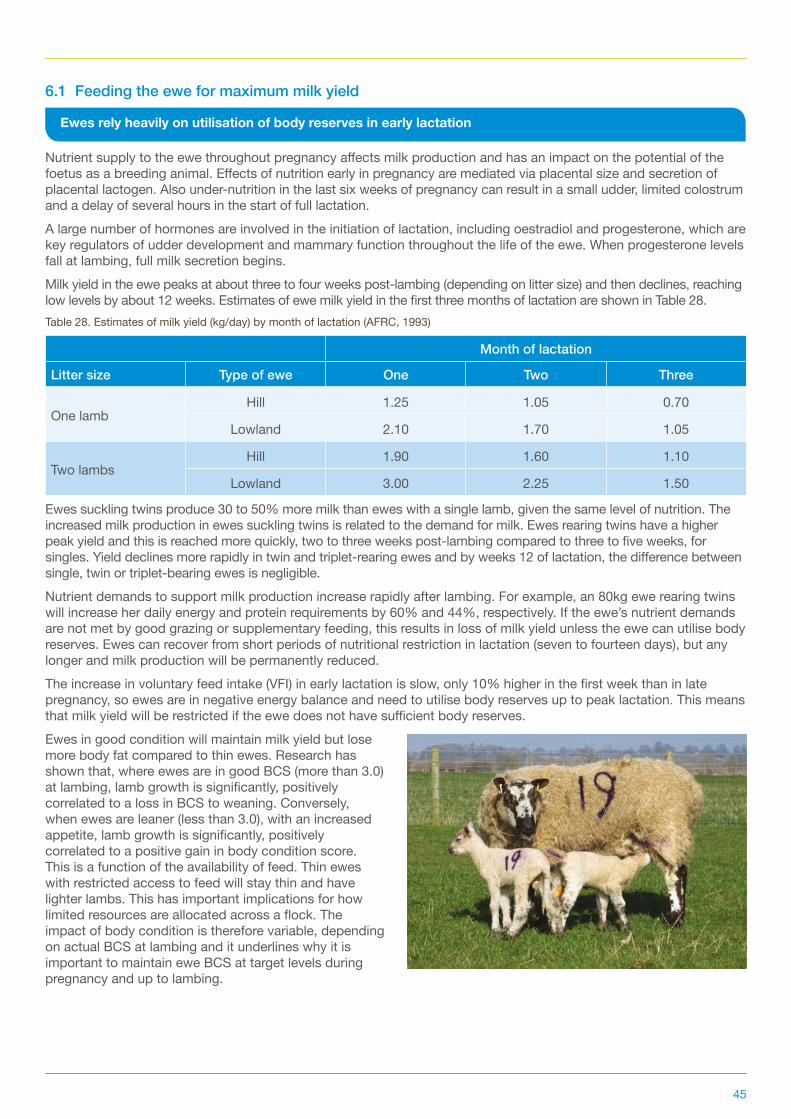
45
6.1 Feeding the ewe for maximum milk yield
Ewes rely heavily on utilisation of body reserves in early lactation
Nutrient supply to the ewe throughout pregnancy affects milk production and has an impact on the potential of the foetus as a breeding animal. Effects of nutrition early in pregnancy are mediated via placental size and secretion of placental lactogen. Also under-nutrition in the last six weeks of pregnancy can result in a small udder, limited colostrum and a delay of several hours in the start of full lactation.A large number of hormones are involved in the initiation of lactation, including oestradiol and progesterone, which are key regulators of udder development and mammary function throughout the life of the ewe. When progesterone levels fall at lambing, full milk secretion begins.Milk yield in the ewe peaks at about three to four weeks post-lambing (depending on litter size) and then declines, reaching low levels by about 12 weeks. Estimates of ewe milk yield in the first three months of lactation are shown in Table 28.Table 28. Estimates of milk yield (kg/day) by month of lactation (AFRC, 1993)
Month of lactation
Littersize Type of ewe One Two Three
One lambHill 1.25 1.05 0.70
Lowland 2.10 1.70 1.05
Two lambsHill 1.90 1.60 1.10
Lowland 3.00 2.25 1.50
Ewes suckling twins produce 30 to 50% more milk than ewes with a single lamb, given the same level of nutrition. The increased milk production in ewes suckling twins is related to the demand for milk. Ewes rearing twins have a higher peak yield and this is reached more quickly, two to three weeks post-lambing compared to three to five weeks, for singles. Yield declines more rapidly in twin and triplet-rearing ewes and by weeks 12 of lactation, the difference between single, twin or triplet-bearing ewes is negligible. Nutrient demands to support milk production increase rapidly after lambing. For example, an 80kg ewe rearing twins will increase her daily energy and protein requirements by 60% and 44%, respectively. If the ewe’s nutrient demands are not met by good grazing or supplementary feeding, this results in loss of milk yield unless the ewe can utilise body reserves. Ewes can recover from short periods of nutritional restriction in lactation (seven to fourteen days), but any longer and milk production will be permanently reduced.The increase in voluntary feed intake (VFI) in early lactation is slow, only 10% higher in the first week than in late pregnancy, so ewes are in negative energy balance and need to utilise body reserves up to peak lactation. This means that milk yield will be restricted if the ewe does not have sufficient body reserves.Ewes in good condition will maintain milk yield but lose more body fat compared to thin ewes. Research has shown that, where ewes are in good BCS (more than 3.0) at lambing, lamb growth is significantly, positively correlated to a loss in BCS to weaning. Conversely, when ewes are leaner (less than 3.0), with an increased appetite, lamb growth is significantly, positively correlated to a positive gain in body condition score. This is a function of the availability of feed. Thin ewes with restricted access to feed will stay thin and have lighter lambs. This has important implications for how limited resources are allocated across a flock. The impact of body condition is therefore variable, depending on actual BCS at lambing and it underlines why it is important to maintain ewe BCS at target levels during pregnancy and up to lambing.
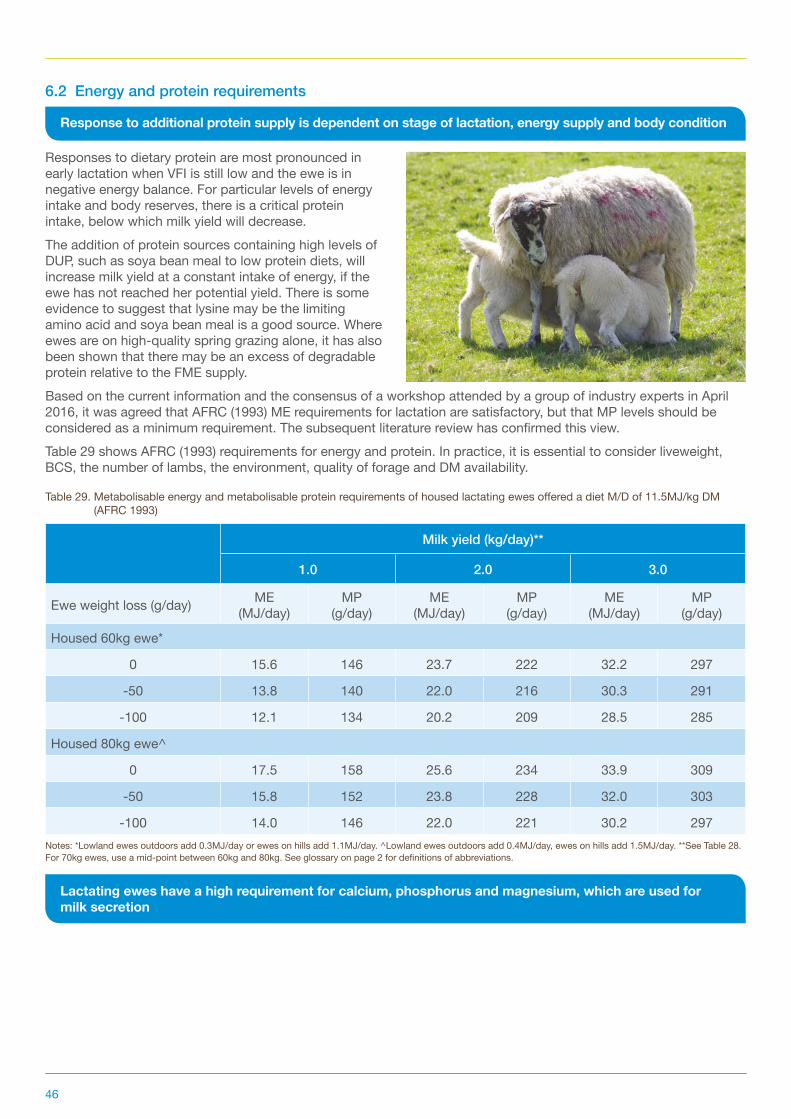
46
6.2 Energy and protein requirements
Response to additional protein supply is dependent on stage of lactation, energy supply and body condition
Responses to dietary protein are most pronounced in early lactation when VFI is still low and the ewe is in negative energy balance. For particular levels of energy intake and body reserves, there is a critical protein intake, below which milk yield will decrease.The addition of protein sources containing high levels of DUP, such as soya bean meal to low protein diets, will increase milk yield at a constant intake of energy, if the ewe has not reached her potential yield. There is some evidence to suggest that lysine may be the limiting amino acid and soya bean meal is a good source. Where ewes are on high-quality spring grazing alone, it has also been shown that there may be an excess of degradable protein relative to the FME supply.Based on the current information and the consensus of a workshop attended by a group of industry experts in April 2016, it was agreed that AFRC (1993) ME requirements for lactation are satisfactory, but that MP levels should be considered as a minimum requirement. The subsequent literature review has confirmed this view.Table 29 shows AFRC (1993) requirements for energy and protein. In practice, it is essential to consider liveweight, BCS, the number of lambs, the environment, quality of forage and DM availability.
Table 29. Metabolisable energy and metabolisable protein requirements of housed lactating ewes offered a diet M/D of 11.5MJ/kg DM (AFRC 1993)
Milk yield (kg/day)**
1.0 2.0 3.0
Ewe weight loss (g/day) ME (MJ/day)
MP (g/day)
ME (MJ/day)
MP (g/day)
ME (MJ/day)
MP (g/day)
Housed 60kg ewe*
0 15.6 146 23.7 222 32.2 297
-50 13.8 140 22.0 216 30.3 291
-100 12.1 134 20.2 209 28.5 285
Housed 80kg ewe^
0 17.5 158 25.6 234 33.9 309
-50 15.8 152 23.8 228 32.0 303
-100 14.0 146 22.0 221 30.2 297Notes: *Lowland ewes outdoors add 0.3MJ/day or ewes on hills add 1.1MJ/day. ^Lowland ewes outdoors add 0.4MJ/day, ewes on hills add 1.5MJ/day. **See Table 28. For 70kg ewes, use a mid-point between 60kg and 80kg. See glossary on page 2 for definitions of abbreviations.
Lactatingeweshaveahighrequirementforcalcium,phosphorusandmagnesium,whichareusedfor milk secretion
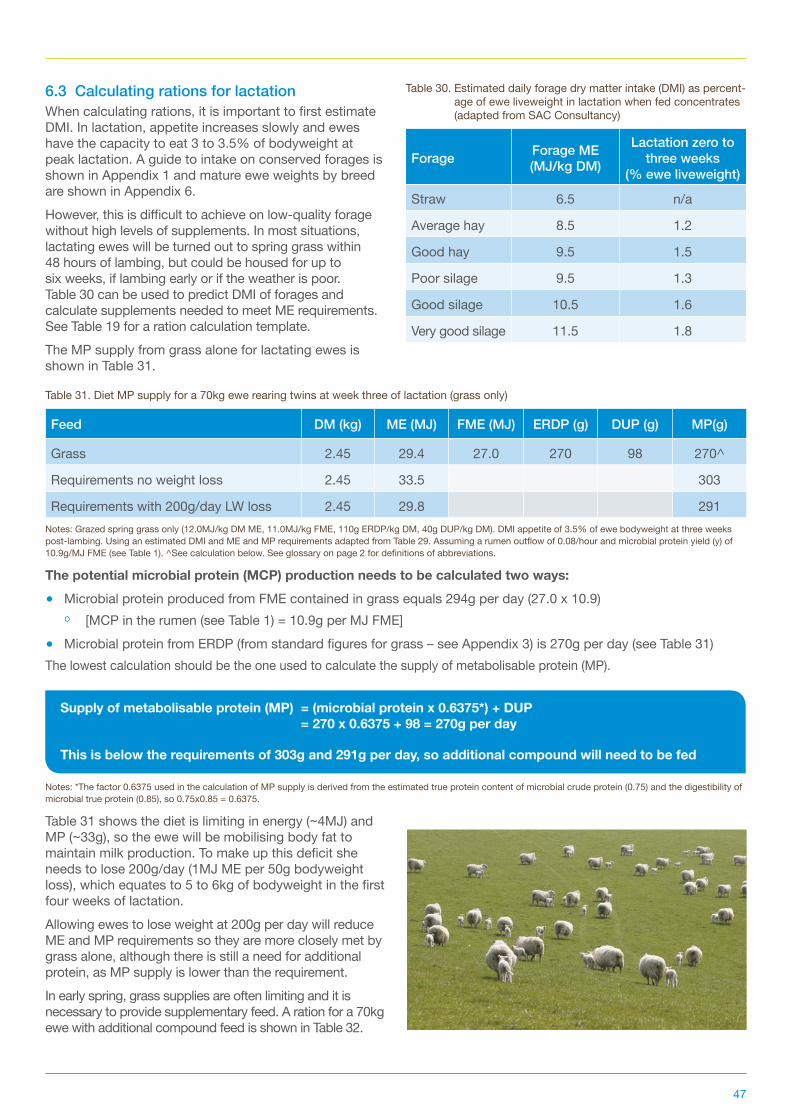
47
6.3 Calculating rations for lactationWhen calculating rations, it is important to first estimate DMI. In lactation, appetite increases slowly and ewes have the capacity to eat 3 to 3.5% of bodyweight at peak lactation. A guide to intake on conserved forages is shown in Appendix 1 and mature ewe weights by breed are shown in Appendix 6. However, this is difficult to achieve on low-quality forage without high levels of supplements. In most situations, lactating ewes will be turned out to spring grass within 48 hours of lambing, but could be housed for up to six weeks, if lambing early or if the weather is poor. Table 30 can be used to predict DMI of forages and calculate supplements needed to meet ME requirements. See Table 19 for a ration calculation template.The MP supply from grass alone for lactating ewes is shown in Table 31.
Table 31. Diet MP supply for a 70kg ewe rearing twins at week three of lactation (grass only)
Feed DM (kg) ME (MJ) FME (MJ) ERDP (g) DUP (g) MP(g)
Grass 2.45 29.4 27.0 270 98 270^
Requirements no weight loss 2.45 33.5 303
Requirements with 200g/day LW loss 2.45 29.8 291Notes: Grazed spring grass only (12.0MJ/kg DM ME, 11.0MJ/kg FME, 110g ERDP/kg DM, 40g DUP/kg DM). DMI appetite of 3.5% of ewe bodyweight at three weeks post-lambing. Using an estimated DMI and ME and MP requirements adapted from Table 29. Assuming a rumen outflow of 0.08/hour and microbial protein yield (y) of 10.9g/MJ FME (see Table 1). ^See calculation below. See glossary on page 2 for definitions of abbreviations.
The potential microbial protein (MCP) production needs to be calculated two ways: ● Microbial protein produced from FME contained in grass equals 294g per day (27.0 x 10.9)
[MCP in the rumen (see Table 1) = 10.9g per MJ FME] ● Microbial protein from ERDP (from standard figures for grass – see Appendix 3) is 270g per day (see Table 31)
The lowest calculation should be the one used to calculate the supply of metabolisable protein (MP).
Supply of metabolisable protein (MP) = (microbial protein x 0.6375*) + DUP = 270 x 0.6375 + 98 = 270g per day
Thisisbelowtherequirementsof303gand291gperday,soadditionalcompoundwillneedtobefed
Notes: *The factor 0.6375 used in the calculation of MP supply is derived from the estimated true protein content of microbial crude protein (0.75) and the digestibility of microbial true protein (0.85), so 0.75x0.85 = 0.6375.
Table 31 shows the diet is limiting in energy (~4MJ) and MP (~33g), so the ewe will be mobilising body fat to maintain milk production. To make up this deficit she needs to lose 200g/day (1MJ ME per 50g bodyweight loss), which equates to 5 to 6kg of bodyweight in the first four weeks of lactation.Allowing ewes to lose weight at 200g per day will reduce ME and MP requirements so they are more closely met by grass alone, although there is still a need for additional protein, as MP supply is lower than the requirement. In early spring, grass supplies are often limiting and it is necessary to provide supplementary feed. A ration for a 70kg ewe with additional compound feed is shown in Table 32.
Table 30. Estimated daily forage dry matter intake (DMI) as percent-age of ewe liveweight in lactation when fed concentrates (adapted from SAC Consultancy)
Forage Forage ME (MJ/kg DM)
Lactationzerotothree weeks
(% ewe liveweight)
Straw 6.5 n/a
Average hay 8.5 1.2
Good hay 9.5 1.5
Poor silage 9.5 1.3
Good silage 10.5 1.6
Very good silage 11.5 1.8
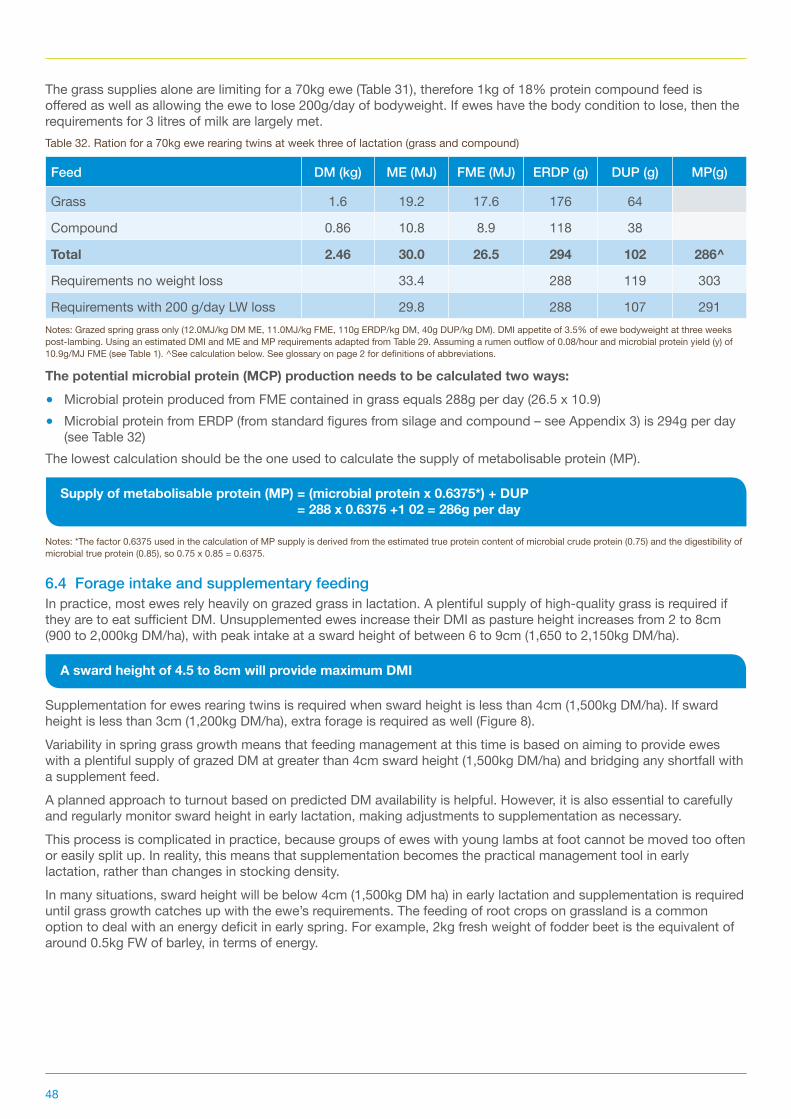
48
The grass supplies alone are limiting for a 70kg ewe (Table 31), therefore 1kg of 18% protein compound feed is offered as well as allowing the ewe to lose 200g/day of bodyweight. If ewes have the body condition to lose, then the requirements for 3 litres of milk are largely met.Table 32. Ration for a 70kg ewe rearing twins at week three of lactation (grass and compound)
Feed DM (kg) ME (MJ) FME (MJ) ERDP (g) DUP (g) MP(g)
Grass 1.6 19.2 17.6 176 64
Compound 0.86 10.8 8.9 118 38
Total 2.46 30.0 26.5 294 102 286^
Requirements no weight loss 33.4 288 119 303
Requirements with 200 g/day LW loss 29.8 288 107 291Notes: Grazed spring grass only (12.0MJ/kg DM ME, 11.0MJ/kg FME, 110g ERDP/kg DM, 40g DUP/kg DM). DMI appetite of 3.5% of ewe bodyweight at three weeks post-lambing. Using an estimated DMI and ME and MP requirements adapted from Table 29. Assuming a rumen outflow of 0.08/hour and microbial protein yield (y) of 10.9g/MJ FME (see Table 1). ^See calculation below. See glossary on page 2 for definitions of abbreviations.
The potential microbial protein (MCP) production needs to be calculated two ways: ● Microbial protein produced from FME contained in grass equals 288g per day (26.5 x 10.9) ● Microbial protein from ERDP (from standard figures from silage and compound – see Appendix 3) is 294g per day
(see Table 32)The lowest calculation should be the one used to calculate the supply of metabolisable protein (MP).
Supply of metabolisable protein (MP) = (microbial protein x 0.6375*) + DUP = 288 x 0.6375 +1 02 = 286g per day
Notes: *The factor 0.6375 used in the calculation of MP supply is derived from the estimated true protein content of microbial crude protein (0.75) and the digestibility of microbial true protein (0.85), so 0.75 x 0.85 = 0.6375.
6.4 Forage intake and supplementary feedingIn practice, most ewes rely heavily on grazed grass in lactation. A plentiful supply of high-quality grass is required if they are to eat sufficient DM. Unsupplemented ewes increase their DMI as pasture height increases from 2 to 8cm (900 to 2,000kg DM/ha), with peak intake at a sward height of between 6 to 9cm (1,650 to 2,150kg DM/ha).
A sward height of 4.5 to 8cm will provide maximum DMI
Supplementation for ewes rearing twins is required when sward height is less than 4cm (1,500kg DM/ha). If sward height is less than 3cm (1,200kg DM/ha), extra forage is required as well (Figure 8).Variability in spring grass growth means that feeding management at this time is based on aiming to provide ewes with a plentiful supply of grazed DM at greater than 4cm sward height (1,500kg DM/ha) and bridging any shortfall with a supplement feed.A planned approach to turnout based on predicted DM availability is helpful. However, it is also essential to carefully and regularly monitor sward height in early lactation, making adjustments to supplementation as necessary. This process is complicated in practice, because groups of ewes with young lambs at foot cannot be moved too often or easily split up. In reality, this means that supplementation becomes the practical management tool in early lactation, rather than changes in stocking density. In many situations, sward height will be below 4cm (1,500kg DM ha) in early lactation and supplementation is required until grass growth catches up with the ewe’s requirements. The feeding of root crops on grassland is a common option to deal with an energy deficit in early spring. For example, 2kg fresh weight of fodder beet is the equivalent of around 0.5kg FW of barley, in terms of energy.
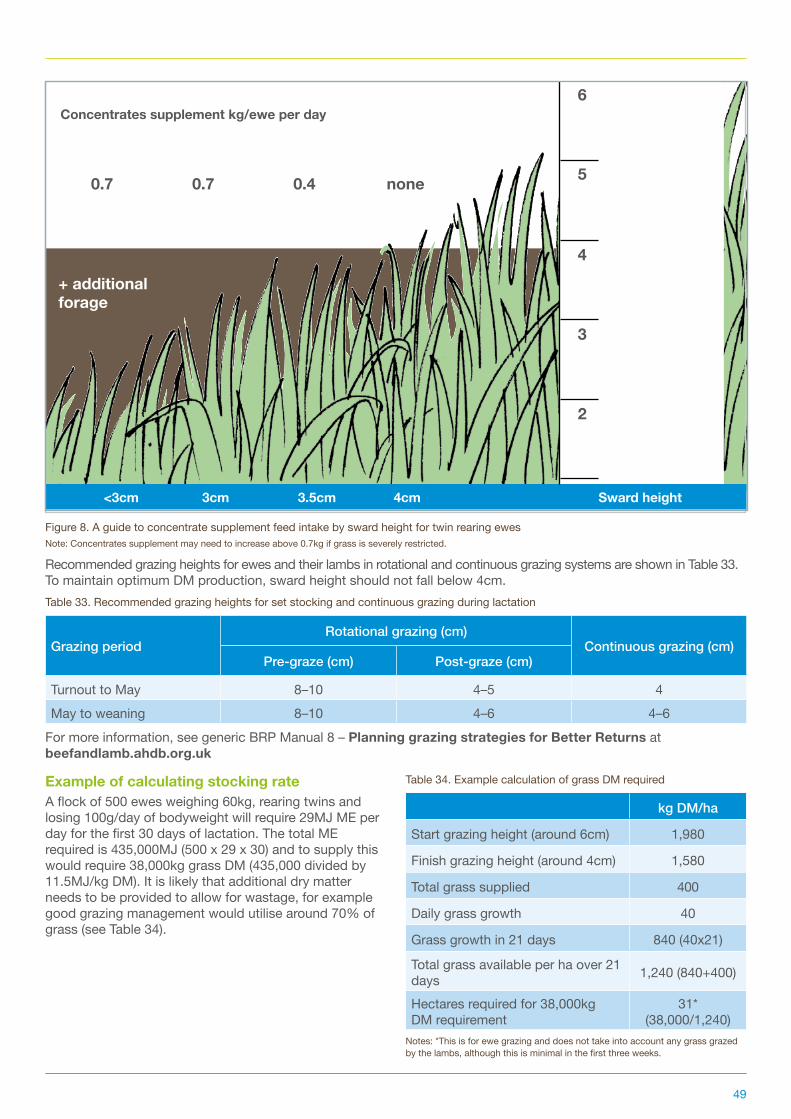
49
+ additional forage
Recommended grazing heights for ewes and their lambs in rotational and continuous grazing systems are shown in Table 33. To maintain optimum DM production, sward height should not fall below 4cm.Table 33. Recommended grazing heights for set stocking and continuous grazing during lactation
GrazingperiodRotationalgrazing(cm)
Continuousgrazing(cm)Pre-graze(cm) Post-graze(cm)
Turnout to May 8–10 4–5 4
May to weaning 8–10 4–6 4–6
For more information, see generic BRP Manual 8 – Planning grazing strategies for Better Returns at beefandlamb.ahdb.org.uk
Example of calculating stocking rate A flock of 500 ewes weighing 60kg, rearing twins and losing 100g/day of bodyweight will require 29MJ ME per day for the first 30 days of lactation. The total ME required is 435,000MJ (500 x 29 x 30) and to supply this would require 38,000kg grass DM (435,000 divided by 11.5MJ/kg DM). It is likely that additional dry matter needs to be provided to allow for wastage, for example good grazing management would utilise around 70% of grass (see Table 34).
Concentrates supplement kg/ewe per day
Note: Concentrates supplement may need to increase above 0.7kg if grass is severely restricted.Figure 8. A guide to concentrate supplement feed intake by sward height for twin rearing ewes
<3cm 3cm 3.5cm 4cm Sward height
6
5
4
3
2
0.7 0.7 0.4 none
Table 34. Example calculation of grass DM required
kg DM/ha
Start grazing height (around 6cm) 1,980
Finish grazing height (around 4cm) 1,580
Total grass supplied 400
Daily grass growth 40
Grass growth in 21 days 840 (40x21)
Total grass available per ha over 21 days 1,240 (840+400)
Hectares required for 38,000kg DM requirement
31* (38,000/1,240)
Notes: *This is for ewe grazing and does not take into account any grass grazed by the lambs, although this is minimal in the first three weeks.

50
6.5OptimisinglambgrowthIn the first six weeks after lambing, lamb growth rate is largely dependent on milk supply, after which lambs increasingly rely on pasture, with or without lamb creep feed. Figure 9 shows the transition between lamb nutrient supply from milk to grass in twin lambs. Lambs need to start grazing or eating creep to maintain optimum growth beyond four weeks of age.By six weeks of age, twin lambs have a daily energy requirement of 20MJ or 10MJ per lamb. For each lamb, energy supplied from milk is about 6.5MJ ME, leaving a gap of 3.5MJ ME to be obtained from pasture or additional creep feed if pasture is limiting. As lambs get older a decision has to be made, whether to continue supplementing the ewe to feed her lambs, or to wean and directly supplement the lambs. The decision to wean should take account of the time to mating and the quality and quantity of the forage available.
6.6Ageoflambsatweaning
Wean lambs at 12 weeks (90 days) of age with target weight of 30kg for lowland ewes
The sheep KPI project has underlined the importance of eight-week, or adjusted 56 day, weight as a predictor of lamb performance to weaning. Lambs that do not reach 85% (17kg) of the 20kg target (equivalent to 285g/day of daily liveweight gain) continue to struggle up to and beyond weaning. Weaning these light lambs at 56 days and introducing them to high-quality feed, eg creep feed, has shown positive results. Further data will be available when the project is complete.Evidence from a variety of sources suggests that optimum weaning age is around 12 weeks (90 days) on grass-based systems. Preliminary data from the sheep KPI project supports this with a target of 30kg liveweight at 90 days or 12 to 13 weeks of age. Assuming twin lambs consume all the milk produced, they need to receive more than a third of their energy requirements from pasture by the time they are six weeks of age, rising to almost 100% by 12 weeks. Once lambs and ewes start competing for grass, weaning should take place, giving lambs initial priority for grazing. However, once the ewes have been condition scored and DM requirements calculated, it may be necessary to reverse this priority to make sure ewes regain condition in time for mating. Lambs should be allowed to graze ahead of the ewes or offered a creep supplement.Research in the UK and New Zealand has shown lambs can be weaned early if feed or grass is likely to be in short supply and would result in ewes and lambs competing for food, as long as the lambs weigh at least 16kg liveweight and are weaned onto good grass or forage.
6
5
4
3
2
1
01 3 6
Weeks from birth
Lamb intake
Ewe milk Pasture2.8kg DM or 7MJ of ME
Milk2.8kg or 13MJ of MEM
ilk o
r pas
ture
(kg
FW)
9 12
Figure 9. The milk to grass transition for lambs reared as twins (Beef & Lamb NZ)
Notes: See glossary on page 2 for definitions of abbreviations.
Ewe milk
Lambintake
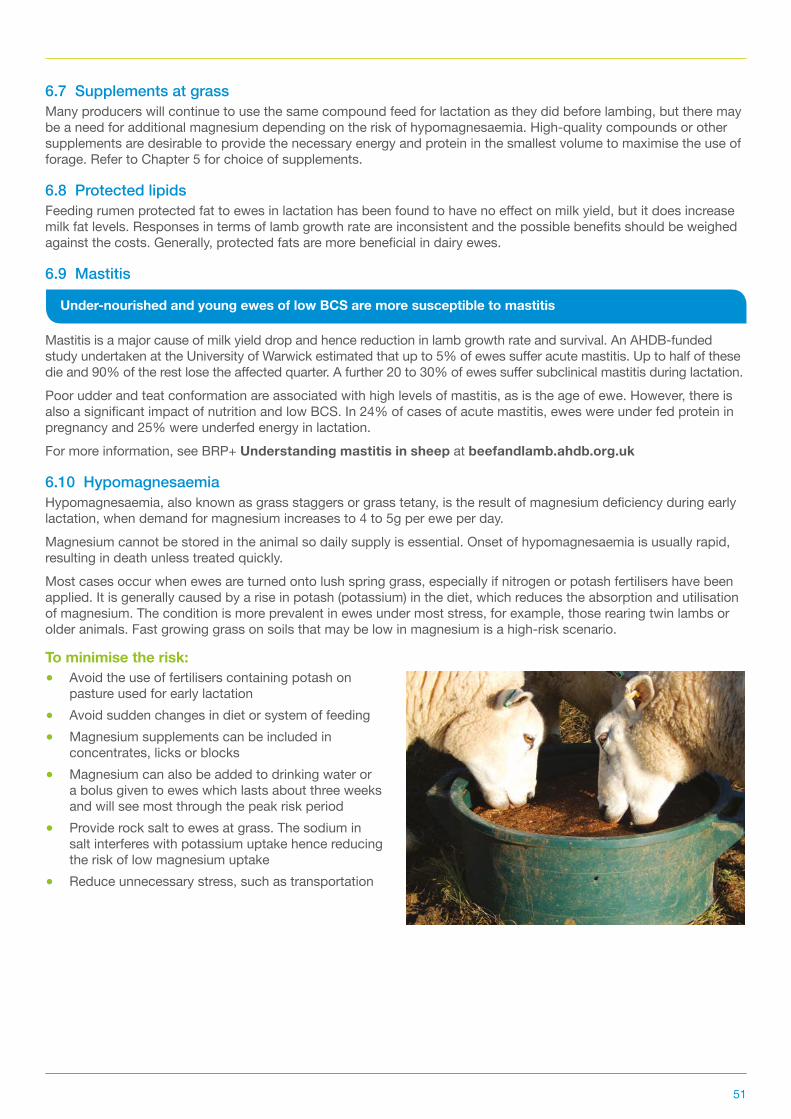
51
6.7 Supplements at grassMany producers will continue to use the same compound feed for lactation as they did before lambing, but there may be a need for additional magnesium depending on the risk of hypomagnesaemia. High-quality compounds or other supplements are desirable to provide the necessary energy and protein in the smallest volume to maximise the use of forage. Refer to Chapter 5 for choice of supplements.
6.8 Protected lipids Feeding rumen protected fat to ewes in lactation has been found to have no effect on milk yield, but it does increase milk fat levels. Responses in terms of lamb growth rate are inconsistent and the possible benefits should be weighed against the costs. Generally, protected fats are more beneficial in dairy ewes.
6.9 Mastitis
Under-nourished and young ewes of low BCS are more susceptible to mastitis
Mastitis is a major cause of milk yield drop and hence reduction in lamb growth rate and survival. An AHDB-funded study undertaken at the University of Warwick estimated that up to 5% of ewes suffer acute mastitis. Up to half of these die and 90% of the rest lose the affected quarter. A further 20 to 30% of ewes suffer subclinical mastitis during lactation. Poor udder and teat conformation are associated with high levels of mastitis, as is the age of ewe. However, there is also a significant impact of nutrition and low BCS. In 24% of cases of acute mastitis, ewes were under fed protein in pregnancy and 25% were underfed energy in lactation. For more information, see BRP+ Understanding mastitis in sheep at beefandlamb.ahdb.org.uk
6.10 HypomagnesaemiaHypomagnesaemia, also known as grass staggers or grass tetany, is the result of magnesium deficiency during early lactation, when demand for magnesium increases to 4 to 5g per ewe per day. Magnesium cannot be stored in the animal so daily supply is essential. Onset of hypomagnesaemia is usually rapid, resulting in death unless treated quickly.Most cases occur when ewes are turned onto lush spring grass, especially if nitrogen or potash fertilisers have been applied. It is generally caused by a rise in potash (potassium) in the diet, which reduces the absorption and utilisation of magnesium. The condition is more prevalent in ewes under most stress, for example, those rearing twin lambs or older animals. Fast growing grass on soils that may be low in magnesium is a high-risk scenario.
To minimise the risk:● Avoid the use of fertilisers containing potash on
pasture used for early lactation● Avoid sudden changes in diet or system of feeding● Magnesium supplements can be included in
concentrates, licks or blocks ● Magnesium can also be added to drinking water or
a bolus given to ewes which lasts about three weeks and will see most through the peak risk period
● Provide rock salt to ewes at grass. The sodium in salt interferes with potassium uptake hence reducing the risk of low magnesium uptake
● Reduce unnecessary stress, such as transportation
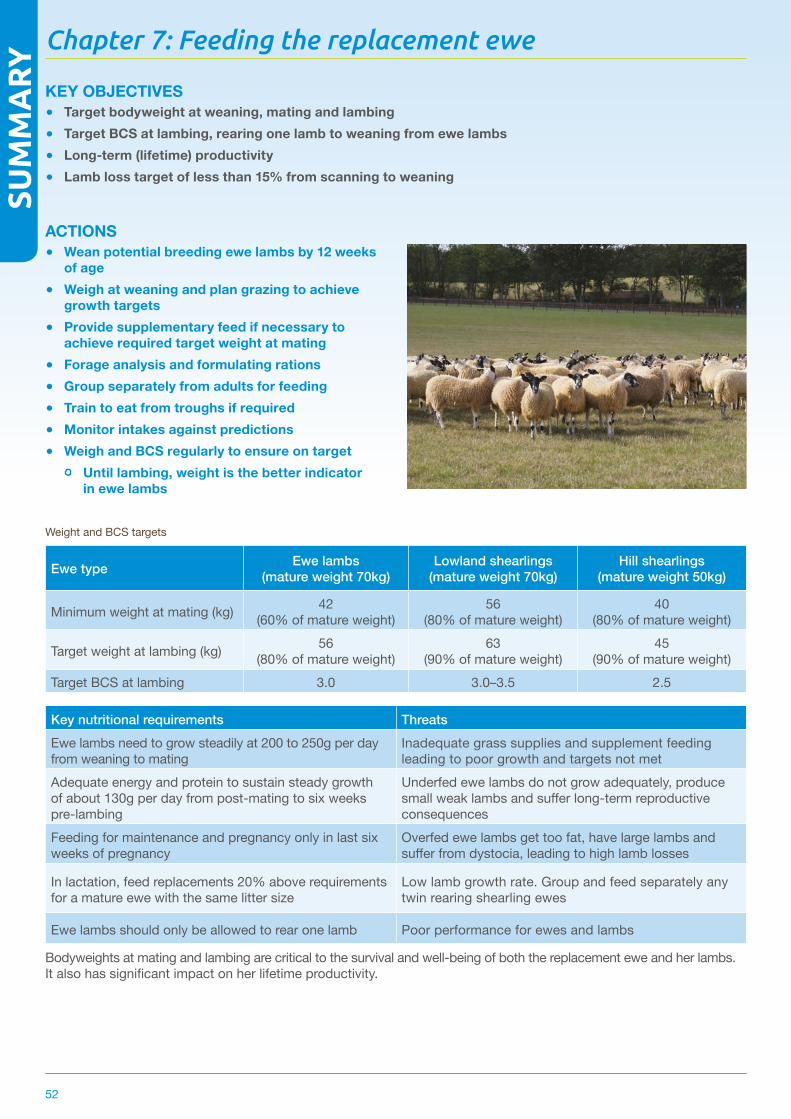
52
KEY OBJECTIVES ● Target bodyweight at weaning, mating and lambing ● Target BCS at lambing, rearing one lamb to weaning from ewe lambs ● Long-term (lifetime) productivity ● Lamb loss target of less than 15% from scanning to weaning
ACTIONS ● Wean potential breeding ewe lambs by 12 weeks
of age ● Weigh at weaning and plan grazing to achieve
growth targets ● Provide supplementary feed if necessary to achieverequiredtargetweightatmating
● Forage analysis and formulating rations ● Group separately from adults for feeding ● Traintoeatfromtroughsifrequired ● Monitor intakes against predictions ● Weigh and BCS regularly to ensure on target
Until lambing, weight is the better indicator in ewe lambs
Weight and BCS targets
Ewe type Ewelambs (mature weight 70kg)
Lowland shearlings (mature weight 70kg)
Hill shearlings (mature weight 50kg)
Minimum weight at mating (kg) 42 (60% of mature weight)
56 (80% of mature weight)
40 (80% of mature weight)
Target weight at lambing (kg) 56 (80% of mature weight)
63 (90% of mature weight)
45 (90% of mature weight)
Target BCS at lambing 3.0 3.0–3.5 2.5
Key nutritional requirements ThreatsEwe lambs need to grow steadily at 200 to 250g per day from weaning to mating
Inadequate grass supplies and supplement feeding leading to poor growth and targets not met
Adequate energy and protein to sustain steady growth of about 130g per day from post-mating to six weeks pre-lambing
Underfed ewe lambs do not grow adequately, produce small weak lambs and suffer long-term reproductive consequences
Feeding for maintenance and pregnancy only in last six weeks of pregnancy
Overfed ewe lambs get too fat, have large lambs and suffer from dystocia, leading to high lamb losses
In lactation, feed replacements 20% above requirements for a mature ewe with the same litter size
Low lamb growth rate. Group and feed separately any twin rearing shearling ewes
Ewe lambs should only be allowed to rear one lamb Poor performance for ewes and lambs
Bodyweights at mating and lambing are critical to the survival and well-being of both the replacement ewe and her lambs. It also has significant impact on her lifetime productivity.
Chapter 7: Feeding the replacement ewe
SUM
MA
RY
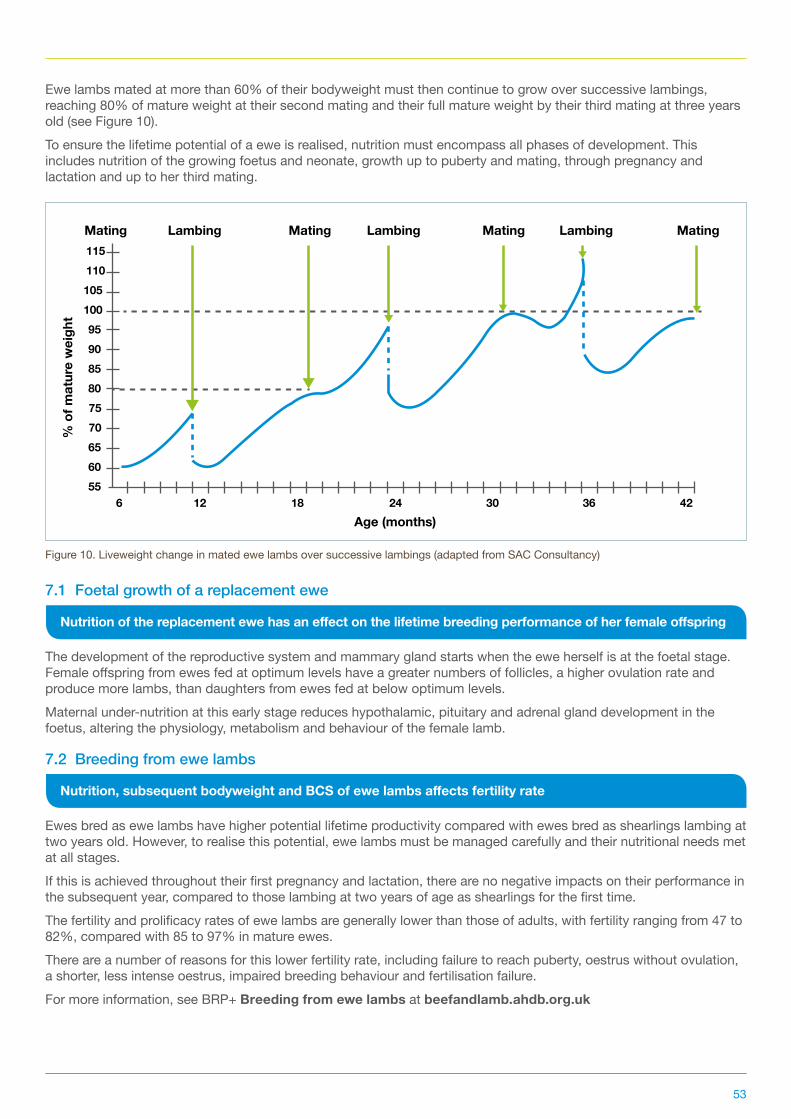
53
Ewe lambs mated at more than 60% of their bodyweight must then continue to grow over successive lambings, reaching 80% of mature weight at their second mating and their full mature weight by their third mating at three years old (see Figure 10).To ensure the lifetime potential of a ewe is realised, nutrition must encompass all phases of development. This includes nutrition of the growing foetus and neonate, growth up to puberty and mating, through pregnancy and lactation and up to her third mating.
7.1 Foetal growth of a replacement ewe
Nutritionofthereplacementewehasaneffectonthelifetimebreedingperformanceofherfemaleoffspring
The development of the reproductive system and mammary gland starts when the ewe herself is at the foetal stage. Female offspring from ewes fed at optimum levels have a greater numbers of follicles, a higher ovulation rate and produce more lambs, than daughters from ewes fed at below optimum levels. Maternal under-nutrition at this early stage reduces hypothalamic, pituitary and adrenal gland development in the foetus, altering the physiology, metabolism and behaviour of the female lamb.
7.2Breedingfromewelambs
Nutrition,subsequentbodyweightandBCSofewelambsaffectsfertilityrate
Ewes bred as ewe lambs have higher potential lifetime productivity compared with ewes bred as shearlings lambing at two years old. However, to realise this potential, ewe lambs must be managed carefully and their nutritional needs met at all stages. If this is achieved throughout their first pregnancy and lactation, there are no negative impacts on their performance in the subsequent year, compared to those lambing at two years of age as shearlings for the first time.The fertility and prolificacy rates of ewe lambs are generally lower than those of adults, with fertility ranging from 47 to 82%, compared with 85 to 97% in mature ewes. There are a number of reasons for this lower fertility rate, including failure to reach puberty, oestrus without ovulation, a shorter, less intense oestrus, impaired breeding behaviour and fertilisation failure.For more information, see BRP+ Breeding from ewe lambs at beefandlamb.ahdb.org.uk
Mating Lambing Mating Lambing
Age (months)
LambingMating Mating115110105100959085807570656055
% o
f mat
ure
wei
ght
6 12 18 24 30 36 42
Figure 10. Liveweight change in mated ewe lambs over successive lambings (adapted from SAC Consultancy)
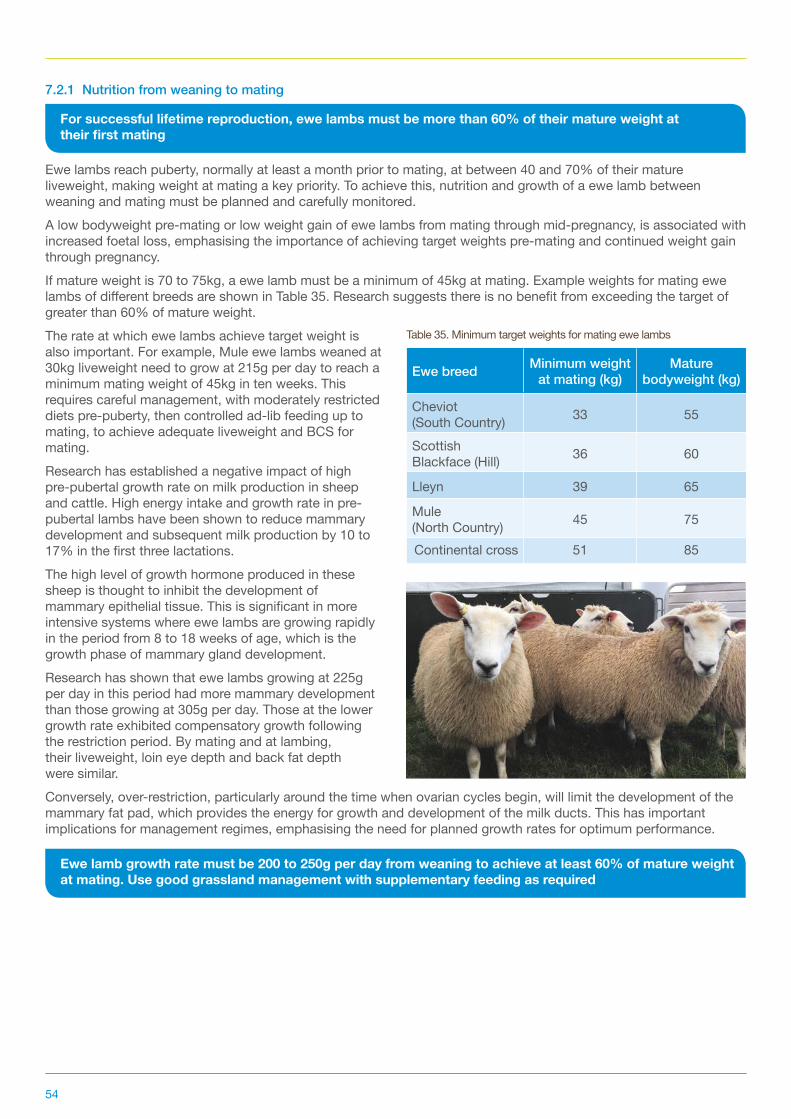
54
7.2.1 Nutrition from weaning to mating
For successful lifetime reproduction, ewe lambs must be more than 60% of their mature weight at theirfirstmating
Ewe lambs reach puberty, normally at least a month prior to mating, at between 40 and 70% of their mature liveweight, making weight at mating a key priority. To achieve this, nutrition and growth of a ewe lamb between weaning and mating must be planned and carefully monitored. A low bodyweight pre-mating or low weight gain of ewe lambs from mating through mid-pregnancy, is associated with increased foetal loss, emphasising the importance of achieving target weights pre-mating and continued weight gain through pregnancy. If mature weight is 70 to 75kg, a ewe lamb must be a minimum of 45kg at mating. Example weights for mating ewe lambs of different breeds are shown in Table 35. Research suggests there is no benefit from exceeding the target of greater than 60% of mature weight.The rate at which ewe lambs achieve target weight is also important. For example, Mule ewe lambs weaned at 30kg liveweight need to grow at 215g per day to reach a minimum mating weight of 45kg in ten weeks. This requires careful management, with moderately restricted diets pre-puberty, then controlled ad-lib feeding up to mating, to achieve adequate liveweight and BCS for mating.Research has established a negative impact of high pre-pubertal growth rate on milk production in sheep and cattle. High energy intake and growth rate in pre-pubertal lambs have been shown to reduce mammary development and subsequent milk production by 10 to 17% in the first three lactations.The high level of growth hormone produced in these sheep is thought to inhibit the development of mammary epithelial tissue. This is significant in more intensive systems where ewe lambs are growing rapidly in the period from 8 to 18 weeks of age, which is the growth phase of mammary gland development. Research has shown that ewe lambs growing at 225g per day in this period had more mammary development than those growing at 305g per day. Those at the lower growth rate exhibited compensatory growth following the restriction period. By mating and at lambing, their liveweight, loin eye depth and back fat depth were similar.Conversely, over-restriction, particularly around the time when ovarian cycles begin, will limit the development of the mammary fat pad, which provides the energy for growth and development of the milk ducts. This has important implications for management regimes, emphasising the need for planned growth rates for optimum performance.
Ewe lamb growth rate must be 200 to 250g per day from weaning to achieve at least 60% of mature weight atmating.Usegoodgrasslandmanagementwithsupplementaryfeedingasrequired
Table 35. Minimum target weights for mating ewe lambs
Ewebreed Minimum weight at mating (kg)
Mature bodyweight(kg)
Cheviot (South Country) 33 55
Scottish Blackface (Hill) 36 60
Lleyn 39 65
Mule (North Country) 45 75
Continental cross 51 85
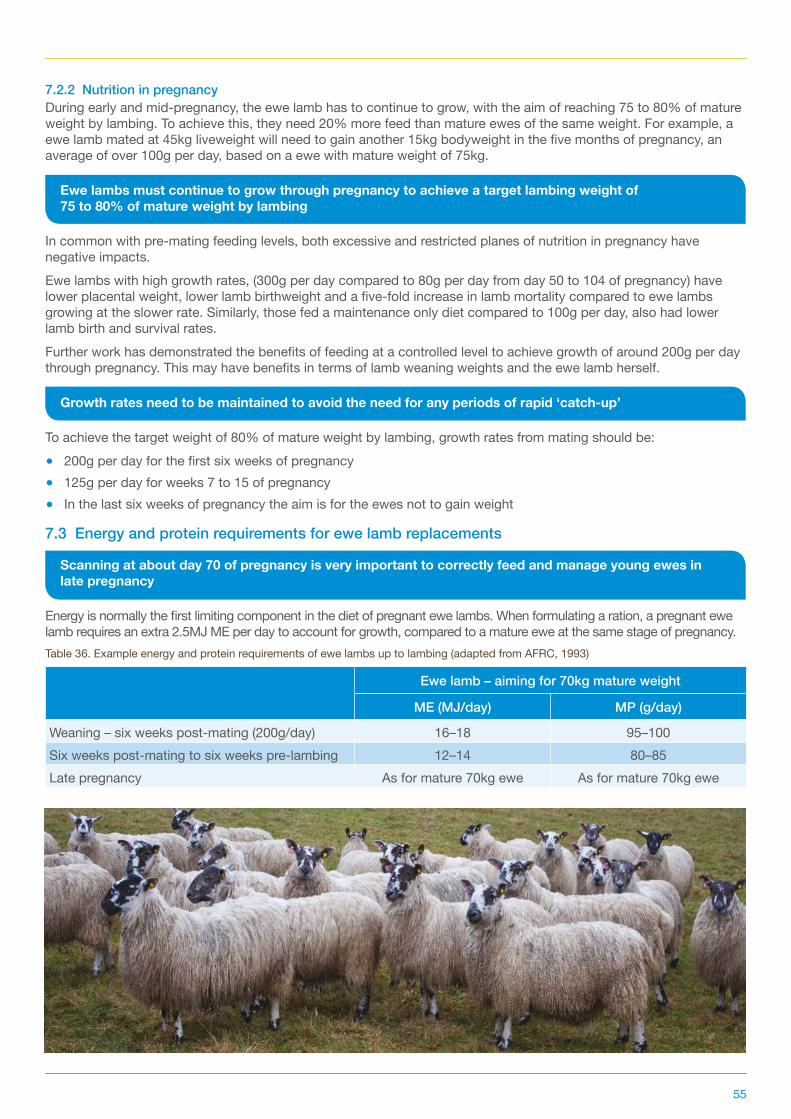
55
7.2.2 Nutrition in pregnancyDuring early and mid-pregnancy, the ewe lamb has to continue to grow, with the aim of reaching 75 to 80% of mature weight by lambing. To achieve this, they need 20% more feed than mature ewes of the same weight. For example, a ewe lamb mated at 45kg liveweight will need to gain another 15kg bodyweight in the five months of pregnancy, an average of over 100g per day, based on a ewe with mature weight of 75kg.
Ewe lambs must continue to grow through pregnancy to achieve a target lambing weight of 75 to 80% of mature weight by lambing
In common with pre-mating feeding levels, both excessive and restricted planes of nutrition in pregnancy have negative impacts. Ewe lambs with high growth rates, (300g per day compared to 80g per day from day 50 to 104 of pregnancy) have lower placental weight, lower lamb birthweight and a five-fold increase in lamb mortality compared to ewe lambs growing at the slower rate. Similarly, those fed a maintenance only diet compared to 100g per day, also had lower lamb birth and survival rates. Further work has demonstrated the benefits of feeding at a controlled level to achieve growth of around 200g per day through pregnancy. This may have benefits in terms of lamb weaning weights and the ewe lamb herself.
Growth rates need to be maintained to avoid the need for any periods of rapid ‘catch-up’
To achieve the target weight of 80% of mature weight by lambing, growth rates from mating should be: ● 200g per day for the first six weeks of pregnancy ● 125g per day for weeks 7 to 15 of pregnancy ● In the last six weeks of pregnancy the aim is for the ewes not to gain weight
7.3Energyandproteinrequirementsforewelambreplacements
Scanning at about day 70 of pregnancy is very important to correctly feed and manage young ewes in late pregnancy
Energy is normally the first limiting component in the diet of pregnant ewe lambs. When formulating a ration, a pregnant ewe lamb requires an extra 2.5MJ ME per day to account for growth, compared to a mature ewe at the same stage of pregnancy.Table 36. Example energy and protein requirements of ewe lambs up to lambing (adapted from AFRC, 1993)
Ewelamb–aimingfor70kgmatureweight
ME (MJ/day) MP (g/day)
Weaning – six weeks post-mating (200g/day) 16–18 95–100Six weeks post-mating to six weeks pre-lambing 12–14 80–85Late pregnancy As for mature 70kg ewe As for mature 70kg ewe

56
7.4Calculatingrationsforreplacementewelambs
DMrequirementsmustbematchedtothesupplyofqualityforagetoachievetargetweightgains
In practice, most replacement ewes rely heavily on grazing or other forage crops from weaning to mating and through the first three months of pregnancy. To achieve target daily liveweight gains, the quality and quantity of DM available must be carefully planned and monitored and supplementation offered if required.An example of ME and DM requirements for a group of 100 ewe lambs weighing 40kg and growing at 200g per head per day for the six weeks pre-mating is shown in Table 37. In the example in Table 37, the DMI of 1.5kg per day is at the upper limit for this size of lamb, so if grass quality is below 11MJ a supplement is required to bring the overall energy density of the diet up to 11MJ/kg DM. For example, the addition of 200g of sugar beet pulp. The MP required for these ewe lambs is 95g per head per day and good grass alone would supply around 100g MP per day.
7.5 Breeding from shearling ewes If replacements are not bred until they are shearlings at 18 months of age, their target is to be at least 80% of their mature weight at mating. This should be a controlled growth curve avoiding any periods of weight loss or very rapid weight gain. For example a Mule shearling ewe, with a mature weight of 75kg, needs to be 60kg at first mating when she is 18 months old. To achieve this from weaning at three months of age, an average growth rate of 100g per day is required.In late pregnancy, the aim should be to feed shearlings 10% more energy and protein than mature ewes. From a practical perspective, shearlings, like ewe lambs, can be shy feeders and fail to get their fair share when fed with mature ewes. This includes forage, concentrates and free-access blocks, buckets and licks. In housed systems, a period of ‘training’ is also useful. Housing dry ewe lambs after lambing means they can experience the feeding system for a short time, allowing them to settle into the system before the following winter.
7.6 Practical feeding during pregnancy and lactationDuring late pregnancy and lactation, ewe lambs and shearlings, where possible, should be managed separately from mature ewes. In the last six weeks of pregnancy, ewe lambs require the same levels of energy and protein as mature ewes of the same bodyweight (see Tables 8 and 9). A flat rate feeding system is ideal for immature ewes to help manage their intakes against a reduced rumen capacity as the foetus grows.In lactation, ewe lambs need 20% more energy and protein than mature ewes of the same bodyweight, to maintain their growth while producing milk (see Table 29). If grass or forage supplies are limited or of poor quality, additional supplementation will be beneficial for ewe lambs. To reduce the pressure on them, their lambs should be offered creep feed and weaned by 10 weeks of age to allow the ewe lamb plenty of time to recover and achieve target of 80% mature bodyweight before her second mating.Ideally, ewe lambs should rear only one lamb, with second lambs fostered or artificially reared. If they are left with two lambs, they must be in a separate group, fed as mature ewes with triplets and the lambs creep fed and weaned by 10 weeks of age.
Table 37. Example calculation of metabolisable energy requirements for a group of 100 ewe lambs pre-mating
40kg ewe lamb growing at 200g/day (MJ per day) 16.6*
Total for group of 100 ewe lambs (MJ per day) 1,660
Total over 42 days up to mating (MJ) 69,720
DM required:
Grass @ 11MJ/DM (kg DM) [69,720 divided by 11] 6,338
Dry matter intake per animal per day (kg DM). [6,338 divided by 100 ewes, divided by 42 days]
1.5
Notes: *Source AFRC (1993) or see Table 36. See glossary on page 2 for definitions of abbreviations.

57
Appendices
Appendix 1: Feed intakes – a guide for twin-bearing ewesHay (ME 9.5MJ/kg)
Pre-lambing(12tothreeweeks) Pre-lambing(threetozeroweeks) Lactation(zerotothreeweeks)
Ewe weight
(kg)
DMI forage
(kg DM/head)
Total DMI (kg DM/head)
% of ewe bodyweight
DMI forage
(kg DM/head)
Total DMI (kg DM/head)
% of ewe bodyweight
DMI forage
(kg DM/head)
Total DMI
(kg DM/head)
% of ewe bodyweight
50 0.9 0.9 1.8 0.7 1.3 2.6 0.8 1.7 3.460 1.1 1.1 1.8 0.8 1.5 2.5 0.9 1.9 3.270 1.3 1.3 1.9 1.0 1.7 2.4 1.1 2.2 3.180 1.4 1.4 1.8 1.1 1.8 2.3 1.2 2.4 3.090 1.6 1.6 1.8 1.3 1.9 2.1 1.4 2.6 2.9
Silage (ME 10.5MJ/kg)
Pre-lambing(12tothreeweeks) Pre-lambing(threetozeroweeks) Lactation(zerotothreeweeks)
Ewe weight
(kg)
DMI forage
(kg DM/head)
Total DMI (kg DM/head)
% of ewe bodyweight
DMI forage
(kg DM/head)
Total DMI (kg DM/head)
% of ewe bodyweight
DMI forage
(kg DM/head)
Total DMI
(kg DM/head)
% of ewe bodyweight
50 0.8 0.9 1.8 0.7 1.3 2.6 0.8 1.6 3.260 1.0 1.0 1.7 0.8 1.5 2.5 1.0 1.9 3.270 1.1 1.2 1.7 1.0 1.7 2.4 1.1 2.3 3.380 1.3 1.3 1.6 1.1 1.8 2.3 1.3 2.6 3.390 1.4 1.4 1.6 1.3 1.9 2.1 1.4 2.9 3.2
Notes: DMI from SAC Consultancy – Feedbyte rations for sheep, using good hay and good silage. Total DMI pregnancy and lactation from AFRC 1993. % of ewe weight = total dry matter intake as % of bodyweight. See glossary on page 2 for definitions of abbreviations.
Appendix2:Relativefeedvaluesofstraightfeedstuffs
Feed DM (g/kg)
ME (MJ/kg DM)
Crude protein (g/kg DM)
Feed value (£/tonne) relative tobarley@£100/t
and rapeseed meal@£170/t
Feed value (£/tonne)
relativetobarley@£130/t
and rapeseed meal@£200/t
Wheat 860 13.8 130 107 138Sugar beet pulp 880 12.5 110 97 127Soya hulls 900 11.9 116 99 127Wheat distillers dark grains 900 13.5 340 175 208
Wheatfeed 880 11.5 175 111 137Beans 860 14.0 290 159 191Molasses 750 12.7 60 64 88Fodder beet 180 12.5 70 18 23
Notes: These calculations do not account for differences in protein quality.
The AHDB Beef & Lamb Blend Calculator can be used to formulate home mixes from a variety of straights. It will provide cost/MJ of energy or cost per unit of protein for all feeds included in the mix. For access, go to tools within the Better Returns Programme Section of beefandlamb.ahdb.org.uk

58
Appendix 3: Feed database – proximate analysis (Ewing, 1997)
DM ME FMEERDP @0.02flow
DUP @0.02flow
ERDP @0.05flow
DUP @0.05flow
ERDP @0.08flow
DUP @0.08flow
(g/kg) (MJ/kg) (g/kg) (g/kg) (g/kg) (g/kg) (g/kg) (g/kg) (g/kg)
Spring grass 12.0 11.0 122 30
Grass silage (clamp, chopped)
300 11.0 8.0 100 5 95 10 90 15
Grass silage (big bale) 350 10.5 8.0 75 27 74 30 72 33
Maize silage 300 11.5 10.1 70 13 67 16 65 19
Wholecrop silage 400 10.5 8.5 60 12 55 15 52 18
Hay 870 8.5 8.1 70 20 56 35 50 50
Straw 870 6.5 6.0 16 14 14 17 13 18
Barley 860 13.2 11.0 105 8 96 16 93 18
Wheat 860 13.8 12.8 107 7 103 11 99 14
Oats 860 12.2 10.0 103 4 99 6 97 8
Maize 890 14.5 12.8 80 10 72 17 70 23
Molassed sugar beet pulp
900 12.5 12.3 64 26 49 38 45 45
Molasses 750 12.7 12.2 4 0 4 1 3 1
Beans 860 14.0 12.7 250 15 235 30 225 39
Soya bean meal 900 13.6 12.7 421 106 325 140 265 245
Rapeseed meal 880 12.1 10.5 301 41 262 69 235 89
Distillers dark grain wheat*
900 13.7 11.0 267 165 255 250 249 265
Ewe concentrate 18% protein
860 12.5 10.2 138 24 125 35 112 45
Ewe concentrate 20% protein
860 12.5 10.2 150 25 140 38 130 48
Notes: All analyses are expressed on a DM basis. *Analysis very variable depending on product source. See Section 2.4.1 for more information on rumen outflow rate. See glossary on page 2 for definitions of abbreviations.
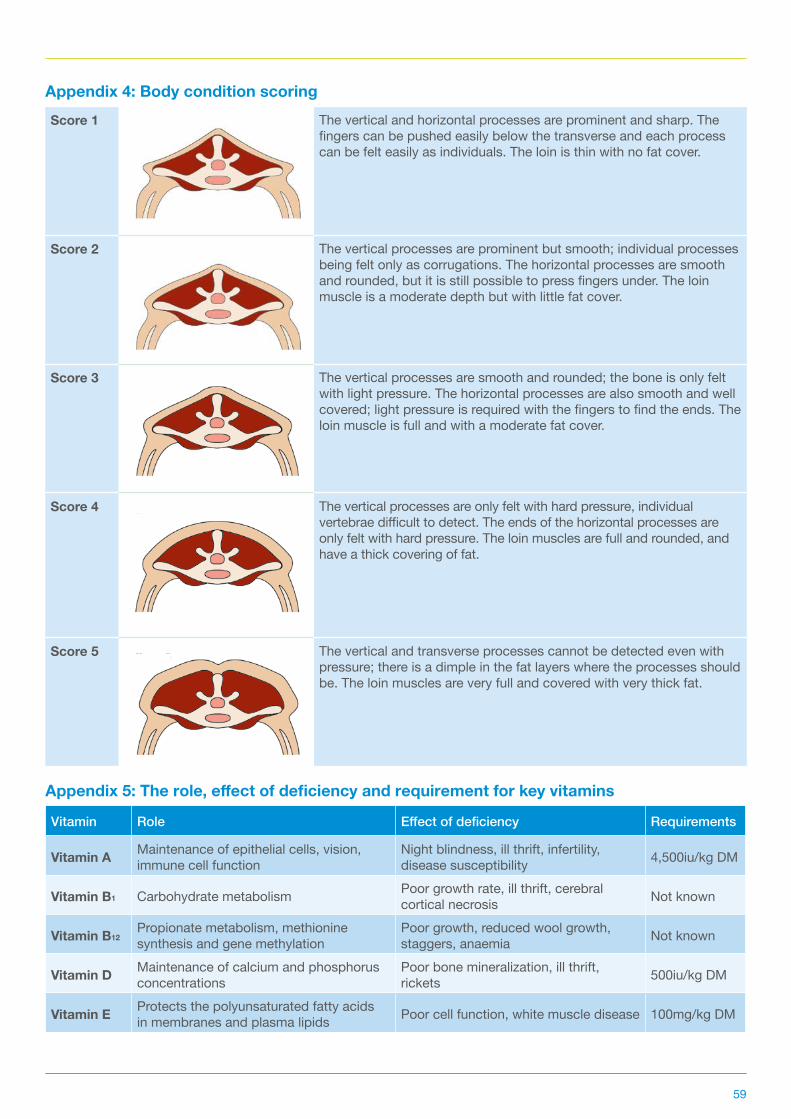
59
Appendix 4: Body condition scoringScore 1 The vertical and horizontal processes are prominent and sharp. The
fingers can be pushed easily below the transverse and each process can be felt easily as individuals. The loin is thin with no fat cover.
Score 2 The vertical processes are prominent but smooth; individual processes being felt only as corrugations. The horizontal processes are smooth and rounded, but it is still possible to press fingers under. The loin muscle is a moderate depth but with little fat cover.
Score 3 The vertical processes are smooth and rounded; the bone is only felt with light pressure. The horizontal processes are also smooth and well covered; light pressure is required with the fingers to find the ends. The loin muscle is full and with a moderate fat cover.
Score 4 The vertical processes are only felt with hard pressure, individual vertebrae difficult to detect. The ends of the horizontal processes are only felt with hard pressure. The loin muscles are full and rounded, and have a thick covering of fat.
Score 5 The vertical and transverse processes cannot be detected even with pressure; there is a dimple in the fat layers where the processes should be. The loin muscles are very full and covered with very thick fat.
Appendix5:Therole,effectofdeficiencyandrequirementforkeyvitamins
Vitamin Role Effectofdeficiency Requirements
Vitamin A Maintenance of epithelial cells, vision, immune cell function
Night blindness, ill thrift, infertility, disease susceptibility 4,500iu/kg DM
Vitamin B1 Carbohydrate metabolism Poor growth rate, ill thrift, cerebral cortical necrosis Not known
Vitamin B12Propionate metabolism, methionine synthesis and gene methylation
Poor growth, reduced wool growth, staggers, anaemia Not known
Vitamin D Maintenance of calcium and phosphorus concentrations
Poor bone mineralization, ill thrift, rickets 500iu/kg DM
Vitamin E Protects the polyunsaturated fatty acids in membranes and plasma lipids Poor cell function, white muscle disease 100mg/kg DM
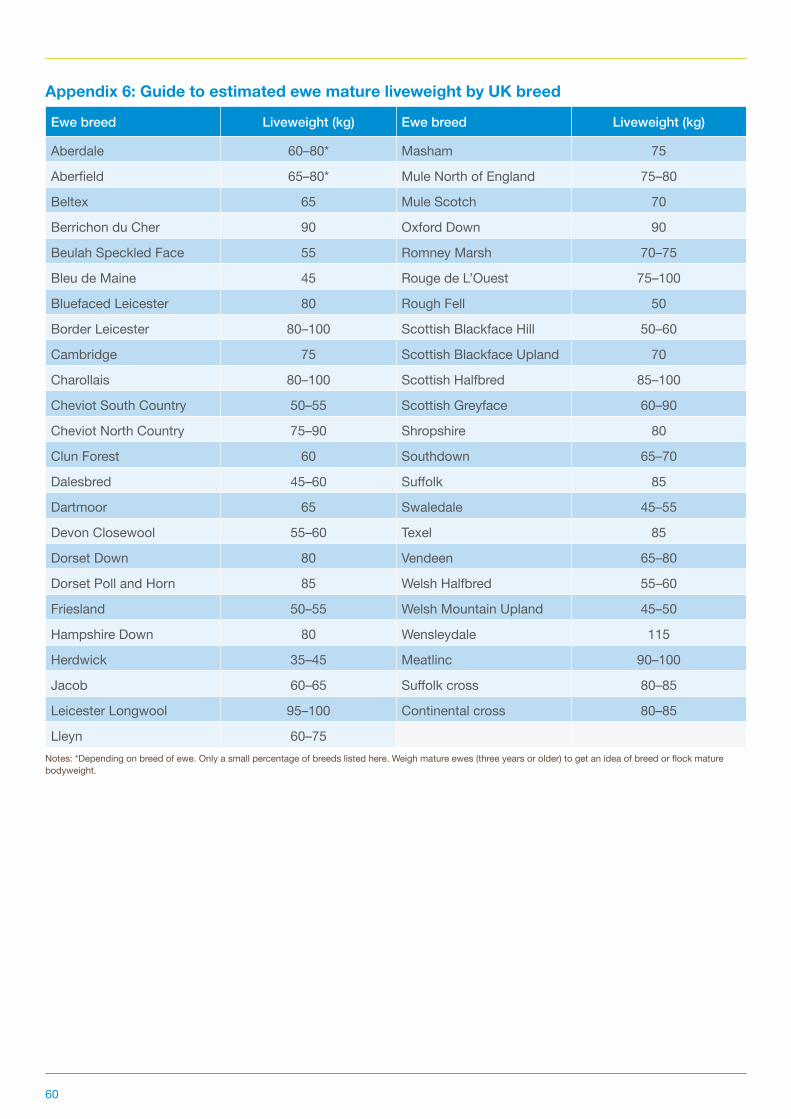
60
Appendix 6: Guide to estimated ewe mature liveweight by UK breed
Ewebreed Liveweight (kg) Ewebreed Liveweight (kg)
Aberdale 60–80* Masham 75
Aberfield 65–80* Mule North of England 75–80
Beltex 65 Mule Scotch 70
Berrichon du Cher 90 Oxford Down 90
Beulah Speckled Face 55 Romney Marsh 70–75
Bleu de Maine 45 Rouge de L’Ouest 75–100
Bluefaced Leicester 80 Rough Fell 50
Border Leicester 80–100 Scottish Blackface Hill 50–60
Cambridge 75 Scottish Blackface Upland 70
Charollais 80–100 Scottish Halfbred 85–100
Cheviot South Country 50–55 Scottish Greyface 60–90
Cheviot North Country 75–90 Shropshire 80
Clun Forest 60 Southdown 65–70
Dalesbred 45–60 Suffolk 85
Dartmoor 65 Swaledale 45–55
Devon Closewool 55–60 Texel 85
Dorset Down 80 Vendeen 65–80
Dorset Poll and Horn 85 Welsh Halfbred 55–60
Friesland 50–55 Welsh Mountain Upland 45–50
Hampshire Down 80 Wensleydale 115
Herdwick 35–45 Meatlinc 90–100
Jacob 60–65 Suffolk cross 80–85
Leicester Longwool 95–100 Continental cross 80–85
Lleyn 60–75Notes: *Depending on breed of ewe. Only a small percentage of breeds listed here. Weigh mature ewes (three years or older) to get an idea of breed or flock mature bodyweight.
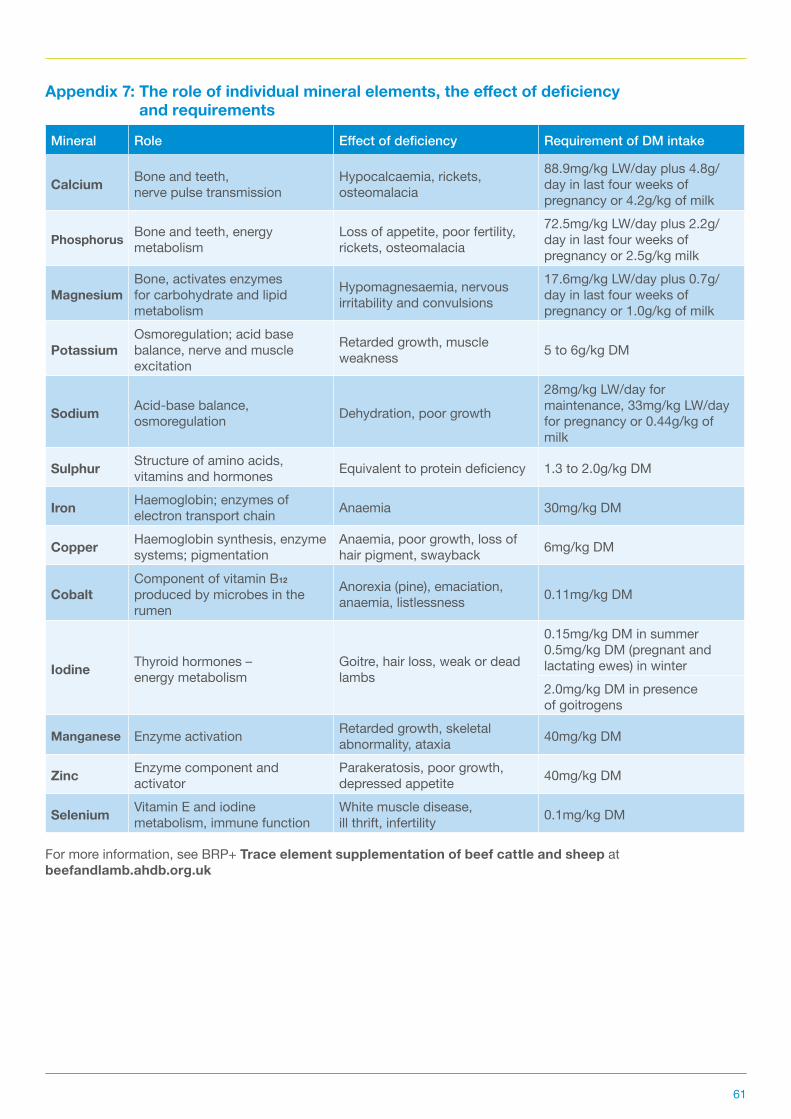
61
Appendix7:Theroleofindividualmineralelements,theeffectofdeficiency andrequirements
Mineral Role Effectofdeficiency Requirement of DM intake
Calcium Bone and teeth, nerve pulse transmission
Hypocalcaemia, rickets, osteomalacia
88.9mg/kg LW/day plus 4.8g/day in last four weeks of pregnancy or 4.2g/kg of milk
Phosphorus Bone and teeth, energy metabolism
Loss of appetite, poor fertility, rickets, osteomalacia
72.5mg/kg LW/day plus 2.2g/day in last four weeks of pregnancy or 2.5g/kg milk
MagnesiumBone, activates enzymes for carbohydrate and lipid metabolism
Hypomagnesaemia, nervous irritability and convulsions
17.6mg/kg LW/day plus 0.7g/day in last four weeks of pregnancy or 1.0g/kg of milk
PotassiumOsmoregulation; acid base balance, nerve and muscle excitation
Retarded growth, muscle weakness 5 to 6g/kg DM
Sodium Acid-base balance, osmoregulation Dehydration, poor growth
28mg/kg LW/day for maintenance, 33mg/kg LW/day for pregnancy or 0.44g/kg of milk
Sulphur Structure of amino acids, vitamins and hormones Equivalent to protein deficiency 1.3 to 2.0g/kg DM
Iron Haemoglobin; enzymes of electron transport chain Anaemia 30mg/kg DM
Copper Haemoglobin synthesis, enzyme systems; pigmentation
Anaemia, poor growth, loss of hair pigment, swayback 6mg/kg DM
CobaltComponent of vitamin B12 produced by microbes in the rumen
Anorexia (pine), emaciation, anaemia, listlessness 0.11mg/kg DM
Iodine Thyroid hormones – energy metabolism
Goitre, hair loss, weak or dead lambs
0.15mg/kg DM in summer 0.5mg/kg DM (pregnant and lactating ewes) in winter2.0mg/kg DM in presence of goitrogens
Manganese Enzyme activation Retarded growth, skeletal abnormality, ataxia 40mg/kg DM
Zinc Enzyme component and activator
Parakeratosis, poor growth, depressed appetite 40mg/kg DM
Selenium Vitamin E and iodine metabolism, immune function
White muscle disease, ill thrift, infertility 0.1mg/kg DM
For more information, see BRP+ Trace element supplementation of beef cattle and sheep at beefandlamb.ahdb.org.uk

62
Appendix 8: Interpreting silage analysis
Term Interpretation of analysis Typical range (DMbasis)
DM (%)
Dry matter. Material remaining after all the water has been removed by drying, corrected to allow for losses of volatile fatty acids. Low DM silage can be fermented and high in acids and low in rumen structure, reducing intakes. High DM silage is more susceptible to spoilage (bacterial and fungal).
G = 15–45 M = 24–35 W = 30–85
Crude protein (%)
Calculated from the total nitrogen content of the silage multiplied by 6.25. The value gives no information on the quality of the protein and does not differentiate between ERDP and DUP sources. If high, additional protein can be rapidly degradable and poorly utilised, especially if there is inadequate rumen available energy in the diet.
G = 10–20 M = 7–9 W = 9–12
D value (%) As known as digestibility. Digestible organic matter content in the DM. It is inversely related to the crop’s stage of maturity at cutting.
G = 55–75 M = 67–78 W = 70–77
ME (MJ/Kg)Metabolisable energy – measure of the energy content of the feed available after losses in, faeces, urine and methane. Predicted from the ‘D value’.
G = 9–12 M/W = 10–12.5
FME (MJ/Kg)Fermentable ME – measure of the portion of ME that is able to supply energy to rumen microbes, ie sugar, starch and digestible fibre fractions.
G/M/W = 6–10
pH
Acidity or alkalinity – pH <7 = acidic, pH 7 = neutral, pH >7 = alkaline. pH above this range, ie alkaline, may be due to poor or secondary fermentation, undesirable VFAs may have formed and production can be reduced. pH below this range, ie acidic may impair rumen function, resulting in acidosis, lower intakes and production.
G = 3.0–6.0 M = 3.6–4.0 W= 4.0–4.2
NH3-N of Total N (%)
Proportion of N that has been broken down during ensilage. It is the best indicator of silage fermentation. High levels indicate butyric fermentation, above 10%. A level below 5% indicates excellent fermentation.
G = 3–10 M = 0–4 W = 0–4
Sugars (%)Level of sugar remaining after fermentation. Level will be affected by the extent of fermentation and tends to be directly proportional to the DM content of the silage.
G = 2–20
Starch (%)Primary energy source of maize and wholecrop silages, from cereal cobs/ears. The rumen availability decreases as the maturity and DM of the crop increases.
M = 25–35 W = 20–30
Ash (%) Measure of the total mineral content. Values above 9% may indicate soil contamination during ensiling.
G = 5–12 M = 4–5 W = 4–8
NDF (%)Neutral detergent fibre levels indicate the total fibre content of the plant and include the hemi-cellulose, cellulose and lignin residues. High NDF levels are associated with mature crops at cutting.
G = 45–65 M = 35–45 W = 40–60
ADF (%)Acid detergent fibre value is similar to the NDF but only measures the amount of cellulose and lignin residues. The ratio of ADF to NDF is indicative of the proportion of digestible fibre in the forage.
G = 30–40 M = 20–28
Oil (%) Oil is an energy component of grass silage. Too high a level can interfere with the activity of rumen microbes. G = 3–5
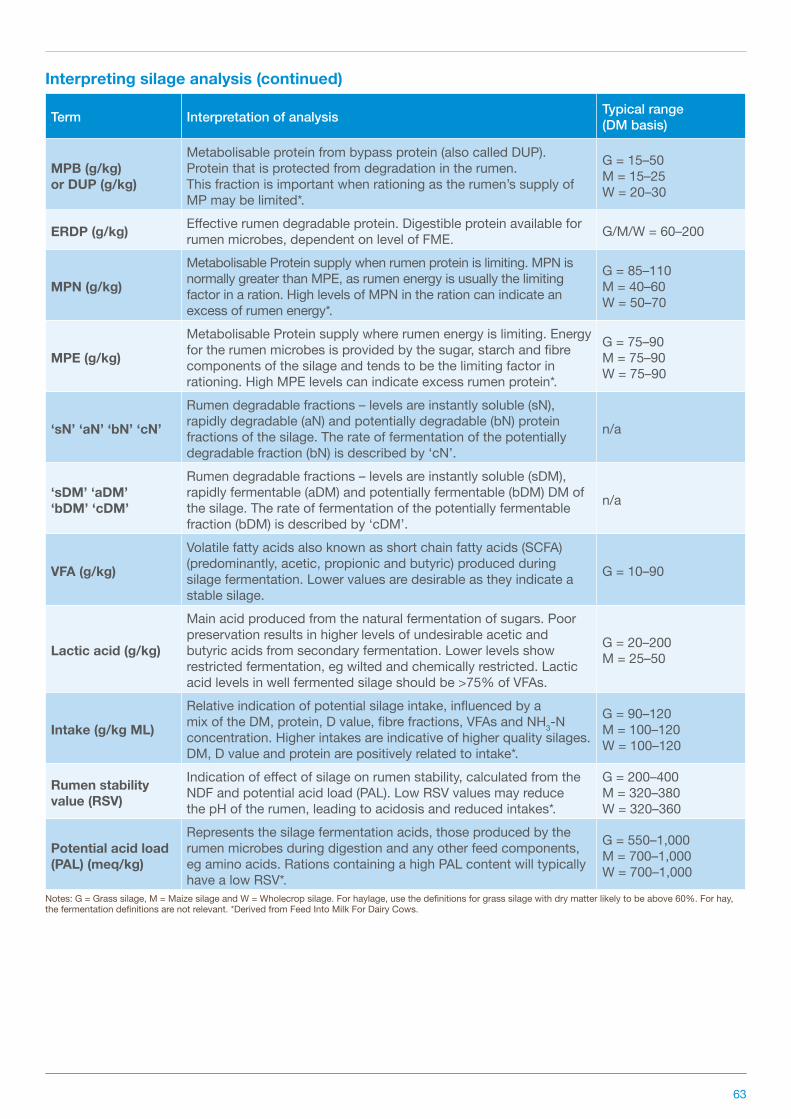
63
Interpreting silage analysis (continued)
Term Interpretation of analysis Typical range (DMbasis)
MPB (g/kg) or DUP (g/kg)
Metabolisable protein from bypass protein (also called DUP). Protein that is protected from degradation in the rumen. This fraction is important when rationing as the rumen’s supply of MP may be limited*.
G = 15–50 M = 15–25 W = 20–30
ERDP (g/kg) Effective rumen degradable protein. Digestible protein available for rumen microbes, dependent on level of FME. G/M/W = 60–200
MPN (g/kg)
Metabolisable Protein supply when rumen protein is limiting. MPN is normally greater than MPE, as rumen energy is usually the limiting factor in a ration. High levels of MPN in the ration can indicate an excess of rumen energy*.
G = 85–110 M = 40–60 W = 50–70
MPE (g/kg)
Metabolisable Protein supply where rumen energy is limiting. Energy for the rumen microbes is provided by the sugar, starch and fibre components of the silage and tends to be the limiting factor in rationing. High MPE levels can indicate excess rumen protein*.
G = 75–90 M = 75–90 W = 75–90
‘sN’ ‘aN’ ‘bN’ ‘cN’
Rumen degradable fractions – levels are instantly soluble (sN), rapidly degradable (aN) and potentially degradable (bN) protein fractions of the silage. The rate of fermentation of the potentially degradable fraction (bN) is described by ‘cN’.
n/a
‘sDM’ ‘aDM’ ‘bDM’ ‘cDM’
Rumen degradable fractions – levels are instantly soluble (sDM), rapidly fermentable (aDM) and potentially fermentable (bDM) DM of the silage. The rate of fermentation of the potentially fermentable fraction (bDM) is described by ‘cDM’.
n/a
VFA (g/kg)
Volatile fatty acids also known as short chain fatty acids (SCFA) (predominantly, acetic, propionic and butyric) produced during silage fermentation. Lower values are desirable as they indicate a stable silage.
G = 10–90
Lactic acid (g/kg)
Main acid produced from the natural fermentation of sugars. Poor preservation results in higher levels of undesirable acetic and butyric acids from secondary fermentation. Lower levels show restricted fermentation, eg wilted and chemically restricted. Lactic acid levels in well fermented silage should be >75% of VFAs.
G = 20–200 M = 25–50
Intake (g/kg ML)
Relative indication of potential silage intake, influenced by a mix of the DM, protein, D value, fibre fractions, VFAs and NH3-N concentration. Higher intakes are indicative of higher quality silages. DM, D value and protein are positively related to intake*.
G = 90–120 M = 100–120 W = 100–120
Rumen stability value (RSV)
Indication of effect of silage on rumen stability, calculated from the NDF and potential acid load (PAL). Low RSV values may reduce the pH of the rumen, leading to acidosis and reduced intakes*.
G = 200–400 M = 320–380 W = 320–360
Potential acid load (PAL)(meq/kg)
Represents the silage fermentation acids, those produced by the rumen microbes during digestion and any other feed components, eg amino acids. Rations containing a high PAL content will typically have a low RSV*.
G = 550–1,000 M = 700–1,000 W = 700–1,000
Notes: G = Grass silage, M = Maize silage and W = Wholecrop silage. For haylage, use the definitions for grass silage with dry matter likely to be above 60%. For hay, the fermentation definitions are not relevant. *Derived from Feed Into Milk For Dairy Cows.
64
For more information contact:Better Returns Programme AHDB Beef & Lamb Stoneleigh Park Warwickshire CV8 2TL
Tel: 024 7647 8834 Email: [email protected]
beefandlamb.ahdb.org.uk
While the Agriculture and Horticulture Development Board seeks to ensure that the information contained within this document is accurate at the time of printing, no warranty is given in respect thereof and, to the maximum extent permitted by law the Agriculture and Horticulture Development Board accepts no liability for loss, damage or injury howsoever caused (including that caused by negligence) or suffered directly or indirectly in relation to information and opinions contained in or omitted from this document.
AHDB Beef & lamb is part of the Agriculture and Horticulture Development Board (AHDB).
© Agriculture and Horticulture Development Board 2017. All rights reserved.