Better Display Screen Equipment work-related ill health ... · PDF fileBetter Display Screen...
156
Health and Safety Executive Better Display Screen Equipment (DSE) workrelated ill health data Prepared by the Institute of Occupational Medicine for the Health and Safety Executive 2007 RR561 Research Report
-
Upload
phungkhuong -
Category
Documents
-
view
218 -
download
2
Transcript of Better Display Screen Equipment work-related ill health ... · PDF fileBetter Display Screen...

Health and Safety Executive
Better Display Screen Equipment (DSE) workrelated ill health data
Prepared by the Institute of Occupational Medicine for the Health and Safety Executive 2007
RR561 Research Report

Health and Safety Executive
Better Display Screen Equipment (DSE) workrelated ill health data
AS Melrose, RA Graveling, H Cowie P Ritchie, P Hutchison, & RM Mulholland Institute of Occupational Medicine Research Avenue North Edinburgh EH14 4AP
A variety of illhealth symptoms have been associated with work with Display Screen Equipment (DSE) including musculoskeletal disorders; mental stress; and visual fatigue. The project sought information about the extent of such illhealth in DSE workers through a survey of employees. It compared the data with those in the scientific literature. An extensive literature review sought to identify consistent evidence on any possible causal role of workplace factors.
The survey found high prevalences in DSE users of selfreported symptoms, eg. headaches (52%), eye discomfort (58%), and neck pain (47%); other symptoms such as back (37%) and shoulder (39%) pain were also frequently reported. Most of those reporting symptoms did not take any time off work. These findings are broadly consistent with other studies in the literature.
The results showed a significant influence of DSE work in that the prevalences of symptoms were higher among those who spent more time at their computer at work and among those who worked for longer without a break. All symptoms were more common among respondents who had indications of stress, anxiety and/or depression. These findings are again consistent with the published literature. Although many studies have examined possible causal factors, methodological differences make it hard to draw any firm conclusions about causation of symptoms.
Comparing these results with those of earlier research provides no positive evidence that the introduction of legislation on DSE work in 1993 has reduced illhealth in DSE workers. However there are substantial uncertainties, not least over the extent to which the provisions of the legislation have been fully implemented, and it cannot be safely concluded that the legislation has had no effect. The report discusses the significance of its detailed results in the context of relevant factors in the workplace, and makes recommendations.
This report and the work it describes were funded by the Health and Safety Executive (HSE). Its contents, including any opinions and/or conclusions expressed, are those of the authors alone and do not necessarily reflect HSE policy.
HSE Books

© Crown copyright 2007
First published 2007
All rights reserved. No part of this publication may bereproduced, stored in a retrieval system, or transmitted inany form or by any means (electronic, mechanical,photocopying, recording or otherwise) without the priorwritten permission of the copyright owner.
Applications for reproduction should be made in writing to:Licensing Division, Her Majesty’s Stationery Office,St Clements House, 216 Colegate, Norwich NR3 1BQor by email to hmsolicensing@cabinetoffice.x.gsi.gov.uk
ii

EXECUTIVE SUMMARY
A variety of ill-health symptoms have been associated with intensive work with Display Screen Equipment (DSE) including musculoskeletal disorders (MSDs) (upper limb disorders; back pain); mental stress; and visual fatigue. In 2003/04, MSDs (bone, joint or muscle problems) were by far the most commonly reported work-related illnesses in Great Britain, with an estimated 1,108,000 people ever employed affected.
The risks of substantial ill-health to any individual user of DSE, is believed to be relatively low, particularly if regulatory provisions are adequately complied with. However, the very large number of people exposed to such work means that, even at a low level of incidence, DSE work potentially makes a significant contribution to the estimated total of working days lost to MSDs in the UK each year.
Against this background, the Health and Safety Executive (HSE) identified a need for improved data relating to the levels of DSE work-related ill health in UK office workers. In addition, targets for reducing work-related ill health and absence from work meant that up to date information was required of the scientific evidence on the extent to which such ill-health could be caused or exacerbated by work and to establish significant risk factors relating to the health problems identified. The research reported here was commissioned as a result.
The study involved a questionnaire survey of a sample of DSE users in organisations of different sizes and sectors across the UK to determine the prevalence of work-related ill health. This was followed by a statistical analysis of additional information on work exposure factors collected during the questionnaire survey. In parallel with this, an in-depth literature review was conducted to determine levels of ill-health in other comparable working populations and to establish the evidence-base for potential causal factors for DSE-related ill health.
The survey results are based on the study group of 1327 DSE users who replied to the survey carried out during 2006 (representing an estimated response rate of 40-45%). These were drawn from a total of 130 organisations randomly selected from throughout the UK. Small businesses were particularly well represented with 108 of the 130 being drawn from this size group. Key findings were:
• 73% of all respondents to the questionnaire survey reported one or more musculoskeletal symptom.
• 12 month prevalence of individual musculoskeletal symptoms ranged from 12% for elbow and forearm symptoms to 47% for neck symptoms. Symptoms involving the shoulder, neck and back were most frequently reported together.
• Slightly over half of all respondents reported symptoms affecting the head and/or eyes. • As expected from the literature, symptoms were reported more frequently by women than
men. • There was little evidence of differences in prevalence between companies of different sizes
or different industry sectors. • Prevalence of these symptoms was higher among those who spent more time at their
computer at work and among those who worked for more than one hour without a break. • All symptoms were more common among respondents who also had indications of stress,
anxiety and/or depression. • 12 month incidence of musculoskeletal symptoms ranged from 2.7% for forearm and leg
symptoms to over 6% for hand and neck symptoms. Incidence of eye discomfort was higher than for all the musculoskeletal symptoms at 9.5%.
iii
• Occurrence of anxiety, depression and distress was marginally more common among younger respondents and anxiety occurred more frequently in women than men. There was little consistent difference in the occurrence of distress, anxiety or depression between companies of different sizes or sectors.
• Occurrence of anxiety, depression and distress was more frequent among those who typically worked more than 5 hours over their contracted hours each week; distress was more common among those who worked more than one hour without a break; and anxiety and depression were more common among those who spent longer per week at the computer.
• The majority of those reporting symptoms (at least 82% depending upon the symptom) took no time off work related to that symptom.
• Expressed as a proportion of those reporting symptoms, the most frequent absences from work were for headaches, back pain and leg pains unrelated to back pain, where more than 10% of those reporting the symptoms had taken some time off work.
• Expressed as the absolute numbers of people reporting absence, the most frequent absences from work were for headaches (105) followed by back pain (65) and neck pain (39).
The recorded prevalences of MSD symptoms are broadly similar to those reported in the published scientific literature, although differences in survey design make accurate comparisons difficult.
• Prevalences of any musculoskeletal symptoms (mainly aches and pains) over the last 12 months in UK-based studies of computer users ranged from 65% - 86%. The value for the present study (73%) is almost mid-way within this range.
• One UK-based study reported wrist/hand symptoms over a 12 month period with prevalences of 49% (left) and 52% (right) compared to 35% in the current study and a lower figure from another UK-based study of 11% (males) and 15% (females) over a one-week time frame.
• For neck and shoulder symptoms, no UK-based studies are available for comparison although values in the literature from other countries of 60% and 43% can be compared to that of 55% in the present study.
• Finally, a 12 month prevalence of back pain of 47% in the present study is lower than that in the only other UK-based study of computer users over the same time frame of 58%.
These prevalences are also broadly similar to those determined in an earlier IOM survey using the same question set. Certainly they are not noticeably lower. For example, a figure of 55% from the current study reporting upper limb symptoms within the last year can be compared to levels of 49% in the preceding three months and 55% lifetime prevalence reported from the earlier IOM study.
The two surveys span the period of currency of the Health and Safety (Display Screen Equipment) Regulations 1992 suggesting that these regulations may not have had a major impact on the prevalence of reported MSD symptoms. However, there are signs in the questionnaire responses (for example in the proportion reportedly not receiving information and training) that implementation of the DSE Regulations may be incomplete, although this was not formally explored in the research reported here. Care should therefore be taken in making judgements on the effectiveness of the regulations based on these findings.
In the present study, the prevalences of MSD symptoms were higher among those who reported spending more time at their computer at work. This is consistent with the scientific literature which shows a reasonably strong and consistent exposure-response relationship between computer work and symptoms. The relationship appears to vary with the type of input device used.
iv

For keyboard use, odds ratios for MSD symptoms are generally moderate (< 2.0) and are associated with more than about 20 hours use a week. For the mouse, the risks can be markedly higher (with several papers reporting odds ratios in excess of 4.0) and a doubling of risk is probably associated with around ten hours of mouse use a week. These estimates are necessarily vague as they reflect differences in the design and analysis of different studies and vary with the anatomical site of any symptoms. Although the evidence is less strong, the literature also includes a number of prospective studies which suggest that this relationship is possibly causal.
The published literature does not allow any clear assessments of which specific aspects of computer work or workstation design (including psychosocial factors) result in the observed relationship between computer work and MSD symptoms. Although many papers report a wide variety of workplace factors, often showing statistically significant relationships with symptoms, these findings are rarely duplicated across studies. This is often more due to differences in study design and the parameters assessed in any one study rather than any failure of one study to replicate earlier findings.
One possible explanation for this is that MSD symptoms develop as a result of the relatively static nature of computer work per se rather than any specific deficiency in the workplace. The idea of the adverse affects of static loading on muscles and other structures is not new and, although there is no specific evidence from the current study to support this hypothesis, it would certainly seem to merit further consideration and exploration.
• The 12-month prevalence of headaches of 52% reported in the present study is higher than those of 43% and 30% reported in other UK studies of computer users (using the same time frame) and all are higher than the value for non-users of 12% reported in the second of these two studies. However, they are within the cited population range of 38-68%.
• The 12-month prevalence of visual discomfort of 58% reported in the present study is similar to one other UK-based study (59%) but higher than another which reported a prevalence of 47% amongst computer users but only 23% in non-users (using the same time frame). However, they can be compared to the range for computer users in the literature of 38% (one week prevalence) to 72% (period not given). No population-based data could be found.
• There is insufficient reliable information in the literature to draw even tentative conclusions regarding any associations between computer work in general or specific work characteristics and either headaches or visual problems.
• The level of psychological distress recorded in the present study using the General Health Questionnaire (GHQ-12) was considerably higher than the documented levels for a UK non-clinical population and a UK industrial population but, in turn, considerably lower than that reported for another predominantly white collar workplace based study (not specifically computer users) using the same instrument.
• The levels of anxiety and depression recorded in the present study using the Hospital Anxiety and Depression scale (HADS) were marginally higher than those reported for a UK non-clinical population using the same scale.
The findings from the current survey of an association between distress, anxiety and depression and work characteristics (e.g. work duration) are consistent with the current concerns regarding psychosocial and psychological factors and MSDs. However, it is not possible to differentiate between cause and effect on the basis of this cross-sectional study.
v

Although almost three-quarters of respondents reported at least one musculoskeletal symptom the vast majority also reported that they had not taken any time off work as a consequence of any symptoms reported. The symptoms most commonly leading to time off work were headaches (absence reported by 7.9% of all respondents) followed by back pain (where the equivalent figure was 4.9%).
On the basis of the findings of the survey and literature review recommendations were made to:
• examine the current implementation and consequent effectiveness of the DSE Regulations, particularly the issue of breaks from DSE work;
• explore the implications of the finding of an exposure-response relationship between mouse use and MSD symptoms for the guidance given in respect of jobs involving intensive mouse use;
• examine the scientific literature on muscle physiology etc. to establish whether the concept of ‘postural fixity’ provides a plausible mechanism to explain the apparent exposure-response curve between time spent working at a keyboard (particularly without a break) and the incidence of MSD symptoms in the absence of any clear evidence for specific causal factors;
• explore the scope for reducing headaches and visual symptoms as a cause of absence from DSE work, possibly by better implementation of breaks;
• explore the issue of stress and computer-based work within the context of the Working Time Directive and its implementation;
• examine the provisions of the Data Protection Act and their implications in relation to the use of email and other internet technologies as an aid to workplace surveys in order to facilitate future studies.
vi

CONTENTS
EXECUTIVE SUMMARY III
1 INTRODUCTION 1
2 BACKGROUND 3
3 AIMS AND OBJECTIVES 5
4 LITERATURE REVIEW: INTRODUCTION AND METHODS 7
5 LITERATURE REVIEW: FINDINGS 15 5.1 General comments 15 5.2 Prevalence or Incidence of MSDs 16 5.3 Prevalence and incidence of psychological problems (stress) 27 5.4 Prevalence and incidence of visual health problems 28 5.5 Evidence on causal factors 30
6 LITERATURE SURVEY: DISCUSSION 47 6.1 General comments 47 6.2 Problems in comparing studies 48 6.3 MSD symptoms or disorders? 50
7 QUESTIONNAIRE SURVEY: METHODS 53 7.1 Constructing a sample 53 7.2 Survey instruments 56
8 QUESTIONNAIRE SURVEY: RESULTS 59 8.1 Survey 59 8.2 Characterisation of working hours and computer use 63 8.3 Overall prevalence of symptoms 64 8.4 Overall incidence of symptoms 65 8.5 Logistic regression analyses of musculoskeletal, head and eye
symptoms 678.6 Logistic regression analyses of well-being indicators 738.7 Musculoskeletal, head and eye symptoms in relation to anxiety and
depression 748.8 Work-days lost 768.9 Responses to non-medical questions 78
9 DISCUSSION AND KEY RESULTS OF THE SURVEY 79
9.1 Survey practicalities 799.2 Overview of key findings 809.3 General discussion of results 82
10 GENERAL DISCUSSION 87
10.1 MSD Prevalence data 8710.2 MSD Incidence data 9110.3 MSD Relationship to computer work 92
vii

10.4 MSD Evidence on causal factors 9510.5 MSD General comments 9810.6 Visual problems 9910.7 Psychological problems 100
11 CONCLUSIONS AND RECOMMENDATIONS 103
REFERENCES 107
APPENDIX 1: SUMMARY OF SIGNIFICANT TESTS OF ASSOCIATION (≤ 5%) OF ALL VARIABLES WITH EACH SYNDROME GROUP (FROM HANSON ETAL, 1999) 113
APPENDIX 2: SUMMARY OF KEY POINTS OF PAPERS AND ‘NIOSH’ RATING115
APPENDIX 3: CHARACTERISATION OF WORKING HOURS AND DURATIONOF COMPUTER USE 133
APPENDIX 4: RESPONSES TO NON-MEDICAL QUESTIONS 137
viii

1 INTRODUCTION
This study was established with two purposes. Firstly, it was intended to provide up-to-date information about the levels of possibly work-related ill-health amongst computer users. Secondly, it was to carry out an in-depth survey of the literature to establish how these levels of ill-health compared to those reported previously (and elsewhere) and to identify the current level of reliable evidence regarding possible work risk factors for the health problems studied.
Work with display screen equipment (DSE) in the United Kingdom (UK) is subject to the Health and Safety (Display Screen Equipment) Regulations 1992 as amended by the Health and Safety (Miscellaneous Amendments) Regulations 2002 (the “DSE Regulations”). A variety of ill-health symptoms have been associated with intensive work with DSE (also described as VDUs). Musculoskeletal disorders (MSDs) are identified as one of the principal risks from such work (including both upper limb disorders and back pain) although the guidance on the regulations (HSE, 2003) also identifies ‘visual fatigue’ and ‘mental stress’ (although it emphasises that the former effects are transient and are not indicative of any permanent injury).
A previous major survey of upper limb symptoms amongst computer (keyboard) users, carried out on behalf of the Health and Safety Executive (HSE) by the Institute of Occupational Medicine (IOM) (Hanson et al, 1999) examined levels of reported symptoms across over 3,500 individuals (a response rate of over 80%). This survey reported that, across all organisations studied, an average of 49% of respondents had experienced symptoms in the last 3 months and 14% had asked for advice about their symptoms from a health professional. However, the timing of this study (1992/1993) meant that it largely predated the introduction and implementation of the DSE Regulations. Although not laying any claim to be entirely representative of the general population there was no reason to suggest that the sample drawn from both the public and private sector was in any way unusual. Clearly, although it would be hoped that the incidence of such problems has reduced in the subsequent decade, such figures lend support to concerns that computer work could make a significant contribution to work-related ill health.
According to the HSE (HSE, 2003) the risks of MSDs to individual users of computers, is believed to be relatively low, particularly if regulatory provisions are adequately complied with. However, the very large number of people exposed to such work means that, even at a low level of incidence, computer work could potentially make a significant contribution to the estimated 12 million working days lost to MSDs in the UK each year.
Attribution of cause to occupational factors is problematic. Both MSDs and stress are recognised as being multi-factorial with many contributing factors including both work and non-work elements (for example back pain is recognised as having a significant genetic component). However, with MSDs, assumed associations arise because the use of the affected muscles at work will provoke symptoms. A hypothetical continuum can be postulated ranging from evocation of symptoms of a pre-existing condition, through exacerbation of an underlying pre-existing condition, to causation of a condition in an otherwise healthy individual. Each of these will result in symptoms arising at work giving rise to an assumed association. Whilst this distinction will be important in some circumstances (e.g. in the event of civil litigation) in others it is less important. Thus, if performing a particular job leads to an individual experiencing symptoms which prevent him or her from performing that job (or impairs job performance) and losing time from work as a consequence, then action is required to at least avoid provoking symptoms regardless of their aetiology.
1

This view is consistent with the World Health Organisation’s (WHO) definition of work-relatedness in terms of interfering with work rather than any imputation of causation.
Stress is second only to MSDs in terms of work-related sickness absence in the UK (Jones et al, 2005). Whilst the guidance to the DSE Regulations identifies mental stress as one of the principal risks of such work the actual levels of stress or related symptoms associated with computer work is not known, and the guidance given to control any risk is largely generic. Anecdotally, some aspects of computer work might be considered to add to the total stress burden (for example by exacerbating workload by the computer crashing or locking at critical times). At the same level, some computer-based work can be regarded as ‘machine’-paced contributing to stress through a lack of personal control and other work might engender a sense of isolation and lack of support (although a more critical analysis might question whether it is the computer work itself that creates this feeling or wider organisational issues). Given the importance of stress as a work-related illness, together with the large proportion of the working population using computers as part of their work, it is clearly important to establish what scientific basis there might be for such beliefs.
Many of the early concerns about the health and safety implications of the widespread introduction of computers into workplaces centred on possible effects on the eyes and eyesight of users. Although these concerns were largely overtaken by the issue of MSDs, and HSE advice is that there is no evidence of permanent damage to eyes or eyesight, temporary eye and eyesight effects (including symptoms such as headaches) are still regarded as one of the principal risks of DSE work (HSE, 2003). Despite this, the prevalence of such problems amongst such users does not appear to have been widely studied in recent years and the guidance given is again largely generic rather than evidence-based.
2

2 BACKGROUND
Musculoskeletal disorders (MSDs) remain a significant cause of work-related sickness absence in Great Britain. Data from the Labour Force Survey (Jones et al, 2005) suggests that, in 2003/04, an estimated 1,108,000 people ever employed were affected by bone, joint or muscle problems making them by far the most commonly reported work-related illnesses. Apart from the individual human impact this represents a major drain on resources and a negative impact on competitiveness. The survey showed that, in 2003/04, on average, each person suffering from an MSD took an estimated 19.4 days off in that 12 month period equivalent to an annual loss of 0.52 days per employed worker in Great Britain. No data are available in relation to types of work which would allow the impact on MSDs of computer-based work to be assessed.
It is widely recognised that the causes of MSDs in general and upper limb disorders (ULDs) in particular are complex, including contributions from both work and non-work factors. In addition, although for many years the focus of attention has been on physical factors in the workplace, there is a growing recognition of the contribution from psychosocial workplace factors (e.g. Devereux et al, 2002). In seeking to establish likely causation, a further difficulty is that having symptoms of an MSD frequently prompts an individual to modify their work or working practices. This is particularly the case now in the context of the DSE Regulations where user should be actively encouraged to report problems so that they can be investigated and ameliorative action taken. These changes can make it difficult to identify specific causal relationships. For example, a previous IOM study on ULDs and computer work (Hanson et al, 1999) initially showed a statistically significant relationship between reporting upper limb symptoms and using a document holder. As the authors pointed out, this can be rationally explained as the efforts by employers to ameliorate symptoms by providing a holder. However, this relationship generally disappeared when more complex multiple stepwise regression analyses were performed. An alternative explanation was that having a document holder was possibly a surrogate for intensive or prolonged keyboard work.
The second phase of this previous IOM work was a major case-control study of keyboard users. A total of 449 subjects took part (295 cases and 154 controls). Following an extensive review of the epidemiological and scientific literature available at the time a measurement and observation package was assembled. Administered by qualified ergonomists it encompassed a structured interview, registration of wrist movements at work using electrogoniometry; direct observation and recording of gross postural features and characteristics (with prior standardisation and training of all researchers); and administration of a psychosocial factors questionnaire. From this package, approximately 100 possible explanatory variables were derived. These could be classified into nine logical groups: age and gender; duration of keyboard usage and other ‘risky’ activities (e.g. hobbies); information about the job; information about the work equipment; the physical environment and factors outside work (e.g. vibration exposure); personal information; general body postures; hand and wrist postures; and psychosocial factors. In the present report, Appendix 1 summarises the significant tests of association between individual variables and syndrome groups defined from clusters of upper limb symptoms (derived from Hanson et al., 1999). Further regression analyses were then performed and reported for each of these syndrome groups.
This work, which in itself entailed a significant reduction in the number of variables actually studied over those originally identified, serves to illustrate the complexities and challenges in determining what contribution workplace factors make to the incidence of MSDs in computer-based work.
Stress is second only to MSDs in terms of work-related sickness absence in the UK (Jones et al, 2005). Although by no means a new issue (early use of the term stress in relation to biological systems is usually attributed to Cannon, 1935), stress began to be more widely
3

recognised as a work issue in the UK during the 1990’s (e.g. Cox, 1993). More recently, recognition of a requirement for stress to be considered in workplace risk assessments has resulted in the development and increased application of the HSE Management Standards on Stress (http://www.hse.gov.uk/stress/standards/index.htm). Whilst the guidance to the DSE Regulations identifies mental stress as one of the principal risks of such work the actual levels of stress or related symptoms associated with computer work is not known. As acknowledged in the text, attributing individual symptoms to particular aspects of a job or workplace can be difficult.
Similarly, although eye and eyesight effects (including symptoms such as headaches) are stated to be one of the principal risks of DSE work the prevalence of such problems amongst such users does not appear to have been widely studied in recent years.
4

3 AIMS AND OBJECTIVES
The aims of the research were to provide improved data about levels of DSE work-related ill health in the UK and to determine the strength of the published scientific evidence in relation to relevant DSE health risk-factors. The objectives against each of these aims were:
a. Improved data about levels of DSE work-related ill health
i. What is the extent of ill health in the United Kingdom that is possibly caused or made worse by DSE work (prevalence and incidence of cases, working days lost)?
ii. What are the significant health problems caused or made worse by DSE work?
iii. Do levels of DSE-related ill health vary between employment sectors (public or private) and sizes of organisations?
b. Improved understanding of the relevant risk factors
iv. Which are the significant risk factors in the scientific literature relating to the health problems identified in relation to DSE work (Aim a(ii))?
v. What is the relative importance of the acknowledged DSE-work-related risk factors in contributing to ill health?
To achieve these aims and objectives the research was carried out in two parts:
1. An in-depth literature review of potential causal factors for DSE-related ill health. In keeping with other authoritative epidemiological reviews, the quality of the research included was carefully assessed to ensure the reliability of any findings. The review also sought to establish levels of DSE-related ill health reported in the literature to aid in the interpretation of the current study and to provide further evidence of the extent of work-related ill health amongst DSE users.
2. A questionnaire survey of a sample of computer users in organisations of different sizes and sectors across the UK to determine the prevalence of work-related ill health among such users. Questions regarding the weekly duration of computer use and periods of uninterrupted use (significant factors identified previously) were included in the survey questionnaire. A statistical analysis of additional information on the potential contribution of such factors was then undertaken.
5

6

4 LITERATURE REVIEW: INTRODUCTION AND METHODS
As part of the study, a review of the published scientific literature was conducted. This review had two purposes. Firstly, it was to establish the reported prevalences (and incidence data if available) of MSDs and other DSE-related conditions in other studies of computer users. Secondly, it was to examine recent epidemiological literature on possible causal factors for these conditions to establish a current level of evidence on this issue. It was anticipated that this could serve to inform future, possibly longitudinal, studies on this topic.
Searches were conducted using the on-line service PubMed (www.pubmed.gov). PubMed is a service provided by the United State National Library of Medicine which includes over 16 million citations from MEDLINE and other life science journals for biomedical articles dating back as far as the 1950s. PubMed includes links to full text articles and other related resources. In addition, an internet search was undertaken using a general search engine with some of the terms, but the quality of the returns was questionable with most of the information consisting of general discussions about VDUs or DSE and employee health rather than actual scientific studies. It was therefore felt that Pubmed would document those scientific or medical papers that would be relevant to the review. Pubmed also included social science papers (e.g. covering stress). Unpublished / grey literature was excluded from the review as it was felt that it would not have been peer reviewed and the results could be seen as speculation rather than scientifically significant.
Initially a list of search terms was compiled which included terms such as “carpal tunnel”, “neck pain” and “visual discomfort”. These were grouped under three main headings:
• musculoskeletal disorders; • fatigue and stress; • visual disorders.
The words and phrases on this list were then used in combination with ‘AND computer’ to search the databases for reference material thus finding all references with both the word and computer that was related. Checks for alternative terms to ‘computer’ indicated a very high degree of overlap in the references identified such that is seemed a waste of resources to continue with these additional entries.
The title and abstract were read to ascertain whether the document actually covered the subject area or merely mentioned the terms somewhere in the text for example, study looking at recreational computer use.
Duplications (where two topics were covered in the same reference) were removed from the list and the remaining references sorted into two categories:
a) Relevant: • Studies involving more than 100 subjects. • Studies where the number of subjects was not given in the abstract but which
appeared to be of possible relevance.
b) Not relevant: • Studies where the computer was used for recreational use e.g. computer game use
rather than computer use within the working environment. • Studies where there were less than 100 subjects in the study i.e. case studies
involving small numbers or individuals. • Studies which were not specifically computer-related e.g. a carpal tunnel research
paper from various industries with a mention of computers.
7

These references were then obtained for further analysis. Tables 4.1, 4.2 and 4.3 display the terms used and the number of references obtained for:
1) Musculoskeletal terms; 2) Visual related terms; 3) Stress related terms;
Tables 4.4, 4.5 and 4.6 provide further details of the reference selection for musculoskeletal, visual and wellbeing related terms.
49 research papers were identified from the initial search as being relevant:
• 43 English; • 3 French; • 1 Japanese; • 1 Korean; • 1 Portuguese.
Several of the foreign papers were disregarded on sample size criteria (i.e. sample was below 100, indeed one Italian paper appeared to look at only one individual that had presented with tenosynovitis). Previous literature reviews have shown that the majority of good relevant papers have been published in English therefore the authors of the Japanese, Portuguese and Korean papers were studied to determine whether the research had been translated into English and published elsewhere. Although the Japanese and Portuguese authors had written other papers, some of which were in English, these were not related to the paper under review. The Korean paper on the other hand had been translated and published elsewhere and was obtained for further analysis in addition to the 3 French papers which could be translated in-house.
8

Table 4.1 Number of papers identified using the musculoskeletal search terms
Body / Injuries Initial sweep " " AND Computer Met defined criteria
Work related musculoskeletal 93 25 13 disorders Repetitive strain injury 261 16 nothing new Occupational overuse 168 0 nothing new syndrome Postural syndrome 17 0 nothing new Muscle strain 286 4 48 Tendon injury 78 2 nothing new Soft tissue inflammation 29 0 0 Lower Back 255 47 6 Lumbar pain 166 3 4 Spinal degeneration 89 2 1 Disc herniation 48 40 0 Disc degeneration 67 41 0 Vertebrae 2244 1522 3 Slipped disc 179 0 1 Osteoarthritis 572 541 0 Thoracic discomfort 10 0 0 Thoracic outlet syndrome 14 13 0 Cervical discomfort 9 0 0 Frozen shoulder 12 5 0 Neck pain 81 81 16 Shoulder pain 43 44 10 Bursitis 13 8 0 Carpal tunnel 114 114 9 Chronic pain syndrome 23 5 0 Cubital tunnel syndrome 3 3 0 Cumulative trauma disorders 263 179 43 De Quervains 0 0 0 Rotator cuff 84 85 0 Epicondylitis 11 11 2 Fibromyalgia 33 33 0 Forearm pain 51 5 5 Tennis elbow 14 14 2 Ganglion cysts 0 0 0 Hand and wrist injuries 20 0 1 Radial nerve compression 1 0 0 Median nerve compression 92 1 4 Tenosynovitis 15 15 4 Tendonitis 38 4 4 Myofascial 32 33 2 Trigger finger 5 5 0 Ulnar Nerve compression 9 8 0 Radial tunnel 12 4 nothing new Nerve entrapment 221 7 nothing new Non-specific arm pain 11 1 nothing new TOTAL NUMBERS 4854 2874 117
9

Table 4.2 References for musculoskeletal terms disregarded and obtained for further review
Details Total Fewer than 100 subjects 36 Numbers not mentioned or not enough information in abstract 13 Duplications 12 Reviews but with no specific details 5 Recreational or not actual computer use 12 Foreign language (3 <100 respondents, one in Japanese, 3 in French) 7 Total disregarded 85 Number of papers reviewed 32
Table 4.3 Number of papers identified using the visually-related terms
Term Initial sweep " " AND Computer Potentially relevant
Visual discomfort 78 19 nothing new Eyesight 0 0 0 Eye problems 30 5 1 Glaucoma 32 0 0 Visual defects 69 0 0 Visual disturbances 7 1 1 Eye strain 21 14 5 Eye fatigue 19 19 nothing new Headaches 33 1 1 Totals 289 59 8
Table 4.4 References for visually related terms disregarded and obtained for further review
Removed from review Total Fewer than 100 subjects 4 Duplications 1 Foreign language (one in Spanish but with <100 respondents other in 2 Portuguese) Studies on children 0 Total disregarded 7 Number of papers reviewed 1
Table 4.5 Number of papers identified using the wellbeing related terms
Term Initial sweep " " AND Computer Potentially relevant
Job Demands 50 9 8 Motivation 1216 17 7 Peer pressure 3 0 0 psychosocial 84 13 13 Alcoholism 65 1 1 Job complexity 5 2 1 Bullying 0 0 0 Stress 431 67 16 Totals 1854 109 46
10

Table 4.6 References for wellbeing terms disregarded and obtained for further review
Removed from review Total Duplications 17 <100 subjects 13 Foreign language (one <100 respondents, one in Korean, one in Portuguese – 4 duplicated twice and under eye strain above) Studies on children 2 Total disregarded 36 Number of papers reviewed 10
The major review of the epidemiological literature conducted by NIOSH (Bernard, 1997) formulated a series of evaluative criteria against which each paper reviewed was assessed. These were:
Criterion Definition
1. The participation rate was ≥ 70% as this criterion limits the degree of selection bias in the study.
2. The health outcome was defined by symptoms and physical examination. This criterion reflects the preference of most reviewers to have health outcomes that are defined by objective criteria
3. The investigators were blinded to health or exposure status when they were assessing the health or exposure status. This criterion limits observer bias when classifying exposure or disease
4. The paper under review was subjected to an independent exposure assessment with characterisation of the independent variable of interest (such as repetition or repetitive work). This criterion indicated whether the exposure assessment was conducted on the joint of interest and involved the type of exposure being examined.
Studies which used specific diagnostic criteria (including physical examination techniques) were given greater consideration than those which relied on self-reported issues. Therefore, observational studies were seen to be superior than those where the authors had no direct contact with the respondents and had relied on self-reporting of symptoms and duration of time spent at a computer. Allowing a score of one for each criterion met gives each paper a score from 0-4.
It was originally intended to utilise these same criteria in the current review and Appendix 2 summarises some features of each paper and tabulates the ‘NIOSH score’ for each. It will be seen that very few scored at all highly. In initiating the review it became apparent that papers could be doubly ‘penalised’ when applying the criteria. For example, if health outcome was by self-reported questionnaire then, it failed to score on criterion 2. However, in these papers there were no investigators and the paper would therefore also fail against criterion 3. Equally, if the paper was simply a prevalence study amongst a particular group of employees, then there was no exposure assessment and therefore no independent evaluation (criterion 4).
Because of these factors it was decided not to place too much emphasis on compliance with the NIOSH criteria (although some cognisance of them was still taken). As an alternative, different criteria were evolved and applied in assessing the merit of individual papers. The NIOSH criteria where however retained for further guidance (and some, such as a participation rate in excess of 70%, remained relevant).
11

As these new criteria evolved during the review process they were not documented beforehand. However, to ensure consistency, papers evaluated earlier in the review process were re-examined to ensure that they had not been regarded too harshly (or leniently) because of their apparent ‘failure’ to meet the original criteria.
One pre-existing criterion was that of the scale of the study being reported. In screening, papers reporting on fewer that 100 subjects were excluded. Above that lower limit there was a tendency to consider larger scale studies more reliable although, when other criteria were taken into account, size clearly was not everything. Often related to this was the question of the nature of the sample selected and the manner in which they had been recruited to the study.
Study design was clearly also a factor with a number of prospective studies identified from the literature and a number of studies structured to provide (or at least look for) exposure-response relationships. Information and data from such (prospective) studies were accorded more weight than cross-sectional studies. Related to this, where relevant, was the definition adopted for any ‘control’ groups who frequently were not genuinely asymptomatic. Perhaps, given the many reasons why individuals can experience muscular aches and pains, such approaches are being realistic as it might well be very difficult to recruit controls who have genuinely never had a brief period of muscle discomfort of some sort. Nevertheless, papers where genuinely asymptomatic individuals had been used as controls were accorded more value than those where controls had reported minor symptoms.
To some extent other criteria were perhaps applied to the paper, rather than the study itself. For example, it was difficult (and not always possible) to differentiate between where a factor was unclear because it had not been explained properly in the paper, rather than it had not been clearly defined in the study. This was often applicable where the clarity of the definition/description of the questionnaire terms (including the reference period over which symptoms were being asked about) was in doubt. An important issue was seen to be the terms of reference used in eliciting responses concerning symptoms with studies frequently constraining respondents to symptoms associated with computer work.
In summary therefore the following alternative criteria were applied to the evaluation of published papers:
Size: Exclusion of studies of fewer than 100 subjects.Study design: Prospective studies were given more notional ‘weight’ than cross-sectional
studies. Controls: Where appropriate, the use of genuinely asymptomatic controls was regarded
as preferable to using those with only minor symptoms. Variables: Clarity of description of variables (e.g. questionnaire wording) and wording
with a ‘neutral’ quality (e.g. symptoms at any time rather than symptoms during or after computer work) were seen as good attributes.
Because these criteria evolved during the review writing process they have not been formally documented for each paper. However, where a factor was seen to be of particular relevance it is noted in the text.
With the exception of two papers (published in 1987 and 1990 respectively), the rest were written between 1994 and 2006. Table 4.7 provides a breakdown of publication numbers per year.
12

Table 4.7 Number of papers by date of publication
Year Number of Papers Pre 1990 1 In 1987 (plus French paper in 1990) 1994 5 1995 3 1998 3 (including French paper) 1999 1 2000 3 2001 3 (including French paper) 2002 4 2003 6 2004 7 (including Korean paper) 2005 11 (including Japanese and Portuguese papers) 2006 1 Total 49* * Some papers covered more than one topic area
13

14

5 LITERATURE REVIEW: FINDINGS
5.1 GENERAL COMMENTS
The literature searches and preliminary evaluations covered three topic areas, reflecting those areas most commonly associated with computer work (HSE, 2003). These were musculoskeletal disorders; fatigue and stress; and visual disorders. Musculoskeletal disorders cover a very broad range of problems. For this reason this category was further subdivided for the purpose of reviewing the literature into three anatomical areas: lower back; neck, shoulder girdle and upper back; upper limbs. Whilst papers generally differentiate reasonably effectively between the upper and lower parts of the torso, the distinction between the neck/shoulder girdle and the upper limbs is less clear and somewhat arbitrary. In addition, symptoms in the upper limb might originate from nerve involvement at a higher level. Nevertheless there was considered to be some merit in attempting to distinguish between problems which focus primarily on the upper torso and those relating particularly to the more distal parts of the upper limb (e.g. elbows outwards).
The numbers of papers discussed in any one section do not necessarily tally with the numbers tabulated above. Papers often covered more than one topic and, when already identified, were not listed to avoid inadvertent duplication in obtaining copies. In addition, when reading the papers for the purposes of the review it was occasionally realised that they did not provide any detail of relevance. These have therefore been omitted from the text although they remain in the table shown in Appendix 2.
Not all of the studies reported findings differentiated by body location, referring instead to musculoskeletal symptoms or some similar synonym. Although potentially of less value in attempting to identify and understand causal mechanisms it was considered important not to exclude these papers which were therefore included as a fourth category.
In recent years, the review of the epidemiological literature on musculoskeletal disorders prepared by NIOSH (Bernard, 1997) has provided a de facto ‘gold standard’ for such reviews. However, although some of the studies reviewed included (or focussed specifically on) computer users, the emphasis of the review was on categories of risk factors (force, repetition, posture) rather than workplace specific descriptors. In addition, the majority of papers were related to industrial workers. Although this document was therefore highly influential in establishing inclusion criteria and the weight to be given to individual studies it was of little immediate value in establishing a baseline of knowledge from which to work.
Three further review articles were identified as part of the literature searches. These papers were evaluated first as providing a potential baseline of knowledge from which the present review could proceed. However, although identified by the search strategy as reviews, two of the three were not substantive reviews of the literature. The first (Ming et al, 2004) largely took a relationship between computer use and musculoskeletal disorders (specifically neck and shoulder pain) as an accepted fact, giving a broad overview of perceived causal factors and explanatory mechanisms. The second, (Buckle 2005) again presented an overview, this time a general introduction to ergonomics and musculoskeletal disorders. In this instance, it was not focussed specifically on computer-based work, although references to such work had been sufficient for it to be identified by the search.
In each of the following sections, papers are reported in chronological order, concluding with those published most recently.
15

5.2 PREVALENCE OR INCIDENCE OF MSDs
5.2.1 Previous reviews
The first and only substantive review paper identified was that by Tittiranonda et al, (1999). Most of the papers reviewed were published no later than 1995, the exceptions being the review by Bernard (1997) and a paper co-authored by one of the review authors described as ‘in press’ and eventually published in 1999. The authors outline a number of the key evaluative criteria as shortcomings in much of the literature. Thus, most studies are cross-sectional; based upon self-reported health measures; and utilise questionnaires to assess workplace factors. In subsequent text it is not always clear to what extent individual papers conformed to this normal pattern or where improved methods such as clinical examinations were utilised, although this can generally be deduced from the text.
The review is valuable, partly because of the historical perspective it provides (with articles dating from 1971 included in the reviewed studies) and partly because the authors have included reference to some less widely available documentation such as NIOSH workplace health hazard investigations. It is divided into two broad areas, firstly examining evidence for an increased risk of MSDs associated with keyboard (mainly computer) work and then considering documents relating to specific risk factors associated with the work.
Care must always be exercised in interpreting data presented second-hand. For example, the authors cite Ferguson (1971) as an early study of the use of electric keyboards. In reality the initial focus of this study was morse code telegraphy with many men affected by morse key use getting relief when this was phased out and replaced by keyboards. Additionally, workplace design issues were not systematically studied in this paper. One point of particular interest is that the incidence of cramp of the hand was much higher in one office and the authors suggested that this was more due to psychological than physical factors.
Despite these shortcomings the overwhelming majority of the studies reported demonstrated an elevated risk of musculoskeletal disorders associated with computer or keyboard use. The authors concluded that, after gender adjustment, the prevalences of hand and wrist symptoms and disorders were approximately 2-8 times higher than in low force, low repetition industrial jobs. Most of the studies reported were cross-sectional. The one prospective study however, found broadly similar findings with computer users being 2.6 times more likely than non computer users to develop hand and wrist symptoms. The authors of the source document apparently estimate that there was a potential underestimate of risk ratio by 40% for hand/wrist symptoms (20% for the back) suggesting that the actual risk ratio could be higher than that found.
Despite the general title referring to musculoskeletal disorders this review concentrated almost exclusively on the upper extremities and neck and no prevalences, incidences or odds ratios were reported relating to low back pain.
5.2.2 Reported prevalences or incidences
Estimates of the prevalence of musculoskeletal disorders vary widely. This might in part be done to differences in definition (e.g. some studies utilise clinical examinations whilst others rely solely on self-report) or even the manner in which questions are phrased. Most papers reporting on studies of MSDs amongst computer workers report the prevalence of symptoms amongst their study population whatever the primary focus of the study.
1. Yamamoto (1987) reported self-reported symptoms from a study of 5,097 workers. No response rate was reported so it is not possible to estimate likely reporting bias. No reference was made to any time frame for the reported symptoms (e.g. ‘in the last
16

year’). Instead it appears that respondents were asked about symptoms with respect to any perceived relationship with VDU work (during, after or VDU-free time). From this, the authors reported ‘transient’ complaints and ‘persistent’ complaints as complaints indices expressed as a percentage. For transient complaints the numerator was number reporting complaints during or just after VDU work only and the denominator was these plus those reporting complaints during VDU-work free time only. They did not present data in relation to those who did not report any symptoms at all. ‘Stiffness in shoulder’ had an index of 45% and ‘heaviness in hand’ an index of almost 31% with other MSDs featuring with lower percentages (e.g. ‘pain in back’ 16%). However, the manner of calculation and ambiguities with the descriptions (i.e. does VDU-work free time include leisure time?) make this study difficult to interpret.
2. Hales et al (1994) reported physical (clinical) examination data amongst 518 computer-using employees of a telecommunications company following a questionnaire survey of self-reported symptoms over the last year (93% response rate). Of these 111 (22%) had defined upper extremity disorders with prevalence’s in different jobs and work locations ranging from 0% to 48%. The authors comment that, compared to studies utilising self-reported symptoms alone, this rate was approximately half that reported elsewhere. Daily VDU use varied from 0-10 hours (Mean 7.3 +/- 1.0) but this was not apparently correlated with the prevalence of disorders.
3. Faucett and Rempel (1994) reported on 166 (150 usable) employees of a newspaper editorial department (a 56% response rate). Case definition was based on self-reported symptoms within the preceding week with an additional requirement that any reported symptoms improved on days off work. The most commonly reported musculoskeletal symptom was ‘pain’ reported by 88 (59%) of the sample. However, only 42 (28%) of individuals met the case definition criteria relating it to work patterns. Although initial reporting refers to pain ‘somewhere in the body’ later references concentrate on ‘upper extremity’ and ‘upper torso’ and it is not clear whether the initial questionnaire included lower torso or lower limbs. No data for these regions are reported. The risk of being an ‘Upper Torso’ case increased with greater daily VDU use (Odds Ratio (OR) = 1.43; probability (p) < 0.05) whilst Upper Extremity case status was associated with greater numbers of daily hours of VDU use (OR = 1.49; p = 0.01). However, the pre-requisite of relating symptoms to work makes these findings difficult to interpret with any reliability. It can be suggested that including those with more persistent symptoms would have increased the ‘noise’ resulting in a reduced Odds Ratio and/or an increased confidence interval around this.
4. Bernard et al (1994) also reported on a study of upper extremity musculoskeletal disorders amongst newspaper workers, this time including 973 employees (total participation rate 93%). Those with non-work related accidents or sudden injuries were excluded from case status. The case definition included only those who scored symptoms at or above the mid-point on a five-point ‘intensity’ scale. Of the total sample, 83.7% reported symptoms within the past year of whom 40.6% of the total met the case definition (including onset since they started their current job). Work factors were derived from direct observation of a random sample of 80 participants, with or without symptoms (40:40 split). The observer was blinded to case status. An interesting consequence of this was that the study showed self-reported estimates of time spent typing were about twice that observed. Importantly however, this over-estimation was consistent between cases and controls. Hours spent typing seemed to present an exposure-response relationship with increasing risk of case status with increased typing time. However it required more than six hours typing per day for this relationship to attain statistical significance (OR = 2.1; p < 0.05).
17

5. Bergquist et al (1995a) reported the results of a second cross-sectional study of MSDs amongst a group of 353 employees remaining from 535 in the original study. The general criterion for inclusion was any discomfort in the last 12 months. Intensive discomfort was more recent (seven days) and interference with work activities. The prevalence of discomfort (self-report) varied from 7.4% for ‘intensive’ neck/shoulder discomfort to 59.6% for less intense symptoms. Back discomfort was reported by 40.7% and arm/hand discomfort by 28.9%. Diagnosis of specific disorders by a physiotherapist reduced these prevalence’s by around two thirds in each case although no low back disorders were included. Analyses showed no significantly elevated odds ratios compared to non-VDU users, either for symptoms or diagnoses. When users were classified according to type of VDU work then an increased odds ratio was identified for neck/shoulder discomfort (but not ‘intense discomfort’) with 5-20 hours data entry a week. However, this effect was not sustained with >20 hours per week casting doubt over the reliability of this result.
6. Hochanadel (1995) reported the results of an intervention study which also documented the prevalence of symptoms amongst 3,326 computer users. It is not clear how many users were invited to participate although reference is made to nearly 20,000 employees operating some 15,000 PCs implying a response rate possibly as low as 16%. Great care should therefore be placed in interpreting the findings of self-reported symptoms ‘during or after using your computer’ amongst the 1,615 (49%) respondents. No time reference is indicated, the questionnaire focussing on the frequency of symptoms instead.
The most commonly reported symptoms were for the neck and the back. The data are only presented graphically and accurate values cannot therefore be determined. Estimates suggest approximately 30% reporting back symptoms with the majority reporting these ‘daily’. Those reporting interference with work were almost equally divided between those with no effect on work performance (44%) and those who reported that they were affected (46%). The fate of the remaining 10% is not known. A statistically significant relationship was identified between symptom occurrence and hours of use although no exposure-response curve was computed, apparently due to limited data. As the study was restricted to computer users there was no unexposed control group although those who reported 0-2 hours computer use a day could have been used as such. Of users in this category 21% reported symptoms. For 2-4 hours daily the equivalent was 50% and, for 4-8 hours, 68% reported symptoms, which is suggestive of an increased risk with increased usage.
7. Jensen et al (1998) reported a study of self-reported MSD symptoms amongst a group of 149 Computer Aided Design (CAD) operators reportedly using CAD for at least five hours per day (62% response rate). The highest 12-month prevalences were for neck pain (70%), low back pain (54%) and shoulder pain (54%). Over seven days the top three were shoulders (28%), neck (27%) and low back (20%). The focus of the study was the use of computer mice. For those who always used the same hand for mouse use the 12-month prevalences of symptoms from the hand/wrist, elbow and shoulder were 49%, 35% and 52% respectively whilst symptom prevalence’s for the other hand were 13%, 15% and 19%. Of subjects who only used their non-dominant hand, 44% reported symptoms on that side with 28% on the other side. The authors calculated that, if all those who did not respond were symptom-free, the most conservative prevalence estimates would be 32%, 25% and 43% for the hand/wrist, elbows and shoulder/neck respectively. The locus of shoulder/neck symptoms is ambiguous because the authors refer initially to shoulder problems but, later in the text, include neck as the third locus for symptoms.
18

8. Hanson et al (1999) reported on a two-phase UK-based study of symptoms of upper limb disorders amongst computer users. Although the overall study, including a secondary case-control element, was not published until 1999, the initial cross-sectional study of self-reported symptoms was conducted during 1992/1993. A total of 3,503 questionnaires were returned (79% response rate) drawn from eleven different organisations (some multi-site). Participants were asked to report signs and symptoms indicative of upper limb disorders ‘within the last three months’ or ‘before the last three months’. As a measure of perceived severity respondents were asked whether they had consulted a doctor, physiotherapist or other health professional about any of the symptoms reported. Reporting of symptoms was not connected to ‘during work’ or ‘when using your keyboard’. Overall, 55% reported symptoms of some nature. Across the entire sample, 6% only reported ‘old’ symptoms (i.e. before the last three months); 35% reported recent ‘mild’ symptoms (no advice sought); and 14% recent ‘severe’ symptoms where advice had been sought. Symptom reporting was on the basis of ‘clusters’ of symptoms, considered as being indicative of hypothetical syndromes. For example, ‘shoulder disorders’ required a positive response to both pain and restriction of movement in the shoulder. Of the total sample, 14.6% were classified with a potential shoulder disorder. The single symptom of pain in the forearm was reported by 10.8% whilst pain with swelling or an awareness of ‘crackling’ was reported by 2.4%. Symptoms in the hand indicative of nerve entrapment (numbness, tingling etc with weakness of grip and pain) were reported by 6.9%. Elbow pain, exacerbated by gripping was reported by 4.8% and triggering of a finger or thumb by 5.8%.
In the subsequent case-control study, involving examination of workplace factors by an ergonomist blinded to case-control status, 295 ‘cases’ (with a defined syndrome cluster) and 154 controls’ (no reported symptoms) took part. The participation rate in this phase was 49%. However, of those not participating the majority (48%) were no longer available, making the proportion of those actively refusing to take part much smaller and the effective response rate (excluding those not available) 65%. For those in any syndrome group, there was a significant influence in the final regression analysis model of self-reported hours spent keying by cases compared to controls (OR = 2.01 per 10 hours).
9. Demure et al (2000) report the findings from a study of 273 VDU users (91% response rate) working across seven buildings for one employer. Symptoms and work duration data were self-reported. Symptoms were reported according to their frequency, not over the time-period within which they occurred. Low back pain was reported at least ‘rarely’ by 82% of respondents with equivalent percentages for neck/shoulder pain and wrist/hand pain of 73% and 47%. In each case, interference with work at least ‘rarely’ was reported by 35%, 36% and 24% respectively. Analysis of those reporting at least occasional symptoms and difficulty working showed that for wrist/hand and neck/shoulder symptoms an exposure-response curve could be established with less than three hours per day as the baseline and further categories of 4-6 hours and seven or more hours daily. For wrist/hand pain the elevated odds ratios of 2.4 and 5.39 (4-6 hours and > 7 hours per day respectively) were both statistically significant in crude analyses. For neck/shoulder pain that for 4-6 hours a day (OR = 1.62) failed to attain significance although the odds ratio for seven or more hours daily use (OR = 4.69) was significant. For low back pain neither odds ratio was significant although the odds ratios showed an increasing trend and that for seven or more hours a day (OR = 2.16) narrowly missed significance (95% Confidence Interval of 0.98 – 4.81).
10. One study (Haufler et al, 2000) reported on the findings from a study of 124 female VDU workers. However, the subjects were recruited via a newspaper article on upper limb disorders and the study group represented only 46% of those who were originally sent a questionnaire having volunteered themselves to take part. These factors suggest
19

that the risks of response bias were very high. Presentation of the findings of symptoms is ambiguous. The authors utilised a modified NIOSH survey instrument relating to symptoms but also asked about diagnoses by a doctor. The time frame used is unclear. Reference is made to symptoms within the past year with further prerequisites of symptoms lasting for at least a week or occurring at least once a month. The results are described in the text as relating to disorders diagnosed by a physician or other health care provider but, in the table heading, as ‘symptoms’. The data show prevalences for hand/wrist, forearm, elbow, shoulder and neck of 37.1%, 17.7%, 18.4%, 16.9% and 8.1% respectively.
11. Ekman et al (2000) reported the results of a questionnaire survey of 2,044 Swedish men and women relating to musculoskeletal health (neck and upper limb). The sample was drawn from a group participating in a large scale survey on a variety of topics (not just musculoskeletal health) for which an overall response rate of 76% is quoted. The results should be interpreted with caution because of the way the study was structured. Firstly, only those respondents who indicated that they used computers at least half of the time were included. Secondly, the questions concerning musculoskeletal symptoms specifically asked ‘After work, do you experience pain in any of the following places?’. If this is interpreted strictly then it will obviously only identify those with current symptoms although there can be no certainty that those who have experienced symptoms in the past will not respond positively. Subject to these caveats, the results showed prevalences of any neck or upper limb pain of 16% for men and 36% for women, a prevalence ratio (PR) of 2.23.
12. Palmer et al (2001) reported the findings of a questionnaire survey of neck and arm symptoms amongst 1,798 keyboard users and 2,898 ‘others’ drawn from 34 general practices across Britain. The overall response rate was 58%. Classification as a keyboard user was on the basis of self-reported use for at least four hours in an average working day. It is not clear whether or not ‘others’ included those who worked at computers to a lesser extent. The authors reported symptom prevalences over the past seven days separately by gender and anatomical location. For male keyboard users, symptom prevalences for neck, shoulder, elbow, wrist/hand pain were 14.8%; 16.4%; 6.0%; and 10.6% respectively. For female users the equivalent values were 22.9%, 21.2%; 4.6%; and 15.1%. With the exception of elbow pain amongst females, (PR = 1.0) prevalence ratios with other employment were all in excess of 1.0 (range 1.1 – 1.4) although these excesses only attained statistical significance in respect of shoulder and wrist/hand pain for both men and women and also for neck pain in women. An additional symptom of numbness/tingling in the upper limb also had a slightly elevated but non-significant prevalence ratio. In each case, symptom reports related to the one week period prior to completing the questionnaire. This contrasts with others where a longer time span (e.g. 12 months) was used.
13. Nakazawa et al (2002) reported the findings from a major study of almost 30,000 workers on an annual basis (1995-1997). Using a self-report questionnaire for both symptoms and work factors they reported prevalences by gender for ‘arthralgia’ ‘stiff shoulders’ and ‘low back pain’ (these terms were not defined). However, the timescale over which these symptoms had been or were experienced are not indicated. For male VDU users, the prevalences for these three conditions were 13.89%, 21.16%, and 10.51% averaged across the three years with less than 1% variation on a year by year basis. For women the equivalent values were 26.03%, 39.95% and 16.00%. Although there was more variation on a year by year basis for women there were no apparent trends across time. The authors reported a significant trend for the prevalence of physical symptoms increasing with increasing daily VDU use despite the fact that two groups of anticipated heavy usage (CAD users and data entry staff) were not included.
20

14. Chiu et al (2002) reported on the findings of a survey of neck pain amongst university academic staff. All data were based on a self-administered questionnaire. Of a total of 780 questionnaires, 211 were returned, representing a response rate of 27.1%. From the 211, a further 16 were excluded on the grounds of incomplete information or pathological problems (e.g. traumatic neck surgery). A further 45 were excluded on the basis of having neck pain before joining the academic staff. This left 150, or 19.2% of the original sample for analysis. The one-year prevalence of neck pain was reported as 46.7% (70 subjects) although, adding those with pre-existing pain back in, increased this to 58.9% (115).
15. All of these studies have reported on cross-sectional studies where drawing inferences regarding causation is problematic (but not impossible). Even in studies such as the last one reported (Chiu et al, op cit) where onset since starting work was an inclusion criterion, the absence of any comparison group makes it difficult to assess any work contribution. Gerr et al (2002) reported on the findings of a prospective study of computer users where 632 new recruits into work involving >15 hours per week of computer use were followed for up to three years. The authors differentiated between neck and upper limb musculoskeletal symptoms (self-reported) and musculoskeletal disorders where those reporting symptoms were subjected to a standard physical examination. Amongst new-starts, 956 were considered eligible for the study (mainly excluded on the basis of anticipating less computer use than previously or expected computer usage less than 15 hours per week). Initially 789 (83%) agreed to participate although only 632 (66% of original sample) went on to complete the entry questionnaire. Of the 632 recruited to the study, 10% (63) reported neck/shoulder symptoms on entry. Of these, 84% (53) underwent a physical examination and 37 (5.9% of original sample) had a diagnosable disorder. The authors reported hand/arm symptoms separately, with 24 (3.8%) reporting initial symptoms and 14 (2.2%) having a diagnosable disorder. Those with symptoms were excluded from the follow-up as were those who failed to complete activity diaries. This left 538 neck/shoulder symptom free (554 disorder free) and 574 hand/arm symptom free (582 disorder free). The authors reported 1 month, 3 month, 6 month and 12 month incidence rates for neck/shoulder and hand/arm symptoms and disorders. These were:
1.9%, 2.8%, 3.6% and 4.1% (neck/shoulder symptoms);
1.5%, 2.1%, 2.8% and 3.2% (neck/shoulder disorders);
1.3%, 1.9%, 2.8% and 3.3% (hand/arm symptoms);
1.0%, 1.4%, 2.0% and 2.5% (hand/arm disorders);
The authors comment that the prevalence of symptoms on entry was lower than levels reported elsewhere. However, the timescale for symptoms is not indicated in the paper. Thus, it is not known whether symptoms asked about at entry related to current symptoms, ever having experienced symptoms, or some intermediate time-frame (e.g. the preceding month).
16. Ortiz-Hernandez et al (2003) reported the levels of MSDs amongst newspaper office workers. Of 298 employees asked to complete a questionnaire 218 did so, a response rate of 73%. Symptoms and computer usage were all determined from questionnaire responses (i.e. self-report). Respondees were sub-divided into computer users (more than 19 hours per week) and ‘non-users’ although these included the 42 who did not use a computer at all as well as 19 who used one for less than 19 hours per week. Prevalence ratios were reported for hand symptoms (PR = 2.45) upper extremity symptoms (PR = 1.37) and back symptoms (PR = 1.17). Only that for hands was
21

statistically significant. Actual prevalences were only reported for the non-user group although they can be estimated for the users from the prevalence ratios as being 43.9%; 48.9% and 58.5% respectively.
17. Korhonen et al (2003) reported the findings of a prospective study, specifically of neck pain, amongst office employees. For the baseline survey, 416 completed a questionnaire (a response rate of 81%). Of these 232 were classified as healthy (reporting neck pain for less than eight days during the preceding 12 months). Thus the prevalence of pain for more than eight days was 44% (184). A follow-up questionnaire 12 months later was completed by 180 (78%). All symptoms were self-reported. The incidence of local neck pain for eight days or more was 13.3% whilst, for radiating neck pain it was 14.4%. A total of 6.7% reported both symptoms yielding a total incident of 20%. A subdivision of self-reported computer working time (more than or less than 50% of the day) yielded no difference in crude odds ratio (OR = 1.0) although the confidence interval was positively skewed ( 95% Confidence Interval = 0.6 – 2.9).
18. A second prospective study of computer use, this time in relation to forearm pain was reported by Kryger et al (2003) in the first paper from the so-called NUDATA study. For this study 9,480 employees were invited to participate via the Danish Association of Professional Technicians. Of these 6,943 (73%) completed the self-administered questionnaire at baseline. Those reporting at least moderate pain in the forearm within the past seven days were offered a clinical examination. These with previous forearm surgery, pain due to traumatic injury or diagnosed clinical conditions such as arthritis or fibromyalgia were excluded. At baseline there were 296 ‘symptom cases’ (4.3%) with right forearm symptoms and 70 (1%) with left forearm symptoms. Of these, 21 were designated as clinical cases. Of the 6,943 initial responders, 5,658 (81%) completed a further questionnaire at follow-up.
At follow up, the one-year incidence of self-reported symptom cases was 67 (1.3%) in the right forearm and 20 (0.4%) in the left. Of the 67 only 27 had been completely symptom free prior to baseline. Self-reported keyboard and mouse usage was subdivided into a series of increasing usage. Both displayed elevated odds ratios (crude and adjusted for age and gender) at baseline. The data reported differentiates between ‘present’ cases (pain in the past seven days) and ‘chronic’ cases (pain for at least 30 days in the past year). Analyses of baseline data showed increasing odds ratios with increasing mouse and keyboard usage although these were not consistently statistically significant until mouse usage exceeded 15 hours a week and keyboard usage 20 hours weekly for present cases, although the cut off was lower for mouse use amongst chronic cases (5 hours or more a week). Adjusted odds ratios were not statistically significantly elevated for keyboard use amongst chronic cases. The results relating to new symptom cases at follow-up are a little unclear. The authors refer to an association with mouse use above 10 hours per week. However, no reference is made to statistical significance. In fact, the 95% confidence interval for the final model at 10-19 hours weekly usage was 1.0 – 4.7 suggesting that a value of unity cannot be entirely excluded although the authors appear to be implicitly accepting this as having some meaning, even if they do not overtly claim statistical significance. The absence of references to such significance is not specific to this issue as the authors seldom use this term in presenting their results. Depending upon the rounding convention adopted, a value of 1.0 could range from 0.95 – 1.05. It is possible therefore that the actual analysis did indicate statistical significance but that the more accurate Odds Ratio (1.01 – 1.05) was lost in rounding. Furthermore, the convention of adopting 5% as the boundary for statistical significance is purely arbitrary. It can be calculated that setting the boundary 1% higher (6%) would yield an Odds Ratio of 1.1 for a mean OR of 2.2 and a range of 1.0 – 4.7. On this basis, it would appear to be acceptable to regard an Odds Ratio with a lower range limit of 1.0 as significant.
22

19. A further prospective study of neck, hand/wrist symptoms was reported by Jensen (2003). A total of 5,033 computer users across 11 companies were invited to participate at baseline (the so-called BIT study). The response rate was 69% (3475). Of these, 3,471 provided a home address and were sent a follow-up questionnaire almost two years later. Just over 100 (108) letters were returned as undeliverable leading to an assumed 3,363 recipients of whom 2,576 (77%) responded.
At follow-up, 25.5% of women and 15.4% men who had reported no more than seven days of symptoms within the preceding year at baseline reported more than seven days neck symptoms at follow-up. For hand-wrist symptoms the equivalent incidences were 21.6% (women) and 12.5% (men). Duration of computer use or mouse use did not show any significant risk of developing neck symptoms. However, computer use for 75% or more of work time yielded a significant increase in odds of having hand-wrist symptoms (OR = 2.0). Curiously, mouse use displayed a bivariate distribution with use described as ‘seldom’ or ‘greater than 50%’ both yielding elevated odds ratios over a usage of 25%. Mouse use was studied in a subgroup of exclusively female workers (excluding the few males involved) who used a computer for all or almost all of their work time. The authors suggest that this bivariate pattern was because those who seldom used a mouse made extensive use of a keyboard instead. If this was a valid suggestion it would imply a possible protective effect of regularly swapping between mouse and keyboard in intensive computer users.
20. Another paper from the NUDATA study was reported by Andersen et al (2003). In this instance the focus was carpal tunnel syndrome. Survey details and response rates were as reported for Kryger et al (op cit). As before, clinical examinations were offered to symptom cases at baseline and at follow-up. The overall self-reported prevalence of tingling/numbness in the right hand at baseline was 10.9%. The interview confirmed the prevalence in the median nerve distribution of 4.8% of which about one third (prevalence 1.4%) reported symptoms at night. At follow-up new or worsened symptoms incidence was 5.5% although only 41 (1.2%) had symptoms in the median nerve distribution. Baseline symptoms were significantly associated with mouse use but not keyboard use. For ‘questionnaire cases’ there was a significantly elevated odds ratio above 10 hours use per week (odds ratio at least 1.8, increasing with increased use). For the clinical ‘median nerve’ cases the odds ratio was significantly elevated above 5 hours weekly use (odds ratio at least 2.2). For those with nocturnal symptoms however the odds ratio was only significant with more than 30 hours use in a week (odds ratio 4.0). At follow up, mouse use but not keyboard use again significantly elevated the risk of being a case. In this instance at least 20 hours weekly mouse use resulted in a significantly elevated odds ratio (2.6).
21. In 2004, Wahlström et al reported on a prospective study of neck pain among VDU users. A total of 1529 users from 46 different worksites were invited to participate by completing a self-report questionnaire. Of these 1283 did so yielding a response rate of 83.9%. Just over half (52%) were free from neck pain in the preceding month at baseline. From this baseline 671 formed the follow-up population who were sent a follow-up questionnaire at approximately monthly intervals for about ten months. Of these, it seems that there was a 100% response rate. Amongst these, 179 developed neck pains for the first time yielding an incidence rate of 36 new cases per 100 person-years. This was significantly associated with a high (self-report) level of perceived muscle tension but only displayed isolated significance in respect of (self-report) exposure to precise or frequent work.
22. Juul-Kristensen et al (2004) reported a further analysis of data from the BIT study reported by Jensen (op cit), this time focussing on shoulder, elbow and back symptoms. As before, all factors were determined through the self administered questionnaire. No
23

details are presented relating to baseline prevalences other than the fact that 20% of them had symptoms for more than seven days in four or more body regions. Of these who were defined as non-symptomatic at baseline (actually fewer than 8 days in the last 12 months), 18%, 10% and 23% showed an increase in the frequency of symptoms for the shoulder, elbow, and low back respectively at the time of the follow-up. Similarly, 20%, 14% and 22% had an increased intensity of symptoms. Using no more than 25% computer usage as a baseline, time spent working with a computer usually showed an increased risk of symptoms (both frequency and intensity). However, none of these increases attained statistical significance.
23. Further analyses of the NUDATA study population have been reported by Lassen et al (2004) and Brandt et al (2004). The first focussed on elbow and wrist/hand symptoms, the latter on neck and shoulder problems. As before, clinical examinations were used, differentiating between those with (self-reported) symptoms and those with diagnosed disorders. Lassen et al (2004) presented further analyses based on definitions of groups with ‘any pain or discomfort’ and ‘severe pain’. Severity was classified as pain or discomfort for more than 30 days (in the preceding 12 months) with the pain causing at least ‘quite a lot of trouble’ (the fifth of seven pain categories). At base line, any pain in the elbow was associated with mouse use, with the odds ratio increasing with duration of use above five hours usage per week. The odds ratio for 2.5-5.0 hours weekly use (1.37) narrowly failed to reach significance (CI = 0.99-1.89). Keyboard time was not significantly associated with elbow pain. Wrist/hand pain in the preceding 12 months yielded significantly elevated odds ratios above 2.5 hours of mouse use per week with the ratio increasing with more extensive use. Keyboard time failed to show any relationship except with weekly usage exceeding 20 hours (OR = 1.61; CI = 1.13-2.28).
Broadly similar findings were derived from an analysis of baseline ‘severe’ pain. Mouse use yielded a consistently elevated odds ratio for elbow pain with more than five hours of use a week. For severe wrist/hand pain the odds ratio with 5.0-10.0 hours mouse use per week was statistically significant as were those above 15 hours whilst that for 10-15 hours a week narrowly missed significance (0.98-2.67). Although some odds ratios above one were obtained in the analyses of keyboard use none of these attained significance for either elbow or wrist/hand severe pain.
Moving to the follow-up data, very similar patterns emerged. Mouse use was associated with elbow or wrist/hand pain above five hours use a week (with elevated odds ratios below that failing to attain statistical significance) and, despite generally elevated odds ratios, no significant relationships were found with keyboard use. Lastly, severe pain groups showed very similar results, although the increasing odds ratios with mouse use only attained statistical significance above 20 hours weekly use with either pain location. Some periods of weekly keyboard use showed significantly elevated risks (e.g. 10-15 hours use, OR = 2.49, CI = 1.08-6.53) although the failure of the highest usage (>20 hours) to attain significance casts doubt on the reliability of this relationship. Unlike previous papers from the NUDATA study, this paper appears to have selected those genuinely pain-free over the preceding 12 months for follow-up.
24. Turning to the neck and shoulder problems amongst the same sample (Brandt et al, 2004) yielded a broadly similar pattern of findings with few significant relationships with weekly keyboard use and a general indication of an exposure-response relationship with mouse use (again studying weekly usage). At baseline, neck symptoms showed a significant elevation in odds ratio above 25 hours whilst 15 hours or above was sufficient usage for shoulder symptoms. For diagnosed cases of tension neck a similar pattern emerged with increasing odds ratios attaining statistical significance above 25 hours mouse use. No significant relationship emerged for right
24

shoulder myalgia with relatively few diagnosed cases (35). Analysing data for the relative risk of becoming a new neck symptom case at follow up yielded only one model in which mouse use (greater than 30 hours) attained statistical significance. For new shoulder symptom cases, at least 30 hours use was consistently significant in all models with 20-29 hours emerging in three of the four. Only keyboard use in excess of 15 hours emerged as significant in any model. As with Lassen et al (2004), those selected for follow-up appear to have not reported any symptoms in that anatomical region in the 12 months preceding the baseline survey.
25. Another paper derived from the NUDATA cohort was that reported by Lassen et al (2005). The authors reported that 12% of the cohort reported being ‘troubled by’ elbow, forearm or wrist-hand pain in the preceding 12 months. Incidence data at follow-up is not available because the study focussed on those with pain at baseline rather than those without. However, one feature of this particular study was that a sub-sample of the study group (38%) provided objective data on mouse and keyboard use by installing a software package which logged selected actions. The study focussed particularly on those whose symptoms persisted through to the follow up. Amongst those with persistent (self-reported) pain there were no significant relationships with self-reported duration of mouse or keyboard use except that those classified as having persistent pain according to the most demanding criterion demonstrated an increased odds ratio of 1.37 for an effect due to ten hour mouse time per week as a continuous variable. However, this effect disappeared when the objective mouse time data were used.
26. Another BIT study paper is that by Juul-Kristensen and Jensen (2005). However, this paper presents a study of factors leading to an apparent decreased risk of symptoms accompanying odds ratios difficult to compare to the other studies and this paper will not be considered further here (although it is discussed in relation to the evidence for specific workplace risk factors).
27. A UK-based study was reported by Woods (2005) in which self-reported musculoskeletal symptoms were compared between those working in data processing (n = 175) and a control group (n = 129). The control group were engaged in manual sorting operations (sitting or standing) and did not use computer workstations. All data processors at work on the study day completed the questionnaire (71% of all employed). In contrast, 245 control workers were given the questionnaire but only 129 (53%) completed it. Twelve-month and seven day prevalences of musculoskeletal symptoms (pain/discomfort) are reported. They varied amongst data processors from 7% reporting symptoms in the right elbow and hips/thighs to 58% reporting neck symptoms over the last 12 months (the equivalent 7-day range was 2-27%). The equivalent ranges for the controls were 2-43% (12 months) and 1-23% (7 days) although, for this group, the low back rather than the neck was the main site for pain. Data processors were significantly more likely to report neck, lower and upper back, wrist/hand, shoulder and left elbow pain/discomfort than controls. Controls however were more likely to report ankle/feet pain.
28. Call centre operators in Brazil were the focus of a study by Rocha et al (2005). Of the 131 present at the time of the study, 108 completed the self-administered questionnaire. Of these, 43% reported neck/shoulder symptoms in the previous year and 37% symptoms in the wrists/hands. However, a further 28 were apparently absent from work at the time due to musculoskeletal disorders. Broad exposure factors were not documented (ergonomic factors are described and discussed in the following sections).
29. Nicholas et al (2005) report on a study of work related upper-extremity symptoms. However, the subject group was recruited from those who responded to a general
25

appeal (through local newspapers, posted fliers and word of mouth) for volunteers with or without symptoms. A total of 282 completed the initial survey and 169 (62%) completed the 3-month follow up. The manner of recruitment means that the study is of very limited value in determining general prevalence data. Subjects were also paid for completing each of the two surveys. Of the 169 at follow-up, 37 were reportedly symptom free. No change data from baseline to follow-up are reported. However, in a second paper from the same study, (Feuerstein et al, 2005) the authors report that those without symptoms at baseline (within the preceding 12 months) were likely to be involved with significantly less time (47.4%) working with a computer (although lap top work, reported separately, was higher in this group). The manner of recruitment of this study means that considerable care should be exercised in extrapolating these results or comparing them to other groups.
30. Hamilton et al (2005) reported on a study of neck and upper limb musculoskeletal complaints amongst female college students. Of the 111 invited to participate 72 completed the self-administered questionnaire, a response rate of 64.8%. Participants were recruited during several occupational therapy classes and at one surority and one dormitory meeting. It appears that the 111 represents the number of questionnaires actually distributed which might have been less than the number of students attending these various classes and meetings. There are therefore some doubts about the representative nature of this sample. Symptom questions specifically related the responses to ‘during or after working on a computer’ with no timescale indicated, thus inviting students to respond only in relation to any symptoms they associated with computer use. Despite this, 26.4% of the respondents reported no symptoms although, because of this phraseology, some of these might have had symptoms they did not associate with such use. It is perhaps not therefore surprising that hours of computer or laptop use did not show any relationship with the frequency of complaints. One item of passing interest is the very high proportion (90.9%) of laptop users reporting symptoms. However, examination of the data reveals that this is based upon 11 subjects (10/11) and, with such small numbers, should be treated with caution.
31. Finally, Rempel et al (2006) report the findings of an intervention study aimed at reducing incident musculoskeletal disorders amongst computer operators. Although details are not provided, the paper reports pre-intervention levels of ‘regional disorders’ (musculoskeletal disorders covering the upper limbs, neck and upper back) and low back pain averaging 65% and 43% respectively. Although the intervention element of the study included a physical examination this part was based solely on self-report. In addition, the regional disorders category included obviously traumatic injuries such as broken bones.
In general terms, although differences in survey design make accurate comparisons difficult, the literature suggests that the prevalences of various upper limb symptoms (mainly aches and pains over the last 12 months) amongst UK-based studies of computer users ranged from 65% - 86%. For neck and shoulder symptoms, no UK-based studies are available for comparison although values in the literature from other countries suggest prevalences of around 60% and 43% respectively. The only other UK-based study of back pain amongst computer users over the same time frame indicated a prevalence of back pain of 58%.
These findings are further summarised and discussed in sections 10.2 and 10.3 following the results of the current survey.
26

5.3 PREVALENCE AND INCIDENCE OF PSYCHOLOGICAL PROBLEMS (STRESS)
5.3.1 General
Psychological or psychosocial factors are increasingly being recognised as contributory factors (risk factors) associated with the development of work-related musculoskeletal disorders. However, the guidance to the Health and Safety (Display Screen Equipment) Regulations (HSE, 2003) also acknowledges ‘mental stress’ as a health effect of such work. This section examines the evidence for an effect of DSE work on mental stress. As such it has focussed specifically on the prevalence and incidence of stress associated with computer work, not on the general prevalence of stress-related illness amongst the working population.
5.3.2 Prevalence or incidence data
Remarkably few papers were identified which documented stress as an outcome measure rather than a potential causal factor of other problems amongst computer users.
1. Bergdahl et al (1994) reported on a survey of 103 people (81% response rate), 40% of whom, reported the symptom of ‘fatigue’; 30% concentration problems and 11% depression (symptom not a clinical diagnosis). The timescale over which they had or were experiencing these symptoms is not given although, from contextual information, it would appear to relate to current symptoms. In addition, as the survey was conducted amongst members of the ‘Association for those Injured by Electricity and Visual Display Units in northern Sweden’, the results should not be regarded as indicative of any form of population statistics.
2. In their major study of more than 25,000 workers with three surveys over a three-year period, Nakazawa et al (2002) included some stress-related variables. Prevalences were reported for ‘general fatigue’ (7.58%); disorder of initiating sleeping (5.72%); anxiety (4.36%) and depressive feeling (3.44%). (All values are mean of values presented for males and females in three consecutive years). No reference timeframe is indicated for symptoms although reported symptoms were classified into ‘not at all’, ‘occasionally’ and ‘always’. The survey covered office workers using VDUs but excluded those involved in CAD work, programming, R&D and data entry. As this appears to exclude all the most intensive users it might be expected that, if there was any relationship between stress and computer use, these values might be an underestimate of the true general prevalence. The authors compared mean scores for mental symptoms (adjusted for age, gender, etc) between those using VDUs for four ranges (<1 hour; 1-3hr; 3-5hr; >5 hour daily). A significantly higher score was obtained for those with more than five hours use compared to each of the other three categories. This effect was consistent across all three years of the study.
3. Roche and Debert-Ribeiro (2004) included factors relating to ‘nervous symptoms’ and other relevant descriptors in their study of systems analysts. Unfortunately however, although the study included a ‘comparison population’ no prevalence data are reported.
These findings allow very little to be concluded from the literature specifically related to computer users. They are discussed in the context of the broader literature on specific psychological problems in section 10.7, following the results of the current survey.
27

5.4 PREVALENCE AND INCIDENCE OF VISUAL HEALTH PROBLEMS
Visually mediated problems (visual fatigue) are often regarded as a consequence of working with computer screens although the guidance given (HSE, 2003) is that such use is not associated with permanent damage to eyes or eyesight.
1. Yamamoto (1987) reported the findings of a survey of 5,097 workers using VDUs (no response rate given). The author classified symptom reports into transient complaints and persistent complaints with no time frame indicated. Visual symptoms featured most highly in the transient complaints group with 14 different complaints. These fell to nine in the persistent complaints category where visual problems were second behind neuropsychological complaints. However, as uneven numbers of questions were presented for the different groups no particular significance should be attributed to this. Eye fatigue was ranked first amongst transient (T) complaints (60.36%) and second amongst persistent (P) complaints (51.34%). However, whilst the latter is calculated on the basis of those indicating a problem divided by all those responding, the transient complaints index was calculated as the percentage of those reporting symptoms at all of these who reported it during and/or just after VDU work.
Other visual symptoms featuring highly were pain in eye (30.78% T, 26.26% P); blurred vision (30.69% T, 29.08 P); difficulty in seeing (24.23% T, 26.77% P); twitch in eyelid (24.17% T, 25.75% P); and difficulties in far vision (17.03% T, 31.43% P). No others scored more than 25% in either category.
2. The study of members of the Association for Those Injured by Electricity and Visual Display Units in northern Sweden (Bergdahl et al, 1994) cited earlier, reported that 39% of respondents reported ‘various eye problems’ although no details as to the nature of these problems are provided. Other symptoms (e.g. headaches) which might be visually mediated are also reported but, in absence of any further detail it is difficult to apportion these to different types of headache.
3. Bergqvist and Knave (1994) reported on a study of eye discomfort and VDU work amongst 327 people (93% response rate) remaining in a longitudinal cohort study of office workers. An earlier paper (Bergqvist et al, 1992) cited in this paper had apparently shown that the cumulative incidence of eye discomfort increased with the extent of VDU work. In this latest paper, comparisons were made between VDU users and non-users for various types of visual symptom, further classifying VDU users into those using them for more or less than twenty hours in a week. No time frame for the symptoms is reported. Prevalences for various visual symptoms included:
(1) any discomfort – 70%; (2) smarting, gritty feeling, redness – 56% (3) sensitivity to light – 40%; (4) itching – 34% (5) moderate discomfort – 29% (6) teariness – 24% (7) dryness – 20% (8) aches – 15%
Computed models included the contribution from other individual and organisational factors. All the factors listed yielded odds ratios greater than 1.0 although only those for any discomfort (OR = 2.9); smarting, etc (OR = 2.0); and itching (OR = 3.7) attained statistical significance with 5-20 hours use. With the exception of itching, all of these yielded higher (significant) odds ratios with >20 hours use implying an exposure-response relationship.
4. The study cited previously by Faucett and Rempel (1994) reported on visual symptoms (although the main emphasis of the study was MSDs). They indicated that, out of 150 subjects (newsroom workers) 38% reported eyestrain and 27% headaches (not
28
necessarily visually mediated). In both cases the symptoms were reported as having been experienced within the last week.
5. Mocci et al (2001) reported on visual discomfort and VDU work amongst 212 bank workers selected from a larger group of 385. Selection was on the basis of no conjunctival alterations or refractive errors (visual deficiencies) and reasonably equivalent working environments and equipment. Of the sample, 31.9% were found to have asthenopia (visual discomfort) as determined from questionnaire responses. Questions specifically directed respondents to indicate only symptoms occurring during or soon after working time but did not apparently indicate any time frame. No correlation was found between asthenopia and either hours per day at a VDU or years of VDU work. However, given the selection process it is not known whether that somehow diminished the range of variables, thereby potentially reducing the ability of the study to identify relationships.
6. Nakazawa et al (2002), in their three year study of more than 25,000 VDU workers, found eyestrain to occur amongst approximately 38.28% males and 53.41% females (averaged across three years) with no time frame given. However, eyestrain was included with other physical symptoms in subsequent analyses and no relationships with VDU use were reported.
7. Tatemichi et al (2004) reported on a possible association between heavy computer users and glaucomatous visual field abnormalities identified in a cross-sectional study of 10,202 randomly selected Japanese workers (participation rate, 73.9%). This study differed from those others reported in this section as it focussed on objective abnormalities rather than subjective symptoms. Subjects were selected from four large institutions involved in the electronics and steel industries. Although not specifically stated it appears from the text that these were office workers. They were also predominantly (>90%) male. Computer usage was classified by years of use (<5 y; 5-10; 10-20; >20) and mean daily hours (<1; 1-4; 4-8; >20) and mean daily hours (<1; 1-4; 4-8; >8) assigning a number from 1-4 to these groups. Multiplying the two scores yielded a value from 1-16 for each subject which was then subdivided into light users (score 1-3) moderate users (4-8) and heavy users (9-16).
Preliminary screening used a form of perimetry to identify loss of visual field. These visual field abnormalities were identified in 5.5% of subjects (point prevalence). Subjects were also classified as having (or not having) refractive errors on the basis of whether or not they wore glasses or contact lenses. No distinction appears to have been made between different purposes (e.g. distance or reading) for these glasses. The authors identified an association whereby, amongst those with refractive errors, heavy computer users were significantly associated with an increased risk of visual field abnormalities (VFA) (OR = 1.74).
Those with VFA were offered an opthalmological examination and, of these, 60.3% (315) took part and 165 were diagnosed with glaucoma. Heavy computer use was significantly associated with glaucoma (OR = 1.82). One concern with the study is that only those with VFA were examined for glaucoma, it being assumed that all those without VFA did not have this condition. It is not known whether or not this is a valid assumption.
8. Finally, Woods (2005) reported on visual strain amongst intensive data processing workers (computer users) compared to a control group of manual workers (postal sorters). Despite the fact that this latter work also included a visual component, significantly higher prevalences of visual symptoms in the last year or last seven days were reported amongst the data processors. For the last year, these covered: tired eyes
29

(41%, OR = 2.6); headaches (30%, OR = 2.8); impaired visual performance (27%, OR = 3.0); and red or sore eyes (26%, OR = 2.5). For the last seven days the equivalent prevalences and odds ratios were: tired eyes, 26%, 2.4; headaches, 12%, 3.4; impaired visual performance, 15%, 7.7; red or sore eyes, 16%, 4.7.
The 12-month prevalence of headaches reported in UK-based studies of computer users ranges from 30% to 43%. This range is higher than that for non-users of 12% reported in one of the studies examined.
The 12-month prevalence of visual discomfort reported in UK-based studies of computer users ranges from 47% to 59%. This range is higher than that for non-users of 23% reported in one of the studies examined. However, studies from other countries yield a wider range of 38% (one week prevalence) to 72% (period not given). These findings are further summarised and discussed in relation to general population statistics in section 10.6, following the results of the current survey.
5.5 EVIDENCE ON CAUSAL FACTORS
5.5.1 General comments
Section 5.2 summarised data which suggests that there is a probable relationship between at least some musculoskeletal symptoms and computer work. It also suggested that work using a mouse presented a greater risk, with significantly increased odds ratios associated with shorter periods of use. This section examines the epidemiological evidence relating to exposure to specific work characteristics associated with computer work and identifies any clear evidence regarding this. The NIOSH review (Bernard, 1997) also included a review of supporting scientific literature which could be considered to provide evidence of ‘biological plausibility’ (possibly indicating a review of supporting a causal mechanism). However such evidence is beyond the scope of this review and, although it is known that some such material exists (e.g. that relating to the elevation of carpal tunnel pressure published by Rempel (1995)), this work will not be discussed further.
It can be anticipated that, where physical workplace factors are involved, those presenting a possible risk of injury to the hand and wrist are likely to be different to those affecting the neck or low back. In addition, hand/wrist and shoulder/neck appeared to be a segregation adopted by many of the papers in the literature. Consequently, these categories will be examined and reported separately below.
A number of papers did not differentiate between the sites of any musculoskeletal symptoms and these will again form a separate section of the review. As the purpose of the review was to assess the evidence for the contribution to symptoms of specific work factors, papers such as that by Jensen et al (1998), which reported exposures without carrying out any statistical analyses for possible associations with symptoms, have not been included.
5.5.2 Risk factors for general musculoskeletal symptoms
Publishes review articles
Interpretation of the reliability of the findings quoted is hindered by the absence of essential information such as the response rate in studies. In addition, workplace risk factors were not necessarily quantitatively compared. For example, Tittiranonda et al (1999) cite early work by Maeda et al (1980). It is stated that hand pain was significantly higher in accounting machine operators than in saleswomen. It is then stated that the mean table and keyboard heights were reported to be high for the accounting machine operators. Reference to the source text reveals
30
that the table and keyboard height were higher than cited ergonomics guidelines. However, no statistical comparison of these heights and the occurrence of symptoms was reported.
Many of the papers cited by Tittironda et al (1999) involved very small numbers of subjects, too small on which to base any significant conclusions. These references are not included in this summary. It should also be noted that the earlier studies cited involved typewriters rather than computer keyboard use and that early studies of computer keyboards would have involved markedly different display screen equipment to that in common usage now.
For brevity, the details of the source texts will not be repeated here although key elements in determining the reliance which can be placed on any findings are noted. On ‘non-neutral postures’ the authors conclude that all but one of the studies reviewed showed greater non-neutral postures such as ulnar deviation, wrist extension, shoulder adduction and flexion to be risk factors for MSD symptoms. The other main work elements reviewed were those of work organisation and psychosocial factors. The authors concluded that the studies reviewed provided some evidence that increasing work pressure and lack of job security or decision making opportunities may contribute to an increased occurrence of work-related MSDs. However, the authors acknowledge that, given the cross-sectional nature of all the studies, some at least of the psychosocial factors might have altered as a consequence of their symptoms and associated difficulties at work.
General musculoskeletal symptoms – original research
Addressing firstly those papers which did not make even a general differentiation between the anatomical locations of symptoms in identifying potential risk factors, six papers were selected from those identified during the screening process plus the previous IOM study (Hanson et al, 1999).
1. In the case-control element of the study by Hanson et al, almost 100 different variables were measured, some of which were self-reported (e.g. duration of keyboard usage and other information about the job); some observed (e.g. postures, equipment and furniture); some recorded using electrogoniometers; and some through questionnaires (e.g. psychosocial factors).
Appendix 1 to the current report summarises preliminary findings from analyses of individual variables for each of the syndrome groups. Preliminary regression analyses were conducted on groups of variables with those achieving modest significance (10%) being included in a subsequent overall analysis. Although these analyses differentiated between different ‘syndrome groups’ only the results for ‘any syndrome group’ will be reported here.
After adjusting for age (which had a significant influence in the final model) and gender (which did not), number of hours reportedly spent keying was the first to enter the model although it did not have the highest Odds Ratio. Factors entering the analysis and yielding a significant Odds Ratio included work equipment factors (e.g. reported problems with seating (OR = 2.09); typing whilst using a hand-held telephone (OR = 5.43); reported screen flicker (OR = 4.16) and problems with software (OR = 2.08). No psychosocial factors or goniometric variables (wrist angles) were significant in the final model. Some non-work factors (e.g. reported hours per week on potentially risky sports or hobbies OR = 1.50; and cigarette smoking, OR = 3.10) were also significant. As with some other studies, some apparently spurious results (e.g. having a footrest being a significant risk factor, OR = 2.26) emerged. The authors suggested that footrests had been issued to some of those with symptoms in an attempt to resolve symptoms rather than them being a causal factor.
31

When the different syndrome groups were analysed separately there were few consistent factors, although that could in part be explained in relation to the anatomical relationship between the disorder and the work factor. Thus high variability in wrist flexion-extension angle (quantified as the standard deviation) had a significant influence on wrist/hand tendon disorders (OR = 1.94) but not on shoulder symptoms.
2. Ekman et al (2000) reported on 2,044 subjects, being a subset of a larger survey (12,462) for which the response rate was 76%. Although the original questionnaire asked separately about symptoms in the upper back/neck, shoulders/arms, wrist/hands, these responses were pooled for the analysis of psychosocial work factors. Data were analysed separately for men and women. For women, the facility to learn and develop in their work; being involved in planning work; and getting support from superiors; were all significantly associated with a reduced risk of symptoms (ORs = 0.52, 0.60, 0.71). For men, only the facility to learn and develop in their job was significant (OR = 0.33) although the other two showed a similar trend to these for women. Unlike women, for whom it failed to attain statistical significance, age was strongly associated with symptoms (OR = 1.75 per 10 years). All symptoms and risk factors were identified by questionnaire.
3. Haufler et al (2000) reported that upper extremity pain (fingers to neck) during work was predicted by higher levels of job stress and what the authors described as ‘a tendency to continue to work with pain to ensure work quality’. However, this was only one of two questions forming the ‘work style’ variable the other being time worked before a break. The tabulated results also show a significant effect from work support factors but this is not stated in the text. These three factors plus work demands contribute to a model for ‘pain during work week’. However, as stated earlier, the manner of recruitment (newspaper article on symptoms) must cast doubt over the representativeness of the findings.
4. The study by Ortiz-Hernandez et al (2003) reported findings for MSD symptoms in the ‘back’ which actually included the neck, shoulders, back and wrist. Such pain was positively associated with self-reported ‘working in uncomfortable positions’ (PR = 1.61): neck rotation or inclination (PR = 1.55) trunk rotation (PR = 1.61) and excessive knee bending (PR = 1.52). One psychosocial parameter, ‘control’ had a significant protective effect (PR = 0.69). From the description given it appears that this was a complex scale including both skill development issues and decision-making capacity rather than relating specifically to the control of (or by) the individual.
5. Another study which, like that of Haufler et al, is of questionable value because of the manner in which participants were recruited was that of Hamilton et al (2005) amongst female university students. However, although data on decision latitude and job demands were collected no students were classified as having ‘job strain’ (according to the Karasek model, Karasek et al, 1985) and so no statistical comparison with musculoskeletal complaints was made.
6. Nicholas et al (2005) reported on a survey in which volunteers were recruited via local newspapers, fliers and word of mouth. Again therefore, the representative nature of this sample must be questioned. Amongst 169 responders to the second part of the survey, 37 were symptom free, 88 had ‘work-related’ symptoms and 44 ‘non-work related’ symptoms (i.e. injury). From these, ‘cases’ were defined as having symptoms in the last 12 months, the absence of any accident or injury not related to work (which might contribute to the symptoms), and symptoms beginning since starting their current job. It is assumed (but not explicit) that this was the group of 88. Compared to the symptom-free controls, case studies showed significant relationships with high ‘ergonomic risk exposure’ and high ‘total workstyle score’. However, the composite nature of these two
32

parameters means that it is impossible to identify any specific characteristics of work contributing to the apparent risk.
7. Finally in this section, Woods (2005) compared data processors to mail sorters. Compared to those without pain, data processors with pain in the last year were significantly more likely to be dissatisfied with their job; to report a lack of choice at work; to report insufficient time for their work; and to report a lack of help. Controls with pain in the last year were likely to report a lack of choice in what they did at work or how they did it; were unable to take breaks; had to work fast; and didn’t have enough time.
5.5.3 Risk factors for hand, forearm or elbow symptoms or disorders
Carpal Tunnel Syndrome
Two papers from the literature survey specifically studied carpal tunnel syndrome (CTS) as an outcome. Although some others (e.g. Hales et al, 1994) identified CTS cases in clinical examinations these cases were not subjected to a separate analysis of work factors.
1. Matias et al (1998) compared 45 female VDU operators with a medical diagnosis of CTS with 55 in similar jobs with no such diagnosis or symptoms. Job satisfaction was determined using the established Job Diagnostic Survey (Hackman and Oldham, 1975) and postures determined from video recordings. The main purpose was to devise a predictive model for having CTS. However, the authors comment that, amongst the most important discriminatory measures were three relating to working posture; trunk inclination; wrist extension and wrist ulnar deviation (other factors included task duration and upper extremity anthropometry). Both wrist extension and deviation showed an increasing probability of CTS with increasing angle. The relationship with trunk angle is curious and there is no obvious biomechanical pathway to account for this. The probability of CTS increased with decreased trunk angle. One plausible explanation (although not offered or explored by the authors) is that trunk angle is a surrogate for some other parameter. For example, older workers might have had more conventional training and be more likely to sit upright (age, which does not appear to have been used in the model, is usually correlated with CTS).
2. The relationships between extent of mouse and keyboard used and CTS symptoms or clinical status reported by Andersen et al (2003) have already been reported. The authors investigated a number of personal and workplace variables as potential risk factors. Although some showed marginally elevated odds ratios none of the physical work place characteristics were statistically significant. These included use of an armrest or wrist support; abnormal mouse or keyboard position; and chair or desk adjustment. The only significant factor was that those with symptoms or clinical CTS were significantly more likely to be dissatisfied with the design of their workplace.
Amongst psychosocial factors, high demands, low control and low social support were all significantly elevated amongst questionnaire cases (ORs = 1.3, 1.3, 1.2) and time pressure was significant (OR = 1.4) amongst those diagnosed with median nerve symptoms. However these patterns were not consistent and were not apparent amongst those with the most stringent diagnostic requirement of waking at night with symptoms. Abnormal mouse position (more than 40cm to the right of the shoulder or from the desk edge) is not necessarily correlated with the manner of mouse use which might have been more informative (and would have been consistent with the study of Matias et al).
33

Other hand, forearm or elbow symptoms or disorders
As stated earlier, many research studies have grouped musculoskeletal symptoms according to anatomical location. The primary division would seem to be to group ‘lower forelimbs’ symptoms (affecting the hands, wrist, forearm or elbow) and ‘upper arm’ symptoms (frequently not differentiating between shoulder and neck). In some instances, more detailed differentiation was provided and, where applicable, that is noted below.
Ideally, in reflecting the balance of evidence, account should also be taken of studies in which a particular factor was examined but failed to demonstrate any effect (as well as those where an effect was found). However, the extensive nature of many of the research programmes reported is such that, to list all parameters examined would be prohibitively lengthy. Therefore, for brevity, only significant findings are reported here as a matter of routine. However, in the interest of balance, notable negative findings are also recorded.
1. The study of telecommunications workers, reported by Hales et al (1994) is stronger than many because of the use of physical examinations to confirm case status (at least one positive physical finding was a pre-requisite). However, it was only a cross-sectional study and relied largely on self-report for exposure variables. The exception to this was that, for a subgroup of employers, objective information on keystrokes per day was available.
The study separately reported findings for hand-wrist cases and elbow cases (as well as neck and shoulder cases which will be described below) Case syndromes included both probable tendon-related and nerve-entrapment diagnoses. Data were initially analysed in five groups in order to exclude non-significant variables from further tests. Logistic modelling was then used with the remaining variables. For hand-wrist cases, the only significant entrants into the model were a self-reported diagnosis of a thyroid condition (OR = 3.9) and high information processing demands (OR = 2.3). Working as a Service Representative appeared to have a significant protective function as the Odds Ratio for this sub-category was 0.1. In interpreting these and other findings from this work it should be noted that work organisation (e.g. times per day getting up from a chair) but not workplace (e.g. position of mouse or keyboard) factors were studied. For elbow disorders, reported separately ‘surges in work load’ emerged as the only significant organisational factor (OR = 2.4), whilst two psychosocial factors (‘fear of being replaced by computers’ and ‘routine work lacking decision making opportunities’) were significant (ORs = 2.9 and 2.8 respectively). Being of non-white race (OR = 2.4) was also a significant factor.
2. Unlike this study, the cross-sectional study of newspaper workers reported by Bernard et al (1994) did include an objective (researcher) assessment of work place factors although this reduced the study size. Health outcomes were identified purely on the basis of self-reported symptoms. However the observations were limited to determining typing time more objectively (leading to the observation reported earlier that both cases and controls appeared to over-report hours typing to an equal extent). No physical work place factors were identified. Although the study also examined psychosocial factors such as working to deadlines and perceived lack of support, none of these attained statistical significance in the final logistic regression modelling for hand or wrist symptoms.
3. Faucett and Rempel (1994) used self-reported symptoms and objective observation of a representative sub sample of workplaces in their study of newspaper workers. However, although enhancing the strength of the study in this respect it did reduce the study population by approximately one half. Symptoms were reported for the category ‘upper extremity’ which apparently included just those relating to the hand and arm. In
34

a multiple regression analysis neither work posture factors nor psychosocial variables attained statistical significance. However, a number of curious interactions were identified between psychosocial factors and height of the keyboard relative to elbow height. Thus, employees who reported low decision latitude had more severe upper extremity numbness associated with a keyboard above elbow height. Job Insecurity also displayed a significant interaction with keyboard height although, as all those with low job security were symptom free, this could not be analysed further. Similarly, greater upper extremity numbness was associated with keyboards above elbow height for employees with low supervisor conflict or high supervisor support. These complex interactions were very small although significant and it seems difficult to account for them.
4. In the first of two papers published at the same time, Bergqvist et al (1995a) reported data for workplace factors compared to hand/arm symptoms (self-report) and diagnoses (clinical examination). Most of the significant findings relate to symptoms rather than diagnosed conditions. As with the work of Faucett and Rempel (op cit) many of the findings relate to interactive effects. The authors report an apparent exposure-response effect whereby those involved in data entry work (but not interactive work) showed a trend for lower relative keyboard height to be associated with a higher risk of hand-arm symptoms. However, the overall odds ratio of 2.8 narrowly failed to attain statistical significance. Those who did ‘combined’ work for at least 20 hours a week and had limited opportunities for breaks and did not use ‘lower arm support’ were significantly more likely to have clinical hand-arm diagnoses (OR = 4.6).
5. In a second paper on the same study population (Bergqvist et al, 1995b) further analyses are reported covering individual, organisational and ergonomic factors moving from univariate to multivariate analyses. Although the text reports a number of univariate associations no numerical data or statistical significances are reported. For hand-arm discomforts (self-reported) what is reported as ‘extreme peer contacts’ (either limited or extensive); extensive overtime; and hand in non-neutral position; all had significant effects in a multivariate analysis. (ORs = 2.1; 2.2 and 3.8 respectively). In a separate model, stomach-related stress reactions were also significant (OR = 3.8). When hand-arm diagnoses rather than symptoms were studied, woman with children; smoking; and extreme peer contacts; emerged as significant (ORs = 5.2, 4.7 and 4.5 respectively). Once again, stomach related stress reactions were significantly related to diagnosed case status (OR = 3.4). In a separate analysis, those who had limited opportunities for rest breaks and did not use lower arm support showed a highly elevated odds ratio of 10.1 compared to the other three groups in the analysis.
6. Demure et al (2000) reported on self-reported symptoms in relation to objectively assessed workstation assessments. Crude univariate analyses showed the odds of having at least occasional wrist/hand pain to be significantly elevated with female gender (OR = 2.19); feeling neutral to very dissatisfied with your job (OR = 2.08); never or infrequently taking breaks (OR = 2.03); having new, adjustable furniture (OR = 2.66); and a poor keyboard position (not in front of employee, not well-disposed forearms) (OR = 2.50). Curiously, having ‘moderate’ control over their work (but not ‘some’ or ‘little/none’) also had a significant effect (OR = 2.83).
In the first model, excluding ergonomic factors, only gender and job dissatisfaction emerged as significant (ORs = 1.94 and 1.94). When ergonomic factors were added in, these factors increased in Odds Ratios (2.98 and 2.10) and new, adjustable furniture and poor keyboard position (ORs = 2.77 and 2.79 respectively) were added. Other than labelling it as ‘curious’ the authors offered no real explanation for the emergence of ‘new, adjustable furniture’ as a significant factor. Pointing out that proper set up and adjustment of new furniture is not guaranteed the authors suggest that maladjusted
35

furniture might be worse than non-adjustable furniture. However, if ‘correct’ adjustment was a factor then it would be expected that this would have been reflected in variables such as poor seat height.
7. All the studies reported above were cross-sectional which therefore provide limited insight into differentiating between cause and effect. Jensen (2003) reported on a follow-up study of self-reported workplace factors at baseline compared to developing symptoms over the follow-up period of approximately 21 months. Results for men and women were reported separately. In initial univariate analyses, low influence at work was significantly related to having hand-wrist symptoms for both men and women (more highly significant for women) whilst high sensory demands (precise work) and repetitive tasks and movements were also significantly related for woman alone. In the subsequent logistic regression models, low influence at work emerged as significant with significantly elevated Odds Ratios for medium-low (OR = 2.3) and low (OR = 2.4) influence. Although the overall contribution of sensory demands remained significant none of the sub-groups Odds Ratios attained statistical significance. For men, influence at work again remained in the model although the results showed a curious pattern with the two intermediate levels of medium-high and medium-low having significantly elevated Odds Ratios (ORs = 2.2 and 2.5 respectively).
8. Newspaper workers appear to have been a particular focus in MSD studies. Ortiz-Hernandez et al (2003) also report on this work group, on this occasion from a Mexican population. Both symptom and workplace factors were determined by self-report. The authors report findings for hand symptoms alone as well as ‘upper extremity’ symptoms covering the fingers, hand, wrist, arms and elbows. In univariate analyses a number of work factors were significantly associated with hand symptoms. These were: reporting an uncomfortable position of some sort (OR = 2.45) as well as the specific postures of trunk rotation (OR = 1.45); bent or twisted hands (OR = 1.95); and excessive knee bending (OR = 1.53). The number of such postures reported also showed a significant effect with both 1-2 and 3 or more being significantly associated with symptoms compared to not reporting any such postures (ORs = 3.41 and 3.35). The nature of their work also showed some significant effects with those reporting data retrieval; data entry and retrieval and diagramming all showing elevated prevalences (ORs = 1.44; 1.51; and 1.58 respectively). It is noteworthy that text entry work did not feature in this.
A slightly different pattern of results was apparent when all upper extremity symptoms were included. Uncomfortable positions remained in the list (OR = 1.83) but, to trunk rotation (OR = 1.45); bent or twisted hands (OR = 1.84); and excessive knee bending (OR = 1.51) were added neck rotation or inclination (OR = 1.69) and upraised arms (OR = 1.59). None of the work types remained as significant. Finally, one psychosocial factor (social support) was also significantly elevated (OR = 1.86). This counter-intuitive finding is not remarked upon or discussed by the authors.
9. Kryger et al (2003) reported specifically on forearm pain amongst the NUDATA cohort of computer users. As with the study of Jensen (op cit), this study was a follow-up (prospective) study rather than cross-sectional. Work place factors were determined by questionnaire with symptoms (self-report) and clinical cases (examination) reported separately. Data are reported for the baseline cross-sectional study as well as the follow-up. This is informative as it potentially provides some insight into those relationships which persist from the cross-sectional study which might have causal influences. In the baseline data, not being satisfied with their workplace design was the strongest workplace factor associated with being a symptom case (OR = 2.0). Curiously, having arm support for the keyboard less than 50% of the time was significantly associated with being a case but not having such support, or using it for
36

more than 50% of the time was not. The psychosocial factor ‘experiencing time pressure’ was a significant factor (OR = 1.4). Personal characteristics of Type A behaviour (OR = 1.5); and female gender (OR = 2.2) were also significantly associated with case status.
The workplace, psychosocial and personal factors were all analysed as separate models (with exposure variables) before being merged into a final model in analysing the follow-up data. No physical factors were significantly elevated amongst new cases. Of the personal characteristics only age (1.4 increase in risk for 10 years) attained statistical significance. Merging these into the final combined model, the two psychosocial factors remained significant as did age. Unlike in the individual models female gender was also significant (OR = 2.2).
10. Juul-Kristensen et al (2004) reported on the prospective element of the BIT cohort. In this case, arm symptoms focussed on the elbow rather than the forearm, wrist or hand, using self-reported symptoms and workplace exposure factors. Three logistic models (work factors; ergonomic (workplace) factors; and psychosocial factors) were developed followed by a ‘full-fit’ model. Each model was also analysed separately for an increase in intensity or frequency of symptoms. This reflects the fact that the follow-up population was not necessarily symptom-free at baseline as those reporting fewer than 8 days symptoms or symptoms rated less than four (scale 0-9) were also included.
Having the screen below eye-height was a risk factor for increased frequency of symptoms (OR = 1.79) but not intensity. Paradoxically, having the need to work fast decreased the risk of more intense symptoms (OR = 0.68). The only significant psychosocial factor was cognitive demands, which significantly increased the risk of more frequent symptoms (OR = 1.02). At first sight, the fact that this marginally elevated Odds Ratio was significant seems surprising. However, the psychosocial data clearly had very small variances with confidence intervals for odds ratios usually spanning just ±0.01. These two factors persisted into the final model, with the low screen (OR = 1.85); and necessity to work fast (OR = 0.59) influencing the frequency and intensity of symptoms respectively.
Note that the necessity to work fast appeared to reduce the risk of more intense symptoms with an Odds Ratio significantly less than one. The text refers oddly to ‘a small necessity to work fast’ as a significant predictor for elbow symptoms rather than more overtly acknowledging this apparent abnormality. Despite an almost halving of the risk, this finding was commented upon or discussed further.
The largest contributor to both combinations was a previous history of symptoms, indicating that these were probably not usually new cases but that the study perhaps more accurately reflects exacerbation rather than causation.
11. Lassen et al (2004) reported on the follow-up element of the NUDATA study, examining those developing elbow and wrist/hand symptoms across a 12 month period. Participants underwent a standard clinical examination but workplace factors were determined by self-report. It appears that those examined as cases at follow-up were genuinely symptom-free at baseline, unlike the BIT cohort reported above or the NUDATA study reported by Kryger et al, (2003) and other papers.
Amongst those reporting elbow pain at follow-up, elevated Odds Ratios were apparent in respect of dissatisfaction with workplace design (OR = 1.63); high job demands (OR = 1.33); female gender (OR = 1.59); and age (OR = 1.35 for a 10 year increase). For wrist/hand pain, elevated odds ratios were obtained for usually (>50%) using a wrist support with a mouse (OR = 1.55); having an unadjusted work desk (OR = 1.30); and
37

female gender (OR = 1.32). In the logistic regression analysis of those with severe elbow pain, dissatisfaction with workplace design (OR = 1.92); age (1.33 per 10 years); low private support network (OR = 1.93); and, unsurprisingly, a current medical condition (OR = 2.14) were all significant. In the equivalent analysis for severe wrist/hand pain, significant associations were identified with: dissatisfaction with workplace design (OR = 1.67); female gender (OR = 1.70) and, again, current medical condition (OR = 1.94). The emergence of dissatisfaction with workplace arrangements as a factor in most analyses is difficult to interpret. It was stated as being intended to identify workplace factors not identified by specific questions. However, it could perhaps reflect a general lack of satisfaction with work in general (i.e. predominantly psychosocial) rather than indicating any specific physical attribute.
12. The following year, the same research group published findings related to persistent pain in the same NUDATA cohort. The data are difficult to interpret because the workplace factors analysed were those reported at baseline, although respondents were apparently asked whether they had changed any aspect of their work or their workplace in the intervening period. The authors state that 31% of respondents indicated that they had made some changes in their work as a result of their pain (most of which were changes to equipment or layout). It is stated that the effects of these were not statistically significant with respect to the prognosis of severe pain although no data or analysis is reported. (Lassen et al, 2005).
13. Rocha et al (2005) described self-reported symptoms and workplace factors in computer operations in a Brazilian call centre. Unlike other studies where some attempt was made to benchmark workplace factors (e.g. describing keyboard height relative to elbow height) respondents in this study were simply asked whether chair or table height was good, regular, bad or very bad. In a univariate analysis, female operators with wrist/hand symptoms were significantly more likely to consider their table height to be bad or very bad (OR = 4.64) and to consider the VDU screen visibility to be regular or good (OR = 2.54). Only 13 operators were male. The effect of perceived table height persisted in the final multivariate model for wrist/hand pain (OR = 4.64). No psychosocial factors (e.g. supervisor or co-worker support) were significant in either analysis.
14. A further prospective study was that by Hannan et al (2005) which focused specifically on psychosocial factors. The authors grouped the 337 participants into four job strain quadrants according to the model of Karasek (Karasek et al, 1985). However, there were no significant differences identified between these four sub-groups in relation to the development of arm/hand symptoms during the six month study period.
5.5.4 Risk factors for neck and shoulder symptoms and disorders
In this and subsequent sections, outline study details will not be repeated where the same paper also reported hand/arm symptoms.
1. Bernard et al (1994) reported neck and shoulder symptoms separately. In each case, two psychosocial factors were included in the final logistic regression models although they were different factors. Respondents reporting a perceived lack of participation in decision making or an increase in job pressure were significantly more likely to report shoulder symptoms (ORs = 1.6 and 1.5 respectively). For neck symptoms the significant factors were high work variance and a perceived lack of importance for ergonomics issues by management (ORs = 1.7 and 1.9). When the data were re-analysed to include only those from departments with comparable numbers of men and woman only the ergonomics issues for neck symptoms remained significant, although the other odds ratios remained elevated.
38
2. Faucett and Rempel (1994) reported data for the upper torso (neck, shoulders and upper back) documenting both physical and psychosocial factors in relation to both pain and stiffness. In multiple regression analyses, pain severity was significantly related to observed head rotation away from the midline and keyboard height above elbow height. There was also a significant interaction between keyboard height and both psychological workload and decision latitude. Using a different psychosocial scale, interactions were identified between co-worker support and keyboard height and between supervisor support and seat back height (relative to the 7th cervical vertebra). When stiffness rather than pain was used as the outcome measure the two physical factors remained significant. With the psychosocial interactions, an interaction between decision latitude and keyboard height was added to the first regression whilst that relating to supervisory support was no longer significant in the second.
In detail, more severe upper torso pain and stiffness were associated with a keyboard position higher than the elbow for employees reporting low decision latitude or high psychological workload. For employees with better supervisory relationships, greater symptom severity was related to higher relative keyboard height and lower relative seat back height. For employees with poorer supervisory relationships the reverse applied. (As the seat back height was measured from the top it is assumed that all employees had the same style of chair otherwise this measurement is meaningless).
3. In their cross-sectional study, Hales et al (1994) reported significant associations between a number of variables and shoulder or neck pain. For shoulder pain, fear of being replaced by computers and number of times arising from your chair yielded significantly elevated Odds Ratios (2.7 and 1.9). As the latter could be regarded as a surrogate for work breaks this latter finding is perhaps surprising. However, the authors do sound a note of caution, which would apply to many of the studies reviewed, which is that the large number of variables analysed increases the prospects of ‘chance’ significant effects.
For neck symptoms, the list of psychosocial factors with significantly elevated odds ratios was substantial. They were: routine work lacking decision making opportunities (OR = 4.2); lack of a productivity standard (OR = 3.5); fear of being replaced by computers (OR = 3.0); high information processing demands (OR = 3.0); jobs requiring a variety of tasks (OR = 2.9); and increasing work procedure (OR = 2.4). The latter term might be a typographical error as the text refers to increasing work pressure.
4. As with arm/hand symptoms, the significant findings of Bergqvist et al (1995a) were restricted to complex interactions. Thus, those who did data entry work and had limited opportunities for rest breaks were significantly more likely to report neck/shoulder discomfort (OR = 4.8). Similarly, those who worked at a computer for at least 20 hours per week and who reported often experiencing stress-related stomach reactions and also reported repetitive movements (repeated movements with risk of tiredness) were significantly more likely to report neck/shoulder symptoms (OR = 3.9).
5. For brevity, the results from the second paper from this group (Bergqvist et al, 1995b) will be restricted to the multiple regression analyses, omitting the univariate data. Eight different models were identified for five different outcome measures. Neck/shoulder discomfort yielded two models. In the first, limited opportunities for rest breaks (OR = 2.7); and too highly placed keyboard (OR = 3.1) were significant factors whilst stress-related stomach reactions (OR = 3.5) and negative affectivity (OR = 2.0) emerged as significant in the second. Curiously this second model also included age below 40, which seems counter-intuitive.
39

For intensive discomfort, only excessive stomach reactions were significant ( OR = 5.4) although a too highly placed VDT narrowly missed significance (OR = 7.4, 0.9 – 60.3). Three diagnosis (rather than symptom) based categories also yielded significant findings. Those with a diagnosis of tension neck syndrome had the same two factors as the discomfort outcome (rest breaks OR = 7.4; keyboard too high OR = 4.4). For cervical diagnoses no physical workplace factors were significant although stomach reactions (OR = 3.9) and tiredness reactions (OR = 1.9) emerged in a second model. For any shoulder diagnosis, rest breaks (OR = 3.3) and low task flexibility (OR = 3.2) were significant in one model and, in a final model, stomach reactions (OR = 4.8) were again a significant factor.
6. As with their findings for wrist/hand pain, the study of Demure et al (2000) identified a curious relationship between control over work and neck/shoulder pain. In this instance both ‘moderate’ and ‘some’ control were significantly associated with case status (ORs = 2.48 and 3.62 respectively) whilst ‘complete’ was used as the benchmark and ‘little/none’ markedly failed to attain significance with a much lower Odds Ratio. Apart from this, the crude (univariate) analyses identified never/infrequent breaks (OR = 1.84); poor posture (undefined) (OR = 2.21); inadequate computer table size (OR = 2.03); and three or more poor workstation characteristics (OR = 2.71) as statistically significant. Possibly reflecting the last variable, the investigating ergonomist (who was blinded to case status apparently) was significantly more likely to recommend major workstation interventions to those reporting symptoms (OR = 2.43). Two predictive models were developed, one excluding ergonomics (physical) factors. In the first (non-ergonomics) model, only ‘some’ control over work remained significant (OR = 3.18). In the second, as well as this factor (OR = 3.17), ‘moderate’ control again attained significance (OR = 2.71) and never or only having infrequent breaks (OR = 1.91) was a further significant factor. None of the physical workplace factors attained significance (although they may have made a significant contribution to the model).
7. The follow-up study element of the BIT study (Jensen 2003) reported neck symptoms separately from hand/wrist symptoms. A low level of influence at work showed a significant association with neck symptoms in women (p < 0.001) but not men. Similarly, high sensory demands were a significant factor, again just for women (p = 0.049). None of the other psychosocial factors studied were significant in this crude, univariate analysis. In a logistic regression however, screen height relative to eye level emerged as a significant risk factor (OR = 1.5 for screen above eye height), and influence at work appeared to display a exposure-response relationship with progressively reducing influence having a gradually increasing Odds Ratio (1.4-2.2). For men, (for whom no workplace factors were significant in the crude analyses), computer skills apparently made a significant contribution to the model. However, perhaps contrary to what might be expected, the main effect appeared to be that having ‘less than good’ computer skills had a protective influence on neck symptoms (OR = 0.4).
8. Korhonen et al (2003) reported on a prospective study specifically of neck pain, studying a group of 416 workers at baseline and the ‘healthy’ cohort at follow-up 12 months later (at which point 180 of the 232 responded). In crude analyses, a measure of less than 3 in ratings of the physical work environment (on a scale of 1-5) (OR = 2.0) was the only significantly elevated Odds Ratio amongst all physical and psychosocial factors. In logistic regression modelling, the first model (adjusted for age and time used for VDU work) yielded the single workplace factor of the keyboard less than 15cm from the edge of the table (OR = 2.1). However, as body position relative to the table is not given, the significance this is unclear. In a second model, including interactions, this factor was no longer significant although the main environment rating
40

was (OR = 2.4) and those who reported at least ‘some’ mental stress and low levels of physical exercise were 6.7 times more likely to report neck pain.
9. Brandt et al (2004) also reported on a prospective study, this time of neck and shoulder symptoms and disorders (symptoms determined by questionnaire, cases by physical examination). Workplace factors were determined by questionnaire. Although 5,658 returned the follow-up questionnaire after one year there were too few clinically confirmed incident cases for the inclusion in any analysis with only 26 new cases (from 109 examined at follow-up out of 141 invited). Analyses of incident symptom cases (new cases), was based upon the 162 out of 5658 returning the second questionnaire. At baseline, univariate analyses showed neck symptoms to be associated with use of arm support for the keyboard less than 50% of the time (OR = 1.3); their chair not adjusted (OR = 1.6); not satisfied with the design of the workplace (OR =1.6); high psychosocial work place demands (OR =1.4): time pressure (OR = 1.2): and negative affectivity (OR = 1.4). Of these, only the workplace dissatisfaction remained significant for the select group with a diagnosis of tension neck (OR = 2.3). This same factor (OR = 1.9), together with high psychosocial demands (OR = 1.5), were significantly associated with having shoulder symptoms. None of these physical or psychosocial factors were significantly associated with the small group (N = 35) diagnosed with right shoulder myalgia.
Turning to new symptoms, four models incorporating physical, psychosocial, personal and combined factors were developed. None of the physical factors displayed a significantly modified odds ratio. Of the psychosocial factors, high workplace demands yielded a significant influence (OR = 1.7). No relevant factors were apparent in the personal factors category with neither age nor gender (which frequently do show significance) having a significant influence on relative risk. In the final combined model, high demands continued to demonstrate a significant influence (OR = 1.7) but no other workplace or psychosocial factors resulted in a significantly elevated risk of becoming a new symptom neck case.
In a similar sequence of analyses of shoulder data, no physical workplace factors significantly elevated the risk of developing symptoms. In this instance, low control (rather than high demands) was the main psychosocial factor (OR = 1.9) and this persisted in the final combined model (OR = 1.9).
10. In the element of the BIT prospective study reported by Juul-Kristensen et al (2005) the authors reported risk factors for symptoms becoming more frequent or more intense. The intensity (but not the frequency) of symptoms was significantly increased amongst these reporting glare or reflections (OR = 1.51) and a factor called ‘pauses, small influence’ (OR = 1.54) in the ergonomic model. In the psychosocial model, the risk of more frequent symptoms was significantly increased by sensory demands (OR = 1.01). In the full fit (combined) model, the risk of more frequent symptoms was significantly influenced by the ‘pauses, small influence’ factor (OR = 1.87) whilst more intense symptoms were significantly increased again by glare and reflections (OR = 1.55). For brevity, only those factors resulting in a significantly elevated odds ratio are reported here although a number of others made a significant contribution to the regression models.
11. Wahlström et al (2004) reported the findings of a prospective cohort study of neck pain among VDU users. A baseline questionnaire was completed by 1,283 respondents (84% response rate) of whom 671 (52%) were free from neck pain at baseline (self-report). Of these, 179 (26.7%) developed pain during the follow-up period (median 10.9 months). Perceived muscular tension, job strain and physical exposure was determined by questionnaire at baseline. Those reporting high muscular tension were
41

at a significantly elevated risk of subsequently developing neck pain in three separate models for men, woman and mixed as well as a total model stratified for gender (ORs = 1.9, 1.9, 1.9 and 1.6 respectively). Median and high job strain emerged as significant in the mixed gender model (ORs = 1.5 and 1.6) but only median strain remained as significant in the adjusted model (OR = 1.5). Medium physical exposure (reporting high to only one of precision or repetitive work) featured in the mixed gender model (OR = 1.4) but no physical exposure factors significantly increased the risk of pain in any of the other models.
12. In the call centre study of Rocha et al (2005) none of the explanatory variables resulted in a significantly elevated odds ratio although one, ‘tense during the past week’ narrowly failed (OR = 2.45, 0.99 – 6.07). However, in a final regression model, two factors: only one to two daily rest breaks (OR = 3.17) and bad thermal comfort (OR = 3.06) resulted in a significant elevation of risk of neck/shoulder symptoms. These figures are ‘adjusted’ although the text does not appear to explain what they were adjusted for.
13. Finally, the prospective study of Hannan et al (2005) examined neck-shoulder as well as hand-arm symptoms. In an age-adjusted model, those exposed to high strain (according to the Karasek model, Karasek et al, 1985) were at an increased risk of neck-shoulder symptoms (OR = 1.88) although this effect failed to maintain statistical significance in the full multivariate model. An interaction was identified between job-strain quadrant and hours spent keying. Hours keying were divided into those keying for more than 5.25 hours per day and those up to that duration. Those in the high strain quadrant were at an increased risk whichever keying time category they were in (≤5.25h - OR = 2.38; >5.25h - OR = 2.74). Those who were in the low strain quadrant but spent more than 5.25 hours a day keying were also at an increased risk (OR = 2.38). There were no significantly elevated risks to those in the active and passive quadrants.
The authors also utilised an alternative analytical approach to the job strain data in which job demand score was divided by the decision latitude score yielding a continuous ratio. This ratio was divided into four ‘categories’ (presumably quartiles but not apparently explained). When these categories were analysed with those having spent more than four years (or less) keying at least 15 hours per week, those in the highest category with no more than four years prior experience showed significantly elevated risk (OR = 3.16) with a positive trend with increasing strain ratio category. No such trend was apparent amongst those with more experience.
5.5.5 Risk factors for back symptoms
Although there is a widely held belief that prolonged sitting can have an adverse effort on the low back only two papers were identified which specifically addressed symptoms in this anatomical region amongst computer users. These were the cross-sectional study of Demure et al (2000) (with self-report symptoms but researcher determined workplace characteristics) and the prospective study of Juul-Kristensen et al (2005 in which all data was self-reported.
1. In the initial univariate analysis of the Demure et al study, no psychosocial or physical workplace factors demonstrated a significant increase in risk and, in subsequent multivariate modelling, none of these factors made a significant contribution to the model although there were signs of an effect of hours usage per day with an increasing risk with time which narrowly failed to reach significance at the highest level (≥ 7 hours per day).
2. Turning to the prospective (BIT) study of Juul-Kristensen et al, the only factor to result in a significantly elevated risk ratio was, perhaps predictably, a history of previous
42

symptoms, which contributed to both the frequency and intensity of symptoms in the full regression models (ORs = 2.40 and 1.40).
5.5.6 Risk factors for stress and related disorders
Although there is a very large body of literature concerning possible causal factors related to stress at work no papers were identified which specifically addressed any causal relationship between computer work and stress.
5.5.7 Risk factors for visual problems
Three papers reporting vision-related problems were identified.
1. In a French language paper, Rechichi and Scullica (1990) reported the findings of a survey of 28,591 VDU operators working for an Italian telecommunications company, (10,281 female, 18,310 male). The paper does not appear to report a response rate for the study. All subjects completed a short questionnaire regarding ten visual symptoms and four workplace VDU characteristics (flicker; and the ability to alter the brightness of characters and the height and angle of the screen). Any subject reporting at least two visual symptoms was classified as ‘asthenopeic’. Computer usage was characterised into four blocks: less than 20% of the time; 20-50% of the time; 50-80% of the time; and more than 80% of the time across a week. There was a significant difference in usage between males and females with most men reporting less than 20% use and most women more than 80%. As a result, data for men and women were reported separately. No overall prevalence values are given and no association between symptoms and computer usage reported. A significantly greater proportion of subjects of both sexes classified as having asthenopia reported flicker on their computer screen (p<0.001). Amongst females, those reporting flicker were 1.6 times more likely to be classed as having asthenopia whilst, for men, the equivalent value was 1.8 times. There was no difference in the proportion of those with asthenopia amongst those reporting that they could or could not adjust the brightness of their screens. However, it should be noted that only very small proportions (less than 4%) reportedly could not do so. An inability to alter the height or angle of the VDU screen was associated with significant increase in the incident of asthenopia. Amongst both men and women the increased proportions were 1.2 and 1.1 respectively.
2. Bergqvist and Knave, (1994) reported on a long-term study of office workers. From an initial group of 535 (91% participation) 353 remained after six years. Of those who had ‘dropped out’ it appears that most (possibly all) had left their jobs for some reason. Of these, 150 (82%) were questioned and one indicated that eye discomfort had influenced their decision to leave. Of the remaining 353, 327 (93%) completed a questionnaire and, of the 260 computer users within this group, a workplace inspection was conducted for 228 (88%) although one measure (relative humidity) was only obtained for 203 (78%). The paper reports a second cross-sectional study with no prospective element reported. Using non-computer users as a comparator, those reporting such use were divided into two categories (5-20 hours per week; >20 hours per week). The usage-related results have been reported earlier. In modelling of ‘any discomfort’, reported ‘stomach stress’ showed an increasing trend with Odds Ratios of 2.5 (seldom) and 4.9 (often). Company type also showed significantly elevated risks (newspaper production OR = 2.6; postal office OR = 3.8; insurance company OR = 3.1) when compared to travel agency work. Curiously, ‘moderate’ work pace showed an elevated risk (OR = 2.4) although this did not persist amongst those classified as having a ‘high’ work pace.
43

With ‘moderate discomfort’ the effects due to stomach stress remained (ORs 2.2 (seldom) and 4.2 (often)). In this instance ‘high’ work pace (but not medium) had a significant effect on risk (OR = 2.2). The influence of stomach stress persisted with ‘smarting, gritty feeling, redness’ (OR = 1.7 (seldom) and 2.6 (often)) but no other significant factors. For these reporting ‘itching’ only ‘often experiencing stomach stress’ remained significant (OR = 2.8) will use of monofocal VDT glasses also suggesting an elevated risk (OR = 2.3), presumably as a result of the symptoms rather than a cause. This factor was the only one associated with a significantly elevated risk of ‘aches’ (OR = 2.1). Sensitivity to light again showed an influence with stomach stress (seldom, OR = 1.9: often, OR = 2.5).
Those reporting often experiencing stomach stress were also significantly more likely to experience ‘teariness’ (OR = 3.3) and dryness (OR = 3.8). Those wearing monofocal or other glasses were also significantly more likely to experience eye dryness (ORs = 2.3 and 11.6 respectively).
When ergonomic factors were added to the model there were no significantly elevated risks associated with either eye aches or teariness. Effects associated with stomach stress remained for three of the six discomfort categories (any, moderate and sensitivity to light) although, in the latter case, the effect was only significant in those also reporting often suffering from stomach stress. Ergonomic influences were sporadic. An eye-VDT distance of less than 60cm was associated with a significantly elevated risk of moderate discomfort (OR =2.5). Those working for an insurance company were at an elevated risk of itching eyes (OR = 2.4) and an eye-keyboard distance of less than 54cm was associated with an increased risk of the same symptom (OR = 1.9). The vertical position of the VDT (centre of screen at 0-20º below eye level compared to lower down) was associated with an increasing risk of reporting sensitivity to light (OR = 1.9).
Increased risks of reporting eye dryness were associated with the use of VDT glasses (monofocal OR = 3.4; other, OR = 12.3); a low (<30%) relative humidity (OR = 2.5); a maximum difference in eye objective distances greater than 10cm (OR = 2.8); and the presence of specular glare (OR = 3.3).
A few interactions were also identified with work characteristics and ergonomics factors for isolated symptoms although not all of those reported were statistically significant. Thus, those who worked at a computer (VDT) for more than 20 hours a week and had their screen in a high vertical location were significantly more likely to report any discomfort (OR = 5.2). Those who used monofocal glasses; had eye-object differences greater than 10cm and were aged 40 or more were more likely to report eye dryness (OR = 4.9). There was also an interaction between age (50 years or older); stomach stress reactions; and working for more than 20 hours per week at a computer who reported more teariness (OR = 9.0) when compared to younger (less than 40) users with stomach stress but less than 20 hours work a week.
3. In 2001, Mocci et al reported on a study of psychological factors and visual fatigue amongst 212 subjects with no clinical visual disorders working in a similar environment (ostensibly to remove any influences of such factors although presumably individual differences in workplace layout remained). Comparisons with other studies are difficult because the results are primarily reported as correlation coefficients. Asthenopia (visual discomfort) was significantly correlated with group conflict (p = 0.01); low co-worker support (p = 0.01); under use of skills (p = 0.05); mental workload (p = 0.01); low self esteem (p = 0.01); low work satisfaction (p = 0.01); role conflict (p = 0.01); and role ambiguity (p = 0.05) although the coefficients were all relatively modest (<0.32). Despite screening for comparability of environments,
44

disturbance by noise (p = 0.01) and (presumably cigarette) smoke (p = 0.01) were also correlated with asthenopia which was also correlated with age (p = 0.01); gender (p = 0.01) and total environmental discomfort score (p = 0.01). In a final hierarchical regression, environmental discomfort, psychological variables and an interaction between group conflict and co-worker support made a significant contribution although the entire model only explained 30% of the variability in asthenopia (adjusted R² = 0.30).
In summary, the published literature does not allow any clear assessments of which specific aspects of computer work or workstation design (including psychosocial factors) result in the observed relationship between computer work and MSD symptoms, visual problems or stress-related disorders. Although many papers report a wide variety of work and workplace factors, often showing statistically significant relationships with symptoms, these findings are rarely duplicated across studies. This is often more due to differences in study design and the parameters assessed in any one study rather than any failure of one study to replicate earlier findings. These findings are further summarised and discussed in sections 10.3 to 10.7 following the results of the current survey.
45

46

6 LITERATURE SURVEY: DISCUSSION
6.1 GENERAL COMMENTS
This section provides an initial discussion of the context of the literature review findings and issues about their interpretation. Note that section 10 contains discussion of the detailed findings of the review of the literature, alongside a discussion of the results from the survey conducted as part of the present study.
The information and data presented in section 5 is of importance in two respects. Firstly, establishing the prevalence and incidence of ill-health amongst computer users is an important factor in determining the magnitude of the problem as a drain on resources both for the employers and for the providers of palliative care. Whilst causation is of importance here, it is of secondary importance to issues such as reducing pain and suffering, absence from work and, in long-term sufferers, reducing the loss of valuable resources (employees). The second issue, that of establishing likely causation, is of importance in understanding and preventing occurrence (aside from any issues regarding ‘blame’ or compensation).
One of the difficulties with MSDs, stress and probably visual problems is that they are undoubtedly multifactorial. For example, carpal tunnel syndrome (CTS) is strongly associated with gender and there appears to be little doubt that it can occur in some females as a consequence of major hormonal changes such as the menopause or a hysterectomy. It might therefore be nothing whatsoever to do with work. However, carpal tunnel syndrome is a prescribed disease for work with vibrating handheld tools and the Industrial Injuries Advisory Council has recently advised extending this to work involving frequent palmar flexion and dorsiflexion of the hand at the wrist (IIAC, 2006) so, although the evidence for a causal relationship with computer work is not strong, there is little doubt that it can also be caused by certain other work activities. Differentiating between the two in a female who qualifies for non-work risk factors but who is also in a ‘qualifying job’ is undoubtedly very difficult. Even in computer work, the established increase in carpal tunnel pressure with typing and mouse use will probably be sufficient to evoke symptoms in a person with incipient CTS, reinforcing their belief that work has caused their disorder.
Theoretically at least, it is possible to describe a continuum starting with work provoking symptoms of an underlying, non work-related disorder; progressing through work aggravating (but not causing) the underlying disorder; to the disorder actually being caused by work. As far as the individual is concerned the distinctions are, to some extent, irrelevant. All they know is that, when they do their work they experience symptoms and, perhaps because they unconsciously protect the affected part out of work, these symptoms initially subside when not working. To the employer it is also initially perhaps immaterial because the first issue is to prevent the symptoms from occurring at work. It is perhaps the issue of litigation which brings these distinctions into focus.
To the epidemiologist the distinction is a very difficult one to make and yet it will clearly contribute to the ‘noise’ surrounding any genuine effect, increasing error bands and confidence intervals in doing so.
A further issue is that musculoskeletal discomfort (and certainly symptoms of some disorders such as back pain) can be provoked not by bad postures or activities but by a lack of activity. To a certain extent the musculoskeletal system of the human body is designed for movement and lack of movement can provoke discomfort. Whilst such discomfort will tend to be more marked in adverse postures, even conventionally ‘good’ postures will involve some muscle loading and, unless such loading is at very low levels, fatigue-related symptoms will begin to be experienced. Where such fatigue is overlain onto a pre-existing injury (e.g a lumbar muscle strain), then symptoms of that strain might well be evoked. From this, it can be
47

hypothesised that some musculoskeletal discomfort associated with work at a computer arises not from some deficiency in the posture adopted (which might be what is conventionally thought of as ‘good’) but from the fact that a posture is sustained for relatively long periods with little or no interruption. Again, a detailed exploration of this hypothesis and any evidence which might exist for or against it is beyond the scope of this document. Nevertheless, it is a consideration and could explain apparently inconsistent findings in what does or doesn’t give rise to symptoms associated with computer work.
This review has focussed on epidemiological studies of work-relatedness and has not examined the wealth of medical and scientific literature which might provide different insights into causation. In some instances, the distinction appears to be becoming lost between identifying what makes a particular individual more susceptible than another to injury (such as having a narrow carpal tunnel) and the tendency to somehow regard that enhanced susceptibility as the cause. One good example of this is the tendency to attribute back pain to genetic influences. Other examples can be drawn from the field of work-related stress. An individual can be under enormous pressure at work and yet feel (and be) able to cope. He (or she) has a stable home life which supports him in that. Then, some non-work issue arises which impacts on the individual and carries over into his work by making him feel that he is no longer in control, no longer able to cope. As a result his health and well-being deteriorate – he is suffering from stress. What has caused his stress?
Although a discussion of these areas is beyond the scope of this review they are worth noting because they provide further factors (long or short-term variations in individual susceptibility) which makes it difficult to distinguish genuine causal influences from the background noise.
6.2 PROBLEMS IN COMPARING STUDIES
There were considerable differences between the various published studies which could explain at least some of the differences in the results obtained and which make comparisons between studies (or any type of meta-analysis) problematic.
The last 20 or so years have seen immense changes, not only in the availability and usage of computers but in the physical characteristics of the systems involved. Inevitably therefore studies carried out at different points in time will be influenced by these changes. At the outset, computer terminals were primarily replacements for typewriters, with ‘word processing centres’ replacing the typing pool. Tasks such as text or data entry were largely placed in the hands of specialists, usually with keyboard training. However, as computers became more readily available so they gradually began to find their way onto the desks of others, to such an extent that dedicated ‘copy typists’ are a relative rarity in many offices today and experience suggests that many users have never had any formal training in using this hardware. Thus, the type of worker exposed and the type of work carried out has progressively changed and these changes will inevitably have had some influence on workplace risks.
In parallel with changes in who uses computers (and specifically keyboards) have been the changes in technology and design. The fact that European Directive 90/270/EEC (EC, 1990) considered it necessary to require keyboards to be separate from the screen and makes no reference to input devices such as mice provides an indication of how far systems have developed. A study carried out in a technologically forward thinking organisation would be carried out in a completely different working environment to others from more ‘backward’ employers and studies a few years apart could actually be evaluating radically different workplaces. Add to this any geographic or cultural differences in how computer technology was ‘rolled out’ and used and already the potential mix of variables is considerable.
48

Turning to individual studies there are, first of all, differences between the type of population sampled from. These include individuals drawn from GP practice lists, volunteers attracted through newspaper advertisements, numerous workplace based studies, people recruited through membership of trades unions, and students. Within the workplace groups are university academic staff, blue-collar workers, newspaper workers, etc. Clearly there might well be differences between waged employees required to work at a computer and university or college students with varying levels of motivation and application.
Once the broad population has been defined then further diversity can arise through those selected from the initial population to be approached. Thus, in different studies, user groups such as CAD operators (who might be expected to have particularly idiosyncratic work characteristics) were either specifically studied or excluded from study groups. In some instances, rather than defining potential recruits by the type of work, a minimum level of ‘exposure’ was required, excluding all those who used a computer for less than a certain amount – except that the amount varied between studies. Where any minimum was set this could vary from five to fifteen hours per week.
All this before any consideration of what data was collected and how it could be determined. Obvious differences relate to subjective (self-report) symptoms and clinical examinations. However, even within these broad categories, further differences arise. For example, respondents might be asked about any experience of symptoms – or restricted to those they associate with periods of computer work. Similarly, exposure data could be self-reported or independently assessed, with software registration of keystrokes or mouse clicks providing highly detailed objective quantification. Some studies simply asked subjective questions (e.g. was a keyboard ‘well-positioned’) whilst others attempted to introduce an objective element by, for example, asking participants to measure various distances themselves. However interpretations of good and bad ergonomics differed between studies. For example, keyboard placement was ‘bad’ if it was closer than 15 cm to edge of desk or, in another study, ‘bad’ if it was greater than 40 cm from the edge of the desk. Others sent assessors in to give an overall rating of the workstation set up which may be more valid as many workplace factors interact. However, this depended on all the assessors identifying the same parameters and scoring them exactly the same way for each respondent seen. It was not always apparent from the papers whether the investigators worked to a standard pro-forma or not.
Exposure time was frequently recorded but again, was this time sitting at the computer workstation, or time actually using a mouse or keyboard? Some papers specifically refer to the time spent physically using a mouse or keyboard whilst, in other cases, the instructions given to respondents in completing their response are not explained.
With more recent papers, an increasing proportion considered the potential role of psychosocial factors. As with physical factors however, how these were described or defined varied widely adding yet another potential source of variation.
Finally, once all the data has been collected, how is it analysed and compared? Any attempts at comparing different groups introduce further issues. Very few utilised ‘non-exposed’ controls – and even if they were not exposed to computer use there was no assurance that they were not exposed to other MSD risks. More often they would be best considered as ‘less exposed’ – at least to computer work.
In essence therefore, differences in reported levels of MSD problems (usually symptoms) between studies should not be assumed to reflect differences between the populations studied and attributed to relative exposures until all other potential factors have at least been considered and their potential effect taken into account.
49

6.3 MSD SYMPTOMS OR DISORDERS?
A regularly expressed concern regarding the epidemiological literature on MSDs is that outcome measures are often purely subjective, focussing on self-reported symptoms with no objective evaluation of health status. This is undoubtedly true for most of the papers reported here. A few however have reported on clinical examinations, although the prevalence of clinically diagnosed cases was seldom sufficient to allow any formal statistical analysis. Nevertheless the findings do inform the debate and discussion over this issue. This does not include papers such as that by Matias et al (1998) where a clinical diagnosis of CTS was a pre-requisite for inclusion in the study.
The only paper to specifically study individuals with diagnosed disorders was that of Hales et al (1994). Amongst their cohort of 533 computer users, 22% were found to have a diagnosable disorder. Unfortunately, although preliminary symptom data were apparently collected by questionnaire, no comparison is presented between those reporting symptoms and the proportion of those having a diagnosable disorder. This paper also raises a further issue, namely the diagnostic criteria applied. Without going into extensive detail it appears that the criteria applied were less stringent than those recommended in the UK by Harrington et al (1998). For example, diagnoses of de Quervain’s disease required a positive Finkelstein’s test but not the presence of localised swelling.
This might account, at least in part, for the relatively high incidence reported for this group. Amongst the specific diagnoses, the most common was ‘distal tendonitis’, which was diagnosed in 8%. Interestingly, thoracic outlet syndrome, which Harrington et al (1998) did not present surveillance criteria for, on the basis of its rarity in the UK, was found in only two subjects
Chronologically, the next study was that of Gerr et al (2002). This paper raises another general issue in that, in this instance, the clinical examiner was not blinded to questionnaire responses. Even where this does not happen there is a degree of ‘non-blinding’, in that usually only those who have reported symptoms will be offered a clinical examination.
In the Gerr et al paper, which was a prospective study, only 10% of subjects reported neck shoulder symptoms on entry into the study with 3.8% reporting hand/arm symptoms. In each case, almost 60% of those with symptoms had a diagnosable disorder. On follow-up (excluding those with pre-existing disorders but not symptoms), 36% now reported symptoms and again, almost 60% had a diagnosable disorder.
The study of Andersen et al (2003), specifically on CTS, provides an interesting comparison. Self-reported tingling/numbness was reported by 10.9%. Of these, just under one half (4.8% of the total) were found on clinical examination to have this symptom in the median nerve distribution and apparently one third of these (1.4% of total) indicated that the symptoms woke them at night (which would classify them as CTS according to Harrington et al). This can be compared to the finding of Hales et al (1994) of 0.8% CTS, and Gerr et al (2002) of 0.5% CTS at the outset of their studies, values which are well within the ranges cited in population-based studies (see Table 10.1).
The NUDATA series of paper provides further insight into the relationships between symptoms and clinical disorders. In each case, clinical examinations were offered to those reporting at least moderate pain in the body part in question during the preceding seven days. Starting with the neck and shoulder (Brandt et al, 2004), 36% reported some neck pain at baseline and, in 10.6% of the total, this pain was at least ‘moderate’. One hundred cases (1.4% of original sample) of tension neck syndrome were diagnosed. For shoulder pain (right only), 21.5% reported symptoms, 7.6% were in at least moderate pain and there were 35 diagnoses of myalgia (0.5%) and 10 of rotator cuff syndrome (0.15%). At follow up, amongst
50

those with no or mild symptoms at baseline, 1.5% now had at least mild neck symptoms and there were ten new cases of tension neck syndrome (0.20%). For the shoulder, 1.9% new symptom cases yielded 12 diagnoses of myalgia (0.25%) and four of rotator cuff (less than 0.1%).
For the forearm (Kryger et al, 2003) an exact figure for any symptoms is not given although, from the text, it can be estimated that around 10% had more than mild symptoms. In the initial cohort, 4.3% reported at least moderate pain in the forearm. Amongst this subgroup, 5% had clinical signs of lateral epicondylitis and 1% signs of de Quervain’s disease (about 15 cases with epicondylitis and 3 with de Quervain’s). Only 0.2% had either supinator syndrome or pronator teres syndrome. At follow-up 1.3% now had at least moderate pain and six had a diagnosable disorder (0.1% of those initially reporting no or only mild symptoms).
These results are not consistent with other data from the same cohort reported by Lassen et al (2004) who reported higher prevalences. At baseline, 27.5% reported any elbow pain which yielded 29 cases of lateral epicondylitis (2 medial epicondylitis) and nine cases of de Quervain’s disease (1.5% and 0.5%).
Generalisations across studies are difficult and it is difficult to reconcile the relatively high values from Hales and co-workers (1994) with the more modest proportions reported since. (It is possible that this reflects a downturn in problems over the intervening period of time although this is purely conjectural).
Actual proportions clearly vary between studies. However, in very broad terms it would seem that, although prevalences in individual studies vary from 0.5% - 22%, a more typical estimate is that fewer than 2% of DSE users will have a clinically diagnosable disorder.
51

52

7 QUESTIONNAIRE SURVEY: METHODS
7.1 CONSTRUCTING A SAMPLE
In order to establish the prevalence and incidence of DSE-related ill health it was necessary to construct a sample which would allow the extrapolation of the data obtained to the general UK population. Whole working population samples, such as that to be surveyed by the Workplace Health and Safety Survey (WHASS) (BMRB, 2006), provide the most direct method of generating such a sample. However, such a sample by definition includes many who are not office workers or DSE users and is therefore relatively inefficient in addressing specific work issues of this nature. For example, Palmer et al (2001) identified 1,871 regular users of keyboards from a questionnaire mailed to 21,201 individuals (12,262 respondents). Increasingly specific sampling of groups within this population provide for more efficient targeting of the research questions but with a progressive reduction in the extent to which results can be generalised to the whole workforce.
As a result, our sampling strategy used a targeted approach, but also included data from a wide range of industry sectors.
Target study population The target population from which the study sample was selected was the population of office workers within the UK. This included all sizes of organisations, from a single office worker in a small vehicle repair shop, to large offices in insurance organisations and telephone call centres. Both regular DSE Users and other office workers with less day-to-day exposure to DSE were included in the study sample. This strategy allowed the comparison of levels of reported ill health across the range of levels of DSE use.
Selection of organisations The first stage in the sample selection process involved obtaining a random selection of organisations which could potentially be included in the study. A key objective of the study was to investigate whether levels of DSE-related ill health varied between employment sectors or job types. Levels of DSE-related ill health may also vary between organisations of different sizes, with larger organisations assumed to be more likely to have in place formal DSE assessment policies and to have easier access to the equipment necessary for well designed work-stations. A sampling scheme was employed which was stratified by company size and sector. Proportionally more small organisations were included in the selection as there were expected to be fewer office workers per organisation in this category.
The results of the 2001 Census were used to determine which industrial (SIC) sectors were most likely to employ significant numbers of office workers, using the numbers of workers in ‘Administrative and Secretarial’ occupations as a guide. Although this under-estimated the total number of office workers in each sector, it was a reasonable indicator of the relative numbers of office workers across the industry sectors. Table 7.1 summarises this information, and shows the total number of administrative workers in each sector, expressed as a percentage of the total number of workers per sector, and as a percentage of all administrative workers.
53

Table 7.1 Distribution of administrative and secretarial workers by SIC
No of admin and % of total number % of all admin and SIC secretarial workers of workers in this secretarial workers
SIC Agriculture 12,999 3.9 0.4 Mining & Quarrying 27,362 12.7 0.9 Manufacturing 288,458 8.7 9.6 Construction 104,620 6.9 3.5 Wholesale, retail 328,955 8.7 10.9 Hotels & Restaurants 48,629 4.6 1.6 Transport 198,946 12.5 6.6 Financial/Intermediation 395,273 36.7 13.2 Real estate, Business 556,975 18.8 18.5 Public Administration 413,938 32.6 13.8 Education 149,991 8.6 5.0 Health 328,163 13.7 10.9 Other 150,412 12.9 5.0
The largest concentrations of administrative workers can be found in the financial intermediation, real estate/business and public administration sectors therefore more organisations from these sectors were included in the survey. This is consistent with the HSE study of fatalities and injuries in local authority enforced ‘office-based industries’ which focused on the financial intermediation sector and two subcategories (Computer-related activities and Other business activities) of the real estate/business sector. All other SIC sectors were included in the study, with the exception of Agriculture, Mining and Hotel sectors where there are proportionally very few administrative workers, representing less than 3% of such workers in the UK.
Although regional differences are not a central focus of the current study, the sample selected was examined to ensure that there was reasonable coverage across the main geographic areas of the UK. The selected sample was also examined to ensure that types of organisations (e.g. banks, insurance companies, civil service), where large numbers of DSE users are normally employed, were included. At that stage any selected organisations which did not employ office workers were excluded. Detailed records were kept of the sampling strategy used, and any subsequent amendments.
Business databases Participating organisations were selected from a standard UK database of public and private organisations (Dun and Bradstreet).
Selection of individuals within organisations The main unit of analysis was the individual office worker within the selected organisations. In small and medium organisations, it was hoped that all office workers employed would complete the questionnaire with a random sample of workers completing the questionnaire in large organisations.
Sample size
It was initially proposed that the survey target would be around 3,000 completed surveys from office workers, of whom it was estimated that in the region of 60% (2,000 workers) would liable to be DSE Users, as defined by the HSE.
Data on numbers of organisations and employment by size group, published in 2001 suggested that, on average, small organisations (<50 employees) comprise of 5 workers, medium organisations (50 to 249 employees) comprise of 100 employees and large
54

organisations (250+ employees) comprise of 1300 employees. Based on the information from the Census 2001, it was estimated that, on average, around 40% of these employees would be office workers and, as above, that around 60% of the office workers would be DSE Users.
Using this information, the sampling strategy summarised in Table 7.2 was formulated.
Table 7.2 Planned sampling strategy
Organisation size Small Medium Large Total
(A) Average workers per organization 5 100 1300 (B) Of whom office workers (40% of A) 2 40 520 (C) (D)
No of organisations surveyed No of office workers surveyed (B*C)
1000 2000
28 1120
12 30001
1040 6120
(E) Assumed response rate 40% 60% 60% (F) No of office workers responding (D*E) 800 672 1800 3272 (G) No of DSE users responding (40% of F) 480 403 1080 1963 1For large organisations it was assumed there would be an average of 250 office workers surveyed to allow for less than 100% sampling in these workplaces.
It was envisaged that 1000 small, 28 medium and 12 large organisations would be recruited for the study with estimated response rates of 40% among employees in small organisations and 60% among workers in medium and large organisations. This was thought to be a conservative estimate given that response rates as high as 80% had been achieved in previous similar surveys. In addition it was assumed that, on average, 250 office workers would be surveyed within each large organisation.
It was intended that the 1040 participating organisations would be evenly distributed across the four industry sectors – Financial Intermediation, Real estate/Business, Public Administration and ‘Others’ (Table 7.3).
A large enough sample was extracted from the selected database to ensure that the target number of companies could be recruited in the medium and large size categories, and to allow for missing or inaccurate contact details among the small companies. Tables 7.3 and 7.4 show the distribution of the proposed sample.
Table 7.3 Target number of companies to be included by industry sector and size
Industry sector Small Medium Large Total Financial Intermediation 250 7 3 260 Real Estate, Business Activities 250 7 3 260 Public administration, defence Other1
250 250
7 7
3 3
260 260
Total 1000 28 12 1040 1All other sectors, with the exclusion of agriculture, mining and hotels
55

Table 7.4 Estimated number of respondents by industry sector and size
Industry sector Small Medium Large Total Financial Intermediation 200 168 450 818 Real Estate, Business Activities 200 168 450 818 Public administration, defence Other1
200 200
168 168
450 450
818 818
Total 800 672 1800 3272 1All other sectors, with the exclusion of agriculture, mining and hotel
7.2 SURVEY INSTRUMENTS
Numerous questionnaires have been published at various times in relation to ill-health in the workplace, particularly in relation to MSDs. Given the remit to cover other significant forms of ill-health (specifically stress and visual discomfort) a composite instrument was required.
For the previous IOM research, an Upper Limb Symptoms Questionnaire was devised, and used after pilot administrations. It was based upon recognised symptoms for various clinically defined disorders such as carpal tunnel syndrome and tenosynovitis. Thus, it specifically addressed symptoms such as numbness or tingling in the fingers and swelling as well as pain. Post hoc analysis of reported symptoms amongst those who reported a clinical diagnosis indicated reasonable (70%) agreement with tentative diagnoses on the basis of the symptoms. This allowed subsequent separate analysis of risk factors for different putative ‘conditions’.
The existence of a database of approximately 3500 questionnaires from keyboard users approximately 10-12 years ago also offered the possibility of providing the basis for a subsidiary analysis of the impact of the DSE Regulations, which was a valuable argument for using this questionnaire.
The IOM questionnaire was supplemented by questions regarding other MSDs, particularly back and neck problems, as well as those regarding other significant health problems.
The Nordic Questionnaire (Kuorinka et al, 1987) has been widely used in studies in the UK and elsewhere. As such it allows the prospect of making comparisons of the prevalence and/or incidence of MSDs between DSE users and other occupational groups. It also has the merit of covering other forms of MSD. However, one negative aspect is that it provides less detail relating to ULDs. Whilst this is possibly less important in relation to establishing the prevalence of problems it may be of significance in any examination of possible risk factors. It is clear from studies of causal mechanisms and previous epidemiological investigations that disorders such as carpal tunnel syndrome and tenosynovitis have different aetiologies.
The general questions of the Nordic questionnaire do not allow the differentiation between such conditions. Whilst some relatively gross over-arching exposure variables (such as time spent using a keyboard) are likely to prove to be a common factor the previous IOM research showed that different syndrome groups displayed different patterns of explanatory variables.
On balance, the prospect of utilising previous survey data to carry out a subsidiary longitudinal comparison of the incidence of symptoms since the early days of the DSE Regulations favoured using the IOM questionnaire. The questionnaire therefore contained many of the same questions from the original questionnaire.
Dealing with other forms of MSD (particularly back pain) again presented a number of options. Although the IOM does have survey instruments that have been used, for example in a previous comparative study of coalminers and office workers (Agius et al, 1988), in this
56

instance it was felt that the opportunities for comparisons with other populations, provided by the use of the NORDIC questionnaire, presented the best option. Therefore, a selected element of this questionnaire was used to examine the incidence and prevalence of back pain. Questions on other relevant symptoms such as leg pain were also included to allow the possibility of tentative categorisation into simple mechanical back pain and other possibly more serious syndromes.
In addition to other forms of MSD, questions were required to determine the prevalence and incidence of stress-related illness and of visually mediated problems. As with MSDs, a number of potentially suitable questionnaires are available which address the issue of stress-related illness. It was important however to differentiate between those survey instruments which are intended to identify the presence of possible causal factors in the workplace (such as the HSE’s own Management Standards) and those aimed at identifying possibly stress-related ill-health. The IOM and others have used the General Health Questionnaire (GHQ-12) to measure psychological distress in a given user population, to enable benchmarking with other studies on mental health and wellbeing at work. The 12 item General Health Questionnaire (GHQ-12) is a self-report tool that can be used to screen for the presence and severity of psychological distress (Goldberg and Williams, 2001). Goldberg and Williams (2001) suggest that a high level of psychological distress can be suggested with a GHQ score of 4 or above.
However, it was considered that this questionnaire alone provided rather a narrow perspective on stress-related illness. Consequently, The Hospital Anxiety and Depression Scale (HADS) was selected as a second set of questions. The HADS is an instrument that has been developed as a self-report questionnaire to help detect psychological distress (Snaith and Zigmond, 1994). It is a 14-item self-report measure which provides results against two subscales (anxiety and depression), where higher scores indicate more symptoms and a greater degree of severity of the psychological state (0-7: normal; 8-10: mild; 11-14: moderate, and 15-21:severe). Thus use of both scales provided three measures of psychological health: distress (GHQ-12), anxiety and depression (both HADS).
7.2.1 Conducting the survey
The main survey instrument was a self-administered questionnaire. This was made available in both paper and web-based formats. Both formats were extensively tested prior to the survey to ensure that the routing was unambiguous and clear, and that it was implemented correctly in the web-based version. Data Protection considerations meant that it was not feasible to acquire home contact details from employers for elected employees therefore initial contact was made with a company representative with the view of distributing the questionnaire via the workplace.
A number of issues were identified in relation to achieving a good response rate. Individuals were fully informed of the intent and purpose of the survey with assurances of confidentiality.
For this study, the IOM team adopted a similarly flexible approach with the option of completing the questionnaire either on the computer (web-based) or by sending them paper copies of the questionnaire for distribution by the employer. A reply-paid envelope was included with every paper questionnaire to encourage participation. Large and medium sized organisations were encouraged to participate via the web as it was felt that this approach would be easier for them to administer (forwarding an e-mail with the link address for the questionnaire and company ID number).
All small organisations were contacted by post in the first instance and invited to participate in the survey. They were asked to fax back or email indicating whether or not they would like to participate and, if so, approximately how many employees they had and whether they
57

would like to use the web-based or paper versions of the questionnaires. Medium and large organisations were contacted by telephone and invited to participate in the survey, again a choice of web-based or paper questionnaires was offered. Organisations which agreed to participate in the research were sent either the requisite number of paper questionnaires by post or were emailed a link to the web-based version. No incentive was offered to employers to participate.
Responses to the survey could be tracked by means of a unique company identifier which was printed on each paper questionnaire, or used to login to the web-based questionnaire. This identifier allowed the calculation of the number of responses received from each participating organisation. Two to three weeks after agreement to participate, a reminder was sent to companies from which few or no responses had been received. This was followed up by a telephone call to further encourage participation.
58

8 QUESTIONNAIRE SURVEY: RESULTS
8.1 SURVEY
8.1.1 Target study size
Based on statistical power calculations at the proposal stage of the study, it was estimated that the study target should be to receive completed questionnaires from 1,963 DSE users. It was estimated that to achieve this target, responses would be required from around 3,000 office workers, of whom 40% to 60% would be DSE users (as shown previously in Table 7.2). As the survey progressed, it became clear that the vast majority of returned questionnaires were from DSE users, and that the target response could be redefined as 1,963 completed questionnaires from office workers of whom more than 95% would be DSE users.
8.1.2 Survey: response
Table 8.1 shows the response to the survey by size and industry sector. It was clear from the responses that one of the original allocations by size in the company database from which the sample was drawn was an error, and this organisation was re-classified (from ‘small’ to ‘large’). Each cell in the table contains the number of companies from which any responses were received, the total number of responses from these companies and, for comparison, the target number of responses per cell.
Table 8.1 Survey response by company size and sector
Size Group Finance
Industry sector Real Estate /Business
Public Admin
Other All
Small Response 17 20 54 17 108 companies Response 69 50 334 57 510 questionnaires Target 120 120 120 120 480 questionnaires % of target 57% 42% 278% 48% 106%
Medium Response 1 4 1 4 10 companies Response 1 24 59 12 96 questionnaires Target 101 101 101 101 404 questionnaires % of target 1% 24% 59% 12% 24%
Large Response 2 2 7 1 12 companies Response 2 79 644 1 726 questionnaires Target 270 270 270 270 1,080 questionnaires % of target 1% 29% 238% 0% 67%
All Response 20 26 62 22 130 companies Response 72 153 1,037 70 1,332 questionnaires Target 491 491 491 491 1,964 questionnaires % of target 15% 31% 211% 14% 68%
59

Overall, response levels achieved were 68% of those targeted. It can be seen from Table 8.1 that the number of responses from small companies was greater than target, and that responses were received from many more companies in the public administration sector than planned. Response in the real estate/business, finance and ‘other’ sectors was poor, as was response among medium companies. It was therefore decided, for the purposes of statistical analyses to group the respondents into two size groups (small, medium/large) and two industry sectors (public administration, other).
Of the 1,332 survey respondents, 1,327 were DSE users.
The companies which participated in the study were widely spread geographically across the UK. Figure 8.1 shows the distribution of all participant companies and Figure 8.2 the distribution of medium/large companies.
A total of 1,194 paper questionnaires were sent to participating companies. It was not possible to obtain absolute confirmation that all were distributed but, based on this figure, the total of 540 responses received indicates a response rate of at least 45% (more if not all were passed on). Determining individual response rates from those who received the web-based version proved problematic and many contacts were unable to provide an accurate picture of the numbers they had forwarded the email link to via group email designations. As would be expected this was much more of a problem amongst the larger employers. Taking the statistics for the small businesses alone yielded figures of 356 and 147, giving a response rate of at least 41%. Again, the actual number could be higher if the email was not forwarded to all of the office employees indicated. Both of these figures represent reasonable response rates for a postal questionnaire (web-based benchmarks are not available) and give confidence in the robustness of the findings. Collectively, they account for around two thirds of the total responses, further strengthening confidence in the overall dataset. For comparison, other recent UK-based research investigating symptoms associated with computer work (Woods et al, 2002) achieved a 24% response rate.
60

Figure 8.1 Distribution of all participant companies (shaded black)
61

Figure 8.2 Geographical distribution of large companies (shaded black) and medium companies (shaded white)
62

8.1.3 Study group
The study results are based on the study group of 1,327 DSE users who replied to the survey. 529 responses were on paper questionnaires and 798 on web-based questionnaire; 430 respondents were male and 886 were female (11 did not complete the question on gender). The age distribution of the study group is shown in Table 8.2. Age ranged from 17 to 70, with women (mean age = 41.6 years) younger, on average, than men (mean age = 44 years).
Table 8.2 Age distribution of the study group, by sex. Each cell contains number and % of row total
Sex <25 25-34 Age group
35-44 45-54 55+ Total No. % No. % No. % No. % No. %
Men 23 5 91 21 88 21 129 30 98 23 429 Women 49 5 215 24 251 28 245 28 124 14 884
Total 72 5 306 23 339 26 374 28 222 17 1,313
Of the 1,327 respondents, 820 were from Medium/Large companies and 507 from Small companies. 1,035 respondents were from public administration companies and 292 from companies from ‘Other’ sectors.
8.2 CHARACTERISATION OF WORKING HOURS AND COMPUTER USE
In the survey questionnaire information was recorded on contracted and actual hours worked per week, number of days on which a computer was used, average number of hours spent at the computer and length of time worked at the computer without a break. Duration of computer use was recorded for work and for leisure/home use. Detailed analysis of these variables is shown in Appendix 3 and summarised here.
8.2.1 Working hours
Contracted hours reportedly ranged from 3 to 80 hours per week, and actual working hours from 3 hours to 100 hours per week. The most commonly reported contracted hours were 35, 37 and 37.5 hours per week. Actual hours worked tended to be longer than contracted hours with 37, 37.5 and 40 hour weeks being most commonly reported. Overall, 71 subjects had a typical working week which was longer than that recommended by the Working Time Directive (48 hours).
665 respondents generally worked more than their contracted hours, by between 0.2 and 62.5 additional hours per week (the 62.5 hours was an individual contracted to work 37.5 hours per week who reported working 100 hours per week). Overall, 478 respondents worked five or fewer extra hours, 118 worked between 5 and 10 extra hours, 60 worked between 10 and 20 extra hours and 9 worked more than 20 extra hours.
On average, men tended to be work longer hours (both contracted and actual) than women. A substantial majority of workers in medium/large companies were contracted to work 30-39 hours per week, with proportionally more workers from small companies contracted to work more than 40 or less than 30 hours per week.
63

8.2.2 Duration of computer use
Most respondents used their computer at work for 3 or more days per week, for varying lengths of time, while most home users used their computer for less than two hours a day.
Total weekly computer use was calculated for work and home computer use separately and for work and home use combined. Average weekly computer use was 25 hours of which 21 hours were at work and 4 hours at home. Women tended to spend longer at the computer at work (average 21 hours compared to 20 hours for men) and less time at the computer at home (average 3 hours compared to 6 hours for men).
It is recommended that computer users take a break every hour. More than half of those surveyed reported working more than 1 hour without a break (846 of the 1315 who provided this information), while 285 respondents used a home computer for more than one hour without a break.
8.3 OVERALL PREVALENCE OF SYMPTOMS
8.3.1 Musculoskeletal, head and eye symptoms
Figure 8.3 shows the prevalence of symptoms experienced when using computer equipment as reported by the 1,327 computer users. For symptoms in the hands, wrist, forearms, shoulders, headaches and eye discomfort, the question referred to symptoms within the last year. All positive answers have been included in the table although, for a few respondents, responses to subsequent questions suggested that the symptoms may have occurred more than one year ago.
Questions about symptoms affecting the elbows, neck, back and legs refer to reports of symptoms which occurred on more than one day. Prevalences in the figure refer to symptoms reported to have occurred in the last year.
The highest prevalence was for eye discomfort (58%) and headaches (52%), followed by pain in neck (47%). There were high numbers of missing responses for the questions on aches and pains in elbows and aches and pains in the legs, both of which had questions in slightly different formats to the other symptoms.
0
10
20
30
40
50
60
70
Han
ds
Wris
t
Fore
arm
s
Elb
ows
Shou
lder
s
Nec
k
Bac
k
Legs
Hea
d
Eye
s
Prev
alen
ce (%
)
Figure 5.3 Prevalence of reported symptoms
64

Of the 1,327 computer users, 1,177 provided data on all eight MSD symptoms. The frequency with which symptoms were reported is as shown in Table 8.3. It can be seen from this table that 320 respondents (27%) did not report any MSD symptoms.
Table 8.3 Frequency of reporting of MSD symptoms
Number of symptoms Frequency 0 1 2 3 4 5 6 7 8
320 203 176 198 114
70 45 29 22
The most frequently reported combinations were of shoulder, neck and back problems. Overall, 528 respondents reported two or more of these symptoms. Of these: • 258 reported all three symptoms • 89 reported neck and back symptoms • 146 reported shoulder and neck symptoms • 35 reported shoulder and back symptoms
The next most reported combinations of symptoms were of hand symptoms with wrist, shoulder, neck or back symptoms (331 respondents); followed by wrist symptoms combined with shoulder, neck or back symptoms (236 respondents).
8.3.2 Well-being symptoms
Prevalence of the three well-being conditions is summarised in Table 8.4.
Table 8.4 Prevalence of conditions reported by computer users
Symptom Frequency % No with missing data Distress 342 26.5 35 Anxiety 503 38.5 22 Depression 167 12.9 28
Complete data on all three conditions was available for 1269 (96%) of the 1327 computer users. Of these 699 (54%) reported none of the conditions, 277 reported one condition, 171 reported two conditions and 122 reported all three conditions. The most commonly reported combination of symptoms was distress and anxiety (by 139 of those reporting two conditions).
8.4 OVERALL INCIDENCE OF SYMPTOMS
Symptom incidence was examined for musculoskeletal, head and eye symptoms. It was not possible to examine incidence of well-being symptoms due to the indirect rating scales used in the questionnaire.
Respondents were asked whether they had experienced any of their musculoskeletal, head and eye symptoms for the first time ever during the past 12 months. Table 8.5 shows (a) the number of respondents who reported having each symptom; (b) the number who provided a response to this question and (c) the number and % of (b) who reported that they had experienced the symptom for the first time ever during the last 12 months. The incidence of
65

each symptom is calculated by applying the proportion of respondents with the symptoms who experienced the symptom for the first time in the past 12 months, to the overall proportion of respondents who reported having the symptom. The estimated incidence of each symptom is shown in Table 8.6, and shown graphically in Figure 8.4.
Table 8.5 Frequency of reporting that this was the first time they had experienced these symptoms. Table includes (a) the total number of respondents experiencing
the symptom in the last year, (b) the number of these respondents who responded to this question (c) the number (and %) of (b) who reported experiencing the symptom
for the first time.
No. with No. First time experienced Symptom symptom responding symptom?
No. % Pain, swelling or tingling in hands Pain or swelling in wrist Pain, swelling or tingling in forearms Aches or pains in either elbow Pain in shoulders Pain in neck Aches or pains in back Aches or pains in legs unrelated to back pain Headaches Eye discomfort
394 352 80 22.7 291 266 51 19.2 169 150 32 21.3 162 147 40 27.2 519 474 67 14.1 619 553 80 14.5 482 421 45 10.7 200 175 29 16.6
659 576 47 8.2 747 653 97 14.8
Table 8.6 Incidence of symptoms reported by computer users
1
Symptom Number with % with % experiencing Incidence of symptom symptom symptom for symptom
st time (%) Pain, swelling or tingling in hands 394 Pain or swelling in wrist 291 Pain, swelling or tingling in 169 forearms Aches or pains in either elbow 162 Pain in shoulders 519 Pain in neck 619 Aches or pains in back 482 Aches or pains in legs unrelated to 200 back pain Headaches 659 Eye discomfort 709
30.4 22.7 6.9 22.0 19.2 4.2 12.8 21.3 2.7
12.9 27.2 3.5 39.4 14.1 5.6 47.2 14.5 6.8 36.6 10.7 3.9 16.2 16.6 2.7
52.3 8.2 4.3 64.0 14.8 9.5
In calculating the symptom incidence in this way it is assumed that, among those with symptoms who did not complete this question, the proportion who experienced the symptom for the first time during the previous 12 months was the same as among whose who did complete the question. As an example of how the incidence might vary the estimates for hand symptoms are presented below under different assumptions:
• Assuming similar proportion among those with missing response – 6.9% • Assuming all those missing responded positively – 9.4% • Assuming all those missing responded negatively – 6.2%
66

0123456789
10
Han
ds
Wris
t
Fore
arm
s
Elb
ows
Shou
lder
s
Nec
k
Bac
k
Legs
Hea
d
Eye
s
Inci
denc
e (%
)
Figure 8.4 Incidence of symptoms reported
8.5 LOGISTIC REGRESSION ANALYSES OF MUSCULOSKELETAL, HEAD AND EYE SYMPTOMS
The statistical analyses of the survey questionnaire data have used the method of logistic regression. Logistic regression methods are used to investigate the association of a binary response variable (i.e. a response variable which takes one of two discrete values, for example, yes, no ; present, absent) with a set of potential explanatory variables. In the current study, the response variables are presence/absence of each of the symptoms of interest, and the potential expanatory variables include age, gender, company size, company sector, weekly duration of computer use etc.
Results from logistic regression analyses can be summarised as odds ratios. Odds ratios represent the ratio of probability of an event in one group to probability of the event in a compared group. As an example, suppose that the probability of reporting headaches is 0.2 among men (i.e. 20% of men report headaches) and 0.3 among women, then the odds ratio for women compared to men would be 0.3 divided by 0.2 = 1.5. This odds ratio shows that the probability of women reporting headaches is 1.5 times that of men; or equivalently that the probability of women reporting headaches is 50% higher than that of men. An odds ratio of 1.0 means that there is no difference between the two groups.
The results of the logistic regression analyses also provide information about the variability of the odds ratios. This enables the calculation of a 95% confidence interval around the odds ratio. Using the above example, the 95% confidence interval for the odds ratio for headaches could range from, say, 1.1 to 1.9. This is represented in the current report as an odds ratio of 1.5 (1.1, 1.9). Using conventional levels of statistical significance, an odds ratio is statistically significantly greater than 1.0 (at the 5% level; p<0.05) if the 95% confidence interval does not contain the value 1.0. Where this is the case, the odds ratios and their confidence intervals have been shown in bold type in the results tables.
8.5.1 Musculoskeletal, head and eye symptoms in relation to age, gender, company size and sector
Logistic regression models were fitted to examine the association between the potential explanatory variables and the odds of reporting each symptom. The first set of models
67

examined the association between personal and company characteristics, and type of questionnaire and the occurrence of symptoms (Table 8.7).
All MSD symptoms were significantly more prevalent among responders to the web-based questionnaire than among those who returned paper questionnaire and all symptoms, with the exception of elbows, were more prevalent in women than men (odds ratios ranging from 1.5 to 2.4). Symptoms affecting the wrists, shoulders, neck, back, head and eyes were more prevalent among younger respondents. Because of the uncertainties over the response rate to the web-based version and consequent concerns that this observation might indicate biased participation amongst this group subsidiary analyses were conducted for the sub-set of small companies who responded via the web (for whom an estimated response rate was available). These analyses confirmed that the effect was still present amongst this subgroup.
There were no consistent differences between industry sectors, with only forearm symptoms showing any clear difference between public administration and other companies, with higher prevalence among public administration workers. Odds ratios for small companies compared to medium/large companies were consistently less than one, indicating lower symptom prevalence in the small companies. However, these apparent size differences were statistically significant at the 5% level only for shoulder symptoms, and at the 10% level for headaches.
These logistic regression results show that the factors consistently associated with symptom occurrence are gender and type of questionnaire (web or paper). Figures 8.5 and 8.6 show the unadjusted prevalence of symptoms subdivided by each of these factors.
68

Table 8.7 Results from logistic regression analyses of personal and company characteristics and type of questionnaire. Results are shown as Odds Ratios (OR) and 95% confidence intervals (CI). Confidence intervals which exclude the value 1 indicate statistical significance at the 5%
level and are indicated in bold type.
Age (per 10 yrs) Female vs male Web v Paper Qs Small v Medium/Large Public v Other
Hands OR 95% CI 0.93 (0.8,1.0) 1.62 (1.2,2.1) 1.58 (1.2,2.1) 0.84 (0.6,1.1) 1.25 (0.9,1.7)
Wrists OR 95% CI 0.85 (0.8,1.0) 1.69 (1.3,2.3) 1.41 (1.0,1.9) 0.87 (0.6,1.2) 1.16 (0.8,1.6)
Forearms Elbows Shoulders OR 95% CI OR 95% CI OR 95% CI
1.05 (0.9,1.2) 1.00 (0.9,1.2) 0.88 (0.8,1.0) 2.14 (1.4,3.2) 1.08 (0.8,1.6) 2.38 (1.8,3.1) 1.48 (1.0,2.1) 1.54 (1.0,2.3) 2.10 (1.6,2.7) 0.91 (0.6,1.3) 0.83 (0.6,1.2) 0.75 (0.6,1.0) 1.68 (1.0,2.7) 1.10 (0.7,1.7) 1.23 (0.9,1.7)
Age (per 10 yrs) Female vs male Web v Paper Qs Small v Medium/Large Public v Other
Neck OR 95% CI 0.86 (0.8,1.0) 1.86 (1.5,2.4) 1.37 (1.1,1.7) 0.87 (0.7,1.1) 1.03 (0.8,1.4)
Back OR 95% CI 0.82 (0.7,0.9) 1.62 (1.3,2.1) 1.44 (1.1,1.9) 0.96 (0.7,1.2) 1.03 (0.8,1.4)
Legs Headaches Eye discomfort OR 95% CI OR 95% CI OR 95% CI 1.09 (0.9,1.2) 0.71 (0.6,0.8) 0.79 (0.7,0.9) 1.50 (1.1,2.1) 2.23 (1.7,2.9) 1.57 (1.2,2.0) 1.52 (1.1,2.2) 1.26 (1.0,1.6) 1.25 (1.0,1.6) 1.00 (0.7,1.4) 0.80 (0.6,1.0) 0.83 (0.6,1.1) 1.30 (0.9,2.0) 1.20 (0.9,1.6) 1.23 (0.9,1.6)
69

0
10
20
30
40
50
60
70
Han
ds
Wris
t
Fore
arm
s
Elb
ows
Sho
ulde
rs
Nec
k
Bac
k
Legs
Hea
d
Eye
s
Prev
alen
ce (%
)
WebPaper
0123456789
10
Han
ds
Wris
t
Fore
arm
s
Elbo
ws
Shou
lder
s
Nec
k
Bac
k
Legs
Hea
d
Eye
s
Inci
denc
e (%
)
MenWomen
0
10
20
30
40
50
60
70
Han
ds
Wris
t
Fore
arm
s
Elb
ows
Sho
ulde
rs
Nec
k
Bac
k
Legs
Hea
d
Eye
s
Prev
alen
ce (%
)MenWomen
Figure 8.5 Prevalence of symptoms by gender
Figure 8.6 Prevalence of symptoms by type of questionnaire
There were too few ‘new’ occurrences of each symptom to allow formal statistical regression modelling to be carried out. We present here, for comparison, incidence of each symptom by gender and type of questionnaire (Figures 8.7 and 8.8).
Figure 8.7 Incidence of symptoms by gender
70

0123456789
10
Han
ds
Wris
t
Fore
arm
s
Elb
ows
Sho
ulde
rs
Nec
k
Bac
k
Legs
Hea
d
Eye
s
Inci
denc
e (%
)WebPaper
Figure 8.8 Incidence of symptoms by type of questionnaire
In general, results for the incidence of symptoms were similar to those for symptom prevalence with higher incidence among women than men and higher incidence among those who used the web-based questionnaire than among those who returned the paper version.
8.5.2 Musculoskeletal, head and eye symptoms in relation to patterns of work
The association of reported symptoms with hours of work, duration of computer use and frequency of breaks was examined using logistic methods, after adjustment for age (where appropriate), gender and questionnaire type. Work variables included in the analysis were:
• Total weekly computer use, work plus home (in hours) • Weekly computer use at work (in hours) • Indicator for whether, at work, breaks were taken each hour • Total hours worked per week and indicator for whether total hours worked per
week exceeded 48 hours • Total hours per week worked more than contracted hours and indicator for
whether actual hours worked were 5 or more hours greater than contracted hours
Each work variable was entered into the regression model separately to determine the strength of association with symptoms and all work variables subsequently entered into the model simultaneously to test for the independence of any associations found. The results of the analysis are shown in Table 8.8.
All symptoms except those in the forearm, back or legs were associated with weekly computer use. In general, symptoms occurrence was more strongly related to computer use at work than to combined work and home use. Odds of reporting all symptoms were higher among those who worked for over one hour without taking a break, and this association was statistically significant for all symptoms except wrists, forearms and elbows. There was no consistent evidence of an association between higher odds of reporting symptoms and working more than 48 hours per week or working 5 or more hours more than contracted hours. However, the odds of reporting eye and elbow symptoms were statistically significantly higher with increased hours spent working, with similarly increased odds ratios for neck, leg and head symptoms although these were of borderline statistical significance (0.05 < p < 0.10).
71

Table 8.8 Results from logistic regression analyses of patterns of work. Results are shown as Odds Ratios (OR) and 95% confidence intervals (CI) for each variable entered singly into a model adjusting for age (where appropriate), gender and questionnaire type. Confidence intervals
which exclude the value 1 indicate statistical significance at the 5% level and are indicated in bold type.
Hands Wrists Forearms Elbows Shoulders OR 95% CI OR 95% CI OR 95% CI OR 95% CI OR 95% CI
Weekly total PC use (per 10 hrs) 1.22 (1.1,1.4) 1.17 (1.0,1.4) 1.11 (0.9,1.3) 1.14 (0.9,1.4) 1.06 (0.9,1.2) Weekly work PC use (per 10 hrs) 1.28 (1.1,1.5) 1.13 (0.9,1.4) 1.04 (0.8,1.3) 1.33 (1.0,1.7) 1.21 (1.0,1.4) Break at 1hr+ v Break every hour 1.60 (1.2,2.1) 1.33 (1.0,1.8) 1.28 (0.9,1.8) 1.26 (0.9,1.8) 1.52 (1.2,2.0) Hours spent working (per 10 hrs) 1.01 (0.9,1.2) 0.97 (0.8,1.2) 0.89 (0.7,1.1) 1.37 (1.1,1.7) 1.07 (0.9,1.2) Work > 48hrs v Work ≤ 48 hrs 0.80 (0.4,1.5) 1.13 (0.6,2.1) 1.05 (0.5,2.4) 1.09 (0.5,2.4) 0.76 (0.4,1.4) Hours over contracted hours (per 10 hrs) 1.04 (0.8,1.4) 1.07 (0.8,1.4) 0.86 (0.6,1.3) 1.31 (0.9,1.8) 1.24 (1.0,1.6) Work 5+ hrs extra v Work <5 hrs extra 0.84 (0.6,1.2) 0.88 (0.6,1.3) 0.87 (0.5,1.4) 1.46 (0.9,2.3) 1.46 (1.0,2.1)
Neck Back Legs Headaches Eye Discomfort OR 95% CI OR 95% CI OR 95% CI OR 95% CI OR 95% CI
Weekly total PC use (per 10 hrs) 1.15 (1.0,1.3) 1.13 (1.0,1.3) 1.12 (0.9,1.3) 1.24 (1.1,1.4) 1.29 (1.1,1.5) Weekly work PC use (per 10 hrs) 1.27 (1.1,1.5) 1.15 (1.0,1.4) 1.17 (0.9,1.5) 1.38 (1.2,1.6) 1.49 (1.3,1.8) Break at 1hr+ v Break every hour 1.65 (1.3,2.1) 1.55 (1.2,2.0) 1.49 (1.1,2.1) 1.83 (1.4,2.3) 1.86 (1.5,2.4) Hours spent working (per 10 hrs) 1.11 (1.0,1.3) 1.04 (0.9,1.2) 1.19 (1.0,1.4) 1.15 (1.0,1.3) 1.22 (1.1,1.4) Work > 48hrs v Work ≤ 48 hrs 0.88 (0.5,1.5) 0.83 (0.5,1.5) 1.09 (0.5,2.3) 1.36 (0.8,2.3) 1.27 (0.8,2.1) Hours over contracted hours (per 10 hrs) 1.25 (1.0,1.6) 1.13 (0.9,1.5) 1.06 (0.8,1.5) 1.12 (0.9,1.5) 1.11 (0.9,1.4) Work 5+ hrs extra v Work <5 hrs extra 1.27 (0.9,1.8) 1.27 (0.9,1.8) 1.06 (0.7,1.7) 1.15 (0.8,1.6) 1.07 (0.8,1.5)
72
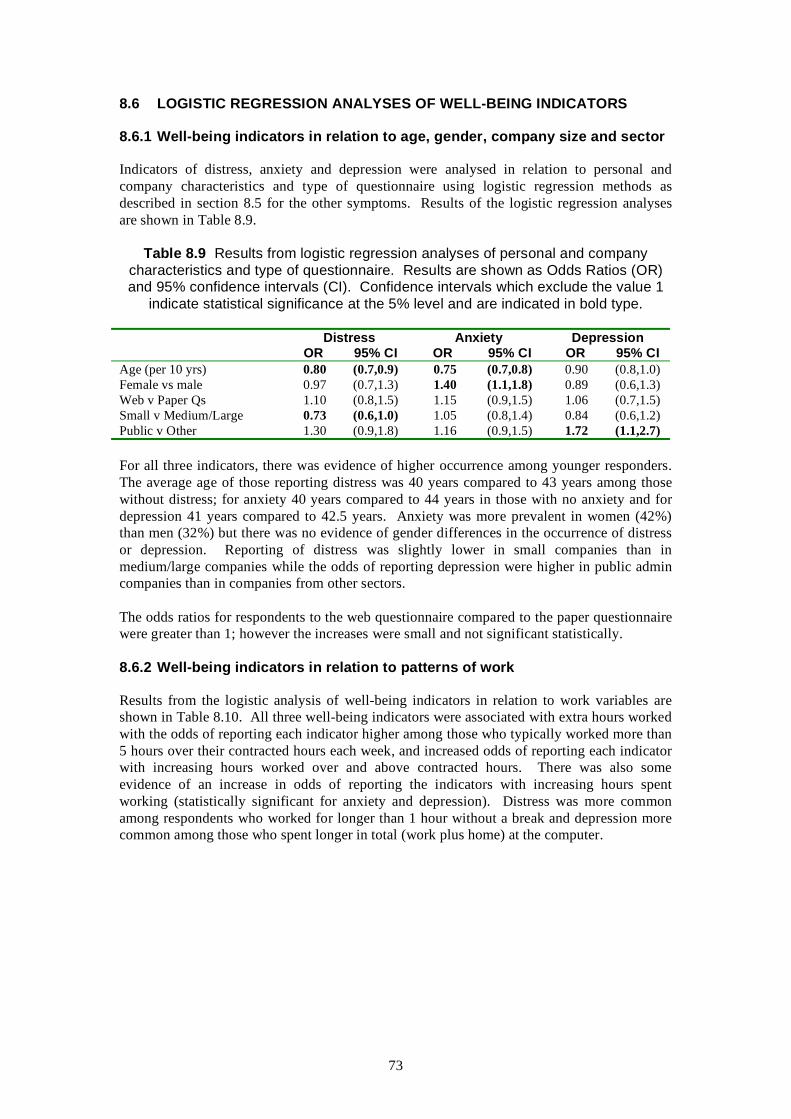
8.6 LOGISTIC REGRESSION ANALYSES OF WELL-BEING INDICATORS
8.6.1 Well-being indicators in relation to age, gender, company size and sector
Indicators of distress, anxiety and depression were analysed in relation to personal and company characteristics and type of questionnaire using logistic regression methods as described in section 8.5 for the other symptoms. Results of the logistic regression analyses are shown in Table 8.9.
Table 8.9 Results from logistic regression analyses of personal and company characteristics and type of questionnaire. Results are shown as Odds Ratios (OR) and 95% confidence intervals (CI). Confidence intervals which exclude the value 1
indicate statistical significance at the 5% level and are indicated in bold type.
Distress Anxiety Depression OR 95% CI OR 95% CI OR 95% CI
Age (per 10 yrs) 0.80 (0.7,0.9) 0.75 (0.7,0.8) 0.90 (0.8,1.0) Female vs male 0.97 (0.7,1.3) 1.40 (1.1,1.8) 0.89 (0.6,1.3) Web v Paper Qs 1.10 (0.8,1.5) 1.15 (0.9,1.5) 1.06 (0.7,1.5) Small v Medium/Large 0.73 (0.6,1.0) 1.05 (0.8,1.4) 0.84 (0.6,1.2) Public v Other 1.30 (0.9,1.8) 1.16 (0.9,1.5) 1.72 (1.1,2.7)
For all three indicators, there was evidence of higher occurrence among younger responders. The average age of those reporting distress was 40 years compared to 43 years among those without distress; for anxiety 40 years compared to 44 years in those with no anxiety and for depression 41 years compared to 42.5 years. Anxiety was more prevalent in women (42%) than men (32%) but there was no evidence of gender differences in the occurrence of distress or depression. Reporting of distress was slightly lower in small companies than in medium/large companies while the odds of reporting depression were higher in public admin companies than in companies from other sectors.
The odds ratios for respondents to the web questionnaire compared to the paper questionnaire were greater than 1; however the increases were small and not significant statistically.
8.6.2 Well-being indicators in relation to patterns of work
Results from the logistic analysis of well-being indicators in relation to work variables are shown in Table 8.10. All three well-being indicators were associated with extra hours worked with the odds of reporting each indicator higher among those who typically worked more than 5 hours over their contracted hours each week, and increased odds of reporting each indicator with increasing hours worked over and above contracted hours. There was also some evidence of an increase in odds of reporting the indicators with increasing hours spent working (statistically significant for anxiety and depression). Distress was more common among respondents who worked for longer than 1 hour without a break and depression more common among those who spent longer in total (work plus home) at the computer.
73

Table 8.10 Results from logistic regression analyses of patterns of work. Results are shown as Odds Ratios (OR) and 95% confidence intervals (CI) for each variable entered singly into a model adjusting for personal and company characteristics (as
appropriate). Confidence intervals which exclude the value 1 indicate statistical significance at the 5% level and are indicated in bold type.
Distress Anxiety Depression OR 95% CI OR 95% CI OR 95% CI
Weekly total PC use (per 10 hrs) 1.12 (1.0,1.3) 1.10 (1.0,1.3) 1.31 (1.1,1.6) Weekly work PC use (per 10 hrs) 1.09 (0.9,1.3) 1.02 (0.9,1.2) 1.30 (1.0,1.7) Break at 1hr+ v Break every hour 1.37 (1.0,1.8) 1.16 (0.9,1.5) 1.38 (1.0,2.0) Hours spent working (per 10 hrs) 1.10 (0.9,1.3) 1.16 (1.0,1.4) 1.24 (1.0,1.5) Work > 48hrs v Work ≤ 48 hrs 1.09 (0.6,2.0) 1.13 (0.7,1.9) 1.58 (0.8,3.1) Hrs over contracted hours (per 10 hrs) 1.27 (1.0,1.7) 1.43 (1.1,1.8) 1.42 (1.0,1.9) Work 5+ hrs extra v Work <5 hrs 1.42 (1.0,2.0) 1.44 (1.0,2.0) 1.58 (1.0,2.4) extra
8.7 MUSCULOSKELETAL, HEAD AND EYE SYMPTOMS IN RELATION TO ANXIETY AND DEPRESSION
As well as health endpoints in their own right, it is possible that the presence of distress, anxiety and/or depression may pre-dispose individuals to report other symptoms, or that the presence of other symptoms may increase the tendency to feel anxious, distressed or depressed. Logistic regression analyses of symptoms were used to examine any associations with the indicators of distress, anxiety and depression after adjustment for other relevant explanatory factors – age, gender, questionnaire type, weekly computer use at work and frequency of breaks. The results are shown in Table 8.11.
There is a clear association between each of the well-being indicators and the reporting of musculoskeletal, head and eye symptoms. In each case there is a statistically significant increase in the odds of reporting each symptom among respondents who had occurrences of distress, anxiety or depression. As noted above, the occurrence of distress, anxiety and depression were not independent with many respondents having positive indicators for more than one of these conditions. Multiple logistic regression methods were used to determine which well-being indicators were most strongly related to symptom occurrence, with results as follows:
• Hands, Wrists, Legs, Head related to anxiety and depression • Shoulders, Neck, Back, Eyes related to distress and anxiety • Forearm related to anxiety • Elbows related to depression
74

Table 8.11 Results from logistic regression analyses of distress, anxiety and depression. Results are shown as Odds Ratios (OR) and 95% confidence intervals (CI) for each variable entered singly into a model adjusting for age (where appropriate), gender, questionnaire type,
duration of computer use and frequency of breaks. Confidence intervals which exclude the value 1 indicate statistical significance at the 5% level and are indicated in bold type.
Distress Anxiety Depression
Hands OR 95% CI 1.57 (1.2,2.1) 1.91 (1.5,2.5) 2.08 (1.5,3.0)
Wrists OR 95% CI 1.63 (1.2,2.2) 2.21 (1.7,2.9) 2.04 (1.4,3.0)
Forearms Elbows Shoulders OR 95% CI OR 95% CI OR 95% CI 1.41 (1.0,2.0) 1.56 (1.1,2.2) 2.12 (1.6,2.8) 1.49 (1.1,2.1) 1.47 (1.0,2.1) 1.91 (1.5,2.4) 1.40 (0.9,2.2) 2.13 (1.4,3.3) 1.63 (1.1,2.3)
Distress Anxiety Depression
Neck OR 95% CI 2.86 (2.2,3.8) 2.60 (2.0,3.3) 2.29 (1.6,3.3)
Back OR 95% CI 1.96 (1.5,2.5) 2.31 (1.8,2.9) 1.71 (1.2,2.4)
Legs Headaches Eye Discomfort OR 95% CI OR 95% CI OR 95% CI 1.72 (1.2,2.4) 1.96 (1.5,2.6) 2.09 (1.6,2.8) 1.91 (1.4,2.6) 2.39 (1.9,3.1) 2.39 (1.9,3.1) 2.53 (1.7,3.7) 3.04 (2.0,4.6) 2.00 (1.4,2.9)
75

8.8 WORK-DAYS LOST
Respondents were asked how much time (in working days) they had taken off work in the last 12 months. The responses are summarised in Figure 8.9, which shows the percentage of those reporting each symptom who took any time off work (1+ days off) and eight or more days off work (8+ days). More detailed information is shown in Table 8.12. The majority of respondents took no time off work.
02468
101214161820
Han
ds
Wris
t
Fore
arm
s
Elb
ows
Sho
ulde
rs
Nec
k
Bac
k
Legs
Hea
d
Eye
s% o
f tho
se re
port
ing
sym
ptom
1+ days off8+ days off
Figure 8.9 Time taken off work
The most frequent absences from work were for headaches, back pains and leg pains unrelated to back pain. For each of these symptoms more than 10% of those reporting symptoms had taken some time off work. Although almost 1 in 5 of those reporting headaches had taken any time off work, very few of these (less than 1% of all those reporting headaches) had taken long-term absence. In contrast, back pain and leg pain which had relatively high levels of time off, also had the highest levels of longer-term time off with between 3% and 4% of respondents with these symptoms taking more than 7 days off work in the past 12 months. Around 2% of respondents reporting symptoms in the wrist, forearms or elbows also reported taking more than 7 days off.
The more detailed information shown in Table 8.12 shows that among those taking longer term absences the most frequently reported time period was 8 days to 1 month off in the past 12 months, with smaller numbers of subjects reporting absences of longer than one month. It should be noted, however, that the survey questionnaire was administered at work and so it is likely that a number of potential respondents who were on longer term sick leave would not have been available to participate in the survey.
As noted in Table 8.3, there were 1177 individuals who provided information on all eight MSD symptoms, of whom 857 reported suffering from one or more MSD symptom. An estimate of the total days lost for these 857 individuals was calculated using the midpoint of each category for work days lost (e.g. 2 to 3 days = 2.5 days) and summing across individuals. Where lost work days were reported for more than one symptom by the same individual, the largest of the values was used (i.e. if < 1 day for one symptoms, and 4-7 days for another, then 4-7 days was used). In total, we estimate a total of 1001 days lost for these individuals, equivalent to 1.2 days per individual with symptoms, and to 8.8 days per individual who took any time off. Averaged across all 1177 workers, this is equivalent to 0.85 days per worker.
76

Table 8.12 Number taking time off work - details
No. with No. Number taking time off work Symptom symptom responding 8days- 1-3 4 months-
to Q25 None ≤ 1 day 2-3 days 4-7 days 1 month months 1 year Pain, swelling or tingling in hands 394 360 Pain or swelling in wrist 291 265 Pain, swelling or tingling in forearms 169 154 Aches or pains in either elbow 162 147 Pain in shoulders 519 477 Pain in neck 619 551 Aches or pains in back 482 439 Aches or pains in legs unrelated to back pain 200 180 Headaches 659 582 Eye discomfort 747 664
337 10 4 3 4 0 2 247 7 3 2 4 0 2 141 7 1 2 1 0 2 138 4 0 2 1 1 1 436 13 13 9 4 0 2 512 11 13 10 3 0 2 374 18 19 14 10 2 2 159 7 6 1 4 2 1 477 52 39 9 3 1 1 632 21 4 3 3 0 1
77

8.9 RESPONSES TO NON-MEDICAL QUESTIONS
In addition to the questions on symptom occurrence, well-being and patterns of work, additional, more detailed questions were included in the questionnaire which explored more fully the conditions in which respondents worked and the computing equipment that they used. It was not an intention of the current study to explore this data in any detail, nor to relate it to the occurrence of symptoms. Detailed descriptions of these responses are given in Appendix 4 with the main patterns summarised here.
The majority of respondents worked at a traditional desktop/workstation. They tended to have adjustable chairs which they knew how to adjust, and had adjusted at some time. Most respondents used their computer and keyboard on three or more days per week for more than two hours per day. Screens were generally flat screens positioned directly in front of the user, which were easy to adjust for brightness, contrast and angle. The majority of respondents used a mouse as a pointing device. Few of the respondents had received any touch typing training.
The majority of respondents also used a computer at home. Most of these used a traditional desktop/workstation set up, and tended to use the computer for leisure only, for less than two hours a day. The computer was usually set up on a computer desk, and few users used a footrest. A mixture of screen types were used (flat screen, CRT, laptop screen) but most were easy to adjust for brightness, contrast and angle. Most used a mouse as a pointing device.
78

9 DISCUSSION AND KEY RESULTS OF THE SURVEY
9.1 SURVEY PRACTICALITIES
A combined postal and web-based survey has been carried out of 1327 DSE users across the UK. The distribution map of responses shows effective coverage from the north of Scotland down to Cornwall and from Norfolk to Northern Ireland. There is little concern therefore of any regional bias. It had been hoped that completed questionnaires would be received from around 2000 DSE users and overall, the survey achieved 68% of the target number of questionnaires, drawn from 130 different organisations. The sample therefore provides adequate numbers of questionnaires for analysis, but the somewhat low response rate from employers raises some questions about the representativeness of those surveyed.
The proportion of small businesses responding was gratifyingly large as small businesses have previously often been found to be a difficult sector to penetrate. Response was particularly disappointing from medium-sized organisations and from organisations outwith the public sector. The reasons for this are unclear. As a result, the statistical analyses by size and sector considered only two size groups (small and medium/large) and two sector groups (public organisations and others). In the event, results from the statistical analysis showed relatively little difference in the reporting of symptoms between organisations in these size and sector groupings.
Initial recruitment amongst larger businesses was better than the statistics suggest. However, a considerable number of those agreeing to be sent a web-link failed to participate or, in some instances, only the initial recipient completed a questionnaire. Further telephone enquiries revealed that in most cases, the initial (health and safety) contact could not personally authorise further distribution and more senior managers were reluctant to do so. (One exception to this was the individual who had misunderstood the requirement and thought that completing the questionnaire himself was all that was required).
The customary approach with surveys of this nature has been to access employers via ‘the person responsible for health and safety’. This has proved to be effective in gaining appropriate access to organisations where the person contacted has been the person asked to complete a questionnaire. In this instance however, the situation was different in that the person contacted was being asked to get others to complete the questionnaire. In hindsight, particularly in larger companies with full-time health and safety professionals, these individuals did not have the authority to accede to such a request. Relying on these people to seek the necessary authorisation added an additional step in the process to what had previously been required which firstly extended the timescale and secondly (and more importantly) frequently proved to be a significant hurdle. Whilst the health and safety professional has a degree of personal interest in occupational health (and an element of ‘camaraderie’) the senior manager often has neither and the process therefore relies on the motivation (and persuasive powers) of the intermediary. Clearly lessons must be learned if surveys of this nature are to be successfully conducted in the future. It would seem likely that the researcher must retain responsibility for pursuing the necessary agreements, using the Health and Safety person as an initial intermediary in that process, rather than relying on that individual to obtain agreement on behalf of the research organisation.
However, once access had been gained within an organisation, the response by employees within the participating companies was more encouraging at more than 40% of those contacted and this provides some reassurance in the robustness of the findings.
79

A choice of paper-based or web-based questionnaires was offered to participating companies. Around 40% of the study group completed the paper questionnaire and 60% the web questionnaire. The design of the web questionnaire ensured that all those who completed it followed the correct routing and did not omit any relevant questions. In general, the quality of the responses to the paper questionnaire was also good, with relatively little missing or invalid data.
A complication of the web-based questionnaire was that it proved very difficult to track how many individual employees had been sent the link. In most cases it was apparent that not all eligible employees had been included (sometimes, for example, distribution appeared to have been limited to those staff which the contact had personal jurisdiction over). Determining an individual response rate therefore proved to be very difficult.
Projections based upon the responses from all sources to the paper version (45%) and from the small companies who used the web version (41%) suggest a reasonable response rate for a survey of this nature without personal contact with recipients (effectively a postal questionnaire even if part of the ‘post’ was electronic). For comparison, the paper-based survey of non-keyboard input device users reported by Woods et al (2002) achieved a response rate of 24%.
Although not as good as workplace-based surveys these figures are nevertheless reasonable, compared to the expected 40% response rate from small companies (although down on the optimistic 60% response anticipated from medium and larger organisations on the basis of previous IOM surveys). The assumption that the web-based version would be easier and more convenient for companies and individuals is not wholly supported (although more employers did choose to adopt that option). Although it does have inherent distribution advantages, the lack of control over distribution (and the uncertainty that creates) reduces any benefit. Ideally the web address would be distributed by personal direct email but this approach is currently not adopted due to concerns over data protection. Again, lessons must be learned, perhaps requiring a clarification of the Data Protection Act and its interpretation, if these barriers to effective surveys are to be overcome. With a growing emphasis on evidence-based guidance it is important that such issues are addressed.
9.2 OVERVIEW OF KEY FINDINGS
Preliminary data analysis showed that the differences in prevalence between questionnaire types were highly significant statistically (symptom prevalence was consistently higher among those who completed the web questionnaire), and that symptom prevalence was significantly higher in women than men. It is notable that this pattern was more marked for MSD, head and eye symptoms, where the reporting was more subjective, than for the wellbeing conditions where the questions were less direct. This could be interpreted as suggesting some (possibly unwitting) bias rather than a genuine phenomenon. Jones and Pitt (1999) and Rowe et al, (2006) have both reported on comparisons between different response modalities (paper and web) where no consistent significant differences in response were obtained. In the present study, response medium was confounded with employer in that each employer only used one method. It is therefore possible that there was a genuine higher prevalence of symptoms amongst those employers who used the web-based questionnaire. However, the data set collected does not permit any further examination of this phenomenon for which no definite explanation is apparent.
Because of these observed effects regression analyses were therefore adjusted for gender and questionnaire type before consideration of any other factors.
80

The aims of the statistical analyses were the estimation of the prevalence and incidence of the range of symptoms identified, examination of how these related to current computer use and investigation of time taken off work as a result. It was not an aim of the survey to investigate the causes of the symptoms and contextual data on workstation layout, computing equipment used and home computer user was collected only to determine the typical patterns of use among the survey respondents. The contextual data showed that the majority of respondents to the survey used a traditional desktop set-up with flat screen monitor and a mouse as a pointing device.
Overall, 73% of all respondents reported one or more musculoskeletal symptoms, with the highest prevalence occurring for neck symptoms (47%) followed by shoulder symptoms (39%). Prevalence of most of the reported MSD, head and eye symptoms increased with increasing weekly PC use, and were higher in those respondents who did not take an hourly break from the computer.
Despite the high incidence of apparent symptoms, the majority of those surveyed who reported symptoms did not take any time of work due to these symptoms. This is in contrast to the findings of the 2003/04 UK Labour Force Survey (LFS) (Jones et al, 2005) which reported that 53% of those who reported musculoskeletal disorders took some time off as a result. Direct comparisons between the two surveys are difficult because, unlike the present survey which asked about symptoms, the LFS asked whether respondents ‘had suffered from any illness, disability or other physical or mental problem that was caused or made worse by your job or work done in the past?’ Apart from any influence of this direct reference to problems being caused or made worse, the use of terms such as ‘illness’ might not be expected to prompt those with minor aches and pains to respond positively.
The breakdown of the LFS data by ‘industry’ or ‘occupation’ does not enable any estimate of the numbers of computer users to be derived and hence any comparable statistics to be determined from this source.
Whatever the differences between the two surveys, a significant minority in the present study reported taking one or more days off work, ranging from 5% of those with eye symptoms to 18% of those with headaches. Relatively few respondents reported taking longer term absence (more than seven days per year) although it should be noted that some workers taking longer-term sick leave might not be present at work to take part in the survey. Longer term absence was reported most frequently for back and leg symptoms. Four respondents reported taking more than three months off due to their symptoms.
It is estimated that those who took reported taking time off in the present study took an average of 8.8 days absence equivalent to 0.85 days per respondent. In comparison, the LFS estimated that, on average, people suffering from a work-related musculoskeletal disorder took 19.4 days off work in 2003/04 because of their complaint which represents an average of 0.52 days (full-day equivalent) per person in employment. It should be borne in mind that the LFS addressed ill-health which the respondents considered was caused or made worse by their work. It is therefore possibly to be expected that such people would be more likely to take time off (from what they considered to be responsible for their symptoms).
A summary of the key results of the present study is given below:
i) 73% of all respondents to the questionnaire survey reported one or more musculoskeletal symptom.
81

ii) Prevalence of individual musculoskeletal symptoms ranged from 12% for elbow and forearm symptoms to 47% for neck symptoms. Symptoms involving the shoulder, neck and back were most frequently reported together.
iii) Over half of all respondents reported symptoms affecting the head and/or eyes. iv) As expected from the literature, symptoms were reported more frequently by women
than men and by those who completed the web-based rather than the paper questionnaire.
v) There was little evidence of differences in prevalence between companies of different sizes or different industry sectors, although forearm symptoms were more common in public organisations and shoulder symptoms more common in medium and large companies.
vi) Prevalence of symptoms was higher among those who spent more time at their computer at work and among those who worked for more than one hour without a break.
vii) All symptoms were more common among respondents who had indications of stress, anxiety and/or depression.
viii) Incidence of musculoskeletal symptoms ranged from 2.7% for forearm and leg symptoms to over 6% for hand and neck symptoms. Incidence of eye discomfort was higher than for all the musculoskeletal symptoms at 9.5%.
ix) Occurrence of anxiety, depression and distress was marginally more common among younger respondents and anxiety occurred more frequently in women than men. There was little consistent difference in the occurrence of distress, anxiety or depression between companies of different sizes or sectors.
x) Occurrence of anxiety, depression and distress was more frequent among those who typically worked more than 5 hours over their contracted hours each week; distress was more common among those who worked more than one hour without a break and anxiety and depression were more common among those who spent longer per week at the computer.
xi) Of those reporting symptoms, the majority (82% to 95% depending on symptom) took no time off work related to their symptoms. As a proportion of those reporting symptoms the most frequent absences from work were for headaches, back pain and leg pains unrelated to back pain, where more than 10% of those reporting the symptoms had taken some time off work. The percentage of those with symptoms taking more than 7 days off work ranged from 0.6% for eye discomfort to 3.9% for leg pain. However, for absolute numbers of people reporting absences, the biggest cause was headaches (105) followed by back pain (65) and neck pain (39).
xii) From the total of 1327 user questionnaires it can be determined that the most common symptom (headaches) resulted in 7.9% of all respondents indicating taking time off work (4.9% for the next most common, back pain).
9.3 GENERAL DISCUSSION OF RESULTS
Despite legislative provision to improve computer workstations (Health and Safety (Display Screen Equipment) Regulations 1992) the level of musculoskeletal symptoms amongst computer users appears to be high. There is no way of telling from the survey how well individual employers had implemented the provision of these regulations although, as a crude index, the vast majority of respondents appear to have adjustable chairs (which they know how to adjust) and VDU screens which can be easily adjusted for brightness, contrast and angle (basic requirements of the Schedule of Minimum Requirements).
Given the statutory requirements for information and training, it is of some concern that approximately one third on respondents stated that they had not received any such training on
82

workstation layout. It is possible that some of these had received some form of training but either did not remember this or did not recognise this as training (although the questioning was deliberately broad). There have been suggestions that raising awareness of MSDs (are requirements of the regulations) increases reporting. The apparent absence of such training mitigates against this being a factor. In addition, the prevalence of MSD symptoms reported in this survey is broadly similar to that identified in the earlier IOM study (Hanson et al, 1999) carried out in the first years of implementing the regulations. It is of course possible as suggested earlier that increased reporting has masked a reduction in symptoms although there is no way of determining such an effect.
There was a tendency for the prevalence of symptoms to be positively associated with increased use of a computer although individual comparisons did not always attain formal statistical significance. This is consistent with the broad findings of the published scientific literature. Computed Odds Ratios were perhaps somewhat lower than those reported elsewhere although this might be a function more of how they were determined (per ten hours of use).
Respondents were asked: ‘What is the longest time you would spend using your computer and keyboard without taking a break of 5 minutes or more?’ There was a more marked tendency for increased reporting of symptoms amongst those who indicated in response that they worked for more than an hour without a break, contrary to what would be recommended in the HSE guidance on the regulations (HSE, 2003). The Odds Ratios were generally higher and more likely to be statistically significant. Such breaks were self-reported and naturally open to individual interpretation and recollection. However, to the extent that the responses can be seen as a reliable account of work-break habits this finding can be seen as reinforcing the regulatory requirement for regular short breaks from computer work. As more than half of respondents indicated that they did not necessarily always take regular breaks this would appear to offer some scope for improvement.
There was some evidence that longer total working hours, as well as time spent using a computer, were associated with higher levels of symptom reporting.
The guidance on the DSE Regulations (HSE, 2003) states that some workers using VDUs may experience temporary visual fatigue leading to a range of symptoms including sore eyes and headaches. The survey identified a relatively high proportion of respondents reporting such symptoms (more than individual musculoskeletal symptoms) and the reported levels were higher than the (few) other surveys in the literature. However, the prevalence of headaches was within the published range for population data (albeit not UK-based). Respondents were asked regarding symptoms ‘when using computer equipment’ although that does not necessary assume a causal role and, considering headaches for example, a chance association is highly likely in many instances. Women were more likely than men to report either symptom. No gender-based data has been found in the literature for comparison.
The general relationships between MSD symptoms and hours of computer use and working without breaks were also reflected in headaches and eye discomfort. As with MSD symptoms it is not possible to differentiate between increased awareness of pre-existing symptoms and any causal relationship. It is noted that, when the results were analysed for the individual clusters of MSD symptoms as reported in Table 8.12, more respondents reportedly took time off work for headaches. A global value for those taking time off for any reported MSD symptom was calculated and proved to be remarkably similar to the value for headaches (19.8% cf 18.0%). The proportion of those with eye discomfort taking time off was low compared to other symptoms. However, the large number of respondents reporting such problems meant that the actual number (rather than the percentage) having absence from work as a result was higher than the number reporting absence due to MSD symptoms in many of the individual body parts.
83

The proportion reporting extended absence of more than one day due to headaches was similar to those taking more than a day off work due to MSD symptoms in the various upper limb parts (e.g. hand, wrist, forearm or elbow symptoms).
Clearly there are many causes of headaches and eye problems which may be unrelated to work (as is the case with MSDs). Nevertheless, there has previously been a tendency to pay less attention to such problems in the workplace than has been given to MSDs. These results suggest that there may be some value in considering ways in which employers could assist their employees and therefore reduce absence through this cause (for example by ensuring the regular breaks referred to earlier; taking steps to minimise reflections and glare; and promoting wider awareness of the provisions for eyesight testing).
Mental stress is referred to in the DSE guidance document as one of the principal risks from such work. The text notes risk factors, apparently derived from the general literature/guidance on stress rather than any specific studies. Indeed, it is stated that although these factors have been ‘linked’ with stress in DSE work they are clearly not unique to such work.
Three measures of psychological well-being were obtained in the current survey. These are derived from responses to standardised questions and therefore unlikely to be so readily influenced by any response bias as self-reported musculoskeletal symptoms. The use of standardised question sets also facilitates direct comparisons with other published studies.
Levels of psychological distress, in this survey, as measured by the GHQ12 question set, are higher than those documented in a population based survey and a study of blue-collar (assembly) workers but lower than reported in another workplace survey. The authors of the latter survey describe their results as ‘slightly higher than would be expected’ although, as their figure of 39% was almost twice the benchmark prevalence they quote of 20%, the use of the term ‘slightly’ could perhaps be questioned.
Within the sample group, no demographic (age, employment sector) factors displayed any significant variation. Three work factors (weekly total PC use; more than an hour before a break; and working at least five hours extra) all displayed elevated odds ratios which narrowly missed formal statistical significance (lower OR limit = 1.0). Given the somewhat arbitrary nature of this statistical criterion discussed earlier it would seem reasonable to suggest that these results are at least indicative of a genuine relationship.
With the exception of forearm pain (which narrowly missed significance on the same basis) symptoms in all anatomical sites (including MSDs, eyes and headaches) displayed a significant positive association with reporting distress. In a cross-sectional study it is of course impossible to draw any inference regarding causation but the observed findings are consistent with what would be expected.
In general terms, the scores for anxiety and depression in this survey present a similar pattern, with prevalences higher than expected from general population data (although not as markedly higher as the distress scores) and, with isolated exceptions, significant positive associations with physical symptoms. Females are significantly more likely than males to report anxiety (OR = 1.40) but not depression and public sector workers more likely than those in the private sector to report depression (OR = 1.72).
No work factors were significantly associated with anxiety although total PC use (home + work) and extra working hours both narrowly missed significance. Odds Ratios were generally higher for depression and that for total PC use was significant with three others (work use, breaks and extra time) narrowly missing significance.
84

Stress and stress-related illnesses are of course multi-factorial and there is no doubt that there are many potential stress factors present in the work of those in both the public and private sectors, although the elevated Odds Ratios for depression was only significant for those in the public sector. Any associations found between well-being indicators and patterns of work in this survey could be serving as surrogates for any of these numerous potential factors rather than being specifically related to computer work, although the trends shown are all as might be expected. Support for this hypothesis can be drawn from the tendency for extra hours worked rather than PC use to show the strongest effect (unlike MSD symptoms). The questionnaire did not ask how much home PC use was actually work-related and it is possible that a degree of working at home accounts for the total PC use showing stronger associations than work PC use (again unlike MSD symptoms) although this is purely conjecture.
In essence therefore, levels of psychological problems (distress, anxiety and depression) were higher amongst the survey sample than would be expected from general UK population data but not necessarily higher than other work-based samples. Some positive associations with work factors have been identified or at least indicated. On the basis of the limited information available, it is not possible to determine whether this is specifically related to VDU work or to other work characteristics although the limited information available suggests that factors other than computer use are the main contributors.
85

86

10 GENERAL DISCUSSION
10.1 MSD PREVALENCE DATA
Reported prevalences and incidences of MSD symptoms from the present study and the published literature are given in Table 10.1.
Table 10.1 Reported prevalences and incidences of musculoskeletal problems (amongst DSE users unless indicated otherwise).
STUDY PREVALENCES NOTES IOM current study 72.8%
55.2% Any MSD symptoms in last 12mths Any upper limb (including shoulder) symptom in last 12mths
30.4% Pain, swelling or tingling in hands, in last 12mths
22.0% 34.8%
Pain or swelling in wrist, in last 12mths Hand or wrist in last 12mths
12.8% Pain, swelling or tingling in forearms, in last 12mths
12.9% 39.4%
Aches or pains in either elbow, in last 12mths Pain in shoulders, in last 12mths
47.2% Pain in neck, in last 12mths 55.5% Neck or shoulder in last 12mths
IOM previous study 36.6% 49% (55%)
9% (13%) 6% (8%) 6% (9%) 18% (22%)
Aches or pains in back, in last 12mths Any upper limb (including shoulder) symptom in last 3mths (ever) Wrist aches or pains in last 3mths (ever) Forearm aches or pains in last 3 months (ever) Elbow aches or pains in last 3 months (ever) Shoulder aches or pains in last 3 months (ever)
Faucett & Rempel, 1994 59% Muscle pain in last week Bernard et al 1994 83.7% Neck or upper limb symptom in past year Bergvist et al 1995a 59.6% Neck/shoulder discomfort in past year
40.7% 28.9%
Back discomfort in last year Arm/hand pain in past year
Jensen et al 1998 70% 54% 54% 52% 41%
Neck pain (12mth) Low back pain (12mth) Shoulder pain (12mth) Hand/wrist pain (12mth) Elbow pain (12mth)
Palmer et al 2001 16.4%(m) 21.2%(f) 12.3%(m) 17.5% (f) 14.8% (m) 22.9%(f) 13.8% (m) 18.3% (f) 10.6% (m) 15.1%(f) 7.9% (m) 11.0%(f) 6.0% (m) 4.6%(f) 5.8% (m) 4.9% (f)
Shoulder pain, last week Shoulder pain, last week, ‘other workers’ Neck pain, last week Neck pain, last week, ‘other workers’ Wrist/hand pain, last week Wrist/hand pain, last week, ‘other workers’ Elbow pain, last week Elbow pain, last week, ‘other workers’
Chiu et al 2002 58.9% Neck pain – in 12mths Korhonen et al, 2003 44% Neck pain >8d in 12mths Anderson et al, 2003 10.9% Tingling/numbness in hand at least 1x per
week over 3mths Brandt et al 2004 36%
21.5% Neck pain in last 7 days Shoulder pain in last 7 days
87

2004
STUDY PREVALENCES NOTES Woods 2005 86% MSD pain/discomfort in 12mths
73% MSD pain/discomfort in 12mths, mail sorters 58% Neck symptoms in 12mths 54% Lower back in 12mths 52% Right wrist/hand in 12mths 49% Left wrist/hand in 12mths 39% Right shoulder in 12mths 34% Left shoulder in 12mths
Rocha et al 2005 43% Neck/shoulder in 12mths 37% Wrist/hands in 12mths
De Krom et al, 1992 9.2% (f) 0.6% (m) CTS in general Dutch population. Tanaka et al, 1997 1.55% CTS (self report) in US working population Atroshi et al, 1999 14.4% (sym) 3.8% (clin. CTS in Swedish general population.
diag.) Papanicolaou et al, 2001 3.72% (minimum) CTS in general US population. Woods et al, 2002 65% Muscular aches, pains or discomfort in 12mths
INCIDENCES Gerr et al, 2002 1.9%, 2.8%, 3.6% and 4.1% 1,3,6 and 12mths, neck/shoulder symptoms
1.5%, 2.1%, 2.8% and 3.2% 1,3,6 and 12mths, neck/shoulder disorders 1.3%, 1.9%, 2.8% and 3.3% 1,3,6 and 12mths, hand/arm symptoms 1.0%, 1.4%, 2.0% and 2.5% 1,3,6 and 12mths, hand/arm disorders
Korhonen et al, 2003 13.3% 12mths, local neck pain 14.4% 12mths, radiating neck pain 6.7% 12mths, both
Kryger et al, 2003 1.3% (r), 0.4% (l) 12mths, forearm pain* Jensen, 2003 25.5% (f), 15.4% (m) 12mths, neck pain increase or onset*
21.6% (f), 12.5% (m) 12mths, hand-wrist symptoms increase or onset*
Andersen et al, 2003 5.5% 12mths, CTS symptoms increase or onset* Wahlström et al, 2004 36% Corrected 12mths neck pain Juul-Kristensen et al, 18%, 20% 12mths, shoulder symptoms frequency and
intensity (increase or onset*) 10%, 14% 12mths, elbow symptoms frequency and
intensity (increase or onset*) 23%, 22% 12mths, neck symptoms frequency and
intensity (increase or onset*) Macfarlane et al, 2000 8.3% 1 year, forearm pain in general UK population * not entirely symptom-free at baseline NB. Studies not indicating a reasonably comparable prevalence have been omitted (e.g. no timescale or point prevalence) or unreliable recruitment (e.g. adverts). NB. Jones et al (2005) report 448,000 with pain in the upper limbs or neck from 03/04 Labour Force Survey, representing 1.0% of those ever employed. 97,000 reported symptoms for the first time in the preceding 12 months. This represents an incidence of 0.31% of the population who were in employment at some time during that period. The equivalent figures for back symptoms were 468,000 (1.1%) and 74,000 (0.23%).
To facilitate comparisons with the published literature, in addition to the prevalences reported earlier for the current study, combined prevalences of hand/wrist and shoulder/neck symptoms were determined together with prevalences for more specific anatomical locations. Similarly, data on any upper limb symptom from the previous IOM study (Hanson et al, 1999) were supplemented by unpublished results for symptoms from individual anatomical sites
It will be seen that prevalences vary widely between studies, partly explicable by differences in the reference period used. For brevity, studies reporting point prevalences or where the reference period was not clear have been omitted.
88
Three studies, the current survey and those reported by Woods et al, (2002) and Woods (2005) reported on any MSD symptom in the last 12 months, including the lower limbs. The study by Woods et al (2002) reported a prevalence of 65% amongst questionnaire responders (although they also reported a prevalence of 85% amongst those directly interviewed. The study reported by Woods (2005) had an even higher prevalence (86%) than this or the current study, (72.8%). Over a shorter timescale, Faucett and Rempel (1994) reported 59% muscle pain over a one-week reference period.
The previous IOM study (Hanson et al, 1999) found that 49% of respondents reported any upper limb symptom in the preceding three months and 55% reported ever having such symptoms. This can be contrasted with the current study where 55% reported upper limb symptoms in the last year and the study of Bernard et al (1994) who reported 83.7% as having neck or upper limb symptoms within the same period.
These figures are those for symptoms which are necessarily self-reported. Therefore the strength of the studies against the evaluative criteria is of little relevance as the prevalence data precede any clinical or workplace examination (where relevant). However, it is noticeable that all of the papers cited above met the initial criterion of at least a 70% participation rate.
Not surprisingly, those studies incorporating clinical assessments and diagnoses reported lower prevalence levels. As a broad guide from various published studies, anything between 10-50% of those reporting symptoms would be found to have a diagnosable clinical condition (although the actual percentage can be even greater) with the proportion varying with the nature of the condition (which might in turn reflect the stringency of the diagnosis). As stated in section 6.3, although estimates vary widely (0.5%-22%), a broad guide would be an estimated prevalence of around 2% diagnosable conditions amongst DSE users.
Wrist/hand and neck/shoulder are commonly reported subdivisions. From the current study, 34.8% reported hand or wrist symptoms in a 12 month period which can be contrasted with Jensen et al (1998) reporting 52% and Rocha et al (2005) 37%, both across the same timescale. Woods (2005) reported values separately for the left and right hands over the same time period, although both values (49% and 52%) are higher than for the current study. Palmer et al (2001) reported lower values (10.6% / 15.1%) although these were reported separately for males and females, were only over a one week period and were restricted to regular keyboard users.
Turning to neck and shoulder symptoms, the value of 55.5% for the current study (12 months) can be compared to Bergvist et al (1995a) 59.6% and Rocha et al (2005) 43% over the same period.
Focussing on specific body parts, few studies other than the two IOM studies reported hand symptoms separately from those for the wrist. Several indicated elbow symptoms where the current study value of 12.9% (12mths) and the previous study values of 6% (3mth) and 9% (ever) can be compared to that of 41% from Jensen et al (1998) 54%, and Woods (2005) 39% right/34% left over a 12mth time period and Palmer et al (2002) 16.4%(m)/21.2%(f) and Brandt et al 2004, 21.5% both over a one week period.
Shoulder pain in the current study (55.5%) is higher than either of the previous IOM prevalences (18%, 3mnth; 22%, ever) and similar to the 12 month prevalence reported by Jensen et al (54%). It is also higher than the values cited by Woods (2005) although, as these are reported for the right (39%) and left (34%) shoulders separately, a direct comparison will depend upon how many of these have pain in just one shoulder. Other studies reporting symptoms over shorter timescales report markedly lower values.
89
The prevalence of neck pain of 47.2% in the present study is lower than Jensen et al (1998) (70%); Woods, (2005) (58%) or Chiu et al (2002) (58.9%) and only marginally higher than that for Korhonen et al (2003) of 44% where a prerequisite was pain for at least eight days. Studies such as Brandt et al (2004) 36% and Palmer et al (2001) 14.8%(m) and 21.2%(f) again only used a one week reference period.
Finally, a 12 month prevalence of back pain of 36.6% recorded in this study can be compared to those of 40.7% reported by Bergvist et al (1995a); 54% by Woods (2005) and 54% by Jensen et al (1998) all across a 12 month period.
Making sensible comparisons between all of these is difficult. As discussed previously, differences in the sample population, the manner of selection of the sample, the precise wording of the questions and the exact anatomical definitions/descriptions used will all contribute to inter-study variability. Add to this the differences in reference periods as indicated above and the ‘cocktail’ becomes even more complex. Care should therefore be exercised in making any comparisons between studies. Certainly, the prevalences of symptoms reported from this current study are not markedly outside the ranges identified in the literature and, if anything, those for neck and back pain appear slightly lower (and these are without any lower limits of frequency or severity).
A similar comment would seem to apply to wrist/hand symptoms whilst shoulder/neck (or shoulder symptoms separately) appear to be more comparable. The exception to these general views tends to be the data from Palmer et al (2001) which differs from the others reported in not being an occupationally derived sample. However, it also differs in having a shorter reference period and in restricting keyboard users to ‘regular’ use (at least four hours). This paper reported elevated Odds Ratios for symptoms amongst keyboard users than other workers with the exception of females reporting elbow pain where there was no difference. For men, the Odds Ratio relating to shoulder pain (OR = 1.4) was statistically significant. For females, those relating to neck pain (OR = 1.3) and wrist or hand pain (OR = 1.1) were significant.
The questions regarding upper limb symptoms in the present study were directly comparable to those asked in the earlier large-scale survey of symptoms carried out about 12 years previously (Hanson et al, 1999). Comparisons between the data collected in the present study and unpublished data from that earlier survey suggest that there has been an upward trend in reported symptoms for many parts of the upper limb over the intervening period. Direct comparisons of the 12 month data collected for this study with those reporting ever having had symptoms in the earlier study clearly show higher values throughout with the exception of the overall value for the upper limb (up to and including the shoulder). These results are not inconsistent as it could reflect individuals reporting more symptoms rather than more individuals reporting symptoms.
A current issue is the suggestion that initiatives such as health awareness campaigns appear initially to increase the incidence of the targeted health problem due to increased reporting. This would certainly apply to MSDs in general and ULDs in particular, where there have been a number of campaigns from a variety of government and other sources in the intervening period. However, whilst this might influence the level of voluntary (unprompted) reporting, it is less apparent why this should have such an effect on the responses to direct questioning. Nevertheless, the study of Woods et al (2002), where they reported a much higher prevalence of MSD symptoms amongst those directly questioned compared to those given a paper questionnaire (although the number questioned was relatively low), suggests that there can be differences in reporting depending upon the medium and manner used for questioning.
90

Parallels with this can be drawn with the finding from the present study for those completing the web-based version of the questionnaire to consistently report higher prevalences and incidences of symptoms than those who completed the paper version. It is possible that this reflects some form of (conscious or unconscious) bias in reporting using the different media although, as stated in section 9.2, this observation does not appear to have been reported in other studies. Although it is possible to formulate hypotheses about this, no firm explanation of this finding can be presented due, at least in part, to the presence of other confounding factors.
Although the methods used to recruit companies differed between the two IOM studies, both relied on those companies being willing to participate and there are no immediately apparent methodological differences which would suggest a systematic difference in the propensity to report symptoms between the two surveys.
10.2 MSD INCIDENCE DATA
Some of the papers cited also determined incidence rates, based upon longitudinal (prospective) studies. These include the extensive NUDATA and BIT studies from which multiple papers are cited. With the exception of those papers reporting from the BIT study (69% response rate) all nine papers reporting incidences had at least a 70% response rate. The NUDATA studies and that by Gerr et al (2002) also included a clinical examination. However, as only those who reported symptoms were offered a clinical assessment, none of the studies met the criterion of the (clinical) investigators being fully blinded to health status (although they might not have been aware of the actual symptoms reported). The workplace examination criterion is not relevant to this element.
Focussing on the one-year incidences, Gerr et al (2002) reported twelve month incidences for neck/shoulder and hand/arm symptoms and clinical disorders of 4.1%(s); 3.2%(d); 3.3%(s) and 2.5%(d) respectively. Korhonen et al (2003) reported a 12-month incidence of neck symptoms of 20%. In the first of the reported NUDATA studies, Kryger et al (2003) reported a one-year incidence of forearm symptoms of 1.3% (right) and 0.4% (left). Fewer than 10% of these qualified as clinical cases.
Jensen et al, (2003), in the first report from the BIT study, reported new incidence cases (12 months) separately for males and females of 15.4% v 25.5% (neck symptoms) and 12.5% v 21.6% (hand-wrist symptoms). As stated above, no clinical examinations were conducted.
Anderson et al (2003) reported on CTS symptoms and cases from the NUDATA study. Of those symptom free at baseline, 4.8% reported the onset of ‘mild’ symptoms after one year (incidence) with 1.1% reporting more frequent symptoms. If those with increased symptoms were included, the one-year incidence was 5.5%. However, when the clinical criterion of symptoms in the median nerve distribution was included the one-year incidence fell to 1.2%. Although included at baseline, the further clinical criterion of waking at night with symptoms was not included in the follow-up.
Wahlström et al (2004) reported on the incidence of new neck pain. Of their sample, 26.7% reported developing symptoms for the first time. Because of variations in the elapsed time between questionnaire administrations these results were normalised to yield an incidence rate of 36 new cases per 100 person-years.
Returning to the last of the BIT studies, Juul-Kristensen et al (2004) focussed on shoulder, elbow and back symptoms. Amongst those defined as non symptomatic at baseline, 12 month incidences for symptoms in these three body zones were 18%, 19% and 23% respectively for
91

increased frequency of symptoms and 20%, 14% and 22% for increased symptom severity. From these descriptors it will be appreciated that those classified as non-symptomatic were not necessarily fully asymptomatic at baseline. In fact, non-symptomatic subjects were those who reported fewer than eight days of symptoms within the preceding 12 months and who scored symptoms as less than four (on a scale of 0-9). No indication is given of the number of subjects who were genuinely symptom-free.
Finally, the two last NUDATA studies (Lassen et al, 2004 and Brandt et al 2004) looked at wrist/hand, elbow, shoulder and neck problems. The Lassen et al study differentiated between ‘any’ and ‘severe’ symptoms, recording one-year incidences of 21.0% (4.0%) for the wrist/hand and 14.1% (2.7%) for the elbow (any (severe)). Brandt et al did not differentiate by symptom severity reporting incidences of ‘symptom cases’ of 1.9% (shoulder) and 1.5% (neck) with approximately 15% of these (i.e. less than 0.3%) classified as clinical cases.
As with the prevalence studies these papers reveal considerable variation in 12-month incidences ranging from over 25% incident neck pain symptom cases from Wahlström et al and 21% wrist/hand symptom cases from Lassen et al with forearm symptom incidences of less than 2% from the NUDATA study. One curious phenomenon is that Lassen et al report NUDATA incidence values of 21% and 14.1% for the wrist/hand and elbow whilst, from the same study Kryger et al reported an incidence of 1.3% for the forearm. Differences in presentation between the two studies make it difficult to establish any explanation for this although it appears likely that differences in classifying cases and determining symptom status at baseline might account for at least some of the difference.
Finally, as before, the adoption of clinical case definitions, established by interview and/or examination, reduced the incidence values. In some papers this could be by around 25% although, in others, the reduction was more dramatic (e.g. 90%). As before, the stringency of case definitions might explain some of these differences although it probably reflects the likelihood that some areas of the upper hand are more likely to have symptoms which do not relate to any present clinical diagnoses (non-specific symptoms).
10.3 MSD RELATIONSHIP TO COMPUTER WORK
Section 5.5 of the literature review examined specific features of computer work stations to establish current evidence relating to individual risk factors. This evidence is discussed below. However, in reporting the prevalence of symptoms, a number of papers reviewed examined the variation of prevalence with overall exposure, either to computer work itself or, in some instances, differentiating between keyboard computer work or mouse computer work. Here, the evaluative criteria applied to the papers become of greater potential importance in establishing whether ‘exposure’ was determined by self-report or whether there was any more objective element. It is well recognised that individuals have a general tendency to overestimate the time spent on particular activities and that appears to be reinforced by those papers which compared actual with estimated exposures (e.g. Bernard et al, 1994). What is particularly interesting is the fact that the same paper reported that the accuracy of estimates did not appear to vary with case status. It is a commonly held view that those with symptoms are more likely to be aware of activities which they perceive as provoking them and therefore more likely to provide higher estimates. This paper does not support that view.
Few papers scored a total of 4 on the NIOSH evaluative criteria. Only the work reported by Bergquist et al (1995b) and, partially, that by Hales et al (1994) did so. The latter had quantitative data on number of keystrokes for one sub-category within their sample. The study by Bergquist et al did not identify any significant difference in the occurrence of muscle
92
problems between VDT users and non-users in general, although data entry work was associated with neck/ shoulder discomfort. However, if this was a genuine causal relationship a stronger association would be expected with more extensive VDT use amongst this group and with more severe symptoms. In neither case did any significant relationship emerge. Care should be taken in attributing a greater ‘value’ to this finding because of the apparently more objective assessment. Although this study did involve an independent assessment of workplace variables this did not extend to observing work activities and the data on the extent of computer use was self-reported. Similarly, in the study by Hales et al, variations in numbers of keystrokes performed failed to show any relationship with the incidence of upper limb disorders although the authors comment that the subgroup for which these data were available, had what seemed to be a relatively low typing workload.
If the investigation focuses on musculoskeletal symptoms rather than clinically diagnosed disorders then the physical examination criterion becomes redundant. On this basis, studies such as that by Demure et al (2000) become more significant. As with the study of Bergquist et al (1995b) in this study the workplace factors but not work activity factors were independently assessed. This study showed a distinct exposure-response relationship between hours of daily VDU use and wrist/ hand symptoms and a less strong relationship for such use and neck/shoulder problems.
One study which used both subjective and objective data for selected work exposure variables was that reported by Lassen et al (2005). Here, some objective indication of computer activity was derived from the software package installed as referred to earlier. In this study, neither the objective nor subjective data showed any consistent effect attributable to exposure to either keyboard or mouse use although the main focus was on persistence of pain.
These findings are in contrast to earlier reports by the same team (Lassen et al, 2004; Brandt et al 2004) using just self-reported exposure data. In these papers, exposure-response relationships were identified associating increased mouse use (self-report) with self-reported symptoms in the wrist/hand; elbow; shoulder; and neck although the level of use attaining significance varied between the anatomical locations. Keyboard usage did not produce any similarly consistent effects although there were some isolated significant responses. The objective (clinical) diagnoses obtained as part of the NUDATA study did not show any consistent relationship with either mouse or keyboard use according to Lassen et al (wrist/hand and elbow). However, Brandt et al (2004) reported an exposure-response relationship between diagnosed ‘tension neck’ and mouse use. Unfortunately, although the later paper by Lassen et al (2005) tabulates self-report and objectively measured mouse and keyboard usage (which shows the expected general over-reporting) no formal comparisons of these data sets between those with or without symptoms is reported.
Trying to draw overall conclusions from the collected studies is not straightforward. Very few met the NIOSH ‘gold standard’ and even these did not necessarily include objective assessment of all work variables. The finding of Bernard et al (1994) that those with or without symptoms did not systematically differ in their reporting of workplace exposure factors might be critical here. If that finding can be generalised to other studies it means that, even if they cannot be used to establish cut-off criteria (e.g. mouse work for more than X hours per week), the findings of exposure-response relationships in themselves are likely to be more robust. This is particularly important, for example, for the various NUDATA studies where not all of the papers relied on self-reported symptoms.
Two UK-based studies (Palmer et al, 2001; Woods, 2005) compared computer users with other occupational groups. The first of these reported excesses of symptoms amongst computer users although prevalence ratios were relatively low and not always significant for all body parts.
93

The second reported excesses amongst computer users for most body parts with generally higher odds ratios than those presented by Palmer et al. However, neither scored at all well against the evaluative criteria and, particularly in the case of the second paper, it cannot be assumed that those not using computers were not exposed to other risk factors potentially associated with upper limb disorders.
Earlier reviews cited above concluded that, on balance, most papers reported a significant risk associated with computer work, with odds ratios generally greater than 2.0. The majority of papers reviewed here which report odds ratios (or for which one can be calculated from the reported data) do show significantly elevated risks associated with computer work in general or specifically with either mouse or keyboard work. The extent of any risk is often lower than 2.0, although that in part reflects the detail of the studies.
For example, Anderson et al (2003) report an odds ratio of 1.8 with more than ten hours mouse use. At more than 15 hours the odds ratio rises to 2.8. The emergence of exposure-response relationships in a number of these papers is a significant advance. Whilst acknowledging the shortcomings in the use of self-reported data, studies such as that of Anderson et al (2003) cited above, which continues to demonstrate an exposure-response curve with new incident cases using a mouse, provide convincing evidence for a genuine effect which is possibly causal. Even if the likely over-reporting of the extent of usage makes determining the duration of use problematic, the evidence that those with symptoms did not tend to disproportionately estimate usage reinforces this finding.
In essence, it would appear that increasing use of a computer, whether predominantly keyboard or mouse-based usage, is significantly associated with an increased tendency to report musculoskeletal symptoms. Evidence as to whether this increase indicates a causal relationship is not entirely clear. Although a number of prospective studies have been published many of them did not select completely symptom-free subjects for their baseline sample (although it could be argued that fewer than eight days of symptoms in a 12 month period is a relatively low baseline). Of those which did, not all attempted to relate incidence data to any exposure parameters. As a further complication, those who were considered to be symptom-free were only free of symptoms for that anatomical location.
What data there are from such studies reinforce the view that computer-use is related to symptoms and that increasing use is generally significantly associated with new or more severe symptoms. The few papers which did select genuinely symptom-free subjects for follow-up do appear to indicate that this association may actually be causal although the level of usage required for a significant effect to emerge appears to be very high.
One feature of interest to emerge is that, where studies differentiate computer usage by type of input device (keyboard or mouse) then mouse use appears to present more risk of symptoms (caused or exacerbated) at lower rates of use for mice than keyboards. For keyboard use, odds ratios are generally moderate (< 2.0) and are associated with more than about 20 hours use a week. For the mouse, the risks can be markedly higher (with several papers reporting odds ratios in excess of 4.0) and a doubling of risk is probably associated with around ten hours of mouse use a week. These estimates are necessarily vague as they vary with the anatomical site of any symptoms.
94

10.4 MSD EVIDENCE ON CAUSAL FACTORS
10.4.1 General comments
Section 10.3 summarised data which suggests that there is a probable relationship between at least some musculoskeletal symptoms and computer work. It also suggested that work using a mouse presented a greater risk, with significantly increased odds ratios associated with shorter periods of use. This section examines the epidemiological evidence relating to exposure to specific work characteristics associated with computer work and identifies any clear evidence regarding this. The NIOSH review (Bernard op cit) also included a review of supporting scientific literature which could be considered to provide evidence of ‘biological plausibility’ (possibly indicating a review of supporting a causal mechanism). However such evidence is beyond the scope of this review and, although it is known that some such material exists (e.g. that relating to the elevation of carpal tunnel pressure published by Rempel (1995)), this work will not be discussed further.
It can be anticipated that, where physical workplace factors are involved, those presenting a possible risk of injury to the hand and wrist are likely to be different to those affecting the neck or low back. In addition, hand/wrist and shoulder/neck appeared to be a segregation adopted by many of the papers in the literature. Consequently, these categories will be examined and reported separately below.
A number of papers did not differentiate between the sites of any musculoskeletal symptoms and these will again form a separate section of the review. As the purpose of the review was to assess the evidence for the contribution to symptoms of specific work factors, papers such as that by Jensen et al (1998), which reported exposures without carrying out any statistical analyses for possible associations with symptoms, have not been included.
Several general comments can be made regarding the epidemiological evidence reviewed. Firstly, comparisons between papers are complicated by a lack of standardisation over the variables assessed. This is particularly marked for physical workplace factors but also true, to a lesser extent, for psychosocial factors. Following on from this, it is apparent that there are few workplace factors which consistently emerge as significant influences across a number of papers. In some instances, factors which do appear to display a significant relationship with symptoms do so in a counter-intuitive manner. When such relationships emerge from multi-factorial analyses it is possible to dismiss these as artefacts of the statistical process although this leads to concern that only those results which do not fit into preconceived models are dismissed in this manner.
Ideally, a review such as this should permit the combination of study results, strengthening the evidence from isolated studies. However, with little comparability between assessed variables and only limited consistency in result, this is seldom possible with the assembled ‘database’.
Many of the published studies are cross-sectional. As a result it is not possible to differentiate between causation and provocation of symptoms in individual studies. One positive aspect of the review is the publication in recent years of results from a number of prospective studies. Even here however, the value is diluted because, in several instances, those selected for longitudinal study are not completely symptom-free at baseline. Although symptoms might be exacerbated there is clearly a considerable distinction to be made between this and causation.
95

10.4.2 General musculoskeletal symptoms
Given the widespread range of symptoms and anatomical locations covered by those papers which did not differentiate between different body parts it is perhaps not surprising that no physical risk factors emerged with any consistency from these studies. Although one paper (Ortiz-Hernandez et al, 2003) did report some modest increases in risk, the factors elevated were not mirrored in any of the other general papers and these findings remain isolated.
Psychosocial factors were more frequently reported upon as having significant associations with symptoms. Differences between the questions asked and the statistical treatments used make it hard to formulate specific comparisons. However, two papers (Ortiz-Hernandez et al 2003, and Woods 2005) both report findings suggestive of a relationship between the extent of personal control over work and the reporting of symptoms. Both also appear to report findings implicating support at work although, in this case, the effects would seem to be contradictory in that Woods reported that those with symptoms are more likely to report a lack of help when time was limited whilst Ortiz-Hernandez et al identified a significant elevation in risk of upper extremity symptoms amongst those scoring more highly with support. In either instance, differences between how questions are presented might invalidate any comparison. It is not therefore possible to discount the latter anomaly without the same argument being applied to the former agreement.
10.4.3 Carpal Tunnel Syndrome
There were two papers identified which specifically addressed CTS risks and computer work, one of which was primarily focussed on devising a predictive model. There was no overlap between the two papers in the physical workplace factors identified although wrist extension and deviation (Matias et al, 1998) and abnormal mouse or keyboard position (Andersen et al, 2003) could be regarded as surrogates for each other. Both papers included psychosocial risk factors, although different parameters and measurement instruments were used. Matias et al (1998) used the Hackman and Oldham Job Diagnostic Survey to give measures of job satisfaction. The authors do not specify the subscales used (skill variety; task identify; task significance; autonomy; and feedback) but none entered the regression model devised. In contrast, Andersen et al (2003), using questions based upon the Karasek job control model (Karasek et al, 1985) found high demands; low control; and low social support to all be significantly associated with CTS symptom suffers.
It must be concluded on the basis of this very limited data set that there is no consistent evidence to associate CTS with computer work.
10.4.4 Hand, forearm and elbow disorders
CTS was the only specific named diagnosis studied in relation to computer work. However, there were a large number of papers relating various symptoms in the forearm (in some instances with clinical diagnoses) to computer work. The results from these papers are frequently apparently inexplicable or contradictory. For example, it is not clear how ‘excessive knee bending’ influences upper hand symptoms (Ortiz-Hernandez et al, 2003) and why using arm support for a keyboard for less than 50% of the time should lead to a significant risk but not either not having any support at all or using it for more than 50% of the time. If such support was beneficial then not having one at all should result in an elevated risk whilst, if it is an adverse characteristic, a greater association would be expected with a longer duration of use. If assumptions are made regarding comparability of the variables analysed in different papers than some tentative relationships can be identified. Thus, ‘bent or twisted hands’ (OR = 1.95); ‘hands in non-neutral position’ (OR = 3.8); and ‘poor keyboard position’ (OR = 2.79) would
96

seem to suggest a degree of consistency. However, other studies (including that by Faucett and Rempel (1994) where wrist angles were measured) failed to demonstrate any such effect.
The widespread belief that psychosocial factors are potential contributory factors to the incidence of upper limb symptoms is reflected in the fact that most of the papers cited included both physical and psychosocial variables. As with the physical factors some results were counter-intuitive (e.g. the positive association between risk of symptoms and social support reported by Ortiz-Hernandez et al, 2003) or seemingly contradictory (such as medium-high and medium-low influence at work significantly elevating risk but not either high or low influence as reported by Jensen 2003). Where there is apparent consistency between papers it is usually because they are derived from the same study population and baseline data.
Clearly, the quality of the studies and reliance which can be placed upon the various sets of findings varies considerably. Amongst the better quality are those derived from the so-called NUDATA cohort where prospective studies of subjects symptom-free at baseline are reported. Even in this series however there is a certain lack of consistency in that, whilst Lassen et al (2004) specifically studied those who were initially genuinely symptom-free, the parallel paper by Kryger et al (op cit) includes those with relatively minor pain at baseline in their follow-up group. The psychosocial workplace factors do not present a consistent pattern at follow-up in these studies. Thus both high demands and time pressure are significantly associated with new forearm pain at follow-up, at least in the initial model; although time pressure narrowly misses significance in the final combined model (Kryger et al, op cit). However, high demands but not time pressure is associated with follow-up elbow pain and neither are associated with wrist/hand pain (Lassen et al, 2004). It is difficult to conceive of an explanatory mechanism which could account for these differences as they cannot be associated for by variations in data collection methodology.
It is clear from all the papers reviewed that there is no strong evidence for which specific physical or psychosocial workplace factors associated with computer work might cause or provoke symptoms of hand, forearm and elbow disorders. Individual studies have produced isolated significant factors, most of which are consistent with expectations. However, the emergence of a number of counter-intuitive findings must cast doubt on at least some of these factors as it is difficult to argue that one particular result is spurious without undermining confidence in those remaining.
10.4.5 Neck and shoulder symptoms
The results from studies of neck and shoulder symptoms or disorders follow a broadly similar pattern to those of more distal upper limb symptoms. Thus, cross-sectional studies appear to identify more contributory factors than prospective studies (presumably provoking symptoms rather than causation) and studies identify isolated factors which are not consistently reflected across different studies. Whilst this might be partly accounted for by methodological differences this cannot be argued with any confidence as being the main explanation. Once again, inconsistent or counter-intuitive findings undermine confidence in any overall pattern. For example, if job strain is genuinely a casual factor, why should ‘medium’ but not ‘high’ exposure elevate the risk of symptoms (Wahlström et al, 2004)?
10.4.6 Back symptoms
The relative absence of studies on back symptoms specifically related to computer work was disappointing with no substantive findings to report.
97

10.5 MSD GENERAL COMMENTS
Section 5.2 to this report summarised evidence which appeared to suggest a relationship between at least some musculoskeletal symptoms and computer work. Whether this relates to causing problems or provoking symptoms is not entirely clear although the evidence does appear to tend towards a causal relationship. What is clear from the evidence discussed in section 5.5 is that there are no factors relating to such work which could consistently account for this relationship. Despite a number of sometimes quite substantial prospective studies, together with several large-scale cross-sectional investigations, no consistent physical or psychosocial factors can be identified from the literature.
A number of explanations can be tentatively put forward to account for this. The first is that the apparent relationships are spurious and that there is no relationship. That this argument would have to be applied even to the suggestion that computer work provokes symptoms of pre-existing conditions tends to undermine this – as does the sheer number of studies which have shown an apparent effect which would have to be discarded.
The next option is that, if you have a muscle (or other body constituent) which is sore for any reason, simply using that body part will provoke symptoms and using it more will provoke more symptoms (or make the symptoms worse). This argument is intuitively sound and probably does account for a proportion of the relationships reported by individuals. However, there is no doubt that how a body part is used does affect the loading on it (as shown by the studies of carpal tunnel pressure) and it is not unreasonable to expect those differences to be reflected in differences in the levels of symptoms experienced. On this basis, how you carry out your work would be expected to make a difference.
Experience has shown that, in individual cases, seemingly minor alterations to workplace layout or working practices can have a marked impact on the level of symptoms experienced. This raises the possibility that surveys of the nature of most of those reported are not sufficiently sensitive and that any failure to identify effects arises from the failure on the part of the researchers to measure or assess workplace variables adequately rather than from the genuine absence of any effect.
Alternatively, the possibility must be considered, as suggested in section 5.5.1, that any adverse effects of work at a computer workstation arise, not from individual deficiencies in workplace factors or working posture but from the relatively immobile nature of the work. Postures which place more loading onto specific muscles or other structures might accelerate that process and structures already experiencing symptoms will be less tolerant of such loading. This could explain observed relationships. However, the role of posture and work place factors would be secondary and therefore less likely to emerge in any analysis. This could account for the observed trends in the current (and other) surveys for time spent at the computer and periods of work without a proper break to be amongst the strongest influences on the prevalence of symptoms.
In essence, the collected body of evidence provides a reasonably strong indication that there is a relationship between the length of time spent using a computer and the prevalence of reported symptoms of MSDs. There is less strong but nevertheless some evidence to suggest that this relationship could be causal. However, there are no clear indications of what it is about that work which results in this relationship. The possibility cannot therefore be excluded that it is somehow intrinsic to the work and that, for example, gripping and using a mouse for several hours will provoke symptoms whatever the design of the mouse; wherever you position it; and however you use it. Some insight into this and the other possibilities outlined above could perhaps be gleaned from a careful study of the background scientific material such as examining
98

the detailed influence of mouse hand posture and mouse use on carpal tunnel pressure or comparing the resultant strain on finger tension (perhaps using MRI technology here to identify localised inflammation at a pre-clinical stage).
The logical corollary to the apparent exposure-response relationship is that reducing time spent using a computer would reduce the prevalence of symptoms, especially amongst those with longer hours of use. The finding from the present study, that the prevalence of symptoms was higher amongst those reportedly working for longer periods without a break, suggests that more rigorous implementation of the provision for breaks within the DSE Regulations might be beneficial.
10.6 VISUAL PROBLEMS
Reported prevalences and incidences of visual problems and headaches from the present study and the published literature are given in Table 10.2.
Table 10.2 Reported prevalences of visual problems and headaches (amongst DSE users unless indicated otherwise).
STUDY PREVALENCE NOTES Headaches: IOM current study 52.3% In last 12mths Faucett & Rempel, 1994 27% In last week Woods et al, 2002 46% In last 12mths Woods 2005 30% In last 12mths
12% Mail sorters (non-VDU) in last 12 mths
Leiper et al 2006 38% - 68% population data reported from literature
Visual symptoms: IOM current study 57.6% In last 12mths Bergdahl et al, 1994 39% Various eye problems amongst
‘VDU ill people’ Faucett & Rempel 1994 38% Eyestrain in last week Woods et al, 2002 59% Tired eyes, in last 12mths Woods, 2005 47%(VDU) 23% (non-VDU) In last 12mths
23% Mail sorters (non-VDU) in last 12 mths
Iwakiri et al 2004 72.1% Eyestrain and/or pain, abstract only
NB. Jones et al (2005) report 37,000 with headaches and/or eyestrain from 03/04 Labour Force Survey (compared with 53,000 in 01/02). Projections based on 73 cases and represent fewer than 3% of those questioned who reported a work-related illness.
Compared to MSDs, fewer studies have considered either visual symptoms or headaches. The prevalence of headaches in the current study is higher than that reported by either Faucett and Rempel 1994 (one week) or Woods (one year) although it is almost exactly mid-way within the range quoted as population data by Leiper et al (2006) and only slightly higher than the levels reported by Woods et al, (2002).
For visual symptoms, the 12 month prevalence from the current study of 57.6% is higher than others reported with the exception of Woods et al (2002) (marginally lower) and Iwakiri et al 2004 (72.1%). This latter paper, written in Japanese, has been examined in abstract only and it is not clear what reference timescale was used. Both values are far higher than the crude estimate from the most recent Labour Force Survey of less than 3%. This value is not a true
99
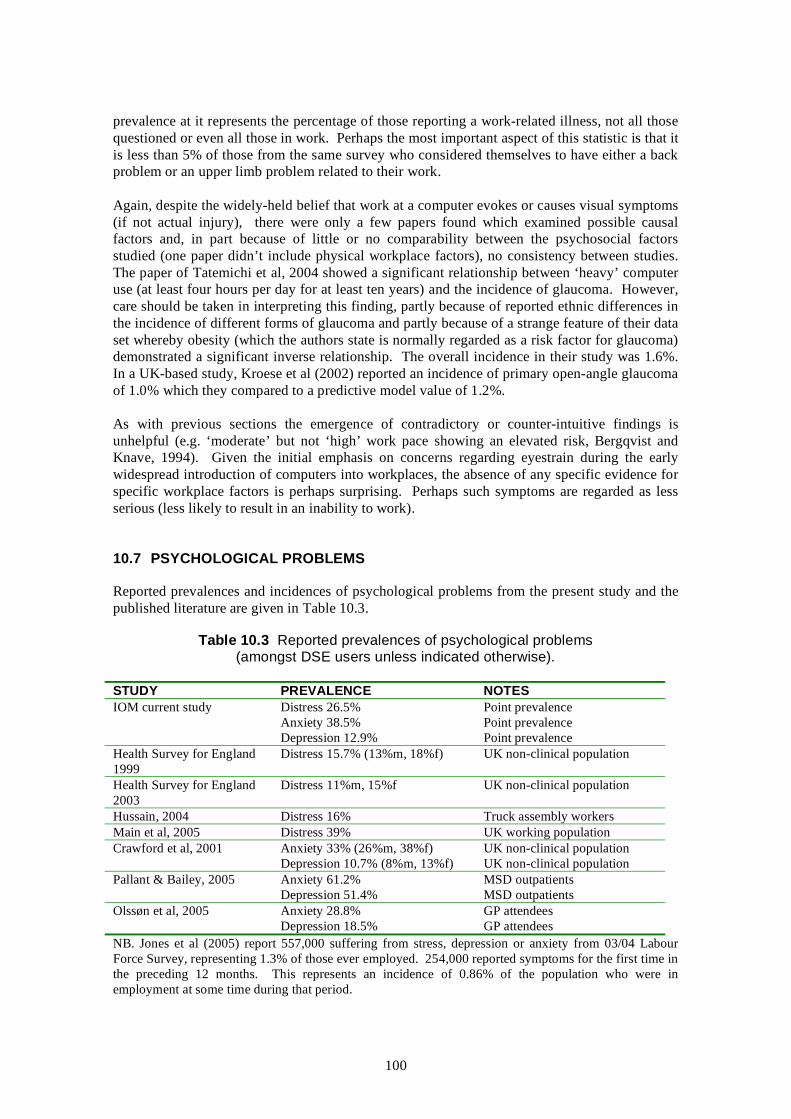
prevalence at it represents the percentage of those reporting a work-related illness, not all those questioned or even all those in work. Perhaps the most important aspect of this statistic is that it is less than 5% of those from the same survey who considered themselves to have either a back problem or an upper limb problem related to their work.
Again, despite the widely-held belief that work at a computer evokes or causes visual symptoms (if not actual injury), there were only a few papers found which examined possible causal factors and, in part because of little or no comparability between the psychosocial factors studied (one paper didn’t include physical workplace factors), no consistency between studies. The paper of Tatemichi et al, 2004 showed a significant relationship between ‘heavy’ computer use (at least four hours per day for at least ten years) and the incidence of glaucoma. However, care should be taken in interpreting this finding, partly because of reported ethnic differences in the incidence of different forms of glaucoma and partly because of a strange feature of their data set whereby obesity (which the authors state is normally regarded as a risk factor for glaucoma) demonstrated a significant inverse relationship. The overall incidence in their study was 1.6%. In a UK-based study, Kroese et al (2002) reported an incidence of primary open-angle glaucoma of 1.0% which they compared to a predictive model value of 1.2%.
As with previous sections the emergence of contradictory or counter-intuitive findings is unhelpful (e.g. ‘moderate’ but not ‘high’ work pace showing an elevated risk, Bergqvist and Knave, 1994). Given the initial emphasis on concerns regarding eyestrain during the early widespread introduction of computers into workplaces, the absence of any specific evidence for specific workplace factors is perhaps surprising. Perhaps such symptoms are regarded as less serious (less likely to result in an inability to work).
10.7 PSYCHOLOGICAL PROBLEMS
Reported prevalences and incidences of psychological problems from the present study and the published literature are given in Table 10.3.
Table 10.3 Reported prevalences of psychological problems (amongst DSE users unless indicated otherwise).
STUDY PREVALENCE NOTES IOM current study Distress 26.5% Point prevalence
Anxiety 38.5% Point prevalence Depression 12.9% Point prevalence
Health Survey for England Distress 15.7% (13%m, 18%f) UK non-clinical population 1999 Health Survey for England Distress 11%m, 15%f UK non-clinical population 2003 Hussain, 2004 Distress 16% Truck assembly workers Main et al, 2005 Distress 39% UK working population Crawford et al, 2001 Anxiety 33% (26%m, 38%f) UK non-clinical population
Depression 10.7% (8%m, 13%f) UK non-clinical population Pallant & Bailey, 2005 Anxiety 61.2% MSD outpatients
Depression 51.4% MSD outpatients Olssøn et al, 2005 Anxiety 28.8% GP attendees
Depression 18.5% GP attendees NB. Jones et al (2005) report 557,000 suffering from stress, depression or anxiety from 03/04 Labour Force Survey, representing 1.3% of those ever employed. 254,000 reported symptoms for the first time in the preceding 12 months. This represents an incidence of 0.86% of the population who were in employment at some time during that period.
100

The use of question sets from published psychological questionnaires allows the direct comparison between the findings from the current survey and published data. The GHQ-12 questionnaire generates a parameter described as ‘distress’, usually said to be indicated when a respondent records four or more positive responses to the 12 questions asked (although some instances of a different cut-off were identified). The reported prevalence of distress is markedly higher than that recorded from a major UK survey (Health Survey for England, 1999), which has itself declined in a more recent repeat of the survey (Health Survey for England 2003) and higher than the value from one workplace survey (Hussain, 2004) although lower than another workplace-based survey (Main et al, 2005).
As might be expected from the full title (Hospital Anxiety and Depression Scale) the HADS questionnaire yields two subscales: anxiety and depression. As with the GHQ12 results, the values obtained in the present study for these two subscales are higher than published values from a general non-clinical survey (Crawford et al, 2001) although the differences are relatively small. Two other sets of survey values make interesting comparisons. The values from MSD outpatient clinic attendees (Pallant & Bailey, 2005) are substantially higher than those obtained from the present study. In contrast, GP attendees appear to be generally less anxious but more depressed (Olssøn et al, 2005).
No studies of causal factors, specifically relating to computer users, were identified from the published literature (as opposed to those studies where psychosocial factors were studied as explanatory variables for musculoskeletal symptoms). Psychological problems such as distress, anxiety and depression are almost certainly inextricably linked by many to the issue of work-related stress and, given the multifactorial nature of this issue and the current emphasis on organisational and other workplace factors (as exemplified by the HSE Management Standards), it is perhaps not surprising that computer use itself has not been a subject for particular attention.
101

102
11 CONCLUSIONS AND RECOMMENDATIONS
Part of this study involved a survey of ill-health amongst computer users in a variety of companies. One disappointing aspect of this was the relatively low response rate from those organisations invited to take part, particularly amongst the private sector and medium-sized employers. Because of this low level of involvement care must be taken in extrapolating the findings to the UK population in general. Although no systematic evaluation of non-participation was carried out, informal enquiries and comments received back from contacts suggested a general reluctance to participate in questionnaire surveys (stated as company policy on a number of occasions) and concerns about the time required. However, as the latter response was often given without the respondent actually seeing the questionnaire, it is unclear how much reliance can be placed on this. The positive corollary to this was that, once organisations had agreed to take part, the overall response rate from individual employees was reasonably high, comparing favourably with other recent UK-based surveys. This gives some reason to believe that the findings are reasonably representative of the organisations who took part.
In common with a number of other large-scale surveys in the literature, the survey was based entirely on self-reported data (although the use of standardised psychological questionnaires mitigated the effect of this to some extent). Original plans to include a clinical examination of a sub-sample of respondents, which would have given some insight into the relationship between self-reported symptoms and diagnosable disorders, unfortunately had to be shelved.
Individually, there have been some very thorough and scientifically sound studies published in recent years on ill-health (particularly MSDs) amongst computer users (including a number where self-reported symptoms have been followed up by clinical investigations). Unfortunately, generating any form of synthesis from these is hindered by a lack of consistency of approach, particularly in defining and measuring workplace factors. This is undoubtedly unhelpful in trying to elucidate common ground amongst the myriad of potential causal factors.
While therefore some caution is advisable in interpreting the findings of this research project, the following conclusions and recommendations are put forward:
1. In the present study, 1327 individual computer users, representing an estimated response rate of approximately 40-45% from participating companies, returned a questionnaire. Of these, 73% reported one or more musculoskeletal symptom. These recorded prevalences of self-reported MSD symptoms are broadly similar to those reported for users in the published scientific literature, although differences in survey design make accurate comparisons difficult. The recorded prevalences of such symptoms are also broadly similar to those determined in an earlier IOM survey of computer users using the same question set. Certainly they are not noticeably lower. The two IOM surveys span the period of currency of the Health and Safety (Display Screen Equipment) Regulations 1992 suggesting that these have not had a major impact on prevalence of reported MSD symptoms amongst computer users. However, although not formally explored, there are signs in the questionnaire responses (for example in the 34% reportedly not receiving any information and training) that implementation of the DSE Regulations might be incomplete. Care should therefore be taken in making judgements based on this self-reported information. Further support for this concern can be derived from the fact that 28% of respondents reported typically working for more than two hours without a break with a further 36% indicating typically working for 1-2 hours without a break (contrary to the guidance to the DSE regulations). Although the survey did not examine their
103

understanding of what constituted a break from DSE work this still gives some cause for concern, particularly because the survey results showed that the prevalences of MSD symptoms were higher among those who reported working for more than one hour without a break.
• The DSE Regulations provide the regulatory framework for controlling risks of MSDs amongst computer users. Given the above possibilities it is recommended that there is further work to examine the current implementation and consequent effectiveness of the DSE Regulations.
• As a specific example of this, most symptoms (not just MSD symptoms) were positively associated with reportedly working for more than an hour without a break. Although the self-report nature of this data warrants caution this could imply that the guidance given to the DSE Regulations is not being followed. It further suggests that, if breaks were taken more frequently, some reduction in the prevalence of symptoms might be expected. It is recommended that this specific issue should be explored further.
2. The prevalences of MSD symptoms were higher among those who reported spending more time at their computer at work. It is not known (and was not within the scope of this study) to what extent similar findings would be obtained from studies of other, largely sedentary, workplaces. The finding is consistent with the scientific literature which shows a reasonably strong exposure-response relationship between computer work and symptoms. Although the evidence is less strong, the literature also includes a number of prospective studies which suggest that this relationship is possibly causal. For keyboard use, odds ratios are generally moderate (< 2.0) and are associated with more than approximately 20 hours use a week. For use of the mouse, the risks can be markedly higher (with several papers reporting odds ratios in excess of 4.0) and, although the exact relationship is unclear, the literature suggests that a doubling of risk is probably associated with an estimated ten hours of mouse use a week.
• It is recommended that the implications of this finding for the guidance given in respect of jobs involving intensive mouse use should be explored further.
3. However, the literature does not allow any clear assessments of which specific aspects of computer work or workstation design result in the observed relationship between computer work and MSD symptoms. Although individual studies have tended to identify specific issues there is little or no consistency between studies, although that is due in part to a lack of comparability between study designs and the explanatory variables examined. The possibility must be considered that the exposure-response relationships between computer work and MSD symptoms which have been identified in this and other studies are not primarily due to any specific deficiencies in workplace design or use but stem from some other factor such as the intrinsic lack of movement which is often a feature of computer-based work. It can be hypothesised that poor workplace posture would not be irrelevant but would be a secondary influence, potentiating any effect of so-called ‘postural fixity’.
• It is recommended that the scientific literature on muscle physiology etc. is examined to establish whether the concept of ‘postural fixity’ provides a plausible mechanism to explain the apparent exposure-response curve between time spent working at a keyboard (particularly without a break) and the incidence of MSD symptoms.
104
4. In the present study, 52% of respondents reported experiencing headaches. This prevalence is broadly similar to that reported for the general population in the published scientific literature. However, no literature on headaches and computer use was identified in the published literature examined. As with MSD symptoms, the prevalence of headaches was higher in the present study among those who reported spending more time at their computer. Unlike MSD symptoms this related both to work use and total use (work and home). Headaches were also associated with reportedly working at their computer for more than one hour without a break.
5. In the present study, 58% of respondents reported experiencing eye discomfort. Although there is little published prevalence data on visual problems the recorded prevalence of eye discomfort is broadly similar to population data reported in the published scientific literature. Again, the prevalence of eye discomfort was related to both work and work plus home computer usage and to reportedly working more than one hour without a break. One paper in the literature reported on apparent associations between display screen characteristics (such as inability to adjust the brightness and contrast) and visual symptoms. However, the characteristics were only present in a very small proportion of those studied (in 1990) and the proportion is likely to be even lower in modern offices. Other papers reported on observed associations between visual symptoms and psychosocial factors although the lack of comparability between studies in the parameters studied makes specific conclusions and recommendations difficult.
6. In DSE work, symptoms such as eyestrain and headaches, although acknowledged, tend to have less emphasis placed on them than MSD symptoms. The results show that the prevalence of such symptoms is high although, as it is no higher than population data suggest, possibly unrelated to the nature of the work. Absolute levels of absence from work related to headaches (18% taking some time off) and eye discomfort (12%) appear to be similar to those due to MSD symptoms (19.8%). The extent of time off work taken for headaches and eye problems does not appear to differ markedly from the pattern for upper limb symptoms (although back and neck pain absence appears to be higher).
• It is recommended that, with the reported relationships in this study between the extent of computer use and headaches and visual symptoms; and because of the comparatively low emphasis on such symptoms in workplace health campaigns compared to MSDs; some attention should be paid to exploring the scope for reducing these as a cause of absence from work, possibly by better implementation of breaks.
7. Amongst the respondents to the present study, 27% were classified as suffering from ‘distress’ (based on a score of 4 or more on the GHQ12 scale); 39% classified with anxiety and 13% depression (using standard scoring for the HADS). This level of ‘distress’ is higher than UK population data but intermediate compared to two other UK workplace-based studies of computer users. Recorded levels of anxiety and depression were slightly higher than UK non-clinical population data although the differences were not particularly marked.
8. There was no material from the literature surveyed which specifically examined characteristics of computer work for any associations (causal or otherwise) with indices of stress such as those studied here. In the present study, the three psychological scales showed stronger associations with all computer use (work plus home) than with work use alone. In addition, distress and depression (but not anxiety) showed associations with long work periods without a break and with working extra hours (beyond those contracted) but not long contracted hours of work.
105

• These findings have potential implications in relation to the implementation of the Working Time Directive and it is recommended that the wider issue of stress and computer-based work should be explored further within this context.
9. Finally, with the increasing trend towards evidence-based guidelines and the formal evaluation of intervention, workplace questionnaires are likely to continue to be an important tool. The advent of email and the internet offers the possibility of adopting this new technology to facilitate such studies. However, current interpretations of the Data Protection Act hinder such approaches.
• It is recommended that this and other aspects of using new technology as an aid to workplace surveys are explored to facilitate future studies.
106

REFERENCES
Agius RM, Lloyd MH, Campbell SJ, Graveling RA, Hutchison PA, Muirhead M, Gurr D, Soutar CA. (1988) Epidemiological and clinical studies of back pain in the mining industry. Edinburgh: Institute of Occupational Medicine, (IOM Report TM/88/10).
Andersen JH, Thomsen JF, Overgaard E, Lassen CF, Brandt LPA, Vilstrup I, Kryger AI, Mikkelsen S. (2004) Computer use and carpal tunnel syndrome: a 1-year follow-up study. Journal of the American Medical Association; 289: 2963-2969.
Atroshi I, Gummesson C, Johnsson R, Ornstein E, Ranstam J, Rosen I. (1999) Prevalence of carpal tunnel syndrome in a general population. Journal of the American Medical Association; 282: 153-58.
Bergdahl J, Anneroth G, Stenman E. (1994) Description of persons with symptoms presumed to be caused by electricity or visual display units – oral aspects. (1994) Scandinavian Journal of Dental Research; 102: 41-45
Bergqvist U, Wolgast E, Nilsson B, Voss M. (1995a) The influence of VDT work on musculoskeletal disorders. Ergonomics; 38: 754-762.
Bergqvist U, Wolgast E, Nilsson B, Voss M. (1995b) Musculoskeletal disorders among visual display terminal workers: individual, ergonomic, and work organizational factors. Ergonomics; 38: 763-776.
Bergqvist UO, Knave BG. (1994) Eye discomfort and work with visual display terminals. Scandinavian Journal of Work, Environment & Health; 20: 27-33.
Bernard B, Sauter S, Fine L, Petersen M, Hales T. (1994) Job task and psychosocial risk factors for work-related musculoskeletal disorders among newspaper employees. Scandinavian Journal of Work, Environment & Health; 20: 417-426.
Bernard BP. (ed) (1997) Musculoskeletal disorders and workplace factors. Cincinnati (OH): NIOSH (DHHS (NIOSH) Publication No. 97-141).
BMRB (2006) Investigation of design options for the Workplace Health and Safety Survey. Sudbury: HSE Books (Research Report 413)
Brandt LP, Andersen JH, Lassen CF, Kryger A, Overgaard E, Vilstrup I, Mikkelsen S. (2004) Neck and shoulder symptoms and disorders among Danish computer workers. Scandinavian Journal of Work, Environment & Health; 30: 399-409.
Buckle P. (2005) Ergonomics and musculoskeletal disorders: overview. Occupational Medicine (Oxford, England); 55: 164-167.
Cannon WB (1935) Stresses and strains of homeostasis. American Journal of Medical Science: 189: 1-14.
Chiu TT, Ku WY, Lee MH, Sum WK, Wan MP, Wong CY, Yuen CK. (2002) A study on the prevalence of and risk factors for neck pain among university academic staff in Hong Kong. Journal of Occupational Rehabilitation; 12: 77-91.
107

Cox T (1993) Stress research and stress management: Putting theory to work. London: HSE (Contract Research Report No. 61/1993)
de Krom MC, Knipschild PG, Kester AD, Thijs CT, Boekkooi PF, Spaans F. (1992) Carpal tunnel syndrome: prevalence in the general population. Journal of Clinical Epidemiology; 45: 373-6.
Demure B, Luippold RS, Bigelow C, Ali D, Mundt KA, Liese B. (2000) Video display terminal workstation improvement program: I. Baseline associations between musculoskeletal discomfort and ergonomic features of workstations. Journal of Occupational and Environmental Medicine / American College of Occupational and Environmental Medicine; 42: 783-791.
Devereux JJ, Vlachonikolis IG, Buckle PW. (2002) Epidemiological study to investigate potential interaction between physical and psychosocial factors at work that may increase the risk of symptoms of musculoskeletal disorder of the neck and upper limb. Occup Environ Med. 59, 269-277.
Ekman, A, Andersson A, Hagberg M, Hjelm EW. (2000) Gender differences in musculoskeletal health of computer and mouse users in the Swedish workforce. Occupational Medicine; 50: 608-613.
European Community (1990) Council Directive 90/270/EEC on the minimum safety and health requirements for work with display screen equipment. Official Journal No L156, 21.6.90, 14.
Faucett J, Rempel D. (1994). VDT-related musculoskeletal symptoms: interactions between work posture and psychosocial work factors. American Journal of Industrial Medicine; 26: 597-612.
Ferguson D. (1971) An Australian study of telegraphists’ cramp. British Journal of Industrial Medicine; 28: 280-285.
Feuerstein M, Nicholas RA, Huang GD, Haufler AJ, Pransky G, Robertson M. (2005) Workstyle: development of a measure of response to work in those with upper extremity pain. Journal of Occupational Rehabilitation; 15: 87-104
Gerr F, Marcus M, Ensor C, Kleinbaum D, Cohen S, Edwards A, Gentry E, Ortiz DJ, Montielh,C. (2002) A prospective study of computer users: I. Study design and incidence of musculoskeletal symptoms and disorders. American Journal of Industrial Medicine; 41: 221-235
Gerr F, Marcus M, Monteilh C. (2004). Epidemiology of musculoskeletal disorders among computer users: lesson learned from the role of posture and keyboard use. Journal of Electromyography and Kinesiology : Official Journal of the International Society of Electrophysiological Kinesiology; 14: 25-31.
Goldberg D, Williams P. (2001) A User’s Guide to the General Health Questionnaire. Windsor: NFER-Nelson.
Hackman JR, Oldham GR. (1975) Development of the Job Diagnostic Survey. J Appl Psych, 60: 159-170.
Hales TR, Sauter SL, Peterson MR, Fine LJ, Putz-Anderson V, Schleifer LR, Ochs TT, Bernard BP. (1994). Musculoskeletal disorders among visual display terminal users in a telecommunications company. Ergonomics; 37: 1603-1621.
108

Hamilton AG, Jacobs K, Orsmond G. (2005) The prevalence of computer-related musculoskeletal complaints in female college students. Work; 24: 387-394.
Hannan, LM, Monteilh, CP, Gerr F, Klenbaum DG, Marcus, M. (2005) Job strain and risk of musculoskeletal symptoms among a prospective cohort of occupational computer users. Scandinavian Journal of Work, Environment and Health; 31: 375-386.
Hanson MA, Donnan PT, Graveling RA, McLaren WM, Butler MP, Hurley JF, Kidd MW, Lancaster RJ, Prescott CA, Symes AM, Tesh KM. (1999) Epidemiological and ergonomic study of occupational factors associated with syndromes of upper limb disorders in keyboard operators. Edinburgh: Institute of Occupational Medicine. (IOM Report TM/99/04).
Harrington JM, Carter JT, Birrell L, Gompertz D. (1998) Surveillance case definitions for work-related upper limb pain syndromes. Occupational and Environmental Medicine; 55: 264-271.
Haufler AJ, Feuerstein M, Huang GD. (2000) Job stress, upper limb pain and functional limitations in symptomatic computer users. American Journal of Industrial Medicine; 38: 507-515.
Health and Safety Executive (2003) Work with display screen equipment: Health and Safety (Display Screen Equipment) regulations 1992 as amended by the Health and Safety (Miscellaneous Amendments) Regulations 2002: Guidance on regulations. 2nd ed. Sudbury: HSE Books (L23).
Health Survey for England (1999) Cardiovascular disease: Volume 1: Results. London: TSO.
Health Survey for England (2003) Volume 2: Risk factors for cardiovascular disease. London: TSO.
Hochanadel CD. (1995) Computer workstation adjustment: a novel process and large sample study. Applied Ergonomics; 26: 315-326.
Hussain T. (2004) Musculoskeletal symptoms among truck assembly workers. Occupational Medicine; 54: 506-512.
Industrial Injuries Advisory Council (2006) Work related upper limb disorders. London: HMSO.
Iwakiri K, Mori I, Sotoyama M, Horiguchi K, Ochiai T, Jonai H, Saito S. (2004) Survey on visual and musculoskeletal symptoms in VDT workers. Sangyo Eiseigaku Zasshai; 46: 201-212.
Jensen C. (2003) Development of neck and hand-wrist symptoms in relation to duration of computer use at work. Scandinavian Journal of Work, Environment & Health; 29: 197-205.
Jensen C, Borg V, Finsen L, Hansen K, Juul-Kristensen B, Christensen H. (1998) Job demands, muscle activity and musculoskeletal symptoms in relation to work with the computer mouse. Scandinavian Journal of Work, Environment & Health; 24: 418-424.
Jones JR, Huxtable CS, Hodgson JT. (2005) Self-reported work-related illness in 2003/04: Results from the Labour Force Survey. Sudbury: HSE Books.
109

Jones R, Pitt N (1999) Health surveys in the workplace: comparison of postal, email and World Wide Web methods. Occup. Med. 49: 556-558.
Juul-Kristensen B, Sogaard K, Stroyer J, Jensen C. (2004) Computer users' risk factors for developing shoulder, elbow and back symptoms. Scandinavian Journal of Work, Environment & Health; 30: 390-398.
Juul-Kristensen B, Jensen C. (2005) Self-reported workplace related ergonomic conditions as prognostic factors for musculoskeletal symptoms: the "BIT" follow-up study on office workers. Occupational and Environmental Medicine; 62: 188-194.
Karasek R, Gordon G, Pietrokovsky C, Frese M, Pieper C, Schwartz J, Fry L, Schirer D. (1985) Job Content Questionnaire: Questionnaire and Users' Guide. Lowell: University of Massachusetts.
Korhonen T, Ketola R, Toivonen R, Luukkonen R, Hakkanen M, Viikari-Juntura E. (2003) Work related and individual predictors for incident neck pain among office employees working with video display units. Occupational and Environmental Medicine; 60: 475-482.
Kryger AI, Andersen JH, Lassen CF, Brandt LP, Vilstrup I, Overgaard E, Thomsen JF, Mikkelsen S. (2003) Does computer use pose an occupational hazard for forearm pain; from the NUDATA study. Occupational and Environmental Medicine; 60: e14.
Kuorinka I, Jonsson B, Kilbom Å, Vinterberg H, Biering-Sörensen F, Andersson G, Jörgensen K. (1987) Standardized Nordic questionnaires for the analysis of musculoskeletal symptoms. Applied Ergonomics; 18: 233-237.
Lassen CF, Mikkelsen S, Kryger AI, Andersen JH. (2005). Risk factors for persistent elbow, forearm and hand pain among computer workers. Scandinavian Journal of Work, Environment & Health; 31: 122-131.
Lassen CF, Mikkelsen S, Kryger AI, Brandt LP, Overgaard E, Thomsen JF, Vilstrup I, Andersen JH. (2004). Elbow and wrist/hand symptoms among 6,943 computer operators: a 1-year follow-up study (the NUDATA study). American Journal of Industrial Medicine; 46: 521-533.
Leiper DA, Elliott AM, Hannaford PC (2006) Experiences and perceptions of people with headache: a qualitative study. BMC Family Practice; 7: 27.
Macfarlane G, Hunt IM, Silman AJ. (2000) Role of mechanical and psychosocial factors in the onset of forearm pain: prospective population based study. British Medical Journal: 321: 676-670.
Maeda K, Hünting W, Grandjean E. (1980) Localised fatigue in accounting-machine operators. Journal of Occupational Medicine; 22: 810-816.
Main C, Glozier N, Wright I. (2005) Validity of the HSE stress tool: an investigation within four organizations by the Corporate Health and Performance Group. Occupational Medicine; 55: 208-214.
Matias AC, Salvendy G, Kuczek T. (1998) Predictive models of carpal tunnel syndrome causation among VDT operators. Ergonomics; 41: 213-226.
110

Ming Z, Narhi M, Siivola J. (2004) Neck and shoulder pain related to computer use. Pathophysiology : The Official Journal of the International Society for Pathophysiology / ISP; 11: 51-56.
Mocci F, Serra A, Corrias GA. (2001) Psychological factors and visual fatigue in working with video display terminals. Occupational and Environmental Medicine; 58: 267-271.
Nakazawa T, Okubo Y, Suwazono Y, Kobayashi E, Komine S, Kato N, Nogawa K. (2002) Association between duration of daily VDT use and subjective symptoms. American Journal of Industrial Medicine; 42: 421-426.
Nicholas RA, Feuerstein M, Suchday S. (2005) Workstyle and upper-extremity symptoms; a biobehavioural perspective. Journal of Occupational and Environmental Medicine; 47: 352-361.
Olssøn I, Mykletun A, Dahl AA. (2005) The hospital anxiety and depression rating scale: A cross-sectional study of psychometrics and case finding abilities in general practice. BMC Psychiatry; 5: 46.
Ortiz-Hernandez L, Tamez-Gonzalez S, Martinez-Alcantara S, Mendez-Ramirez I. (2003) Computer use increases the risk of musculoskeletal disorders among newspaper office workers. Archives of Medical Research; 34: 331-342.
Pallant JF, Bailey CM. (2005) Assessment of the structure of the Hospital Anxiety and Depression Scale in musculoskeletal patients. Health and Quality of Life Outcomes; 3: 82.
Palmer KT, Cooper C, Walker-Bone K, Syddall H, Coggon D. (2001) Use of keyboards and symptoms in the neck and arm: evidence from a national survey. Occupational Medicine (Oxford, England); 51: 392-395.
Papanicolaou GD, McCabe SJ, Firrell J. (1999) The prevalence and characteristics of nerve compression symptoms in the general population. Journal of Hand Surgery [Am]; 26: 460-6.
Rechichi C, Scullica L, (1990) Asthenopia and monitor characteristics. Journal of French Opthalmology; 19: 456-460.
Rempel D (1995) Musculoskeletal loading and carpal tunnel pressure. In: SL Gordon, SJ Blair, LJ Fine (eds.). Repetitive motion disorders of the upper extremity. Rosemont (IL): American Academy of Orthopaedic Surgeons, 123-132.
Rempel DM, Krause N, Goldberg R, Benner D, Hudes M, Goldner GU. (2006) A randomised controlled trial evaluating the effects of two workstation interventions on upper body pain and incident musculoskeletal disorders among computer workers. Occupational and Environmental Medicine; 63: 300-306.
Rocha LE, Debert-Rebeiro M. (2004) Working conditions, visual fatigue and mental health among system analysts in San Paulo, Brazil. Occupational and Environmental Medicine; 61: 24-32.
Rocha LE, Glina DM, Marinho Mde F, Nakasato D. (2005) Risk factors for musculoskeletal symptoms among call center operators of a bank in Sao Paulo, Brazil. Industrial Health; 43: 637-646.
111
Rowe G, Poortinga W, Pidgeon N (2006) A comparison of responses to internet and postal surveys in a public engagement context. Science Communications, 27: 353-375.
Snaith RP, Zigmond AS. (1994) HADS: Hospital Anxiety and Depression Scale. Windsor: NFER Nelson.
Tanaka S, Wild DK, Cameron LL, Freund E. (1997) Association of occupational and non-occupational risk factors with the prevalence of self-reported carpal tunnel syndrome in a national survey of the working population. American Journal of Industrial Medicine: 32: 550-556.
Tatemichi M, Nakano T, Tanaka K, Hayashi T, Nawa T, Miyamoto T, Hiro, H, Sugita M. (2004) Possible association between heavy computer users and glaucomatous visual field abnormalities: a cross-sectional study in Japanese workers. Journal of Epidemiology and Community Health; 58: 1021-1027.
Tittiranonda P, Burastero S, Rempel D. (1999) Risk factors for musculoskeletal disorders among computer users. Occupational Medicine (Philadelphia, Pa.); 14: 17-38, iii.
van den Heuvel SG, de Looze MP, Hildebrandt VH, The KH. (2003) Effects of software programs stimulating regular breaks and exercises on work-related neck and upper-limb disorders. Scandinavian Journal of Work, Environment & Health; 29: 106-116.
Wahlstrom J, Hagberg M, Toomingas A, Wigaeus Tornqvist E. (2004) Perceived muscular tension, job strain, physical exposure, and associations with neck pain among VDU users; a prospective cohort study. Occupational and Environmental Medicine; 61: 523-528.
Woods V, Hastings S, Buckle P, Haslam R. (2002) Ergonomics of using a mouse or other non-keyboard input device. Sudbury: HSE Books (RR045)
Woods V. (2005) Musculoskeletal disorders and visual strain in intensive data processing workers. Occupational Medicine (Oxford, England); 55: 121-127.
Yamamoto S. (1987) Visual, musculoskeletal and neuropsychological health complaints of workers using video display terminal and an occupational health guideline. Japanese Journal of Ophthalmology; 31: 171-183.
112

APPENDIX 1: SUMMARY OF SIGNIFICANT TESTS OF ASSOCIATION (≤ 5%) OF ALL VARIABLES WITH EACH SYNDROME GROUP (FROM HANSON ET AL, 1999)
Risk Factors Any Synd.
Trigger Digit
Nerve Entra-pment
Tend’n Disord
Epico-ndylitis
Shoul-der Disord
Fore-arm Pain
Gender (female) - -
Age (increasing) - - -
No. years experience with - - - - -keyboard No. hours keying per week No. hrs/wk in ‘risky’ sports +
- - hobbies How info. presented (visual +
- - audible) Visual means (document holder) -
Difficulties reading text (yes)
Frustrations with programs (yes) - -
Not able to take breaks -
Busy periods (yes) - - - - - -
Specified rate of keying (yes)
Chair: no armrests - Chair: no backrest angle - - - - adjustment Chair: no upper back support - - - - - -
Any problems with chair? (yes) -
Footrest (yes)
Use document holder (yes) -
Keyboard attached to screen - - - - - -
Keyboard not tiltable -
Screen flicker (yes) -
Unable to swivel screen - - - - - -
Noise level disturbing (always) - - - - -
Other env. factors disturbing (yes)
Exposed to vibration (yes) -
Wear glasses or contacts (yes) - - - -
113

Risk Factors Any Synd.
Trigger Digit
Nerve Entra-pment
Tend’n Disord
Epico-ndylitis
Shoul-der Disord
Fore-arm Pain
Eyewear type (bifocals, VDU glasses) - - - - -
Smoke cigarettes (yes) - - - Diagnosed rheumatoid or - - - - osteoarthritis (yes) Accident related to symptoms (yes) Increasing longest spell at
keyboard without break (+ve) Observed working with left - - - - - -shoulder elevated (yes) Not observed to use some fingers - - - - - -more frequently than others Observed touch typist - - - Observed heavy-handed typing - - - - style *WES - Peer Cohesion (lower) - - - - -
*WES - Task Orientation (lower) - - - - -
*WES - Innovation (lower) - - - - -
*WES - Physical Comfort (lower) - - #Goni - Flex/Extension of right - - - - -wrist (median angle) #Goni - Flex/Extension of right - - - - - -wrist (Stand. Dev. over recording period) #Goni - Rad/Ulnar deviation of left - - - - - -wrist (median angle)
* WES – Workplace Environment Scale. #Goni – measurements obtained from electrogoniometers.
114

APPENDIX 2: SUMMARY OF KEY POINTS OF PAPERS AND ‘NIOSH’ RATING
Ref Author& Date
Limitations, benefits and notes >70% Participation
rate
Physical examination
Investigators blind to health
outcomes
Independent examination (workplace)
Number of criteria met
1 Rocha et al (2005)
Limitations 1. Cross sectional design 2. Analysis was undertaken in only one call centre linked to a bank in Brazil. 3. Small sample size (108 call centre operators completed questionnaire from 131 staff at the call centre a response rate of 82.4%). All informed of the objectives of study and agreed to participate voluntarily. 4. Predominately female (88%, n=95) working 6 hours per day with one 30 min break. 5. Analysis of statistical association limited to females only 6. Difference in jobs between male and female respondents. Men telemarketing, females in customer service – task analysis was undertaken (interviews and observing staff at job). But only ten respondents analysed in this manner. 7. Age group also predominately younger workers (18-23 made up 67% of respondents) with workers seated 95% of the time typing and answering telephones. 8. Self administered questionnaire so potential for over-reporting of symptoms. Average length of time to complete = 20 mins. 9. Perceived characteristics of work rather than actual. However, incoming calls monitored which showed operator received 90-140 calls per day lasting approx 2 mins each. Males answered fewer calls. 10. Prevalence of symptoms greater among women (suggests age of men, number of years in job and job control as reason but lacks evidence to support this). 11. The prevalence of reported symptoms located on the neck/shoulder and wrists/hands was estimated for both male and female respondents. 12. Although figures were presented for ergonomic issues such as chair height, noise etc – no actual measurements were taken (only perceived view of good/excellent, regular or bad/very bad).
YES NO NO NO 1
115

13. As the respondents were informed of the objectives of the study there may have been an over reporting of symptoms in the questionnaire. 14. No medical examinations performed to correlate data. Benefits 1. Response rate high (82.4%) 2. Ergonomic observations were undertaken but not for all respondents. Note Comparison with another studies (Hales et al 1994 and Norman et al 2004) suggested their results showed a higher prevalence for MSD’s in call centre staff compared with telephone operators or VDT terminal workers.
2 Anderson et al Limitations YES YES YES & NO* NO 3* (2003)
[NUDATA Study – related to ref 19, 20 & 21]
1. Overrepresentation of non-respondents at follow-up of young men with executive jobs. 2. Study based on questionnaire and clinical interview rather than nerve conduction tests. 3. Media interest in the study may have led to over-reporting of symptoms (even though study was introduced as a general study on work environment) with 2 occupational groups (technical assistants or draftsmen and machine technicians). 4. In all multivariate analysis those who used both hands were excluded from the study (n=623) 5. Overall self-reported incidence of tingling/numbness in right hand at baseline 1.9% - interviews confirmed 4.8% with median nerve numbness
[details not provided in this study, however according to ref 19 – 2 groups
with one group blind, other informed]
(1.4% with night symptoms). At follow-up this was 5.5% (n=198) but interviews only identified 41 cases (1.2%). 6. Unclear whether the clinical interviews were conducted with all those in those in the survey or whether the results only correspond with the questionnaire responses. 7. Small number of incident cases with extensive median nerve symptoms (n=35) so focus on mouse and keyboard use only. Benefits 1. Large number of Danish companies studied (n=3500) 2. Good response rate with questionnaire sent to 9480 (all trade union members – 73% response at baseline, 82% at follow-up a year later) 3. Wide range of exposure and simultaneous analysis of physical
116

symptoms. Psychosocial and non-occupational characteristics measured at 2 points.
3 Bergqvist et al Limitations YES YES YES YES 4 (1995b) 1. Cross sectional studies cannot determine causality
[related to ref 4 & 5]
2. Classification of exposure at the time of the study may have misrepresented conditions as they existed at the time of the onset of MSD problems. 3. Small sample size only 260 VDT workers 4. Majority of respondents’ female (76%) 5. Self administered questionnaire so potential for over-reporting of symptoms (however, medical investigation undertaken e.g. compass goniometer for active range of movement). Benefits 1. Medical and 88% of workplaces analysed 2. High participation rate (97%)
4 Bergqvist et al Limitations YES YES YES YES 4 (1995a) 1. Cross sectional studies cannot determine causality [from Ref 3]
[related to ref 3 & 5]
2. Underreporting of OR between VDT and non-VDT users suggested but verification failed a few respondents confirmed workplace or job change. 3. Large suggested bias in hand and back OR (30%+) could not be verified by a drop-out questionnaire. Benefits 1. Both clinical and workplace examinations undertaken (workplace 82%, physiotherapy examination 91%) 2. High response rate (92% of 353 office workers) 3. Seven different companies in Stockholm studied. 4. Control used (those that used a computer less than 5 hrs per week)
5 Bergqvist et al Limitations YES NO YES YES 3 (1994) 1. Cross sectional studies cannot determine causality [this study did
[related to ref 3 & 4]
2. Study population included large number of older men (age not provided) but median age was 47 3. Some of the variables acted as confounders of the VDT-eye
not include the clinical
examination discomfort relationship. Benefits
data as seen in ref 3 & 4]
1. Study agrees with others in a similar vein.
117

2. High response rate (93%, n=327) 3. Ergonomic conditions measured for 88% (n=288) and relative humidity for 78%.
6 Bernard et al Limitations YES NO NO YES 2 (1994) 1. Cross sectional studies cannot determine causality
2. Self report of symptoms so potential for over-reporting of symptoms / time spent at computer 3. Only one company involved in study (newspaper) though 4 different departments analysed 4. No mention of influence outside of work 5. Numerous association tests increases the chance of spurious results Benefits 1. Large number of respondents completed questionnaire with high response rate (n=973, 93% response) 2. 80 respondents participated in a work sampling evaluation 3. Controls were used – those with no values vs. those with high values
7 Brandt et al Limitations YES YES NO NO 2 (2004) 1. Media interest in the subject could have encouraged biased
responses to questionnaire 2. Self reported time and exposure so potential for over-reporting of symptoms / time spent at computer 3. Only 2.1% met criteria for neck or shoulder disorders according to clinical examination
[ref would suggest those performing
clinical examinations were aware of
4. One year between baseline and follow-up with no direct contact during intervening period Benefits
participants symptoms]
1. Clinical examination of 925 respondents at baseline and 109 at follow-up. 2. Tested for selection bias and drop out bias 3. Large number of respondents (6943 at baseline, 5658 at follow-up) with good participation rates (73% and 82% respectively) 4. Comparison made between time spent with mouse and keyboard and severity of symptoms
8 Buckle Limitations N/A N/A N/A N/A N/A (2005) 1. Review only – no actual study conducted
118

[review] 2. Mentions display screen equipment and computer use but not in any detail
9 Chiu et al (2002)
Limitations 1. Limited population as only staff at one university studied (Hong Kong) 2. Low response rate (19% return rate – 150 from 780 across 26 departments) 3. Majority of subjects over the age of 31. 4. Self reported questionnaire so potential for over-reporting of symptoms and time spent at computer Benefits 1. Questionnaire validity tested on 5 lecturers with clinical experience in treating neck patients. 2. Test-retest reliability tested
NO NO YES NO 1
10 Demure et al (2000)
Limitations 1. Cross sectional studies cannot determine causality 2. Differences in definitions of MSDs made comparison with other studies difficult (but prevalence rates similar) 3. Subjective responses to questionnaire so potential for over-reporting bias (symptoms and time spent at computer) 4. Relatively low numbers involved in study (n=294) Benefits 1. Response rate high with 249 (91%) completing questionnaire and 273 (93%) have a workstation assessment conducted 2. Assessments randomly assigned and assessors blind to physical symptoms of respondents
YES NO YES YES 3
11 Faucett (1994)
Limitations 1. Limited number of respondents (n=297) with low response rate (56% - 166 returned) 2. One company investigated (newspaper organisation- editorial department only) 3. Potential for over-reporting on symptoms and time spent at computer as subjective questionnaire Benefits 1. Workstation assessment conducted but only for 70 respondents (42% of returned questionnaires)
NO NO NO YES 1
119

12 Gerr et al (2004)
[review]
Limitations 1. Review only – no actual study conducted
2. Review limited to field based epidemiological studies (studies with less than 20 VDU users) 3. Only 6 studies identified
N/A N/A N/A N/A N/A
13 Hales et al (1994)
Limitations 1. Cross sectional study cannot discern causality
however survival bias was tested for 4. Medical records and exposure times were by self report therefore misclassification errors possible 5. Low variance in variables such as time spent on computer 6. Large numbers of independent variables (70 in total) increases the chance of spurious results Benefits 1. Physical examinations conducted by 4 physicians blinded to questionnaire Reponses 2. Number of keystrokes recorded in subgroup (n=174) 3. High participation rates (93%, N =518)
YES YES YES YES 4
14 Jensen et al (2003)
[related to ref 16& 17]
Limitations 1. Questionnaire based survey so potential for over-reporting of symptoms and computer use duration 2. Greater percentage of females completed questionnaire (66.5% at baseline, 66.8% at follow-up). 3. One year between baseline and follow-up with no intervention in the intervening period Benefits 1. Large study (1999 respondents at baseline, 69% response rate / 2576 respondents at follow-up, 77% response rate).
NO NO NO NO 0
15 Jensen et al (1998)
Limitations 1. Cross sectional study cannot discern causality 2. Only one company studied (engineering) 3. Small number of respondents studied (149 with 62% response rate) 4. Self reported estimates of durations therefore potential for overestimations Benefits 1. Workplace study looking at posture, muscular activity and
NO NO NO YES 1
120

psychosocial exposure was recorded using video recordings – however, this was only done for 6 respondents 2. Wrist posture measured using goniometer for some respondents (numbers vary depending on location but no greater than 20) 3. Psychosocial exposure measured using semi-quantitative observational methods for 11 respondents
16 Juul-Kristensen et al (2005)
[related to ref 14 & 17]
Limitations 1. Possible misclassification of prognostic factors for MS symptoms (unable to quantify misclassification) 2. Outcome variables self reported and recall bias problematic for epidemiological studies. 3. Furniture recommendations unknown (assumptions made e.g. non-adjusted chairs resulted in non-optimal posture). 4. Exposure at follow-up could not be confirmed as not included in questionnaire (final models included only those individuals that had not changed jobs since baseline). 5. “Monotonous work” appears to be different from other types of work Benefits 1. No selection bias regarding symptoms, gender or age was observed. 2. Large number of subjects (1999 at baseline, 69% response rate) within 11 different organisations)
NO NO NO NO 0
17 Juul-Kristensen et al (2004)
[related to ref 14 and 16]
Limitations 1. Recall bias may be a problem (over-reporting of symptoms and duration at computer) 2. Self reported however (but used 2 variables – frequency and intensity). Benefits 1. Prospective study therefore able to identify predictors 2. Controlled for job change 3. Numbers high but response rate low
NO NO NO NO 0
18 Korhonen et al (2003)
Limitations 1. 1 year baseline / follow-up study of 416 employees in only one company (administrative unit) 2. Questionnaire so self reported therefore potential for over-
YES NO NO NO 1
121

reporting of symptoms and duration at computer 3. Drop out rates relatively high: 19% at baseline and 22% at follow up 4. Sex effects may have been due to differences in work tasks Benefits 1. Response rates reasonable (81% at baseline, 78% at follow-up) 2. Control – those who reported <7 days of neck pain in the last 12 months
19 Kryger at al Limitations YES YES YES and NO* NO 2/3* (2003) 1. Although participation at baseline was 73.2%, there was a shortage [2 clinical
[NUDATA of incident cases at follow-up (n=67). 2. More female respondents than male (62.6% vs. 37.4%)
examinations performed, one
study – 3. Unable to explain why mouse and keyboard time seemed to have a group – related to 2, linear effect starting from 0hrs per week – could be due to reporting bias or investigator 20 and 21] self reporting inaccuracies (goes into detail re: figures). blind to
4. No angle measurements were taken (postural variables and questionnaire hand/arm symptoms) answers, other Benefits investigator 1. High response rate to questionnaire (6943 at baseline, 5658 at informed] follow-up = 73.2% and 59.6% respectively) 2. Two clinical examinations undertaken (one where the physician was told about symptoms, other blind) at baseline 235 clinical examinations but only 49 at follow-up.
20 Lassen et al Limitations YES NO YES YES 3 (2005)
[NUDATA study – related to ref 2, 19 & 21]
1. Subjective response from respondent to questionnaire so overestimated responses compared to objectively measured times. However, no statistically significant effects of mouse and keyboard times on the prognosis of arm pain whether self reported or objectively recorded. 2. Study not large enough to directly address prognostic problems of clinically relevant arm pain as it was felt that these pain states were rare. Benefits
[did not look at clinical data
from NUDATA
study]
1. High response rate to questionnaire – as a result, sample size and covariate distributions did not seem to indicate that the negative results were due to lack of study power or that the results were due to measurement error. 2. Computer use recorded on 42% of respondents using “workpace
122

recorder” software. Notes Comment on the results being “surprising” if mechanical exposures are considered as major risk factors for the development and persistence of work-related pain in computer workers. Previous studies have suggested that the persistence of pain would be affected by exposure time but results do not seem to agree. Suggests further research.
21 Lassen et al Limitations YES YES YES & NO* NO 2/3* (2004) 1. Association between exposure time and outcomes distorted by [details not
[NUDATA Study – related to ref 2, 19 & 20]
selection and information bias. Analysis indicated only limited effect 2. Media exposure on the study may have affected high-exposure symptomatic subjects to over-report – researchers did not think this explained the difference between their hypothesis and results. 3. Selection may influence exposure response – researchers suggest
provided in this study, however according to ref 19 – 2 groups
with one group the results “spoke against any pronounced survivor effect” Benefits
blind, other informed]
1. As with 20, large number of respondents 2. Alterations to computer workstation layout was recorded but when this occurred was not. 3. Clinical examinations conducted on symptomatic subjects at baseline and follow-up). Few diagnoses made from data and selection bias did not readily affect the results obtained. Note Discusses overestimation of self-reported computer time [subgroup n=2146 studied – daily recordings during the year] but these results detailed in another paper.
22 Matias et al Limitations NO NO NO YES 1 (1998) 1. Subjective responses to questions therefore potential for over-
reporting of symptoms and duration at computer 2. Small sample (100 staff of which 45 with CTS) so sample and task specific. 3. All respondents female 4. Anthropometric measurements cannot be controlled => no interpretation of tolerance limits can be made (only risk classification) 5. Mainly word-processing so unable to predict for general popn. 6. Factors such as equipment used not factored into results.
123

7. Rest breaks between and within VDT use not recorded. 8. Psychological factors out-with workplace not included. 9. Predictive tool can only indicate probability person HAS CTS not that they will get it in the future [would need longitudinal study over longer period for that]. Benefits 1. Direct observation (and measurements taken using marker pens and video recordings) to record posture and job exposure 2. Variation on equipment provided for subjects e.g. chair etc
23 Ming et al (2004) [review]
Limitations 1. Not actually a study but a review of pathophysiology of neck and shoulder pain Note Researchers note that pain is always subjective.
N/A N/A N/A N/A N/A
24 Mocci et al (2001)
Limitations 1. Study limited to one particular job - bank workers. 2. Small number of subjects (initially 385 with 82% male. However only those presenting with conjunctival alterations or refractive errors selected for analysis (n=298). 212 subjects without organic visual disturbances. 3. Difficulty in measuring visual discomfort (clinical features imprecise and uneasily measured). – tried to combat this by imposing strict criterion of asthenopia only if reported at least 3 times per week during or shortly after end of work at VDT. 4. Self reported so potential for overestimation (correlation between stressor and dysfunctioning). Self reports also increases potential for conceptual overlap in the measures (e.g. assessing the same construct). 5. May also introduce third variable that influences dependent and independent variable (in this case, support from co-workers).
Benefits 1. Relatively few studies look at visual discomfort separately (most include other issues such as ULDs) and includes psychological factors
YES NO NO NO 1
25 Nakazawa et al (2002)
Limitations 1. Self administered questionnaires so potential
YES NO NO NO 1
124

for over-reporting of symptoms and duration at computer
2. All respondents within IT company (though different departments such as sales, accounts and planning, no CAD or data entry respondents) 3. Cronbach’s alpha of physical symptoms and sleep related symptoms were not high enough. Also prevalence of absence of symptoms high. Benefits 1. Cronbach’s alpha was 0.7 for mental and about 0.5 for the other 2 suggesting sufficient reliability for the study 2. Large number of respondents (29711 in 1995, 28780 in 1996 and 25964 in 1997) 3. Annual health examination with 90% participation rate each year
26 Ortiz-Hernandez et al (2003)
Limitations 1. Only one company (newspaper organisation in Mexico) with four job classifications 2. No security that worker reports were as precise as instrumental measurements therefore bias introduced whereby workers overvalue intensity and duration of symptoms. 3. Did not take into account symptom intensity. 4. To evaluate adoption of “uncomfortable postures” were unable to use objective measurements due to financial constraints therefore workers provided information so potential for overestimation of relationship between ergonomic factors and MSDs. 5. Vacation time not recorded. 6. Cross-sectional study therefore no certainty that PC exposure was present prior to the MSD. 7. Variety of criteria used to establish case definitions e.g. some studies use a year, this one used a month. Benefits 1. Number of respondents (n=218, 73%)
YES NO NO YES 2
27 Palmer et al (2001)
Limitations 1. Self reported so potential for over-reporting of symptoms (no ergonomic or clinical assessments performed) 2. Although study looked at computer use, questionnaire mailed to 163 GP practices across UK so many of those that responded were not
NO NO NO NO 0
125

computer users and cross-sectional study so underestimation if keyboard users transferred to other occupations. Benefits 1. Large study sample (n=12262) but low response rate was low (58%). However non-manual workers – 2279 male, 2610 – female with 790 / 1081 reporting keyboard use. 2. Focus for research not keyboard use so no expected response bias. However, those with upper limb pain may have been aware of keyboard use and symptoms so may have reported it more often.
28 Tittiranonda et al (1999)
[review]
Limitations 1. Review of epidemiological and ergonomic literature rather than actual study. Benefits 1. A good review that discusses many of the limitations of previous studies e.g. classification, duration of study.
N/A N/A N/A N/A N/A
29 Van Den Heuval et al (2003)
Limitations 1. Low response rate could have resulted in selection bias (social security office in Netherlands). Although many asked to complete a questionnaire (n=12000), only 1700 returned (about 14%) with 1000 meeting criteria for selection. For 22 locations only first 20 employees asked to participate. Then broken down into 3 groups (n=268) 2. Study was on people with existing complaints (not healthy individuals) so unknown whether software has an effect (i.e. to prevent discomfort). 3. Self report on whether exercises performed so potential for over or under reporting of details. 4. The results on the effects of the software program seem to contradict. Pre-versus post intervention scores of severity and frequency did not reveal any differences between the groups. Whereas, the results concerning post intervention perceived recovery revealed a favourable effect for the stimulation of regular breaks – this may have been due to intervention bias (i.e. subject felt their issues were being addressed). However, this could have been due to the software in that it raised the subjects’ awareness of posture, breaks etc). 5. Overall decrease in complaints could have been due to booklet provided (giving advice on posture) or changes to the subject’s
NO NO NO YES 1
126

workstations. 6. “Regression to the mean” may have occurred (where subjects complained prior to intervention). 7. Duration of study may not have been long enough to show effects on the complaints. 8. Natural breaks (e.g. using the phone etc) were not recorded. 9. Effect of software only as good as the willingness of people to actually use it. Benefits 1. Clinical examination conducted to confirm individual respondent’s diagnosis.
30 Wahlstrom al (2004)
et Limitations 1. Exposure variables only measured at baseline 2. The study population may have been those people less likely to develop neck pain - thus showing lower incidence rates 3. Inclusion of people with differing prior exposure to computer workstations Benefits 1. Large number of respondents (46 worksites approached). 1579 asked to complete questionnaire, 1283 completed (81.2%). Study populations 327 females / 344 males.
YES NO NO NO 1
31 Woods (2005)
Limitations 1. Limitations of cross-sectional studies e.g. recall of information, difficulty in determining causal relationships
between work factors & MSDs. However, response rate relatively high. 2. Individual eye symptoms (e.g. red eyes) revealed significant results but sample number too small to report. 3. Control group were manual workers so nature of work different from that of the study group. 4. Trade union chose processing centres (so may have been some selection bias). 5. Workstation set-up differed within organisational sites so difficult to compare results across sites (though it was a purpose built workstation at each site). 6. Only 175 data processors (and a control group of 129) studied. Benefits
YES NO NO NO 1
127

1. Very few studies have looked at the visual impact of extended computer use, this one does.
32 Yamamoto (1987)
Limitations 1. Self reporting so potential for overestimation of symptoms. 2. Response rate not provided (although number of companies provided, does not provide details of number of questionnaires sent / response rate). 3. Paper itself does not highlight any limitations in the study other than difficulty compiling data for a control group of workers not engaged in VDT work but who belonged to the same office worker groups. 4. No control group – instead compared the complaints using a VDU vs. complaints not using a computer by classifying people into one of 4
N/K* [Does not say
how many questionnaires were initially sent - though
5097 completed questionnaire]
NO NO NO O*/1 [one
variable not known]
groups. Benefits 1. Nationwide survey of 1000 companies in Japan (n=532 agreed to participate covering 23 industries and 5097 completed questionnaire)
A Ekman et al Limitations YES NO NO NO 1 (2000) 1. Not just office workers included in the study (or those using
VDU’s) included other industries with computer use. 2. Questionnaire did not reflect the fact that work-related upper limb disorders often become worse over time or that some individuals may only be troubled at work. 3. Self reported questionnaire so potential for over-reporting on symptoms (though there were some interviews taken, no clinical assessments were made). 4. Three distinct occupational groups but mainly predominately male responses (professionals – men / technicians – men / clerks – women). Results indicate that females report higher neck and upper limb pain than males but this may have been due to the job tasks rather than actual gender differences. Benefits 1. Large number of respondents (n=2044).
B Gerr et al Limitations NO NO NO NO 0 (2002) 1. US Study of newly hired staff within 8 organisations but
participation rate relatively low (66% n=623). 2. Respondents predominately female (70.9%)
128

3. If weekly diary was missing, previous weeks results used in analysis (<1% missing however). 4. Study not designed to determine whether computer use increases the risk of CTS (would require comparison group of non-computer users). 5. Users also familiar with computer use (i.e. those with previous symptoms have been shown to reduce their computer use).
C Hochanadel (1995)
Limitations 1. Not a random sample population (therefore reporting bias may be present). 2. Subjective reporting of symptoms. No pain scales or drawings used or confirmation from medical records / clinical assessment 3. No attempt made to verify the implied causal relationships with computer use and symptoms. Questionnaire did not include “off the job” activities or tasks that could have resulted in symptoms reported. 4. Lack of information on worker satisfaction, type of work performed and use of mouse or digitizer. 5. Some recommendations user unable to make e.g. fixed height chair. 6. Measurement error (by the user) i.e. estimating height of desk etc and actual measurements were not taken by researchers. 7. Response by gender – females reported higher levels but keystroke information not recorded by researchers. Benefits 1. Response rate 76% (n=537) with almost equal male to female ratio
YES NO NO YES 2
D Rempel et al (2006)
Limitations 1. 269 customer service reps within one company asked to participate in study (67.6%, n=182 agreed). However, post intervention only 69 participated. 2. Unavailability of 7 participants for physical examination may have biased the results. 3. Although interventions administered by trained research associated however, difficult to say whether these interventions were administered in the same way (i.e. trainer difference). One month after intervention, visits made to ensure intervention was being used. Benefits
NO YES YES YES 3
129

1. Exit and drop-out questionnaire administered E Bergdahl et al
(1994) Limitations 1. Respondents were not clinically checked pre / post study so results rely on respondents answered (which could be biased as study group was “those injured by electricity and VDU’s in northern Sweden”. 2. 79% of respondents were female and only 103 participants (questionnaire sent to 127). 3. Study suggests any further study to include oral and medical investigation and that patients with persistent symptoms undergo a psychological / psychiatric examination!
YES NO NO NO 1
F Hamilton et al Limitations NO NO NO NO 0 (2005) 1. Sample size very small (only 72 questionnaires returned) and
limited to female college students 2. Job content questionnaire not developed specifically for students. 3. Data collected over several weeks therefore amount of time spent at computer and quantity of job demands based on academic cycle. 4. Self-reported questionnaires so potential over-estimation of symptoms / time at PC
[and less than <100
participants]
G Feuerstein et al Limitations NO NO NO NO 0 (2005) 1. Two part study – for questionnaire design sample size low (260
responded to advert with 64 meeting inclusion criteria and 30 did not wish to go further). Only piloted on 5 individuals. 2. Second part of study – 282 met inclusion criteria with 143 (51.6%) completing second questionnaire 3 weeks later for a test-retest comparison. 3. Used a convenience sample which resulted in a restricted sample of the US workforce (educated females). Sample not selected nor stratified to reflect total population. 4. According to the authors, it may be that certain behaviours are related to back pain while others are related to more specific UE problems. 5. No clinical assessments performed to confirm symptoms / diagnosis. Benefits 1. Test-retest comparison conducted for second part of study to ensure test reliability
H Hannan et al Limitations YES NO NO YES 2
130

(2005) 1. Researchers unable to rule out the possibility that participants who developed symptoms that met criteria during the course of the study were also symptomatic, but to a lesser degree at the time they completed the Job Content Questionnaire. 2. Cohort size modest so statistical power of the analysis limited. 3. Use of self-reported symptoms and use of self-reported medication but have been used in other studies with similar results. 4. 87.3% of respondents had worked previously (for >15hr/wk) at a computer therefore, results may have been distorted by selective survival in that those at greatest risk for developing MS symptoms had already developed them and altered their level of work accordingly. 5. Unable to control for individual characteristics such as personality or behaviour. 6. As respondents were not followed after reporting symptoms, no history could be obtained therefore symptoms could have been due to change of job rather than long term issue. Benefits 1. Total number of participants at baseline was 447 of which 314 participated in neck-shoulder cohort, 33 in hand-arm cohort.
I Haufler et al (2000)
Limitations 1. Cross sectional design and low participation rate therefore potential for selection bias (initially 267 met inclusion criteria, 176 returned (65.7%) with 124 symptomatic (70.5% of returned questionnaires). 2. No asymptomatic controls 3. Female participants only 4. No clinical assessment performed on any of the respondents nor workstation assessment
NO NO NO NO 0
J Nicholas et al (2005)
Limitations 1. Web based questionnaire (282 met inclusion criteria). After 3 months asked to complete a follow-up only 62% participated. 2. Researcher indicated that the workstyle construct required further validation (including elaboration of the multidimensional aspects of job stress). 3. Also suggests future research should compare the performance of the model to different bio-behavioural models to determine their ability to optimally explain clinical outcomes.
NO NO NO NO 0
131

K Tatemichi et al Limitations YES YES NO NO 2 (2004) 1. All underwent perimetry test, only those with positive test re-tested
2 Self-reported computer usage L Pentikis et al Limitations N/A N/A N/A N/A N/A
(2002) UNABLE TO OBTAIN REFERENCE F1 Mbaye et al Limitations N/K* NO NO NO O*/1
(1998) 1 Self reported questionnaire so potential for over-reporting of [one
[FRENCH] symptoms and duration as no clinical or workstation analysis performed 2. Only 152 respondents
variable not known]
F2 Rechichi et al Limitations YES YES YES NO 3 (1990) [FRENCH]
1. Self-reported workplace features, often very small proportion reporting deficiencies.
F3 Iwakiri et al Limitations NO NO NO NO 0 (2004)
[JAPANESE]
1. Response rate low (60.5%) 2. Self reported questionnaire so potential for over-reporting of symptoms and duration at computer as no clinical or workstation assessment performed Benefits 1. Questionnaires with missing data were
excluded from the analysis F4 Kim et al Limitations N/K* NO NO NO 0/1*
(2005) 1. Self-reported questionnaire so potential for over-reporting of [one
[KOREAN] symptoms and duration at computer as no clinical or workstation assessment performed
variable not known]
F5 Rocha et al Limitations YES YES YES YES 4 (2004) [ORIGINAL STUDY IN PORTUGUE SE, 2001,
1. Self-reported questionnaire so potential for over-reporting of symptoms as no clinical assessment performed. 2. Only one job category analysis (system analysts) so unable to extrapolate to general population Benefits
SAME GROUP OF RESPONDE NTS BUT REPORT IN
1. Observation of the workstation, environment, equipment and work organisation conducted by professional ergonomics. 2. Control group also included in study (636 individuals in study group vs 147 in control group)
ENGLISH]
132

APPENDIX 3: CHARACTERISATION OF WORKING HOURS ANDDURATION OF COMPUTER USE
In the survey questionnaire information was recorded on contracted and actual hours worked per week, number of days on which a computer was used, average number of hours spent at the computer and length of time worked at the computer without a break. Duration of computer use was recorded for work and for leisure/home use.
A3.1 Working hours
Contracted hours ranged from 3 hours per week to 80 hours per week. The most commonly reported working weeks, accounting for over 60% of respondents, were:
• 35 hours reported by 120 (9.2%) responders • 37 hours reported by 379 (29.0%) responders • 37.5 hours reported by 329 (25.2%) responders
Table A3.1 shows the distribution of contracted hours, by gender and overall. On average, men tended to be contracted to work longer hours than women.
Table A3.1 Distribution of contracted hours by gender. Each cell contains number of respondents and % of row total.
Contracted hours Gender <20 20-29 30-39 40+ All Men 6 1.4 11 2.6 353 83.2 54 12.7 424 Women 77 8.7 106 12.0 665 75.5 33 3.8 881
All 83 6.4 117 9.0 1018 78.0 87 6.7 1305
Table A3.2 shows the distribution of contracted hours by company size. A substantial majority of workers in medium/large companies were contracted to work 30-39 hours per week. Proportionally more workers from small companies were contracted to work more than 40 or less than 30 hours per week.
Table A3.2 Distribution of contracted hours by company size. Each cell contains number of respondents and % of row total.
Company size <20
Contracted hours 20-29 30-39 40+ All
Small 43 8.7 74 15.0 318 64.4 59 11.9 494 Med/Large 40 4.9 43 5.3 702 86.4 28 3.4 813
All 83 6.4 117 9.0 1020 78.0 87 6.7 1307
Actual working hours ranged from 3 hours per week to 100 hours per week. The most commonly reported working weeks, accounting for around 40% of respondents, were:
• 37 hours reported by 207 (15.8%) responders • 37.5 hours reported by 152 (11.6%) responders • 40 hours reported by 178 (13.6%) responders
133

followed by 35 hours (60 respondents) and 45 hours (71 respondents). Overall, 71 subjects had a typical working week which was longer than that recommended by the Working Time Directive (48 hours).
Table A3.3 shows the distribution of actual hours worked, by gender and overall. On average, men tend to work longer hours than women, with actual hours for both men and women tending to be higher than contracted hours.
Table A3.3 Distribution of actual hours by gender. Each cell contains number of respondents and % of row total.
Actual hours Gender <20 20-29 30-39 40+ All Men 6 1.4 12 2.8 203 47.3 208 48.5 429 Women 62 7.1 103 11.7 482 54.9 231 26.3 878
All 68 5.2 115 8.8 685 52.4 439 33.6 1307
Table A3.4 shows the distribution of actual hours by company size. Proportionally more workers from small companies work less than 30 hours per week.
Table A3.4 Distribution of actual hours by company size. Each cell contains number of respondents and % of row total.
Company Size <20
Actual hours 20-29 30-39 40+ All
Small 38 7.7 70 14.1 210 42.3 178 35.9 496 Med/Large 30 3.7 45 5.5 477 58.7 261 32.1 813
All 68 5.2 115 8.8 687 52.5 439 33.5 1309
Of the 1300 respondents for whom contracted and actual hours of work could be compared, 596 (46%) worked actual hours exactly equivalent to their contracted hours. Of the remaining 704 respondents, 39 worked fewer than their contracted hours with reductions ranging from 0.1 hours to 7.5 hours.
665 respondents tended to work more than their contracted hours, by between 0.2 and 62.5 additional hours per week (the 62.5 hours was an individual contracted to work 37.5 hours per week who reported working 100 hours per week). Overall, 478 respondents worked five or fewer extra hours, 118 worked between 5 and 10 extra hours, 60 worked between 10 and 20 extra hours and 9 worked more than 20 extra hours.
134

1 Duration of computer use
Table A3.5 shows the typical weekly computer use at work. Most respondents used their computer for 3 or more days per week, for varying lengths of time.
Table A3.5 Typical weekly computer use at work
Days per week <2 Hours per day
Between 2 & 4 Between 4 & 6 More than 6 All <1 11 4 2 0 17 1 or 2 10 14 15 10 50 3 or more 27 220 458 540 1245
Total 48 238 475 550 1312
Table A3.6 shows similar information for computer use at home, for the 1105 subjects who had home computers (one subject did not provide information on duration of use). Most home users used the computer for less than two hours a day.
Table A3.6 Typical weekly computer use at home
Days per week <2 Hours per day
Between 2 & 4 Between 4 & 6 More than 6 All <1 288 23 4 1 316 1 or 2 225 57 14 1 297 3 or more 342 122 22 5 491
Total 855 202 40 7 1104
Total weekly computer use was calculated for work and home computer use separately and for work and home use combined. Responses to the questions on duration of use were allocated to the mid-point of the response groupings as follows:
Table A3.7 Response group mid point
Allocated value Variable Days per week
Range < 1 day
Work 0.5 days
Home 0.5 days
1 or 2 days 1.5 days 1.5 days 3 or more days 4.0 days 5.0 days
Hours per day < 2 hours 1 hour 1 hour 2 to 4 hours 3 hours 3 hours 4 to 6 hours 5 hours 5 hours > 6 hours 7 hours 7 hours
Weekly computer use was calculated by multiplying the number of hours per day by the number of days per week to give an estimate of total number of hours per week spent using the computer. Average weekly computer use was 25 hours of which 21 hours were at work and 4 hours at home. Women tended to spend longer at the computer at work (average 21 hours
135

compared to 20 hours for men) and less time at the computer at home (average 3 hours compared to 6 hours for men).
It is recommended that computer users take a break about once per hour. More than half of those surveyed, reported working more than 1 hour without a break (846 of the 1315 who provided this information), while 285 respondents used a home computer for more than one hour without a break.
136

APPENDIX 4: RESPONSES TO NON-MEDICAL QUESTIONS
In addition to the questions on symptom occurrence, well-being and patterns of work, additional, more detailed questions were included in the questionnaire which explored more fully the conditions in which respondents worked and the computing equipment that they used. It was not an intention of the current study to explore this data in any detail, nor to relate it to the occurrence of symptoms. We present in this section a summary of the responses to these additional questions to give some context for the main body of the report. For example, it is interesting and useful to note that the majority of respondents use traditional desktop computers rather than laptops or PDAs (Q28) or that relatively few respondents had received touch typing training (Q40), although it is not possible to draw any conclusions on associations between these factors and the occurrence of symptoms in the study population. The numbering in this section reflects that of the questionnaire.
Q28: Which of the following do you use at work (please tick all that apply - totals add up to more than number of respondents)
Traditional desktop/workstation 1254 Laptop/notebook 241 Other (e.g. PDA, blackberry) 89
(Missing responses : 11)
Q29A: Do you know whether your work chair is adjustable?
Adjustable 1266 Not adjustable 36 Don’t know 13
(Missing/invalid responses : 12)
Q29B: If you answered ‘Adjustable’ to Q29A, do you know how to adjust your work chair?
Yes 1216 No 43
(Missing responses: 7)
Q29C: If YES to Q29B, have you ever adjusted your work chair?
Yes 1158 No 52
(Missing responses: 6)
137
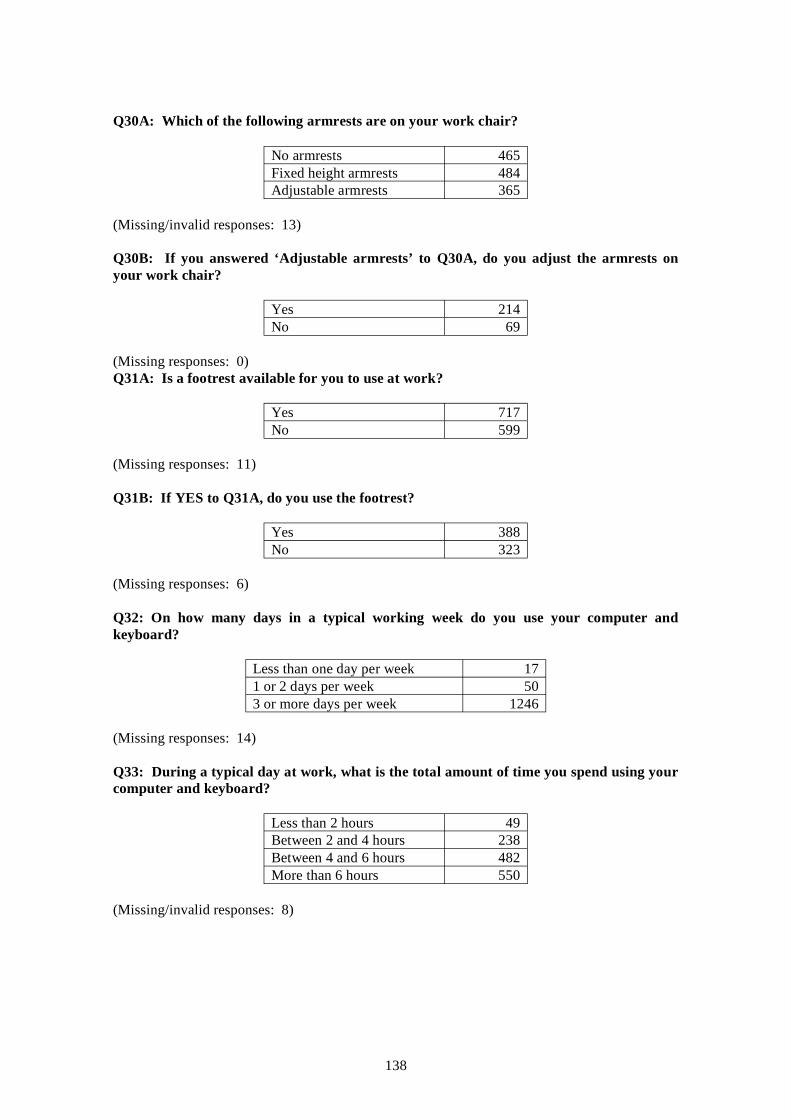
Q30A: Which of the following armrests are on your work chair?
No armrests 465 Fixed height armrests 484 Adjustable armrests 365
(Missing/invalid responses: 13)
Q30B: If you answered ‘Adjustable armrests’ to Q30A, do you adjust the armrests on your work chair?
Yes 214 No 69
(Missing responses: 0) Q31A: Is a footrest available for you to use at work?
Yes 717 No 599
(Missing responses: 11)
Q31B: If YES to Q31A, do you use the footrest?
Yes 388 No 323
(Missing responses: 6)
Q32: On how many days in a typical working week do you use your computer and keyboard?
Less than one day per week 17 1 or 2 days per week 50 3 or more days per week 1246
(Missing responses: 14)
Q33: During a typical day at work, what is the total amount of time you spend using your computer and keyboard?
Less than 2 hours 49 Between 2 and 4 hours 238 Between 4 and 6 hours 482 More than 6 hours 550
(Missing/invalid responses: 8)
138

Q34: During a typical day at work, what is the longest time you would spend using your computer and keyboard without taking a short break of 5 minutes or more?
Less than 30 minutes 88 Between 30 minutes and 1 hour 381 Between 1 and 2 hours 478 More than 2 hours 370
(Missing/invalid responses: 10)
Q35: What type of screen do you use at work?
Flat screen (stand alone) 623 Flat screen (on angle poise arm) 308 Old style bulky screen / CRT 275 Large screen for design work (e.g. CAD) 12 Laptop screen 53 Hand held / PDA / Blackberry screen 8
(Missing responses: 8)
For Q35, 40 subjects (not included in the above table) indicated more than one kind of screen as follows:
Flat screen (stand alone and on angle poise arm) 6 Flat screen (stand alone) and CRT 2 Flat screen (stand alone) and laptop screen 13 Flat screen (stand alone) and handheld screen 2 Flat screen (angle poise arm) and laptop screen 7 Flat screen (angle poise arm) and handheld screen 1 CRT and CAD screen 1 CRT and laptop screen 2 CRT and handheld screen 1 Flat screen (stand alone), CRT and laptop screen 1 Flat screen (stand alone), laptop and handheld screen 1 Flat screen (angle poise arm), laptop and handheld screen 2 Flat screen (angle poise arm), CRT, laptop and handheld screen 1
Q36: Where at work is the screen positioned when you are using it?
Directly in front of you 1019 To your left 129 To your right 159
(Missing/invalid responses: 20)
139

Q37(1): Do you find it easy to adjust the brightness of the screen?
Yes 1108 No 199
(Missing/invalid responses: 20)
Q37(2): Do you find it easy to adjust the contrast of the screen?
Yes 1096 No 211
(Missing/invalid responses: 20)
Q37(3): Do you find it easy to adjust the screen’s angle (swivel and tilt)?
Yes 1066 No 236
(Missing/invalid responses: 25)
Q38: Which of the following pointing devices do you use most frequently at work?
Mouse 1262 Tracker ball 19 Tracker pad 18 Graphic tablet / graphics stylus 0 Touch screen 2
(Missing responses: 9)
For Q38, 17 subjects (not included in the above table) indicated more than one pointing device as follows:
Mouse and tracker ball 6 Mouse and tracker pad 6 Mouse and touch screen 4 Mouse, tracker ball and graphic tablet 1
Q39: Have you received any training or information on laying out your workstation? (please tick all that apply - totals add up to more than number of respondents)
I have not received any training or information 446 Video presentation 101 Computer based assessment package 120 Workstation assessment by company safety person 526 Workstation assessment by Health and Safety company 94 Self instruction 415
(Missing responses: 19)
140

Q40: Have you received any touch typing or data entry training?
Yes 399 No 912
(Missing responses: 16)
Q41A: Do you use a computer at home?
Yes 1108 No 213
(Missing/invalid responses: 6)
The following questions Q41B to Q53 refer to the 1108 home computer users only
Q41B: What computer do you use? (please tick all that apply - totals add up to more than number of respondents)
Traditional desktop / workstation set up 906 Laptop / notebook 387 Other (e.g. hand held / PDA / Blackberry 55
(Missing responses: 3)
Q41C: If you have answered, in Q41B, that you use more than one computer at home, which of these do you use most often?
Traditional desktop / workstation set up 140 Laptop / notebook 66 Other (e.g. hand held / PDA / Blackberry 1
(Missing/invalid responses: 5)
Q42A: Which of the following do you use your home computer for?
Leisure only 711 Work only 10 Both 383
(Missing/invalid responses: 4)
Q43: On average, how many days per week do you use your computer and keyboard?
Less than one day per week 317 1 or 2 days per week 297 3 or more days per week 492
(Missing responses: 2)
Q44: On average, how many hours per day do you usually spend using your computer at home?
141

Less than 2 hours 855 Between 2 and 4 hours 203 Between 4 and 6 hours 40 More than 6 hours 7
(Missing/invalid responses: 3)
Q45: When using your computer at home, what is the longest time you would spend at the keyboard without taking a short break of 5 minutes or more?
Less than 30 minutes 347 Between 30 minutes and 1 hour 471 Between 1 and 2 hours 225 More than 2 hours 61
(Missing responses: 4)
Q46: When using your computer at home, where is it located?
Computer desk 885 Kitchen table / dining table 82 Other table e.g. coffee table 81 Other e.g. on floor 50
(Missing/invalid responses: 10)
Q47A: Is the chair that you use when using your computer at home adjustable?
Adjustable 633 Not adjustable 450 Don’t know 23
(Missing responses : 2)
Q47B: If you answered ‘Adjustable’ to Q47A, do you know how to adjust this chair?
Yes 620 No 11
(Missing responses : 2)
142

Q47C: If YES to Q47B, have you ever adjusted this chair?
Yes 582 No 36
(Missing responses : 2)
Q48A: Which of the following armrests are on the chair that you use when using your computer at home?
No armrests 624 Fixed height armrests 380 Adjustable armrests 96
(Missing/invalid responses: 8)
Q48B: If you answered ‘Adjustable armrests’ to Q48A, do you adjust the armrests on the chair that you use when using your computer at home?
Yes 84 No 12
(Missing responses: 0)
Q49: Do you use a footrest when using your computer at home?
Yes 63 No 1037
(Missing responses: 8)
Q50: What type of computer screen do you use at home?
Flat screen (stand alone) 386 Flat screen (on angle poise arm) 113 Old style bulky screen / CRT 350 Large screen for design work (e.g. CAD) 11 Laptop screen 222 Hand held / PDA / Blackberry screen 2
(Missing responses: 2)
143

For Q51, 22 subjects (not included in the above table) indicated more than one kind of screen as follows:
Flat screen (stand alone) and CRT 1 Flat screen (stand alone) and laptop screen 7 Flat screen (stand alone) and handheld screen 1 Flat screen (angle poise arm) and laptop screen 3 CRT and laptop screen 6 CAD and laptop screen 1 Flat screen (stand alone), laptop and handheld screen 1 Flat screen (angle poise arm), laptop and handheld screen 1 Flat screen (stand alone), CRT, CAD and laptop screen 1
Q52(1): Do you find it easy to adjust the brightness of the screen?
Yes 987 No 113
(Missing responses: 8)
Q52(2): Do you find it easy to adjust the contrast of the screen?
Yes 987 No 113
(Missing responses: 8)
Q52(3): Do you find it easy to adjust the screen’s angle (swivel and tilt)?
Yes 947 No 147
(Missing responses: 14)
Q53: Which of the following pointing devices do you use most commonly at home?
Mouse 932 Tracker ball 14 Tracker pad 125 Graphic tablet / graphics stylus 1 Gamepad 3 Joystick 0 Steering wheel 0 Touch screen 9
(Missing responses: 1)
144

For Q53, 23 subjects (not included in the above table) indicated more than one pointing device as follows:
Mouse and tracker ball 7 Mouse and tracker pad 8 Mouse and joystick 1 Mouse and steering wheel 1 Mouse and touch screen 2 Tracker ball and tracker pad 1 Mouse, tracker ball and graphic tablet 1 Mouse, tracker ball and steering wheel 1 Mouse, game pad and joystick 1
145

Published by the Health and Safety Executive 05/07

Health and Safety Executive
Better Display Screen Equipment (DSE) workrelated ill health data
A variety of illhealth symptoms have been associated with work with Display Screen Equipment (DSE) including musculoskeletal disorders; mental stress; and visual fatigue. The project sought information about the extent of such illhealth in DSE workers through a survey of employees. It compared the data with those in the scientific literature. An extensive literature review sought to identify consistent evidence on any possible causal role of workplace factors.
The survey found high prevalences in DSE users of selfreported symptoms, eg. headaches (52%), eye discomfort (58%), and neck pain (47%); other symptoms such as back (37%) and shoulder (39%) pain were also frequently reported. Most of those reporting symptoms did not take any time off work. These findings are broadly consistent with other studies in the literature.
The results showed a significant influence of DSE work in that the prevalences of symptoms were higher among those who spent more time at their computer at work and among those who worked for longer without a break. All symptoms were more common among respondents who had indications of stress, anxiety and/or depression. These findings are again consistent with the published literature. Although many studies have examined possible causal factors, methodological differences make it hard to draw any firm conclusions about causation of symptoms.
Comparing these results with those of earlier research provides no positive evidence that the introduction of legislation on DSE work in 1993 has reduced illhealth in DSE workers. However there are substantial uncertainties, not least over the extent to which the provisions of the legislation have been fully implemented, and it cannot be safely concluded that the legislation has had no effect. The report discusses the significance of its detailed results in the context of relevant factors in the workplace, and makes recommendations.
This report and the work it describes were funded by the Health and Safety Executive (HSE). Its contents, including any opinions and/or conclusions expressed, are those of the authors alone and do not necessarily reflect HSE policy.
RR561
www.hse.gov.uk