Better Demand Planning for Beverage Distributors
17
Better Demand Planning for Beverage Distributors Managing Forecast Error to Improve Sales Performance Keith Peterson, PhD | President & CEO | Halo
-
Upload
daniel-bachar -
Category
Software
-
view
871 -
download
2
Transcript of Better Demand Planning for Beverage Distributors

Better Demand Planning for Beverage DistributorsManaging Forecast Error to Improve Sales
Performance
Keith Peterson, PhD | President & CEO | Halo

In 2014, craft beer volume sales increased just more than 17%, and dollar sales were up 20.5% in U.S. multi-outlets and convenience stores (IRI).
From 2009 to 2014, craft beer volume sales increased 81%. They grew 14% in 2014 alone.
THE BEVERAGE INDUSTRY IS CONTINOUSLY CHANGING…
The ground coffee segment was down almost 3.5% in dollar sales in U.S. multi-outlets…(while) shelf-stable cappuccinos and iced coffees increased 15.6% in dollar sales.
Although the overall energy drinks category was up 6.9% …this single-digit increase is in contrast to double-digit increases in years past.
Source: we pulled these stats from Bevindustry.com (http://www.bevindustry.com/articles/88556-state-of-the-beverage-industry-report?v=preview)

Like much of the beverage industry, craft beer has also been impacted by SKU proliferation. Craft brewers saw SKUs increase 6.6% in 2014, with more than 3,890 packages in the marketplace.
Lift trucks innovate to meet SKU proliferation trends…Forklifts designed to help beverage companies with cost containment and productivity
…AND SUPPLIERS AND DISTRIBUTORS MUST RESPOND
TO CHANGE
Source: we pulled these stats and insights from Bevindustry.com (http://www.bevindustry.com/articles/88556-state-of-the-beverage-industry-report?v=preview)
Bottles continue to be the bulk of the category; however cans are driving far more than their fair share of growth — 8% share versus 28% of case volume growth.

In a world of exploding SKU’s, diverse competition and changing consumer tastes,
forecasting is different.
It is no longer reasonable to expect that your historical sales trends will consistently
predict future performance.
⏵ If you need better customer service and operational efficiencies, then its time focus on your demand planning process
⏵ One of the best ways to improve your demand plan is to improve your sales forecasting
⏵ While many suppliers and distributors still rely on spreadsheets – there are better tools to improve forecast management and collaboration
⏵ But, its not as easy to improve forecasting accuracy - supplier performance, pricing shifts, weather and a host of other factors impact sales predictability
⏵ Some people say, “Then why bother trying to forecast?”
Sales forecasting for suppliers and distributors
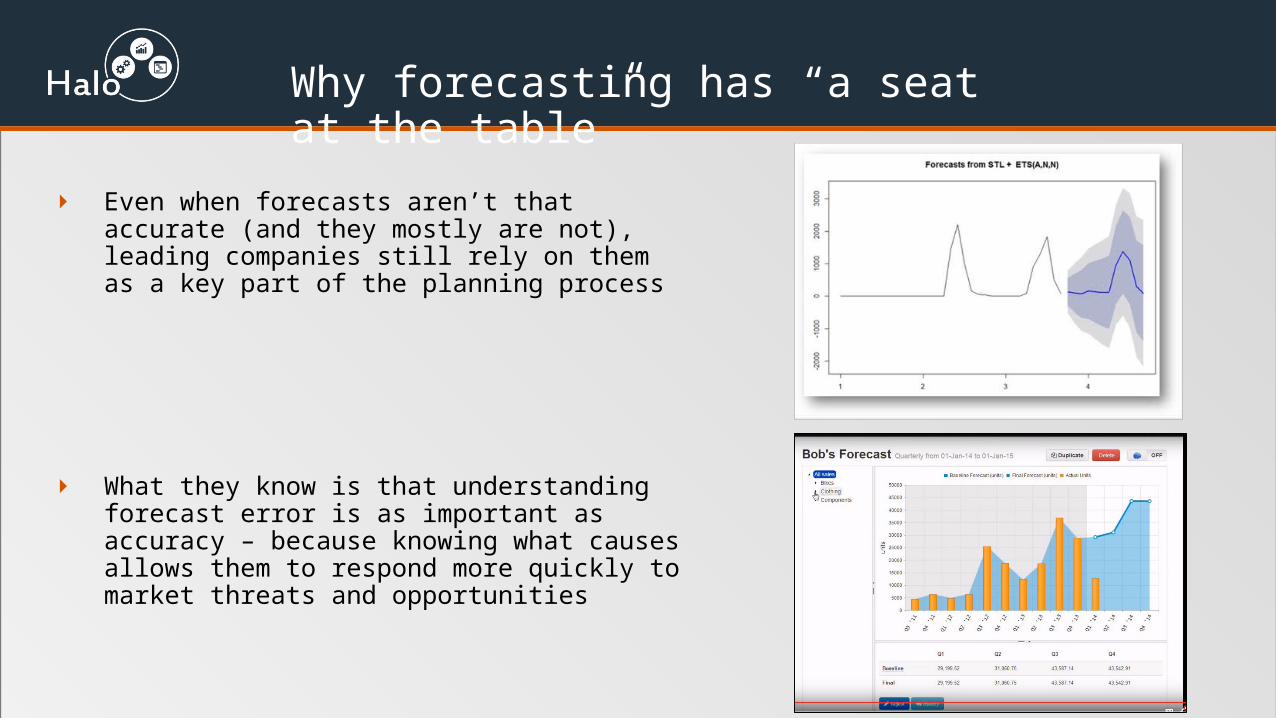
⏵ Even when forecasts aren’t that accurate (and they mostly are not), leading companies still rely on them as a key part of the planning process
⏵ What they know is that understanding forecast error is as important as accuracy – because knowing what causes allows them to respond more quickly to market threats and opportunities
Why forecasting has “a seat at the table”

⏵ Statistical forecasting is most commonly based on using historical sales data combined with management inputs to determine future demand
⏵ When those predictions are wrong, it is usually because of changes in demand that are not measured by historical experience
⏵ The beverage industry is changing fast and becoming more and more complex – given all the changes, its pretty unreasonable to expect that highly accurate forecasts can be generated just from the traditional sales history and staff inputs
⏵ But, we can use forecasting and error analysis to be smarter and faster decision makers
Forecasting with historical sales
⏵ Knowing how much stock to maintain is key to maximizing your working capital• Carry too much and you are tying up working capital• Carry to little and you risk disappointing customers (and future sales)
⏵ Distributors have to keep up with changing taste and exploding SKU’s• Service, manage, order and rotate• Moving from local to regional markets
⏵ Accurately forecasting inventory allows distributors to improve coverage and service levels while freeing more working capital
Why forecasting? Working capital

⏵ The key to reducing forecast error is better data and more collaboration with suppliers and customers
⏵ Data that improves visibility into downstream demand, as currently as possible includes aggregated depletion information for competitors, retail sales data, and factors that impact local demand (e.g., loss of a big employer, weather)
⏵ Collaboration that improves visibility into supply and demand requires interaction with suppliers and customers. Inputs into a collaborative forecast include your own historical data, supplier and customer forecasts, and sales personnel inputs
Getting to better forecasts

⏵ 80% of forecasting is still done in spreadsheets, but• Spreadsheets don’t handle large volumes of data• Spreadsheets don’t easily support automation of data collection
⏵ 75% of statistical forecasts are manually edited by managers• Spreadsheets are not ideal for sharing and collaborating on forecast across teams
and stakeholders• Spreadsheets don’t enable easy modeling and “what if” planning
Forecasting processes

⏵ Done right, forecasting is data and analysis intensive
⏵ Without the right tools, the forecasting process is often defined by shortcuts
⏵ Common short cuts include:• Only running forecasts quarterly, depending on how much effort it takes to compile
the data• Generating forecasts for big time periods (monthly)• Using simple forecasts based mostly on historical sales trends • Doing top down forecasts that “disaggregate” a company or product family forecast
to the SKU level – rather than forecasting from a “bottom up” or “middle out” process
Spreadsheets and manual processes take their toll

⏵ In general, and especially in beverage, the longer your forecast time horizon, the greater the error
⏵ If you can forecast more quickly for more granular time intervals, you will see big results because you can react faster
Getting more value from your forecasting
Weekly Monthly Quarterly
Buffer in stock required
10% 25% 60%

⏵ Getting your forecasts competed more quickly means focusing on areas that drive variability• Research which larger customers most impact your forecast error and work on
improving predictability with them
• Data management is often the most manual, time consuming and error prone phase of the process – use tools that automate and control these tasks (/HTML)
• Use exception management – build reports that highlight what products and SKU’s have large changes in forecast accuracy and research the causes – review more stable products only periodically
Reducing your forecast production intervals

⏵ Data access and integration• Pull data directly from ERP and syndicated data streams• ‘Bind’ data from spreadsheets and other sources for ad hoc analysis• Input screens for managers to adjust forecasts and “write back” results to planning
software
⏵ Forecast automation• Leverage computer programs that auto-select the best forecast based on
performance and the nature of your data (completeness, skew, variation)• Leverage computer programs that provide options to define your own product
hierarchy and do “top down”, “bottom up”, and “middle out” forecasts
New tools to improve results and simplify your life

⏵ Visual analytics • Use charts to group products by forecast accuracy metrics to help determine which
products need the most attention• Use charts to track the “forecastability” of your data – no need to keep trying to
improve forecasts that are as good as they can get
⏵ Exception reporting• Monitoring hundreds of SKU’s is time consuming and often not profitable. Prioritize
SKU’s by error and change in demand variability for more intensive reviews
⏵ Automated replenishment plans• Set cycle and buffer stock levels based on historical performance. Then use
reporting to help sales and operations collaborate on how to optimize inventory planning
New tools to improve results and simplify your life

⏵ Which is most valuable to you:• Reduce working capital while maintaining service levels?• Increase service levels without spending more?
⏵ Reducing your forecast cycle times will allow you to plan better and react faster to changing market conditions
⏵ Where you can see a return• Reducing the amount of time and effort on your forecasting process• Reducing the impact of negative market changes before they hit your books• Increasing your readiness to react to market trends for new flavors, packaging and
branding
ROI for beverage distributors

Let’s keep talking
More information: halobi.com/resources
Blog: halobi.com/blog
Contact: halobi.com/contact-us