
BESTPLACESTOWORK · The Best Places to Work engagement score is calculated using a proprietary...
16
2018 RANKINGS BESTPLACESTOWORK.ORG
Transcript of BESTPLACESTOWORK · The Best Places to Work engagement score is calculated using a proprietary...

2 0 1 8 R A N K I N G S
BESTPLACESTOWORK.ORG

America deserves a federal government that is
highly effective—one that is efficient, innovative and
responsive to the needs of its citizens. Government
works best when it has an engaged workforce,
good leaders and the processes, structures and
information to make smart decisions. The Partnership
for Public Service accomplishes its mission by
identifying opportunities to make government work
better, offering solutions to fix government where it
is broken and collaborating with people inside and
outside government to bring about change.
The Best Places to Work in the Federal Government® rankings, part of our effort to improve
the federal workforce and the management of
the government, offer the most comprehensive
assessment of how federal public servants view their
jobs and workplaces. The rankings provide employee
perspectives on leadership, pay, innovation, work–life
balance and a range of other issues.
The rankings and accompanying data also give
federal leaders a way to measure employee
engagement of the federal workforce as a whole
as well as at individual departments, agencies, and
their subcomponents. This serves to alert federal
leaders to signs of trouble and provides a roadmap
to better manage our government’s most important
asset—its employees. The best private sector
organizations understand that increased employee
engagement leads to better performance and
outcomes, and federal leaders need to follow suit
by placing greater emphasis on strengthening the
workforce and the workplace culture.
Please go to bestplacestowork.org for detailed
data showing where agencies stand and for
resources that can help turn the Best Places to
Work rankings into a plan for change.

A LOOK ACROSS THE FEDERAL GOVERNMENT
The 2018 Best Places to Work rankings represent the tale of two governments: one with agencies that have committed leaders who foster high and improving levels of employee engagement, and the other in which a lack of leadership has led to static or declining employee engagement. The divergent paths of these two governments give the White House, Congress and federal agency leaders a roadmap to what works, what doesn’t and how to improve employee engagement and agency performance.
Since 2003, when we published the first rankings, we have learned that good leaders not only focus on policy, but place an emphasis on creating workplace conditions that foster improved government effectiveness and performance.
According to the 2018 Best Places to Work data, employee engagement declined at 59.1 percent of the federal organizations included in the rankings, while only 39.6 percent registered increases and 1.3 percent stayed the same. This represents a stark contrast to the previous three years when more than 70 percent of federal organizations experienced
How do we calculate the engagement score?
The Best Places to Work engagement score is calculated using a proprietary weighted formula that looks at responses to three questions in the Federal Employee Viewpoint Survey conducted by the Office of Personnel Management.
• I recommend my organization as a good place to work. (Q. 40)
• Considering everything, how satisfied are you with your job? (Q. 69)
• Considering everything, how satisfied are you with your organization? (Q. 71)
A CLOSER LOOK AT EMPLOYEE ENGAGEMENT IN 2018
Government-wide Best Places to Work in the Federal Government® data: Partnership for Public Service. Private-sector data: Mercer | Sirota. Learn more at bestplacestowork.org.
Only 39.6% of agencies improved their Best Places to Work engagement score in 2018 while 59.1% declined and 1.3% stayed the same.
The 2018 government-wide engagement score is 62.2 points out of 100 compared to the private sector average of 77.1 out of 100, a 14.9-point difference.
PRIVATE SECTOR 77.1
GOVERNMENT-WIDE 62.2
39+60+159.1%
39.6%
60
70
50
80
1.3%
77.3/100 EMPLOYEE SKILLS– MISSION MATCH
67.8/100
TEAMWORK
61.4/100 WORK–LIFE BALANCE
61.0/100 TRAINING AND DEVELOPMENT
60.1/100
SUPPORT FOR DIVERSITY
59.9/100
PAY
57.6/100 STRATEGIC MANAGEMENT
56.4/100 EFFECTIVE LEADERSHIP
47.1/100 PERFORMANCE-BASED REWARDS AND ADVANCEMENT
63.8/100 INNOVATION
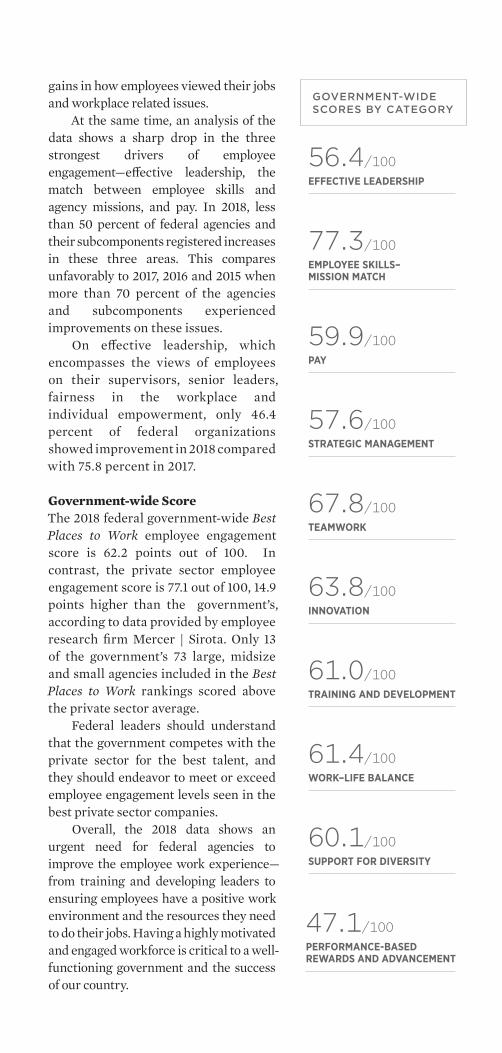
GOVERNMENT-WIDE SCORES BY CATEGORY
gains in how employees viewed their jobs and workplace related issues.
At the same time, an analysis of the data shows a sharp drop in the three strongest drivers of employee engagement—effective leadership, the match between employee skills and agency missions, and pay. In 2018, less than 50 percent of federal agencies and their subcomponents registered increases in these three areas. This compares unfavorably to 2017, 2016 and 2015 when more than 70 percent of the agencies and subcomponents experienced improvements on these issues.
On effective leadership, which encompasses the views of employees on their supervisors, senior leaders, fairness in the workplace and individual empowerment, only 46.4 percent of federal organizations showed improvement in 2018 compared with 75.8 percent in 2017.
Government-wide Score The 2018 federal government-wide Best Places to Work employee engagement score is 62.2 points out of 100. In contrast, the private sector employee engagement score is 77.1 out of 100, 14.9 points higher than the government’s, according to data provided by employee research firm Mercer | Sirota. Only 13 of the government’s 73 large, midsize and small agencies included in the Best Places to Work rankings scored above the private sector average.
Federal leaders should understand that the government competes with the private sector for the best talent, and they should endeavor to meet or exceed employee engagement levels seen in the best private sector companies.
Overall, the 2018 data shows an urgent need for federal agencies to improve the employee work experience—from training and developing leaders to ensuring employees have a positive work environment and the resources they need to do their jobs. Having a highly motivated and engaged workforce is critical to a well-functioning government and the success of our country.

AGENCY RANKINGS
For the seventh consecutive year, NASA increased its Best Places to Work score and has retained its standing as the number one large federal agency. The space agency’s employee engagement score is 81.2 out of 100, a 0.3-point increase from 2017. The Department of Health and Human Services ranks second among large agencies, increasing its score for the fourth consecutive year to 70.9.
In the midsize category, the Federal Trade Commission took top honors with a score of 84.0 and moved up from fourth place in 2017. It is followed by the Federal Energy Regulatory Commission at 83.9 and the Securities and Exchange Commission with a score of 82.1.
The top-ranked small agency for the second year in a row is the Federal Mediation and Conciliation Service with a score of 87.2, followed by the U.S. International Trade Commission at 85.7.
The Office of the General Counsel at the Federal Energy Regulatory Commission and the Office of the Inspector General at the Tennessee Valley Authority tied for the top honor among agency subcomponents, with scores of 95.0.
Agencies on the RiseThe most improved large federal organization is the Office of the Secretary of Defense, Joint Staff, Defense Agencies and the Department of Defense Field Activities, which raised its score by 2.1 points to 63.2.
The Federal Trade Commission and the Small Business Administration tied for the most improved midsize agency, each rising 2.6 points. The Federal Election Commission saw the biggest improvement among small agencies with a 9.6 point increase, although it ranks 25th out of 29 small agencies. The Secret Service is the most improved agency subcomponent with an 11 point increase, although it ranks 398th out of 415 subcomponents.
Agencies Falling BehindWhile a number of agencies were successful in creating a more robust and positive work environment, others faced great difficulties.
The Department of Agriculture experienced the biggest decrease in employee engagement among large agencies, dropping 6.9 points to a score of 59.0 and from seventh to 16th place in the rankings. For the second consecutive year, the Department of State experienced a decline in employee engagement, dropping 3.3 points to a score of 60.7 and falling from eighth to 14th place in the rankings.
In the midsize category, the Consumer Financial Protection Bureau’s score declined by 25.2 points to 51.7, resulting in a fall in the rankings from seventh to 26th place. The National Labor Relations Board’s score decreased by 12.6 points to 55.3 while the Department of Education dropped 12.4 points and was last in the rankings with a score of 47.3.
In the small agency category, the Federal Labor Relations Authority’s score dropped by 31 points to 41.6. The Domestic Nuclear Detection Office at the Department of Homeland Security experienced the biggest decline among subcomponents, falling 46.9 points for a score of 13.7, while DHS, its parent agency, went up 1.1 points.

RANK AGENCY SCORE CHANGE
1 National Aeronautics and Space Administration 81.2 0.3
2 Department of Health and Human Services 70.9 0.5
3 Department of Commerce 70.3 1.1
4 Department of Transportation 67.7 0.1
5 Intelligence Community 66.3 -0.3
6 Department of Veterans Affairs 64.2 NA
7 Office of the Secretary of Defense, Joint Staff, Defense Agencies, and Department of Defense Field Activities 63.2 2.1
7 Department of the Navy 63.2 -0.6
9 Department of the Interior 62.8 -1.1
10 Department of Justice 62.6 -1.1
11 Department of the Army 62.4 0.0
12 Social Security Administration 61.9 -1.1
13 Department of the Treasury 61.3 -0.3
14 Department of State 60.7 -3.3
15 Department of the Air Force 60.4 -0.3
16 Department of Agriculture 59.0 -6.9
17 Department of Homeland Security 53.1 1.1
EMPLOYEE ENGAGEMENT SCORES
LARGE AGENCIES15,000 OR MORE EMPLOYEES

The Best Places to WorkIN THE FEDERAL GOVERNMENT 2012
View the complete rankings by category at bestplacestowork.org.
SCORES BY CATEGORY
EFFECTIVE LEADERSHIP
1 National Aeronautics and Space Administration 75.0 0.3
2 Intelligence Community 63.1 1.0
3 Department of Health and Human Services 62.3 1.2
4 Department of Commerce 60.3 0.7
5 Department of Transportation 59.1 1.2
EMPLOYEE SKILLS–MISSION MATCH
1 National Aeronautics and Space Administration 86.0 0.6
2 Department of Health and Human Services 81.6 0.6
3 Department of Commerce 79.9 1.1
4 Intelligence Community 79.8 0.2
5 Department of the Interior 78.8 0.6
5 Department of Transportation 78.8 -0.6
PAY
1 National Aeronautics and Space Administration 71.4 -0.1
2 Intelligence Community 66.7 0.8
3 Department of Commerce 64.3 -0.2
4 Office of the Secretary of Defense, Joint Staff, Defense Agencies, and Department of Defense Field Activities
63.9 0.7
5 Department of Health and Human Services 63.5 0.6
STRATEGIC MANAGEMENT
1 National Aeronautics and Space Administration 70.5 2.2
2 Department of Health and Human Services 63.9 2.5
3 Department of Commerce 62.7 3.1
4 Department of State 59.9 -0.2
5 Office of the Secretary of Defense, Joint Staff, Defense Agencies, and Department of Defense Field Activities
59.7 3.9
INNOVATION
1 National Aeronautics and Space Administration 81.9 0.4
2 Intelligence Community 72.7 2.7
3 Department of Health and Human Services 70.0 0.5
4 Department of the Air Force 65.8 0.3
5 Department of the Army 65.7 1.0
5 Department of the Interior 65.7 0.3
TEAMWORK
1 National Aeronautics and Space Administration 81.8 0.8
2 Intelligence Community 78.4 -0.4
3 Department of Transportation 71.9 0.8
4 Department of Health and Human Services 71.7 0.9
5 Department of the Treasury 71.3 0.6

RANK AGENCY SCORE CHANGE
1 Federal Trade Commission 84.0 2.6
2 Federal Energy Regulatory Commission 83.9 1.0
3 Securities and Exchange Commission 82.1 1.2
4 Government Accountability Office 80.7 -1.8
5 Federal Deposit Insurance Corporation 80.5 -1.4
6 Peace Corps 79.8 -0.9
7 Smithsonian Institution 76.7 -0.2
8 National Science Foundation 75.5 0.8
9 Architect of the Capitol 75.3 NA
10 General Services Administration 74.5 0.8
11 Nuclear Regulatory Commission 72.8 1.5
12 Department of Energy 68.5 1.9
13 U.S. Agency for International Development 67.2 -2.3
13 National Credit Union Administration 67.2 -1.8
15 Equal Employment Opportunity Commission 65.4 -1.1
16 Office of Personnel Management 65.2 -0.5
17 Federal Communications Commission 64.4 1.6
18 Court Services and Offender Supervision Agency 63.5 0.4
19 Department of Labor 63.0 -3.2
20 Small Business Administration 62.0 2.6
21 Department of Housing and Urban Development 60.1 -2.3
22 Environmental Protection Agency 57.5 -6.0
23 National Archives and Records Administration 56.7 -4.8
24 National Labor Relations Board 55.3 -12.6
25 U.S. Agency for Global Media 52.5 1.3
26 Consumer Financial Protection Bureau 51.7 -25.2
27 Department of Education 47.3 -12.4
EMPLOYEE ENGAGEMENT SCORES
MIDSIZE AGENCIES1 ,000–14,999 EMPLOYEES

The Best Places to WorkIN THE FEDERAL GOVERNMENT 2012
SCORES BY CATEGORY
View the complete rankings by category at bestplacestowork.org.
EFFECTIVE LEADERSHIP
1 Federal Trade Commission 75.0 1.0
2 Federal Energy Regulatory Commission 74.6 0.9
3 Securities and Exchange Commission 68.6 1.7
4 Peace Corps 68.1 -0.9
5 Nuclear Regulatory Commission 67.9 1.8
EMPLOYEE SKILLS–MISSION MATCH
1 Federal Trade Commission 87.8 0.6
2 Securities and Exchange Commission 84.3 1.2
3 Federal Energy Regulatory Commission 83.5 0.3
4 Peace Corps 82.9 0.0
5 Federal Deposit Insurance Corporation 82.8 0.0
PAY
1 Federal Deposit Insurance Corporation 79.1 -0.7
2 Securities and Exchange Commission 76.2 0.0
3 Federal Energy Regulatory Commission 71.4 2.2
4 Nuclear Regulatory Commission 71.3 0.8
5 General Services Administration 70.1 -0.3
STRATEGIC MANAGEMENT
1 Federal Trade Commission 76.1 2.1
2 Federal Energy Regulatory Commission 74.4 0.8
3 Peace Corps 73.5 1.0
4 Federal Deposit Insurance Corporation 69.8 -0.8
5 Architect of the Capitol 69.2 NA
INNOVATION
1 Federal Trade Commission 79.8 2.9
2 Peace Corps 75.0 0.4
3 National Science Foundation 72.8 0.4
4 Securities and Exchange Commission 71.9 1.7
5 Federal Energy Regulatory Commission 71.8 2.3
TEAMWORK
1 Federal Energy Regulatory Commission 83.2 1.1
2 Federal Trade Commission 83.1 -0.7
3 Peace Corps 79.3 -0.4
4 General Services Administration 78.6 0.8
5 Nuclear Regulatory Commission 78.5 2.1

RANK AGENCY SCORE CHANGE
1 Federal Mediation and Conciliation Service 87.2 0.3
2 U.S. International Trade Commission 85.7 4.8
3 Congressional Budget Office 85.3 NA
4 Farm Credit Administration 81.1 0.6
5 Pension Benefit Guaranty Corporation 78.3 4.8
6 National Transportation Safety Board 77.8 0.3
7 Office of Management and Budget 75.0 -0.4
8 National Endowment for the Humanities 74.9 3.5
9 Federal Maritime Commission 74.4 6.9
10 Overseas Private Investment Corporation 73.6 -6.2
11 National Endowment for the Arts 72.6 -7.9
12 Millennium Challenge Corporation 69.1 -4.7
13 Corporation for National and Community Service 66.3 -6.6
14 Office of Special Counsel 66.1 -7.4
14 National Gallery of Art 66.1 3.2
14 Consumer Product Safety Commission 66.1 -5.8
17 Federal Housing Finance Agency 65.6 1.1
18 Merit Systems Protection Board 64.2 -4.3
19 Surface Transportation Board 64.0 -2.3
20 International Boundary and Water Commission 63.2 2.8
21 Railroad Retirement Board 63.1 -6.2
22 Federal Retirement Thrift Investment Board 61.9 6.9
23 Commodity Futures Trading Commission 58.3 -0.3
24 Office of the U.S. Trade Representative 57.8 -3.1
25 Federal Election Commission 49.4 9.6
26 Selective Service System 44.2 -0.1
27 Federal Labor Relations Authority 41.6 -31.0
28 Defense Nuclear Facilities Safety Board 38.7 0.1
29 Export-Import Bank of the United States 36.8 -18.1
EMPLOYEE ENGAGEMENT SCORES
SMALL AGENCIES100–999 EMPLOYEES

SCORES BY CATEGORY
View the complete rankings by category at bestplacestowork.org.
EFFECTIVE LEADERSHIP
1 Federal Mediation and Conciliation Service 80.4 1.6
2 U.S. International Trade Commission 73.6 3.6
3 Pension Benefit Guaranty Corporation 69.6 5.0
4 Farm Credit Administration 69.4 0.9
5 National Transportation Safety Board 65.8 2.5
PAY
1 Farm Credit Administration 78.5 -1.6
2 Federal Mediation and Conciliation Service 77.2 -2.2
3 National Transportation Safety Board 76.2 2.5
4 Federal Labor Relations Authority 74.2 4.1
5 Federal Maritime Commission 73.0 8.2
STRATEGIC MANAGEMENT
1 U.S. International Trade Commission 80.6 5.5
2 Federal Mediation and Conciliation Service 78.3 2.1
3 Office of Management and Budget 75.6 2.2
4 Federal Maritime Commission 75.5 5.6
5 Farm Credit Administration 73.4 1.9
INNOVATION
1 Federal Mediation and Conciliation Service 85.1 -0.5
2 U.S. International Trade Commission 77.1 3.7
3 Office of Management and Budget 76.7 -1.3
4 Pension Benefit Guaranty Corporation 75.7 5.6
5 Millennium Challenge Corporation 73.6 0.3
TEAMWORK
1 Federal Mediation and Conciliation Service 86.6 3.5
2 Office of Management and Budget 84.7 0.9
3 U.S. International Trade Commission 84.2 2.7
4 Farm Credit Administration 80.4 0.6
5 Office of Special Counsel 78.2 -4.8

RANK AGENCY SCORE CHANGE
1 Office of Inspector General (TVA) 95.0 2.9
1 Office of the General Counsel (FERC) 95.0 2.2
3 Bureau of Consumer Protection - All (FTC) 88.7 NA
4 Bureau of Competition - All (FTC) 88.0 NA
5 Office of General Counsel (SEC) 87.9 4.9
6 Office of Financial Management (SEC) 87.8 3.4
7 Region I (NRC) 87.4 NA
8 Alcohol and Tobacco Tax and Trade Bureau (Treasury) 87.1 2.6
9 National Examination Program (SEC) 86.2 4.3
9 Office of Operations - All (ITC) 86.2 NA
11 Office of Support Operations (SEC) 85.5 -1.3
12 Office of Energy Market Regulation (FERC) 85.1 0.9
13 Kennedy Space Center (NASA) 84.2 4.0
13 Region III (NRC) 84.2 NA
15 Division of Investment Management (SEC) 84.0 0.8
16 Goddard Space Flight Center (NASA) 83.4 -0.1
17 National Enforcement Program (SEC) 82.8 0.2
18 Marshall Space Flight Center (NASA) 82.7 0.8
19 Office of the Executive Director (FERC) 81.9 5.0
20 Johnson Space Center (NASA) 81.5 -0.3
20 Stennis Space Center (NASA) 81.5 -0.4
22 Office of Energy Projects (FERC) 81.2 0.0
23 Office of the Inspector General (DOT) 81.0 -2.8
24 U.S. Army Audit Agency (Army) 80.9 -1.1
25 Office of the Inspector General (DOJ) 80.8 3.1
26 Office of Inspector General (HHS) 80.7 2.5
27 Office of Information Technology (PBGC) 80.6 NA
27 Office of the General Counsel (GSA) 80.6 7.9
29 Directorate for Biological Sciences (NSF) 80.3 -2.0
30 Langley Research Center (NASA) 80.0 -0.4
30 Office of Examinations (FCA) 80.0 NA
30 Glenn Research Center (NASA) 80.0 2.0
33 U.S. Special Operations Command (Army) 79.9 4.4
33 Division of Corporation Finance (SEC) 79.9 -2.3
EMPLOYEE ENGAGEMENT SCORES
AGENCY SUBCOMPONENTSSUBAGENCIES, BUREAUS, DIVISIONS, CENTERS AND OFFICES*
*NUMBER OF EMPLOYEES VARIES
View the complete rankings of 415 subcomponents at bestplacestowork.org.

EFFECTIVE LEADERSHIP
1 Office of the General Counsel (FERC) 86.4 -0.4
2 Region I (NRC) 82.5 NA
3 Kennedy Space Center (NASA) 79.4 3.0
3 Alcohol and Tobacco Tax and Trade Bureau (Treasury) 79.4 3.8
5 Bureau of Competition - All (FTC) 79.0 NA
EMPLOYEE SKILLS–MISSION MATCH
1 Office of the General Counsel (FERC) 93.3 4.0
2 Office of Inspector General (TVA) 91.5 1.9
3 Bureau of Competition - All (FTC) 90.6 NA
4 Bureau of Consumer Protection - All (FTC) 89.2 NA
5 Alcohol and Tobacco Tax and Trade Bureau (Treasury) 88.1 1.3
PAY
1 Office of Inspector General (TVA) 97.7 5.3
2 Office of the Inspector General (Interior) 86.2 5.9
3 Office of General Counsel (SEC) 85.9 3.8
4 Office of Financial Management (SEC) 85.0 -3.9
5 Office of Support Operations (SEC) 84.9 -3.8
STRATEGIC MANAGEMENT
1 Office of Inspector General (TVA) 89.4 0.8
2 Office of the General Counsel (FERC) 88.1 4.6
3 Bureau of Competition - All (FTC) 81.8 NA
4 Office of Support Operations (SEC) 80.9 -1.2
5 Region I (NRC) 79.5 NA
INNOVATION
1 Office of Inspector General (TVA) 86.2 -0.4
2 Office of the General Counsel (FERC) 84.1 8.0
3 Goddard Space Flight Center (NASA) 83.8 0.4
4 Johnson Space Center (NASA) 83.6 0.3
5 Kennedy Space Center (NASA) 82.9 3.1
TEAMWORK
1 Office of the General Counsel (FERC) 93.6 2.8
2 Region I (NRC) 91.2 NA
3 Office of Inspector General (TVA) 89.7 0.6
4 Bureau of Consumer Protection - All (FTC) 88.4 NA
5 Office of Operations - All (ITC) 85.5 0.6
SCORES BY CATEGORY
View the complete rankings by category at bestplacestowork.org.

ADDITIONAL BEST PLACES TO WORK FACTS AND FINDINGS
★ The 2018 Best Places to Work rankings include the views of employees from 488 federal agencies and subcomponents, the most in the history of the rankings. There are 17 large agencies, 27 midsize agencies, 29 small agencies and 415 subcomponents included in the rankings.
★ The Securities and Exchange Commission has improved its Best Places to Work employee engagement score by 26.1 points since 2012, moving up in the midsize agency rankings from 19th place six years ago to third place in 2018 and registering a score of 82.1.
★ The Environmental Protection Agency’s employee engagement score fell for the second year in a row, dropping 6 points to 57.5 in 2018. Employees gave the agency’s senior leaders low marks with a score of 38.1 out of 100, a decline of 7.1 points compared to 2017.
★ Two agencies dealing with trade took divergent paths in 2018. The U.S. International Trade Commission ranked second among small agencies, increasing its score by 4.8 points to 85.7. In contrast, the Office of the U.S. Trade Representative’s score dropped 3.1 points to 57.8 and the office fell to 24th place among small agencies.
★ Two agencies that deal with the rights of federal employees experienced a decline in employee engagement. The Federal Labor Relations Authority dropped 31 points while the Merit Systems Protection Board fell by 4.3 points in their Best Places to Work engagement scores.
★ The Partnership and BCG found that the federal government has a highly mission-focused workforce, but needs stronger leadership. The Best Places to Work data shows that effective leadership remains the key driver of employee engagement as it has been every year since the rankings were launched in 2003, but only 46.4 percent of government agencies and their subcomponents in the rankings experienced an improvement in how employees view their leaders while 53.6 percent either stayed the same or declined.
The Best Places to Work in the Federal Government® rankings—the most comprehensive and authoritative rating of employee engagement in the federal government—are produced by the Partnership for Public Service and Boston Consulting Group.
For 17 years, the nonpartisan, nonprofit Partnership for Public Service has been dedicated to making the federal government more effective for the American people. We work across administrations to help transform the way government operates by increasing collaboration, accountability, efficiency and innovation. Visit ourpublicservice.org to learn more. Follow us on social @RPublicService and subscribe today to get the latest federal news and information on upcoming Partnership programs and events, and more.
Boston Consulting Group (BCG) is a global management consulting firm and the world's leading advisor on business strategy. We partner with clients from the private, public, and not-for-profit sectors in all regions to identify their highest-value opportunities, address their most critical challenges, and transform their enterprises. Our customized approach combines deep insight into the dynamics of companies and markets with close collaboration at all levels of the client organization. This ensures that our clients achieve sustainable competitive advantage, build more capable organizations, and secure lasting results. Founded in 1963, BCG is a private company with offices in more than 90 cities in 50 countries.
ABOUT BEST PLACES TO WORK

The majority of the data used to develop the Best Places to Work rankings was collected by the Office of Personnel Management through its Federal Employee Viewpoint Survey. The survey was administered April through June 2018 to permanent executive branch employees and was completed by 598,003 federal workers, for a response rate of 40.6 percent, a decline of 4.9 points from 2017.
The rankings also include responses from more than 249,000 additional employees at 12 agencies who were surveyed at the same time and had a response rate of more than 50 percent. The Architect of the Capitol, Congressional Budget Office, Consumer Financial Protection Bureau, Department of Veterans Affairs, Federal Deposit Insurance Corporation, Government Accountability Office, Millennium Challenge Corporation, Office of the Inspector General at the Tennessee Valley Authority, Office of the Inspector General at the United States Postal Service, Peace Corps, Smithsonian Institution, and the U.S. Army Audit Agency provided data from their own surveys. In addition, the rankings incorporate responses from employees at the nation’s intelligence agencies, which conducted a similar survey but did not report the number of respondents because it is classified.
For the first time since the launch of the Best Places to Work rankings in 2003, the Department of Veterans Affairs did not to participate in the 2018 FEVS and instead decided to administer its own internal survey. Since the VA’s survey included the three questions needed to calculate an agency’s Best Places to Work employee engagement score, the department is included in our rankings. However, like other agencies that conduct their own surveys, we have not included the VA’s data in the calculation of the 2018 government-wide score. Please see bestplacestowork.org for more information.
Organizations are ranked within one of four groupings: large agency (15,000 or more employees), midsize agency (1,000-14,999 employees), small agency (100-999 employees) and agency subcomponent (subagency, bureau, division, center or office).
The 2018 rankings include 488 federal agencies and their subcomponents: 17 large federal agencies, 27 midsize agencies, 29 small agencies and 415 subcomponents.
The OPM survey data was weighted to represent all federal employees on demographic characteristics such as age, gender, race, supervisory status, agency size and occupation. The survey results have a margin of error of plus or minus 1 percent.
The Best Places to Work statistical model, developed with CFI Group in 2003, is based on the same methodology used in CFI Group’s American Customer Satisfaction Index. The Best Places to Work engagement score is calculated based on the percentage of positive responses to three workplace engagement questions and is weighted according to a proprietary formula developed with Hay Group in 2007.
The workplace environment scores are calculated by averaging the percentage of positive responses to questions in 10 categories, including effective leadership, employee skills–mission match, pay, and work–life balance. Regression analysis is used to determine the categories with the most influence on the Best Places to Work engagement score.
METHODOLOGY
The Partnership for Public Service and Boston Consulting Group extend thanks to the Office of Personnel Management for its administration of the Federal Employee Viewpoint Survey, upon which the Best Places to Work rankings are based.

Copyright © 2018 Partnership for Public Service. The Best Places to Work in the Federal Government is a registered trademark of the Partnership for Public Service. All rights reserved.
1100 New York Ave NW Suite 200 EastWashington DC 20005
(202) [email protected] #12110
4800 Hampden LaneSuite 400Bethesda, Maryland 20814
(301) 664-7400bcg.com


