
Best Available Copy - Defense Technical Information Center · KEY WORDS (Continue on reverse side l...
48
IO w/ TECHNICAL REPORT: NAVTRAEQUIPCEN IH-265 ' COMPUTER SIMULATION OF FRESNEL LENS OPTICAL QULANDING SYSTEM !g COMPU7,ER LABORATORY NAVAL TRAINING EQUIPMENT CENTER ORLANDO, FLORIDA 32813 SEPTEMBER 1976 TASK REPORT FOR PERIOD JULY 1975 - JUNE 1976 DoD Distribution Statement Approved for public release; distribution unlimited. A AI A 3
Transcript of Best Available Copy - Defense Technical Information Center · KEY WORDS (Continue on reverse side l...
IOw/
TECHNICAL REPORT: NAVTRAEQUIPCEN IH-265
' COMPUTER SIMULATION OF FRESNEL LENS OPTICALQULANDING SYSTEM
!g COMPU7,ER LABORATORYNAVAL TRAINING EQUIPMENT CENTERORLANDO, FLORIDA 32813
SEPTEMBER 1976
TASK REPORT FOR PERIOD JULY 1975 - JUNE 1976
DoD Distribution Statement
Approved for public release;distribution unlimited.
A AI A 3

BestAvailable
Copy

Technical Report: NAVTRAEQUIPCEN IH-265
COMPUTER SIMULATION OF FRFSNEL LENS OPTICAL LANDING SYSTEM
Igor V. GolovcsenkoComputer Laboratory
September 1976
GOVERNMENT RIGHTS IN DATA STATEMENT
Reproduction of this publication in wholeor in part is permitted for any purposeof the United States Government.
Approved:
LEONARD D. HEALYHead, Computer Laboratory
JAMES F. HARVEYDirectorResearch and Technology Department
NAVAL TRAINING EQUIPMENT CENTERORLANDO, FLORIDA
32813
&m, m
UNCLASSIFIEDSECURITY CLASSIFICATION OF THIS PAGE (When Data Entered)
R•EPORT DOCUMENTATION IAGE READ INSTRUCTIONSBEFORE COMP'.ETING FORM
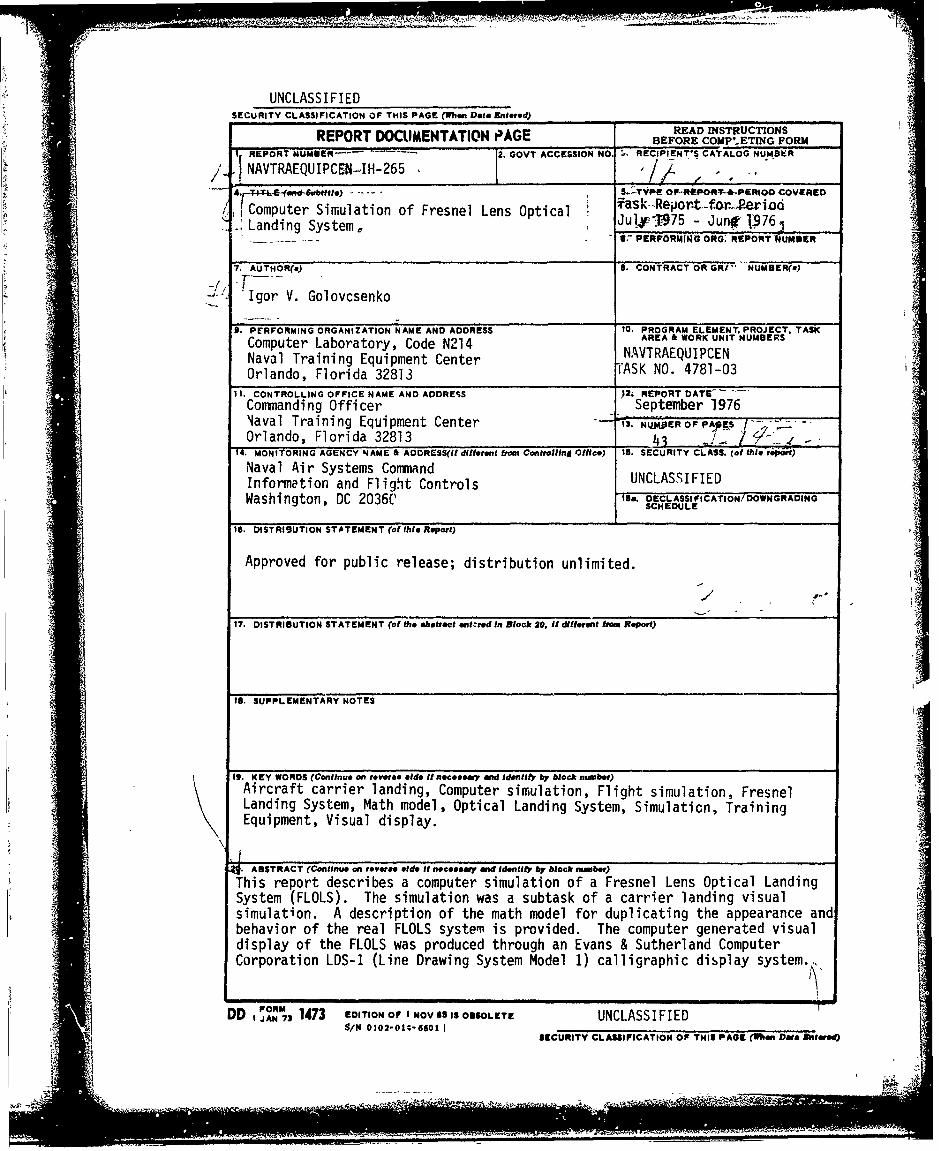
11 1EPORT "UMOER- "- 2. GOVT ACCESSION NO. •o RECIPIENT'S CATALOG NUMBER/ INAVTRAEQUIPCEN..,IH-265 /•" "
4. 65bite.-TYPE Of-REPOR-T-*-PERIOC COVERED,F~t ~ask- -Regor4t.-far-~Per iadComputer Simulation of Fresnel Lens Optical J -t-fnWr*1976 ~SLanding System, [JlF•37 u• 1.7Ladn yt6 sPERFORMI[N- ORG. REPORT -UMBER
7. AUTHOR(@) S. CONTRACTOR GRI "NUMBER(*)
S-Igor V. Golovcsenko
9. PERFORMING ORGANIZATION NAME AND ADDRESS 10. PROGRAM ELEMENT. PROJECT. TASK
AREA & WORK UNIT NUMBERSComputer Laboratory, Code N214ARE ENNaval Training Equipment Center NO.T4781-03Orlando, Florida 32813 TASK NO. 4781-03
II. CONTROLLING OFFICE NAME AND ADDRESS "2• REPORT DATE .. ..Commanding Officer September 1976Naval Training Equipment Center 13. NUMPER OF PA ; S
Orlando, Florida 32813 4_ -
14. MONITORING AGENCY NAME & ADDRESS(Il dillerent from Controling Office) 15. SECURITY CL'ASS. (of this r-oi-t)
Naval Air Systems CommandInformation and Flight Controls UNCLASSIFIEDWashington, DC 2036C' 1Sa. DECLASSIFICATION/DOWNGRADINGWashigton DC 036CSCHEDULE
16. DISTRISUTION STATEMENT (of this Report)
Approved for public release; distribution unlimited.
17. DISTRIBUTION STATEMENT (of the abstract .ft~red In Block 20, i. different from Report)
IS. SUPPLEMENTARY NOTES
19. KEY WORDS (Continue on reverse side l necessary aid identify by block number)Aircraft carrier landing, Computer simulation, Flight simulation, FresnelLanding System, Math model, Optical Landing System, Simulation, TrainingEquipment, Visual display.
4. ABSTRACT (Continue on reverse side It n'eceeemvy and identity by block namber)
This report describes a computer simulation of a Fresnel Lens Optical LandingSystem (FLOLS). The simulation was a subtask of a carrier landing visualsimulation. A description of the math model for duplicating the appearance andbehavior of the real FLOLS system is provided. The computer generated visualdisplay of the FLOLS was produced through an Evans & Sutherland ComputerCorporation LDS-1 (Line Drawing System Model 1) calligraphic display system.-
AllDDI FORM 1473 EOITION OF I NOV65 IS OBSOLETE UNCLASSIFIED
8/N 0102-01;-6601 1SECURITY CLASIIFICATION OF THIS PAGE (When Data RntereQd
-mm m .. l
I .- -

UNCLASSIFIEDýL(.-.U'TY CLASSIFICATION OF THIS PAOE(When Data Entered)
tit
Ig
Ir
UNCLASSIFIEDSIECURITY CLASSIFICATION OF THIS PAGE(31hon Date E~ntered)
te'1
,iim ý -- -- ---- -----
NAVTRAEQUIPCEN IH-245 '
TABLE OF CONTENTS
SECTION PAGE
I INTRODUCTION ....................................... 5
II TRADEC SIMULATION FACILITY ......................... 6
III CARRIER LANDING SIMULATION ......................... 7
IV DESCRIPTION OF FLOLS ............................. 9
V CARRIER MATH MODEL ................................. 21 ,
VI FLOLS SIMULATION .................................. . 31
u-
g~A.
V V

NAVTRAEQUIPCEN IH-265
LIST OF ILLUSTRATIONS
FIGURE PAGE
1 Computer Generated Display of Aircraft Carrier ............. 8
2 Typical Lens Installation .................................. 10
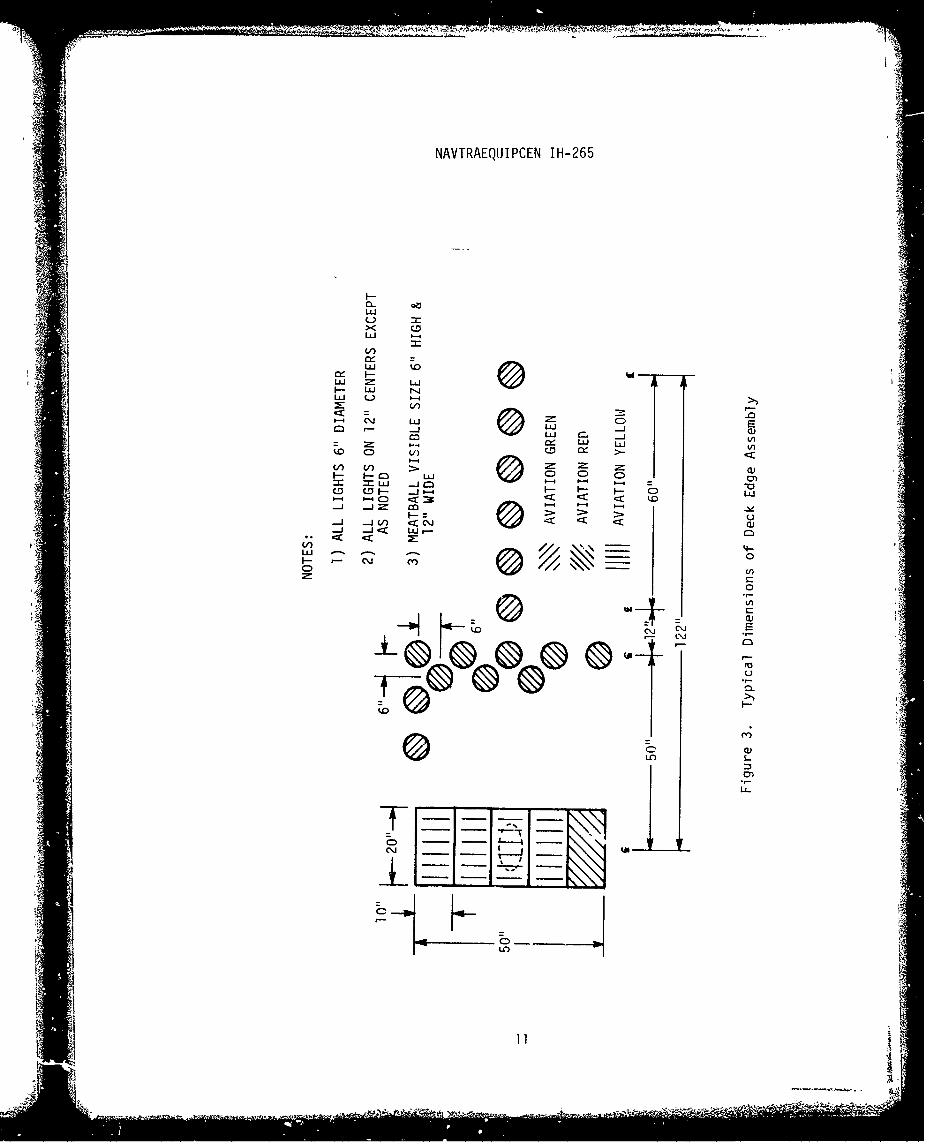
3 Typical Dimensions of Deck Edge Assembly ................... I
4 Correlation between Meatball Position and Glide Slope ...... 13
5 Carrier Approach Geometry .................................. 15
6 Glide Slope Angle and Hook-to-Eye Distance ................. 6
7 (a) H/E Roll Angle Corresponding to Zero Degree Rotation of 17Source Light Indicator Assembly ............................ 17
7 (b) H/E Roll Angle Corresponding to 7.5 Degree ClockwiseRotation of Source Light Indicator Assembly ................ 18
7 (c) H/E Roll Angle Corresponding to 7.5 Degree CounterclockwiseRotation of Source Light Indicator Assembly ................ 19
8 Carrier Dimensions ......................................... 22
9 Top Down View of Carrier with 8.08 Degree Rotation ......... 24
10 Vertical Cross Section of Carrier .......................... 25
11 Hook-to-CG Distance in the Math Model ...................... 29
12 Cable Zones ................................................ 30
13 Definition of Position Coordinate System ................... 33
14 Positioning of FLOLS Focal Point ........................... 34
15 Duplicate FLOLS Displays ................................... 37
16 View of Carrier at 1.5 Nautical Miles ...................... 41
17 Visual Simulation of Deck Edge Assembly .................... 43
1 2

K
NAVTRAEQUIPCEN IH-265
LIST OF TABLES
TABLE PAGE
1 Carrier Dimensions in the Horizontal Plane .................. 23
2 Carrier Dimensions with 8.08 Degree Rotation of Ship Axes... 263 Representative Values of Glide Slope Deviation, Illustrating
Relationship between Angular Deviation, "DEFLECT", andMEATBALL Indication ......................................... 35
4 Visual Meatball Indication as Function of Selected X and ZValues ...................................................... 40
ft I
3/4
-• Mi
N •wmm•nm•a

NAVTRAEQUIPCEN IH-265
SECTION I
INTRODUCTION
The computer simulation of a Fresnel Lens Optical Landing System(FLOLS) at the Naval Training Equipment Center (NAVTRAEQUIPCEN) graphicdisplay installation is described in this report. The graphic installationis a part of Training Device Computer (TRADEC), the NAVTRAEQUIPCEN researchfacility for flight simulation, and includes an Evans & Sutherland ComputerCorporation LDS-I (Line Drawing System Model 1) for the generation ofcalligraphic displays.
The FLOLS simulation was a subtask of a carrier landing visualsimulation on the TRADEC facility. The carrier landing program has beenutilized in the investigation of visual system requirements for flightsimulators.
The Fresnel system is an electrooptical landing system for use onaircraft carriers. The model for this simulation was the FLOLS MK 6 MOD 1,which is a standard CV and CVA aircraft carrier optical landing system inthe Navy.
The simulation in this report was not designed by the author.Consequently, functional analyses, design specifications, and programmingdesign documents have not been included.
The report is a description of two systems: the real system, and itssynthesized counterpart. A mathematical model is provided for duplicatingthe appearance and behavior of the real FLOLS through digital computation.The computer program listings and all references cited are available forinspection at the Computer Laboratory, Code N-214, Naval Training EquipmentCenter, Orlando, Florida.
5i
5

NAVTRAEQUIPCEN IH-265
SECTION II
TRADEC SIMULATION FACILITY
The TRADEC real-time digital simulation facility is utilized by theNAVTRAEQUIPCEN in its research efforts in training device technology andadvanced simulation concepts. It consists of a Xerox Data Systems Sigma 7digital computer with 49,152 words of magnetic core memory; general-purposeperipheral equipment including keyboard printer, punched tape system, cardsystem, magnetic disk and tape storage, and a high-speed line printer; afour-degree-of-freedom motion platfoim; a variable configuration simulatedaircraft cockpit which is mounted on the motion platform; an operator'scontrol console; special analog input/output and discrete interfaces; andtwo separate computer-generated display systems functioning independentlyof each other.
Presently the cockpit is configured like that of an F4 Phantom aircraft.The instructor's console is equipped with the same flight and engineinstruments that are in the cockpit. The instructor's console also providesa bank of push-button indicator switches which can be utilized as pureindicators or as switches. These permit an interface with a simulationprogram and can be utilized in whatever fashion may be desired.
Both display systems provide line-drawing or stroke-drawing(calligraphic) display capabilities to the simulation facility. The firstsystem is an Information Displays Incorporated Input/Output Machine (IDIIHOM),and is used primarily for instructor station control applications. TheIDIIOM consists of a Varian DATA 620/i digital computer, a special computerinterface to the Sigma 7, a display processing unit, function generators,and two display consoles with light-pens, programmable function buttons, ASRteletypewriters, and graphic input tablet.
The second display system, an Evans & Sutherland Computer CorporationLDS-I (Line Drawing System Model 1), is designed for out-of-the-windowpicture presentations of the external environment. The picture will change
in direct response to the motion of the simulated aircraft, providing thesimulator pilot with a dynamically changing view of the surrounding world.The LDS-I consists of a display processor for interpreting drawing commands,a hardware matrix multiplier and clipping divider for real-time transformat-ions on display data, and a line generator to convert digital data to analogdeflection and intensity signals for two cathode ray tube (CRT) terminals.One of these terminals is in the cockpit, while a second one is at theinstructor's console. References 1, 2, and 3 provide further details onthe TRADEC simulation facility.
1 M. Fischer, F.R.Cooper,"Training Device Computer Facility Dedicated atOrlando," Training Device Developments, NAVTRADEV P-1300-51, NTEC, Orlando,Florida, February 1970.2 J.L.Booker,"Computer Generated Display System," Training Device Develop-ments, NAVTRADEV P-1300-55, NTEC, Orlando, Florida, June 1971.
3 Evans & Sutherland Computer Corporation,"Line Drawing System Model 1, 32Bit,System Reference Manual," Salt Lake City, Utah, December 1, 1971.
6

NAVTRAEQUIPCEN IH-265
SECTION III
CARRIER LANDING SIMULATION
The simulator software currently available on the TRADEC system is aprogram which simulates the F4E aircraft. The F4E simulator can be utilizedin the conduct of research in various aspects of simulation techniques andof human factors relating to simulation. The flight simulation providesclosed-loop control functions to the simulator pilot in the cockpit. TheSigma 7 computer program provides the necessary real-time solutions to theaircraft flight equations.
A secoz•d program, running concurrently with the F4E simulation program,provides a visual simulation of an aircraft carrier in a landing exercise.This program generates a true-perspective out-of-the-window view of anaircraft carrier on the cockpit display scope. The picture moves inaccordance with the aircraft attitude and flight path as the aircraftapproaches the carrier. A completely nonprogrammed flight path allows thepilot complete control of his flight maneuvers. The cathode ray tubepresents a 19 degrees horizontal by 19 degrees vertical field of view to thesimulator pilot.
The picture is composed of connected lines which form a stick-like figureof a carrier° as in figure 1. The display also includes a simulated horizonline as an indication of the aircraft attitude to the pilot. The three-dimensional world for the display system is composed of a data base contain-ing X, Y, Z coordinates of the end points of all connected lines. Thesimulation program determines the position and direction of view for thedisplay, eliminates all lines not visible in the cone vision from thecockpit, computes a two-dimensional perspective jpicture of the visible lines,and generates a picture of the data base as seen through the front windowof the aircraft cockpit.
References 4, 5, and 6 provide detailed descriptions of the carrierlanding simulation. References 7 and 8 describe two experiments that havebeen conducted with this simulation program.
4 P.A. Kapsis, M.J. Poor, J.H. Gottschalk, H.J. Wychorski, R.McDowell,
"Software Documentation for the Research Tool Digital Computer System,Volume 1, Math Model Report," Technical Report: NAVTRADEVCEN 67-C-0196-7,September 1969.
5 I.E. Sutherland, D. Cohen, "Display Techniques for Simulation,"Technical Report: NAVTRADEVCEN 70-C-0025-1, February 1971.
6 D. Cohen, "Naval Training Device Center Graphic Display Installation,"unpublished internal NAVTRAEQUIPCEN Report.
7 F.R. Cooper, W.T.Harris, V.J.Sharkey, "Effects of Visual System TimeDelay on Pilot Performance," 8th NTEC/Industry Conference Proceedings,Naval Training Equipment Center, Orlando, FL, Nuvember 1975.8 S.C. Collyer, J.L. Booker, I.V. Golovcsenko, "The Investigation of Zoomvs. True Perspective in Simulated Carrier Landings," Technical Report:NAVTRAEQUIPCEN IH-266, to be published.
7

NAVTRAEQUIPCEN IH-265
41)1.111 1 1L
I8

NAVTRAEQUIPCEN IH-265
SECTION IV
DESCRIPTION OF FLOLS
The Fresnel system i: an electrooptical landing system for use onaircraft carriers. By use of the Fresnel system, the pilot whose aircraftis approaching a carrier may visually establish and maintain the properglide slope angle for landing.
The Fresnel system provides a horizontal bar of light that appears inthe source light indicators of the deck-edge assembly. The position of thisbar of light with respect to a set of fixed horizontal datum lights indicatesto the pilot of an approaching aircraft whether he is above, below, or onthe correct glide slope. The bar of light is formed by the combined actionsof source lights, Fresnel lenses, and lenticular lenses, Because of theoptical system, the bar of light appears above the horizontal datum lightsif the glide slope is too great, and below the horizontal datum lights if theglide slope is too small. When the pilot aligns the bar of light with thehorizontal datum lights, his approach is correct for a carrier landing.
A. PHYSICAL CHARACTERISTICS
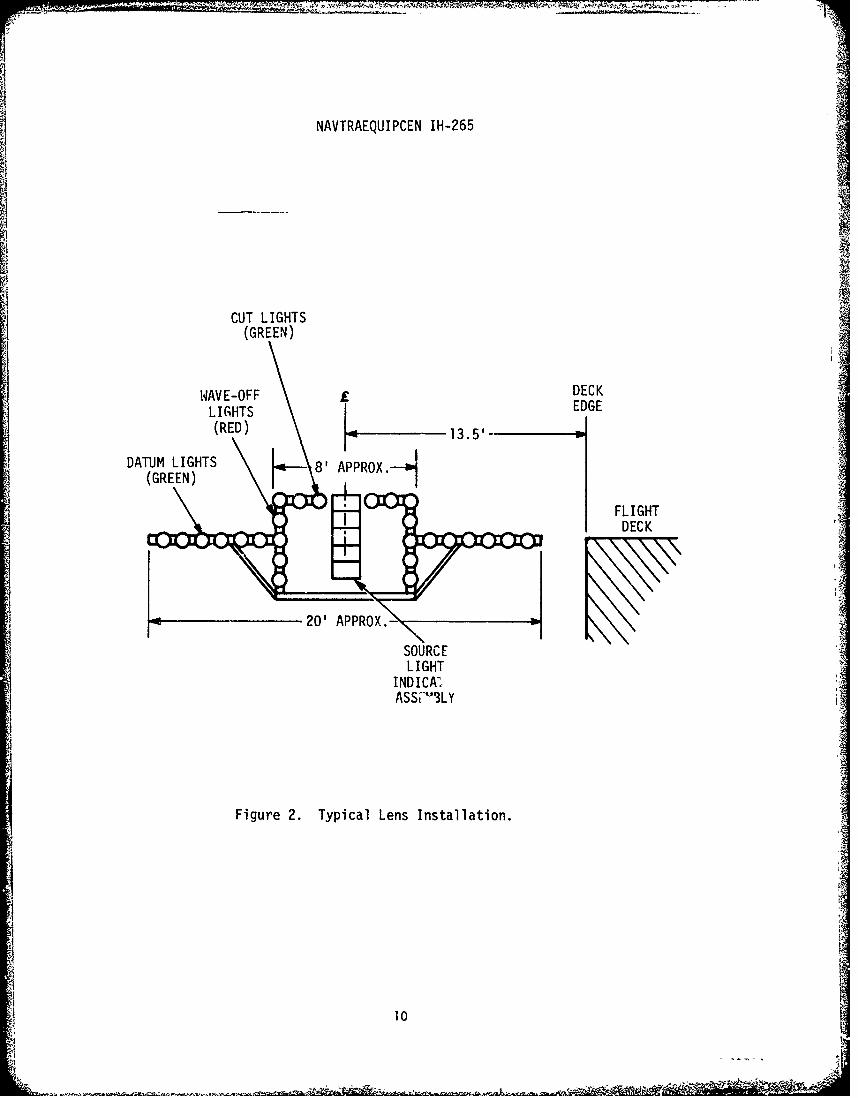
The FLOLS deck edge unit is located on the port side outboard platforwopposite the island, approximately two thirds of the total runway distanceforward of the ramp. The deck edge unit consists of five cell assembliesmounted in a four foot high vertical stacking (see figures 2 and 3), fromwhich a yellow bar virtual image is produced across the cell, with an imagedistance of 150 feet behind the lens. 9 The arrangement of lenses with respectto the source lamps and the physical properties of the lenses cause the sourcelamps to appear as a common light image 12 inches wide and approximately 6inches high. The lamps and lenses of each cell are adjusted so that the barof yellow light seen moving up and down the face of the lens box movessmoothly from one cell to another. A horizontal row of green datum lightson each side of the indicator assembly at the center of the center cell providesthe reference to which the meatball is compared. A detailed description of theFLOLS, including physical dimensions, is provided in referer~ce 10.
When an aircraft in its approach to the carrier is dangerously low,(specifically in excess of 0.375 degrees deviation from the correct glideslope), the pilot of that aircraft views the bar of light through the red lensof the bottom (low) cell assembly. During normal operation the source lightscontained in the low cell are flashing in order that the pilot may readilyrecognize the existence of a "red meatball cond-tion."
9 Naval Air Systems Command, "Visual Landing Aids Design Standards;
Shipboard Installation," Technical Manual: NAVAIR 51-50AAA-I, 1 June 1974.
10 Bureau of Naval Weapons, "Installation, Service, Operation and MaintenanceInstructions, Fresnel Lens Optical Landing System MK 6 MOD 0," TechnicalManual: NAVWEPS 51-40ABA-I, 1 October 1964.
I,.. .9
- - ---
NAVTRAEQUIPCEN IH-265
CUT LIGHTS(GREEN)
WAVE-OFF £ DECKLIGHTS EDGE
(RED) 13.5'-
DATUM LIGHTS 8' APPROX.i(GREEN)
FLIGHTDECK
20' APPROX.-al
SOURCELIGHT
INDICA',ASSt'"3LY
Figure 2. Typical Lens Installation.
10
NAVTRAEQUIPCEN IH-265
L:.J
C/)
LLJ U >)
Mi I-i
SLUJ LUJV
F- C0 Ll I- L
CD F- F- F- - CD L
I-:--jj 0.J~L. .F- Cz
rC
51t. LU _4-I-'C~ crnliax
a- Cý
AL S-a.~::30L
cU*
LOL
-..........

S- - .... .
j NAVTRAEQUIPCEN JI-265
Vertical lines of red lights are located on each side of the lensstacking frame, as shown in figure 2. Tihese lights are flashed simultaneouslyat a rate of approximately 90 flashes per minute to indicate wave-off (unsafe
landing condition). In addition, a horizontal row of green lights is mountedabove the lens. These lights, which do not flash, are turned on in a mannersimilar to the wave-off lights to indicate a "cut" to the pilot of a propellerdriven aircraft
Figure 3 shows some typical dimensions for the deck edge assembly. Thesource light indicator assembly contains 15 source lamps in 5 separate cells.Each cell contains three source lamps arranged horizontally. As previouslystated, the source lamps appear as a common light image 12 inches wide andapproximately 6 inches high.
B. GLIDE SLOPE
Since different types of aircraft have different structural characteristicsand capabilities, they would ideally require different glide slope angles. Asa matter of practice, however, basic angle sett ngs of 3.5 and JU are mostcommonly used (3.5 on the east coast and 4.0 on the west coast)P1 These settingsrepresent the basic angles that are considered to be acceptable in most recoveryoperations. The maximum 4-degree angle is dictated by the structual loads onthe airplane imposed by the vera cal sink speed. The minimum glide slope angleis dictated by several factors.
a. The airplane must clear the ramp for a steady deck condition by aminimum distance of 10 feet to allow for safe ramp clearance during pitchingdeck conditions and pilot deviation from the desired glide slope. The lengthof the flight deck limits the distance that the arresting wires may be setforward of the ramp; therefore, this geometry of a ten foot ramp clearance andwire location sets a limit to which the glide slope may be lowered and stillarrest the airplane.
b. The shallower the angle becomes, the greater the dispersion intouchdown with glide slope error due to the simple trigonometric relation.The ground effect for some airplane models is more pronounced on touchdowndispersion for the shallower glide slope angles.
c. It has been qualitatively determined that for the shallower angles,those of less than three degrees, pilots find it more difficult to accuratelymaintain desired glide slope than for the slightly steeper angles.
The total vertical angle of usable information conveyed by the FLOLS is1.5 degrees. Plus and minus 0.75 degree deviations from the correct glideslope represents the limits within which the meatball is fully visible.Figure 4 illustrates three representative meatball positions: those for thecorrect glide slope, for 0.75 degrees above, and for 0.75 degrees below thecorrect glide slope. Three quarters of a degree above correct glide slopecorresponds to the meatball being 2 meatball heights above the centered position.
11 Ibid.12 J. H. Nelson, G. M. Griffin, "United States Navy Pilot-Controlled LandingProcedure and Associated Equipment," Report 423, NATO Advisory Group forAeronautical Research and Development, Paris, France, January 1963.
12

NAVTRAEQUIPCEN IH-265
U')A
UC)
CL -j .LLJ
-j .- LLJ
LUJ LLU in.'4 0
-0C-)
IL (C)
LLJ 0
00
V)I
LUC 1--4A
z~)CD w U)(
C)~ LU
V0LJV LUJ::W~~i Cl F C-+
CD ) w0D)) I
1U) LU LL u)
1-J L- .- L iLjj C)
_j CC - LU I
F- 0 Fuj-- F- LU 4L-0
a) I- LL.V) o L
Li-
ý'Io
Q 13
NAVTRAEQUIPCEN IH-265
Similarly, three quarters of a degree below correct glide slope correspondsto the meatball being 2 meatball heights below the centered position.
When the airplane is "in the groove" - coming down the slope with zeroerror trajectory -- it is the pilot's eye that is actually on the glide path.The glide path is therefore computed so that the eye-touchdown point isforward of the hook touchdown point, which is calculated to be near the no. 3wire (see figure 5). The desired touchdown point aboard ship is normallybetween the second and third arresting pendants. If the error exceeds 5 feetabove the desired glide slope the airplane will bolter; 5 feet below thedesired glide slope places the airplane in dangerously close proximity to theflight deck ramp. Figure 5 shows that the aircraft's huok Luuchdown pointwill always be closer to the stern of the carrier than the optical touchdownpoint.
C. HOOK-TO-EYE DISTANCE
Alt2iough the pitch angle setting for glide slope is seldom changed, theroll .,-jle setting is changed for each different type of aircraft to berecovered. This is necessary because of the widely varying hook-to-eyevalues for different types of aircraft. Figure 6 illustrates how differentaircraft models have varying heights-of-eye of the pilot (called hook-to-eyedistance) and require varying lens heights to give the proper hook-to-rampclearance. Since a vertical height adjustment is necessary to accommodatediffering aircraft with differing hook-to-eye dimensions, the standard FLOLSinstallation provides a rapid change-o•-height adjustment to meet varyingrequirements. This is achieved by rotating the source light indicatorassembly about its roll axis! The deck edge assembly includes an H/E(hook-to-eye)roll d'rv-e for rotation of the source light indicator assemblyabout its roll axis.
Any rotation of the light source indicator assembly shifts the opticalglide slope either up or down depending on the direction in which the assemblyis rotated. This shift is possible only because the physical placement ofthe FLOLS unit is not directly at the angled deck's center line, but as muchas 85 feet to the port side of t-at line. Since the normal approach to thecarrier is in line with the center line of the angled landing deck, a lateraltilt of the "light plane" about the roll axis of the source light indicatorassembly shifts the optical glide slope either up or down for those pilotswho are approaching in line with the center line, dependi-ng on the directionof the tilt. The light plane is defined by the intersection of the FLOLSglide slope and the pitch axis of the source light indicator assembly.Figure 1-26 of reference 10 has an illustration of the light plane. This isreproduced here as figure 7.
Figure 7 illustrates three H/E roll angle functions and the resultingoptical touchdown points. Figure 7(a) illustrates the H/E roll angle whichcorresponds to a rotation of zero degrees of the source light indicatorassembly. Figure 7(b) illustrates the H/E roll angle which corresponds to aclockwise rotation of 7.5 degrees of the source light indicator assembly asviewed from the stern of the ship. Figure 7(c) illustrates the H/E roll anglewhich corresponds to a counterclockwise rotation of 7.5 degrees of the sourcelight indicator assembly as viewed from the stern of the ship. A clockwise
14 iI I

NAVTRAEQUIPCEN IH-265
.C5
:rj
IJ-J-
LiiCE
I-S-c
1M 0)
-J- S.-
C)=S.-
=1 0
LL.J
UC)
LL0 V)--
< LLI~ <
'CC
15
............ t4

2 uNAVRufAEQUIPTCEN IH-265
I~MVRMLIiU1I.~0
IIC)C
V))ji
CD M)
F--
160

NAVTRAEQUIPCEN IH-.265
.17

NAVTRAEQUIPCEN IH-265
- N -
II
1 48
44 4*-lw

NAVTRAEQUIPCEN 111-265
I:
..... ...
-i-
Figure 7(c). H/E Roll Angle Corresponding to 7.5 Degree Counterclockwise
Rotation of Source Light Indicator Assembly.
A 19

-- ----- - - F- -
NAVTRAEQUIPCEN IH-265
rotation results in a downward shift of the optical glide slope, while acounterclockwise rotation results in an upward shift of the optical glideslope.
An important note in connection with the FLOLS is that it is imperativefor the pilot to line up with the runway center line in making an arrestedlanding aboard the carrier, since the FLOLS does not provide line-up informat-ion. The preselected H/E roll angle function and resulting touchdown pointis valid only when the pilot is lined up with the runway centerline.
The relationship between a change in optical glide slope angle and achange in source light indicator assembly roll angle depends upon thestructural characteristics of the flight deck and location of the sourcelight indicator assembly. Therefore, a recovery bulletin relating hook-to-eye distance and roll angle is furnished for each carrier. The purpose ofthis aircraft recovery builetin is to give the basic angle and roll angle dialsettings for the various types of aircraft expected to land on that particularcarrier.
D. STABILIZATION
To compensate for the rolling and pitching motion of the ship, stabili-zation signals will drive the indicator unit to correct for roll and pitch.The MK 6 MOD 0 FLOLS has a point mode of stabilization, while the MK 6 MOD Ior MOD 2 FLOLS has both point and line modes for stabilization. The pointmode stabilizes the glide slope at a point 2,500 feet aft of the carrier, Pwhile the line mode will stabilize the glide slope all the way in to touchdown.With the point stabilization mode, the indicator unit (source light indicatorassembly) is caused to rotate about its pitch axis in accordance with astabilization signal. The line stabilization mode produces signals whichthrough electronic circuitry drive the indicator unit to correct for roll andpitch with separate drives (2 degrees of freedom).
With either type of stabilization, the hook-to-eye value of the aircraftis corrected by rolling the indicator assembly. The H/E roll angle that isselected is not altered as a result of the stabilization signals. Neither isthe glide slope angle. Once the basic pitch and the H/E roll angles areselected, they are maintained regardless of the pitch and roll of the carrier.
It should be noted that the Fresnel system cannot compensate for heave,which is the rise and fall of the entire ship without a change in pitch androll angles. Therefore, a Landing Signal Officer is required to initiate awave-off signal when the ship's heave becomes such that a landing is impractical.
20
-----------

NAVTRAEQUIPCEN IH-265
SECTION V
CARRIER MATH MODEL
The following description of the carrier math model is preliminary tothe presentation in Section VI of the carrier approach geometry and the FLOLSsimulation equations.
A. DIMENSIONS
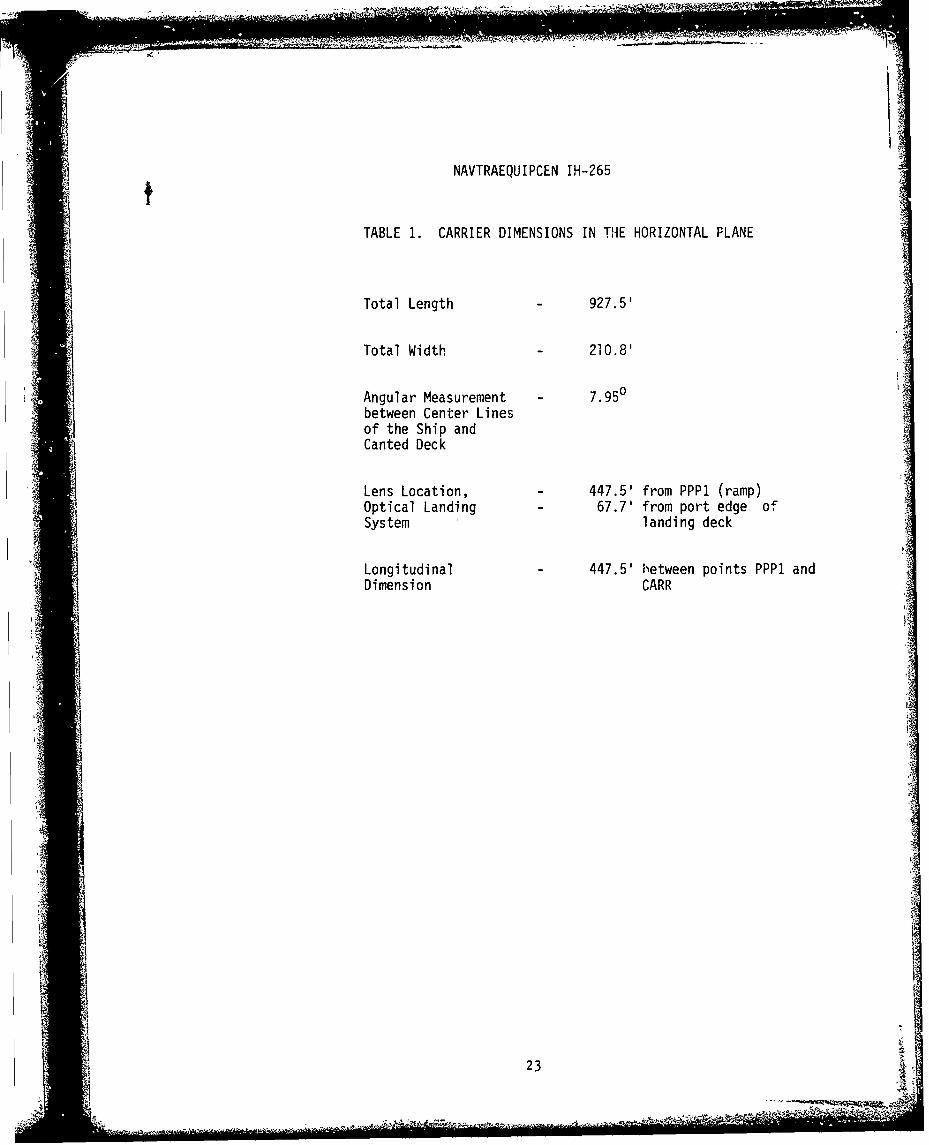
Figure 8 shows the significant dimensions of the aircraft carrier in thehorizontal plane. The dimensions are tabulated in table 1. Figure 8 is notdrawn to scale and does not include all details present in the display file.
The coordinate points PPP1 and CARR in the math model (see also figure 8)are defined as follows.
PPPI - Used as the starting point for drawing the carrier deck. Locatedat the corner formed by the ramp and the starboard edge of the deck area.
CARR -. Origin of the data definition coordinate system. In drawing theaircraft carrier, CARR is the only absolute point in the display file. Hence,all parts of the carrier are drawn relative to this coordinate.
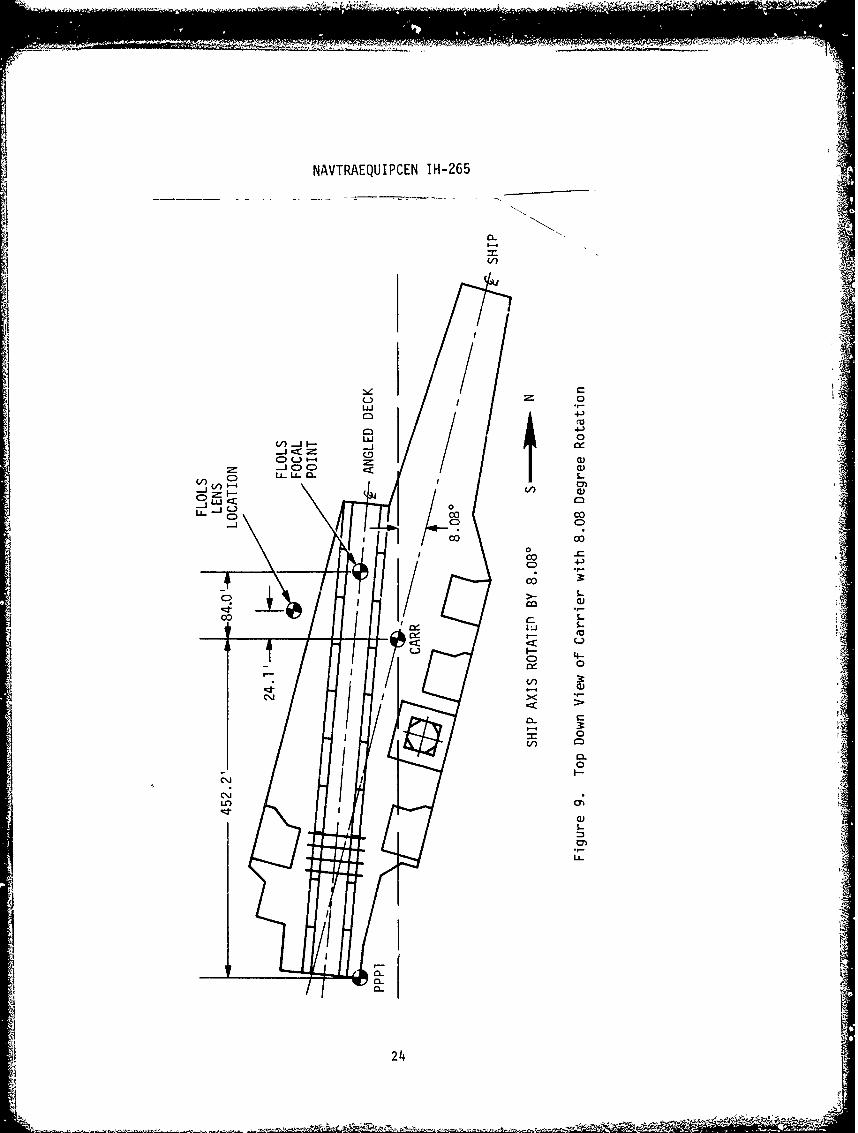
Figure 9 also shows a top-down view of the carrier, but with the shipaxis rotated by 8.08 degrees. This figure shows the carrier orientation asactually used in experiments. The reason for such a reorientation was toenable the pilots to land with an approximately zero degree aircraft heading.This was done by aligning the angled deck center line with the north-southaxis. Due to the digital representation of data, the 7.95 degree rotationfor an exact alignment was not possible; the nearest attainable value was the8.08 degrees actually used.
Figure 9 also indicates the location of the FLOLS focal point. This isthe computational point used to determine the apparent motion of the meatballlanding device in response to glide path changes. The glide slope is set tooriginate at this coordinate point. An explanation of its use follows in thedescription of the FLOLS math model.
Figure 10 shows a vertical cross section of the carrier, with dimensionsfor deck level, arresting cables, FLOLS lens location, FLOLS focal point,PPP1, and CARR. As in the two previous illustrations, figures 8 and 9, thefigure is not drawn to scale, and does not include all details present in thedisplay file. Note that as in figure 9, the ship axis is rotated by 8.08 de-grees. Table 2 lists the dimensions associated with figures 9 and 10.
B. LANDING OUTCOMES
TRAP Several conditions must be satisfied for a successful trap attouc-dio'n. The following conditions are tested:
a. Aircraft Altitude - Z coeodinate of aircraft CG (Center of G-avity).If the altitude is any value greater than 66 feet, the aircraft is flyinghiqher than the carrier deck, and a landing is not feasible.
21
wi ni.-

U~0.
:z 0
C)Ln Xi
0 '-
C) I-
0)
LU
22'
NAVTRAEQUIPCEN IH-265
TABLE 1. CARRIER DIMENSIONS IN TIHE HORIZONTAL PLANE
Total Length - 927.5'
Total Width - 210.8'
Angular Measurement 7.950between Center Linesof the Ship andCanted Deck
Lens Location, 447.5' from PPP1 (ramp)Optical Landing 67.7' from port edge ofSystem landing deck
Longitudinal 447.5' between points PPP1 andDimension CARR
• ~23
NAVTRAEQUIPCEN IH-265
4V
0~0ui=
ui 0,
_j LnOC-4 cm
C) 0000
00
CC)co
i I.
CCL
0~
S-
C"
LL.
24

NAVTRAEQUIPCEN IH-265
'cm
U-U
CI-
LOJ
Z L
V-) E-
-j-
I Li
U-5-w
-C u
) '-4
25

NAVTRAEQUIPCEN IH-265
TABLE 2. CARRIER DIMENSIONS WITH 8.08 DEGREE ROTATION OF SHIP AXES
Deck Level - 53.3' above sea levelArresting Cables,
Ramp to Wire Distance - Cable 1 129.7'
Cable 2 151.1'
Cable 3 172.5'
Cable 4 193.9'
FLOLS Focal Point 435.2' forward of ramp
43.5' above sea level
FLOLS Lens Location 476.3' forward of ramp
117.8' to the left of the angleddeck center line k
Location of CARR - 452.2' forward of ramp 4
26
26
- - -- -- ~ *. - --- - -- -. .. ,- -. '*
NAVTRAEQUIPCEN IH-265
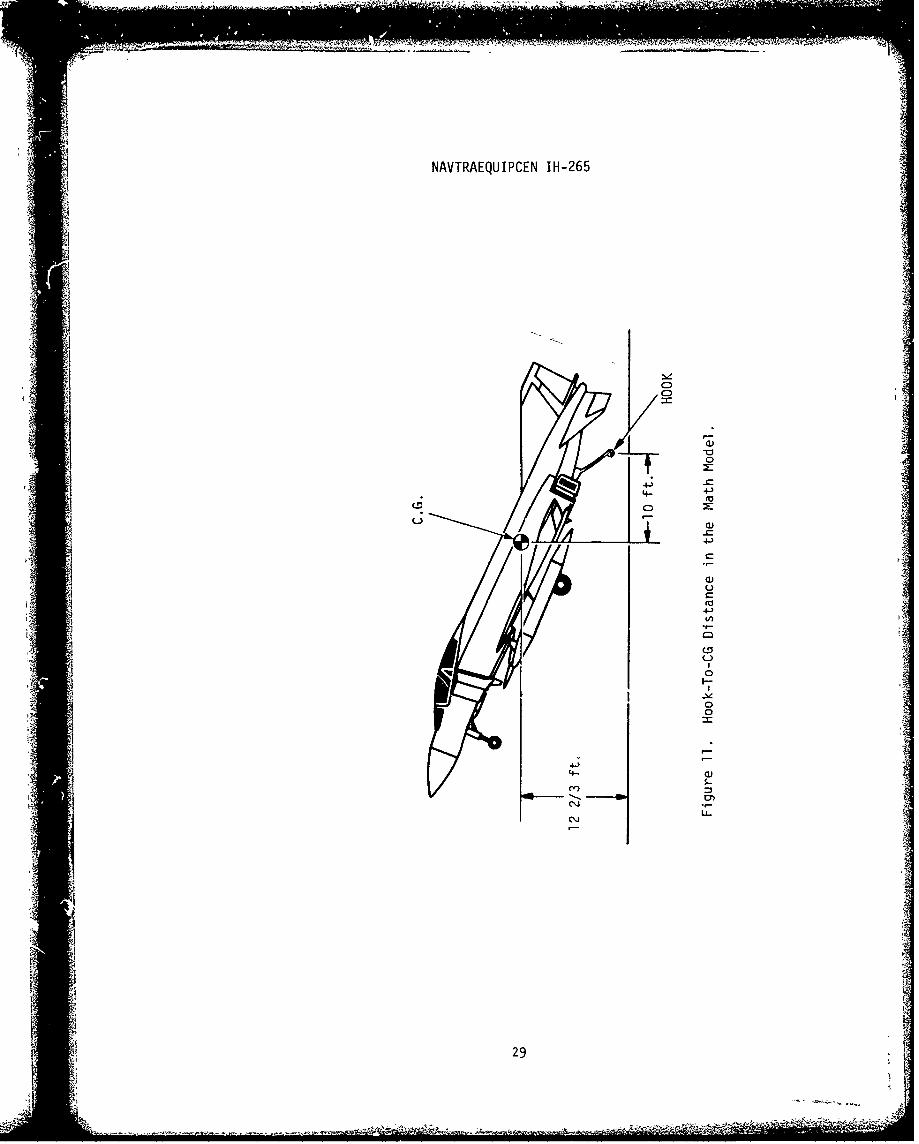
Once however the altitude reaches 66 feet, the aircraft has achieved theproper altitude for landing. Note that with deck level being 53.3 feetabove sea level, the aircraft CG is located 12.7 feet above the carrier deckat touchdown, as in figure 11.
b. Cable Zones - Tests for landing in cables zones. For these tests,the hook was assumed to be 10 feet back of the CG, as in figure 11. Figure12 shows the angled deck runway in close-up view, with the dashed linesindicating the limits on the horizontal location of the CG for successfullanding in cable zones 1, 2, 3, or 4. The longitudinal CG limits along theangled deck runway, as measured from CARR, were as follows:
ZONE FROM TO
1 330 feet 310 feet
2 310 feet 290 feet
3 290 feet 270 feet
4 270 feet 250 feet
The lateral limits on each side of the runway as measured from thereference point CARR were set to:
WAYLEFT limit = 76.3 feet.
WAYRIGHT limit = 26.3 feet.
c. Crash - Several conditions are tested in the time interval justprior to--an-ing. Crashes occur for any of the conditons listed in the nextparagraph.
CRASH The aircraft is crashed if when on the landing deck, or duringapproach •j land:
a. The landing gear is not down and locked.
b. The rate of descent is greater than the maximum allowable value forlanding (R/C <-1000 feet/minute).
c. The roll angle is too large, such that the wing tips contact the deckduring roll (-150 > (D> 15o).
d. The pitch angle is such that the nose wheel shock is fully compressed,or the tail is dragging along the ground during roll. f
e. Maximum dynamic pressure is exceeded. A test checks for mach greaterthan the maximum allowable mach as a function of altitude.
27
NAVTRAEQUIPCEN IH-265
f. Normal accelerations exceed structural limits. This occurs when theapplied G is too negative or too positive. The limits on G are afunction of mach and of gross weight.
g. Aircraft runs into side of carrier. This happens when the plane fliesinside the carrier deck area with insufficient altitude for a landing,i.e., when the following conditions are all met:
X value of aircraft to CG is greater than MIN DECK X.
X value (if aircraft C(- is less than MAX DECK X.
Y value of ai-craft CG is greater than MIN DECK Y.
Y value of aircraft CG is less than MAX DECK Y.
Altitude less than 66 feet.
BOLTER After a successful touchdown without capture, the aircraftaltitude is restricted to 66 feet until a successful takeoff. There are sev-eral touchdown areas for bolter:
TOUCHDOWN AREA TELETYPEWRITER MESSAGE
on deck, short of cables 'TOUCHDOWN SHORT'
on deck, overshot of cables 'TOUCHDOWN BEYOND CABLES'
left of cables 'TOUCHDOWN LEFT'
right of cables 'TOUCHDOWN RIGHT'
'i ~28
right ~ of cale 'TOUCHDOWN.RIHT'
-4. � ___
I'1A
NAVTRAEQUIPCEN IH-265
-i
-' I
I
1 4%'4- 4-'
CD
C-,
4�S
C
a.,C-,
CDC-,
0I-
I -�00
II4 -
-�4-i4- w
C\SU-
(\J
1�
r� ;;;29
.41
-. - * - .�., �,4- *-

NAVTRAEQUIPCEN IH-265
+
•,z'} .=.I • • , iL , • ,l.J.l I.LI mm Im," €..p €•
V.I • ,-,m
""•g 1•m-" L_ o
r'• ._I .. J • C• -
S ,"- • -0• m , ++,
, • t'M
,,, • .•.• .o•+.+.,.... •++
•,,...• •...,•'.• ."-• ...'9.• -•
• * • • •=: .. .::_.' ""-"::.".:.•i "'
,-., •• •, • I •,
- lllii• l• ii= . i
-J €.•4 "'p- I-.
z -- €:• _j r'•
•./• •="• '•l:•
L,•I• '7 L.I- I.LI I-- C:•CP O..JZ
-- •--• .J __ I.•I I.•I L.•I I--- Z ::•:•"• IJ- V'• •" r," •') cC •"
t..• LLI r"•
N
30 •i+
I l I

NAVTRAEQUIPCEN IH-265
SECTION VI
FLOLS SIMULATION
The Fresnel system is represented by a ctabilized system which is freefrom the pitch, roll, and heave inputs of the ship. This is so because thecurrent mathematical model of the aircraft carrier does not include thesevariables. The system simulates a +90degree aximuthal range light beaminclined at a 3.53 degree angle relative to the center line of the angleddeck, with the light source or 'meatball' visible for deviations of +0.75degrees from the desired 3.53 degree glide slope.
MEATBALL DISPLACEMENT
Meatball displacement refers to the vertical position of the meatballwith respect to the fixed horizontal row of datum lights. Error from glidepath is presented to the simulator pilot as a vertical displacement betweenthe moving meatball and the stationary datum arms. The meatball displacementis a function of the carrier approach geometry. its computation requiresinformation regarding the carrier dimensions, as found in section V of thisreport, and aircraft altitude and positional data for each computational cycle.
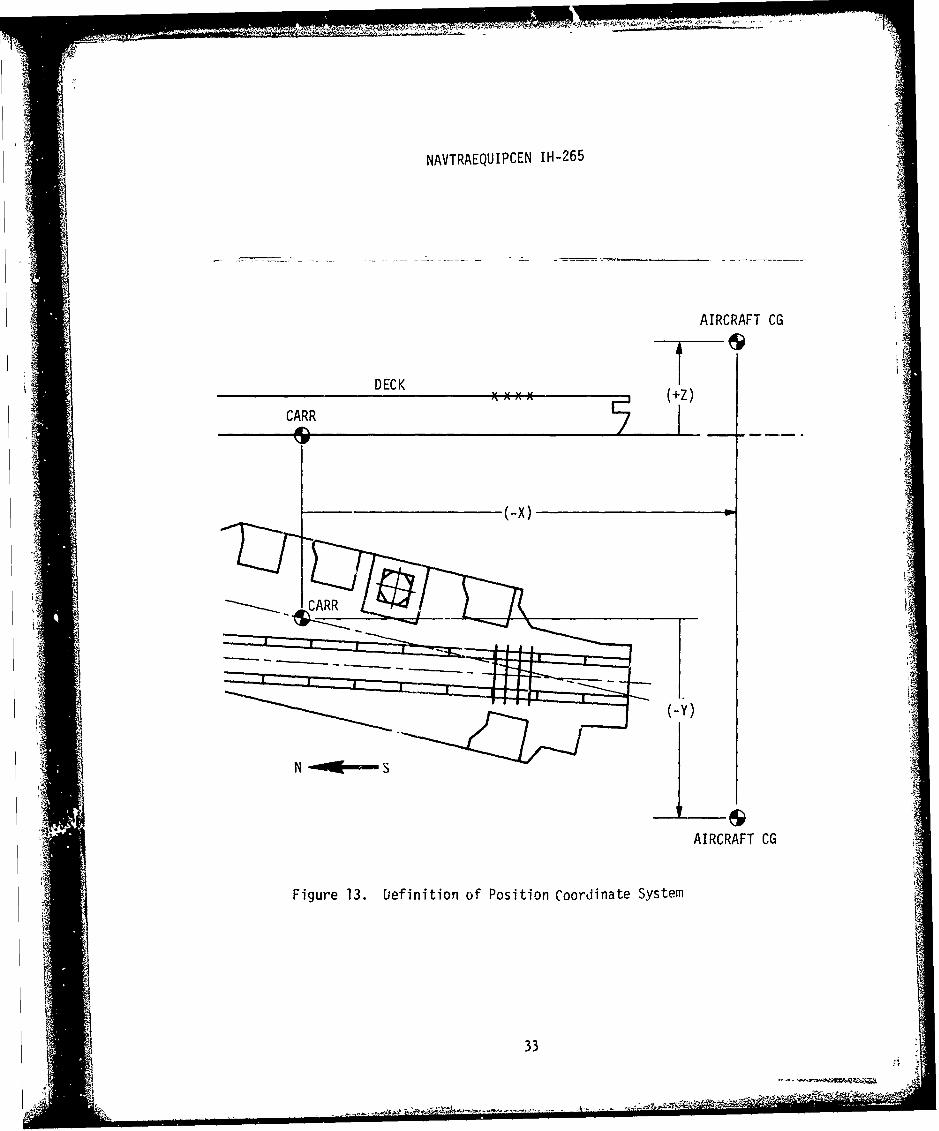
Figure 13 shows the X, Y, Z coordinate system for defining aircraftaltitude and position. The carrier and the aircraft are viewed in both thevertical and horizontal planes. The definitions of the X, Y, and Z variablesare as follows:
"X" is the linear distance in inches from the carrier's reference pointCARR to the aircraft center of gravity (CG), measured along the north-southcoordinate axis. Positive sense of direction is to the north, negative senseof direction to the south, such that X has a negative value for a landingapproach from the south.
"Y" is the linear distance from CARR to aircraft CG along the east-westcoordinate axis, with positive sense to the east.
"Z" is the aircraft altitude in inches, measured from sea level to air-craft CG, with positive sense of direction being up.
The governing equations for the meatball displacerrent are
DEFLECT = -(2 3-C. units) *(MBFN) (1)
MBFN 8Z - 8 X * DZ/DX (2)
where DEFLECT is measured in CRT scope coordinate units, and MBFN, SZ, SXDZ,DX are measured in inches.
A CRT scope coordinate unit is the unit of deflection in the screencoordinate system. In the Evans and Sutherland LDS-!, the number of differentpoints that may be displayed along each axis is 4096. The position generatorswhich determine the amount of deflection of the beam on the face of the CRTutilize digital-to-analog converters whose resolution is 12 bit in the Xaccess (4096 positions) and 12 bit in the Y access (4096 positions).
A3
NAVTRAEQUIPCEN IH-265
Therefore, using 12 binary digits of precision provides an addressable areaof 4096 x 4096 scope coordinate units on the display scope.
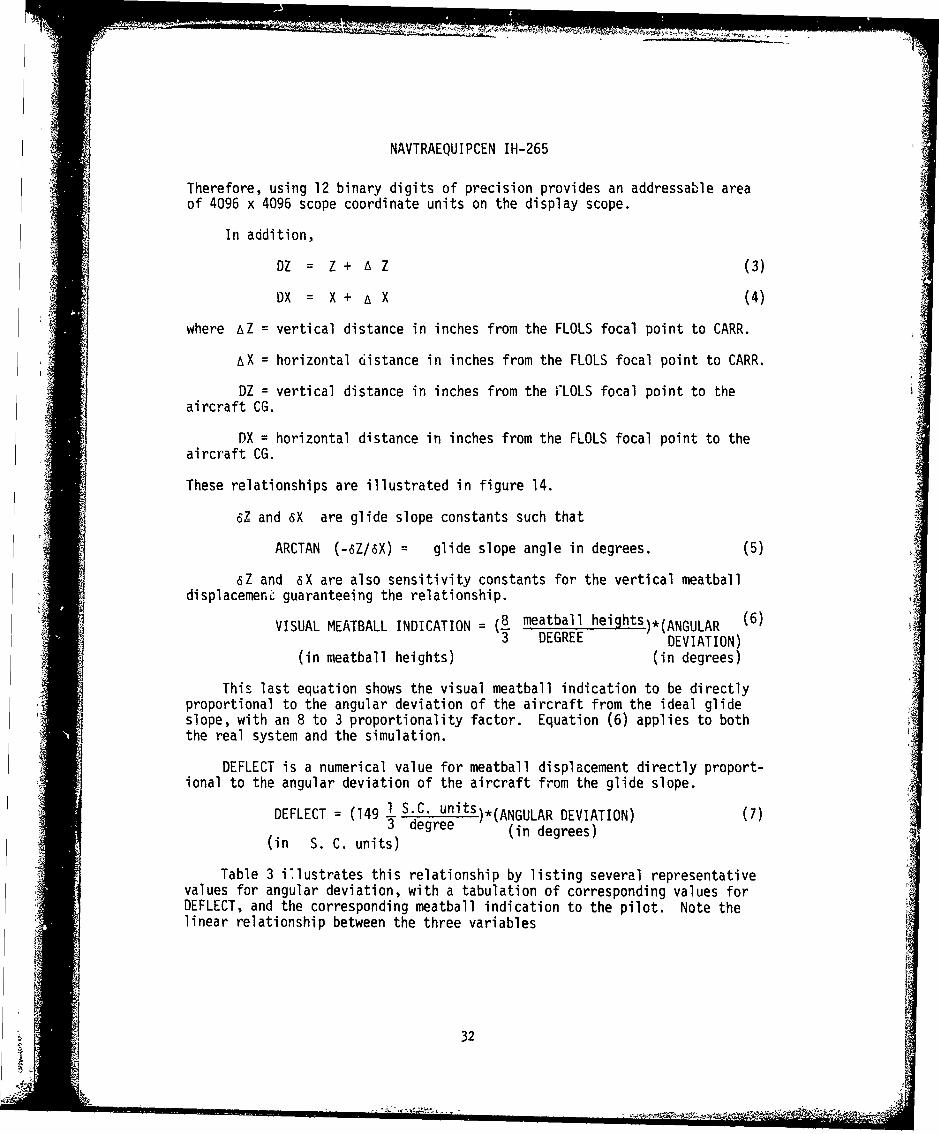
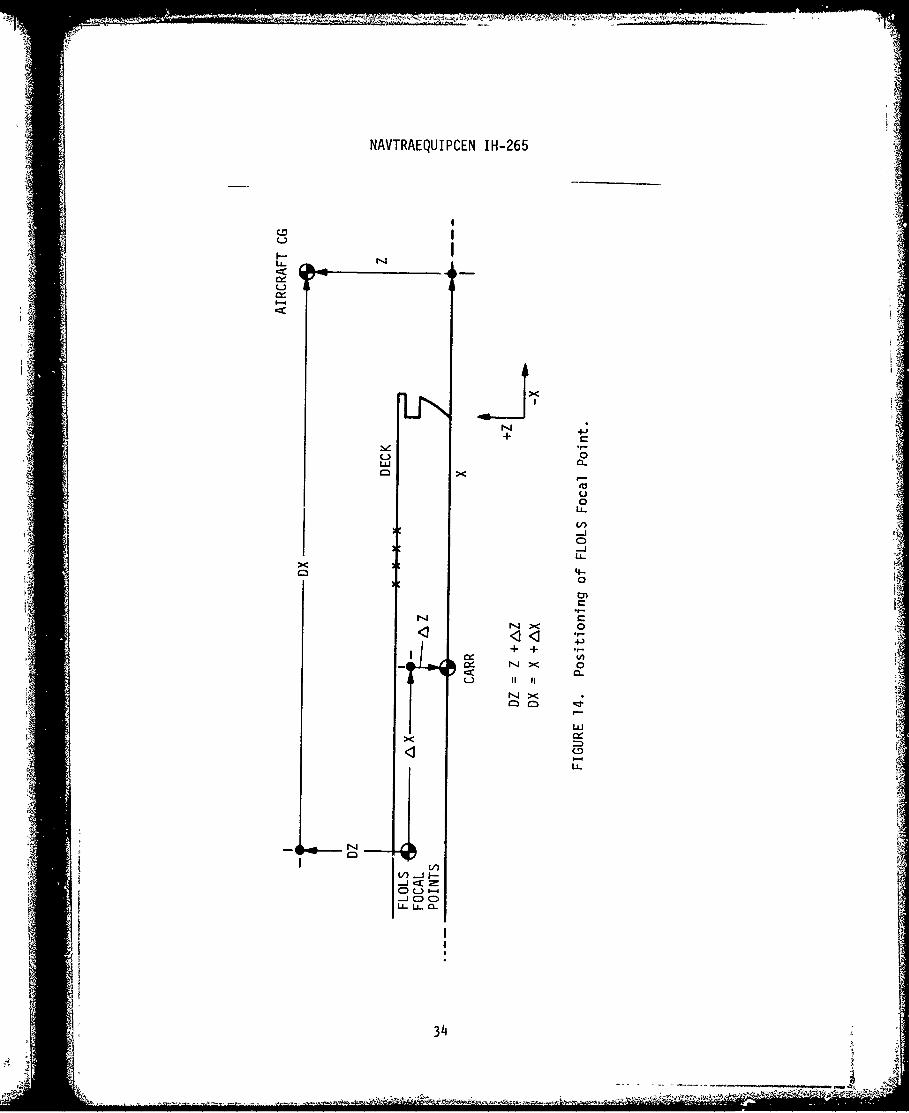
In addition,
DZ = Z+ AZ (3)
OX = X + AX (4)
where AZ = vertical distance in inches from the FLOLS focal point to CARR.
AX = horizontal distance in inches from the FLOLS focal point to CARR.
DZ = vertical distance in inches from the FLOLS focal point to theaircraft CG.
DX = horizontal distance in inches from the FLOLS focal point to theaircraft CG.
These relationships are illustrated in figure 14.
6Z and SX are glide slope constants such that
ARCTAN (-6Z/SX) = glide slope angle in degrees. (5)
6Z and 6X are also sensitivity constants for the vertical meatballdisplacemenL guaranteeing the relationship.
VISUAL MEATBALL INDICATION meatball heights)*(ANGULAR (6)3 DEGREE DEVIATION)
(in meatball heights) (in degrees)
This last equation shows the visual meatball indication to be directlyproportional to the angular deviation of the aircraft from the ideal glideslope, with an 8 to 3 proportionality factor. Equation (6) applies to boththe real system and the simulation.
DEFLECT is a numerical value for meatball displacement directly proport-ional to the angular deviation of the aircraft from the glide slope.
DEFLECT = (149 1 S.C. units.)*(ANGULAR DEVIATION) (7)3 degree (in degrees)
(in S. C. units)
Table 3 illustrates this relationship by listing several representativevalues for angular deviation, with a tabulation of corresponding values forDEFLECT, and the corresponding meatball indication to the pilot. Note thelinear relationship between the three variables
32
'"A" ' ' '" , , .... I... " i 1•" ''p
NAVTRAEQUIPCEN IH-265
AIRCRAFT CG
DECK(+Z)
CARR
-(-x)
4N -- S
AIRCRAFT CG
Figure 13. Definition of Position Coordinate System
33
NATREQIE IH-265
4ý4
u 0
C-,)
'-'4-
3c
C-) 0
4-)
(A)
a-
-LJ
Li..
'4 (4-4
Km
V)-JF
34-

NAVTRAEQUIPCEN IH-265
TABLE 3. REPRESENTATIVE VALUES OF GLIDE SLOPE DEVIATION,ILLUSTRATING RELATIONSHIP BETWEEN ANGULAR •_DEVIATION, "DEFLECT," AND MEATBALL INDICATION.
Angular Deviation Computed Visual Meatballfrom Desired Glide Value of IndicationSlope "DEFLECT"
(degrees) (scope coordinate) (meatball heightsunits above or below
horizontal referencebar)
+0.75o +112 meatball is 2 meatballheights above horizon-tal reference bars
+0.3750 +56 one meatball heightabove
+0.0670 +10 0.1785 meatball heightsabove
0.00 0 meatball centered,5.
-0.75o -112 2 meatball heights
below
355
'4-
'5
35 - •,

NAVTRAEQUIPCEN IH-265
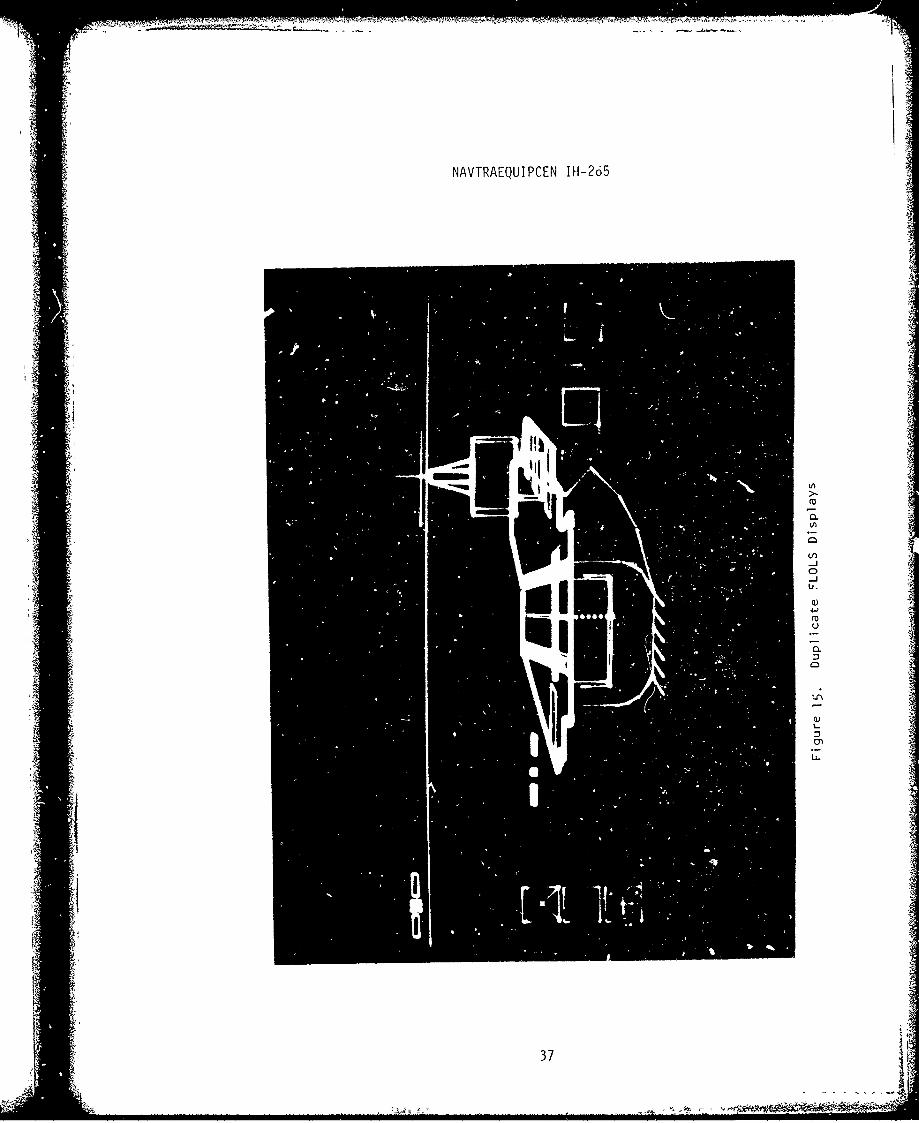
MBFN is similarly a linear measure of meatball displacement and isinversely proportional to the angular deviation from the glide slope. MBFNis measured in inches, the basic unit of length in the simulation. Thereason for two variables as measures of meatball displacement is the dualdisplay of FLOLS. One display is an integral component of the three-dimen-sional carrier model, while a second display appears at the left hand edgeof the CRT screen, as in figure 15. This second display is drawn in the2-D operational mode of the LDS-I. Always positioned at the same scopecoordinates on the left hand side of the screen, the 2-D version does notmove, and unlike the 3-D version, its size does not change on the screen.
The purpose for this second FLOLS display is to ensure continuedvisibility of the FLOLS when the aircraft carrier is either quite far or quitenear to the viewer. With the carrier more than approximately one mile fromthe viewer, the 3-D FLOLS display is too small to be useful because of itsinsensitive error indivation at long range. Conversely, when the carrier isclose enough for the aircraft to be above the deck, the narrow 19 degree fieldof view on the CRT precludes the 3-D FLOLS from being seen.
MBFN and DEFLECT are meatball displacement values for the 3-D and 2-DFLOLS displays, respectively. The two functions differ with respect tosign and magnitude. Their opposite polarities are due to separate coordinatesystems for the 3-D and 2-D displays, the down direction being positive inthe former and negative in the latter. The difference in magnitudes of MBFNand DEFLECT exists because unlike the 2-0 version, the 3-D FLOLS version isdrawn to model scale.
The value for MBFN equals zero when the aircraft CG is on the prescribed
ideal glide slope. This condition is expressed by equation (8) below.Substituting MBFN = 0 into equation (2).
0 = MBFN= 6Z - 6X* (DZ/DX)
QZ DZ aircraft exactly on glide slope (8)
Equation (8) indicates that for the special condition of the aircraftexactly on the glide slope, the 6Z/6X ratio for the ideal glide slope isequal to the DZ/DX ratio of the aircraft glide slopc.
The conditions for engaging the third arresting cable are as follows:
6 Z = 264"
6X = 4280"
A X = -1008"
These given values for the constants 6Z and 6X provide the simulation aprescribed ideal glide slope of 3.530, with a visual sensitivity on the CRTdisplay in accordance with equation (6). The given values for the constants
36
NAVTRAEQUIPCEN 111-265
4
I
It)
m
LA
0
(��)
0-JI.).
44
U
:30. A
0
U-I
Q)L:3
U-? a
'1 IV
f A
37 If- - .-

NAVTRAEQUIPCEN IN-265
AZ and A X place the FLOLS focal point 522 inches above sea level and 1008inches forward of the carrier reference point, as in figures 9 and 10.
In order to illustrate how the equations for the meatball displacementoperate, several specific values for X and Z will now be substituted intoequations (1) through (7)
I:lustrative Example 1. In this first example, the iircraft has landed,
and its center-of-gravity is positioned directly above the third wire.
X = -280 feet
Z = + 66 feet
DZ = Z + A Z = (66' * 12) +(-522") = 270"
DX = X + A X = (-280' * 12) + (-1008") = -4368"
MBFN = 6Z - SX (DZ/DX) = 264" - (-4280") * 270'-43681
- -0.56"
DEFLECT = (-2) * (MBFN) (-2) * (-.0.56") = 1.12 S.C. units
ANGULAR DEVIATION FROM GLIDE SLOPE = DEFLECT/1491 = .00750
VISUAL MEATBALL INDICATION = 8/3 ANGULAR DEVIATION FROM GLIDE SLOPE
:1 - 8/3 * (.00750) =
= 0.02 meatball heights above center
GLIDE SLOPE = ARCTAN 6Z ARCTAN -264" = 3.5306 RCA 4280"'
Illustrative Example 2. In this example, the aircraft has landed andthe hook is engaged by the third wire.
X = -270 feet
Z = 66 feet
DZ = 270"
DX = -4248"
MBFN = -8.03"
DEFLECT = 16.06 scope coordinate units
ANGULAR DEVIATION FROM GLIDE SLOPE = .050
VISUAL MEATBALL INDICATION 0 0.14 meatball heights above center
38

-Ai
NAVTRAEQUIPCEN IH-265
Table 4 shows the visual meatball indication as a function of severalsets of specific X and Z values. The first set of values corresponds to asituation where the aircraft is on the flight deck (z = 66'). The secondgroup corresponds to the aircraft located approximately 1.5 nautical milesfrom the third wire on the flight deck (X = -9347'). Note that when theaircraft CG is directly above either the first or second wires, the meatballis low; when the CG is directly above the third wire, the meatball ispractically centered; and when the CG is directly above the fourth wire, themeatball is higb.
Aircraft CG Visual Meatball
Above Wire # Indication
1 0.92 meatball heights below
2 0.47 meatball heights below
3 0.02 meatball heights above
4 0.57 meatball heights above
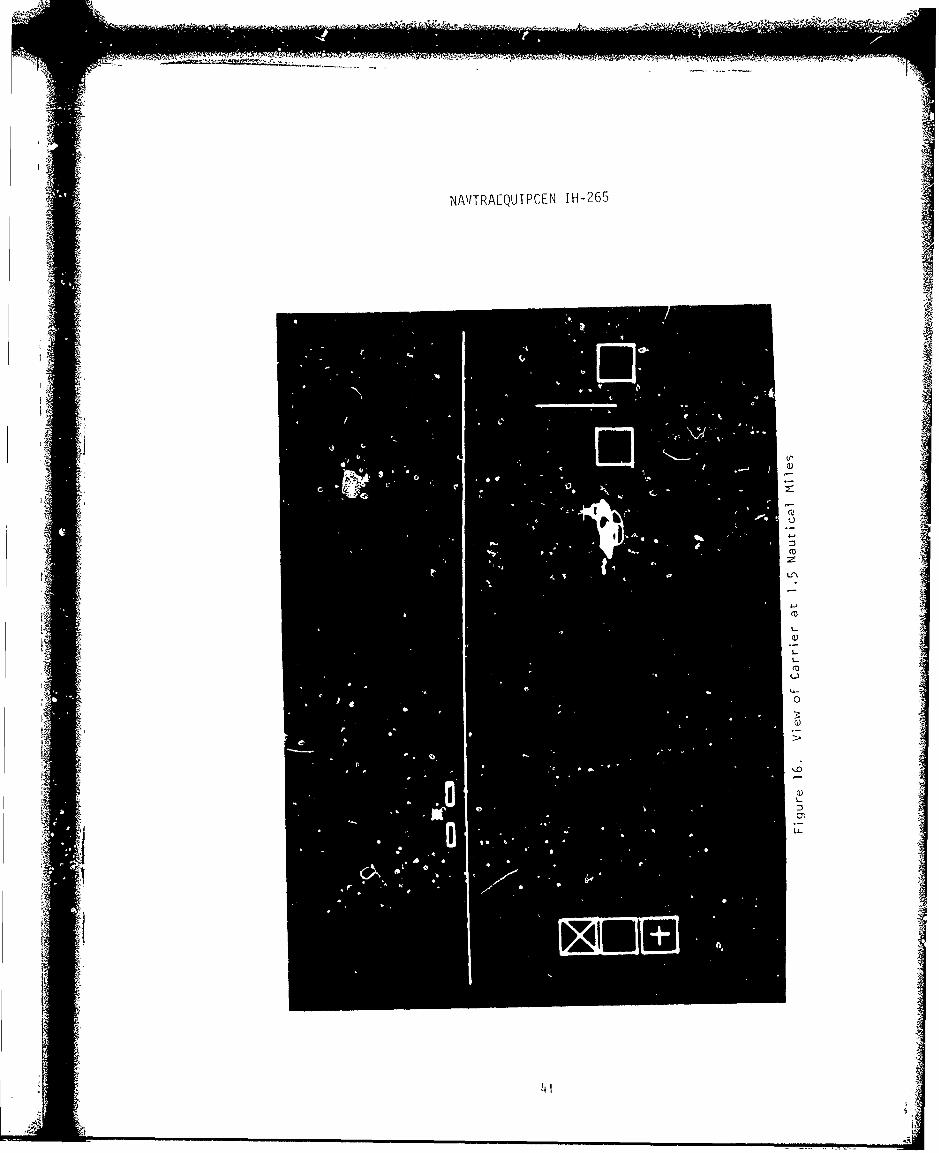
Illustrative Example 3. In this example, the aircraft is at a distance
of 1.5 nautical miles from the fourth wire. The view from that distance, andthe corresponding meatball indication, are shown in figure 16.
X = -9347 feet
Y = -500 feet
Z = + 710 feet
DZ = Z + A Z = (710' * 12) + (-522") = 7998"
DX = X + A X = (-9347' * 12) + (-1008") = -113,172"
MBFN = 6 Z - 6 X *(DZ/DX) = ?64" _ (-4?89n, * t7- 8- -• 7,A 5 :
DEFLECT = (-2) * (MBFN) = (-2) * (-38.5") = 77.0 s.c. units
ANGULAR DEVIATION FROM GLIDE SLOPE = DEFLECT/149½ = +77.0/1491
= + 0.5150
VISUAL MEATBALL INDICATION = 8/3 ANGULAR DEVIATION FROM GLIDE SLOPE
= 8/3 * (0.5150) = 1.37 meatball heights above
center
S39

NAVTRAEQUIPCEN IH-265
TABLE 4. VISUAL MEATBALL INDICATION AS FUNCTION OF SELECTED X AND Z VALUES.
X Z DEFLECT (SCOPE ANGULAR VISUAL(feet) (feet) COORDINATE DEVIATION MEATBALL
UNITS) FROM GLIDE INDICATIONSLOPE (meatball
(degrees) heightsabove center)
-260' 66' 31.88 0.21o 0.57
-270' 66' 16.06 O.050 0.14
-280' 66' 1.12 0.010 0.02
-290' 66' -13.03 -0.090 -0.23
-300' 66' -26.44 O-0.180 -0.47
-320' 66' -51.26 -0.340 -0.92
0-9347' 610' -13.86 -0.09 -0.25
-9347' 625.23' 0 00 0
-9347' 748.62' !12 0.750 2.0
- 1
40
.......
-- -� -'-"4 - �
4-
NA'(TRAEQUIPCF�N IH-265
4-
? jU
4
U
zU-'
44 L.
4'
4- -
L
0
3:
1'
'0
L .4
rIL
4-
4;
�,' 4.j
4
.4,
1414 -4'
4'
I4�

NAVTRAEQUIPCEN IH-265
DISPLAY CONFIGURATION
There are two displays of the FLOLS in the carrier landing simulation.One display appears next to the carrier, while a second display is stationedon the left side of the screern (see figure 15). The second display remainsstationary at a constantly displayed size and may be used if needed when themeatball of the first display is either invisible or not clearly visible tothe simulator pilot. The meatball of the three-dimersional FLOLS display,which is adjacent to the carrier, is not visible over the entire range of
operation.
The location of the FLOLS for the aircraft carrier is illustrated infigures 8, 9, and 10. The lens is shown to be 476.3 feet forward of theangled deck ramp, and 117.8 feet to the left of the angled deck center line.
Figure 17 shows the FLOLS displays for both the three-and two-dimensionalmodels. The meatball is drawn as an eight-pointed star, and the horizontaldatum lights are represented by fixed index bars. The figure shows dimensionaldata as well.
OTHER FEATURES
The meatball is drawn only if the plane is aft of the meatball display.The effect is the simulation of +900 azimuthal range light beam.
Above a 4.280 glide slope the meatball is no longer displayed. (4.280 =
3.53 + 0.750). At 4.280, the meatball is at the top of its travel (two meat-
ball height8 above center). At 3.530, the meatball is at its origin, while at2.780 (3.53 - 0.750) it is positioned at the bottom of its allowable travel.It is not displayed below 2.780.
To facilitate the detection of low meatball, the meatball is displayedwith a brighter intensity between 3.530 and 2.780, so that the simulator pilotviews a brighter meatball below the prescribed glide slope.
The following features are lacking in the present system:
a. The actual FLOLS has a yellow meatball and green datum lights. The
The TRADEC LDS-1 system on the other hand has no color.
b. Flashing red meatball condition fob' dangerously low approach.
c. Wave-off signal for unsafe landing condition.
42
I.... 5'•• • : .. _. .. . . .. . . . . .. . .....• •. ... • • "•- • . . . . . • •.. . ... ,--

NAVTRAEQUIPCEN IH-265
I-
LzU
IM
C:)
cJm
I-o 4--)-
A OLLA
I-A-
41< U 0
Li> W
Cr --UC.
43A

NAVTRAEQUIPCEN IH-265
DISTRIBUTION LIST
Naval Training Equipment Center 41Orlando, Florida 32813Defense Documentation Center 12
Cameron StationAlexandria, Virginia 22314
Chief of Naval Education & TrainingSupportCode N21Pensacola, Florida 32508
Chief of Naval Education & TrainingCode N331Pensacola, Florida 32508
Naval Air Systems Command 6AIR 340FWashington, DC 20361
Chief of Naval OperationsOP 59Washington, DC 20350
Chief of Naval MaterialNavy DepartmentCode 0324Washington, DC 20360
CommanderNaval Air Development Center LibraryWarminster, Pennsylvania 18974
Chief of Naval ResearchONR 461800 North Quincy StreetArlington, Virginia 22217
Chief of Naval Air TrainingTraining Research DepartmentNaval Air StationCorpus Christi, Texas 78719
US Army Training Device AgencyNaval Training CenterOrlando, FL 32813Chief of Naval Education & TrainingLiaison OfficeAir Force Human Resource LaboratoryFlying Training DivisionWilliams AFB, AZ 85224
44 A


![Arrays & ArrayList - courses.cs.washington.edu4 Words exercise Write code to read a file and display its words in reverse order. A solution that uses an array: String[] allWords =](https://static.fdocuments.net/doc/165x107/5f5243ef210e8f62dc332b93/arrays-arraylist-4-words-exercise-write-code-to-read-a-file-and-display.jpg)


![Building Java Programs - courses.cs.washington.edu...3 Words exercise Write code to read a file and display its words in reverse order. A solution that uses an array: String[] allWords=](https://static.fdocuments.net/doc/165x107/5f627d3bb0a1ca1f2971b442/building-java-programs-3-words-exercise-write-code-to-read-a-file-and-display.jpg)


