Bernalillo County Behavioral Health Initiative: Peer Case ...
116
Bernalillo County Behavioral Health Initiative: Peer Case Management Process Evaluation Prepared by: Alex Severson, Ph.D. Prepared for: Bernalillo County Department of Behavioral Health Services UNIVERSITY OF NEW MEXICO, INSTITUTE FOR SOCIAL RESEARCH CENTER FOR APPLIED RESEARCH AND ANALYSIS JULY 2021
Transcript of Bernalillo County Behavioral Health Initiative: Peer Case ...

Bernalillo County Behavioral
Health Initiative: Peer Case
Management Process
Evaluation
Prepared by:
Alex Severson, Ph.D.
Prepared for:
Bernalillo County Department of Behavioral
Health Services
UNIVERSITY OF NEW MEXICO, INSTITUTE FOR SOCIAL RESEARCH
CENTER FOR APPLIED RESEARCH AND ANALYSIS
JULY 2021

2
Table of Contents Introduction ................................................................................................................................................... 4
Literature Review .......................................................................................................................................... 5
Study Design and Methodology .................................................................................................................... 8
Program Data .......................................................................................................................................... 10
Performance Measures ............................................................................................................................ 10
Client-Level Data .................................................................................................................................... 12
Centro Sávila ....................................................................................................................................... 12
Crossroads for Women........................................................................................................................ 12
Client Satisfaction Surveys ..................................................................................................................... 13
Staff Interviews ....................................................................................................................................... 13
Study Findings ............................................................................................................................................ 20
Centro Sávila ........................................................................................................................................... 20
Program Description ........................................................................................................................... 20
Performance Measures ........................................................................................................................ 26
Client-Level Data ................................................................................................................................ 33
Client Satisfaction Surveys ................................................................................................................. 41
Staff Interviews ................................................................................................................................... 43
Crossroads for Women (CRFW)............................................................................................................. 49
Program Description ........................................................................................................................... 49
Performance Measures ........................................................................................................................ 52
Client-Level Data ................................................................................................................................ 55
Client Satisfaction Surveys ................................................................................................................. 64
Staff Interviews ................................................................................................................................... 66
Discussion and Conclusion ......................................................................................................................... 72
Limitations .............................................................................................................................................. 72
Performance Measure Data ................................................................................................................. 72
Client-Level Data ................................................................................................................................ 72
Client-Satisfaction Survey Data .......................................................................................................... 73
Interview Data ..................................................................................................................................... 74
Recommendations for Providers ............................................................................................................. 75
Strategies for Clearer Performance Measure Reporting ..................................................................... 75
Strategies for Increasing Attendance Rates and Intensiveness ........................................................... 77
Timing and Scope of Screening and Assessment Tools ..................................................................... 80
Covid-19, Telehealth, and ICM Best Practices ................................................................................... 82
3
Summary of Key Findings ...................................................................................................................... 84
Future Research ...................................................................................................................................... 87
Conclusion .............................................................................................................................................. 88
References ................................................................................................................................................... 89
Appendix A – Sample Crosswalk for Client-Level Data Request .............................................................. 93
Appendix B – BHI Interview Guide ......................................................................................................... 101
Appendix C – Provider Screening Tools .................................................................................................. 113

4
Introduction
In April 2015, the Bernalillo County Commission (BCC) contracted with Community Partners Inc. (CPI)
to provide consultation and develop a business plan for a regional cohesive system of behavioral health
care. In the 2015 report, CPI noted that, “It is important to develop a crisis care network for individuals that
will not only rely on the provision of crisis services but to ongoing treatment following crisis stabilization”
(CPI 2015: 32). To this end, the report identified both case management generally and Intensive Case
Management (ICM) specifically as evidence-based approaches which could be used to address this
community need. In their 2017 Request for Proposals (RFP 09-10-JZ), Bernalillo County and the
Department of Behavioral Health Services (DBHS) built upon these earlier CPI case management
recommendations to solicit proposals from community behavioral health providers to implement Peer Case
Management (PCM) interventions. The goal of PCM interventions is to link clients in the target population
– usually defined as individuals with concurrent substance abuse and serious mental illnesses – to relevant
social services through the use of relatable peers instead of licensed clinicians, behavioral health
professionals, or paraprofessionals.
In 2019, the DBHS contracted with two community-based behavioral health providers – Centro Sávila
(CCN 2019 – 0519) and Crossroads for Women (CRFW) (CCN 2019 - 9463) – to provide PCM
interventions to relevant target populations in Bernalillo County. Common among the services offered by
the two providers are: traditional case management services, the development of individualized service
plans, employment and education support, a focus on ICM with small case manager-client loads, the
integration of Motivational Interviewing (MI) techniques into case management practice, and the provision
of more general behavioral health services. The programs differ, to some extent, in the target populations
served and their referral streams, some of the types of case management services offered, program incentive
structures, and existing organizational capacities.
To date, the two funded PCM programs have not been systematically evaluated to determine whether
program activities have been implemented as intended and whether program implementation is consistent
with program-developed logic models and process maps, the existing evidence-base on peer case
management and ICM, and recommended best practices in the field. The purpose of the present process
evaluation is to evaluate three primary components of program implementation: (1) fidelity (i.e., the degree
of correspondence between the program-in-theory and program-in-practice), (2) dose (i.e., how frequently
clients utilize PCM services, which specific services clients utilize, and which clients are frequent service
utilizers), and (3) reach (i.e., whether the programs serve their intended population).
In order to assess fidelity, dose, and program reach, this process evaluation employs a mixed-methods
approach – using both qualitative and quantitative data – to assess these dimensions of program
implementation. To facilitate our review, we rely on data from four primary data sources – (1) monthly
performance measure data each provider reported to the DBHS, (2) 15 semi-structured staff interviews, (3)
quarterly client-satisfaction surveys conducted by each provider, and (4) client-level data from our record
review – each of which are described in more detail in the Study Design and Methodology section of this
report.
5
In what follows, we first survey the peer-reviewed literature on peer case management and ICM. We
proceed to discuss the design, data sources, and methodology of the process evaluation. We then review
both providers’ (a) performance measure data, (b) client-level data, (c) client satisfaction survey data, and
(d) interview data separately. We conclude the report by synthesizing themes across multiple data sources,
identifying central insights from the data and offering recommendations to improve process flow and data
quality in reporting going forward.
Literature Review
As noted in the Introduction, the central goal of PCM, as with most other variations of case management
models, is to link clients in the target population – usually defined as individuals with concurrent substance
abuse and serious mental illnesses – to relevant social services in an effort to help individuals in the target
population navigate an often-fragmented behavioral health ecosystem (Albrecht and Peters 1997).
Specifically, case managers aim to link clients to resources which can help address clients’ short-term and
long-term behavioral health needs, whether these specific needs relate to housing stability, vocational
training, employment stability, educational access, mental health, substance abuse, financial capability, life
skills, identity formation, or service coordination (Wellness Recovery Action Plan 2010).
However, case managers often perform a variety of additional tasks beyond information provision alone,
including the provision of social support to the clients they case manage, counselling, outreach, coaching
and advocacy, and service referrals (Pitt et al., 2013). Over the long-term, most case management programs
seek to promote positive psychosocial outcomes for program participants, whether perceptual (e.g.,
heightened self-esteem, self-management, self-efficacy, and sense of community belonging) or behavioral
(e.g., reduced relapse rates, reduced hospital time, increased use of community services, etc.) in nature.
However, the uniqueness of the PCM approach to case management lies in the form of its service delivery:
PCM, in contrast to other approaches to case management in the clinical literature such as generalist case
management or Assertive Community Treatment (ACT), relies on relatable peers – defined formally as
“individuals with histories of successfully living with serious mental illness who, in turn, support others
with serious mental illness” (Chinman et al. 2014: 429) – instead of licensed clinicians, behavioral health
professionals, or paraprofessionals to deliver case management services. Notably, these peers are distinct
from other behavioral health professionals who typically provide case management services in that their
knowledge about recovery is a function of both formal training – usually, some form of state-certification
– and shared lived experience (Borkman 1976; Dennis 2003). In part because of the shared lived
experiences peer case managers have with the target population, peer case managers tend to mirror the
socio-demographic characteristics of the individuals they serve and are often matched to clients on the basis
of such characteristics (Fuhr et al. 2014; Daniels, Bergeson, and Jan Myrick 2017; Nicholson and Valentine
2018).
Drawing from the socio-cognitive theoretical foundation of Social Learning Theory (Bandura 1977), PCM
approaches to case management reason that because peer case managers typically share relevant
experiences with, and background characteristics of, the target population and because peer case managers
serve as salient exemplars of successful recovery, clients will be motivated to model the peer case
manager’s behavior (Salzer 2002; Fuhr 2014). Advocates of peer case management approaches reason that

6
this modeling occurs because the shared experience of coping with addiction and recovery paired with
shared background characteristics help cultivate a sense of empathy, connectedness, mutualism, and
reciprocity between the peer case manager and their respective clients (Mead and Macneil 2006) and
because the visibility of the case manager’s own successes in recovery will be motivational to the client
(Gidugu et al. 2015). To these points, Chinman et al. note that peer case managers “draw upon their lived
experiences to share ‘been there’ empathy, insights, and skills . . . serve as role models, inculcate hope,
engage patients in treatment, and help patients access supports in the community” (2008: 1315). From this,
the perceived “peerness” of the case manager is reasoned to increase clients’ self-efficacy and case
manager-client trust which, in the short-term, is theorized to increase positive self-disclosure and reduce
client attrition. Over the long term, it is reasoned that peer case management will promote positive
psychosocial, mental health, recovery-oriented, physical health, and wellness outcomes including improved
mental well-being, reduced rates of substance use, reduced hospitalization rates, and reduced criminality,
among other things.
The evidence-base for PCM has expanded rapidly over the last twenty years. While there are some notable
methodological concerns with the existing evidence-base on PCM – specifically, a lack of clarity about
what peer support looks like and how peerness is defined and quantified, heterogeneity in programmatic
characteristics across interventions, and variability in model fidelity – the existing empirical evidence to
date from the most rigorous studies – meta-analyses and systematic reviews of randomized controlled trials
on PCM interventions – suggests that, on balance, peer case managers are either equivalently effective or,
in some cases, more effective than traditional behavioral health professionals and paraprofessionals at
improving client-side behavioral health outcomes.
To this point, Bellamy, Schmutte, and Davidson (2017) provide a comprehensive literature review of eight
recently published meta-analyses and systematic reviews which evaluated the effectiveness of peer-case
management programs on a set of mental health and physical outcomes, primarily analyzing studies which
used high-quality experimental or quasi-experimental designs. The first review discussed in the paper by
Pitt et al. (2013) analyzed 11 randomized controlled trials (RCTs) from 1979 - 2012 on peer support and
presented evidence that clients with serious mental illnesses who worked with peer case managers did not
experience any difference in psychosocial, mental health symptom, and service use outcomes compared to
clients who were under the supervision of traditional health professionals. This same review also presented
some tentative evidence that peer support lead to mild reductions in how frequently clients made use of
emergency services.
The second article discussed by Bellamy, Schmutte, and Davidson (2017) was a 2014 meta-analysis of 18
peer-support RCTs from 1982 to 2013 by Lloyd-Evans et al. (2014). Similar to the Pitt et al. (2013) review,
this review did not find consistent evidence that peer support improved hospitalization rates, mental health
symptoms, or service satisfaction relative to control groups. The review presented some tentative evidence
that the reception of peer support services significantly increased subjective measures of hope, recovery,
and empowerment in clients, though the authors noted that improvements in these measures were partially
dependent on specific features of program implementation such as program content, target client group,
whether case management was group-based or individual, whether case management was delivered face-
to-face or internet-based, the degree of support case management providers received from local mental
health services, and the extent of provider training.

7
The third review discussed by Bellamy, Schmutte, and Davidson (2017) was a 2014 meta-analysis of 14
RCTs by Fuhr et al. (2014). This review found that for individuals with serious mental illness, peer support
interventions produced small positive effects for improving clients’ quality of life and hope and were as
effective as other clinical approaches at improving clinical symptoms and quality of life. The fourth review
discussed by Bellamy, Schmutte, and Davidson (2017) was a 2014 systematic review of 20 studies, a mix
of RCTs and correlational studies from 1995 to 2012 by Chinman et al. (2014). The authors of this review
concluded that the level of evidence for each type of peer support service was moderate. However, the
authors also noted that many of the studies considered in their review had methodological shortcomings,
and that outcome measures varied across studies, making comparisons across studies difficult. The authors
also noted that the effectiveness of PCM services varied by service type. The authors found when compared
to professional staff, peers were better able to reduce inpatient use and improve a range of recovery
outcomes, although one study they referenced found a negative impact. The effectiveness of peers in
existing clinical roles was mixed.
The other set of review papers discussed by Bellamy, Schmutte, and Davidson (2017) evaluated the effects
of peer support on physical health outcomes which are less relevant for the purposes of the present process
evaluation given the emphasis on behavioral health outcomes. However, the overall conclusion of Bellamy,
Schmutte, and Davidson states: “In regards to traditional clinical outcomes (e.g. hospitalization rates,
symptom severity), the evidence clearly supports the inclusion of peer services is not detrimental to care
quality and results in at least equivalent outcomes to usual care conditions and/or services provided solely
by non-peer staff [emphasis added]” (2017: 165). The authors also concluded on the basis of their review
that there is some evidence that peer services can modestly reduce psychiatric inpatient service use and
crisis emergency services overall.
While the evidence noted so far presents a somewhat mixed picture on the efficacy of peer support
interventions relative to other forms of case management and flags the conditionalities constraining the
intervention’s effectiveness, it is worth noting that governing behavioral health agencies, including the
Substance Abuse and Mental Health Services Administration (SAMHSA), included peer case management
in their National Registry of Evidence-Based Programs and Practices (Wellness Recovery Action Plan
2010). Furthermore, it is worth highlighting that even if it is the case that peer-case management is not
uniquely effective at improving some outcomes of interest relative to other modes of case management, it
may still be a worthwhile intervention to pursue from a cost-effectiveness and opportunity cost perspective
given that the approach is, at worst, as effective as alternative approaches to case management and is
typically less expensive on the provider’s side per the current evidence-base.
In the context of the DBHS’ proposals and the actual implementation of peer case management in the field,
it is worth noting that in Bernalillo County’s initial RFP for PCM programs, the RFP indicated that peer
case management proposals would also be considered for acceptance which integrate Strengths-Based Case
Management (SBCM), an approach to case management which focuses on clients’ strengths and
emphasizes their capacity for growth and recovery (Fukui et al., 2012). Recent evidence suggests that
individuals who receive SBCM are hospitalized less frequently, are more independent in daily life, achieve
more goals, function better in the competitive employment and educational domains, report greater social
support, and have overall better physical and mental health (Barry et al., 2003; Rapp and Goscha 2006;
Fukui et al., 2012).

8
The two behavioral health providers who received contracts for the PCM program through the DBHS have
both implemented, in the broader context of their existing PCM programs, variations of ICM practices as
well, an approach to case management which enjoys more empirical support than PCM alone (see, for
instance, the Cochrane systematic review on ICM by Dieterich et al. 2017). Thus, we have reason to expect
that to the extent that the implementation of PCM by the providers is faithful to the underlying theoretical
models of SBCM and ICM and when considered in tandem with other evidence-based case management
strategies, positive behavioral health outcomes are likely to follow.
Study Design and Methodology
The design of this process evaluation follows recommendations on best practices for reporting for process
evaluations articulated by the MRG – Population Health Sciences Group (Moore et al. 2015). In their article
“Process Evaluation of Complex Interventions: Medical Research Council Guidance”, Moore et al. (2015)
note:
An intervention may have limited effects either because of weaknesses in its design or because it is
not properly implemented. On the other hand, positive outcomes can sometimes be achieved even
when an intervention was not delivered fully as intended. Hence, to begin to enable conclusions
about what works, process evaluation will usually aim to capture fidelity (whether the intervention
was delivered as intended) and dose (the quantity of intervention implemented). Complex
interventions usually undergo some tailoring when implemented in different contexts. Capturing
what is delivered in practice, with close reference to the theory of the intervention, can enable
evaluators to distinguish between adaptations to make the intervention fit different contexts and
changes that undermine intervention fidelity. (p. 2).
Moore et al. (2015) offer the following guidance on the types of information worth collecting within process
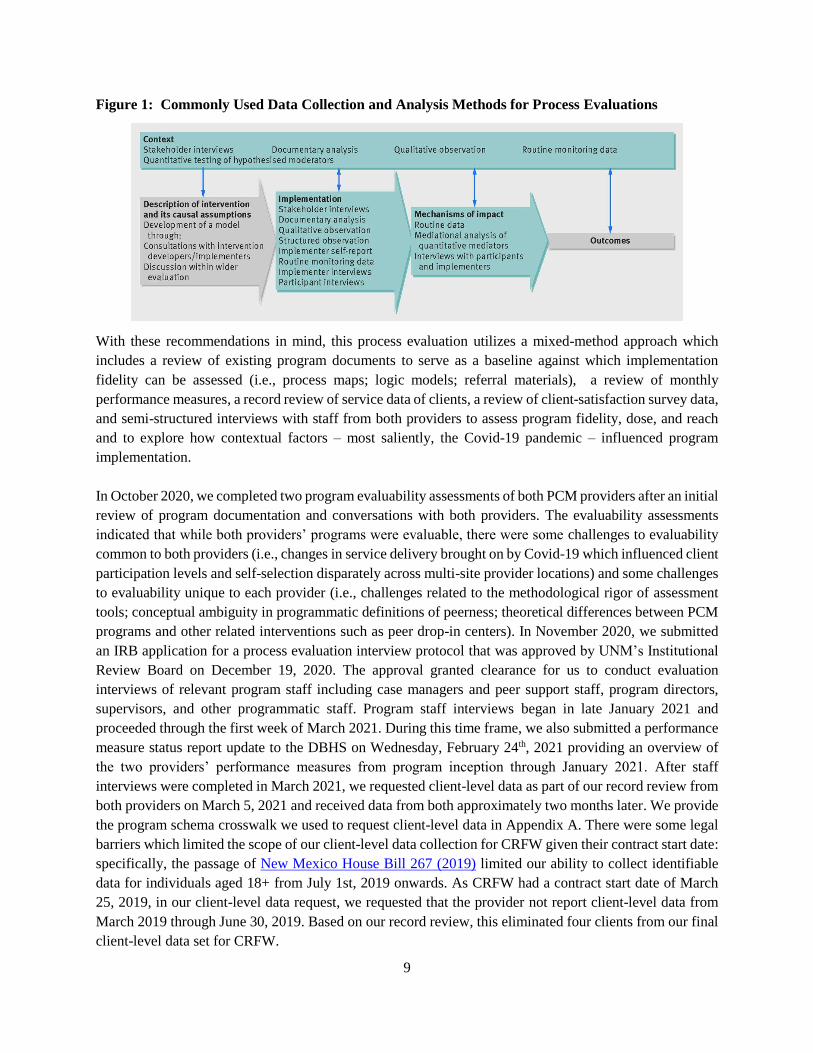
evaluations in order to assess program fidelity, dose, and reach (see also Figure 1):
• Use quantitative methods to measure key process variables and allow testing of pre-hypothesized
mechanisms of impact and contextual moderators
• Use qualitative methods to capture emerging changes in implementation, experiences of the
intervention and unanticipated or complex causal pathways, and to generate new theory
• Balance collection of data on key process variables from all sites or participants with detailed data
from smaller, purposively selected samples
• Consider data collection at multiple time points to capture changes to the intervention over time
• Provide descriptive quantitative information on fidelity, dose, and reach
CONTINUE TO NEXT PAGE
9
Figure 1: Commonly Used Data Collection and Analysis Methods for Process Evaluations
With these recommendations in mind, this process evaluation utilizes a mixed-method approach which
includes a review of existing program documents to serve as a baseline against which implementation
fidelity can be assessed (i.e., process maps; logic models; referral materials), a review of monthly
performance measures, a record review of service data of clients, a review of client-satisfaction survey data,
and semi-structured interviews with staff from both providers to assess program fidelity, dose, and reach
and to explore how contextual factors – most saliently, the Covid-19 pandemic – influenced program
implementation.
In October 2020, we completed two program evaluability assessments of both PCM providers after an initial
review of program documentation and conversations with both providers. The evaluability assessments
indicated that while both providers’ programs were evaluable, there were some challenges to evaluability
common to both providers (i.e., changes in service delivery brought on by Covid-19 which influenced client
participation levels and self-selection disparately across multi-site provider locations) and some challenges
to evaluability unique to each provider (i.e., challenges related to the methodological rigor of assessment
tools; conceptual ambiguity in programmatic definitions of peerness; theoretical differences between PCM
programs and other related interventions such as peer drop-in centers). In November 2020, we submitted
an IRB application for a process evaluation interview protocol that was approved by UNM’s Institutional
Review Board on December 19, 2020. The approval granted clearance for us to conduct evaluation
interviews of relevant program staff including case managers and peer support staff, program directors,
supervisors, and other programmatic staff. Program staff interviews began in late January 2021 and
proceeded through the first week of March 2021. During this time frame, we also submitted a performance
measure status report update to the DBHS on Wednesday, February 24th, 2021 providing an overview of
the two providers’ performance measures from program inception through January 2021. After staff
interviews were completed in March 2021, we requested client-level data as part of our record review from
both providers on March 5, 2021 and received data from both approximately two months later. We provide
the program schema crosswalk we used to request client-level data in Appendix A. There were some legal
barriers which limited the scope of our client-level data collection for CRFW given their contract start date:
specifically, the passage of New Mexico House Bill 267 (2019) limited our ability to collect identifiable
data for individuals aged 18+ from July 1st, 2019 onwards. As CRFW had a contract start date of March
25, 2019, in our client-level data request, we requested that the provider not report client-level data from
March 2019 through June 30, 2019. Based on our record review, this eliminated four clients from our final
client-level data set for CRFW.

10
Table 1 summarizes the target populations for each provider and lists the screening and assessment tools
each provider identified using – at some point throughout the program’s existence – in their original
contracts.
Table 1. Overview of PCM Providers’ Target Populations and Forms
Program Target Population Listed Forms
Centro Sávila High-risk adults 18 and older who have co-
occurring mental health and substance use
challenges including returning citizens who were
formerly incarcerated, who reside in the South
Valley or International District of Bernalillo
County, and who would benefit from intensive
peer case management to access services that
address the social determinants of health
(SDOH)
• General Services Intake
• ACEs
• Triage Referral Form
• Columbia Suicide Severity Index
(CSSI)
• WellRx Social Risk Screening
Tool
• Functional Assessment (SNAP)
CRFW Women who have completed any of Crossroads’
housing programs and have transitioned to
independent living in the Albuquerque
community, specifically those with co-occurring
mental health and substance abuse diagnoses
• POPPS Screening Tool (Modified
Version of AHC-HRSN Screening
Tool)
• POPPS Aftercare Program Follow-
Up Form
Program Data In order to assess program fidelity, it is important to understand the causal assumptions underpinning each
provider’s intervention and to trace the evolution of program process from start to finish. Causal
assumptions are typically articulated – either directly or indirectly – in logic models and visible, in practice,
in process maps. These program documents, in tandem, serve as a baseline against which we can make
eventual assessments of program fidelity in the field: deviations from the logic models and process maps
could either be construed as adaptive responses to evolved program needs, reflecting the unique ecosystems
of each provider (i.e., staffing; existing resources; stage of program implementation) and natural
fluctuations in the needs of their served target population or could signal a more meaningful departure from
program fidelity if and where the deviations conflict with the intervention’s central theory. Distinguishing
between these two explanations for process deviations can help us arrive at a better sense of a program's
potential effectiveness downstream.
Performance Measures
As part of BHI funding requirements, BHI-funded PCM providers agreed to report a number of
performance measures on a monthly basis to the DBHS. These performance measures were designed to
describe basic aspects of program implementation and to provide updates to the DBHS about changes to
program implementation. Both PCM providers indicated in their contracts that they would report
performance measure data including variables such as: the number of clients who completed intake forms
and screening, the number of service plans constructed, the number of clients reaching personal self-
identified goals, staff-to-client ratios, participation in civic engagement opportunities or community events,
the number of referrals, the number of client contacts with community providers, the number of case

11
management appointments made, the number of case management appointments attended, the number of
clients with more than one visit with their case manager, the number of internal referrals, social
determinants of health (SDOH) data, the number of staff trainings and case staff meetings, client satisfaction
survey results, the number of community events attended, and client demographics, including age, gender,
race, ethnicity, housing status, and preferred language. Not all of these performance measures were reported
by both providers throughout stages of program implementation (i.e., number of staff trainings and staff
case management meetings were never reported) and which performance measures were reported to the
DBHS evolved over time as data management tools and screening and assessment forms co-evolved.
In February 2021, we completed a status report which aggregated performance measure data by provider
and by year. In the status report, we noted that the performance measure data had not been cross-validated
against client-level data and thus could contain inaccuracies. Because the performance measure data was
summed across multiple years of program implementation and because some programs changed data
collection instruments for specific performance measure variables over time, the level of analysis provided
in the February 2021 status report did not permit inferences about changes in service delivery or program
effectiveness over time. Further, at the time of the report, it was unclear which specific instruments were
used to document program success: some of these measures, after discussions with providers in the
interviewing process, appear to not be evidence-based measures (i.e., assessing mental health improvements
for the performance measure data by asking only a subset of clients a single question about whether their
mental health improved versus using psychometrically-validated tools for tracking changes in mental health
improvement) whereas other performance measures were ambiguous (i.e., the number of repeat clients and
new clients and their summation severely overstated actual program participation; some performance
measure variables were vaguely-labelled). Thus, some of the conclusions of our February status report were
inaccurate given the use of total clients – and not new clients – as the relevant denominator. Additionally,
there were two other issues with performance measure data we observed upon reviewing the performance
measure data after the status update to the DBHS was submitted: the problem of client duplication makes
it difficult to assess whether new, continuing, or total clients should be used as the relevant denominator in
rate calculations such as attendance rates at case management meetings (i.e., the new versus continuing
client distinction is unclear in performance measure reporting as continuing clients include non-PCM clients
since continuing clients were reported on the performance measure data the first month both programs
began), and the reporting of demographic statistics, at times, included all clients at the organization-level
and not at the relevant program-level. For these reasons, one cannot necessarily draw accurate inferences
about the target population served at the program-level from the performance measure demographic data
alone.
This process evaluation’s discussion of performance measure data updates the February 2021 status report
which only reviewed performance measure data through January 2021. Further, we review additional
reported performance measures by provider not detailed in that report. In so doing, we provide a brief
description of each performance measure’s operationalization – if we are aware of how the performance
measure is coded – and include an additional three months of data added in through April 30, 2021. We
reproduce a table of performance measures in each provider section based on the most recently reported
performance measures reported to the DBHS by provider through the end of April 2021. We also provide
brief summaries of the performance measures by year noting some additional interpretative caveats of the
performance measure data and discrepancies between the performance measure data and client-level data
12
where they exist in the Discussion and Conclusion section of this report. As identified in previous ISR
reports (ACES and E & T), the type and quality of performance measures collected typically varies by
provider and by stage of program implementation. Thus, for these reasons, we want to underscore the
limited utility of performance measures for evaluation purposes, particularly when contrasted with the
greater granularity of client-level data, and we discourage the DBHS from using performance measure data
to either (a) inform contract renewal decisions or (b) inform subjective senses of programmatic successes
until the existing issues with performance measure data – expanded upon more systematically in Discussion
and Conclusion section – are resolved.
Client-Level Data
We met with both PCM providers between September 2020 and April 2021 in order to better understand
their program design and their data collection procedures. The meetings and discussions were important for
consensus-building between the evaluation team and the providers, allowed us to better understand the data-
management capacity of the providers, and allowed us to clarify any ambiguity surrounding our data-pull
requests (i.e. clarify details on variable collection and reporting processes). The following two sections
describe the client-level data collection process for each provider.
Centro Sávila
We met virtually with the provider twice before the data extraction in April 2021 to clarify specific
questions the provider had about variables we had requested data on and to discuss potential complications
associated with extracting the data from the existing EMR system and from paper records. We performed
our first data extraction on May 10, 2021. There were some limitations to the data provided during the first
extraction: some variables had ambiguous response categories not enumerated in the program schema
crosswalk, the initial data pull included identified data on minors which was inconsistent with the stated
program target population and thus was deleted given the requirements of New Mexico House Bill 267
(2019), the initial data did not include dates of intake and discharge in a readable format, and we did not
receive client-satisfaction survey data. After an email exchange to clarify some of these questions, we also
requested updated logic models, process maps, and additional referral documentation. We received a
number of updated program documents on May 12, 2021 including a .pdf with aggregated client satisfaction
survey data included in Spanish, Centro Sávila’s Strategic Initiative Report from 2021 which helped clarify
recent organizational changes to the peer case management program, and a copy of the WellRx
Questionnaire Centro Sávila used in the screening process. We performed our second data extraction on
May 13, 2021. With Centro Sávila’s client-level data, we are able to report data on client enrollment, referral
sources, client demographics, case management appointment counts and duration, client pre-program
residential status, and scores on the WellRx screening tool.
Crossroads for Women
We sent an initial request for data extraction – including a program schema crosswalk – to the appropriate
programmatic staff at CRFW on March 8, 2021, carbon-copying the program director. We met virtually
with the provider once before the data extraction to clarify some questions about variable coding. We
extracted the data on April 26, 2021. We followed up with CRFW staff three times via email after the initial
data extraction to ask a few clarification questions about the coding of specific variables on the client

13
satisfaction survey and to clarify some discrepancies which emerged in the data after brief descriptive
analysis (i.e., some questions about the scoring procedure used to identify clients’ unmet needs). With
CRFW’s data, we are able to report data on client enrollment, referral sources, client demographics, case
management appointment types, counts, and duration, pre-program employment and residential status, and
scores on the POPPS screening tool.
Client Satisfaction Surveys
Providers conducted quarterly client satisfaction surveys to assess how peer case management clients
evaluated the services they received and to evaluate other client-side attitudes (i.e., mental health
improvement), program knowledge, and barriers to service access. Since client satisfaction often correlates
with program retention (Tsai, Reddy, and Rosenheck 2014), having a better understanding of how clients
perceive the program can help evaluators and providers assess what works and what does not at the level
of service-provision. While both providers conducted quarterly satisfaction surveys, the types of questions
used to assess satisfaction varied both in number and form. As we note in the provider subsections, each
provider’s way of asking about client satisfaction has some limitations in terms of psychometric question-
design (i.e., the way these questions were worded and the answer choices provided could bias estimates of
satisfaction or could be improved through expanding the range of response options). Further, the quarterly
satisfaction surveys do not have high response rates. While low response rates are not as intrinsically
problematic as non-statisticians may reflexively assume (see, for instance, Kohut et al. 2012), because we
cannot assess outcome-correlated differences between clients who responded to satisfaction surveys and
those who did not, we cannot assess whether the opinion reported in the client satisfaction surveys typifies
the opinions of all clients more generally in the program: thus, the external validity of these survey
instruments paired with question wording concerns limit the interpretative scope of client-satisfaction
survey data.
Staff Interviews
From January 2021 – March 2021, we conducted 15 semi-structured interviews with current and former
case managers, program directors, and other administrative staff at the two providers. We used purposive
sampling to identify our sampling frame (Palinkas et al. 2015). We generated the sampling frame from
staff-emailed lists of past and current employees involved with each program’s peer case-management
programs. We report response rates by provider – assessed on the basis of these initial lists – in Table 2. Of
those who did not participate in staff interviews, most were former staff who did not have valid
organizational email addresses. Additionally, our interview recruitment email noted the need to enumerate
peer-case management relevant staff from program inception through January 2021. Thus, newer program
hires – including a new Program Operations Director at Centro Sávila – were excluded from participation.
Despite the lack of full-coverage in our interviewing, we suspect that we reached a concept in qualitative
interview research known as concept saturation which is defined formally as the point in data collection
where further data collection generates redundant information provided in previous interviews (Low 2019).
While in practice, the number of individuals volunteering to participate in the interview determined when
recruitment into the study ceased, by the last few interviews, significant repetition of concepts occurred,
suggesting adequate sampling and concept saturation.

14
Table 2. Interview Response Rates
Provider Response Rate (N)
Centro Sávila 76.9% (N = 10)
CRFW 100% (N = 5)
We conducted all interviews using the video-conferencing platform Zoom. Most interviews (93.3%; N =
14) were video-recorded and automatically transcribed using Zoom’s built-in transcription feature.
Participants had the option of not having their Zoom interview session recorded and transcribed. One
participant completed the interview process but did not consent to video-recording, and one participant
requested data deletion after the interview was completed and thus, we exclude the latter participant’s data
from the remaining analyses we present in this report. On average, interviews lasted 53 minutes though
median interview length varied by staff type given the interview’s skip logic (i.e., case managers were
typically asked 24 more questions than other types of program staff). Appendix B includes the interview
questionnaire. The interviews linearly progressed through the following thematic content:
• Participant training and qualifications
• Program referral sources
• Intake processes including assessments for mental health and substance use
• Self-assessment of the use of evidence-based practices
• Case management practices and services (i.e. case-manager-client relations; service plan
construction)
• Discharge and aftercare policies
• Workplace satisfaction and work burnout inventories
An analysis of these interviews allowed us to understand how peer case managers and other program staff
make sense of their work. Specifically, we wanted to document how peer case managers and other staff
process and monitor clients and evaluate the quality of their work environments, looking for similarities
and differences in their accounts. In the interviews, we also wanted to examine factors identified in the
peer-reviewed literature which limit the generalized effectiveness of peer support services (i.e., how peers
perceive their peerness in relation to their clients; whether peer support workers feel supported by other
staff) (Bellamy, Davidson, and Schmutte 2017). In what follows, we provide aggregated interviewing
counts and statistics across both providers. Table 3 reports the number of interviews completed by provider
excluding data from the participant who requested data deletion.
Table 3. Number of Interviews
Provider Number of Interviews
Centro Sávila 9
CRFW 5
Table 4 reports the education-level of participants. Over 75% percent of participants had at least a
Bachelor’s degree or a Master’s degree.

15
Table 4. Education
Education-Level Count Percent
HS or Equivalent 2 14.3%
Some College 1 7.1%
BA 5 35.7%
MA 5 35.7%
Doctoral Degree or Equivalent 1 7.1%
Table 5 reports formal case management-related certifications held by participants (i.e., CPSS; CPSW). We
provide details on the specific types of certifications received in the later discussion of each providers’
interviews. It is worth noting that not all staff positions (i.e., intake assessors; directors) necessarily require
case management-related certifications.
Table 5. Peer Case Management Certification Status
Count Percent
Yes 8 57.1%
No 6 42.9%
Table 6 reports whether participants were case management or administrative staff. A few participants
indicated job title changes which occurred within a few weeks preceding their interviews, and some
respondents indicated a division of work responsibilities between case management and other types of work
(i.e., completing intakes). We code these participants as blended staff.
Table 6. Job Titles of Staff Interviewed
Staff Type Count Percent
Case
Management
7 50%
Administrator or
Director
5 35.7%
Blended Staff 2 14.3%
Table 7 reports the years of work experience participants had in the behavioral health field. On average,
participants had 13 years of experience with a minimum of 0.5 years and a maximum of 50 years. Three
(21.4%) of the participants had 21 years or more of work experience and two (14.3%) had 16 to 20 years
of work experience. Over 30% of the participants had 16 or more years of work experience.
Table 7. Years of Work Experience
Years Count Percent
0 to 2 3 21.4%
3 to 5 3 21.4%
6 to 10 2 14.3%
11 to 15 1 7.1%
16 to 20 2 14.3%
21 + 3 21.4%

16
Table 8 reports the number of years each respondent had been employed by their respective employer. On
average, participants had been employed 3.1 years with a range of 0.25 years to 10 years.
Table 8. Years at Provider
Years Count Percent
0 to 2 9 64.3%
3 to 4 1 7.1%
5 to 6 1 7.1%
7 to 8 1 7.1%
9 to 10 2 14.2%
11 + 0 0%
Table 9 reports the number of hours worked weekly by participants. The vast majority (92.9%; N = 11) of
participants were full-time employees.
Table 9. Hours Worked Weekly
Hours Count Percent
Less than 20 0 0.0%
20-30 3 7.1%
31-39 0 0%
40+ 11 92.9%
Table 10 reports the number of hours staff delivered peer case management services each week. Four of the
14 participants did not answer this question as their job responsibilities did not involve case management
responsibilities. While over 90% of participants were full-time employees, only 20% indicated working
full-time providing peer case management services.
Table 10. Hours of Peer Case Management Services Provided
Hours Count Percent
1 to 20 4 40%
21 to 39 4 40%
40+ 2 20%
Table 11 summarizes the average years of experience and average years worked at the provider by provider.
Table 11. Summary Information by Provider
Provider Interview
Count
Average Years
of Experience
Range in
Years of
Experience
Average Years
Worked at
Provider
Range in
Years Worked
at Provider
Centro Sávila 9 14.5 0.58 - 50 2.5 0.25 – 10
CRFW 5 10.4 1 - 30 4.1 1- 10
In each interview session, we asked participants, specifically those who reported providing case
management services, a series of questions designed to assess their perceived workloads (i.e., number of
clients seen per week), perceptions of client similarity (1 = Very Dissimilar; 7 = Very Similar), and

17
perceptions of the quality of case manager-client relationships (1 = Very Unsatisfied; 7 = Very Satisfied).
We report these results in Table 12 below.
Table 12. Aggregated Case Management Perceptions
PCM Variables N Mean Standard Deviation Minimum Maximum
Clients Per Week 9 10.89 4.53 6 20
Client Similarity 9 6.00 1.11 4 7
Client Relationship 9 6.22 1.09 4 7
The results from Table 12 suggest that perceptions of case management workload were typically in the
range of ICM recommendations for case-loads. Generally, to ensure high-dosage, high-intensity case
management, the peer-reviewed literature on ICM suggests case managers have no more than 15-20 active
clients at a time. Further, the results from Table 12 suggest that, on average, case managers typically
perceived the clients they worked with to be similar to themselves – indicative of high peerness evaluations
– and perceived their relationships with their clients positively. No case managers provided ratings of
similarity or client relationship quality below the midpoint of the 7-point scale.
We also asked a series of questions designed to assess employee perceptions of (a) workplace satisfaction
(1 = Very Unsatisfied; 7 = Very Satisfied), (b) role change (0 = No Role Change; 1 = Role Change), (c)
certification usefulness (1 = Very Useless; 7 = Very Useful), (d) case manager – staff relations (1 = Very
Unsatisfactory ; 7 = Very Satisfactory), and (e) professional fulfillment, the latter of which was assessed
using the Stanford Professional Fulfillment Index (PFI) (Trockel et al., 2018). The PFI assesses the degree
of intrinsic positive reward an individual derives from their work, including happiness, meaningfulness,
contribution, self-worth, satisfaction, and feeling in control when dealing with difficult problems at work.
We coded response options on a five-point Likert scale (0 = Not at all True; 4 = Completely True). We
calculated scale scores by averaging the scores of all items within the PFI. These factors – workplace
satisfaction, role change, certification usefulness, case manager staff relations, and professional fulfillment
– have been identified in recent studies of peer support as factors which influence the generalized
effectiveness of peer support workers. We report descriptive statistics for all quantitative interview
questions in Table 13.
Table 13: Work Environment Variables
From Table 13, we observe that, in general, average levels of workplace satisfaction were high (x̅ = 5.15
on 7-point scale), though there is variability across participants in ratings given the standard deviation and
range, suggesting some polarization in perceptions of workplace satisfaction. Seventy-six percent (N = 10)
of employees reported experiencing role change since starting their positions. All employees who had
received relevant training or certifications perceived their training and certification to be, at minimum,
useful to them on the job. Average perceptions of case management - staff relations were positive (x̅ = 5.43
Workplace Variables N Mean Standard Deviation Minimum Maximum
Work Satisfaction 13 5.15 2.15 1 7
Role Change 13 0.76 0.43 0 1
Certification Use 10 6.4 0.84 5 7
PCM-Staff Relations 14 5.43 1.74 1 7
PFI 13 2.97 0.54 2 3.67

18
on 7-point scale), though similar to the workplace satisfaction variable, there is variability across
participants given the standard deviation and range. Finally, PFI scores were, on balance, high (x̅ = 2.97 on
4-point scale) indicating overall positive perceptions of professional fulfillment.
As there are interpretative and statistical challenges associated with detecting statistically significant
differences in underpowered, small-N samples using both parametric techniques such as t-tests or
regression analyses and non-parametric tests such as Wilcoxon Mann Whitney tests (Button et al. 2013),
we present a correlation matrix in Table 14 to assess bivariate relationships across providers for the
quantitative interview variables. The numbers reported in Table 14 – Pearson correlation coefficients – are
a simple measure of linear correlation between two variables which range from -1 to +1: a value of -1
indicates a perfectly negative correlation (as Variable 1 increases, Variable 2 decreases monotonically), a
value of 0 indicates the absence of a correlation, and a value of 1 indicates a perfectly positive correlation
(as Variable 1 increases, Variable 2 increases monotonically). We want to underscore the cliché: correlation
does not imply causation. Examining bivariate associations does not tell one whether a variable is causally
related to another variable as a correlation does not account for confounding or potential spuriousness in
bivariate relationships. For instance, it might be that evaluations of work satisfaction may be influenced by
how a specific provider addresses role change or by some unmeasured variable which would not be
accounted for through the examination of a bivariate correlation alone. Nonetheless, correlational analysis
can be suggestive of – though not probative of – potentially real relationships.
CONTINUE TO NEXT PAGE

19
Table 14. Correlation Matrix of Interview Covariates with Employee Workplace Perceptions
(1) (2) (3) (4) (5) (6) (7) (8) (9) (10) (11) (12)
(1) Work
Satisfaction
1.00 -- -- -- -- -- -- -- -- -- -- --
(2) PCM
Satisfaction
0.82 1.00 -- -- -- -- -- -- -- -- -- --
(3) PFI 0.14 0.31 1.00 -- -- -- -- -- -- -- -- --
(4) Org:
CRFW
0.55 0.52 -0.18 1.00 -- -- -- -- -- -- -- --
(5) Job: Case
Manager
-.01 0.00 0.05 -0.15 1.00 -- -- -- -- -- -- --
(6) Work
Full-Time
-0.14 -0.07 0.49 0.03 -0.52 1.00 -- -- -- -- -- --
(7) Weekly
Hours
0.04 0.17 0.47 -0.01 -0.66 0.87 1.00 -- -- -- -- --
(8)
Education
-0.14 0.01 0.13 0.04 -0.25 0.22 0.39 1.00 -- -- -- --
(9)
Certifications
0.22 0.05 0.21 0.04 0.29 -0.1 -0.26 -0.15 1.00 -- -- --
(10)
Experience
-.024 -0.34 -0.51 -0.15 0.05 -0.54 -0.45 0.31 0.34 1.00 -- --
(11) Years
w/ Provider
0.31 0.42 0.08 0.22 -0.64 0.26 0.65 0.58 -0.27 0.08 1.00 --
(12) Role
Change
0.39 0.12 0.11 0.06 -0.51 0.13 0.27 -0.18 -0.14 -0.26 0.36 1.00
Note: Statistically-significant correlations (p-value < 0.10) presented in bold.
Table 14 presents the correlation matrix of all individual-level quantitative variables measured in the
interview process across all 14 participants. There were some quantitative variables measured exclusively
among staff who indicated providing peer support services, described in more detail in the Study Findings
subsection, not reported in Table 14. From Column 1, we observe that higher levels of workplace
satisfaction were significantly and positively correlated with higher levels of perceived PCM–staff
relationships (r = 0.82; p-value < 0.01) and organization (i.e., employees at CRFW reported higher levels
of workplace satisfaction than employees at Centro Sávila) (r = 0.55; p-value < 0.1). A similar story emerges
from Column 2. From Column 3, we observe that higher mean levels of PFI (i.e., feeling more fulfilled at
work) were significantly negatively correlated with years of experience in the behavioral health field (r = -
0.51; p-value < 0.10), positively correlated with working full–time (r = 0.49; p-value < 0.10), and positively
correlated with the number of hours one worked (r = 0.47; p-value < 0.10). Again, we caution against
making causal inferences on the basis of bivariate correlations given issues of potential confounding and
given the small sample size which makes such correlations particularly sensitive to the presence of outliers.

20
Study Findings
Our evaluation of the two programs focused on a review of program materials (i.e. most recent fiscal year
contracts and available program descriptions contained in process maps and logic models where provided),
an analysis of performance measures provided to the DBHS, a review of identified data pulled from record
reviews, a review of client satisfaction data where provided, and interviews with staff, supervisors,
administrators, and directors.
Centro Sávila
Program Description
Centro Sávila’s PCM program offers intensive and strengths-based peer case management in conjunction
with counselling services to high-risk individuals with co-occurring mental health illnesses and substance
use disorders in Bernalillo County. One of the stated goals noted in Centro Sávila’s contract was the desire
to expand case management staffing capacity at Centro Sávila with the expectation that increased PCM
staffing would, in linking program clients to relevant community resources, reduce client recidivism and
otherwise attenuate the effects of adverse social determinants of health (SDOH) on client behavioral health
outcomes. Centro Sávila’s approach to peer case management emphasizes the development of
individualized treatment plans, the provision of case management services emphasizing ICM and MI
practices, and the provision of employment and education support.
Centro Sávila outlined program process and procedures in their contract (CCN 2019 - 0519). The following
description of Centro Sávila’s program process reviews the contracted description of Centro Sávila’s
process and not necessarily the process observed in practice or the process described in the provider’s
process maps. First, staff at Centro Sávila would use a series of intake forms to identify client case
management needs. Following this, staff would screen program participants for Adverse Childhood Effects
(ACES). Following this, case managers would create individualized service plans with their clients which
would be updated every 90 days. Case managers would provide intensive case management to their clients,
with an idealized staff-to-client ratio of 8:1, pairing case management with harm reduction approaches to
treatment and the use of MI techniques, and would accompany clients to meetings and appointments in
support of their goals. Additionally, case managers would provide episodic urgent care out of the WEHC
location. We report the list of Centro Sávila’s evidence-based practices in Table 15.
CONTINUE TO NEXT PAGE

21
Table 15. Centro Sávila’s Evidence-Based Practices
Evidence-Based Practice Description
Motivational Interviewing (MI) Motivational Interviewing (MI) is a counseling method that
helps participants resolve ambivalent feelings and insecurities
to find the internal motivation they need to change their
behavior. It is a practical, empathetic, and short-term process
that takes into consideration how difficult it is to make life
changes (Rollnick and Allison 2004; Hettema, Steeler, and
Miller 2005)
See also: https://www.samhsa.gov/homelessness-programs-
resources/hpr-resources/empowering-change
Intensive Case Management Intensive Case Management (ICM) is a community‐based
package of care aiming to provide long‐term care for severely
mentally ill people who do not require immediate admission.
Intensive Case Management evolved from two original
community models of care, Assertive Community Treatment
(ACT) and Case Management (CM), where ICM emphasizes
the importance of small caseload (fewer than 15) and high‐
intensity inputs (King 2006; Burns et al. 2007; Dietrich et al.
2017)
See also:
https://www.ncbi.nlm.nih.gov/pmc/articles/PMC6472672/#:~:t
ext=Intensive%20Case%20Management%20(ICM)%20is,do%
20not%20require%20immediate%20admission.
Strengths-Based Case Management Strengths-Based Case Management combines a focus on
individual's strengths with three other principles: promoting the
use of informal supportive networks; offering assertive
community involvement by case managers; and emphasizing
the relationship between the client and case manager. It is an
approach that helps participants achieve specific desired
outcomes. Implementation of Strengths-Based Case
Management has been attempted in a variety of fields such as
substance abuse, mental health, school counselling, older
people and children and young people and families (Rapp
2008). See also:
https://www.iriss.org.uk/resources/insights/strengths-based-
approaches-working-individuals
Centro Sávila provided us with three different process maps: one for their Main Location located at 1317
Isleta Blvd SW (Figure 2) and two for the Westside Emergency Housing Center (WEHC) located at 7440
Jim McDowell NW pre-Covid and post-Covid (Figure 3 and Figure 4). Centro Sávila also provided services
at The Hopkins Center located at La Mesa Presbyterian Church at 7401 Copper Ave and housing for clients
during Covid-19 out of the Hilton Garden Inn. These process maps highlight how the provider viewed client
engagement with the program, beginning with client referral, screening and eligibility criteria
determination, intake processes, assessment and service delivery, and the discharge process.

22
Centro Sávila Process - Main Location
Figure 2 describes program processes at Centro Sávila’s main location through December 2020. To
reiterate, the following description of Centro Sávila’s process map does not necessarily reflect the process
observed in practice. As indicated in Figure 2, Centro Sávila aimed to receive referrals from a variety of
sources from outside agencies. Once a referral was received by an intake coordinator at Centro Sávila,
preliminary eligibility was determined and an intake appointment was scheduled and completed if the client
consented to case management. The case manager and client then developed a treatment plan based on
expressed client goals and needs. Following this, the case manager provided clients with information on
how to access services and would meet with clients to follow-up with them and assess goal progress. Clients
could be discharged from the program if they indicated that they did not want to continue in the program,
if they did not contact their case manager for two months, or if they completed their treatment goals.
Figure 2. Centro Sávila Process Map – Main Location
Centro Sávila Process – Westside Emergency Housing Center (WEHC)
Centro Sávila also provided peer case management services to individuals out of the WEHC. However, the
types of case management services provided at WEHC were different in form than those provided at their
main location given the shelter’s focus on the delivery of rapid access services and urgent care. Notably,
there were some points of contrast between the process maps for Centro Sávila’s Main Location and WEHC
location. First, the referral sources at WEHC were distinct from those at Centro Sávila’s main campus with
most referral sources at WEHC being self-referrals of individuals who showed up at the shelter. Second,
the WEHC process map identifies an additional medical screening step which precedes case management
provision for some clients who presented with medical needs. After a client consented to case management

23
services, within 1-3 days the client would meet with a case manager to complete intake documentation.
Within 1-3 days after the intake appointment with the case manager, the case manager would collect
resources needed for clients based off of expressed needs. If a client exited WEHC, they would either be
called by the case manager or could request to meet with the case manager. Within 1 day of the initial intake
appointment, clients typically created a service plan in coordination with their peer case manager, were
housed, and received monthly case manager updates. The discharge criteria indicated that clients could be
discharged if they wanted to be or if they failed to contact the case manager for two months. The process
map indicates some relevant program considerations unique to the WEHC delivery of peer case
management services: the limited availability of intakes and case management meetings (i.e., limited to 3
weekdays), the limited geographic provision of case management services (i.e., case managers limited to
meeting clients at homeless shelter), and delays in connecting clients with service providers.
Figure 3. Centro Sávila Process Map – WEHC (Pre-Covid)
The onset of the Covid-19 pandemic changed how Centro Sávila operated out of the WEHC location as
articulated in Figure 3’s modified process map from June 12, 2020. Some key points of contrast with the
initial process map for WEHC include: (1) the nature of case management contact converted to non-face-
to-face contact (i.e., virtual messengers or phone calls) and (2) the timeline to discharge changed (i.e.,
clients were discharged if they missed three meetings with their case manager versus every 2 months).
CONTINUE TO NEXT PAGE

24
Figure 4. Centro Sávila Process Map – WEHC (Post-Covid)
Centro Sávila also provided us with a Referral and Process Map from August 2020 reproduced in Figure 5
below. This referral and process map provides greater specificity surrounding program operations including
components of crisis resolution, greater specificity over the intake screeners administered (e.g., Intake;
WellRx; ACES; CCSS), and more detail on program inclusion and exclusion criteria. However, this map
more generally articulates process and referral procedures for all of Centro Sávila’s homelessness
prevention and crisis support programs and not just Centro Sávila’s peer case management program.
Figure 5. Centro Sávila Referral and Process Map (Updated August 2020)
CONTINUE TO NEXT PAGE
25
Centro Sávila’s process flow evolved over time in response to organizational growth and the expressed
needs of clients and staff. In the fall of 2020, Centro Sávila conducted a study in partnership with Mora
Consulting LLC to evaluate workflows related to service access. The results of this study – detailed in the
Centro Sávila Strategic Initiative Report (2021) – suggested the following barriers to organizational service-
access at the client and staff levels:
1. Clients were frustrated with the number of steps required before seeing a clinician.
2. Clients were often sent to voicemail so staff could attend to other tasks.
3. New client outpatient appointments were difficult to coordinate.
4. There were often delays in referral response for both client/referring entity.
5. Waitlists were often unmanaged.
6. Staff felt overwhelmed and were confused about processes and data entry requirements for
reporting.
7. There was duplication of work effort across teams.
8. Staff were unsure of performance metrics and could not confidently navigate the system.
9. Cumbersome reporting due to limited EMR data.
10. Billing by third parties creates extra work on clinicians.
The Centro Sávila Strategic Initiative Report (2021) suggested that one of the root causes of these barriers
was the operational independence, or siloing, of different teams within the organization. In response to the
issues identified by the study by Mora Consulting LLC in the fall of 2020, Centro Sávila proposed
implementing biphasic changes – effective in January 2021 and March 2021 – to streamline existing
processes. Table 16 provides an overview of these proposed operational changes.
Table 16. Centro Sávila Strategic Initiative Report Biphasic Restructuring Plans
Phase Start Date Components
Phase 1 January 2021 • Centralization of scheduling and referral management, program
enrollment, peer case management
• Direct referral request into EMR Bear Intercom
• Expansion of direct services
• Automatic Billing
Phase 2 March 2021 • Management structure changes
• Human Resources components
• CCSS Certifications
Some organizational changes relevant to peer case management identified in the Centro Sávila Strategic
Initiative Report (2021) included (1) modifications to the intake process to reduce case manager
responsibilities for intake, (2) reassignment of some case management staff to the intake and enrollment
team, and (3) the hiring of a new Director of Operations to oversee, in part, the peer case management
program. Centro Sávila, in the Strategic Initiative Report, reasoned that these operational modifications
should increase the number of direct service hours case managers provide which should, in turn, produce a
more efficient workflow.

26
Performance Measures
Centro Sávila’s reported performance measures have evolved over time in part because of program
maturation, the Covid-19 pandemic, and the expansion of services delivered out of the WEHC location.
Table 17 provides an overview of Centro Sávila’s performance measures and their operationalization.
Table 17. Performance Measures
Performance Measure Operationalization
Number of Clients Screened for Intake • Number screened for PCM intake from City
Partnership
• Number accepted and/or transferred to PCM
from City Partnership
• Number screened for initial intake for CS PCM
• Number accepted and or transferred to CS PCM
• Number referred from internal CS programs
• Total number of clients screened
• Total number of clients accepted
Clients in Active Case Management • Case Manager Number of Clients
• Case Manager Hours of PCM Services
• Total number of clients on active caseloads
Self-Identified Service Plans • Number of plans initiated (by 30 days)
• Number of clients reaching personal self-
identified service plan goals
• Number of clients that decreased in severity
• Number of clients with improved mental health
Referrals – Warm Hand Offs • Number of clients
• Number of clients referred
• Number of total referrals
• Number of clients who connect with community
provider
• Percent of clients referred out
Appointments with PCM • Number of scheduled appointments with PCM
• Number of appointments attended
• Number of high severity clients seen weekly
Client Satisfaction • Number of client satisfaction surveys (quarterly)
• Percent of clients satisfied (quarterly)
Number of Collaborative Community
Partners
• Shared information and coordination of services
• Established new partnership, cooperation, and
relationship
Peer Screening and Brief Intervention -
Westside
• Clients referred from City
• Clients peers called
• Clients peers assessed
• Clients brief intervention

27
• Minutes of services provided
• Number of staff allocated – average
Referrals Out • Number of referrals from COAST Team
• Number of referrals from City HGI
• Total
• Number of clients referred to internal CS PCM
• Number of clients who reconnected with
provider for case management
• Number of clients who contact community
provider
Client Demographics • Gender
• Age by category
• Race/ethnicity
• SDOH
• Client Insurance
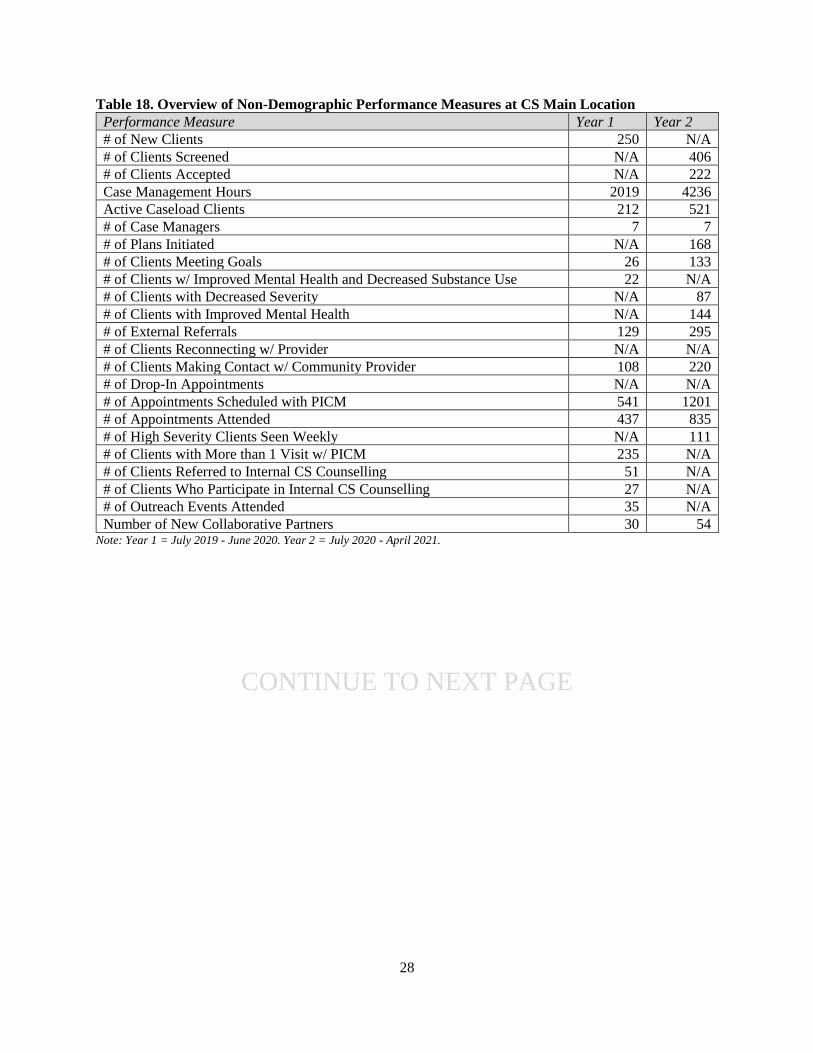
Table 18 reports the non-demographic performance measures reported by Centro Sávila’s main location
for Year 1 (July 2019 – June 2020) and Year 2 (July 2020 – April 2021) of program implementation and
Table 19 reports the demographic performance measures reported by Centro Sávila’s main location for
Year 1 (July 2019 – June 2020) and Year 2 (July 2020 – April 2021) of program implementation.
CONTINUE TO NEXT PAGE
28
Table 18. Overview of Non-Demographic Performance Measures at CS Main Location
Performance Measure Year 1 Year 2
# of New Clients 250 N/A
# of Clients Screened N/A 406
# of Clients Accepted N/A 222
Case Management Hours 2019 4236
Active Caseload Clients 212 521
# of Case Managers 7 7
# of Plans Initiated N/A 168
# of Clients Meeting Goals 26 133
# of Clients w/ Improved Mental Health and Decreased Substance Use 22 N/A
# of Clients with Decreased Severity N/A 87
# of Clients with Improved Mental Health N/A 144
# of External Referrals 129 295
# of Clients Reconnecting w/ Provider N/A N/A
# of Clients Making Contact w/ Community Provider 108 220
# of Drop-In Appointments N/A N/A
# of Appointments Scheduled with PICM 541 1201
# of Appointments Attended 437 835
# of High Severity Clients Seen Weekly N/A 111
# of Clients with More than 1 Visit w/ PICM 235 N/A
# of Clients Referred to Internal CS Counselling 51 N/A
# of Clients Who Participate in Internal CS Counselling 27 N/A
# of Outreach Events Attended 35 N/A
Number of New Collaborative Partners 30 54 Note: Year 1 = July 2019 - June 2020. Year 2 = July 2020 - April 2021.
CONTINUE TO NEXT PAGE

29
Table 19. Overview of Demographic Performance Measures at CS Main Location Performance Measure Year 1 Year 2
Gender: Male 112 164
Gender: Female 144 233
Age: 0-5 5 6
Age: 6-11 14 7
Age: 12-19 31 45
Age: 19-24 39 42
Age: 25-44 72 140
Age: 45-64 61 124
Age: 65+ 24 32
Ethnicity: Hispanic/Latino 186 227
Ethnicity: Non-Hispanic/Latino 18 71
Race: Black 4 5
Race: Asian 0 1
Race: White 41 28
Race: American Indian or Alaskan Native 15 28
Race: Native Hawaiian or Pacific Islander 0 0
Race: Multiracial 1 11
Race: Other 23 146
Race: Not Reported 17 178
Insurance: Medicaid 126 86
Insurance: Commercial 21 81
Insurance: No Insurance 86 223
# of SDOH Screeners 240 Note: Year 1 = July 2019 - June 2020. Year 2 = July 2020 - April 2021.
Table 20 reports the non-demographic performance measures reported by Centro Sávila’s WEHC location
for Year 1 (July 2019 – June 2020) and Year 2 (July 2020 – April 2021) of program implementation and
Table 21 reports the demographic performance measures reported by Centro Sávila’s WEHC location for
Year 1 (July 2019 – June 2020) and Year 2 (July 2020 – April 2021) of program implementation.
CONTINUE TO NEXT PAGE

30
Table 20. Overview of Non-Demographic Performance Measures at WEHC
Performance Measure Year 1 Year 2
# of New Clients 475 N/A
# of Clients Referred from City N/A 249
# of Clients Peers Assessed N/A 213
Minutes of Services Provided N/A 5060
Case Management Hours 3389 N/A
Active Caseload Clients 760 N/A
# of Case Managers 7 N/A
# of Clients Meeting Goals 56 N/A
# of Clients w/ Improved Mental Health and Decreased Substance Use 48 N/A
# of External Referrals 435 N/A
# of Clients Reconnecting w/ Provider 164 N/A
# of Clients Making Contact w/ Community Provider 119 N/A
# of Drop-In Appointments 525 N/A
# of Appointments Scheduled with PICM 843 N/A
# of Appointments Attended 684 N/A
# of Clients with More than 1 Visit w/ PICM 462 N/A
Number of New Collaborative Partners 88 N/A Note: Year 1 = July 2019 - June 2020. Year 2 = July 2020 - April 2021.
CONTINUE TO NEXT PAGE

31
Table 21. Overview of Demographic Performance Measures at WEHC
Performance Measure Year 1 Year 2
Gender: Male 412 N/A
Gender: Female 434 N/A
Age: 0-5 26 N/A
Age: 6-11 18 N/A
Age: 12-19 44 N/A
Age: 19-24 44 N/A
Age: 25-44 245 N/A
Age: 45-64 353 N/A
Age: 65+ 96 N/A
Ethnicity: Hispanic/Latino 103 N/A
Ethnicity: Non-Hispanic/Latino 85 N/A
Race: Black 18 N/A
Race: Asian 0 N/A
Race: White 29 N/A
Race: American Indian or Alaskan Native 56 N/A
Race: Native Hawaiian or Pacific Islander 1 N/A
Race: Multiracial 10 N/A
Race: Other 20 N/A
Race: Not Reported 73 N/A
Insurance: Medicaid 561 N/A
Insurance: Commercial 3 N/A
Insurance: No Insurance 222 N/A Note: Year 1 = July 2019 - June 2020. Year 2 = July 2020 - April 2021.
Performance measure reporting to the DBHS changed between Year 1 and Year 2 of program
implementation: in Year 2 of the program’s operation through April 2021, Centro Sávila did not report
performance measure data for WEHC clients in their reporting which explains the high frequency of NAs
in the Year 2 column in Tables 20 and 21. In the narrative section of their October 2019 Performance
Measure report provided to the DBHS, Centro Sávila provided some added context to this decision, noting
that there were issues associated with collecting demographic data from clients at WEHC and also noting:
They [quantitative performance measures] don't account for the intensive work that goes into
setting up an entirely new clinic. They are focused primarily on the services that are directly
provided to the patients at the WEHC clinic. The growth of the clinic is limited by several factors,
including financial resources, space, provider availability, and the communication that needs to
happen when multiple providers and agencies team up on a collaborative process. Nevertheless,
there have been great successes that are unlikely to be captured by the data. We are focused on
finalizing the intake process at the shelter to truly obtain the number of residents coming through
for services with us and partnering organizes.
One insight we can extract from the reported performance measure data not reported in Table 20 or Table
21 and not available in the provided client-level data are staff-to-client ratios. Of staff who reported
providing case management services each month and through April 2021, case managers had an active
caseload of approximately 20.2 clients per month. However, the average obscures variation between case
managers (i.e., one case manager averaged 4 clients per month; another averaged 77.1 clients per month),
does not account for the part-time or full-time work status of the case manager – which is unknown from
the performance measures and could explain variation in caseloads, and obscures month-to-month

32
variability within case-managers (e.g., one case manager saw 102 clients in back-to-back months and 1
client another month, suggesting temporal variation in client inflows). Two case managers saw particularly
high levels of caseloads in the first year of program implementation per the reported performance measures:
one averaged 55.2 cases per month and another averaged 77.1 cases per month. It is unclear why these
numbers were so high, whether this was a function of (a) the case manager engaging with high-volume,
low-intensity WEHC clients or (b) a miscalculation in the performance measures. Removing these two case
managers from the average caseload calculation suggests the active caseload per case manager was closer
to 12.3 clients per month which is within range of ICM recommendations. Having noted this, there is still
monthly variability within this subset of case managers when excluding the two case managers with
significantly high caseloads: for instance, in Year 1, one case manager had 0 active cases one month and
29 another. In Year 2, for instance, one case manager had 4 active cases one month and 27 in another.
Centro Sávila also provided comments on program successes, barriers, and changes related to performance
measure tracking over time in the narrative section of their performance measure reporting. This
information provides useful context for tracking program change longitudinally and identifying successes
with, and complications to, service delivery which are not captured directly in the interviewing data – given
the limited time-frame of the interviewing – or client-level data. A majority of program successes
mentioned in the narrative reports were centered on either (a) anecdotal examples of individual-client
success stories securing services, (b) expansion of collaborative community partners, (c) expansion of
training and certification opportunities for staff, or (d) the ability of the program to secure funding post-
Covid (i.e., CARES Act relief funding) and thus we do not detail these in more length here. We highlight
important barriers to service delivery mentioned in at least two monthly narrative reports below:
• There were many reported barriers clients encountered at the WEHC location (i.e., clients often
lacked access to reliable Internet, computers, and phones; clients often encountered transportation
barriers getting to the WEHC; clients often lacked money to afford identification cards and birth
certificates which limited clients’ ability to access other types of services; WEHC’s limited hours
of operation often did not overlap with those of other service providers and partners).
• Staff turnover at the WEHC location led to limited communication with Centro Sávila’s case
managers which made scheduling and locating clients difficult.
• It was difficult for the provider to collect demographic data for WEHC clients given the initial
outsourcing of demographic information in intakes received by other providers. It was difficult for
the provider to collect SDOH data given concerns that administering the Well-Rx scale would re-
traumatize clients and increase substance use among the client base.
• The provider identified many instances of friction with some partnering agencies (i.e., lack of
communication with providers and clients; outdated housing lists provided to clients; non-
comprehensive demographic data provided; other agencies’ lack of professionalism in dealing with
clients).
• Covid-19 and government public health emergency measures increased the remote delivery of
services (i.e., referrals, screenings, and case management were primarily conducted through phone
calls or using Tele-med). This limited case managers’ ability to collect relevant paperwork from
clients who did not have access to reliable Internet connections or phones.
• Covid-19 increased clients’ food-security needs (i.e., substantial uptick in utilization of food box
program).
• Covid-19 and government public health emergency measures reduced clients’ ability to access
external resources and offices and often delayed appointments (i.e., MVD had limited hours;
increased risk of homelessness due to limited housing supply; PCMs were not able to access copies

33
of documentation needed to obtain and reach client’s goals, such as housing applications, ISD
financial support, and other direct assistance applications.)
• The provider noted there were systemic issues trying to get new case management staff certified in
Peer Support Work (i.e., lack of communication with Office of Planning, Evaluation, and
Research).
• The provider reported some data-entry issues associated with their previous referral systems,
particularly out of the WEHC location.
• The provider noted that there were often seasonal fluctuations in client enrollment (i.e., decreases
in winter months).
Client-Level Data
This section details the client-level data we received from Centro Sávila which includes data on referrals,
enrollment and intake, screening, assessment, and services provided. During the time period considered for
this report, between June 2019 and May 2021, Centro Sávila’s PCM program screened 529 individuals for
program eligibility. We excluded 51 clients from analysis given that they were minors (i.e., either their date
of birth was entered incorrectly in the data we received or they were referred to non-PCM services). The
following set of tables reports the data we received for the remaining 478 PCM clients. Table 22 reports
where clients accessed case management services given the unique constellation of services offered at the
WEHC location in contrast to Centro Sávila’s other locations.
Table 22. Location of Service Provision for Centro Sávila PCM Clients
Client Program Location Count Percent
WEHC 95 19.9%
Main Campus 383 80.1%
Total 477 100%
Note: Missing location data for 1 client.
From Table 22, we note that a majority of 80.1% (N = 383) of Centro Sávila’s PCM clients received services
at their main campus. Table 23 reports client data by referral source.
Table 23. Referral Source for Centro Sávila PCM Clients
Referral Source Count Percent
WEHC 174 36.4%
Self-Referral 299 62.7%
Unknown 4 0.0%
Total 477 100%
Note: Missing referral source data from 1 client.
Table 24 reports the combined race and ethnicity of screened clients in line with recommendations from
the Census Bureau for merging race-ethnicity data reporting. 147 clients self-reported being White with
144 of these individuals reporting they were Hispanic/Latino. Seven clients reported they were American
Indian, 6 reported being African-American, 1 Asian, zero reported being Native Hawaiian or Other Pacific
Islander, and 173 identified their race as “Other”.

34
Table 24. Race & Ethnicity
Race & Ethnicity Count Percent
American Indian or Alaska Native 7 1.6%
Asian 1 0.0%
African American 6 1.4%
Native Hawaiian or Other Pacific Islander 0 0%
White 3 1%
Hispanic/Latino 144 33.6%
Other Race 173 40.3%
Unknown 95 22.1%
Total 429 100%
Note: Missing race and ethnicity data from 49 clients.
Table 25 reports clients’ sex. 48.6% (N = 228) of Centro Sávila’s PCM client base identified as female
and 51.3% (N = 241) of Centro Sávila’s PCM client base identified as male.
Table 25. Sex
Sex Count Percent
Female 228 48.6%
Male 241 51.3%
Total 469 100%
Note: Missing sex data from 9 clients.
Table 26 reports clients’ ages using the age cut points produced in the performance measure data for ease
of comparison. A plurality of 41.8% (N = 197) of PCM clients were in the 45-64 age bracket. The average
age of all clients was 45.2 years of age and the median age of all clients was 46. The youngest client was
18 years old, and the oldest client was 85 years old.
Table 26. Age
Age-Group Count Percent
19-24 39 8.3%
25-44 182 38.7%
45-64 197 41.8%
65+ 53 11.2%
Note: Missing age data from 4 clients. 3 clients were 18.
Table 27 reports clients’ residential status at the time they were enrolled. A plurality of 43% (N = 197) of
Centro Sávila’s client base reported being homeless at the time of intake compared to the 40.2% (N = 184)
of Centro Sávila’s client base which reported being housed at a private residence. Centro Sávila did not
report data on clients’ employment status at intake.
CONTINUE TO NEXT PAGE

35
Table 27. Residential Status at Intake
Residential Status Count Percent
Homeless 197 43.0%
Private 184 40.2%
Other 12 2.6%
Unknown 62 13.5%
Total 458 100%
Note: Missing residential status data from 30 clients.
In order to assess client needs at the point of intake, Centro Sávila administered the WellRx Questionnaire
to clients during the initial screening and assessment process. The WellRx Questionnaire is an 11-item
binary-response self-reported screening tool used to assess the social determinants of health across four
primary domains (i.e., economic stability, education, neighborhood and physical environment, and food)
(Page-Reeves et al., 2016). Clients can indicate multiple needs on the WellRx Questionnaire. See Appendix
C for more detail on WellRx Questionnaire question wording.
Per staff interviews and programmatic materials, the WellRx Questionnaire was used at the discretion of
case management staff at or near the point of intake. 22.2% (N = 106) of clients completed the WellRx
Questionnaire with some unexplained drop-off for the utilities question (Question Response Rate: 80.2%;
N = 85). The low completion rate of the overall questionnaire reflects a combination of (a) lack of data
from earlier paper records and (b) case manager discretion in administering the scales. Table 28 reports
clients’ identified needs on the WellRx Questionnaire at the time they were enrolled. The typical client
who completed the WellRx screener identified an average of 4.10 unmet needs with the total number of
unmet needs identified ranging from a minimum of 0 needs to a maximum of 11 needs, spanning the full
gamut of the scale’s range. Per Table 28, the three most commonly identified unmet needs, identified in
bold text, were income assistance (61%; N = 65), housing (56%; N = 59), and transportation (43%; N =
45). The three least commonly identified unmet needs were substance use (13%; N = 14), medical (17%;
N =17), and ER visits (22%; N = 23). It is unclear whether these needs typify the overall distribution of
unmet needs across all Centro Sávila PCM clients given the low completion rate of the WellRx
Questionnaire. The WellRx Questionnaire was only administered at the point of intake and not at any other
routine points as clients progressed through the PCM program, and thus we cannot conduct pre-post
statistical analysis using the existing SDOH data.
CONTINUE TO NEXT PAGE

36
Table 28. Descriptive Statistics of WellRx Screening Scale Score at Intake
Variable N Mean St. Dev. Min Pct (25%) Pct (75%) Max % with Need
Food 106 0.36 0.48 0 0 1 1 36%
Housing 106 0.56 0.50 0 0 1 1 56%
Utilities 85 0.41 0.50 0 0 1 1 41%
Transportation 105 0.43 0.50 0 0 1 1 43%
Childcare 104 0.08 0.27 0 0 0 1 8%
Income 106 0.61 0.49 0 0 1 1 61%
Employment 105 0.42 0.50 0 0 1 1 42%
Education 106 0.35 0.48 0 0 1 1 35%
Substance Use 106 0.13 0.34 0 0 0 1 13%
Safety 106 0.31 0.47 0 0 1 1 31%
Abuse 103 0.24 0.43 0 0 0 1 24%
ER Visits 103 0.22 0.42 0 0 0 1 22%
Medical 101 0.17 0.38 0 0 0 1 17%
Note: 372 clients enrolled in PCM did not complete any of the WellRx screening tool.
Centro Sávila also indicated in their process maps and interviews they administered the Columbia-Suicide
Severity Rating Scale (C-SSRS) during the screening and assessment process to assess clients’ potential
suicidality risk in order to refer clients of given risk-levels to the appropriate in-house clinical staff and
therapeutic services (Posner et al., 2008). However, this tool was only administered to 2.7% (N = 13) of
clients. Of the clients the C-SSRS was administered to, 7.7% were classified as no-risk (N = 1), 77.0% (N
= 10) were classified as low-risk, and 15.3% (N = 2) were classified as moderate-risk. Centro Sávila did
not report any additional screening or assessment data including ACEs screens which were indicated in the
original contract and process maps.
Centro Sávila also provided us with data on the primary need identified by clients in their service plans.
Table 29 reports the primary need identified by clients in their service plans.
Table 29: Primary Need Identified in Client Service Plans
Number of Clients Percent of Clients Identifying Goal
Housing 60 12.6%
Social Security Card 9 1.9%
Food 58 12.1%
Employment 12 2.5%
ID Acquisition 15 3.1%
Behavioral Health 104 21.8%
Public Benefit Enrollment 75 15.7%
Other 69 14.4%
Unknown 76 15.9%
Total 478 100%
From Table 29, we note that the three highest priority needs identified by clients – excluding the
miscellaneous “Other” category – were behavioral health needs (21.8%; N = 104), public benefit enrollment
needs (15.7%; N = 75), and housing needs (12.6%; N = 60).

37
In order to assess Centro Sávila’s dosage of case management services, it can be helpful to examine how
client enrollment in Centro Sávila’s PCM program evolved over time. An examination of client enrollment
trend data enables us to understand the temporal dynamics of client entrance and exit patterns as they evolve
in response to internal organizational changes and external stimuli such as the Covid-19 pandemic. Figure
6 plots the number of clients enrolled in Centro Sávila’s PCM program from July 2019 – April 2021 with
a red discontinuity line indicating the onset of the Covid-19 pandemic in March 2020 which was associated
with wide-scale programmatic changes in service delivery reflecting the program’s uptake of social
distancing policies and Covid-safe practices. Figure 6 – paired with the results of a change point detection
test designed to assess discontinuities in time-series data using the changepoint package in R – suggest a
few things about the evolution of client in-flows in Centro Sávila’s PCM program over time. First, the onset
of the Covid-19 pandemic in March 2020 was associated with a statistically significant short-term decline
in client enrollment levels which persisted for three months. Second, program enrollment levels rebounded
to pre-Covid levels in July 2020 before decreasing continuously in the later months of 2020 and into 2021.
Figure 6. Centro Sávila Client Enrollment Patterns from July 2019 – April 2021
In order to assess dosage, it can also be helpful to get a sense of how long clients remain enrolled in the
program. Of the 45.8% (N = 219) of total program clients who were discharged from the program before
the data collection period end-date of May 6, 2021, the median number of days a client was enrolled in the

38
program was 93 days. Of the remaining 54.2% (N = 259) of clients who still remained in the program
through the data collection period end-date of May 6, 2021, the median number of days a client had been
enrolled in the program was 240.5 days.
It is also worth considering the dosage of case management services provided as this allows us to more
directly assess the intensity of case management services provided and to estimate which client-level factors
predict disparate rates of service utilization. There are a few ways we can assess dosage within the client-
level data we received from Centro Sávila: (1) analyzing the overall number of minutes clients spent directly
interacting with case managers; (2) analyzing the number of case management meetings each client
scheduled; (3) analyzing the number of case management meetings each client attended; and (4) analyzing
the typical number of minutes each client engaged with their case manager per successful contact.
Unfortunately, we did not request data on the type of case management contact from Centro Sávila so we
cannot assess the form these contacts assumed, whether these contacts represented in-person case
management meetings, virtual meetings via Zoom or other video-conferencing platforms, telephonic
meetings, or direct mailers. However, we can approximate this indirectly by looking at the disparity
between number of attempted contacts (i.e., which we assume are either in-person or phone meetings with
clients) relative to other modes of contact (i.e., texts or mailers).
We present the descriptive statistics – including mean, median, and ranges – of these four variables in Table
30. We choose to discuss the median estimates instead of the mean given visible rightward skew in the data
(i.e., the relative rarity of high-frequency service utilizers) which biases estimates of mean minutes and
contacts artificially upwards. Thus, the median provides a more substantively meaningful interpretation of
the typical client’s case management interactions.
Table 30: Descriptive Statistics of Dosage
Variable Mean Median St. Dev Min Pct
(25%)
Pct
(75%)
Max N
Minutes Per Client 177.9 60.0 353.9 0 60 120 3,050 374
Number of Meetings
Scheduled
2.68 1.0 4.54 1 1 2 43 374
Number of Meetings
Attended
2.17 1.0 3.82 0 1 2 38 374
Minutes Per Contact 71.3 60 39.8 15 60 70 590 303
Note: The data we report in Table 30 excludes the 95 individuals who received rapid services at the WEHC location as data on
case management services was not reported for most clients at the WEHC location.
From the first row in Table 30, the median client received 60 minutes of case management services. From
Rows 2 and 3 of Table 30, we can estimate the attendance rate of scheduled client meetings (i.e., the degree
of client no-shows) by contrasting the number of clients who scheduled meetings against the number of
clients who attended meetings. Overall, clients attended 80.9% (N = 813) of 1,004 scheduled case
management meetings. While all of the 374 clients considered had at least one case management meeting
scheduled, 12.6% (N = 47) of clients attended no meetings with their case manager, and 61.50% (N = 230)
of clients only attended one case management meeting with their case manager. Thus, the overall dosage
of case management services provided for most clients is comparatively low (74.1% of clients met with
case managers no more than one time) when we consider ICM recommendations for high-frequency, high-

39
intensity contacts with case managers. From Row 4 of Table 30, we observe that of the 303 clients who had
contact with case managers of any duration (i.e., phone calls or in-person meetings), the median length of
contact was 71.3 minutes per contact.
It can also be helpful to analyze the profiles of high-service utilizers (i.e., clients logging higher volumes
of contacts and more minutes of contacts with case managers) in order to observe whether there are any
systematic patterns underlying service utilization rates. To this end, we utilize ordinary least squares (OLS)
regression to estimate whether these three outcomes – the number of client contacts, total minutes met with
case managers, and attendance rate – were predicted by recorded demographic characteristics of clients
(i.e., age, sex, race, ethnicity, marital status), the duration of client enrollment in the program, and unmet
needs as assessed by WellRx Questionnaire. We coded a client as having an unmet SDOH need using the
criteria identified on the WellRx Questionnaire (0 = Not an Unmet Client Need; 1 = Unmet Client Need).
We present the results of these regressions in Table 31 below excluding variables for which no statistically
significant differences were reported across models for ease of interpretation and excluding data on race
given potential identification concerns related to small cell size. Model 1 presents the results of an OLS
model predicting the total number of case management contacts a client had. Model 2 presents the results
of an OLS model predicting the total numbers of minutes of case management services provided. Model 3
presents the results of an OLS model predicting client attendance rates.
CONTINUE TO NEXT PAGE

40
Table 31. Results of OLS Models Predicting Service Utilization Outcomes
Model 1 - Contacts Model 2 – Minutes Model 3 – Attendance
Rate
Age 0.02 (0.01) * 1.22 (1.15) -0.00 (0.00)
Ethnicity: Non-Hispanic 1.71 (1.03) * 181.41 (99.87) * -0.10 (0.11)
Ethnicity: Unknown -1.42 (0.70) ** -127.86 (67.55) * -0.17 (0.8) **
Res Status: Homeless 0.78 (0.47) * 133.21 (45.42) *** -0.05 (0.05)
Res Status: Other 7.14 (1.12) *** 451.71 (108.5) *** -0.18 (0.12)
Days in Program 0.01 (0.00) * 0.15(0.09) -0.00 (0.00) ***
SDOH: Food -1.74 (0.97) * -199.9 (93.9) -0.07 (0.11)
SDOH: Housing -1.04 (0.80) -63.63 (77.72) -0.15 (0.09) *
SDOH: Utilities 2.51 (0.54) *** 237.37 (52.34) 0.05 (0.06)
SDOH: Childcare 5.00 (1.46) *** 391.47 (141.00) *** -0.05 (0.15)
SDOH: Income 3.24 (0.81) *** 248.24 (78.45) *** 0.08 (0.08)
SDOH: Employment -1.85 (0.83) ** -158.14 (80.58) -0.13 (0.09)
SDOH: Education 2.00 (0.91) ** 143.59 (88.16) 0.13 (0.10)
SDOH: Substance Use -3.26 (1.33) ** -322.76 (128.70) *** -0.13 (0.14)
SDOH: Safety -2.56 (0.88) *** -290.74 (84.71) *** 0.13 (0.10)
SDOH: ER 2.12 (0.99) ** 327.77 (95.27) *** 0.12 (0.11)
Observations 314 314 314
R2 0.46 0.44 0.25
Adjusted R2 0.41 0.39 0.18
F - Statistic 9.60*** 9.00*** 3.78***
Note: Results of OLS regressions. *p < 0.10, **p < 0.05, *** p < 0.01. Reference category for Ethnicity = Hispanic. Reference
category for residential status = private residence.
The results from Table 31 suggest a few things about clients who engage more frequently in case
management services at Centro Sávila’s main location. We consider here, for brevity’s sake, primarily
variables which achieve statistical significance at conventional levels (p-value < 0.05) and not marginally-
significant results (p-value < 0.10) and variables which achieve statistical significance across more than
one model. To facilitate interpretation, the coefficients in Model 1 can be interpreted as the effect of moving
from one unit to another unit of the row variable (i.e., either the reference category for categorical variables
identified in the table caption or from the absence of a need to the presence of a need for SDOH variables)
on the total number of times a client is contacted by their case manager. Thus, for illustration, the coefficient
of 5.00 for the SDOH Childcare variable in Model 1 indicates that, all else equal and after controlling for
other variables in the model, clients who reported an unmet childcare need were contacted 5 more times
than clients without an unmet childcare need. Clients who indicated having unmet needs in utilities,
childcare, income, education, and emergency room usage were significantly more likely to have higher
levels of contact with case managers than clients without such needs after statistically controlling for other
factors. Conversely, clients who indicated having unmet needs in employment, substance use, and safety
were more likely to have significantly fewer contacts with case managers than clients without such needs.
From Model 2, we note that relative to clients who lived at private residences at the point of intake, clients
who were homeless received, on average, 133.2 more minutes of case management. Similarly, clients with
expressed childcare needs, income needs, and ER needs were significantly more likely to have longer case
management sessions than clients without those needs. Conversely, clients with expressed substance use

41
and safety needs were significantly more likely to have shorter case management sessions than clients
without those needs. Finally, from Model 3, we note that there were not as many predictors of client
attendance rates as there were for contacts or minutes of case management services. Specifically, the only
need-based variable predicting attendance rates was the SDOH: Housing variable. Clients who reported
having unmet housing needs at the point of intake had, on average, 15% higher no-show rates for case
management appointments than clients reporting not having unmet housing needs, though this result is
marginally significant at conventional levels of statistical significance (p-value < 0.10). When dropping the
WellRx variables from the model, the Residential Status: Homeless variable similarly emerges as
statistically significant and is of the same direction and substantive size as the SDOH: Housing variable,
suggesting that housing issues and particularly, homelessness, reduces the likelihood of a client attending
scheduled case management meetings.
Finally, it is worth considering external referral streams for clients at Centro Sávila. Excluding 332 referrals
to case management services, Table 32 reports referrals to other types of services beyond case management.
Table 32. External Referral Services Provided
Referral
Count
Percent
Food Security 9 17.6%
Outpatient Services 14 27.4%
Psychoeducation 2 3.9%
Public Benefits Enrollment 22 43.1%
Services for Systems-Involved
Youth
1 2.0%
Services for Victims of Crime 3 5.9%
Total 51 100%
From the external referral data provided by Centro Sávila, we were not able to assess the number of minutes
of referral services provided or whether those who received case management services also received
referrals to non-case management services as only one referral was reported per client in the data we
received. Of non-case management referrals identified in the data, public benefits enrollment (43.1%; N =
22) and outpatient services (27.4%; N = 14) were the primary services clients were referred out to.
Comprehensive data on clients’ service enrollment and uptake are currently unavailable, so we are unable
to determine the extent to which client service referrals resulted in service receipt at this time.
Client Satisfaction Surveys We received aggregate data from Centro Sávila for one client satisfaction survey conducted in October
2020 (N = 33). It is unclear what the response rate was for the October 2020 survey given a lack of
information on the standard denominator used to compute response rates for surveys (i.e., the total number
of clients who received survey invitations). The October 2020 survey was conducted in Spanish. We
translated the survey questionnaire and survey results using Google’s translation services. The October
2020 survey asked clients 36 questions including questions about the length of time clients were enrolled
in the program, referral sources, appointment attendance rates and reasons for non-attendance, clients’

42
distance to the counselling center, clients’ primary mode of transportation, and demographic information
(i.e., sex; education-level; ethnicity; preferred language; length of residency in the United States; zip code;
etc.). While most questions were closed-choice format, there were a few questions which were open-ended.
We provide a sample of questions relevant for case management service delivery below and descriptive
statistics for each of these variables in Table 331.
1. How long have you been receiving services? (0 = It’s my first visit; 1 = Less than a Month; 2 = 1-
5 months; 3 = 6 months -1 Year; 4 = More than a year)
2. How often do you see your counselor? (0 = Once a Month; 1 = Once Every Two Weeks; 2 =
Once a Week; 3 = Two or more times a week)
3. Compared to your first visit, how do you feel now? Would you say you feel worse, the same, a
little better, somewhat better, or much better? (0 = Worse; 1 = Same; 2 = A Little Better; 3 =
Somewhat Better; 4 = Much Better)
4. How satisfied are you with services? (0 = Not Satisfied; 3 = Very Satisfied)
5. Have you received mental health services outside of Centro Sávila /Hopkins Center? (0 = No; 1 =
Yes)
6. Do you have health insurance? (0 = No; 1 = Yes)
Table 33. Descriptive Statistics of Client Satisfaction Surveys (October 2020)
Variable Mean Median St. Dev Min 25% 75% Max N
Length of Services 3.03 3.00 0.92 0 2 3 4 33
Counselor Frequency 1.54 2.00 0.57 0 1 2 2 31
How Do You Feel 3.75 4.00 0.57 1 4 4 4 32
Satisfaction with Services 3.00 3.00 0.00 3 3 3 3 32
Outside Mental Health 0.19 0.00 0.40 0 0 0 1 32
Health Insurance 0.09 0.00 0.30 0 0 0 1 33
From Table 33, we note that a plurality of respondents (42.4%; N = 14) indicated accessing services for
between six months to a year. Most respondents indicated meeting with their counselors once a week
(56.25%; N = 18). Respondents could also provide open-ended answers explaining the reasons why they
might not have been able to attend a scheduled appointment with a counselor. The most common
explanations offered for non-attendance of scheduled appointments included job responsibilities and family
commitments. A majority of respondents indicated that they felt much better since their first visit (81.25%;
N = 26), and all respondents (100%; N = 32) indicated that they were satisfied with the services they had
received. 19% (N = 6) of respondents reported receiving mental health services outside of Centro Sávila.
Only 9% (N = 3) of respondents indicated having health insurance.
However, it is worth noting that self-selection bias likely limits the generalizability of these findings to
Centro Sávila ’s broader client base when considered jointly with the small sample size of the survey. First,
no clients from the WEHC location were included in the survey per the survey’s referral source data.
Second, there was an overrepresentation of female respondents in the sample (90.6%; N = 29) relative to
the sex distribution of all Centro Sávila clients identified in the client-level data where only 48.6% of the
client base was female. While we did not examine other potential demographic imbalances between the
survey sample and the broader client base given time constraints associated with translating the survey and
1 We modified variable coding from the original survey such that higher values for a variable indicate higher levels of the
variable under consideration to ease aid of interpretation.
43
generating the raw data from aggregated report totals, we suspect the survey sample is likely not
representative of the broader client base in other meaningful ways which likely correlate with measured
outcomes. Because of this, it is important to consider how the profile of survey respondents systematically
differs from the broader client base and to consider how these imbalances may bias outcomes. Further,
survey results are time-bound, identifying a subset of broader opinion at a snapshot of time, and thus do not
necessarily allow us to make inferences of client satisfaction at other time points throughout program
implementation.
Staff Interviews
We conducted 10 interviews with staff at Centro Sávila. Interviews were conducted by one trained
researcher using the semi-structured interview guide available in Appendix B and took between 30 and 90
minutes to complete. We took notes during the interview, and all interviews were audio-recorded. After
each interview, we wrote up expanded notes in full. A few common themes emerged from the interviews
which we highlight in Table 33 and Table 34 below which identify various factors facilitating or impeding
the delivery of peer case management services which were mentioned by, at minimum, two staff members.
We split the tables into areas where staff perceived program success – what we term facilitating factors
(Table 34) – and areas where staff perceived areas for program improvement – what we term impeding
factors (Table 35).
CONTINUE TO NEXT PAGE

44
Table 34. Facilitating Factors
Factors
• There was general consensus among program staff on the adequacy of existing
referral sources.
• There was general consensus among program staff on program purpose and
goals (i.e., service coordination; client retention; active listening; meeting client
where they are at without judgment).
• Most staff agreed on common measures of program success (i.e., service plan
completion; discharge rates).
• Among case managers, there were high perceptions of client similarity (i.e.,
peerness) (x̅ = 5.4 on 7-point scale) and satisfaction with client relationships (x̅ =
6.2 on 7-point scale).
• Among case managers, there was a high capacity for trust-building and use of
self-disclosure with clients.
• Some staff indicated that the new intake and enrollment teams increased work
efficiency.
• For staff which had received training, most generally perceived their training to
be effective and helpful (x̅ = 6.5 on 7-point scale). There was also consensus that
there were many opportunities for training development and updating.
• In general, there were high scores on PFI index (x̅ = 3.03 on 4-point scale),
indicating high levels of staff professional fulfillment.
• In general, staff were satisfied with the frequency of meetings with other
program staff and perceived higher-level staff as being open to feedback.
• In general, staff agreed that Centro Sávila did a good job facilitating working at
home during Covid-19 (i.e., providing access to chairs, Internet, phones, and
desks).
• Some staff indicated that recent hiring changes brought about more
accountability.
CONTINUE TO NEXT PAGE
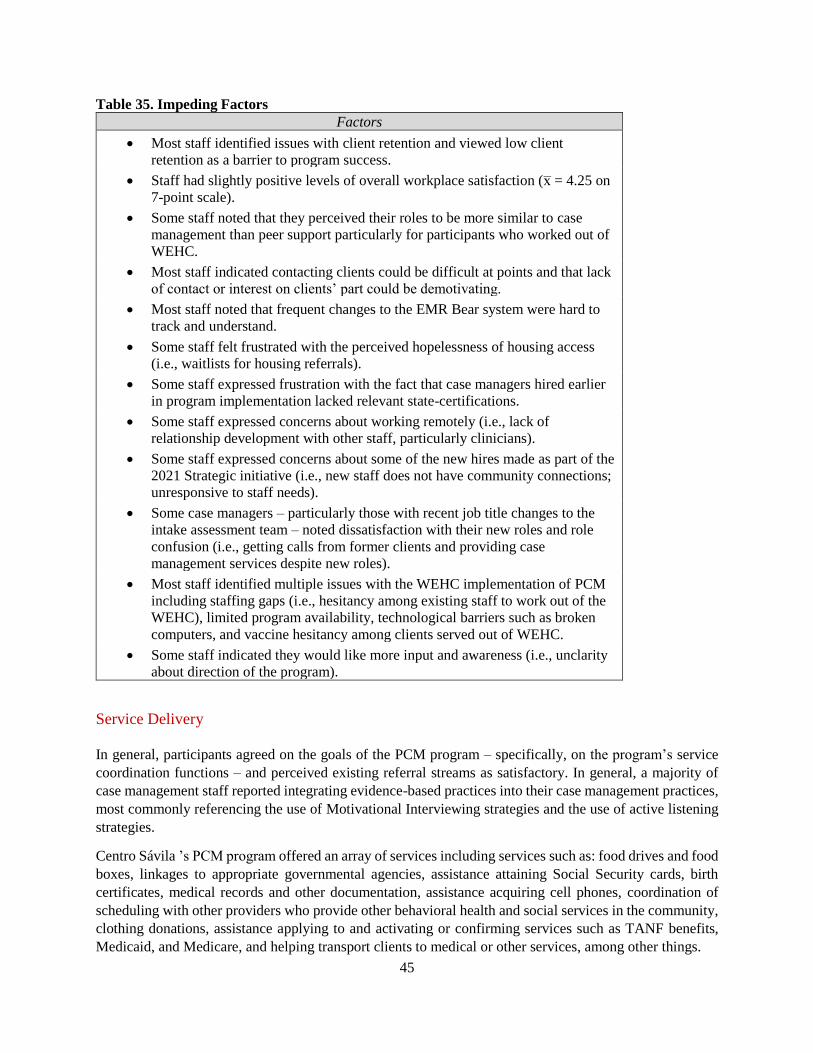
45
Table 35. Impeding Factors
Factors
• Most staff identified issues with client retention and viewed low client
retention as a barrier to program success.
• Staff had slightly positive levels of overall workplace satisfaction (x̅ = 4.25 on
7-point scale).
• Some staff noted that they perceived their roles to be more similar to case
management than peer support particularly for participants who worked out of
WEHC.
• Most staff indicated contacting clients could be difficult at points and that lack
of contact or interest on clients’ part could be demotivating.
• Most staff noted that frequent changes to the EMR Bear system were hard to
track and understand.
• Some staff felt frustrated with the perceived hopelessness of housing access
(i.e., waitlists for housing referrals).
• Some staff expressed frustration with the fact that case managers hired earlier
in program implementation lacked relevant state-certifications.
• Some staff expressed concerns about working remotely (i.e., lack of
relationship development with other staff, particularly clinicians).
• Some staff expressed concerns about some of the new hires made as part of the
2021 Strategic initiative (i.e., new staff does not have community connections;
unresponsive to staff needs).
• Some case managers – particularly those with recent job title changes to the
intake assessment team – noted dissatisfaction with their new roles and role
confusion (i.e., getting calls from former clients and providing case
management services despite new roles).
• Most staff identified multiple issues with the WEHC implementation of PCM
including staffing gaps (i.e., hesitancy among existing staff to work out of the
WEHC), limited program availability, technological barriers such as broken
computers, and vaccine hesitancy among clients served out of WEHC.
• Some staff indicated they would like more input and awareness (i.e., unclarity
about direction of the program).
Service Delivery In general, participants agreed on the goals of the PCM program – specifically, on the program’s service
coordination functions – and perceived existing referral streams as satisfactory. In general, a majority of
case management staff reported integrating evidence-based practices into their case management practices,
most commonly referencing the use of Motivational Interviewing strategies and the use of active listening
strategies.
Centro Sávila ’s PCM program offered an array of services including services such as: food drives and food
boxes, linkages to appropriate governmental agencies, assistance attaining Social Security cards, birth
certificates, medical records and other documentation, assistance acquiring cell phones, coordination of
scheduling with other providers who provide other behavioral health and social services in the community,
clothing donations, assistance applying to and activating or confirming services such as TANF benefits,
Medicaid, and Medicare, and helping transport clients to medical or other services, among other things.
46
Per our interviews, the quality and dosage of case management service delivery was site-dependent: at
Centro Sávila’s main location, service delivery was primarily case-management focused whereas at WEHC,
service delivery was more diffuse given the range of services offered to serve the unique client bases’ urgent
care needs. In part because of this, a number of participants highlighted service delivery issues at the WEHC
location. A few interview participants in particular noted difficulties engaging with the client population at
the WEHC location expressing sentiments such as:
Sometimes they [homeless case management clients] do not remember that they know you once
they’re in the shelter. Once they’re in the shelter, they’re like “Oh yes, I want a case worker” but
once you call them they’re like “No, I don’t need the services” or they don’t call you or they don’t
remember you or “I already have someone else, I don’t want you” or “Yes, I need the services
because I am working with another case manager who isn’t helping me” or “Yes, I need a
caseworker because I don’t have one.
Other participants expressed frustrations with the quality and frequency of services delivered at WEHC
given the limited hours of operation and staffing concerns. Clinic hours at WEHC were often scheduled
when most other community providers and resources were closed, reducing the ability of case managers to
make same-day referrals. For referrals which occurred the following day, participants reported issues
transporting clients and connecting clients to other agencies.
One participant noted that at the WEHC location, clients often did not have phone access and when they
were able to use the phone at WEHC, there could be a lot of background noise which made it difficult to
hear what the client was saying. Similarly, other participants identified issues with the reliability of Internet
services at the WEHC noting that it could be difficult to get responses from staff and clients to emails in
part due to connectivity issues and in part due to high levels of staff turnover. A few participants noted that
they felt demotivated by the complexity and severity of needs clients present with at WEHC. For instance,
one participant noted:
This is a perpetual situation, dealing with the homeless population, it’s never going to be solved.
There’s not enough housing. There’s a misunderstanding within the [peer case management]
community. What I mean about a misunderstanding is where the individual worker thinks that just
because a client is on a waiting list for housing that that’s going to solve their current situation,
but it’s not because the next thing is how are they going to pay for a house. It’s perpetual. It’s
never going to end, especially if they have other underlying condition like substance use or mental
health; that’s going to be perpetual whether I am working with them or not.
Covid-19 changed, at least temporarily, the primary mode of case management service delivery as staff
transitioned to a mixture of in-person case management and telehealth. While staff generally felt supported
working remotely by Centro Sávila, the nature of remote work presented barriers to service delivery and
interagency coordination, as one participant noted:
Right now, specifically in Covid, it has made behavioral health, case management, and therapy,
all of those different ways of providing services so much harder. First of all, I can’t see my clients
in person, so that makes it hard, let alone go to another agency.
As detailed in more length in the Discussion and Conclusion section of this report and as mentioned in the
Literature Review, the transition from in-person case management to primarily telephonic case management
modalities can potentially disrupt the theoretic logic of ICM models of case management which emphasize
high-intensity case management inputs and in-person interactions. Further, the transition from in-person

47
case management to other virtual modalities risks changing the pool of program participants if those without
reliable access to phones or the Internet are less likely to make use of virtual case management services.
Training and Certification Many peer case management staff indicated seeing value in training and the acquisition of state-
certifications for peer support. While most participants reported perceiving that their own training and
certifications had been helpful to them on the job and indicated that there were continual opportunities to
update their training on the job, a few participants indicated dissatisfaction with both (a) Centro Sávila’s
prior hiring of non-certified peer case managers and (b) organizational barriers to completing training
certifications (i.e., failure to receive signatures internally from relevant staff). To this end, some
participants noted that the initial contract for PCM did not mandate PCM state-level certifications for the
hiring of case managers. Rather, the expectation on the provider’s side was that non-certified staff would
receive training on the job. However, staff indicated that this training was phased in slowly. Other forms of
training that were mentioned in the interviewing process that peer case managers received included training
in harm reduction practices and MI, training in Question, Persuade, Refer (QPR) suicide prevention
techniques, internal workshops on active listening, training on ACES, training in the administration of the
C-SSR scale to screen clients for suicidality, and training in Comprehensive Community Supports Services
(CCSS). In terms of formal training certifications, 50% (N = 3) of Centro Sávila’s peer case management
staff indicated having received formal state-certifications as Certified Peer Support Workers (CPSW) or
Certified Peer Support Specialists (CPSS).
Intake and Screening Most participants described a screening and assessment process distinct from the one outlined in the process
map due to the overlap of the interview timeline with the changes to the screening and assessment process
noted in Stage 1 of Centro Sávila’s 2021 Strategic Initiative Plan which highlighted the creation of new
enrollment and intake teams. Whereas before, case managers had shared responsibility for administering
intake forms and screening participants, the new policies were designed to reduce case manager workload
burden. These updates to program organization were met with mixed reactions by staff. Some participants
indicated the creation of enrollment and intake teams helped (a) increase accountability and structure, (b)
reduce the amount of time case managers worked on non-case management activities, and (c) improve
client relations by reducing the perceived “clinicalness” of the first point of contact clients had with case
management staff. However, other participants – typically, former case managers who were re-assigned job
responsibilities to the intake team – indicated frustration with their job transition given that their role as
intake assessors was inconsistent with their previous peer case management training, that their new role
was not what they were passionate about, and/or that there was some role ambiguity associated with their
new job responsibilities. For instance, multiple staff reassigned to the intake team reported that they still
received case management calls from former clients despite their new job titles and were performing
double-work because of this. Multiple staff – including those not on the intake team – reported that they
felt the role of intake assessor should be delegated to individuals who were not previously case managers.
In terms of the process for screening and assessment, staff suggested the new screening and assessment
process would typically work in the following manner. First, a potential-client would call Centro Sávila and
set up an appointment with a staff member on the enrollments team. The enrollments team member would
then schedule an appointment with a case manager on the basis of shared lived experience, program-fit, and
case manager availability. Once the schedule was set, a member of the scheduling team would call the
potential client and email them relevant intake forms (i.e., WellRx). Once a client completed the intake
48
forms, they would electronically sign paperwork – including a release of information – by email, send back
the documentation to the scheduling team member who would then set up an appointment with a peer case
manager.
Some participants indicated it was difficult to screen clients on the phone given lack of access to a phone
among many clients. Staff indicated that if they encountered difficulties trying to screen a potential client
on the phone, they would try to schedule a meeting in-person though this was difficult given technological
access issues. All case management staff identified using common screening tools, specifically the WellRx
Questionnaire and C-SSR. Some also identified using the Universal Triage form during the screening
process. There was some inconsistency in reporting when scales were used: while most participants
indicated the WellRx Questionnaire was only administered at intake, two participants noted the SDOH was
re-administered on a quarterly basis.
Evidence-Based Practices The evidence-based practice most commonly mentioned by program staff was the use of Motivational
Interviewing. Staff emphasized the importance of taking client-centered approaches, using self-reflection
and question mimicry to foster greater senses of autonomy and choice among clients. From the interviews,
it was not as obvious how other evidence-based practices – such as Strengths Based Case management or
harm reduction – were incorporated into existing case management practice.
Service Plan Development Case managers developed treatment plans – using CCSS Functional Assessments – with their clients to
identify primary and secondary sets of goals. Most staff indicated the acquisition of Social Security cards
or other forms of identification were the primary goal mentioned by the client base and indicated this was
problematic because a large portion of homeless services and benefit applications require a state-issued
identification card, proof of residency, and proof of citizenship. Some staff provided information on the
periodic updating of these service plans, noting they were reviewed by the case manager every 90 days and
updated at that point. Others suggested the service plans were updated at the discretion of the case manager.
Client Relations Participants whose job responsibilities partially or at some point involved the provision of peer case
management services typically perceived themselves as similar to the clients that they served (x̅ = 5.67 on
7-point scale where 7 = “Very Similar”) and perceived relationships with their clients to be satisfactory (x̅
= 6.33 on 7-point scale where 7 = “Very Satisfactory”). Participants generally indicated they were either
unaware as to how peerness was assessed during the hiring process or provided vague guidelines
surrounding common lived experience. Common issues case managers identified in working with their
client population, where they existed, included high client attrition rates and establishing and maintaining
contact with clients, particularly with clients housed within the WEHC. Case managers emphasized
relatability and trust as important factors in developing a rapport with clients and mentioned concepts from
MI in discussing how they typically interacted with clients.
EMR-Bear Issues A number of participants identified challenges associated with the introduction of, and modifications to,
the EMR Bear system used to log and track participant progress. Specifically, participants identified issues
with (a) the frequency of changes to the EMR-Bear system (i.e., not logging case notes to logging case
49
notes) and (b) inadequate training on inputting information into the system. These concerns echoed some
of the concerns identified in the Mora Consulting LLC report from the fall of 2019. Other participants
emphasized the limited scope of data captured by the EMR Bear system. For instance, one participant noted:
There’s a set-up here that they haven’t quite figured out…It’s a program called EMR Bear and it’s
not user-friendly for the worker because all they are assessing is appointments. And to me, it’s
irrelevant because my clients call me in the middle of the day without an appointment and there’s
no way to document that.
Some staff also some expressed concern that the process of inputting data into EMR BEAR was time-
consuming.
Workplace Satisfaction In general, PFI scores at Centro Sávila were high (x̅ = 3.3 on 4-point scale). Additionally, staff generally
perceived moderately positive relations between peer case managers and other staff (x̅ = 4.78 on 7-point
scale). While PFI scores were high, there was some polarization in attitudes with respect to quality of
supervision and management received at Centro Sávila. For instance, some issues identified included:
concerns over new hires and doing extra work beyond the work which was scheduled. To this end, one
participant noted:
So we have case management and we put in our schedule, but then I have a lot of phone calls for
case management on a daily basis, so I do a lot of case management, even though it's not on the
schedule. So per week and then on top of that there's paperwork, and so I end up scrambling to do
the paperwork and do the case management, but I do a lot of I think a lot of his case management.
And then later and doing the back end of paperwork.
Crossroads for Women (CRFW)
Program Description
CRFW’s Peer on Peer Supportive Services (POPSS) aftercare program deploys a matrix of peer case
management, therapeutic groups, social events, and community-building activities among dual-diagnosis
clients who previously completed any CRFW housing program to promote short, intermediate, and long-
term client-level behavioral health outcomes (i.e., reduction in daily illegal substance use; increased
housing stability; reduced criminal justice system involvement). For program recruitment, CRFW relies
primarily on internal referral streams from CRFW or from their existing transitional housing programs:
Maya’s Place in Albuquerque and The Pavilions in Los Lunas. The POPPS program offers intensive case
management services, monthly check-ins with peer support specialists, monthly alumni group meetings,
vocational support services, access to therapeutic groups located at CRFW community building, and access
to the CRFW Incentives Program which included service-plan related incentives for need-based items
including bus passes, limited housing vouchers, and discounted prices on furniture, among other things,
which clients could access if they attended a certain number of case management meetings or groups. Table
36 highlights CRFW’s evidence-based practices used in the POPPS program.

50
Table 36. Evidence-Based Practices
Evidence-Based Practice Description
Intensive Case Management Intensive Case Management (ICM) is a
community‐based package of care aiming to
provide long‐term care for severely mentally ill
people who do not require immediate admission.
Intensive Case Management evolved from two
original community models of care, Assertive
Community Treatment (ACT) and Case
Management (CM), where ICM emphasizes the
importance of small caseload (fewer than 20) and
high‐intensity input.
(King 2006; Burns et al. 2007; Dietrich et al. 2017)
See also:
https://www.ncbi.nlm.nih.gov/pmc/articles/PMC6
472672/#:~:text=Intensive%20Case%20Managem
ent%20(ICM)%20is,do%20not%20require%20im
mediate%20admission.
Motivational Interviewing Motivational interviewing is a counseling method
that helps people resolve ambivalent feelings and
insecurities to find the internal motivation they
need to change their behavior. It is a practical,
empathetic, and short-term process that takes into
consideration how difficult it is to make life
changes (Rollnick and Allison 2004; Hettema,
Steeler, and Miller 2005)
See also: https://www.samhsa.gov/homelessness-
programs-resources/hpr-resources/empowering-
change
Trauma-Informed Care Patients with a history of traumatic life events who
enter the health care system are particularly
vulnerable because they can become distressed or
re-traumatized as the result of health care
experiences (Coles and Jones 2009). A large
population of patients may be suffering from the
symptoms and sequelae of trauma and could
benefit from trauma-informed care, which uses an
understanding of trauma to meet the unique health
care needs of survivors (Rosenberg 2011). Trauma-
informed care aims to meet the unique needs of
trauma survivors (Rosenberg 2011) and has been
studied and practiced in the contexts of addiction
treatment (Covington 2008; Frisman, Ford, Lin,
Mallon, and Chang 2008; Harris and Fallot 2001;
Morrissey et al., 2005) and inpatient psychiatric
care (Barton, Johnson, and Price 2009; Chandler

51
2012; Regan, 2010). See also:
https://ncsacw.samhsa.gov/userfiles/files/SAMHS
A_Trauma.pdf
CRFW’s logic model is illustrated in Figure 7 and provides insight into how POPPS clients engaged in the
program, beginning with the client referral, screening and eligibility criteria determination, intake process,
assessment and service delivery and ending with a discussion of anticipated short, intermediate and long-
term outcomes at the individual-level and social outcomes more generally. POPPS’ theory of change notes
that the provision of trauma-informed care would promote changes in self-attitudes which would, in turn,
result in positive outcomes for clients. While it is a beneficial that the provider articulated a theory-of-
change, the language used in the statement of the theory-of-change is vague and thus could prove hard to
falsify (i.e., “What does “value of self” refer to? How is that measured? What are healthy relationships, and
with whom? How are those measured?) (Forti 2012).
Figure 7. Crossroads’ Logic Model
We present CRFW’s process map, finalized with Crossroads in February 2020, in Figure 8. The process
map describes the program’s vision of program implementation and not necessarily the program process
observed in practice and thus provides a baseline against which model fidelity can be assessed. Per Figure
8, referrals for the POPPS program would come primarily from existing CRFW transitional housing
programs through Maya’s Place and Pavilions therapeutic communities. After a referral had been made to
the POPPS program, intake documentation would be completed including a needs assessment which would
be completed by potential clients. This needs assessment would be used to structure a client’s individualized
treatment plans. Within 1-7 days of completing intake documentation, clients would construct an
individualized treatment plan with a case manager. For a client to be considered engaged in the program,

52
they would need to attend either (1) at least one POPPS group meeting or (2) one case management session
within 60 days of enrollment. Clients could be discharged from the POPPS program if they returned to
either Maya’s Place or Pavilions Community Housing, if they wanted to be discharged, or if they violated
CRFW’s zero-tolerance policies. Other details on program process – for instance, participation in the
incentives program – were not mentioned in the process map but were detailed more extensively in in the
interview process.
Figure 8. Crossroads’ Process Map
We requested from the provider additional logic models and process maps in May 2021 if they happened
to be available; however, the provider indicated they had not updated their logic models or process maps
since their initial construction.
Performance Measures
Per BHI-funding requirements, CRFW reported a series of performance measures to the DBHS on a
monthly basis. As with Centro Sávila, the reporting of performance measures evolved over time. Table 37
lists and describes the performance measures reported by CRFW.
CONTINUE TO NEXT PAGE

53
Table 37. Performance Measures
Performance Measure Operationalization
Number of Client Served • Number of new clients served in case management,
therapeutic groups and community/social events
• Number of returning clients served in case
management, therapeutic groups and
community/social events
Total Service Usage • Number of clients
• Number of clients attending 6 or more services
• Number reporting improved mental health
• Number reporting decreased substance use relapse
• % of clients attending 6 or more services
Case Management • Hours of case management services provided
• Number of new clients receiving case management
• Number of returning clients receiving case
management
• Number of clients attending 3 or more case
management meetings
Service Plans • Number of clients who completed service plans
• Number of clients making progress of their service
plans
• Percentage of clients making progress on their
service plans
Re-Arrest Rates • Percentage of clients with no new arrests
Maintenance of POPPS Services • Number of clients exiting CRFW housing services
• Number of clients with 2 contacts in 3 months
• Percent maintaining
Outreach • Social media outreach
• Outreach events conducted
Client Satisfaction • Number of client satisfaction surveys (quarterly)
• Percentage of Clients Satisfied (quarterly)
Number of Collaborative
Community Partners
• Number of collaborative meetings
• Number of collaborative meeting attendees
• Number of collaborative community partners
(quarterly)
Client Demographics • Gender
• Age by category
• Race/ethnicity
• SDOH
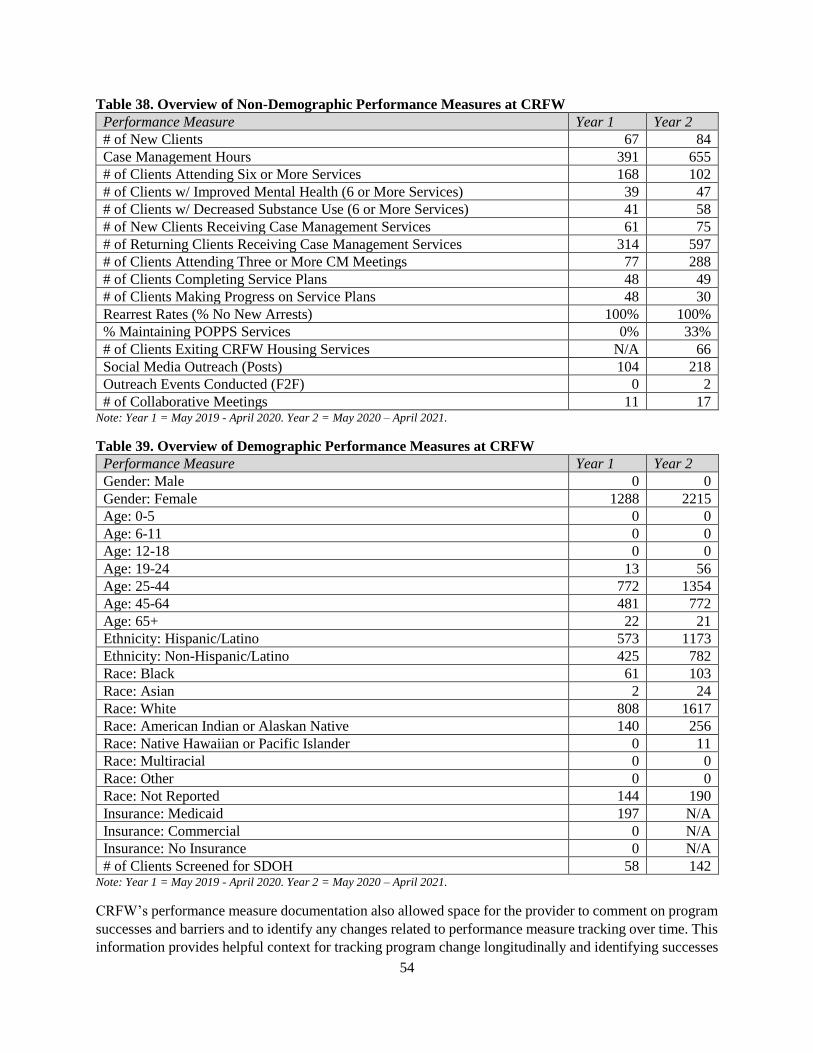
54
Table 38. Overview of Non-Demographic Performance Measures at CRFW
Performance Measure Year 1 Year 2
# of New Clients 67 84
Case Management Hours 391 655
# of Clients Attending Six or More Services 168 102
# of Clients w/ Improved Mental Health (6 or More Services) 39 47
# of Clients w/ Decreased Substance Use (6 or More Services) 41 58
# of New Clients Receiving Case Management Services 61 75
# of Returning Clients Receiving Case Management Services 314 597
# of Clients Attending Three or More CM Meetings 77 288
# of Clients Completing Service Plans 48 49
# of Clients Making Progress on Service Plans 48 30
Rearrest Rates (% No New Arrests) 100% 100%
% Maintaining POPPS Services 0% 33%
# of Clients Exiting CRFW Housing Services N/A 66
Social Media Outreach (Posts) 104 218
Outreach Events Conducted (F2F) 0 2
# of Collaborative Meetings 11 17 Note: Year 1 = May 2019 - April 2020. Year 2 = May 2020 – April 2021.
Table 39. Overview of Demographic Performance Measures at CRFW
Performance Measure Year 1 Year 2
Gender: Male 0 0
Gender: Female 1288 2215
Age: 0-5 0 0
Age: 6-11 0 0
Age: 12-18 0 0
Age: 19-24 13 56
Age: 25-44 772 1354
Age: 45-64 481 772
Age: 65+ 22 21
Ethnicity: Hispanic/Latino 573 1173
Ethnicity: Non-Hispanic/Latino 425 782
Race: Black 61 103
Race: Asian 2 24
Race: White 808 1617
Race: American Indian or Alaskan Native 140 256
Race: Native Hawaiian or Pacific Islander 0 11
Race: Multiracial 0 0
Race: Other 0 0
Race: Not Reported 144 190
Insurance: Medicaid 197 N/A
Insurance: Commercial 0 N/A
Insurance: No Insurance 0 N/A
# of Clients Screened for SDOH 58 142 Note: Year 1 = May 2019 - April 2020. Year 2 = May 2020 – April 2021.
CRFW’s performance measure documentation also allowed space for the provider to comment on program
successes and barriers and to identify any changes related to performance measure tracking over time. This
information provides helpful context for tracking program change longitudinally and identifying successes
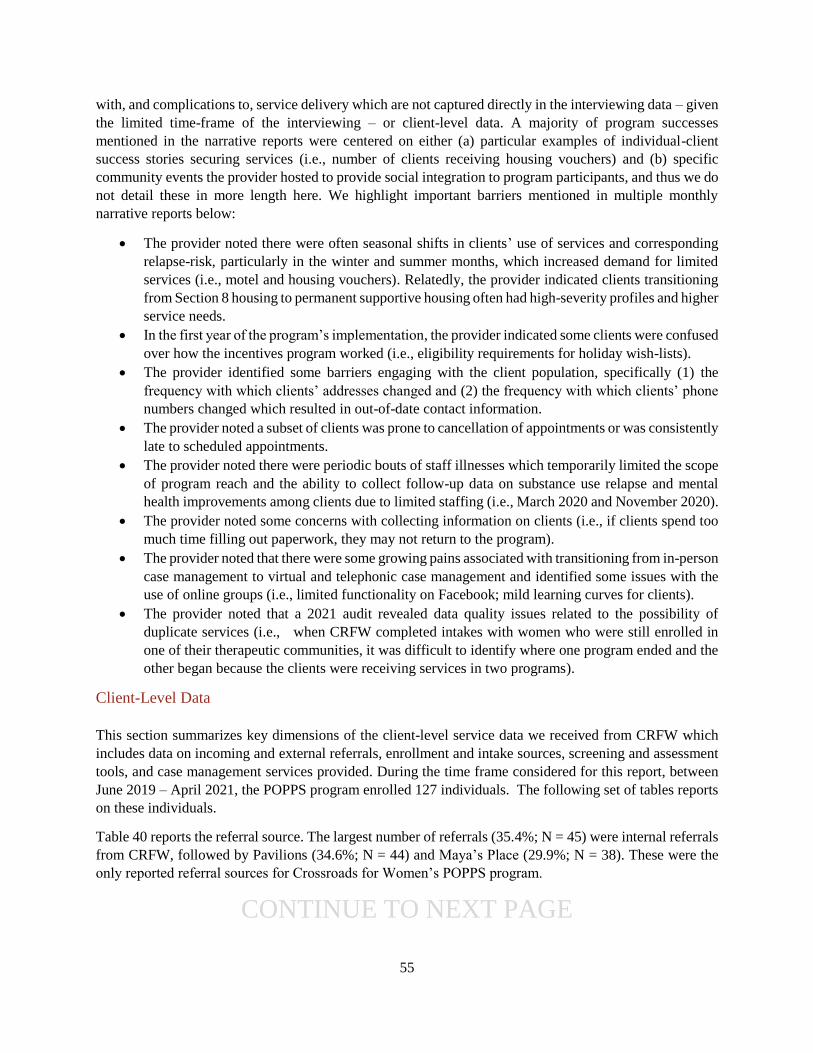
55
with, and complications to, service delivery which are not captured directly in the interviewing data – given
the limited time-frame of the interviewing – or client-level data. A majority of program successes
mentioned in the narrative reports were centered on either (a) particular examples of individual-client
success stories securing services (i.e., number of clients receiving housing vouchers) and (b) specific
community events the provider hosted to provide social integration to program participants, and thus we do
not detail these in more length here. We highlight important barriers mentioned in multiple monthly
narrative reports below:
• The provider noted there were often seasonal shifts in clients’ use of services and corresponding
relapse-risk, particularly in the winter and summer months, which increased demand for limited
services (i.e., motel and housing vouchers). Relatedly, the provider indicated clients transitioning
from Section 8 housing to permanent supportive housing often had high-severity profiles and higher
service needs.
• In the first year of the program’s implementation, the provider indicated some clients were confused
over how the incentives program worked (i.e., eligibility requirements for holiday wish-lists).
• The provider identified some barriers engaging with the client population, specifically (1) the
frequency with which clients’ addresses changed and (2) the frequency with which clients’ phone
numbers changed which resulted in out-of-date contact information.
• The provider noted a subset of clients was prone to cancellation of appointments or was consistently
late to scheduled appointments.
• The provider noted there were periodic bouts of staff illnesses which temporarily limited the scope
of program reach and the ability to collect follow-up data on substance use relapse and mental
health improvements among clients due to limited staffing (i.e., March 2020 and November 2020).
• The provider noted some concerns with collecting information on clients (i.e., if clients spend too
much time filling out paperwork, they may not return to the program).
• The provider noted that there were some growing pains associated with transitioning from in-person
case management to virtual and telephonic case management and identified some issues with the
use of online groups (i.e., limited functionality on Facebook; mild learning curves for clients).
• The provider noted that a 2021 audit revealed data quality issues related to the possibility of
duplicate services (i.e., when CRFW completed intakes with women who were still enrolled in
one of their therapeutic communities, it was difficult to identify where one program ended and the
other began because the clients were receiving services in two programs).
Client-Level Data
This section summarizes key dimensions of the client-level service data we received from CRFW which
includes data on incoming and external referrals, enrollment and intake sources, screening and assessment
tools, and case management services provided. During the time frame considered for this report, between
June 2019 – April 2021, the POPPS program enrolled 127 individuals. The following set of tables reports
on these individuals.
Table 40 reports the referral source. The largest number of referrals (35.4%; N = 45) were internal referrals
from CRFW, followed by Pavilions (34.6%; N = 44) and Maya’s Place (29.9%; N = 38). These were the
only reported referral sources for Crossroads for Women’s POPPS program.
CONTINUE TO NEXT PAGE

56
Table 40. Referral Source for CRFW
Referral Source Count Percent
Crossroads for Women 45 35.4%
Maya’s Place 38 29.9%
Pavilions 44 34.6%
Total 127 100%
Table 41 reports the race and ethnicity of enrolled individuals as extracted from the client-level data. 99
clients self-reported being White with 68 of these individuals reporting they were Hispanic/Latino. 14
clients reported they were American Indian, 5 reported being African-American, 2 Asian, and 1 reported
being Native Hawaiian or Other Pacific Islander. 3 American Indians and 1 Asian client also identified their
ethnicity as Hispanic/Latino. In total, 68 clients (56.2%) reported being Hispanic/Latino. Six clients either
refused to report or did not know their race or ethnicity.
Table 41. Race & Ethnicity
Race & Ethnicity Count Percent
American Indian or Alaska Native 14 11.6%
Asian 2 1.7%
African American 5 4.1%
Native Hawaiian or Other Pacific Islander 1 0.8%
White 29 24.0%
Hispanic/Latino 68 56.2%
Total 121 100%
Note: 6 clients missing.
100% of CRFW’s client base identified as female.
Table 42. Sex
Sex Count Percent
Female 127 100%
Male 0 0%
Total 127 100%
Table 43 reports the educational levels of respondents. The education level for 80.3% (N = 102) of CRFW’s
client base was not reported and thus there is considerable missingness in this variable. Of the clients who
reported their educational levels, a plurality (40%) attended a 2-year college. 24% of respondents indicated
they had achieved their GED or graduated high school, 16% did not complete high school, 16% attended a
vocational school, and 4% attended a four-year college.
CONTINUE TO NEXT PAGE
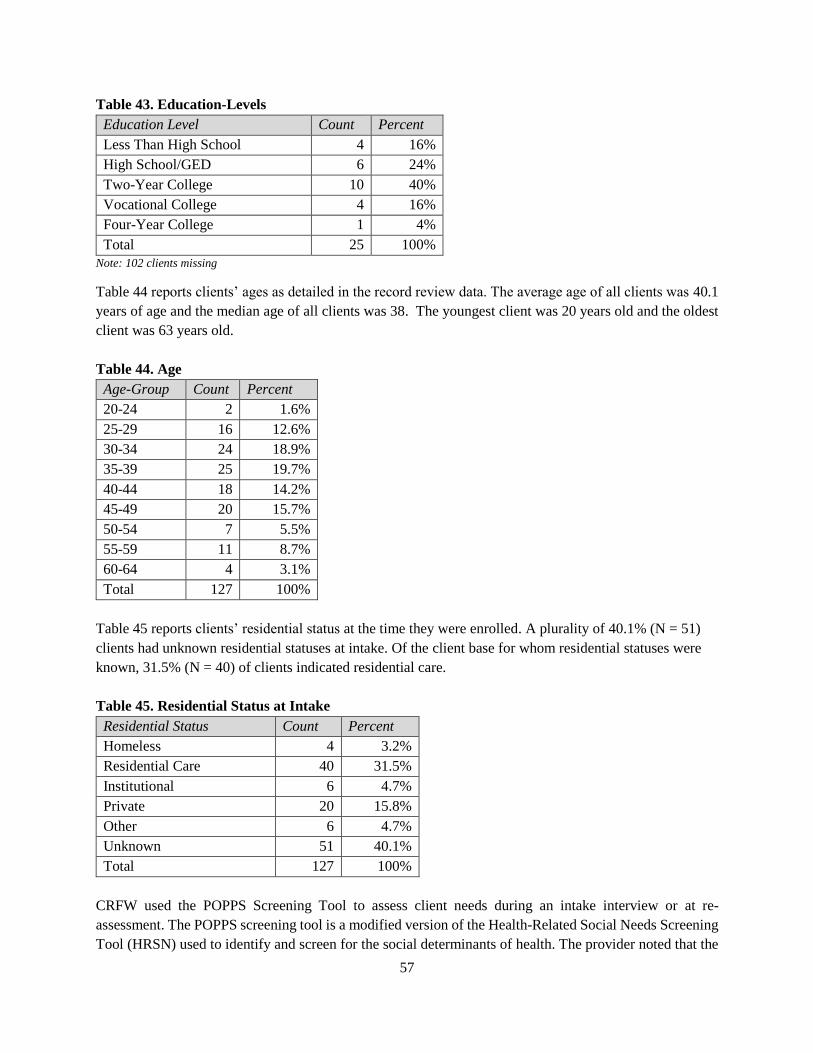
57
Table 43. Education-Levels
Education Level Count Percent
Less Than High School 4 16%
High School/GED 6 24%
Two-Year College 10 40%
Vocational College 4 16%
Four-Year College 1 4%
Total 25 100%
Note: 102 clients missing
Table 44 reports clients’ ages as detailed in the record review data. The average age of all clients was 40.1
years of age and the median age of all clients was 38. The youngest client was 20 years old and the oldest
client was 63 years old.
Table 44. Age
Age-Group Count Percent
20-24 2 1.6%
25-29 16 12.6%
30-34 24 18.9%
35-39 25 19.7%
40-44 18 14.2%
45-49 20 15.7%
50-54 7 5.5%
55-59 11 8.7%
60-64 4 3.1%
Total 127 100%
Table 45 reports clients’ residential status at the time they were enrolled. A plurality of 40.1% (N = 51)
clients had unknown residential statuses at intake. Of the client base for whom residential statuses were
known, 31.5% (N = 40) of clients indicated residential care.
Table 45. Residential Status at Intake
Residential Status Count Percent
Homeless 4 3.2%
Residential Care 40 31.5%
Institutional 6 4.7%
Private 20 15.8%
Other 6 4.7%
Unknown 51 40.1%
Total 127 100%
CRFW used the POPPS Screening Tool to assess client needs during an intake interview or at re-
assessment. The POPPS screening tool is a modified version of the Health-Related Social Needs Screening
Tool (HRSN) used to identify and screen for the social determinants of health. The provider noted that the

58
scale is intended as a tool to support staff and clients in assessing clients’ service needs during an intake
interview or re-assessment and that a secondary purpose of the scale’s administration is to increase client
re-engagement. Initial POPPS Screening Tool data was reported for 82 of the 127 (64.6%) clients who
completed the intake process. In conversations with the provider, the disparity between the number of
clients who completed the intake process and the number of clients who completed the POPPS screening
tool was noted to be a function of (1) the newness of the process of using the POPPS screening tool (i.e., it
was phased in in August 2020), (2) the need to meet the more immediate needs of clients instead of having
clients fill out paperwork, (3) difficulty contacting clients to complete the POPPS tool after initial intake,
and (4) client stability. Re-assessments of the POPPS Screening Tool were conducted at the discretion of
case managers and not at uniform reporting periods throughout client progression through the program.
However, the provider noted in their June 2020 narrative section of their performance measure reporting
that, “We have configured the Social Determinants of Health Survey for new clients and will being
administering it at intake and after a client has a long service lapse, though we are working to define what
long service lapse means in terms of concrete time frames.” 25.6% (21) of the 82 clients who completed
the initial POPPS Screening tool completed it a second time. Of the clients who completed the POPPS
screener a second time, the typical duration between completion of the first and second screeners was 165
days.
One way we could analyze this data is through the use of a one-group pretest-posttest design where we
compare client scores at intake against scores at reassessment to estimate mean changes in SDOH needs.
Pre-post designs are often used when an intervention is applied between two time points. It is worth noting
that a number of methodological issues are associated with this design choice: for instance, the lack of a
randomized control group, client maturation effects, historical effects, and statistical regression to the mean
are all issues which complicate the interpretability of findings emerging from one-group pretest-posttest
designs (Knapp 2016). Whether the observed change can be attributed to the PCM intervention or not
depends on a number of factors including whether (a) a control group exists; (b) the study is experimental,
quasi-experimental or observational; and (c) relevant covariates and cofounds have been adequately
controlled for (Pearl 2009; Mayer et al. 2016). Further, given the small sample size of clients completing a
POPPS reassessment and specific methodological challenges associated with repeated-measure designs, we
cannot statistically control for factors we anticipate would influence POPPS scores at reassessment, most
importantly, the length of time a client was enrolled in the POPPS program before reassessment. Indeed,
regressions controlling for repeated-measure of clients cannot be carried out due to these limitations. The
results of limited paired sample t-tests – not reported – indicate no statistically significant differences in
POPPS scores at intake and at reassessment across all seven subscales of the screening tool. However, we
caution against extrapolating from these null findings given the lack of relevant controls – most notably,
the duration of time between assessments – and given the violation of a number of parametric assumptions
(i.e., normality in the residuals).
We detail the criteria by which unmet client needs were classified in Table 46 below and provide descriptive
statistics – including the proportion of clients who were classified as having specific unmet needs on the
basis of the criteria articulated in CRFW’s POPPS screening tool program documentation – in Table 46.
Information on the specifics used for scoring client needs using the HRSN screening tool is available here.
However, the information provided for the HRSN screening tool documentation scoring is ambiguous or
not articulated for some SDOH subscales (i.e., for living situation needs, it is unclear whether a Yes/No

59
answer for Question 1 or any Yes answer for Question 2 is used to calculate the expressed need). Per
conversations with the provider, some items from the original HRSN screening tool (i.e., physical activity)
were redacted for the POPPS screening tool to reflect the seven domains CRFW works in and to save time.
To the extent scoring was accurately conducted, the POPPS questionnaire permits crude inferences about
the scope of challenges confronted by program clients and can help assess components of program reach
(i.e., does the program serve its intended population).
Table 46. POPPS Screening Tool Scale Description and Definition of Unmet Needs
Scale Unmet Need Criteria
Independent Living Any score above 0 may indicate an unmet need in independent living,
including housing, food security, and transportation.
Family or Social A score of 11 or more may indicate that the client is in an unsafe situation
Vocational/Educational Any score above zero may indicate that the client has unmet needs in the
Vocational/Educational domain.
Medical Any score above zero may indicate that the client has unmet medical needs
or is experiencing barriers in accessing medical services
Substance Use Any score above zero may indicate that the client has unmet needs focused
on maintaining or stabilizing their recovery or substance use disorders.
Mental Health Any score of 3 or higher may indicate that the client has unmet needs related
to mental health stabilization.
Legal Any score above zero may indicate that the client has unmet needs in the
legal domain.
Table 47. Descriptive Statistics of POPPS Screening Scale Score at Intake
Variable N Mean St. Dev. Min Pct (25%) Pct (75%) Max % with Unmet Need
Housing 82 1.78 2.01 0 0 3 7 61.0%
Family 82 5.12 2.46 3 4 5 16 6.1%
Vocational 82 0.96 0.90 0 0 2 3 63.4%
Medical 82 0.00 0.00 0 0 0 0 0%
Substance
Use
82 1.34 0.97 1 1 2 4 86.6%
Mental
Health
82 1.68 1.83 0 0 2.75 6 25.6%
Legal 82 0.00 0.00 0 0 0 0 0%
From Table 47, we note the primary unmet needs identified by clients on the POPPS screening tool,
identified in bold, were: substance use (86.6%; N = 71), vocational needs (63.4%; N = 52), and housing
needs (61%; N = 50).
Clients were asked to complete a service plan in consultation with their case manager though these service
plans evolved over time. These service plans identify key client-identified goals – not necessarily related
to a clients’ presented primary needs – and are used to assess client progress throughout the program. Table
48 reports the primary goal identified by clients in the construction of their service plans of the 64 clients

60
who completed service plans. To be clear, these are not necessarily the clients’ only goals recorded in their
service plan but are rather, the primary client goal identified at the point of intake. These goal categories
can help provide a crude sense of the most immediate needs of POPPS program participants though goals
can evolve as a client progresses through the program and clients can have multiple goals. In our record
review, CRFW also reported data on the number of clients who met their goals; however, there were some
interpretability issues (i.e., numeric coding inconsistent with the initial program schema crosswalk) paired
with missingness for some of this data given episodic data collection, and thus, we do not report these
results. From Table 48, we note that the three most common needs identified in initial service plans,
highlighted in bold, related to: (1) education (28.1%; N = 18), housing (26.6%; N = 17), and job security
(25.0%; N = 16).
Table 48: Primary Need Identified in Client Service Plans
Number of Clients Percent of Clients Identifying Goal
Housing 17 26.6%
Social Security Card 1 1.6%
Job Security 16 25.0%
ID Acquisition 1 1.6%
Education 18 28.1%
Substance Abuse Recovery 4 6.3%
Family 1 1.6%
Legal 1 1.6%
Mental Health 3 4.7%
Medical 2 3.1%
Total 64 100%
In order to assess CRFW’s dosage of case management services, it can be helpful to examine how client
enrollment in the POPPS program evolved over time. Figure 9 plots the number of clients enrolled in
CRFW’s POPPS program from July 2019 – April 2021 with a red discontinuity line indicating the onset of
the Covid-19 pandemic in March 2020 which was associated with wide-scale programmatic changes in
service delivery as social distancing guidelines were adopted. Figure 9 suggests that the onset of the Covid-
19 pandemic in March 2020 temporarily reduced client in-flows, though the effect on client in-flows was
short-lived.
CONTINUE TO NEXT PAGE

61
Figure 9. CRFW Client Enrollment Patterns from July 2019 – April 2021
In order to assess dosage, it could also be helpful to get a sense of how long clients remain enrolled in the
POPPS program. However, CRFW only formally discharged 2.4% (N = 3) clients from the program.
Because the program is aftercare-centric, most clients (97.6%; N =124) remained enrolled at the end of the
data collection period on April 21, 2021.
It is worth considering the dosage of case management services provided as this allows us to assess the
intensity of case management services provided and to estimate which client-level factors predict service
utilization rates. There are a few ways of assessing dosage within the client-level data we received from
CRFW: (1) analyzing the overall number of minutes clients spend directly interacting with case managers
– independent of type of contact; (2) analyzing the median number of minutes a client spends interacting
with the case manager per contact of those types of contacts where duration makes sense to record (i.e.,
phone calls and in-person meetings); and (3) analyzing mode of the contact (i.e., whether the contact was
face-to-face or not) which can help assess intensiveness. We present the descriptive statistics – including
mean, median, and ranges – of these three variables in Table 49. We choose to discuss the median estimates
instead of the mean given visible rightward skew in the data (i.e., one outlier client reported 1215 minutes
of case management) which biases estimates of mean minutes and contacts artificially upwards. Thus, the
median provides a more substantively meaningful interpretation of the typical client’s case management
interactions.
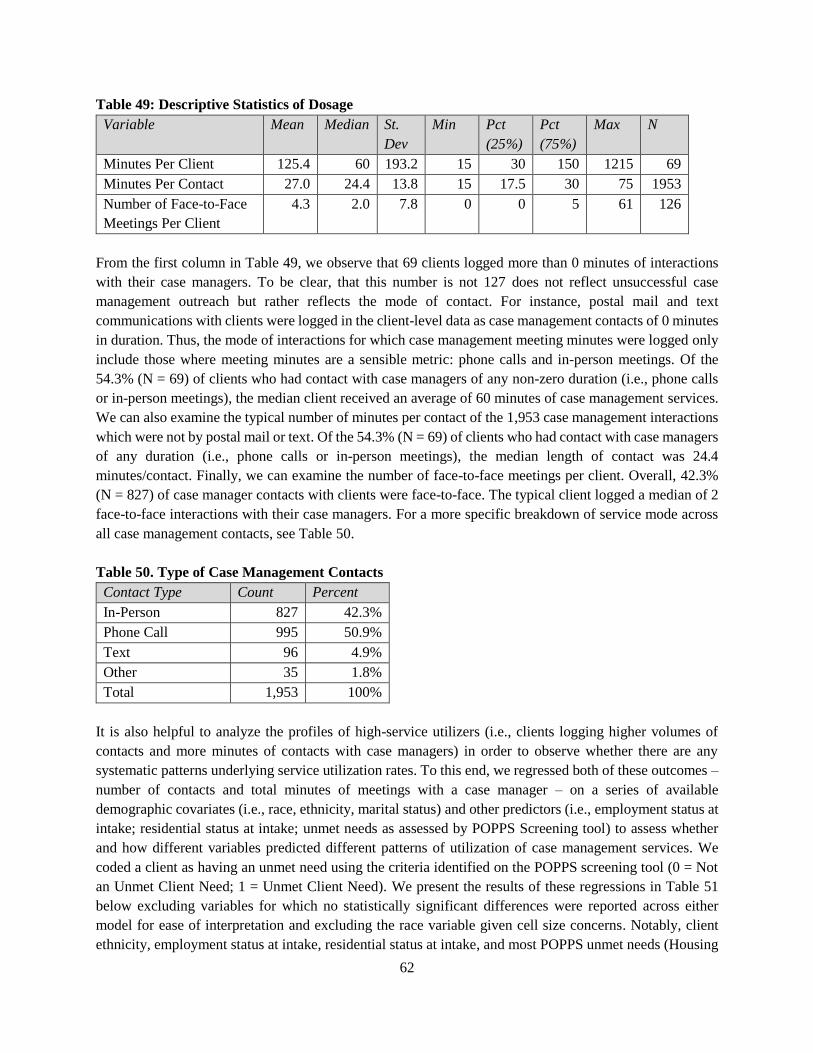
62
Table 49: Descriptive Statistics of Dosage
Variable Mean Median St.
Dev
Min Pct
(25%)
Pct
(75%)
Max N
Minutes Per Client 125.4 60 193.2 15 30 150 1215 69
Minutes Per Contact 27.0 24.4 13.8 15 17.5 30 75 1953
Number of Face-to-Face
Meetings Per Client
4.3 2.0 7.8 0 0 5 61 126
From the first column in Table 49, we observe that 69 clients logged more than 0 minutes of interactions
with their case managers. To be clear, that this number is not 127 does not reflect unsuccessful case
management outreach but rather reflects the mode of contact. For instance, postal mail and text
communications with clients were logged in the client-level data as case management contacts of 0 minutes
in duration. Thus, the mode of interactions for which case management meeting minutes were logged only
include those where meeting minutes are a sensible metric: phone calls and in-person meetings. Of the
54.3% (N = 69) of clients who had contact with case managers of any non-zero duration (i.e., phone calls
or in-person meetings), the median client received an average of 60 minutes of case management services.
We can also examine the typical number of minutes per contact of the 1,953 case management interactions
which were not by postal mail or text. Of the 54.3% (N = 69) of clients who had contact with case managers
of any duration (i.e., phone calls or in-person meetings), the median length of contact was 24.4
minutes/contact. Finally, we can examine the number of face-to-face meetings per client. Overall, 42.3%
(N = 827) of case manager contacts with clients were face-to-face. The typical client logged a median of 2
face-to-face interactions with their case managers. For a more specific breakdown of service mode across
all case management contacts, see Table 50.
Table 50. Type of Case Management Contacts
Contact Type Count Percent
In-Person 827 42.3%
Phone Call 995 50.9%
Text 96 4.9%
Other 35 1.8%
Total 1,953 100%
It is also helpful to analyze the profiles of high-service utilizers (i.e., clients logging higher volumes of
contacts and more minutes of contacts with case managers) in order to observe whether there are any
systematic patterns underlying service utilization rates. To this end, we regressed both of these outcomes –
number of contacts and total minutes of meetings with a case manager – on a series of available
demographic covariates (i.e., race, ethnicity, marital status) and other predictors (i.e., employment status at
intake; residential status at intake; unmet needs as assessed by POPPS Screening tool) to assess whether
and how different variables predicted different patterns of utilization of case management services. We
coded a client as having an unmet need using the criteria identified on the POPPS screening tool (0 = Not
an Unmet Client Need; 1 = Unmet Client Need). We present the results of these regressions in Table 51
below excluding variables for which no statistically significant differences were reported across either
model for ease of interpretation and excluding the race variable given cell size concerns. Notably, client
ethnicity, employment status at intake, residential status at intake, and most POPPS unmet needs (Housing
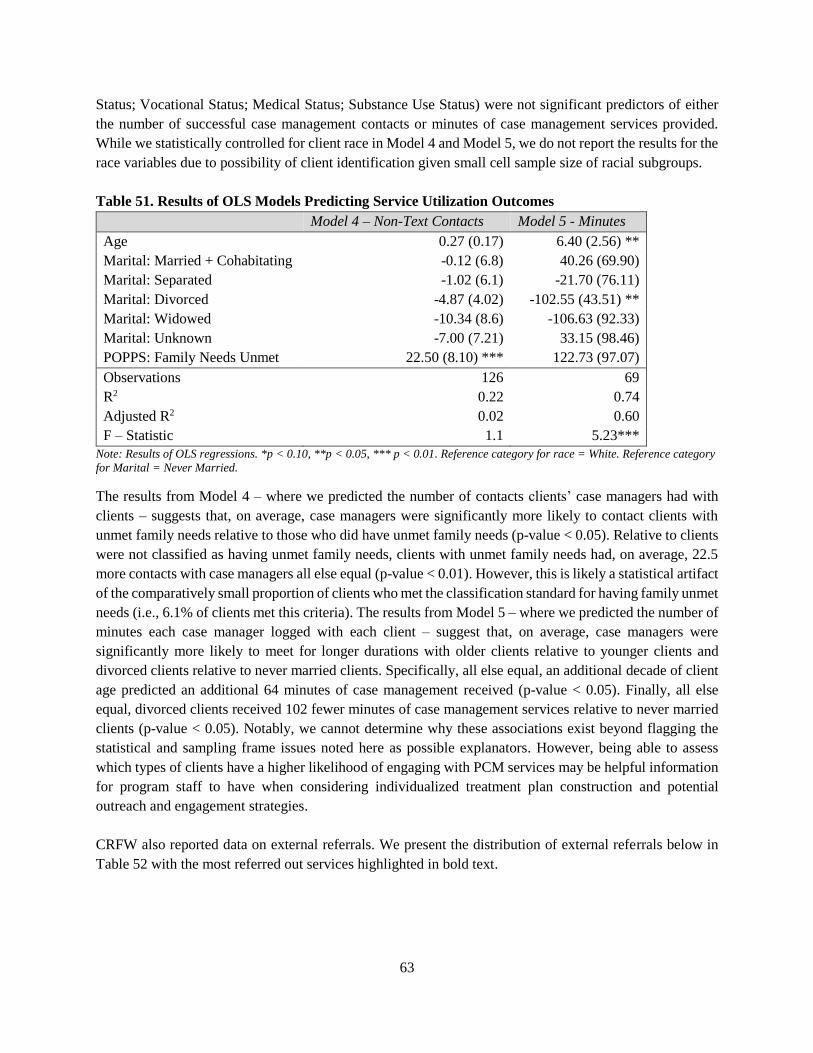
63
Status; Vocational Status; Medical Status; Substance Use Status) were not significant predictors of either
the number of successful case management contacts or minutes of case management services provided.
While we statistically controlled for client race in Model 4 and Model 5, we do not report the results for the
race variables due to possibility of client identification given small cell sample size of racial subgroups.
Table 51. Results of OLS Models Predicting Service Utilization Outcomes
Model 4 – Non-Text Contacts Model 5 - Minutes
Age 0.27 (0.17) 6.40 (2.56) **
Marital: Married + Cohabitating -0.12 (6.8) 40.26 (69.90)
Marital: Separated -1.02 (6.1) -21.70 (76.11)
Marital: Divorced -4.87 (4.02) -102.55 (43.51) **
Marital: Widowed -10.34 (8.6) -106.63 (92.33)
Marital: Unknown -7.00 (7.21) 33.15 (98.46)
POPPS: Family Needs Unmet 22.50 (8.10) *** 122.73 (97.07)
Observations 126 69
R2 0.22 0.74
Adjusted R2 0.02 0.60
F – Statistic 1.1 5.23***
Note: Results of OLS regressions. *p < 0.10, **p < 0.05, *** p < 0.01. Reference category for race = White. Reference category
for Marital = Never Married.
The results from Model 4 – where we predicted the number of contacts clients’ case managers had with
clients – suggests that, on average, case managers were significantly more likely to contact clients with
unmet family needs relative to those who did have unmet family needs (p-value < 0.05). Relative to clients
were not classified as having unmet family needs, clients with unmet family needs had, on average, 22.5
more contacts with case managers all else equal (p-value < 0.01). However, this is likely a statistical artifact
of the comparatively small proportion of clients who met the classification standard for having family unmet
needs (i.e., 6.1% of clients met this criteria). The results from Model 5 – where we predicted the number of
minutes each case manager logged with each client – suggest that, on average, case managers were
significantly more likely to meet for longer durations with older clients relative to younger clients and
divorced clients relative to never married clients. Specifically, all else equal, an additional decade of client
age predicted an additional 64 minutes of case management received (p-value < 0.05). Finally, all else
equal, divorced clients received 102 fewer minutes of case management services relative to never married
clients (p-value < 0.05). Notably, we cannot determine why these associations exist beyond flagging the
statistical and sampling frame issues noted here as possible explanators. However, being able to assess
which types of clients have a higher likelihood of engaging with PCM services may be helpful information
for program staff to have when considering individualized treatment plan construction and potential
outreach and engagement strategies.
CRFW also reported data on external referrals. We present the distribution of external referrals below in
Table 52 with the most referred out services highlighted in bold text.

64
Table 52. External Referral Services Provided
Referral
Count
Percent Number of Unique
Clients Referred
Total Minutes of
Referred Services
Substance Abuse and Recovery 8 3.6% 3 390
Housing 90 40.3% 24 3045
Vocational 105 47.1% 25 2700
Family 10 4.5% 1 255
Clinician 10 4.5% 2 225
Total 223 100% 55 6615
As noted in Table 52, a plurality of external referrals (47.1%; N = 105) were vocational in scope and
40.3% (N = 90) were housing-related referrals.
Client Satisfaction Surveys We received data from CRFW for two client satisfaction survey waves: one conducted using the survey
platform SurveyMonkey in October 2019 (N = 52) and one conducted using the SurveyMonkey platform
in January 2021 (N = 51). CRFW distributed their client satisfaction surveys through their Facebook group
and by text. It is unclear what the precise response rates were for both surveys given a lack of information
on the standard denominator used to compute response rates for surveys (i.e., the total number of clients
who received survey invitations). However, the .csv files we received for both survey batches included
information on the percentage of surveys completed of the total number of surveys viewed. Using this
metric – which likely understates survey participation given that the number of survey views is greater than
the total number of POPPS program participants enrolled during the survey wave dates – the completion
rate for the October 2019 wave was 19.9% (N = 261) and 32.3% (N = 161) for the January 2021 wave. The
October 2019 survey asked clients the following set of questions2:
1. How long have you been a client of the POPSS (aftercare) program? (0 = Less than 6 months; 1 =
6 months to a Year; 2 = 1-2 years; 3 = More than 2 years)
2. Which of the following types of engagement have you had with the POPPS program? Please
select all that apply. (0 = Case Management; 1 = Peer Support; 2 = Facebook Groups; 3 = Zoom
Groups; 4= Other)
3. Overall, how satisfied are you with POPPS services? (0 = Not Satisfied; 1 = Satisfied; 2 =
Somewhat Satisfied; 3= Very Satisfied; 4 = Extremely Satisfied)
4. Are the POPPS services meeting your needs? (0 = No; 1 = Yes)
5. After engaging with POPPS services, did you feel more stable in your mental health) (0 = No; 1 =
Somewhat; 3 = Yes)
6. After engaging with POPPS services, did you feel more stable in your substance use recovery? (0
= No; 1 = Somewhat; 2 = Yes)
7. How likely are you to continue to access POPPS services? (1 = Absolutely Not Likely; 1 = Not
So Likely; 2 = Somewhat Likely; 3 = Very Likely; 4 = Extremely Likely)
We present the descriptive statistics of the October 2019 wave in Table 54.
2 We modified variable coding from the original survey such that higher values for a variable indicate higher levels of the variable
under consideration (i.e., 0 = no Facebook services used; 1 = Facebook services used or 0 = Not Satisfied; 4 = Extremely Satisfied)
to ease aid of interpretation.

65
Table 53. Descriptive Statistics for October 2019 Survey Wave
Variable Mean Median St. Dev Min Pct
(25%)
Pct
(75%)
Max N
Access Length 1.87 2.0 1.14 0 1.0 3.0 3 52
Services: CM 0.90 1 0.30 0 1 1 1 52
Services: PS 0.39 0 0.49 0 0 1 1 52
Services:
0.65 1 0.48 0 0 1 1 52
Services: Zoom 0.40 0 0.50 0 0 1 1 52
Satisfaction 3.62 4 0.77 0 3 4 4 52
Needs Met 0.98 1 0.13 0 1 1 1 52
Mental Health
Stability
0.90 1 0.30 0 1 1 1 52
Substance Use
Recovery
Stability
0.98 1 0.14 0 1 1 1 51
Continuing 1.75 2 0.48 0 2 2 2 52
From Table 53, we note that a majority 82.7% (N = 43) of respondents indicated accessing services for over
six months. On average, of the listed services, majorities of respondents used case management services
(90%; N = 47) and Facebook groups (65%; N = 34). Large majorities of respondents reported mental health
stability (90%; N = 47) and substance use recovery (98%; N = 50) and indicated that they felt their needs
were met (98.1%; N = 51). Most respondents (98%; N = 51) indicated they felt they would continue making
use of POPPS services in the future. Respondents also had the option of providing open-ended feedback
specifically about both (1) types of POPPS resources they perceived to be the most valuable and (2) any
additional comments they had for program staff which we produce in Table 54 below. In terms of POPPS
resources, most respondents indicated that food boxes, gas cards, and bus passes were particularly helpful
to them.
Table 54. Most Commonly Identified Incentives in October 2019 Survey
Mentioned Percent
Bus Passes 8 15.4%
Food Boxes 28 53.8%
Motel Vouchers 5 9.6%
Gas Cards 7 13.5%
Phone Cards 5 9.6%
In terms of additional comments respondents offered, overall sentiment about the program was highly
positive reflecting sentiments such as this:
Just knowing that you guys are always there no matter what I'm very grateful for the staff that we
have. You're all doing an awesome job and I love Crossroads they saved my life.
The January 2021 survey had a sample size of 51 clients with a completion rate of 19.9% (N = 261). The
January 2021 survey asked clients the following questions:
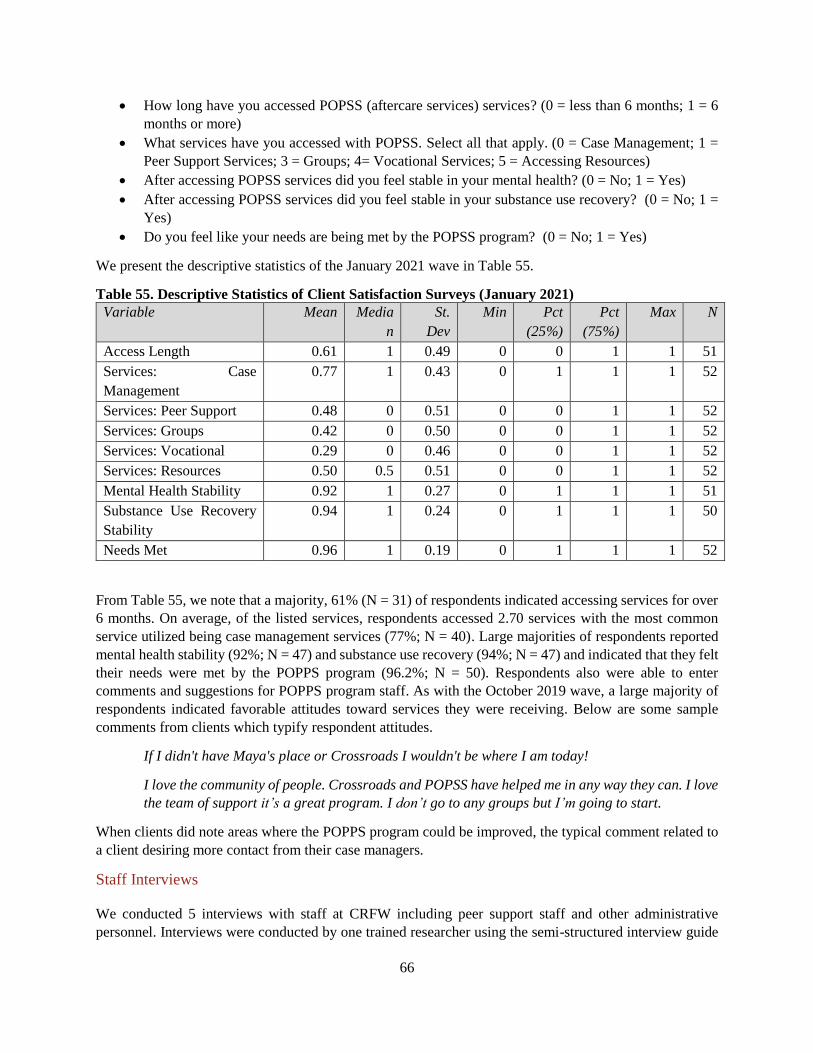
66
• How long have you accessed POPSS (aftercare services) services? (0 = less than 6 months; 1 = 6
months or more)
• What services have you accessed with POPSS. Select all that apply. (0 = Case Management; 1 =
Peer Support Services; 3 = Groups; 4= Vocational Services; 5 = Accessing Resources)
• After accessing POPSS services did you feel stable in your mental health? (0 = No; 1 = Yes)
• After accessing POPSS services did you feel stable in your substance use recovery? (0 = No; 1 =
Yes)
• Do you feel like your needs are being met by the POPSS program? (0 = No; 1 = Yes)
We present the descriptive statistics of the January 2021 wave in Table 55.
Table 55. Descriptive Statistics of Client Satisfaction Surveys (January 2021)
Variable Mean Media
n
St.
Dev
Min Pct
(25%)
Pct
(75%)
Max N
Access Length 0.61 1 0.49 0 0 1 1 51
Services: Case
Management
0.77 1 0.43 0 1 1 1 52
Services: Peer Support 0.48 0 0.51 0 0 1 1 52
Services: Groups 0.42 0 0.50 0 0 1 1 52
Services: Vocational 0.29 0 0.46 0 0 1 1 52
Services: Resources 0.50 0.5 0.51 0 0 1 1 52
Mental Health Stability 0.92 1 0.27 0 1 1 1 51
Substance Use Recovery
Stability
0.94 1 0.24 0 1 1 1 50
Needs Met 0.96 1 0.19 0 1 1 1 52
From Table 55, we note that a majority, 61% (N = 31) of respondents indicated accessing services for over
6 months. On average, of the listed services, respondents accessed 2.70 services with the most common
service utilized being case management services (77%; N = 40). Large majorities of respondents reported
mental health stability (92%; N = 47) and substance use recovery (94%; N = 47) and indicated that they felt
their needs were met by the POPPS program (96.2%; N = 50). Respondents also were able to enter
comments and suggestions for POPPS program staff. As with the October 2019 wave, a large majority of
respondents indicated favorable attitudes toward services they were receiving. Below are some sample
comments from clients which typify respondent attitudes.
If I didn't have Maya's place or Crossroads I wouldn't be where I am today!
I love the community of people. Crossroads and POPSS have helped me in any way they can. I love
the team of support it’s a great program. I don’t go to any groups but I’m going to start.
When clients did note areas where the POPPS program could be improved, the typical comment related to
a client desiring more contact from their case managers.
Staff Interviews
We conducted 5 interviews with staff at CRFW including peer support staff and other administrative
personnel. Interviews were conducted by one trained researcher using the semi-structured interview guide

67
available in Appendix B and took between 20 and 90 minutes to complete. We took notes during each
interview, and all interviews were audio-recorded. After each interview, we wrote up expanded notes in
full. A few common themes emerged from the interviews which we highlight in Table 56 and Table 57
below which identify various factors which facilitated or impeded the delivery of peer case management
services which were mentioned by, at minimum, two staff members. We split the tables into areas where
staff perceived program success – what we term facilitating factors (Table 56) – and areas where staff
perceived areas for program improvement – what we term impeding factors (Table 57).
Table 56. Facilitating Factors
Factors
• All staff indicated the work environment was supportive and non-hierarchical
(i.e., open door policy; nonjudgmental staff; high levels of flexibility; high levels
of collaboration across staff).
• Staff had positive levels of overall workplace satisfaction (x̅ = 6.6 on 7-point
scale).
• Most staff agreed on definitions of program success (i.e., percentage of women
in recovery; engagement in groups).
• In general, most staff believed the POPPS program was successful in achieving
its goals.
• Among staff with case management responsibilities, there were high perceptions
of client similarity (i.e., peerness; x̅ = 6.67 on 7-point scale) and satisfaction with
client relationships (x̅ = 6.0 on 7-point scale).
• In general, staff had high perceptions of training and certification usefulness (x̅ =
6.25 on 7-point scale). Most staff indicated there were many opportunities for
training and professional development (i.e., maintenance of CPSW certification
through CEUs).
• In general, PFI scores for CRFW were high (x̅ = 2.83 on 4-point scale)
indicating high levels of professional fulfillment.
CONTINUE TO NEXT PAGE

68
Table 57. Impeding Factors
Factors
• Some staff expressed concerns about staffing and caseloads (i.e., small number of
staff for an expanding client base; new program growing pains).
• Some staff noted the program did not make much use of intensive case
management because of the sporadic nature of client-contact. This led to a belief
the program was more similar to a peer drop-in center since clients accessed
services on an as-needed basis and given limited staffing capacity (i.e., not much
of opportunity to update client service plans because of infrequent contact with
clients).
• Some staff indicated there were difficulties working with the client population
(i.e., clients have difficulty achieving independence; housing is limited and the
criminal histories of clients restricts ability to access housing services; some
clients violate boundaries; challenges associated with ID acquisition).
• Some staff indicated it could be difficult for clients to sustain gains made in
program (i.e., housing) due to Covid-19.
• Some staff indicated there were supply-demand imbalances for clients using the
incentive program (i.e., more clients needed incentives than could be provided).
Service Delivery In general, most participants agreed on the primary goals of the POPPS program and perceived existing
referral streams from CRFW and the two therapeutic communities to be satisfactory. In terms of the dosage
of case management services provided to clients, most participants who provided case management services
noted that the number of interactions they had with clients was a function of the severity of needs clients
had with some types of needs (i.e., food needs) necessitating only one appointment with case management
staff and clients with more intensive needs (i.e., housing) necessitating more frequent interactions. Prior to
Covid-19, case management services occurred more regularly in the form of in-person interactions with
clients. A number of community events – including nights at Cliff’s Amusement Park and Painting with a
Twist – were used to foster a sense of community among the client base and to integrate POPPS clients
with other CRFW clients. After Covid-19, participants noted they would still provide case management
services to clients in the form of home visits on an as-needed basis (i.e., dropping off food boxes, diapers,
and/or cleaning supplies at client homes), though most case management became telephonic, and other
services such as therapeutic groups became increasingly virtual in delivery. However, CRFW resumed
limited in-person groups in August 2020 limiting group totals to 10 person and gradually started folding in
in-person and office-based groups before reverting back to virtual services in October 2020 in response to
heightened Covid-rates. Many participants identified the private Facebook CRFW Butterflies group for
CRFW program alumni as an active source of client engagement with the number of group members
reportedly doubling since the onset of Covid-19 in March 2020. Relatedly, program outreach was
predominantly conducted via group text messaging, Facebook posts, and Facebook Messenger. The use of
Facebook Live on Fridays was designed to provide weekend support to program alumni with messaging
focusing on topics such as relapse prevention, healthy local activities for women, upcoming events, and
crisis support reminders.
CRFW had an incentive program which allowed clients to receive signatures for attending case
management sessions, engaging actively with CRFW’s groups, and attending socialization events. Clients
could exchange these signatures for incentives such as: $20 Walmart gift cards, $20 Smiths gift cards, $20
Dollar Tree gift cards, and holiday wish lists. Participants noted that they received client feedback at

69
monthly client-advisory board meetings and through the use of quarterly client satisfaction surveys and that
they used the information received in both contexts to inform the types of incentives they offered to clients
for program participation. Participants reported that the program spent $4,954 on motivational incentives
including bus passes and gift cards and an additional $11,245.69 on client costs such as PNM bills for
clients, the Night of Excellence event expenses, and hygiene. Participants noted broad client participation
in the incentives program and generally perceived the incentives program as effective for increasing client
participation.
However, Covid-19 influenced the nature and scope of CRFW’s incentives program due to reported
increases in the demand for incentives. This increase in demand was reported to be related to both increases
in program enrollment and more pronounced economic needs by clients. Because of this, CRFW placed
limitations on the number of incentives a client could receive on a monthly basis (i.e., clients were limited
to 1 Walmart Card; 2 Smiths Card; 1 Dollar Tree card per month). Participants noted that there were some
difficulties tracking signatures for the incentives program during this time which were typically logged in
the AWARDs database. One issue identified with the incentives program in the few months after March
2020 was that clients would log in to Facebook Live groups for relatively short durations (< 5 minutes) and
receive signature credits despite not participating in earnest. However, participants noted that this behavior
was reduced once the program director met with clients to discuss the issue.
Relatedly, multiple staff indicated that Covid-19 depressed opportunities for clients to access housing and
job opportunities for clients making it difficult for clients to sustain housing and job gains made in the
program. To this end, some participants noted that CRFW was able to secure rental assistance funding in
the summer of 2020 to help support clients with housing needs.
However, there were also some operational issues Covid-19 engendered as well. Specifically, CRFW had
to reduce the number of beds available in both therapeutic communities to comply with social distancing
guidelines. Additionally, one of the community houses at The Pavilions had to close for two months due to
water damage. The nature of remote work presented barriers to service delivery and interagency
coordination, as one participant noted:
I do think we have seen an increase in connections, especially because of Covid, because it has
been not so, not disorganized, but so discombobulated in terms of what resources they [the client
base] can access at any one time because of Covid whether MVD or Social Security or things like
that so we’ve actually seen a dramatic increase over the last year, and we’ve identified new
resources to provide so we’ve seen a lot more connection because of our ability to access resources
like motel vouchers.
Covid-19 also impacted staffing at CRFW. In November 2020, a number of staff at CRFW were diagnosed
with Covid-19. CRFW was able to rotate healthy staff in to cover for some of the CRFW staff during this
time period.
Reasons for discharge were expanded upon in the interview process. Specifically, a client could be
discharged for physical assault or threats of violence, the possession of illegal substances on CRFW
grounds, stealing from CRFW, repeatedly missing groups and/or not meeting with case managers, or being
kicked out of housing. However, there was some unclarity surrounding when a client re-entered the program
after extended inactivity.

70
Training and Certification All peer case management staff indicated seeing value in training (x̅ = 6.25 on 7-point scale) and the
acquisition of state-certifications for peer support. All staff reported having received training in MI and
strengths-based case management. However, some case management staff reported not always
incorporating MI techniques into the delivery of their case management services. Other forms of training
mentioned in the interviewing process that staff received included training in harm reduction practices. In
terms of formal training certifications, 100% (N = 3) of CRFW’s peer case management or peer support
staff indicated having received formal state-certifications as Certified Peer Support Workers (CPSW) or
Certified Peer Support Specialists (CPSS).
Intake and Screening Most participants described a common process for screening and assessment at CRFW. Participants
suggested that the screening and assessment process would typically work in the following manner. First,
a potential-client would be initially referred to CRFW through contacts – typically either transition officers
or parole officers – at the New Mexico Department of Corrections. Once potential clients graduated from
the therapeutic communities (i.e., Maya’s Place or Pavilions), they would be informed of the POPPS
program through weekly CRFW case manager outreach at the communities. Individuals who had completed
CRFW program internally were emailed upon graduation to inform them of the existence of the POPPS
program and available resources. Clinical assessments were performed prior to a client entering the POPPS
program by trained clinicians affiliated with the therapeutic communities or by the licensed substance abuse
specialist on staff. Participants indicated that clinical assessments would be re-administered on an as-needed
basis throughout program participation.
Once an individual was referred to the POPPS program, their information (i.e., demographics) would be
inputted into the AWARDs system database. Clients would complete an intake form with case managers
within 90 days of referral. The intake process usually involved completion of the POPPS Questionnaire to
assess client SDOH needs as well as the construction of individual treatment plans where clients would
identify a number of goals they wanted to work on. However, participants noted not always administering
the POPPS questionnaire at the point of intake. Typically, at the point of intake, case managers provided
clients with information on how to access online groups (i.e., the private Facebook Butterflies community
page) and information describing the incentives program at CRFW. Clients would also complete a
telehealth consent form given high frequency of virtual meetings in the post-Covid era. Participants
indicated re-administering the POPPS questionnaire and updating treatment plans at different time points
as a client progressed through the program. For instance, some staff indicated re-administering the POPPS
questionnaire every 90 days if they had not heard from a client whereas other staff indicated re-
administering the POPPS questionnaire every 30 days after meeting with a client in-person. Participants
indicated updating the service plans every 90 days as well if they were able to establish contact with clients.
Evidence-Based Practices In general, a majority of case management staff reported integrating evidence-based practices into their
case management practices, most commonly referencing the use of Motivational Interviewing practices and
strengths-based case management. Participants also mentioned using harm reduction practices, noting that
they would connect clients with needle-exchanges if needed. However, some staff indicated that they did
not always use MI in every session and some staff indicated using a blend of evidence-based practices and
non-evidence-based practices. To this end, one participant noted:

71
CRFW in general is based on the teachings of Stephanie Covington, and those are evidence-based
practices. We use those and also Stephanie Covington’s curriculums for our groups because they
were created for women…and that forms the foundation of what happens in each of our programs
whether POPPS or any of our other programs, so evidence-based practices are important. But I
will say that we do incorporate things that the women want to see that people wouldn’t say are
necessarily evidence-based but our women want to see this so we are like “Ok” because we are a
holistic program so we want to ensure we provide a wide variety of tools so we want to balance
our evidence-based practices with what our women want to see.
Additionally, a few participants indicated they did not perceive the services offered through the POPPS
program as constituting intensive case management. To this point, one participant noted:
The POPPS program is probably our least intensive case management and that’s because it is
voluntary and often it is focused on crisis intervention which we do use. And so we use crisis
intervention techniques in that [the POPPS] program more so in other programs and more harm
reduction in the POPPS program and more MI in that program than any other program.
Service Plan Development Participants noted that treatment plans were completed during intake. Staff would use strengths-based case
management to discuss client strengths and immediate needs. They would then discuss which goals a client
had. However, there were some challenges associated with tracking treatment plan progress over time
identified by multiple staff related to client drop-off. For instance, one participant noted:
And the issue though with the treatment plans with this program is because we are sort of like a
drop-in center, and women are coming to access things on an as-needed basis, there hasn’t been a
lot of opportunity to update treatment plans because I might hear from one person but I might not
hear again from them for 30 or 60 days so that’s been kind of hard.
Client Relations Participants whose job responsibilities partially or at some point involved the provision of peer case
management services typically perceived themselves as similar to the clients that they served (X = 6.67 on
7-point scale where 7 = “Very Similar”) and perceived relationships with their clients to be satisfactory (X
= 6.00 on 7-point scale where 7 = “Very Satisfactory”). Common issues case managers identified in
working with their client population, where they existed, included establishing and maintaining contact
with clients (i.e., client contact information could become out-of-date), difficulties engaging with some
clients who had mental health issues, and difficulties with clients’ level of independence. Some participants
also noted that requests for mental health referrals, housing referrals, and substance abuse treatment
increased due to the Covid-19 pandemic. Another issue identified was that it could be difficult to secure
housing for clients who had criminal backgrounds as well as with securing various forms of identification.
Case managers emphasized transparency and utilizing client-centric approaches as important factors in
developing a rapport with clients.
Database Participants indicated that they tracked the delivery of case management services and other client
information through the AWARDs database. Participants did not indicate they had difficulties inputting
information into the system and generally perceived the EMR software and tracking as being up to date.

72
Workplace Satisfaction In general, PFI scores at CRFW were high (x̅ = 2.83 on 4-point scale). Additionally, participants generally
perceived positive relations between peer case managers and other staff (x̅ = 6.6 on 7-point scale).
Participants generally indicated feeling supported by both clinical staff and higher-level management and
felt satisfied with the quality of supervision and leadership they received at work (x̅ = 6.6 on 7-point scale).
Discussion and Conclusion
In what follows, we review the limitations to the present report, provide evidence-based recommendations
to address data-quality concerns and some of the concerns providers identified in the interviewing process,
and summarize key study findings.
Limitations
As with any study, the present process evaluation has several limitations which limit the ability to
extrapolate from the data. We address the limitations of each data type in brief here and provide some
recommendations on how to remedy some of these limitations in the subsequent Recommendations
subsection.
Performance Measure Data
The ability to draw meaningful conclusions on the basis of performance measure data is limited given issues
associated with (a) ambiguity in performance measure meaning (i.e., uncertainty surrounding how measures
are computed, such as total client counts, or the data sources of some measures), (b) performance measure
aggregation (i.e., composite measures which combine individual measures in ways which are unclear), (c)
performance measures’ unknown psychometric properties (i.e., reliability; sensitivity), (d) inaccurate Excel
formulas (i.e., total and continuing client counts overstate program enrollment; percent of clients remaining
enrolled in services did not use the more appropriate weighted average measure which adjusts averages for
sample size), (e) demographic measures being reported at the provider-level and not the program-level, and
(f) the omission of performance measure variables identified in the original provider contracts (i.e., number
of staff trainings). More generally, given the evolution of performance measures over time and changes in
the Excel templates for performance measure reporting over time, it is difficult to assess meaningful
longitudinal change in a plurality of performance measures.
Client-Level Data
We were able to gather client-level data from both providers within approximately two months of our initial
data pull request and, in general, were satisfied with the scope of data included, the formatting of the data,
and the degree of provider cooperation, though some of the data predictably required cleaning,
transformation, and recoding on our end. After the initial data extractions, we followed up with both
providers more than once to receive clarification about (a) inconsistencies we noticed in the data if we
detected them or (b) ambiguity in the values of response categories for some of the variables we requested
data on.

73
However, there are some limitations to the client-level data which we note. First, across providers, both
baseline and follow-up data collection for clients – specifically, relevant screening and assessment tools
(i.e., SDOH and C-SSR) was sporadic [i.e., only 31.1% (N = 188) of 604 clients completed 1 or more
SDOH assessments across both providers and less than 1% (N = 14) of 604 clients completed C-SSR
screening] which poses challenges for analyzing the data and making comparisons, especially over time, as
very few clients were given re-assessments and even then, re-assessments were not administered at
consistent time intervals. This limits the statistical power to detect meaningful program effects and the
inconsistent re-administration of such tools may result in a survivorship and selection biases favoring
longer-term clients who are doing better in the program versus clients who disengage and withdraw from
active program participation. Secondly, some of the data we received contained inaccuracies (i.e., columns
with information on the number of goals a client achieved included values inconsistent with our data schema
crosswalk). Third, while both providers incidentally reported data above and beyond what we requested in
the crosswalk schema and which ended up being helpful for our analyses, we wish we had included some
additional variables in our initial data request for both providers (i.e., mode of case management meetings;
number of overall contacts and number of successful contacts; external referral minutes and contacts).
Finally, while Centro Sávila did report some data on clients served at the WEHC location, we did not
receive any screening, assessment, or case management service data for this portion of the client base. These
gaps in the data – which constitute roughly a quarter of all Centro Sávila clients – paired with the non-
inclusion of WEHC clients in client satisfaction surveys – is sizable. While we recognize that case managers
face pressures to be responsive to the immediate and unique needs of the client base served at the WEHC
and that immediate triaging needs often override data-collection protocols and while we recognize that there
is a lack of institutional capacity and support at the WEHC which complicates data collection, the
sparseness of specific data on this population makes it difficult to draw any definitive conclusions about
what case management does or does not look like at WEHC and which services are or are not helpful for
this client base.
Client-Satisfaction Survey Data
Per their contracts, both providers noted they would conduct quarterly client satisfaction surveys. We
received, in total, three quarterly satisfaction surveys for both providers. Thus, the client satisfaction survey
data we examined did not represent all waves of each programs’ client satisfaction surveys. Another
complication is that it is unclear how to calculate survey response rates given a lack of information on the
appropriate denominators (i.e., the survey files did not contain information on the total number of surveys
sent out in each wave). Third, there are open questions about the degree of sample representativeness given
the small sample sizes for all three surveys and given both the skew in the demographic profiles of survey
participants and the sites considered for sampling. For instance, in Centro Sávila’s survey data, despite
48.6% of the overall PCM client base being women, 90.0% of survey respondents were women. Further,
Centro Sávila ’s client satisfaction data excluded clients at the WEHC location. Who agrees to voluntarily
self-select to participate in surveys may represent the tails of the distribution of opinion given stronger
incentives to reply to surveys when one feels strongly about the survey’s subject matter (i.e., highly
negatively or highly positively) and can also be influenced by other client-side characteristics which
correlate with outcome measures of interest (i.e., opportunity costs associated with completing a survey).
CRFW did not collect data on client demographic characteristics in their client satisfaction surveys. Thus,

74
it is possible that the results of client satisfaction results may not generalize to the broader client base if the
reasons for why clients choose not to participate or the demographic imbalances – where they exist –
between survey takers and non-survey takers correlate with measured outcomes and should be interpreted
with due caution. Finally, there were some question-wording and response option practices which could be
improved given best practices from survey methodology research. For instance, some questions included
in the client satisfaction surveys had narrower response ranges than is typically recommended in the survey
methodology literature. Typically, questions which have five-to-seven response options are more desirable
than questions with three or four response options or binary options (i.e., Yes/No) as they permit the
researcher a greater ability to detect statistically meaningful differences and more nuanced gradations of
opinion. To this point, Preston and Colman (2000) note:
On several indices of reliability, validity, and discriminating power, the two-point, three-point, and
four-point scales performed relatively poorly, and indices were significantly higher for scales with
more response categories, up to about 7. Internal consistency did not differ significantly between
scales, but test–retest reliability tended to decrease for scales with more than 10 response
categories. Respondent preferences were highest for the 10-point scale, closely followed by the
seven-point and nine-point scales. Implications for research and practice are discussed. (p. 1)
In addition, some questions violated the principle of survey endpoint parallelism which could artificially
skew responses toward the tails of the distribution by, for instance, including non-equivalent endpoints of
the scale (i.e., including endpoints of “Very Unsatisfied and Very Satisfied” is better practice than “Very
Poor” and “Very Satisfied”), and some questions were not necessarily psychometrically-sound ways of
assessing client-level outcomes (i.e., asking if someone’s mental health improved does not tell one whether
it actually did, and respondents can be biased toward answering questions about behavior like substance
abuse in socially-desirable ways). We encourage providers to consider these points going forward and also
encourage providers to collect more data on relevant demographic characteristics (i.e., age, income, sex,
race, ethnicity, etc.) such that the results of the client satisfaction surveys can be more granularly analyzed
to assess variation across clients in satisfaction which can, in turn, help programs develop more effective
and targeted service delivery.
Interview Data
We conducted interviews with 15 staff at both providers for an overall response rate of 83.3% (N = 15/18).
However, throughout the interview process, participants informed us of additional program staff who would
have been good candidates for the interview sampling frame (i.e., new program hires) who were not
included in the initial sampling frame from the emailed lists we had received. However, we could not
interview these individuals due to the time-bound recruitment frame stipulated in our IRB application.
Additionally, interviews occurred within the first quarter of 2021 (January 2021 – March 2021). A number
of programmatic changes occurred during this time – for instance, the first set of program changes
associated with Centro Sávila ’s Strategic Initiative Plan. Thus, the interview results we obtained represent
a snapshot of opinion at one discrete time point and do not necessarily allow us to make inferences about
how interviewees felt at other stages of program implementation. Third, the interpretation of the
quantitative data obtained in the interviews can be suggestive, but the inferential power of this data is limited
due to common small-sample biases (i.e., it only takes one respondent answering with a one on a 7-point

75
scale to drive average estimates downwards). Fourth, there were some interviewing questions which, in
retrospect, we wish we had included in the interview guide (i.e., workplace burnout in the PFI scale;
questions about staff onboarding procedures; questions about how peer support staff made their peerness
evident to clients), some questions in the interview guide which were suboptimal in design or question
wording (i.e., we often needed to provide additional clarification on questions where we asked participants
to assess whether their programs use evidence-based practices and for questions where we asked peer
support workers about their perceptions of their peerness given interviewee confusion over the terms
evidence-base and peerness), and some questions we wish we had omitted due to redundancy in content
which may have increased interview length unnecessarily.
Recommendations for Providers
Strategies for Clearer Performance Measure Reporting
There were a few issues identified with performance measure reporting – some unique to each provider –
which can be modified which will help improve the clarity of performance measure results in the future.
We recognize that some of these issues are more easily resolvable than others and that there are some
reasonable defenses for a subset of these issues which can be offered (i.e., a desire not to burden clients
with excessive scale administration; the amount of time to extract data from EMR systems). We also
recognize that providers were in an implementation pilot phase for the first year of their programs’ existence
and that performance measures evolved over time as more institutional knowledge was acquired. However,
making at least some of the following recommended improvements identified below in Table 58 could
generally help improve the quality of performance measure reporting and lead to more accurate
programmatic insights going forward.
CONTINUE TO NEXT PAGE

76
Table 58. Performance Measure Issues and Recommendations
Issue Recommendation
Client counts are ambiguous (i.e., Who is a
continuing client? Are they a client enrolled
specifically in the program or more generally in the
organization? Are they double-counted month-to-
month?)
Our recommendation is to only include clients
enrolled in the program in the total client
calculation. We also note that running totals for
“Total Clients” should not simply use Excel
formulas which sum total and continuing clients for
each month given that this summation duplicates
continuing clients across months which leads to an
overstatement of total clients in the performance
measure data.
Some variables should be decomposed to allow for
more granular insights (i.e., combining the number
of clients with improved mental health and
substance use together into one variable does not
allow one to understand differential improvements
in each category).
Our recommendation is to break variables – such
as number of clients with improved mental health
and substance use – into two different variables and
report each separately.
The measurement of some performance measure
variables could be enhanced by using
psychometrically-validated scales (i.e., asking a
subset of clients a single-question about if their
mental health improved is not adequate for
assessing true mental health improvements given
both (1) issues with single-item measures of
complex phenomena and (2) familiar self-report
biases related to social desirability.
Our recommendation is to rely on existing program
scales available in EMRs – instead of single-item
self-report questions – to assess changes in mental
health or substance use over time, if feasible. This
will allow for a more accurate depiction of
improvement. There are also short-form scales
(i.e., PHQ – 9; WHODAS 2.0) which take < 3
minutes to administer which could be considered.
Some variables are inappropriately computed in
the Excel spreadsheets (i.e., % of continuing
clients).
One recommendation is to verify that the
computation of variables in the Excel spreadsheets
is accurate (i.e., make use of weighted-averages
where appropriate instead of taking the average of
averages without adjusting for different sample
sizes in different months).
Some variables are vague (i.e., Is the number of
clients who reportedly reach their goals each month
all of their treatment plan goals or just one goal?
How is a decrease in severity measured?) and are
not clearly defined in the narrative description
section of Excel sheets. Relatedly, some sheet
indicators are unclear.
Our recommendation is to provide a codebook in a
new sheet in the Excel file which specifically
explains the data used to generate each variable,
including question-wording, if applicable, and
source. If a provider changes how they measure a
performance measure, the provider should indicate
(1) how the performance measure changed, (2)
when it changed, and (3) why it changed.

77
Demographic data are reported for all provider
clients and not just program participants.
Our recommendation is that data should only be
reported at the program-level and not the provider-
level.
Not all contracted performance measures are
recorded.
Our recommendation is to reach out to the
appropriate DBHS staff for technical assistance for
collecting additional variables.
Strategies for Increasing Attendance Rates and Intensiveness
A systematic review by Ponka et al. (2020) on ICM notes:
ICM helps service users maintain housing and achieve a better quality of life through the support
of a case manager that brokers access to an array of services. The case manager accompanies the
service user to meetings and can be available for up to 12 hours per day, 7 days a week. Case
managers for ICM often have a caseload of 15–20 service users each…Case management
interventions may be most effective when they target specific complex populations or times of
transition with more effective interventions that involve low caseloads, greater intensity and
continuity of contact time, and direct service provision in addition to mere coordination. (p. 5)
Both providers indicated that it was difficult, at times, to encourage continual engagement in their PCM
programs, particularly given the voluntariness associated with harm-reduction approaches to case
management and common issues establishing and maintaining contact with their respective client bases
including clients’ limited access to phones, reliable Internet, and reliable transportation. These challenges
are not unique to these providers and are relatively common for behavioral health providers: for instance,
a 2013 systematic review reported that approximately 40-54% of homeless patients owned a cell phone
relative to 84% of homed-individuals who did own a cell phone (McInnes, Li, and Hogan 2013).
Providers seemed aware of the possibility of low program engagement rates at earlier stages of program
implementation and noted that it is important to understand the reasons for low-level engagement. For
instance, in their monthly narrative from their performance measure report from July 2019, CRFW staff
noted:
When we designed the program, we anticipated that POPSS clients would engage with the program
once or twice to address specific issues and then there would be long periods where they did not
engage with the case manager. We have been surprised at the number of women who want to
engage regularly for longer periods. To ensure that we are offering a truly client-driven program,
we want to ensure that our processes match the needs of the clients. It's perfectly acceptable for a
client to drop in for support around a single issue or to continue with more sustained engagement.
The issue of low program engagement and attendance rates – and having a better understanding of the
reasons underlying both – are important to think about when considering (a) the scale of a program’s reach,
(b) potential biases in the data for outcome evaluation, and (c) cost-effectiveness. It is also worth
considering how a program formally defines client disengagement and discharge procedures given the
78
vulnerabilities of the populations being served and the possibility of duplication upon service re-entry after
longer periods of program disengagement. Speaking to this point, an article by Mitchell and Selmes (2007)
notes:
In most psychiatric specialties in the United Kingdom, two or three episodes of nonattendance elicit
the withdrawal of that service, with no attempt to contact the patient personally. Yet there is general
acceptance that unexpected loss of contact with a patient who has established symptoms is more
likely to signify increased rather than absent mental health needs. We suggest that whenever
possible, clinicians should consider potential causes of nonattendance before discontinuing any
services unilaterally. Likelihood of initial nonattendance reflects patient beliefs and insight, source
of the referral, and barriers to care (such as distance and cost). These continue to influence follow-
up attendance, as do important interpersonal influences, such as therapeutic alliance and
perceived helpfulness. Special consideration is needed for individuals whose first language is not
the same as the one used by the health professional and for those with cognitive impairment or
limited social support. (p. 871)
Most existing research finds that ongoing substance use during treatment and diagnosis with an SMI is
consistently correlated with lower meeting attendance (Penzenstadler et al., 2019). Demographic variables,
interestingly, typically display inconsistent relationships with attendance and continual program
enrollment, though in our review of client-level data, we did find suggestive evidence that age positively
correlated with higher rates of peer case management service utilization. It is important to consider the
statistical effect that variability in client attrition rates may have on evaluating outcomes downstream: the
likelihood of survivorship bias, for instance, increases if clients who leave the program for long periods are
clients with higher levels of severity or if the reason for disengagement (i.e., homelessness) correlates with
outcomes we want to measure (i.e., housing stability). Further, the peer-reviewed literature suggests that
appointment adherence can have a negative impact on client health, provider productivity, and can result in
reduced cost-effectiveness (Mohammadi et al. 2018).
The challenges with client program engagement manifest in two primary ways in the client-level data we
reviewed for both providers: an overall low volume of case management contacts and noncompliance rates
for scheduled case management meetings. For instance, while all of the 374 clients considered in Centro
Sávila’s analysis had at least one case management meeting scheduled, 12.6% (N = 47) of clients attended
no meetings with their case manager and 61.50% (N = 230) of clients only attended one case management
meeting with their case manager. Thus, the overall dosage of case management services provided for most
clients was comparatively low as 74.1% of clients met with case managers no more than one time. While
the typical client at CRFW had 4.10 contacts with their case managers, 21.3% (N = 27) of CRFW clients
logged no more than one contact with their case manager. Additionally, 52.7% of CRFW’s case
management contacts were not face-to-face and 45.7% (N = 58) of clients never met with a case manager
in-person or on the phone.
The evidence-base on client retention for behavioral health programs suggest a few strategies for increasing
client retention rates and engagement, some of which the providers have already adopted and others the
providers have not. The feasibility of adopting these strategies will vary as a function of provider resources

79
and broader environmental and system-level factors. To improve client retention rates, Orwin et al. (1999)
suggest that providers:
• Eliminate or decrease waiting times between enrollment and entry.
• Orient clients with a realistic view of program expectations.
• Increase contact with case managers.
• Make services more accessible (e.g., by scheduling more hours when services are available).
• Improve program facility environment.
• Improve responsiveness to client-specified needs (e.g., housing).
• Invite families to come to the program early to increase their understanding of the program.
• Increase opportunities for recreation and self-improvement.
• Improve relapse prevention efforts.
Additionally, a recent systematic review by McClean et al. (2016) suggests that the inclusion of reminder
systems – specifically, those which include additional information including appointment date, time, and
place but also information on orientation and health – are effective at reducing appointment non-attendance.
We also want to draw providers’ attention to a 2010 report by The United States Department of Housing
and Urban Development (HUD), “Strategies for Improving Homeless People’s Access to Mainstream
Benefits and Services” which featured CRFW. The HUD report provides a number of actionable
recommendations to address some of the common challenges providers mentioned in the interviewing
process and which were evident in the client-level data with respect to primary client goals and SDOH
needs, including advice on how to overcome service barriers associated with: geographic and transportation
barriers, negative office atmospheres and stigmatization, the complexity and cognitive demands of lengthy
benefit applications, ID and documentation requirements, the complexities of maintaining enrollment, staff
system knowledge, and broader system interaction problems. For instance, the HUD reports identifies the
following mechanisms as ways providers can address common difficulties associated with client
transportation:
• Many homeless services providers simply use program funds to provide transportation, often in the
form of an agency van, or in tokens for taxis or public transportation.
• Others went a step further and located their agencies and programs to alleviate problems of
transportation, setting up in close proximity to benefit offices
• Many mainstream agencies in study communities outstation workers—that is, workers from a
program or agency go to homeless assistance programs during regularly scheduled times to do
intakes and deliver services. In addition to alleviating issues of program knowledge and system
interaction, workers from various agencies and programs go to service sites such as shelters,
emergency rooms, and day centers to bring benefit applications and information to homeless clients
• Outreach workers also provide some measure of transportation assistance by either bringing
applications for people to fill out without their having to come into the office, or by arranging
transportation services once they make the initial contact, as is the case with Denver Outreach
Collaborative.
• Multi-service centers, at which users may access multiple services and benefits, are an effective
tool for minimizing travel expenses as well as integrating services, as discussed below.

80
We encourage both providers to review the recommendations contained in the HUD report to address
existing challenges with enrollment and program engagement where feasible. However, we also recognize
that there are systemic limitations which constrain providers’ abilities to adopt some of these
recommendations. For instance, while one of the HUD report recommendations is to increase client contact
rates with case managers, we recognize that this goal can be difficult to achieve given limited staffing,
unanticipated temporal surges in the client base, and access to reliable technology. We also recognize that
broader systems-level factors are often beyond the control of providers (i.e., recommendations for improved
responsiveness for client housing needs are constrained by broader market forces of supply-and-demand).
Timing and Scope of Screening and Assessment Tools
Another issue we want to highlight is the timing and scope of the delivery of screening and assessment
tools given that our process evaluation revealed that there were inconsistencies with when screening and
assessment tools were administered between the process maps, interviews, and client-level data and given
the comparatively low rates of scale administration across both providers and even lower rates of scale re-
administration. Specifically, providers’ initial process maps indicated that screening tools (i.e., WellRx and
POPPS Screening Tool II) would be re-administered at periodic intervals (i.e., 90 days) whereas in practice,
these scales often were either not re-administered a second time or were re-administered at inconsistent
time points (i.e., 152 days after initial administration). Our interviews also revealed that there was some
confusion across participants regarding when these scales should be administered. Further, some scales that
case managers reported receiving training in and which were identified in provider contracts (i.e., ACES;
C-SSR) were used very sparingly in practice (i.e., 0% of clients were ACE screened; < 1% of clients were
screened for suicidality using the C-SSR) despite SAMSHA’s recommendations that all clients [emphasis
added]—particularly those who have experienced trauma—should be screened for suicidality (see, for
instance, TIP 50 – “Addressing Suicidal Thoughts and Behaviors in Substance Abuse Treatment”).
We want to underscore the importance of re-administering scales periodically at specific, clearly-defined
time points for outcome evaluation purposes: in order to assess program effectiveness, it is important to
have repeated measures on behavioral health assessment tools (i.e., particularly, the SDOH screeners) in
order to be able to evaluate the effect of PCM programs on behavioral health outcomes. Repeated measures
of psychometrically-validated assessment tools are more reliable ways of tracking true participant progress
and outperform empirically-weaker forms of assessing change in mental health (i.e., single item questions
which suffer statistical reliability issues) or subjective impression-based views of client success. In the
absence of repeated assessments, it can be difficult to accurately assess whether a program has its intended
effect. On the provider-side, this is important information to have as it can help promote more effective
service delivery downstream and lead to better serving the existing target population. On DBHS’ side, this
is important information to have as it can help promote cost-effectiveness in grant distribution to behavioral
health providers on the basis of demonstrable change.
We recognize that there are some logistical issues associated with scale administration and re-
administration that the providers flagged in the interviewing process which we will address in turn. Staff at
both providers in the interviewing process indicated that they were resistant to administering screening and
assessment tools due to either (1) a perception that the administration of these scales (i.e., specifically, the
SDOH scales) risks re-traumatizing clients and/or (2) administration of these scales increases perceptions
that the program is not organic, threatens the therapeutic alliance of case-managers with their clients and,

81
in so doing, risks client attrition. To address these concerns, we review SAMHSA’s recommendations for
trauma-informed assessment and scale delivery at the clinician-level which can be adapted by case
managers and note that screening and assessment can be performed by non-case management staff (i.e.,
clinicians or others) in ways which are less invasive and are sensitive to the needs of clients who have
experienced trauma.
First, the Department of Health and Human Services (HHS) has developed criteria for certified community
behavioral health clinics (CCBHCs) related to the timing of screening tools for evaluation purposes. We
replicate the criteria below from the SAMHSA website which can serve as a template for timing which
providers can more explicitly articulate in their relevant program documentation (i.e., process maps):
• A preliminary screening and risk assessment at the point of first contact with a consumer: If the
screening identifies an emergency or crisis need, an immediate response with appropriate services
is required. The criteria do not specify the content of the preliminary screening and risk assessment.
• An initial evaluation and services: If the preliminary screening reveals emergency or urgent needs,
the initial evaluation must be completed within one business day and, for urgent needs, services
must be provided within one business day. If the preliminary screening reveals routine needs, the
initial evaluation must be completed and services provided within 10 business days. Criterion 4.d.3
specifies the content of the initial evaluation.
• A comprehensive person- and family-centered diagnostic and treatment planning evaluation: This
evaluation must be completed within 60 calendar days of the first request for services. Criterion
4.d.5 includes suggestions for states to consider in determining the content of this evaluation,
although it is up to states to establish the final content. This criterion also recognizes that state,
federal, or accreditation content requirements might already exist that apply to the CCBHC.
In terms of the providers’ concerns that scale re-administration risks re-traumatizing their client base, we
want to note that (1) trauma-informed care requires scale administration in order to assess trauma in the
first place, (2) there are clinical and evidence-based strategies for reducing the potential harms clients feel
when filling out screening and assessment tools that non-clinicians can adopt, and (3) best practices for
trauma-informed care note the importance of completing these screenings. For a more comprehensive
review on these considerations, we refer providers to SAMSHA’s TIP 57 “Trauma Informed Care in
Behavioral Health Services”. For instance, TIP 57 notes:
As a trauma-informed counselor, you need to offer psychoeducation and support from the outset of
service provision; this begins with explaining screening and assessment and with proper pacing of
the initial intake and evaluation process. The client should understand the screening process, why
the specific questions are important, and that he or she may choose to delay a response or to not
answer a question. at all. Discussing the occurrence or consequences of traumatic events can feel
as unsafe and dangerous to the client as if the event were reoccurring. It is important not to
encourage avoidance of the topic or reinforce the belief that discussing trauma-related material is
dangerous, but be sensitive when gathering information in the initial screening. Initial questions
about trauma should be general and gradual. Taking the time to prepare and explain the screening
and assessment process to the client gives him or her a greater sense of control and safety over the
assessment process. (p. 110)
82
The TIP provides guidelines which we replicate below which can help reduce the probability that clients
feel stress when completing the SDOH screeners:
• Clarify for the client what to expect in the screening and assessment process. For example, tell the
client that the screening and assessment phase focuses on identifying issues that might benefit from
treatment.
• Inform him or her that during the trauma screening and assessment process, uncomfortable thoughts
and feelings can arise.
• Provide reassurance that, if they do, you’ll assist in dealing with this distress—but also let them
know that, even with your assistance, some psychological and physical reactions to the interview
may last for a few hours or perhaps as long as a few days after the interview, and be sure to highlight
the fact that such reactions are normal (Read et al., 2003).
• Use self-administered, written checklists rather than interviews when possible to assess trauma.
• Interviews should coincide with self-administered tools to create a sense of safety for the client
(someone is present as he or she completes the screening) and to follow up with more in-depth data
gathering after a self-administered screening is complete.
Covid-19, Telehealth, and ICM Best Practices
The evaluation of the two providers’ PCM programs occurred in the broader context of the Covid-19
pandemic. The pandemic influenced a number of program operations, staffing procedures, and morale. It
is worth being mindful of the ways in which the specific service delivery changes engendered by Covid-19
mid-intervention – most prominently, the transition away from in-person to telephonic case management
services – may influence behavioral health outcomes, differentially bias who self-selects into programs,
and complicates the ability to make causal inferences about specific providers’ program efficacy. The onset
of the pandemic – paired with government-mandated public health orders – required nontrivial resets from
both providers, resulted in statistically-significant short-term drops in program enrollment per a series of
change point detection regressions, required providers to reconfigure modes of service delivery on the fly,
and generated challenges for the existing client base which correlate with program outcomes (i.e., increased
food insecurity; substance use relapse; increased job loss).
It is unclear whether the programmatic shifts to telephonic and virtual case management are in tension with
the underlying theoretical logic of ICM. For instance, a recent network analysis by Suzuki et al. (2019)
suggests that one of the definitional components of ICM involves regular face-to-face contact with case
managers. If case management is primarily delivered through telephonic or virtual modes, there are breaks
from model fidelity which can potentially threaten the effectiveness of the intervention if these formats
reduce client-side perceptions of mutualism, closeness, and reciprocity they feel with their case managers.
The delivery of virtual services also negates some of the streets-side elements of case management which
are typical of ICM programs (i.e., going with clients to appointments in the field). Further, it seems
reasonable to suspect that programs’ client bases change when service delivery changes (i.e., those without
access to reliable Internet may be less likely to participate in programs which emphasize virtual or
telephonic forms of engagement, problems which seem particularly pronounced in the client populations

83
served by both providers given the unique vulnerabilities of these populations). To this point, CRFW noted
in their performance measure narrative report from March 2020:
All groups have gone to an online format during Facebook live videos. This changes a lot of the
group dynamics insofar as it's more public and less intimate than an in-person group. We
encourage comments, but not the disclosure of a ton of personal experience just to ensure that the
women's privacy is protected. This changes the dynamic between the group facilitator and the
clients, moving the dynamic closer to a lecture and away from a group conversation. Nevertheless,
given the circumstances, it's a good compromise.
Following up on this point – specifically with respect to the broader point about who is using case
management services – CRFW noted in their performance measure narrative report from May 2020:
Groups will continue in an electronic format. The regular videos and groups that happen on the
program's social media page will continue. However, clients are warned that the social media
page is not a HIPPA compliant format and are asked to be mindful of that fact and privacy issues
when commenting on the videos. We will be transitioning some of our groups to Zoom. Attendance
in those groups might decrease a bit, since clients will be learning a new way of accessing groups
and it won't be quite as simple and straightforward as a Facebook Live video. However, we believe
that the benefit of increasing the interactivity between the group facilitator and the clients and
allowing clients to speak more openly about their thoughts and experiences is worth making the
change. We are finding that a lot of our clients are missing the face to face connection they had
with their peers when they were able to come to our building. Zoom won't replace all of that, but
we think it will help.
Having noted some potential challenges telehealth presents, in the interest of balance, it is worth noting
some of the potential advantages telehealth approaches afford over the standard model of behavioral health
care provision. For instance, a recent paper by Mochari-Greenberger and Pande (2021) highlights how the
move to telehealth can overcome some established barriers to behavioral health care. We replicate a table
from Mochari-Greenberger and Pande (2021) below:
CONTINUE TO NEXT PAGE

84
Figure 10. Barriers to Behavioral Health During COVID-19 Overcome with Virtual Health Care
Delivery
Thus, there are tradeoffs to the incorporation of telehealth services which are worth being mindful of when
considering outreach and engagement activities.
Summary of Key Findings
A total of 604 clients participated in both providers’ PCM programs in the time-frame considered for this
process evaluation from June 2019 – April 2021. Across providers – of the clients who received case
management services of any duration – clients received, on average, 151.6 minutes of case management
services, though the average number of minutes of case management services provided varied by provider
(177.9 minutes per client for Centro Sávila and 125.4 minutes per client for CRFW). The median number
of total case management minutes provided per client – of the clients who received case management
services of any duration – was 60.0 minutes per client and is equivalent for both providers. Across providers,
the average duration of case management meetings was 49.2 minutes, and the median duration of case
management meetings was 42.2 minutes. Across both providers, the median number of total meetings with
case managers was 1.50 meetings. Additionally, across both providers, only 50.3% (N = 304) of clients met
with their case managers more than one time. While all of the 374 clients considered in Centro Sávila’s
analysis had at least one case management meeting scheduled, 12.6% (N = 47) of clients attended no
meetings with their case manager, and 61.50% (N = 230) of clients only attended one case management
meeting with their case manager. Thus, the overall dosage of case management services provided for most
clients was comparatively low as 74.1% of clients met with case managers no more than one time. While
the typical client at CRFW had 4.10 contacts with their case managers, 21.3% (N = 27) of CRFW clients
logged no more than one contact with their case manager. Additionally, 52.7% of CRFW’s case
management contacts were not face-to-face and 45.7% (N = 58) of clients never met with a case manager
in-person or on the phone.
These low-level engagements – while not particularly unique to these providers and while potentially
reflective of the specifics of clients’ shorter-term needs – are at odds with the ICM models’ emphasis on

85
high frequency, high-intensity contact between case managers and their clients and make both programs
somewhat indistinguishable from other case management models. See, for instance, this table from Ponka
et al. (2020) which provides an overview of different case management models and note where the
distinctions between the providers’ ICM programs and other case management interventions are unclear:
Figure 11. Characteristics of Case Management Models
In general, staff who had peer case management job responsibilities indicated work-loads consistent with
ICM best practices (i.e., < 15 active clients per case manager), though we note that, per the performance
measure data that we have, workloads tended to vary on a month-to-month basis, reflecting broader system-
level factors (i.e., housing availability; Covid-19) and at times exceeded ICM recommendations for
caseloads.
The profiles of high-service utilizers (i.e., clients logging higher volumes of contacts and more minutes of
contacts with case managers) at both providers shared only one common predictor: in both cases, younger
clients tended to be significantly less likely to have contacts with their case managers and were significantly
less likely to meet with case managers for longer durations. In terms of the unmet needs of the client bases
86
served by both providers, while both providers used different assessment tools to measure social
determinants of health and had differing assessment completion rates, both providers reported that a
majority of their clients – of those who completed the SDOH assessments – had housing needs (59.5% of
clients) and either income or vocational needs (62.2%) at the point of intake. Better understanding the
profiles of high-frequency service utilizers is important for programs to understand as this can allow them
to reconsider existing strategy related to outreach, engagement, and service plan construction.
The services providers were likely to refer clients out to varied, though this data is limited for Centro Sávila
given the reporting of only one external referral per client: CRFW was most likely to refer clients out to
housing services whereas Centro Sávila was most likely to refer clients out to public benefit enrollment
services. Comprehensive data on clients’ service enrollment and uptake are currently unavailable, so we
are unable to determine the extent to which client service referrals resulted in service receipt at this time.
We found that across providers, peers generally perceived themselves to be similar to the clients they served
and that they generally had satisfactory relationships with their clients which suggests that peerness-
perceptions were not a barrier to peer support. However, across providers, case managers identified
common barriers to working with their specific target populations, most commonly noting transportation
limitations and the infrequency of client contacts. Additionally, across providers, most peer-support and
case management staff indicated that they were satisfied with the work they performed and felt supported
from others within their organizations, though we do note some variability across and within providers in
the uniformity of these perceptions. A majority of staff at both providers indicated experiencing some role
change in their job functions since starting their positions: while role change is common to new programs,
we want to highlight that excessive role change is associated with higher perceptions of role ambiguity,
higher levels of workplace burnout, and reductions in perceptions of workplace satisfaction (Acker 2003).
Nearly all respondents indicated that the training they had received was useful to them on the job.
In terms of client satisfaction metrics, clients at both providers reported high levels of satisfaction with
program services, though the scope of data collected in these surveys varied by provider and is limited due
to the limited sampling frames used which excluded meaningful subsets of clients (i.e., those without
reliable Internet; clients at WEHC). Thus, we caution against drawing strong inferences about aggregate
satisfaction on the basis of this data and view this data as suggestive at best.
Finally, both providers changed how they delivered case management services in response to Covid-19 and
public health orders. These shifts from in-person service delivery to primarily virtual and telephonic modes
could result in different patterns of client engagement, potentially excluding portions of the client base
without reliable Internet access or consistent telephone services. However, initial statistically significant
declines in enrollment levels observed in March and April 2020 were eventually corrected for and both
programs updated procedures and protocols on the fly. As noted in the Recommendations subsection, the
potential negative effects of telehealth case management service delivery should be considered, in balance,
against potential gains from these platforms when programs consider how to transition back to in-person
service delivery as public health orders are relaxed.

87
Future Research Though we were able to answer a number of questions in the present process evaluation, there are still a
few process-related questions which we were not able to answer but which could help us better understand
how both providers’ programs are implemented going forward. We present a sample of some research
questions below which could help us better understand the dynamics of both providers’ process flows in
the future:
1. Is CRFW’s POPPS incentive program effective at increasing client-engagement? Understanding
the profiles of POPPS clients who utilize the incentives program can provide insights into whether,
and under which conditions, the POPPS’ incentives program is effective at increasing client
participation, which incentives work best, and which types of clients are most likely to make use
of the program.
2. What does virtual case management engagement look like when quantified? Gathering specific
data on aggregated and de-identified user engagement with relevant Facebook groups (i.e., scraping
Facebook API data for CRFW’s Butterflies group) could permit a deeper understanding of the
degree of virtual service utilization and change over time in response to Covid-19.
3. How do clinicians perceive the PCM programs at both providers? Conversations with clinicians on
staff could result in refinement of the clinician record data collection tools to address the questions
of screening and assessment tools at other points of contact.
4. In which specific ways do peer case managers make their “peerness” known to their clients? How
does – in other words – the notion of peerness get reinforced in case manager-client interactions?
5. Were there significant changes in the demographic characteristics of clients participating in
program activities before and after Covid-19? We could explore whether and how Covid-19
changed which types of clients were more likely to engage and disengage from both PCM programs
before and after Covid-19 to empirically assess the effect of telehealth on client engagement.
Before discussing plans for an outcome evaluation, we want to note that there are a series of challenges to
conducting an outcome evaluation of both PCM programs going forward.
1. Both programs incorporate elements of other behavioral health interventions in addition to peer
case management into their programming. For instance, both providers indicated their case
managers use MI techniques, and the evidence-base suggests that MI interventions have
independent positive effects on behavioral health outcomes. While the inclusion of multiple
evidence-based techniques in service-delivery may maximize the likelihood of program
participants realizing positive behavioral health outcomes, because multiple interventions are being
applied to the same population simultaneously, this makes it difficult to assess the degree to which
any positive behavioral health outcomes observed in the future are a direct function of the
“peerness” of case managers or whether the outcomes are a function of other varied dimensions of
the case management services provided, such as the use of MI.
2. The conceptual distinction between the two programs’ case management and other models of case
management is ambiguous. For instance, both programs’ service delivery shares resemblance to
other modes of case management – the standard case management model because of the drop-in
and episodic nature of service provision, particularly post-Covid, and critical time interventions
(CTI) because of the target populations they are working with at the WEHC and POPPS more
generally. This similarly makes it difficult to assess the extent to which the programs are purely
peer case management programs and whether it is the peers per se or these other forms of case
management which have the largest effect on the outcomes observed.

88
3. The absence of data on outcome-relevant variables (i.e., demographics, residential status,
employment status) – both at intake and throughout program progression – reduces our ability to
assess how program participation and other baseline client characteristics influence outcomes.
4. A recent pre-print paper by Haber et al. (2021) discusses how key assumptions underlying common
outcome evaluation research designs (i.e., pre-post analysis) are violated because of the Covid-19
pandemic. Specifically, Haber et al. argue that it is difficult to conduct outcome evaluations when
evaluating interventions which were ongoing when Covid-19 began since it difficult to determine
what explains outcomes in the absence of a control group (i.e., it violates an assumption called
conditional exchangeability). We still need some time to consider and reason through best
methodological practices for outcome evaluation because of Covid-19 going forward and will
attend to best evaluation practices as they are developed.
Assuming an outcome evaluation is desirable, we would ideally like to collect data on the following set of
outcomes: client housing stability, mental health improvements, quality of life measures, substance use,
hospitalization, income, and employment status. It may also be useful to conduct a cost-benefit analysis to
estimate whether peer case managers are more cost-effective when compared against standard case
management models or the system as usual.
Conclusion
After approximately two years of program development and maturation, a total of 604 clients have received
over 1,253 hours of peer case management services while enrolled in both Centro Sávila’s and CRFW’s
PCM programs. In general, there are elements of both programs’ implementation which are consistent with
ICM best practices (i.e., average caseloads for case managers are typically under 15 active caseloads per
case manager; service delivery, before Covid-19, featured more streets-based service provision) and PCM
best practices (i.e., peerness perceptions are high among case managers; peers generally perceive supportive
work environments; peers have the capacity to receive state peer support certifications and are generally
supported by their providers in doing so). However, there are other elements of program implementation
which fall short of these standards (i.e., the frequency and intensity of case management contact is low;
service-delivery post-Covid-19 was mostly not in person; the distinction between peer case management
and other related interventions is unclear at times). Limitations to data collection and gathering (i.e., high
levels of assessment missingness and re-administration; gaps in more extensive data collection for clients
at WEHC) – paired with the unique and unprecedented disruption to service-delivery of Covid-19 mid-
intervention – present considerable challenges to evaluation going forward. The evidence from the process
evaluation presents a mixed picture of program successes (i.e., high client satisfaction rates; generally
positive work environments; high peerness perceptions) and limitations (i.e., common difficulties engaging
the target population repeatedly) and identifies unique characteristics of both providers’ client bases who
are prone to access services. We encourage the DBHS and the providers to reflect on some of the
recommendations we spotlight in the Recommendations subsection to enhance the quality of data collection,
increase prospects for longer term program evaluability, and maximize potential program effectiveness
going forward.
89
References
Acker, Gila M. 2003. "Role Conflict and Ambiguity: Do They Predict Burnout among Mental Health
Service Providers?" Social Work in Mental Health 1(3): 63-80.
Albrecht, G. L., and K. E. Peters. 1997. "Peer Intervention in Case Management Practice." Journal of
Case Management 6(2): 43-50.
Bandura, A. 1977. Social Learning Theory.
Barry, Kristen Lawton, et al. 2003. "Effect of Strengths Model versus Assertive Community Treatment
Model on Participant Outcomes and Utilization: Two-Year Follow-Up." Psychiatric Rehabilitation
Journal 26(3): 268 - 277.
Bellamy, Chyrell, Timothy Schmutte, and Larry Davidson. 2017. "An Update on the Growing Evidence
Base for Peer Support." Mental Health and Social Inclusion: 161-167.
Borkman T. 1976. “Experiential Knowledge: A New Concept for The Analysis of Self-Help Groups.”
Social Service Review 50: 445–456.
Button, Katherine S., et al. 2013. "Power Failure: Why Small Sample Size Undermines the Reliability of
Neuroscience." Nature Reviews Neuroscience 14(5): 365-376.
Case Management. SAMHSA. (2020, April 30). https://www.samhsa.gov/homelessness-programs-
resources/hpr-resources/case-management.
Chinman, Matthew, et al. 2008. "Early Experiences of Employing Consumer-Providers in the VA."
Psychiatric Services 59(11): 1315-1321.
Chinman, Matthew, et al. 2014. "Peer Support Services for Individuals with Serious Mental Illnesses:
Assessing the Evidence." Psychiatric Services 65(4): 429-441.
Community Partners, Inc. 2015. Behavioral Health Business Plan (prepared for the Bernalillo County
Bernalillo County Board of County Commissioners). December.
Daniels, Allen S., Sue Bergeson, and Keris Jän Myrick. 2017. "Defining Peer Roles and Status Among
Community Health Workers and Peer Support Specialists in Integrated Systems of Care." Psychiatric
Services 68(12): 1296-1298.
Davidson, Larry, and Kimberly Guy. 2012. "Peer Support Among Persons with Severe Mental Illnesses:
A Review of Evidence and Experience." World Psychiatry 11(2): 123-128.
Dennis CL. 2003. “Peer Support Within a Health Care Context: A Concept Analysis.” International
Journal of Nursing Studies 40(3): 321–332.

90
Dieterich, Marina, et al. 2017. "Intensive Case Management for Severe Mental Illness." Cochrane
Database of Systematic Reviews.
Forti, Matthew. 2012. “Six Theory of Change Pitfalls to Avoid (SSIR).” Stanford Social Innovation
Review: Informing and Inspiring Leaders of Social Change,
ssir.org/articles/entry/six_theory_of_change_pitfalls_to_avoid#:~:text=Creating%20a%20mirror%20inste
ad%20of,%2C%20culture%2C%20and%20so%20on.
Fuhr, Daniela C., et al. 2014. "Effectiveness of Peer-Delivered Interventions for Severe Mental Illness
and Depression on Clinical and Psychosocial Outcomes: A Systematic Review and Meta-Analysis."
Social Psychiatry and Psychiatric Epidemiology 49 (11): 1691-1702.
Fukui, Sadaaki, et al. 2012. "Strengths Model Case Management Fidelity Scores and Client Outcomes."
Psychiatric Services 63(7): 708-710.
Gidugu, V., Rogers, E. S., Harrington, S., Maru, M., Johnson, G., Cohee, J., & Hinkel, J. 2015.
“Individual Peer Support: A Qualitative Study of Mechanisms of Its Effectiveness.” Community Mental
Health Journal 51(4): 445-452.
Haber, Noah A., et al. 2021."Policy Evaluation in COVID-19: A Graphical Guide to Common Design
Issues." arXiv preprint arXiv:2009.01940.
Hettema, Jennifer, Julie Steele, and William R. Miller. 2005. "Motivational Interviewing." Annual Review
of Clinical Psychology 1: 91-111.
Jenkins, David G., and Pedro F. Quintana-Ascencio. 2020. "A Solution to Minimum Sample Size for
Regressions." PloS one 15(2): e0229345.
King, Robert. 2006. "Intensive Case Management: A Critical Re-Appraisal of the Scientific Evidence for
Effectiveness." Administration and Policy in Mental Health and Mental Health Services Research 33(5):
529-535.
Knapp, Thomas R. 2016. "Why is the One-Group Pretest–Posttest Design Still Used?.": 467-472.
Lloyd-Evans, Brynmor, et al. 2014. "A Systematic Review and Meta-Analysis of Randomised Controlled
Trials of Peer Support for People with Severe Mental Illness." BMC Psychiatry 14(1): 39-51.
Low, Jacqueline. 2019. "A Pragmatic Definition of the Concept of Theoretical Saturation." Sociological
Focus 52(2): 131-139.
Mead, Shery, and Cheryl MacNeil. 2006. "Peer Support: What Makes it Unique." International Journal
of Psychosocial Rehabilitation 10(2): 29-37.
91
McInnes, D. Keith, Alice E. Li, and Timothy P. Hogan. 2013. "Opportunities for Engaging Low-Income,
Vulnerable Populations in Health Care: A Systematic Review of Homeless Persons’ Access to and Use of
Information Technologies." American Journal of Public Health 103(2): 11-24.
Mitchell, Alex J., and Thomas Selmes. 2007. "A Comparative Survey of Missed Initial and Follow-Up
Appointments to Psychiatric Specialties in the United Kingdom." Psychiatric Services 58(6): 868-871.
Mohammadi, Iman, et al. 2018. "Data Analytics and Modeling for Appointment No-Show in Community
Health Centers." Journal of Primary Care & Community Health 9: 2150132718811692.
Moore, Graham F., et al. 2015. "Process Evaluation of Complex Interventions: Medical Research Council
Guidance." BMJ 350: 1-7.
Mochari-Greenberger, Heidi, and Reena L. Pande. 2021. "Behavioral Health in America During the
COVID-19 Pandemic: Meeting Increased Needs through Access to High Quality Virtual Care." American
Journal of Health Promotion 35(2): 312-317.
Nicholson, Joanne, and Anne Valentine. 2018. "Defining “Peerness”: Developing Peer supports for
Parents with Mental Illnesses." Psychiatric Rehabilitation Journal 41(2): 157-159.
Page-Reeves, Janet, et al. 2016. "Addressing Social Determinants of Health in a Clinic Setting: The
WellRx pilot in Albuquerque, New Mexico." The Journal of the American Board of Family Medicine
29(3): 414-418.
Palinkas, Lawrence A., et al. 2015. "Purposeful Sampling for Qualitative Data Collection and Analysis in
Mixed Method Implementation Research." Administration and Policy in Mental Health and Mental
Health Services Research 42(5): 533-544.
Penzenstadler, Louise, et al. 2019. "Advance Statements to Prevent Treatment Disengagement in
Substance Use Disorders." Canadian Journal of Addiction 10(4): 10-18.
Pitt, V., Lowe, D., Hill, S., Prictor, M., Hetrick, S.E. et al. 2013. “Consumer-Providers of Care for Adult
Clients of Statutory Mental Health Services.” Cochrane Database of Systematic Reviews 3(9).
Posner, K., et al 2008. "Columbia-Suicide Severity Rating Scale (C-SSRS)." New York, NY: Columbia
University Medical Center 10.
Preston, Carolyn C., and Andrew M. Colman. 2000. "Optimal Number of Response Categories in Rating
Scales: Reliability, Validity, Discriminating Power, and Respondent Preferences." Acta Psychologica
104(1): 1-15.
Rapp, Charles A., and Richard J. Goscha. 2006. The Strengths Model: Case Management with People
with Psychiatric Disabilities. Oxford University Press, USA.
92
Reeves, Elizabeth. 2015. "A Synthesis of the Literature on Trauma-Informed Care." Issues in Mental
Health Nursing 36(9): 698-709.
Rollnick, Stephen, and Jeff Allison. 2004. "Motivational Interviewing." The Essential Handbook of
Treatment and Prevention of Alcohol Problems: 105-115.
Salzer M, Shear S. 2002. “Identifying Consumer-Provider Benefits in Evaluations of Consumer-
Delivered Services. Psychiatric Rehabilitation Journal 25 (3): 281-288.
Tsai, Jack, Navin Reddy, and Robert A. Rosenheck. 2014. "Client Satisfaction with a New Group-Based
Model of Case Management for Supported Housing Services." Evaluation and Program Planning 43:
118-123.
Wellness Recovery Action Plan (WRAP). 2010. SAMHSA’s National Registry for Evidence-Based
Programs and Practices. Rockville, Md, Substance Abuse and Mental Health Services Administration,
2010. Available at nrepp.samhsa.gov/ViewIntervention.aspx? id=208. Accessed Oct 8, 2020.

93
Appendix A – Sample Crosswalk for Client-Level Data Request
Peer Case Management Basic Client Information Data Elements Review -
Client Records
Comments for Providers
Thank you for your assistance in helping us gather data for the purposes of the Institute of Social
Research's process evaluation of your peer case management program. The Excel sheet on the next page
provides a detailed list of specific variables that we are interested in collecting which will help us evaluate
the process of your peer case management program. We recognize that (a) there are differences across
providers in which types of data are reported, (b) that you may not have collected data for each of the
variables listed or for all clients, and (c) that where you do collect data on these variables, the variables
may be scored or coded differently than the scoring or coding system we have listed on the next page.
This is okay: we recognize these are all possibilities. For the variables that you do have coded differently
than what we report here, however, if you could let us know how your coding or scoring differs for these
variables by making a note in the Excel sheet comment section (e.g., are there different questions added in
or taken out or different time periods for arrest data variables), that would be helpful to us. Additionally,
if you feel as though there are any other variables which you track which may be helpful for us to know
about that are collected at the client-level (e.g., other behavioral health screeners not mentioned here;
more specific question-level data from the quarterly client satisfaction surveys; case management notes;
other data on client criminal justice involvement; drug usage), feel free to include it. We only ask that the
data you provide be de-identified for human subject research purposes (e.g., that you provide a
randomized client ID # or identifier that is consistent across multiple data files and that you do not report
data that could theoretically identify the client, things like names/SSNs/birth-dates). We recognize that
this process of data gathering and cleaning may take some time given that you may have to pull data from
multiple sources within and beyond your EMR systems. Once the data has been compiled, if you could
shoot an email to Alex Severson @ [email protected] to let us know the data is ready, we would be
happy to set up a time to come pick it up in person as we have to follow, due to IRB and university
regulations, a specific protocol for data collection where we have to physically pick up the data at each
provider location using a thumbnail. Please feel free to reach out to Alex Severson if you need any
clarification on this process or any of the variables listed on the next sheet, and thank you again for your
assistance!
Labeling a data element that is not collected: If a data element is not currently collected by the provider,
write 'Not Collected'. For example, if the provider is not collecting Substance Abuse Diagnosis on any of
its population, write 'Not Collected.'
Labeling a data element that is collected only for certain population: If a data element is not collected for
all served population, please provide a brief description for whom the information is not collected. For
example, if the provider is not collecting outcome data (employment status) for all non-SMI population
who receive services, state this in the comment column of the crosswalk.

94
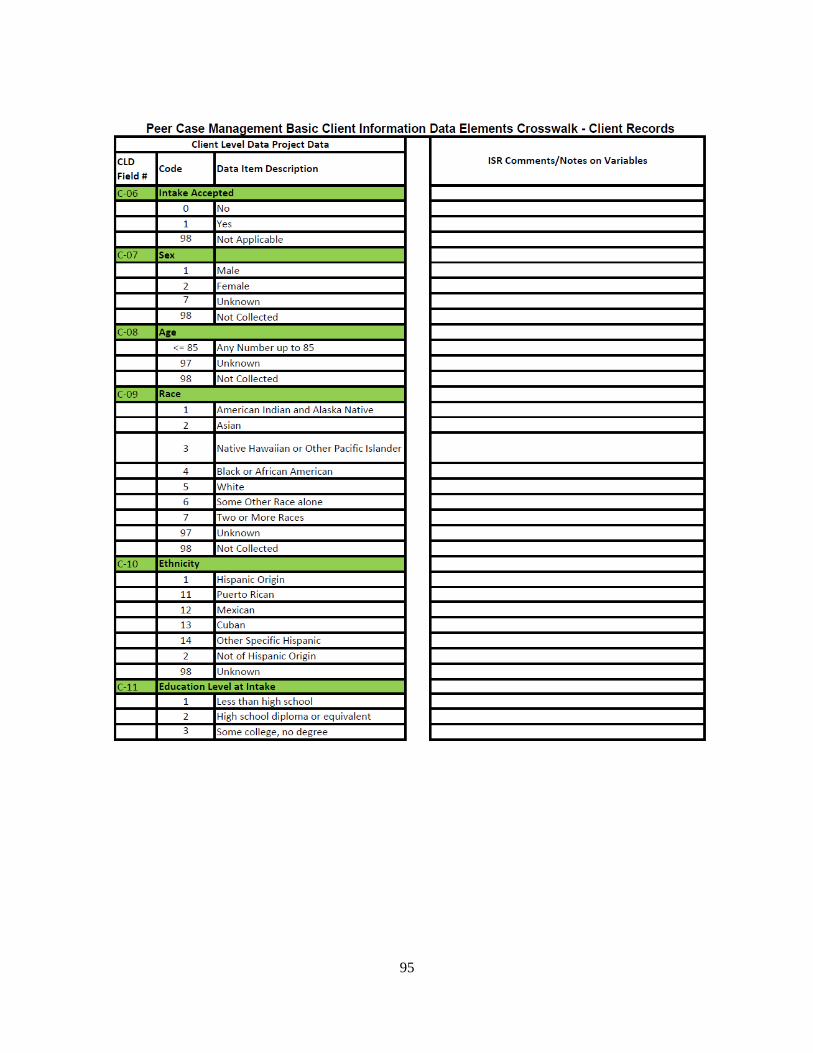
95

96

97

98

99
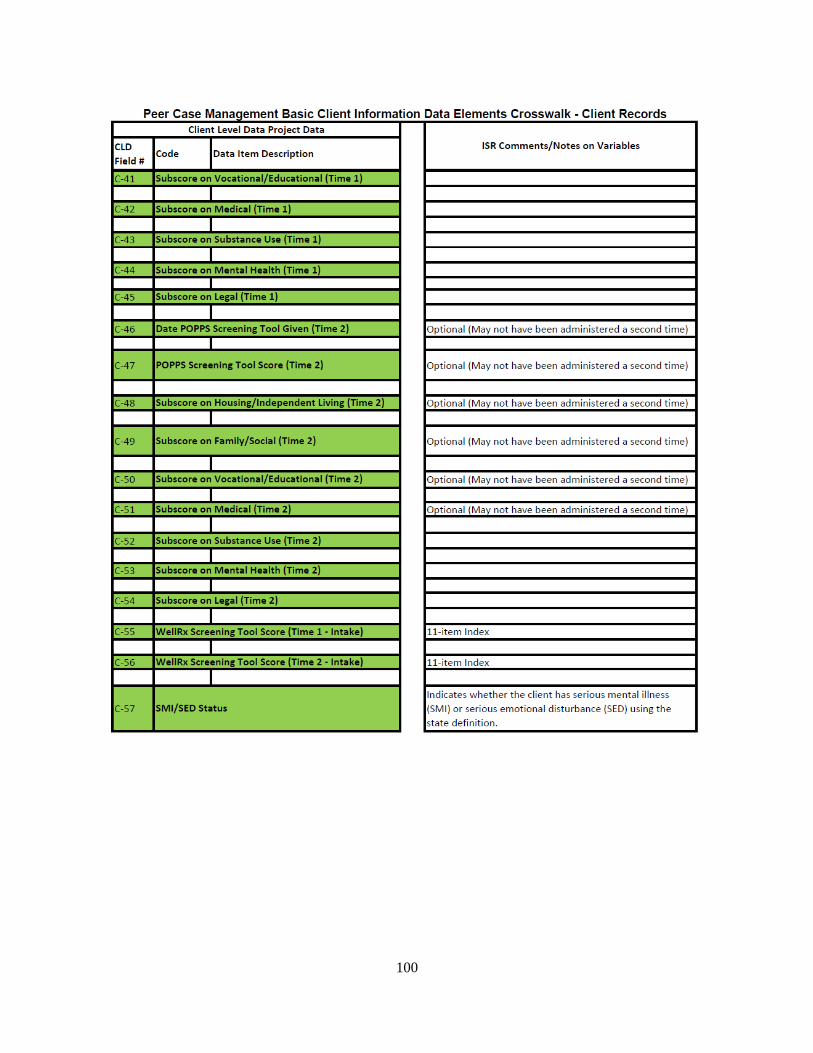
100

101
Appendix B – BHI Interview Guide
BHI Provider Interview Guide (Peer Case Management)
General Interviewer Instructions
Administrative Information (Prefilled by Interviewer)
1. Interview Date:
2. ISR Interviewer:
3. BHI Program Name:
4. BHI Program Provider (if more than one provider):
5. Interviewee ID #:
Introduction
Before we begin, do you have any questions about the project or the interview?
Thank you for participating in our research. Just to let you know, this interview should take approximately
75 minutes to complete depending on the length of your answers. First, I need to ask a few administrative
questions.
6. Current Job Title: Click or tap here to enter text.
7. What is the highest level of education you have completed?
High School/GED = 12
Instructions and guidance for interviewers are in italics. You should not skip any questions or sections unless
directed to by the instructions. If the interviewee declines to answer any questions, please note this. Some
questions have a line to record a numeric answer. Please use this instead of circling, x’ing or checking the
appropriate response.
• Remember to speak slowly and remain accessible for questions.
• Remind participant that all answers are confidential and they can skip any question they are not
comfortable answering.
• At the end, review the interview to make sure you did not miss any relevant questions.
• If the participant is a former employee of the provider, please note “Former on the “Current Job
Title” line and change all relevant language to past tense.
• The topics have separate headings. Do not read the headings as part of the interview: they are for
your benefit.
• Be sure to read through the entire guide before beginning the interview; there are instructions at the
end for interviewer observations.
Text in Bold is meant to be read to the interviewee
Text in Bolded Italics notes skip patterns
Text in Italics is instructions for the interviewer
If there is a project specific and/or provider specific addendum, please make sure you have a copy.
102
8. Please tell me about any certifications and/or licenses you have that are relevant to Peer Case
Management3:
Click or tap here to enter text.
9. How many total years of work experience in this field do you have? [Answer should be converted to years
and months]
Choose an item.
10. How long have you worked for this program?
Choose an item.
11. Are you employed?
☐Full-time
☐Part-time
☐Other [Please specify]: ________________________________________
12. About how many hours per week do you work? Click or tap here to enter text.
13. About how many hours per week do you work on Click or tap here to enter text.
14. In a few brief sentences, describe what you do in your role as a [Insert answer from Q6 above].
Click or tap here to enter text.
Program Information
Now I’m going to ask you a few questions about your [Peer Case Management] program.
15. In your own words, what are the main goals of this program?
Click or tap here to enter text.
16. What do you feel is the most accurate measure of this program’s success?
Click or tap here to enter text.
17. How successful or unsuccessful do you feel this program is based on that measure?
Click or tap here to enter text.
18. In your view, does this program use evidenced-based practices and/or curricula? [Probe: Some examples
mentioned in your proposal are Motivational Interviewing or Strengths-Based Case Management.] [If Yes,
proceed to Q 19. If No or Don’t Know, Proceed to Q 20].
☐Yes
☐No
☐Don’t Know
19. Could you describe, in specific detail, what your program’s evidence-based practices are and how they are
used in practice?
Click or tap here to enter text.
3 Program name = Peer-on-Peer Supportive Services (POPPS) or Peer Case Management (PCM) depending on the provider.

103
20. Next, I would like for you to tell me how you think about the concept of peerness in the context of your
[Peer Case Management] program. In your view, what does peerness mean?
Click or tap here to enter text.
21. Does Centro Sávila have any official criteria by which peerness is defined when selecting potential peer
case managers or peer support specialists? [If Yes, proceed to Q 22. If No or Don’t Know, Proceed to Q
23].
☐Yes
☐No
☐Don’t Know
22. What are the official criteria for defining peerness?
Click or tap here to enter text.
Outreach
Next, I have a few questions about how potential clients and other providers learn about your [insert program
name here] program.
23. Are you involved in outreach for this program? Yes ____ No ____ [If Yes, proceed to Q 24; If No, skip
to Incoming Referrals section.].
☐Yes
☐No
24. How do potential clients or other agencies learn about your program? [Probe: Where do you go to let
people know about your services?]
Click or tap here to enter text.
Incoming Referrals
Next, I have a few questions about incoming referrals to the program.
25. Is handling referrals one of your job functions? [If Yes, proceed to Qs 26-28. If No, skip to the
Screening section Q 29.]
☐Yes
☐No
26. Briefly describe how potential clients are referred to this program. [Probe: phone calls, word of mouth,
from family, criminal justice system [ask for specifics – i.e. courts, police, jail, probation, pre-trial], from
within your agency [ask some detail about this], are there formalized procedures or paperwork for this?]
Click or tap here to enter text.
27. Which of those is the best source of referrals? [Probe: Is there a top three? What about other providers
within the BHI funding initiative?] Click or tap here to enter text.
28. Is there a source that you wish you received referrals from? Click or tap here to enter text.

104
Next, I have a few questions about how individuals are screened for eligibility in your program.
29. Is screening a person for program eligibility one of your job functions? [If Yes, proceed to Q 30. If No,
then skip to General Intake section.].
☐Yes
☐No
30. What are the eligibility criteria for this program? [Be sure to ask for both inclusion and exclusion criteria.] Click or tap here to enter text.
31. Could you briefly describe how the screening works? [Probe: How are those criteria determined?] Click
or tap here to enter text.
32. Share with us your impressions of the initial screening process thus far. How favorably or unfavorably, in
your view, has it been received by your clients?
Click or tap here to enter text.
Next, I have a few questions about what happens to an individual once they are screened and deemed eligible
for the program.
33. Is intake one of your job functions? [If Yes, proceed to Q34. If No, skip to the Assessments section.]
☐Yes
☐No
34. Would you please describe how your intake process works? [Prompt: Is there anything else that is part of
the process?]
Click or tap here to enter text.
Assessments
Now I’m going to ask you a few questions about the assessment process for the program and any assessment
instruments or tools you might use.
35. Is giving or facilitating assessments one of your job functions? [If Yes, Proceed to Q 36. If No, skip to
Service Delivery section].
☐Yes
☐No
36. When you have a new client, what specific assessments are administered at or near the time of intake? [List
each assessment in the table below. If this interview is audio recorded, make sure to write down the list so
you can ask the follow-up questions for each assessment.]
Click or tap here to enter text.
For each assessment, ask the following questions to complete the table information.
37. At what other times is [insert assessment name] administered?
38. How is the information from [insert assessment name] used?
Assessment Name At Intake Additional
Time points (#)
At
Discharge
Use

105
39. If you are familiar, could you discuss, in some detail, how you or the staff at [insert provider name]
selected these specific assessment tools over other assessment tools? Click or tap here to enter text.
40. If you are familiar, could you discuss, in some detail, why you or the staff at [insert provider name]
selected these specific assessment tools over other assessment tools? Click or tap here to enter text.
Service Delivery
Next, we would like to ask a few questions about the specific services delivered as part of your [insert program
name here] program. [If Q6 = Peer Case Manager or Peer Support Specialist, proceed with Q41 – Q 63. If Q6 =!
Peer Case Manager or Peer Support Specialist, skip to Q64].
41. How many clients do you typically meet with each week?
Click or tap here to enter text.
42. Do you carry out home visits with your clients? [If Yes, Proceed to Q 42. If No, Skip to Q 43].
☐Yes
☐No
43. For a typical week and for a typical client, how many home visits would you say you conduct? Click or
tap here to enter text.
44. Do you provide virtual case management services – for example, over platforms such as Zoom, Facebook,
or Skype - to your clients? [If Yes, Proceed to Q 45. If No, Skip to Q 46].
☐Yes
☐No
45. For a typical week and for a typical client, how many virtual meetings with your clients would you say you
conduct? Click or tap here to enter text.

106
46. Could you describe, in some detail, how exactly individual service plans are constructed with
each client? [Probe: How are competing client needs prioritized?]
Click or tap here to enter text.
47. In general, could you name specifically which types of services you are most likely to refer
clients to?
Click or tap here to enter text.
48. In general, could you name specifically which types of services are you least likely to refer
clients to? Click or tap here to enter text.
49. Have the types of services you have referred clients to evolved over time? If so, how?
Click or tap here to enter text.
50. How are referrals monitored or tracked?
Click or tap here to enter text.
51. Could you describe, in some detail, what it means for a client to progress through their
customized service plan?
Click or tap here to enter text.
52. Could you describe what difficulties, if any, clients commonly encounter as they progress through their
customized service plans?
Click or tap here to enter text.
53. How are clients informed about community resources including education, employment
assistance, and housing-related services?
Click or tap here to enter text.
54. How frequently would you say you contact your clients?
Click or tap here to enter text.
55. How frequently would you say your clients contact you?
Click or tap here to enter text.
56. How much time would you say you spend communicating with each client per week?
Click or tap here to enter text.
57. On a scale of 1-7 where a 1 indicates Very Dissimilar, a 4 indicates Neither Dissimilar nor
Similar, and a 7 indicates Very Similar, in general, how similar would you say you are – in terms
of your background and lived experiences - to the typical client you case-manage?
☐Very Dissimilar (1)

107
☐ Dissimilar (2)
☐Somewhat Dissimilar (3)
☐Neither Dissimilar nor Similar (4)
☐Somewhat Similar (5)
☐Similar (6)
☐Very Similar (7)
58. Why would you rate the similarity this way?
Click or tap here to enter text.
59. On a scale of 1-7 where a 1 indicates Very Unsatisfied, a 4 indicates Neither Unsatisfied nor
Satisfied, and a 7 indicates Very Satisfied, in general, how satisfied would you say you are with
the quality of the relationships you have with your clients?
☐Very Unsatisfied (1)
☐Unsatisfied (2)
☐Somewhat Unsatisfied (3)
☐Neither Unsatisfied nor Satisfied (4)
☐Somewhat Satisfied (5)
☐Satisfied (6)
☐Very Satisfied (7)
60. Why would you rate the quality of your client relationships this way?
Click or tap here to enter text.
61. Have you encountered any challenges developing relationships with your clients? [If Yes, Proceed to Q 62.
If No, Skip to Q 63].
☐Yes
☐No
62. Could you provide some specific examples of such challenges?
Click or tap here to enter text.
63. How do you build trust with your clients?
Click or tap here to enter text.
64. Could you tell us a little bit more about how specifically you integrate evidence-based practices –
such as Strengths Based Case Management or Motivational Interviewing - into the case
management services you deliver?
Click or tap here to enter text.
65. How are schedules for treatment sessions monitored? Click or tap here to enter text.

108
66. How are appointments, attendance, and reporting compliance monitored and documented, and
who is responsible for this? Click or tap here to enter text.
67. How is participant progress or non-compliance with their service plans reported?
Click or tap here to enter text.
68. In your view, is this information up-to-date?
Click or tap here to enter text.
69. Are any incentives given to program participants for completing different stages of their service
plans? [If Yes, proceed to Q 70. If No, Proceed to Discharge from Program Section.]
☐Yes
☐No
70. What specific incentives have been provided?
Click or tap here to enter text.
71. Why did you decide on this specific set of incentives?
Click or tap here to enter text.
72. What are the goals of these specific incentives?
Click or tap here to enter text.
73. In your view, do you view think that these incentives are effective or ineffective?
Click or tap here to enter text.
Discharge from Program
Next, we have a few questions about how clients are discharged from your program.
74. Would you describe the different ways a person leaves your program?
Click or tap here to enter text.
75. What does it mean for a person to successfully discharge from your program?
Click or tap here to enter text.
76. Under what circumstances can a participant be removed from the program?
Click or tap here to enter text.
77. Do you create some sort of discharge or transition plans for your clients? [If No or Don’t Know, skip to
Aftercare/Follow-Up Section].
☐Yes
☐No
☐Don’t Know

109
78. Could you please describe those?
Click or tap here to enter text.
After Care + Follow-Up
I have a few questions about aftercare or follow up with clients.
79. Does your program offer after care or any follow-up for your clients? [If Yes, Proceed to Q 80. If No, skip
to Work Environment and Relationships section.]
☐Yes
☐No
80. What does it entail?
Click or tap here to enter text.
81. What kinds of barriers, if any, are there to providing aftercare for clients?
Click or tap here to enter text.
82. For how long do you offer this service?
Click or tap here to enter text.
Work Environment and Relationships
Finally, I have a few questions about the work environment and relationships at [insert provider name].
83. What’s the general work environment like for employees at [insert provider name] in regard to having the
necessary support to be able to get your job done in the best way possible? [Probe: Some key issues we are
interested in include being included in decision making, having the proper autonomy and authority to make
decisions, having access to the information you need, and having support from management].
Click or tap here to enter text.
84. On a scale of 1 – 7 where 1 indicates Very Unsatisfied, 4 indicates Neither Unsatisfied nor Satisfied, and 7
indicates Very Satisfied, in general, how would you rate the quality of the supervision, management, and
leadership you receive at [insert provider name]?
☐Very Unsatisfied (1)
☐Unsatisfied (2)
☐Somewhat Unsatisfied (3)
☐Neither Unsatisfied nor Satisfied (4)
☐Somewhat Satisfied (5)
☐Satisfied (6)
☐Very Satisfied (7)
85. Why would you rate the quality of the supervision, management, and leadership you receive at [insert
provider name] this way?
Click or tap here to enter text.
86. In your view, has your role as a [Insert Q6 answer here] changed at all since being hired? [If Yes, Proceed
to Q 87. If No, Proceed to Q 88].
☐Yes

110
☐No
87. In what specific ways has your role changed since being hired?
Click or tap here to enter text. 88. [Only Ask if Q6 =Peer Case Manager or Peer Support Specialist]: On a scale of 1 – 7 where a value of 1
indicates Very Useless, 4 indicates Neither Useless nor Useful, and 7 indicates Very Useful, in general,
how useful would you say your training certification has been for your job?
☐Very Useless (1)
☐Useless (2)
☐Somewhat Useless (3)
☐Neither Useless nor Useful (4)
☐Somewhat Useful (5)
☐Useful (6)
☐Very Useful (7)
89. [Only Ask if Q6 =Peer Case Manager or Peer Support Specialist]: Do you have opportunities to update
your peer case management training or certification? If you do, what does these look like?
☐Yes
☐No
Click or tap here to enter text.
90. How many times each month do you meet with other program staff at [insert provider name here]
to discuss [insert program name here]? Click or tap here to enter text.
91. What generally happens when program staff meetings occur at [insert provider name here]? Click
or tap here to enter text.
92. On a scale of 1 – 7 where a value of 1 indicates Very Unsatisfactory, 4 indicates Neither
Unsatisfactory nor Satisfactory, and 7 indicates Very Satisfactory, in general, how would you
evaluate the quality of the relationships between peer case managers and other staff at [insert
provider name here]?
☐Very Unsatisfactory (1)
☐Unsatisfactory (2)
☐Somewhat Unsatisfactory (3)
☐Neither Unsatisfactory nor Satisfactory (4)
☐Somewhat Satisfactory (5)
☐Satisfactory (6)
☐Very Satisfactory (7)
93. Why would you evaluate the relationship that way?

111
______________________________________________________________________________________
______________________________________________________________________________________
______________________________________________________________________________________
__________________________________________
94. How true do you feel the following statements are about you at work during the past two weeks? [Not at all
True, Somewhat True, Moderately True, Very True, Completely True]
a. I feel happy at work
Select Participant Answer Here
b. I feel worthwhile at work
Select Participant Answer Here
c. My work is satisfying to me
Select Participant Answer Here
d. I feel in control when dealing with difficult problems at work
Select Participant Answer Here
e. My work is meaningful to me
Select Participant Answer Here
f. I’m contributing professionally in the ways I value most
Select Participant Answer Here
Conclude the Interview
112
This concludes the interview questions; thank you for your time. Is there anything I missed or that you
would like to add?
Interviewer Notes: Observations made by interviewer
• How was the interview conducted? (ex: Skype video, audio only, telephone)
• Did participant seem comfortable answering questions in this format? Were there any positive or negative
comments you could note here?
• Did you experience any technical difficulties during this interview? If so, do you think these had any impact
on data quality?
• Were there any other distractions during the interview? If so, do you think these had any impact on data
quality?
• Did participant have questions about interview, how the information will be used, or other questions? If so,
what were their inquiries?
• Did participant have any issues with interview or questions? If so, what were their concerns?
Interviewer Notes:

113
Appendix C – Provider Screening Tools

114

115

116