Berlin, 27 May 2020€¦ · This strategy aims at delivering the solution to one of the prevailing...
25
1 Berlin, 27 May 2020
Transcript of Berlin, 27 May 2020€¦ · This strategy aims at delivering the solution to one of the prevailing...
1
Berlin, 27 May 2020
2
Letter to the Shareholders .............................................. 3
YOC at a Glance ................................................................. 4
Range of Services and Products ................................... 5
Interim Consolidated Management Report .............. 8
Interim Consolidated Financial Statements ........... 12
Notes to the Consolidated Financial Statements 16
YOC Locations .................................................................. 22
Financial Calendar 2020 .............................................. 23
Imprint ………………………………………………………………...….. 24
3
Dear Shareholders,
Since 2001, the YOC Group has been one of the leading independent providers of mobile advertising in Europe.
We have set ourselves the goal of creating an optimal digital advertising experience for advertisers, digital media content providers and mobile Internet users.
That is why we develop attention-grabbing digital advertising products that achieve sustained brand awareness and reach, appeal and inspire people. And this is why we have designed and developed VIS.X®, our proprietary trading platform.
VIS.X® is a next-generation programmatic supply-side platform that enables the efficient media trade of visible and attention-grabbing advertising products.
Since 2018, VIS.X® has enabled our customers to purchase high-quality advertising inventory in combination with YOC’s advertising products around the clock in an automated and therefore scalable manner in accordance with their advertising strategy.
At the same time VIS.X® helps our publisher partners to better monetize their media inventory.
The times during which this interim report is prepared are turbulent, highly challenging and influencing the lives of people around the world. The corona epidemic was an unforeseen event for the global community of states, but also for the world economy. The challenges are as varied as they are enormous.
No one, whether individual, institution or economic entity, remains unaffected. It is precisely the economic consequences of international “shutdown measures” that have a strong impact and threaten entire macroeconomies such as individual companies or business models.
We are also affected by the effects of the spread of the coronavirus. After two successful first months of the 2020 financial year, we already had to accept cancellations and declines in bookings in March.
The current second quarter of 2020 is likely to be particularly affected, before we should see increased, profitable growth again in the second half of 2020.
To limit the overall impact of the Corana crisis, we have consistently introduced appropriate countermeasures.
To anticipate: We will not only overcome this crisis, but will continue to grow stronger. In the last two years, we have been able to significantly accelerate our strategic thrust and expand our programmatic business on the basis of our proprietary technology. The automated trading of our mobile advertising products is now of particular help to us, as it is much less affected by the effects of the corona crisis than traditional insertion order.
We are pleased to be able to report an increase in turnover for the YOC Group of around 18 % in the first three months of the current financial year 2020 to total turnover of EUR 3.4 million compared to the same period of the previous year (Q1/2019: EUR 2.9 million).
Increased trading on our VIS.X® technology platform will help us to increase the company's profitability: operating earnings before interest, taxes, depreciation and amortisation (EBITDA) improved by 130 % or EUR 0.12 million to EUR 0.03 million (Q1/2019: EUR -0.1 million).
Thus, the steady improvement in earnings of previous years continues in the first quarter of 2020.
Dear shareholders, despite the difficulties we are currently facing in the context of the corona crisis, we are positive about the future. We are sticking to our long-term strategy and continue to invest in innovations.
On the basis of our unique VIS.X® technology platform in combination with our self-developed advertising formats and our many years of know-how, we expect to emerge from the corona crisis with a strengthened competitive position.
I would like to thank you very much for the trust you have placed in us and look forward to continuing our cooperation with you.
All the best to you and your families. Stay healthy and safe.
Kind regards,
Dirk-Hilmar Kraus
CEO

4
When using rounded amounts and key figures, differences may occur due to commercial rounding.
The previous year’s figures were adjusted due to the application of IFRS 5 Non-current Assets Held for Sale and Discontinued Operations.
1) Based on permanent employees on full-time
2) as of 31 December 2019
3.377 2.871 506 18
2.211 1.584 627 40
1.166 1.287 -121 -9
38,6 38,2 0,4 PP 1
3.508 3.000 508 17
27 -91 118 130
0,8 -3,0 3,8 PP n.a
-233 -373 140 38
-0,08 -0,10 0,02 20
-0,08 -0,10 0,02 20
54 42 12 29
53 39 14 36
63 68 -5 -7
65 71 -6 -8
5.514 6.4722) -958 -15
-91 -77 -14 -18
Total Revenue
National
International
Gross profit margin (in %)
Total output
EBITDA
EBITDA margin (in %)
Earnings after tax
Earnings per share (diluted in EUR)
Earnings per share (basic in EUR)
Cash flow from operative activities
Average number of employees1)
Number of employees at end of March
Total revenue per employee (in kEUR)
Total output per employee (in kEUR)
Total assets
5
With its growth of expertise since 2001, YOC develops innovative digital advertising formats, making them available through its marketplace for both traditional and automated real-time trade (programmatic advertising).
With its cutting-edge technology, developed in-house, along with a tremendous coverage, the company operates at the forefront of the advertising market. YOC’s proprietary products create positive brand awareness and contribute substantially to changing the advertising market.
This way advertising clients reach their goals, while the self-developed, unobtrusive formats improve the user experience.
Our long-standing experience, transparent processes, our software and excellent service create trust in YOC and convince both customers and partners.
Many of the world’s 500 largest advertisers use YOC technology. Our customers include well-known brands such as Deutsche Telekom, Audi, McDonald’s, L’Oréal, Volkswagen, Mercedes-Benz, Netflix, Coca-Cola, Samsung and Sky.
Our around 400 integrated well-selected international partners with a direct global coverage of more than 200 million monthly active users (MAU) include premium publishers such as Kurier, Kronenzeitung, Bunte.de, Der Tagesspiegel, Grupa RMF or Eurosport.
They trust in YOC due to our technological and market-specific skills as well as a long-standing profitable partnership.
The company positions itself as an ad technology provider with its proprietary supply side platform VIS.X® and with mobile advertising products and solutions in the core markets of Germany, Austria, Spain and Poland.
YOC develops its own scalable technological platform, delivering new products through all sales channels in demand, especially in the strongly growing and highly automated environment of programmatic advertising.
As a result of the modified technological framework parameters, YOC has over the past years assumed a stronger position in the market for digital advertising and undergone decisive changes.
To this end, the company has internalised important elements of the value chain in mobile advertising.
This includes the development of proprietary, high-performing advertising products that on the one hand unfold a strong advertising effect for advertisers and on the other do not intrude on the internet user’s consumption of media content.
What is more, the company set up a comprehensive system landscape over the past years, consisting of self-developed, innovative software and prominent solutions by well-known external providers like Google, SAP or Salesforce. On this basis, YOC is able to serve all relevant sales channels in a scalable manner.
The mix of a modern and scalable supply-side platform, innovative advertising products and a high-performing technological infrastructure is the striking competitive feature by which YOC clearly stands out from other market participants.
VIS.X®: YOC’S SUPPLY-SIDE PLATFORM (SSP)
The supply side platform VIS.X®, which was introduced at the beginning of 2018, was expanded in the financial year 2019 and has established itself with a significant share of the company’s revenues.
This strategy aims at delivering the solution to one of the prevailing problems of the digital advertising market: satisfying the demand for the programmatic purchase of highly effective advertising formats.
Most of the platforms available in the market concen-trate on standard products, so that the product lines developed by YOC in-house - as well as eye-catching advertising formats from several third-party providers – were not available for programmatic booking.
With VIS.X®, YOC has established a new programmatic trading venue for international, brand-safe inventory by premium publishers and is positioning itself in the market as a provider of high-quality advertising technology.
The platform combines the publishers’ advertising inventory with YOC’s own products via private marketplaces in an integral auction, thereby offering the advertisers all relevant products in one transaction.
In line with the buyers’ targeting data and individual campaign goals, YOC provides the appropriate auctioning mechanisms for an efficient media purchase.
The purchasing process for advertisers, media agencies as well as their trading desks does not require further technological adaptations to the existing infrastructure.
Already available advertising media are transformed into YOC’s in-house, promotionally effective products and delivered through VIS.X® in real time.
6
The technology developed by YOC thereby unfolds the full potential of programmatic advertising, making VIS.X® the ideal platform for effective digital advertising.
By integrating several hundred publishers and due to the high performance of VIS.X®, the trading desks are offered high scalability in real-time as well as international premium inventory for their media purchase.
The full inventory of one publisher is offered to all buyers at the same time. This ensures ideal monetising for the publishing partner. At the same time, the platform offers YOC’s advertising client’s premium inventory, high transparency as well as brand safety, leading to better advertising results. Hence, the use of VIS.X® provides the publishers, trading desks or advertisers with a sustainable competitive edge.
The company benefits from its independence from third-party suppliers, positioning itself as a strong technology provider with a scalable business model. This constantly drives the company to further develop the in-house supply-side platform (SSP) VIS.X® and thereby increase the platform’s performance capacity.
VIS.X® is registered and protected as a European trademark by the European Patent Office since 2018.
PRODUCT LINES
The company successfully commercialises its product lines YOC Understitial Ad®, YOC Inline Video Ad, YOC Mystery Ad®, YOC Mystery Scroller® as well as YOC Ads Plus.
The aim of these products is to spread the advertising messages of advertisers among the end users in an effective and purposeful way.
The use of different methods of display, interactive elements as well as unobtrusive operating principles leads to a better acceptance with users.
Adding to this, other than traditional standard formats, the YOC products allow for enhanced methods of measuring different interaction and retrieval statistics. This is how, on the one hand, they contribute substan-tially to the measurability of marketing success for advertisers, while on the other hand enhancing the potential for optimising the advertising effect with the end users.
In particular those product variants with video compo-nents offer advertisers the possibility to advertise their brands and products audio-visually on mobile devices in a comprehensive and highly scalable manner.
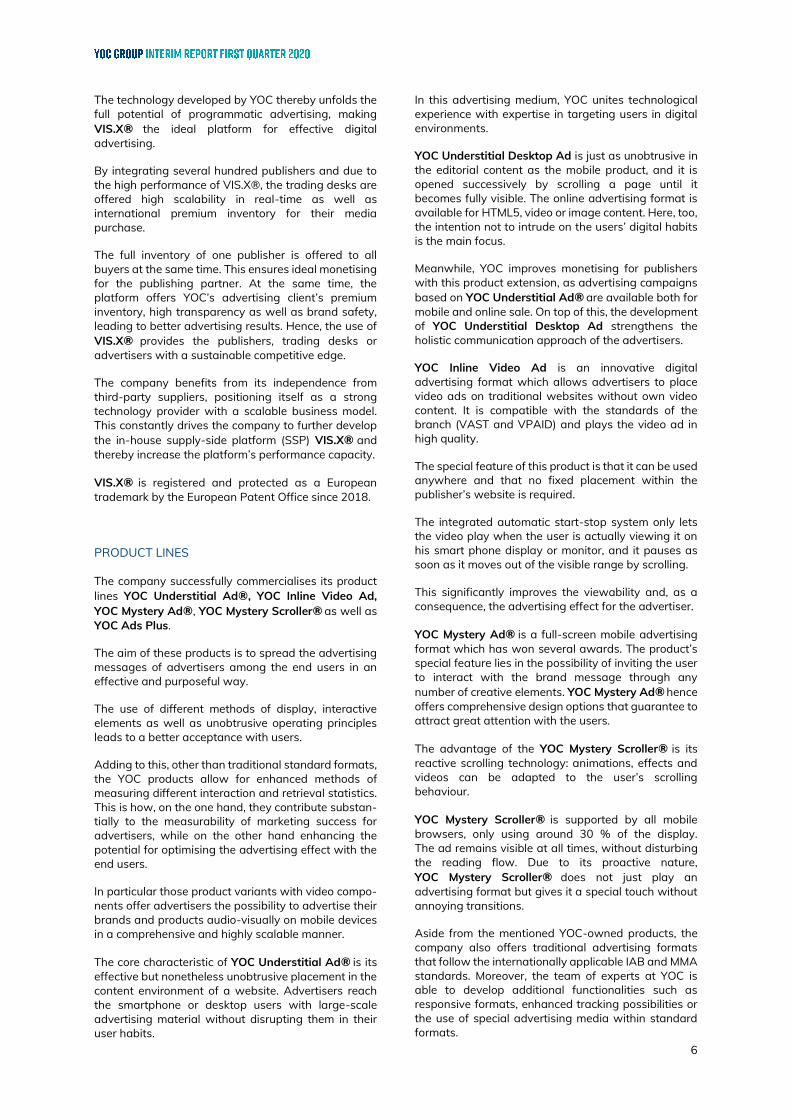
The core characteristic of YOC Understitial Ad® is its effective but nonetheless unobtrusive placement in the content environment of a website. Advertisers reach the smartphone or desktop users with large-scale advertising material without disrupting them in their user habits.
In this advertising medium, YOC unites technological experience with expertise in targeting users in digital environments.
YOC Understitial Desktop Ad is just as unobtrusive in the editorial content as the mobile product, and it is opened successively by scrolling a page until it becomes fully visible. The online advertising format is available for HTML5, video or image content. Here, too, the intention not to intrude on the users’ digital habits is the main focus.
Meanwhile, YOC improves monetising for publishers with this product extension, as advertising campaigns based on YOC Understitial Ad® are available both for mobile and online sale. On top of this, the development of YOC Understitial Desktop Ad strengthens the holistic communication approach of the advertisers.
YOC Inline Video Ad is an innovative digital advertising format which allows advertisers to place video ads on traditional websites without own video content. It is compatible with the standards of the branch (VAST and VPAID) and plays the video ad in high quality.
The special feature of this product is that it can be used anywhere and that no fixed placement within the publisher’s website is required.
The integrated automatic start-stop system only lets the video play when the user is actually viewing it on his smart phone display or monitor, and it pauses as soon as it moves out of the visible range by scrolling.
This significantly improves the viewability and, as a consequence, the advertising effect for the advertiser.
YOC Mystery Ad® is a full-screen mobile advertising format which has won several awards. The product’s special feature lies in the possibility of inviting the user to interact with the brand message through any number of creative elements. YOC Mystery Ad® hence offers comprehensive design options that guarantee to attract great attention with the users.
The advantage of the YOC Mystery Scroller® is its reactive scrolling technology: animations, effects and videos can be adapted to the user’s scrolling behaviour.
YOC Mystery Scroller® is supported by all mobile browsers, only using around 30 % of the display. The ad remains visible at all times, without disturbing the reading flow. Due to its proactive nature, YOC Mystery Scroller® does not just play an advertising format but gives it a special touch without annoying transitions.
Aside from the mentioned YOC-owned products, the company also offers traditional advertising formats that follow the internationally applicable IAB and MMA standards. Moreover, the team of experts at YOC is able to develop additional functionalities such as responsive formats, enhanced tracking possibilities or the use of special advertising media within standard formats.
7
Measuring viewability has advanced to becoming a decisive factor for managing, optimising and analysing a campaign. In financial year 2019, YOC hence further extended its technological infrastructure for measuring and analysing the viewability of mobile ad formats.
The YOC products follow the standards of the market (IAB and MRC) and thereby offer advertisers internationally comparable performance indicators for the effectiveness of their digital advertising.
As a consequence, YOC provides alternative payment models for its advertising clients based on the collected viewability data. A campaign is only charged for when for example a video has been played in full length in the user’s field of vision.
All YOC product lines, with the exception of the YOC Inline Video Ad, have been protected and registered with the European Patent Office for brand safety reasons.
EXPANSION OF THE PRODUCT PORTFOLIO TO INCLUDE YOC ADS PLUS
YOC Ads Plus are creative extensions of our proprietary high-impact products. We keep pursuing our mission of offering a better advertising experience for everyone.
The new product line includes a variety of formats, which can be individually adapted to the customer’s wishes.
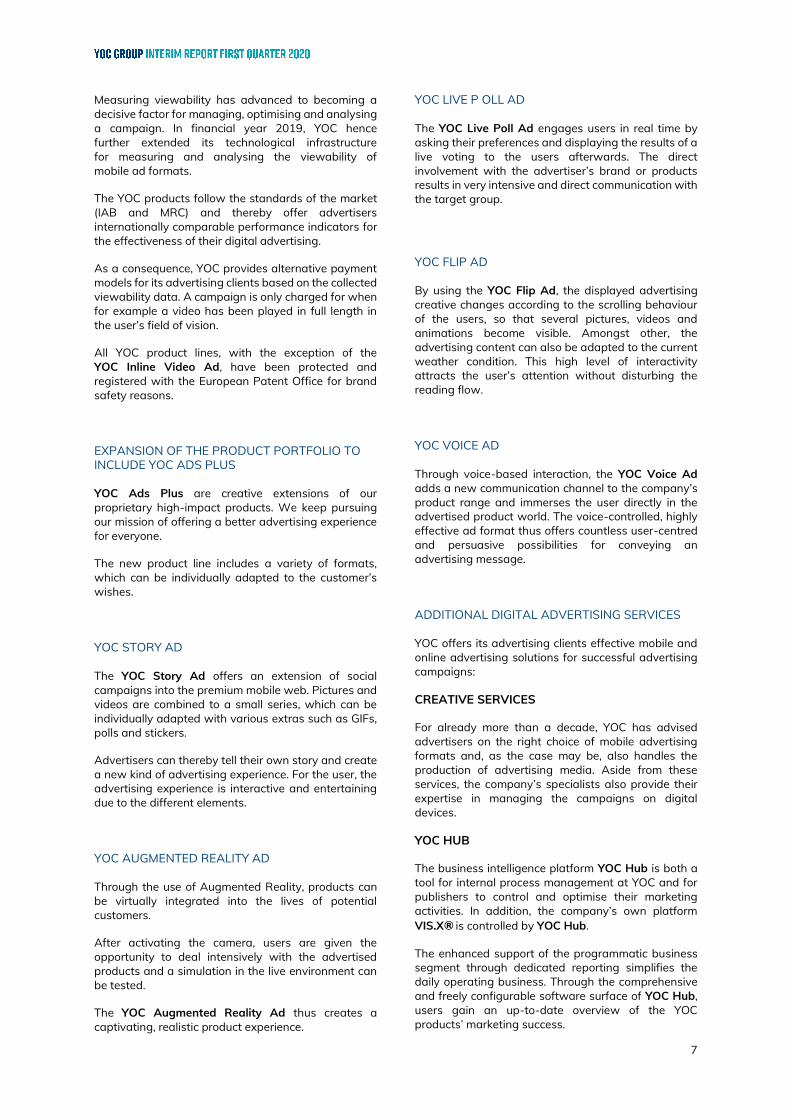
YOC STORY AD
The YOC Story Ad offers an extension of social campaigns into the premium mobile web. Pictures and videos are combined to a small series, which can be individually adapted with various extras such as GIFs, polls and stickers.
Advertisers can thereby tell their own story and create a new kind of advertising experience. For the user, the advertising experience is interactive and entertaining due to the different elements.
YOC AUGMENTED REALITY AD
Through the use of Augmented Reality, products can be virtually integrated into the lives of potential customers.
After activating the camera, users are given the opportunity to deal intensively with the advertised products and a simulation in the live environment can be tested.
The YOC Augmented Reality Ad thus creates a captivating, realistic product experience.
YOC LIVE P OLL AD
The YOC Live Poll Ad engages users in real time by asking their preferences and displaying the results of a live voting to the users afterwards. The direct involvement with the advertiser’s brand or products results in very intensive and direct communication with the target group.
YOC FLIP AD
By using the YOC Flip Ad, the displayed advertising creative changes according to the scrolling behaviour of the users, so that several pictures, videos and animations become visible. Amongst other, the advertising content can also be adapted to the current weather condition. This high level of interactivity attracts the user’s attention without disturbing the reading flow.
YOC VOICE AD
Through voice-based interaction, the YOC Voice Ad adds a new communication channel to the company’s product range and immerses the user directly in the advertised product world. The voice-controlled, highly effective ad format thus offers countless user-centred and persuasive possibilities for conveying an advertising message.
ADDITIONAL DIGITAL ADVERTISING SERVICES
YOC offers its advertising clients effective mobile and online advertising solutions for successful advertising campaigns:
CREATIVE SERVICES
For already more than a decade, YOC has advised advertisers on the right choice of mobile advertising formats and, as the case may be, also handles the production of advertising media. Aside from these services, the company’s specialists also provide their expertise in managing the campaigns on digital devices.
YOC HUB
The business intelligence platform YOC Hub is both a tool for internal process management at YOC and for publishers to control and optimise their marketing activities. In addition, the company’s own platform VIS.X® is controlled by YOC Hub.
The enhanced support of the programmatic business segment through dedicated reporting simplifies the daily operating business. Through the comprehensive and freely configurable software surface of YOC Hub, users gain an up-to-date overview of the YOC products’ marketing success.

8
KEY FIGURES
Due to the closure of the UK site, the discontinued operation has to be presented separately in accordance with the requirements of IFRS 5 and the previous year's figures adjusted to enhance comparability.
In the first three months of the current fiscal year 2020, the company increased its total revenues at group level by EUR 3.4 million (Q1/2019: EUR 2.9 million), not including the discontinued operations in the British market. This corresponds to an increase of around 18 % compared to the same period of the previous year.
Revenues on the national market increased by 40 % compared to the same period of the previous year.
Revenues from international business activities declined slightly by 9 % in the first three months of 2020. This was due to the fact that the sales targets in the Spanish market could not be achieved. Appropriate adjustments to the cost structure were made. However, a stabilisation is expected for the year as a whole. In contrast, sales revenues in Austria and Poland increased compared to the same period of the previous year.
In particular, the proprietary VIS.X® technology platform launched on the market in fiscal year 2018 contributed to the revenue development in the current fiscal year 2020 with continuously growing revenue shares and achieved a revenue growth of 146 % compared to the first quarter of 2019.
The trade platform VIS.X® allows for the program-matic (automated) trade of highly effective advertising products by YOC, positioning the company as a provider of high-quality advertising technology.
Parallel to this development, the proportion of sales accounted for by Ad Tech's own products increased further, so that the company's gross profit margin remained stable at 38.6 % in the first three months of 2020 (Q1/2019: 38.2 %).
Operating earnings before interest, taxes, depreciation and amortization (EBITDA) improved by EUR 0.12 million (+130 %) year-on-year to EUR 0.03 million (Q1/2019: EUR -0.1 million).
Thus, the improvement in profitability of previous years continued in the first three months of 2020.
The operating cash flow in the reporting period came to EUR -0.1 million (Q1/2019: EUR -0.1 million). In addition to earnings after taxes, this resulted from the business-related change in working capital.
The following comments on the profit situation do not include the activities terminated in financial year 2019 and the subsidiary YOC Mobile Advertising Ltd, which was liquidated on 31 March 2020. The profit component of the British subsidiary is shown under discontinued operations due to the separate presentation in accordance with IFRS 5.
The previous year's figures have been adjusted accordingly to improve comparability.
REVENUE TREND AND OVERALL PERFORMANCE
During the first three months of the current 2020 financial year, the YOC Group increased total revenues by around 18 % year-on-year to EUR 3.4 million (Q1/2019: EUR 2.9 million).
At EUR 3.5 million, the Group's total output was EUR 0.5 million higher than in the previous year (Q1/2019: EUR 3.0 million).
GROSS PROFIT
Due to the significantly increasing revenue contribution of the technological platform VIS.X®, we achieved to improve the gross profit margin to 38.6 % (Q1/2019: 38.2 %) in the reporting period.
In the context of the development over the past years, which was characterised by the increasing focus on technology as well as YOC’s proprietary advertising product lines, the gross margin improved by ten per cent (2013: 29 %).
The further increase in the gross profit ratio is an important element in the sustained positive development of the company.
9
PERSONNEL EXPENSES AND STAFF DEVELOPMENT
Compared to the previous year, the average number of employees (excluding the Management Board) in the YOC Group rose to 54 (Q1/2019: 42 employees).
On 31 March 2020, the YOC Group had 53 permanent employees. This represents an increase of 36 % over the previous year (Q1/2019: 39 permanent employees).
At EUR 1.1 million, personnel expenses were around 15 % higher than in the same period of the previous year (Q1/2019: EUR 0.9 million).
OTHER OPERATING EXPENSES
During the first three months of the current fiscal year 2020, other operating expenses of total EUR 0.34 million on the same the level of the previous year (Q1/2019: EUR 0.39 million).
The cost control measures implemented in recent years continue to have an impact.
EBITDA
Operating earnings before interest, taxes, depreciation and amortization (EBITDA) improved by EUR 0.12 million (+130 %) year-on-year to EUR 0.03 million (Q1/2019: EUR -0.1 million). Thus, the improvement in profitability of previous years continued in the first three months of financial year 2020.
NET INCOME
The post-tax result (including corporate functions) came to EUR -0.23 million (Q1/2019: EUR -0.37 million) in the reporting period.
In the first quarter 2020 financial year, the YOC Group recognised planned depreciation in the amount of EUR 0.17 million (Q1/2019: EUR 0.13 million).
The financial result was EUR -0.06 million as compared to the previous year (Q1/2019: EUR -0.04 million).
Taxes on income and revenue in the amount of EUR 0.1 million also remained unchanged (Q1/2019: EUR 0.1 million).
POST-TAX RESULT DISCONTINUED OPERATIONS
The result of the discontinued subsidiary YOC Mobile Advertising Ltd. amounted profits by altogether EUR 0.02 million (Q1/2019: EUR -0.05 million) in the past financial year.
The Management Board in 2019 decided in consultation with the Supervisory Board to discontinue business at the British subsidiary YOC Mobile Advertising Ltd. Therefore, the liquidation of the company was filed for at the Companies House at the end of 2019. The liquidation took place on 31 March 2020. The company reports the result from YOC Mobile Advertising Ltd. as discontinued operations in accordance with IFRS 5.
POST-TAX RESULT YOC GROUP
As a result of the above-mentioned factors, the Group concluded the first quarter 2020 with a loss of around EUR -0.23 million (Q1/2019: EUR -0.37 million).
As of 31 March 2020, YOC Group's cash and cash equivalents amounted to EUR 0.7 million.
OPERATING CASH FLOW
The operating cash flow is determined using the indirect method. The starting point for determining the operating cash flow is the net income after taxes in the reporting period, amounting to EUR -0.2 million (Q1/2019: EUR -0.4 million). The operating cash flow includes all cash transactions that are not attributable to investing or financing activities.
The operating cash flow came to EUR -0.1 million in the reporting period (Q1/2019: EUR -0.1 million). In addition to earnings after taxes, this resulted from the business-related change in working capital.
CASH FLOW FROM INVESTING ACTIVITIES
The cash flow from investing activities totalling EUR 0.2 million (Q1/2019: EUR 0.1 million) primarily comprises capitalizable development costs in connection with the further development of the company's technological platforms and innovative products as well as external development costs.
In the fixed assets, the additions and disposals are balanced.
CASH FLOW FROM FINANCING ACTIVITIES
The cash flow from financing activities of EUR -0.01 million (Q1/2019: EUR -0.2 million) results from the repayment of leasing liabilities and the balance of loans taken up and repaid.

10
The implementation of measures for a strategic realignment led to an increased business volume of the YOC Group.
In the first three months of 2020, they achieved an operating result before interest, tax, depreciation and amortisation (EBITDA) amounting to EUR 0.03 million (Q1/2019: EUR -0.1 million).
The YOC Group's total assets fell to EUR 5.5 million (31 December 2019: EUR 6.5 million) for seasonal reasons.
OPPORTUNITIES AND RISKS
Being a service provider with an international focus, YOC Group is active in a dynamic market which naturally brings about certain corporate and branch-specific as well as financial risks. Main risks include market and competition risks, technological risks, liability risks, personnel risks, planning risks, organisa-tional as well as financial and treasury risks.
These risks are influenced by our own business activities as well as external factors. YOC Group has taken measures to detect such possible risks in time and to reduce them.
To this end, an adequate risk management system has been developed which records and evaluates risks by means of a company-wide risk inventory at regular intervals and, if necessary, constantly monitors them.
YOC Group’s risk policies which have been set by the Management Board remain unchanged and are a vital part of the corporate policy, in line with the pursuit of sustainable growth, growth in company value and securing the company’s existence in the long-term.
For this purpose, necessary risks are consciously taken, while taking into account the risk-return-ratio, in order to make use of market opportunities and to exhaust the success potential inherent in them.
By means of anticipatory risk control as part of the internal control system, risks and opportunities can be detected and evaluated at an early stage so that a timely and appropriate response is possible, and efficient management can be guaranteed for the company’s success.
The measures that are to be taken in line with risk control are being implemented in the respective operating units.
OUTLOOK
The use of the internet is already established to a high degree in the daily lives of people. The wide-ranging possibilities and the abundance in online contents result in the continued increase of the daily internet use.
Above all, people who are online with their mobile devices when they are on the move use the Internet much more intensively than the overall population: Among the under-50s, just over 90 percent use the Internet at least occasionally while on the move.1)
In order to stay relevant for these generations, both publishers and advertisers need to present attractive offers for information and entertainment.
For publishers this means not to overstrain their users with advertisements, and ideally even offer them added value through creative formats.
Whereas for advertisers this means to know their target group well and address them in a creative way.
In this light, the call for creative and highly effective formats becomes even more relevant. Rich media formats allowing for the integration of a wide variety of media such as video, audio or HTML5 create higher interaction rates compared to standard banners, hence leading to a stronger and more positive brand awareness.
For several years, YOC has already positioned itself in this business field with a large number of attractive product lines and features, and it expects to participate in the growth of the market by providing interactive and highly effective advertising formats in the programmatic environment.
In the European context, the market currently scarcely offers supply-side platforms which can serve the demand for mobile programmatic advertising combined with highly effective advertising products.
11
Further reservations arose as many advertisers were concerned their ads could appear in environments with negative connotations.
This underlines even more the relevance of secure premium environments, and in particular their transparency.
This has given rise to a need for action at YOC: With the launch of the new proprietary supply-side platform VIS.X® in the year 2018, YOC does not merely offer highly effective advertising formats that comply with the rules of the Coalition for Better Ads2), but can now also trade and deliver them platform-based via programmatic trading channels.
By binding premium publishers and their high-quality inventory, the company moreover covers the strong demand for brand safety, and hence secure advertising environments, and will thus participate in the further expansion of programmatic trade in Europe in the future.
The Management Board devotes special attention to stabilising the dynamic growth of the programmatic platform trade and thereby to implementing the defined business strategy.
To this end it is necessary that all YOC branches adapt the new market positioning and implement all relevant tasks.
The proprietary platform VIS.X® allowed the company to gain a substantial competitive edge as well as independence from third-party providers through the programmatic trade of highly effective advertising products.
For the ongoing 2020 financial year, the company so far foresaw Group-wide sales revenues amounting to EUR 17.0 million to EUR 18.0 million, and an operating result before interest, taxes, depreciation and amortisation (EBITDA) amounting to EUR 1.0 million to EUR 1.5 million.
However, the world-wide spread of the novel coronavirus SARS-CoV-2 increased distinctly in the first quarter of 2020. Due to the uncertainty as to the duration of the crisis, the full extent of its implications for society at the time being cannot be reliably quantified.
The further spread of the coronavirus SARS-CoV-2 is followed by negative impacts especially in the advertising industry.
The YOC AG Management Board with view to the unexpected decline in orders for the current second quarter of 2020 decided on 09 April 2020 not to uphold the forecast for the year 2020 as a whole and developed alternative planning scenarios.
As soon as a reasonably reliable assessment of the further business development for the year 2020 is possible, YOC AG will publish a prognosis that is adjusted accordingly.
Following two successful months at the beginning of the 2020 financial year, the company had to face cancellations and a decline in orders as early as March 2020. Particularly hard hit by this development will most likely be the months of April, May and June 2020. For the second half-year, we expect a stronger revenue growth year-on-year. Building on this planning assumption, we would see a positive EBITDA for the year as a whole.
Based on the currently foreseeable economic develop-ments, the company further introduced appropriate countermeasures, among others in connection with the utilisation of state funds.
The company currently assesses various alternative financing opportunities, which can partly be utilised with no preconditions from third parties.
- - - - - - - - - - - - - - - - - - - - - - - - - - - - - - - - - - - - - - - - - - - -
1) http://www.ard-zdf-onlinestudie.de/ardzdf-onlinestudie-2019/. [20.05.2020].
2) Coalition for Better Ads. The Bad Ads Standards. https://www.betterads.org/standards/. [27.02.2020].

12
All figures in EUR
When using rounded amounts and key figures, differences may occur due to commercial rounding. The previous year’s figures were adjusted
due to the application of IFRS 5 Non-current Assets Held for Sale and Discontinued Operations.
Revenue 3.376.841 2.870.687
Own work capitalised 83.585 70.489
Other operating income 47.421 58.943
Total output 3.507.847 3.000.120
Expenses for goods and services 2.072.721 1.773.552
Personnel expenses 1.068.355 930.817
Other operating expenses 339.987 386.506
Earnings before interest, taxes, depreciation and amortization 26.784 -90.755
Depreciation and amortisation expenses 173.802 130.698
Earnings before interest and taxes -147.018 -221.453
Financial expenses 62.987 39.928
Financial result -62.987 -39.928
Earnings before taxes -210.006 -261.381
Income taxes 44.134 59.062
Net income continuing operations -254.140 -320.443
Net income discontinued operations 21.065 -52.837
Net income -233.075 -373.280
Net income -233.075 -373.280
Earnings per share basic -0,07 -0,11
Earnings per share diluted -0,07 -0,11
Earnings per share basic -0,08 -0,10
Earnings per share diluted -0,08 -0,10
Net income -233.075 -373.280 Net other comprehensive income to be reclassified through profit or loss in subsequent periods: Unrealised gains/losses from foreign currency translation -5.205 -7.656
Total other comprehensive income -5.205 -7.656
Total comprehensive income -238.280 -380.936
13
All figures in EUR
Where rounded figures are used, differences may occur due to commercial rounding.
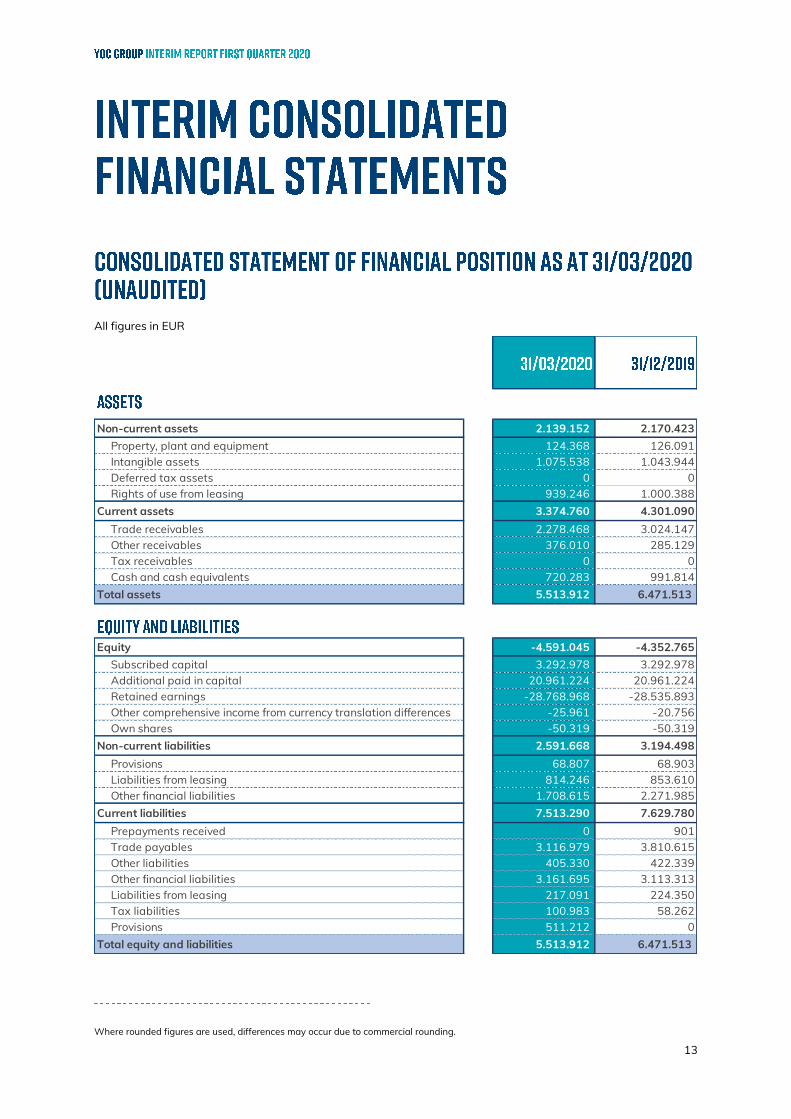
Non-current assets 2.139.152 2.170.423 Property, plant and equipment 124.368 126.091 Intangible assets 1.075.538 1.043.944 Deferred tax assets 0 0 Rights of use from leasing 939.246 1.000.388Current assets 3.374.760 4.301.090
Trade receivables 2.278.468 3.024.147 Other receivables 376.010 285.129 Tax receivables 0 0 Cash and cash equivalents 720.283 991.814Total assets 5.513.912 6.471.513
Equity -4.591.045 -4.352.765 Subscribed capital 3.292.978 3.292.978 Additional paid in capital 20.961.224 20.961.224 Retained earnings -28.768.968 -28.535.893 Other comprehensive income from currency translation differences -25.961 -20.756 Own shares -50.319 -50.319Non-current liabilities 2.591.668 3.194.498
Provisions 68.807 68.903 Liabilities from leasing 814.246 853.610 Other financial liabilities 1.708.615 2.271.985Current liabilities 7.513.290 7.629.780
Prepayments received 0 901 Trade payables 3.116.979 3.810.615 Other liabilities 405.330 422.339 Other financial liabilities 3.161.695 3.113.313 Liabilities from leasing 217.091 224.350 Tax liabilities 100.983 58.262 Provisions 511.212 0Total equity and liabilities 5.513.912 6.471.513
14
All figures in EUR
Where rounded figures are used, differences may occur due to commercial rounding.
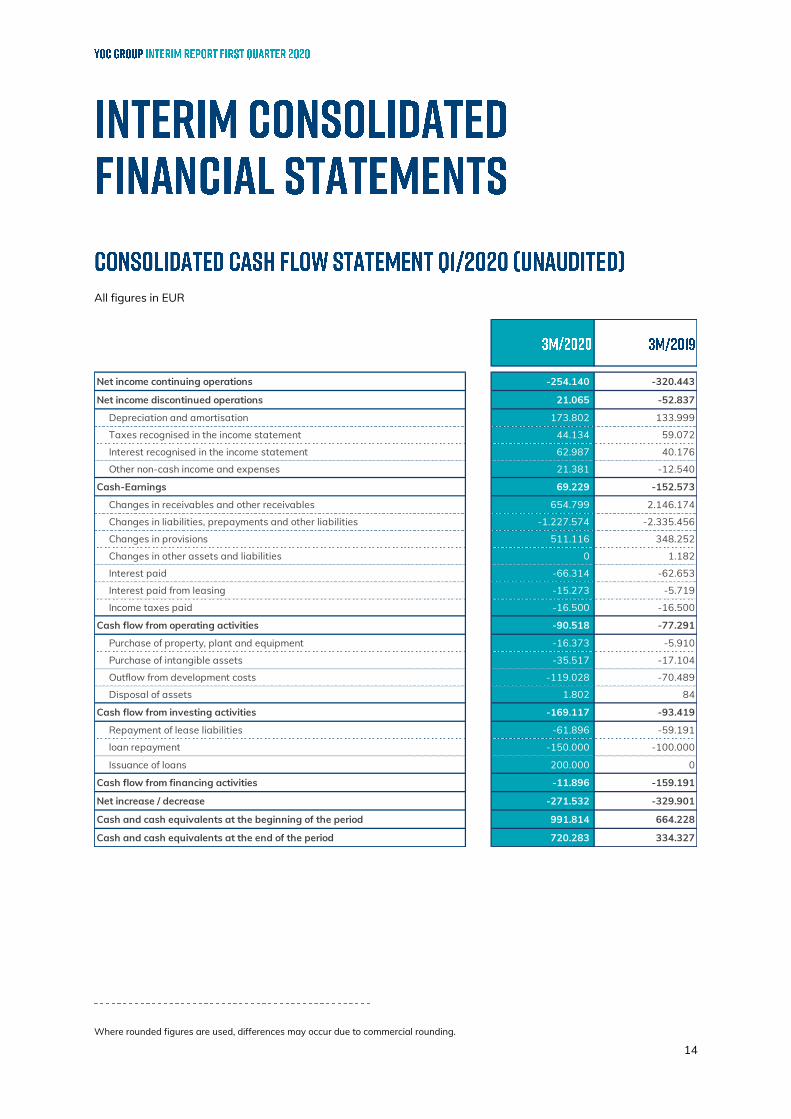
Net income continuing operations -254.140 -320.443
Net income discontinued operations 21.065 -52.837
Depreciation and amortisation 173.802 133.999
Taxes recognised in the income statement 44.134 59.072
Interest recognised in the income statement 62.987 40.176
Other non-cash income and expenses 21.381 -12.540
Cash-Earnings 69.229 -152.573
Changes in receivables and other receivables 654.799 2.146.174
Changes in liabilities, prepayments and other liabilities -1.227.574 -2.335.456
Changes in provisions 511.116 348.252
Changes in other assets and liabilities 0 1.182
Interest paid -66.314 -62.653
Interest paid from leasing -15.273 -5.719
Income taxes paid -16.500 -16.500
Cash flow from operating activities -90.518 -77.291
Purchase of property, plant and equipment -16.373 -5.910
Purchase of intangible assets -35.517 -17.104
Outflow from development costs -119.028 -70.489
Disposal of assets 1.802 84
Cash flow from investing activities -169.117 -93.419
Repayment of lease liabilities -61.896 -59.191
loan repayment -150.000 -100.000
Issuance of loans 200.000 0
Cash flow from financing activities -11.896 -159.191
Net increase / decrease -271.532 -329.901
Cash and cash equivalents at the beginning of the period 991.814 664.228
Cash and cash equivalents at the end of the period 720.283 334.327
15
All figures in EUR
Where rounded figures are used, differences may occur due to commercial rounding.
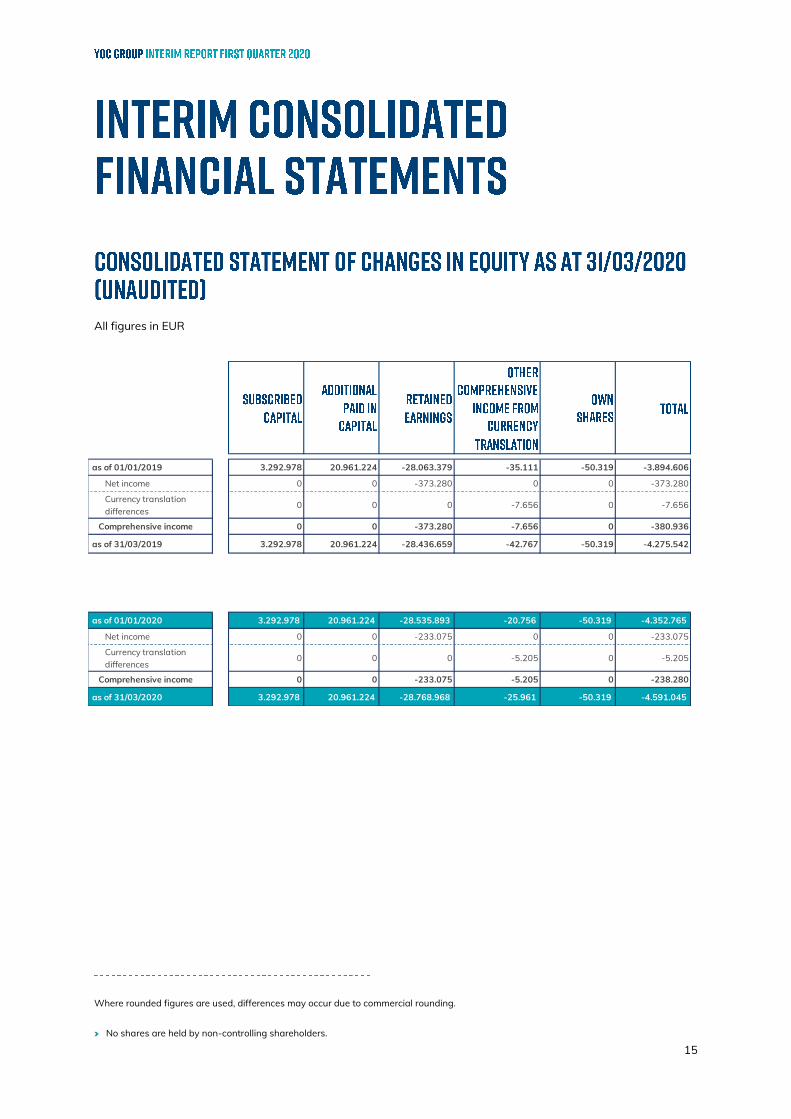
› No shares are held by non-controlling shareholders.
as of 01/01/2019 3.292.978 20.961.224 -28.063.379 -35.111 -50.319 -3.894.606
Net income 0 0 -373.280 0 0 -373.280
Currency translation differences
0 0 0 -7.656 0 -7.656
Comprehensive income 0 0 -373.280 -7.656 0 -380.936
as of 31/03/2019 3.292.978 20.961.224 -28.436.659 -42.767 -50.319 -4.275.542
as of 01/01/2020 3.292.978 20.961.224 -28.535.893 -20.756 -50.319 -4.352.765
Net income 0 0 -233.075 0 0 -233.075
Currency translation differences
0 0 0 -5.205 0 -5.205
Comprehensive income 0 0 -233.075 -5.205 0 -238.280
as of 31/03/2020 3.292.978 20.961.224 -28.768.968 -25.961 -50.319 -4.591.045

16
GENERAL INFORMATION
YOC AG, with headquarters at Greifswalder Str. 212, Berlin, Germany, is an international provider of Mobile Advertising.
YOC AG is listed in the Prime Standard of the Frankfurt Stock Exchange under the identification number WKN 593273 / ISIN DE 0005932735.
PRINCIPLES FOR THE PREPARATION OF THE FINANCIAL STATEMENTS, ACCOUNTING AND VALUATION METHODS
Principles for the preparation of the financial statements
YOC AG’s interim report as of 31 March 2020 was prepared in compliance with the German Securities Trading Act (WpHG).
The interim consolidated financial statements were prepared as condensed financial statements pursuant to IAS 34 and comply with Section 315a of the German Commercial Code (HGB) in accordance with the rules of the International Financial Reporting Standards (IFRS) of the International Accounting Standards Board (IASB) as adopted by the European Union and valid on the reporting date as well as the interpretations of the IFRS Interpretations Committee (IFRS IC) approved by the IASB.
The condensed and unaudited interim consolidated financial statements of YOC AG do not contain all the information and disclosures necessary for the preparation of complete financial statements at the end of the financial year.
It is therefore to be recommended to read the interim report along with the Annual Report 2019.
Standards and interpretations requiring mandatory application in the current financial year
In the ongoing financial year 2020, all standards that were mandatory as of 01 January 2020 were complied with.
Published standards and interpretations that are not yet mandatory
In October 2018, the IASB published changes to IFRS 3, “Business Combinations”. The changes clarify how to determine whether a business or a group of assets was acquired.
The changed definition of a business emphasizes that the creation of outputs by a business focuses on goods and services provided to customers.
The previous definition focused on the return in the form of dividends, reduced cost and other economic uses for shareholders and others.
The differentiation between a business and a group of assets is substantial as the acquirer recognises goodwill or financial assets only when acquiring a business.
These changes become effective for the financial years beginning on or after 01 January 2020.
The implementation of the changes will have no significant impact on the consolidated financial statements. The provisions are yet to be incorporated into European law by the EU.
In May 2017, the IASB published IFRS 17, “Insurance Contracts”, which regulates the accounting principles with regard to the recognition, measurement, presentation and disclosure for insurance contracts within the standard’s scope of application.
IFRS 17 replaces the IFRS 4 regulations which had given entities the possibility of a further application of national accounting standards. This led to the application of a multitude of different accounting principles.
IFRS 17 solved this problem of a lack in comparability of financial statements created by IFRS 4 by requiring standardised accounting for all insurance contracts, thereby creating benefits for both investors and insur-ance companies. Insurance obligations are recognised by using current values instead of historical acquisition costs. The information is constantly updated, providing the addressees of financial statements with more useful information for decision making.
IFRS 17 becomes effective for any financial years beginning on or after 01 January 2021.

17
The implementation of the changes will have no significant impact on the consolidated financial statements. The provisions are yet to be incorporated into European law by the EU.
In January 2020, the IASB has adopted changes to IAS 1 regarding a limited adjustment of the evaluation criteria for classifying liabilities as current or non-current. The changes to IAS 1 only regard the recognition of liabilities in the presentation of the financial position, but not
the amount or date of recognising assets, liabilities, expenses or earnings or corresponding information.
These changes mainly ensure that:
› the classification as non-current liability depends on the company’s right as of the reporting date to defer settlement of the liability by at least twelve months following the end of the reporting period. This right must be substantive. Moreover, any conditions for exercising such a right must be fulfilled as of the reporting date, failing which it is deemed a current liability.
› the actual intention of the management to settle such a liability within twelve months following the reporting date is immaterial for the classification of a liability, and
› the settlement refers to the transfer of cash instruments, equity instruments or other financial assets or contributions to the counterparty.
These changes are to be applied from 01 January 2020. A premature application of these changes is permitted, provided they have been endorsed by the EU.
In October 2018, the IASB published changes to IAS 8, “Accounting Policies”, changes in accounting estimates and errors. The changes aimed at standardising the definition of the concept of “materi-ality” in all standards and clarifying certain aspects of the definition.
Information is material if omitting, misstating or obscuring it could reasonably be expected to influence the decisions that the primary users of general purpose financial statements make on the basis of those financial statements, which provide financial information about a specific reporting entity.
The Group assumes that the changes to the definition of “materiality” have no significant impact on the consolidated financial statements.
Furthermore, the IASB has published several other announcements which are of no relevance to the company and which the company therefore does not expect to affect it. The YOC AG Management Board assumes that the above-mentioned standards and interpretations will be applied in the consolidated financial statements of the financial year in which they become mandatory if cases should occur in which they apply.
CONSOLIDATION PRINCIPLES
The consolidated financial statements include those companies which YOC AG controls.
Control of an investee is considered to exist when the group is exposed, or has rights to, variable returns from its involvement with the investee, and is able to apply its power of disposition over the affiliated company to affect those yields.
The inclusion of subsidiaries in the consolidated financial statements begins from the date on which YOC AG achieves control over the subsidiary.
It ends at the time at which control of the subsidiary is lost.
The separate financial statements of the consolidated companies are prepared as of the reporting date of the consolidated financial statements.
All intercompany earnings and expenses as well as assets, liabilities and equity capital are eliminated in full.
CONSOLIDATED COMPANIES
The Management Board in financial year 2019 decided in consultation with the Supervisory Board to discontinue business at the British subsidiary YOC Mobile Advertising Ltd. Consequently, an application for liquidation of the company was submitted to Companies House at the end of 2019. The liquidation and deconsolidation took place on 31 March 2020.
Five companies were now consolidated in YOC Group:
1. YOC AG, Berlin - - -
2. YOC Mobile Advertising GmbH, Berlin 100 % 1 11/03/2009
3. YOC Central Eastern Europe GmbH, Vienna, Austria
100 % 1 01/06/2009
4.
YOC Spain, S.L., Madrid, Spain 100 % 1 22/09/2009
5.
YOC Poland Sp. z o. o., Warsaw, Poland 100 % 1 04/04/2019
18
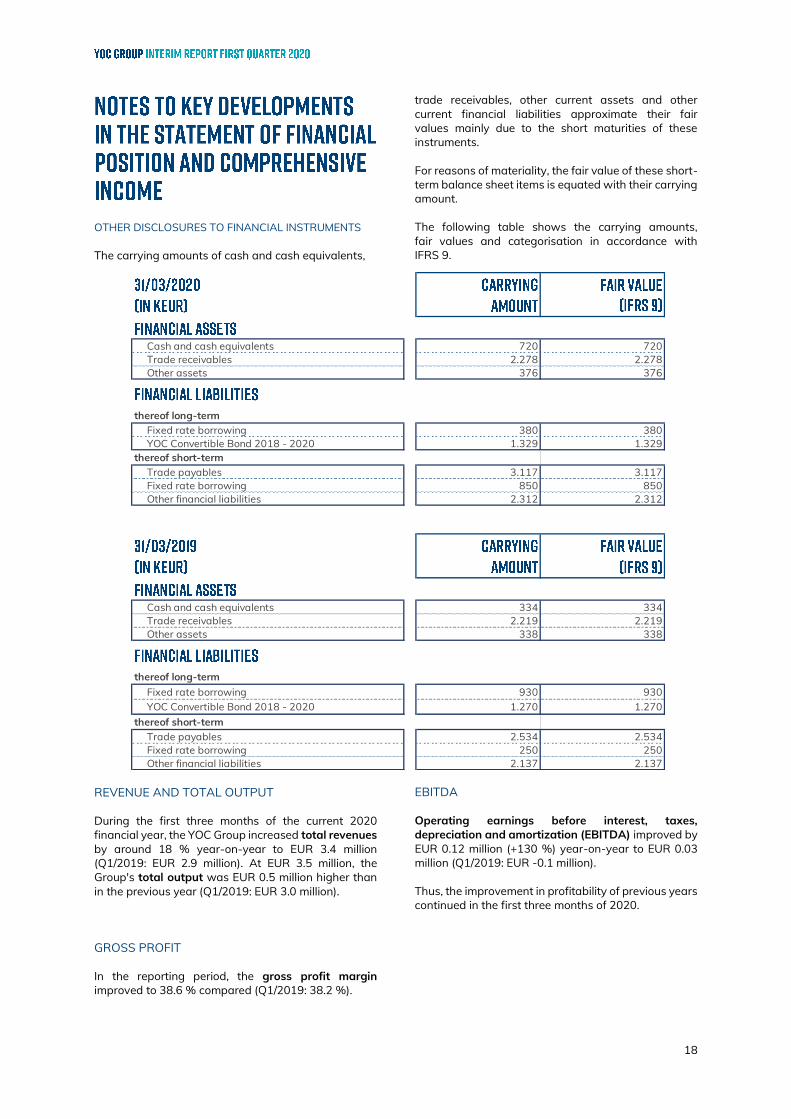
OTHER DISCLOSURES TO FINANCIAL INSTRUMENTS
The carrying amounts of cash and cash equivalents,
REVENUE AND TOTAL OUTPUT
During the first three months of the current 2020 financial year, the YOC Group increased total revenues by around 18 % year-on-year to EUR 3.4 million (Q1/2019: EUR 2.9 million). At EUR 3.5 million, the Group's total output was EUR 0.5 million higher than in the previous year (Q1/2019: EUR 3.0 million).
GROSS PROFIT
In the reporting period, the gross profit margin improved to 38.6 % compared (Q1/2019: 38.2 %).
trade receivables, other current assets and other current financial liabilities approximate their fair values mainly due to the short maturities of these instruments.
For reasons of materiality, the fair value of these short-term balance sheet items is equated with their carrying amount.
The following table shows the carrying amounts, fair values and categorisation in accordance with IFRS 9.
EBITDA
Operating earnings before interest, taxes, depreciation and amortization (EBITDA) improved by EUR 0.12 million (+130 %) year-on-year to EUR 0.03 million (Q1/2019: EUR -0.1 million).
Thus, the improvement in profitability of previous years continued in the first three months of 2020.
Cash and cash equivalents 720 720 Trade receivables 2.278 2.278 Other assets 376 376
thereof long-term Fixed rate borrowing 380 380 YOC Convertible Bond 2018 - 2020 1.329 1.329thereof short-term Trade payables 3.117 3.117 Fixed rate borrowing 850 850 Other financial liabilities 2.312 2.312
Cash and cash equivalents 334 334 Trade receivables 2.219 2.219 Other assets 338 338
thereof long-term Fixed rate borrowing 930 930 YOC Convertible Bond 2018 - 2020 1.270 1.270thereof short-term Trade payables 2.534 2.534 Fixed rate borrowing 250 250 Other financial liabilities 2.137 2.137

19
Segment reporting is based on the internal management structure and internal reporting.
At the beginning of the second quarter of 2019, the internal reporting and external corporate communications were remodeled.
The Group is consequently sectioned into Corporate Functions and the following reportable business segments:
› National
› International
For the formation of the above-mentioned reportable business segments, the regions Austria, Spain, Poland and the Netherlands are for the first time combined to the International Segment in the context of drawing up the half-year financial statements 2019, as these regions show similar economic characteristics and are also comparable with regard to their products, services, customers, processes, structures and sales principles.
Up until the half-year financial statements 2019, the Great Britain region was also recognised within the International Segment. By terminating the business activities and the related application pursuant to IFRS 5, the region was eliminated from the segment and the previous year’s figures were adjusted accordingly.
The sales revenues are calculated based on the revenue generated by the national subsidiaries in the respective countries. Internal revenues between the segments are mainly advance payments. Internal revenues within each segment are eliminated accordingly.
The Corporate Functions segment includes revenue and expense incurred in the parent company and not directly attributable to any business segment, in particular levies and holding costs.
In addition, sales revenues in the area of central revenue optimisation of the international publisher portfolio of YOC Group are generated in the parent company and recharged internally.
In the National Segment the total revenue including internal revenues was increased by around 44 % to kEUR 2,182 (Q1/2019: kEUR 1,516).
As a consequence, EBITDA increased by kEUR 122 to kEUR 376 (Q1/2019: kEUR 254) compared to the same period last year.
The sales revenue of international business operations decreased by 9 % to kEUR 1,166 (Q1/2019: kEUR 1,287).
Sales revenues in Austria and Poland were increased compared to the same period of the previous year. In Spain, however, the planned business development could not be achieved.
As a result, the segment contributed a positive EBITDA to consolidated earnings of kEUR 59 (Q1/2019: kEUR -28).
The EBITDA reconciles to the post-tax result as follows:
EBITDA 27 -91
Depreciation and Amortisation 174 131
Financial Result -63 -40
Net Income before Taxes -210 -261
Taxes 44 59
Net Income Continuing Operations
-254 -320
Net Income Discontinued Operations 21 -53
NET INCOME -233 -373
As of 30 March 2020, trade and other receivables amounted to kEUR 709 (previous year: kEUR 617) in the National Segment, kEUR 694 (previous year: kEUR 822) in the International Segment and kEUR 875 (previous year: kEUR 780) in the Corporate Functions segment.
Trade and other liabilities amounted to kEUR 1,404 (previous year: kEUR 1,123) in the National Segment, kEUR 1,295 (previous year: kEUR 974) in the International Segment and kEUR 418 (previous year: kEUR 437) in the Corporate Functions segment.

20
The EBITDA of YOC Group is reconciled to net income as follows:
As of 31 March 2020, YOC Group's cash and cash equivalents amounted to EUR 0.7 million.
The operating cash flow came to EUR -0.1 million in the reporting period (Q1/2019: EUR -0.1 million).
The cash flow from investing activities totalling EUR 0.2 million (Q1/2019: EUR 0.1 million) primarily comprises capitalizable development costs in connection with the further development of the company's technological platforms and innovative products as well as external development costs.
In the fixed assets, the additions and disposals are balanced.
The cash flow from financing activities in the amount of EUR -0,01 million (Q1/2019: EUR -0,2 million) results from cash outflows due to loan repayments and loan taken as well as the repayment of lease.
GUARANTEES, CONTINGENT LIABILITIES AND SIMILAR OBLIGATIONS
Depending on a specific exercise scenario, payment obligations may arise from the virtual stock option program under certain circumstances.
There are no other contingencies, warranties, contingent liabilities or similar obligations.
EVENTS AFTER THE INTERIM REPORTING PERIOD
The world-wide spread of the novel coronavirus SARS-CoV-2 constantly accelerated in the first quarter of 2020. In the face of the continuous evolution of the situation, the full extent of its implications for our society at the time being cannot be reliably quantified.
(in kEUR)
External revenue 1.124 779 1.473 0 3.377 Internal revenue 1.057 387 237 -1.682 0Total revenue 2.182 1.166 1.710 -1.682 3.377 Own work capitalised 0 0 84 0 84 Other operating income 24 4 222 -203 47Total output 2.206 1.171 2.016 -1.884 3.508 Costs of goods sold 1.356 668 1.730 -1.682 2.073 Personnel expenses 313 261 494 0 1.068 Other operating expenses 161 182 201 -203 340 EBITDA 376 59 -409 0 27
External revenue 844 995 1.031 0 2.871 Internal revenue 671 292 128 -1.091 0Total revenue 1.516 1.287 1.159 -1.091 2.871 Own work capitalised 0 0 70 0 70 Other operating income 35 6 201 -182 59Total output 1.551 1.293 1.430 -1.274 3.000 Costs of goods sold 984 771 1.112 -1.093 1.774 Personnel expenses 255 263 414 0 931 Other operating expenses 59 288 214 -174 387 EBITDA 254 -28 -309 -7 -91

21
Due to the further dynamic evolution of the situation and with view to the unexpected decline in orders for the current second quarter of 2020, the YOC AG Management Board on 09 April 2020 decided not to uphold the forecast for the year 2020 as a whole.
In order to limit the overall impact of the Corana crisis, the Company has initiated appropriate counter-measures.
There were no other significant events after 31 March 2020 up to the date of publication of the interim consolidated financial statements.
REPORT ON RISKS AND OPPORTUNITIES
The financial instruments of the YOC Group include trade accounts payable, cash and cash equivalents, other assets and trade accounts payable, other liabilities and the YOC convertible bond 2018–2022.
It is possible that the YOC convertible bond 2018–2022 was not or only partially converted into YOC shares on the repayment date. In this case, 112 % of the non-converted bonds would be repaid.
All other information on the company- and industry-specific and financial risks of the YOC Group and its management is provided in the risk report of the Group management report or the 2019 financial year, which forms part of the audit by the auditor.
RELATED PARTY DISCLOSURES
For the purposes of IAS 24, related companies and persons are generally defined as members of the Management Board and of the Supervisory Board of YOC AG along with their family members and companies controlled by these persons. Persons in key positions and their close family members are also considered related parties (according to IAS 24.9).
YOC AG’s obligations to their Management Board member Dirk-Hilmar Kraus in the amount of kEUR 180 have been carrying a 5 % interest rate p. a. since 01 January 2015 and are recognised in non-current financial liabilities.
In addition, Dirk-Hilmar Kraus has provided the company with a loan of kEUR 100 in the course of 2019 for financing the further growth of the company. The loan carries an interest of 6 % p. a. and is recognised in non-current financial liabilities. This loan is due for repayment in July 2021.
Mr. Dirk-Hilmar Kraus provided the company with a short-term loan of kEUR 200 in February 2020. This is subject to interest at 7 % p.a.
The total amount of loans provided to the company by Dirk-Hilmar Kraus was kEUR 480 (Q1/2019: kEUR 180). The loans are not secured.
Beyond that, no significant business transactions with related companies or persons took place in the period under review.
The Declaration of Conformity with the German Corporate Governance Code (Deutscher Corporate Governance Kodex) pursuant to Sect. 161 of the German Stock Corporation Act (AktG) was issued by the Management Board and the Supervisory Board in February 2020 and has been made permanently accessible to YOC AG’s shareholders on the web page at www.yoc.com in the “Investor Relations” section.
I assure, to the best of my knowledge, and in accordance with the applicable reporting principles for interim financial reporting, the interim consolidated financial statements give a true and fair view of the assets, liabilities, financial position and profit or loss of the Group, and the interim management report of the Group includes a fair review of the development and performance of the business and the position of the Group, together with a description of the principal opportunities and risks associated with the expected development of the Group for the remaining months of the financial year.
Berlin, 27 May 2020
Dirk-Hilmar Kraus
The Management Board
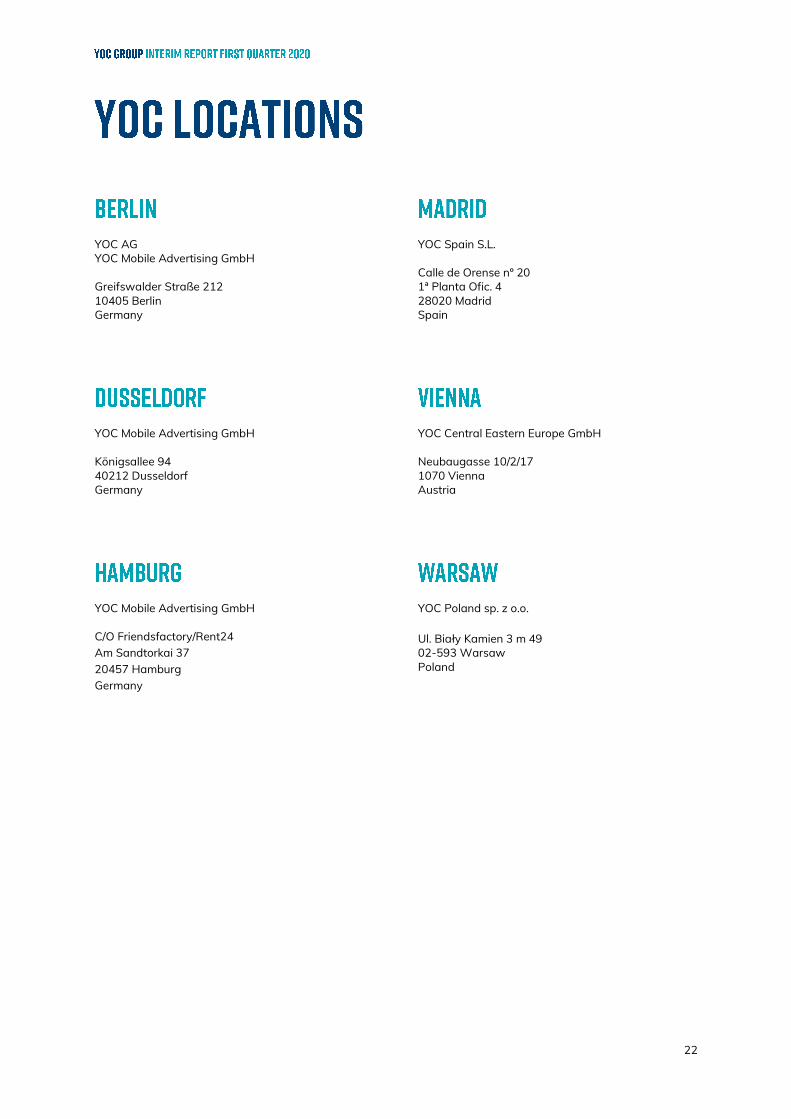
22
YOC Spain S.L.
Calle de Orense nº 20 1ª Planta Ofic. 4 28020 Madrid Spain
YOC Central Eastern Europe GmbH
Neubaugasse 10/2/17 1070 Vienna Austria
YOC Poland sp. z o.o.
Ul. Biały Kamien 3 m 49 02-593 Warsaw Poland
YOC AG YOC Mobile Advertising GmbH
Greifswalder Straße 212 10405 Berlin Germany
YOC Mobile Advertising GmbH
Königsallee 94 40212 Dusseldorf Germany
YOC Mobile Advertising GmbH
C/O Friendsfactory/Rent24 Am Sandtorkai 37 20457 Hamburg Germany
23
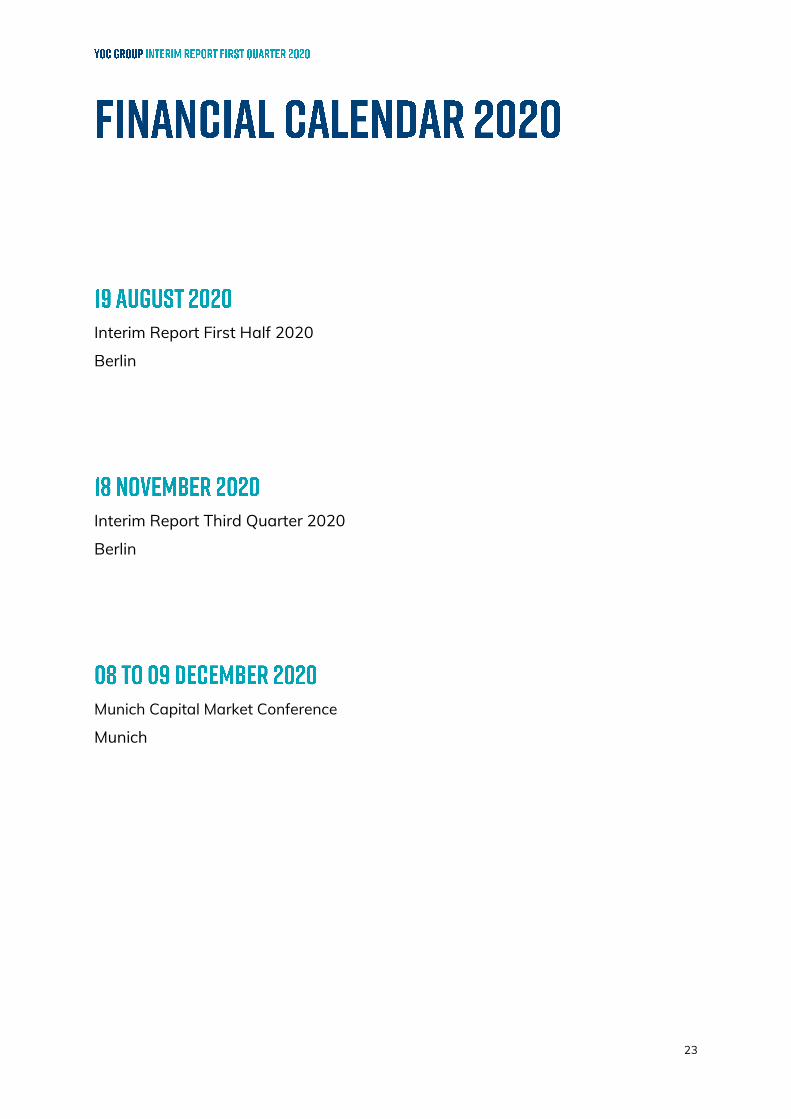
Interim Report First Half 2020
Berlin
Interim Report Third Quarter 2020
Berlin
Munich Capital Market Conference
Munich
24
YOC AG Greifswalder Straße 212 10405 Berlin Germany
P +49 (0) 30 72 61 62 - 0 F +49 (0) 30 72 61 62 - 222 [email protected]
Commercial Register Registration: Berlin HRB 77 285
YOC AG Investor Relations
[email protected] www.yoc.com

25