Berkswell Mill wind flow study Report August 2019
29
Berkswell Windmill Wind flow Study Report: 119019 19 August 2019 – CONCEPT 1 BERKSWELL MILL WIND FLOW STUDY Location: N 52°22’50.77” W 1°38’7.46” Client: Berkswell Parish Council and the Friends of Berkswell Mill Date of visit: 31 May 2019 Date of photo’s: 31 May 2019 Date of report: 5 August 2019 (calculations June 2019); amended 19 August 2019 Author: E. van der Elst Status: Definitive
Transcript of Berkswell Mill wind flow study Report August 2019

Berkswell Windmill Wind flow Study Report: 119019 19 August 2019 – CONCEPT
1
BERKSWELL MILL WIND FLOW STUDY
Location: N 52°22’50.77” W 1°38’7.46”
Client: Berkswell Parish Council and the Friends of Berkswell Mill
Date of visit: 31 May 2019
Date of photo’s: 31 May 2019
Date of report: 5 August 2019 (calculations June 2019); amended 19 August 2019
Author: E. van der Elst
Status: Definitive

Berkswell Windmill Wind flow Study Report: 119019 19 August 2019 – CONCEPT
2
1. Erfgoed Advies Groen
1.1 About
Erfgoed Advies (Heritage advice) Groen has traditionally been an engineering firm that specialises in the
restoration of windmills and watermills. In the last five years, we have done much more in the area of
heritage than just making plans for mills. However, 75% of the work still consists of mills. Of the 1,200 mills
in the Netherlands, 250 mills of these mills are regular customers of Erfgoed Advies Groen and for more
than 400 other mills in the Netherlands consultancy work has been done. 25% of the other work consists
of other monuments such as churches, town halls, fortresses, farms and barns.
The agency is characterised by the no-nonsense approach from the engineering past. "If it is not broke, do
not fix it." Only take action if necessary, try to repair as much as possible with what can still be retained,
and if replacement cannot be avoided, copy the old situation as much as possible. Another characteristic
of our company is the establishment of a good diagnosis, a systematic approach and a follow-up of the
project.
All employees within the office have a great passion for their profession. Two of the five employees are
millers in their spare time.
Erfgoed Advies Groen provides all services and documents that are required for the entire process of
restoration, management and maintenance of monuments.
Restoration:
• Building technical research
• Building history research (archival research and colour research are often purchased).
• Vision document, schedule of requirements, cost estimate based on key figures and references.
• Predesign, 3D Visualization, elements budget
• Construction calculations (soil mechanics and foundation calculations are often purchased)
• Final design
• Specifications, budget, working (technical) drawings
• Design sprinkler installations
• Working drawings and detail drawings
• Documents application environmental permits
• Documents for subsidy applications
• Documents for the tender and the tender itself, including an official report.
• Sight supervision, building meetings including reporting and signing off
• Work visits incl. Visit reports, inspections and tests in between
• Administration of restorations
• Delivery including process report and aftercare
• Restoration report

Berkswell Windmill Wind flow Study Report: 119019 19 August 2019 – CONCEPT
3
Maintenance and management:
• Architectural inspection
• Project conservation plans
• Organization of maintenance incl. Placing on the market and following up
• RI & E safety and risk inventory
• Inventory mill biotope including wind calculations
• Flow analysis and power calculations water mills
• Calculation of rebuilding value
• Expertise in case of damage
• Re-use research
• Management plan incl. Management vision
• Review current organization management incl. Benchmark.
1.2 Certifications
Erfgoed Advies Groen has the following certifications:
• URL 2002 Certified consultancy firm for mills. Certification from the Stichting ERM (Foundation for
the certification of restauration quality and preservation of monuments in The Netherlands)
• URL 2001 Certified for modules A and B for technical surveying of monuments. Certification from
the Stichting ERM.
• Member of TIMS (The International Molinological Society).
2. The Study
2.1 Terms used in the report
Within the report several terms from molinological nomenclature are used. An explanation of the terms is
found hereunder.
Windmill biotope:
The windmill biotope refers to the direct environment around a wind- or watermill. The relationship
between the mill and its surroundings play a crucial role in the physical operation of the mill. The
landscape and buildings around the mill have a direct impact on how the mill functions. For a
windmill, the area that is designated as the ‘direct environment’ is a 400 metre radius measured
from the centre of the mill.
More than just wind, the windmill biotope includes the accessibility to the mill for grain and flour
transport and the millers sight of the sky (for assessing the sky, cloud formations) which allows

Berkswell Windmill Wind flow Study Report: 119019 19 August 2019 – CONCEPT
4
him/her to adjust the mill for production and safety reasons. Also the mill’s function as a
monument is included.
Wind velocity:
A vector (speed and direction) measuring the direction and speed of the airflow. Can be
measured in metres per second (m/s), knots or the scale of Beaufort. For this study the wind
velocity was noted in m/s. Wind velocity is dependent on altitude due to surface drag from the
Earth’s surface.
The windspeed has a direct impact on how much energy the mill can induce. The difference in
windspeed in front of the sails and behind the sails squared multiplied by the mass of the air and
an efficiency factor equals the power the mill produces.
Milling days:
Milling days refers to the amount of days per year that the wind velocity is conducive to milling
flour. Windmills start to operate effectively above a certain wind velocity. This is dependent on
several factors, including the type of sail (in the case of windmills) and air temperature (density).
When the wind velocity exceeds a certain speed, the mill can mill flour – this is referred to as a
milling day. For the purpose of this study an average wind velocity of 3.4 m/s between 9 a.m. and
6 p.m. was used as the minimum velocity necessary to be classified as a milling day.
Wind map:
A radar graph showing the 8 compass rose and the amount of day the wind comes from each
direction.
Cannister:
Where the sails are connected with the windshaft. The cannister holds the sails in place and can
easily be identified as this is where the inner and outer sail cross each other.
Sail span:
The span of the inner and outer sail from tip to tip. Essentially the diameter of the turning circle at
the tips of the sails.
Lowest point of the sail:
The distance between the tip of the lower sail and the ground when the sail is perfectly vertical.
2.2 Purpose of the study
The purpose of this wind flow study is to determine three things:
1. The biotope of the windmill in a situation where there are no building and trees to obstruct the
wind. This scenario is based on the average wind flow and the removal of all objects from the
calculation model. In the case of this study, this excludes any impact of wind turbulence caused
Berkswell Windmill Wind flow Study Report: 119019 19 August 2019 – CONCEPT
5
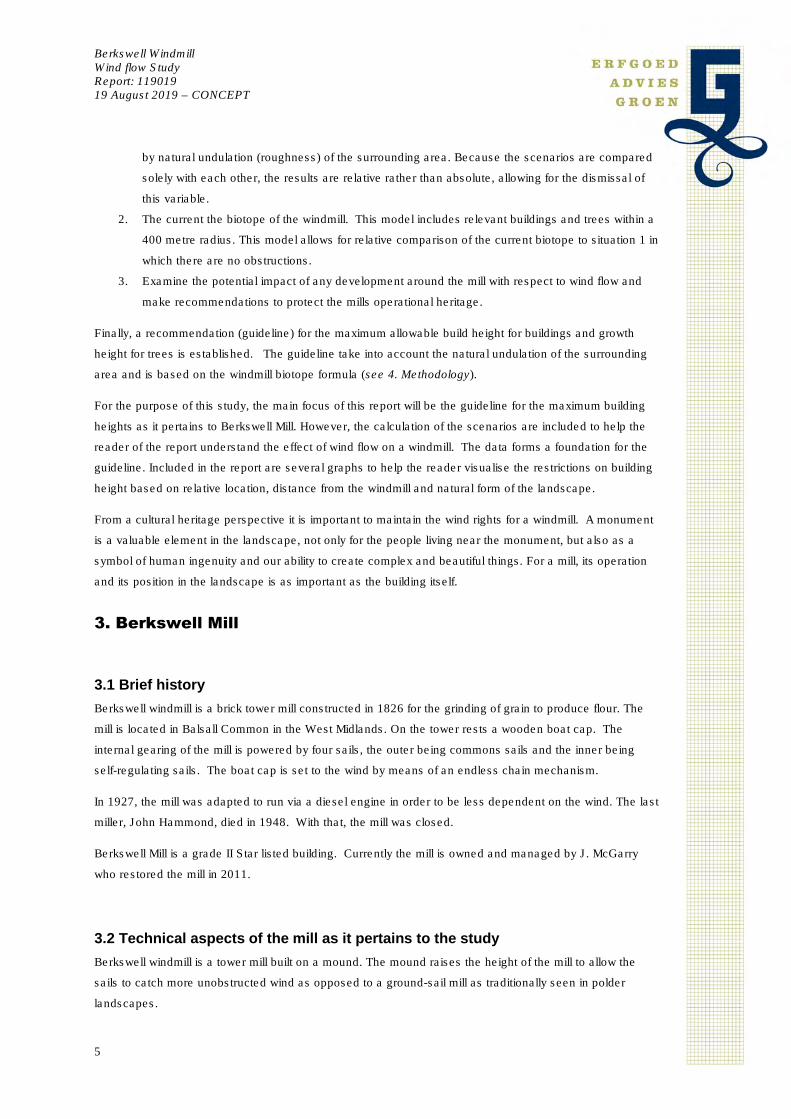
by natural undulation (roughness) of the surrounding area. Because the scenarios are compared
solely with each other, the results are relative rather than absolute, allowing for the dismissal of
this variable.
2. The current the biotope of the windmill. This model includes relevant buildings and trees within a
400 metre radius. This model allows for relative comparison of the current biotope to situation 1 in
which there are no obstructions.
3. Examine the potential impact of any development around the mill with respect to wind flow and
make recommendations to protect the mills operational heritage.
Finally, a recommendation (guideline) for the maximum allowable build height for buildings and growth
height for trees is established. The guideline take into account the natural undulation of the surrounding
area and is based on the windmill biotope formula (see 4. Methodology).
For the purpose of this study, the main focus of this report will be the guideline for the maximum building
heights as it pertains to Berkswell Mill. However, the calculation of the scenarios are included to help the
reader of the report understand the effect of wind flow on a windmill. The data forms a foundation for the
guideline. Included in the report are several graphs to help the reader visualise the restrictions on building
height based on relative location, distance from the windmill and natural form of the landscape.
From a cultural heritage perspective it is important to maintain the wind rights for a windmill. A monument
is a valuable element in the landscape, not only for the people living near the monument, but also as a
symbol of human ingenuity and our ability to create complex and beautiful things. For a mill, its operation
and its position in the landscape is as important as the building itself.
3. Berkswell Mill
3.1 Brief history
Berkswell windmill is a brick tower mill constructed in 1826 for the grinding of grain to produce flour. The
mill is located in Balsall Common in the West Midlands. On the tower rests a wooden boat cap. The
internal gearing of the mill is powered by four sails, the outer being commons sails and the inner being
self-regulating sails. The boat cap is set to the wind by means of an endless chain mechanism.
In 1927, the mill was adapted to run via a diesel engine in order to be less dependent on the wind. The last
miller, John Hammond, died in 1948. With that, the mill was closed.
Berkswell Mill is a grade II Star listed building. Currently the mill is owned and managed by J. McGarry
who restored the mill in 2011.
3.2 Technical aspects of the mill as it pertains to the study
Berkswell windmill is a tower mill built on a mound. The mound raises the height of the mill to allow the
sails to catch more unobstructed wind as opposed to a ground-sail mill as traditionally seen in polder
landscapes.

Berkswell Windmill Wind flow Study Report: 119019 19 August 2019 – CONCEPT
6
The mill is also built on the highest point in the surrounding area. This was done to ensure that none of
the wind was obstructed and the wind turbulence was minimised.
Image 1: Satellite photo of Berkswell Mill and the surrounding area taken on 5-4-2018. The yellow circle
is the 100 metre radius, the red circle is the 400 metre radius. Within the 400 metre radius, Berkswell Mill
is located (nearly) on the highest point. The image is oriented North. (Satellite photo from Google Maps).
The height of the mound on which the mill is built is 1.00 metre above the surrounding ground level. The
lowest point of the sail is 1.18 metres above the mound (2.18 metres above ground level). The sail span is
18.80 metres. Half of the sail span is 9.40 metres. Thus, the middle point of the sails (centre of the
cannister) is 10.40 metres above the mound, or 11.40 metres above the surrounding ground level. The
height of the cannister, sail tips and the mound are necessary to determine the effect of wind turbulence
on the mill.
For reference, the ground level is 131 metres above sea level. See the graphs in chapter 5.
MILL

Berkswell Windmill Wind flow Study Report: 119019 19 August 2019 – CONCEPT
7
Measuring Length Unit
Sail span 18,8 m1
Measured over length of
sail
Sail span / 2 9,4 m1
Measured over length of
sail
Lowest point sail from mound 1,18 m1 Vertical
Cannister height from mound 10,4 m1 Vertical
Highest point sail from mound 19,62 m1 Vertical
Mound height 1 m1 Vertical
HEIGHTS
Measuring Above sea level (m1) Relative
Ground level 131 0
Height of mound 132 1
Lowest point sail 133,18 2,18
Cannister 142,4 11,4
4. Methodology
4.1 Elements in the study
As stated in chapter 2 of this report, the study focused on determining the relative reduction in milling days
for Berkswell Mill with the arrival of new developments and on establishing a guideline for the maximum,
permissible build heights for building within a 400 metre radius of the mill.
In this chapter, the methodology of both elements will be described with emphasis on the latter.
4.2 Milling days
In order to understand the effect of wind turbulence on the mills ability to produce power, the reduction in
number of milling days is calculated. The first step in this process is to establish a control, a baseline in
which the number of milling days in an ideal scenario is calculated. The first step is to procure wind data
from the nearest weather station.
The wind data acquired for the study is from Solihull Weather Station, measured at an altitude of 10
metres above ground height.

Berkswell Windmill Wind flow Study Report: 119019 19 August 2019 – CONCEPT
8
Next, the raw data is analysed, grouped and sorted so that we can see a daily average wind speed and
predominant direction. With this data a wind map can be generated to help visualise the predominant wind
direction in Solihull over the period of one calendar year, in this case 2018. The average windspeed is
calculated in the daytime hours only (9 a.m. until 6 p.m.).
Graph 1: The wind map for Solihull weather station from the 1st of January 2018 until the 31st of December
2018. The predominant wind directions are Southwest and West, then South and Northeast. This graph
includes all 365 days of the calendar year.
Next, the data is analysed to calculate the number of days on which the average windspeed during the day
was equal to or greater than 3.4 m/s.
Graph 2: The wind map for Solihull weather station showing the number of days the average windspeed
exceeded 3.4 m/s between 9 a.m. and 6 p.m.
0
10
20
30
40
50
60
70
80
N
NE
E
SE
S
SW
W
NW
Wind Map - Solihull
365 days
(1.1.2018 - 31.12.2018)
Alt. 10 metres
0
10
20
30
40
50
60
70
N
NE
E
SE
S
SW
W
NW
Wind Map - Solihull
Milling days
(1.1.2018 - 31.12.2018)

Berkswell Windmill Wind flow Study Report: 119019 19 August 2019 – CONCEPT
9
With this data it is possible to calculate the theoretical number of milling days per year and in which
direction it comes from in the ideal scenario.
Next, a model is created in which the wind disruption caused by an object (building or tree) can be
calculated. The factors for this are:
• Distance between the object and the mill
• Height of the object
• Ground elevation of the object
• The sweep of the object (the degrees that the width of the object covers measured radially from
the centre point of the mill – the closer the object, the greater the sweep – assuming the object is
the same size).
• Where in relation to the mill the object is located. On the previous page, the graphs show clearly
that the predominant wind directions are the Southwest and the West but with wind flows from
other directions that enable the mill to operate. This is accounted for in the model, as not all
directions are weighted equally.
• A reduction factor per object. If objects are in line (seen radially from the mill) the disturbance is
less. If one object is blocking another, the blocked object has a negligible effect on the wind flow.
This is accounted for with a reduction factor.
• For trees, the tree density is accounted for, as well as the season.
With these factors in place, the reduction can be calculated per object. The wind reduction/turbulence is
calculated by taking the ratio of the object’s height to the object’s distance from the mill and placing it on
the wind reduction graph according to Nägeli. Thereafter, the relative windspeed before the object and
after the object are calculated and the reduction is the product of the post windspeed divided by the pre
windspeed.
Graph 3: Graph showing the disturbance to airflow caused by objects. The red line shows the location of
the object. At a certain height/distance ratio the object can actually accelerate the airflow.
This reduction is then used to calculate the reduction in milling days per wind direction.
This model can be used to calculate countless scenarios.

Berkswell Windmill Wind flow Study Report: 119019 19 August 2019 – CONCEPT
10
4.3 Biotope guideline
In the Netherlands, the standard for windmill biotopes is decided by ‘De Hollansche Molen’ (The Dutch
Windmill foundation).
The standard method of calculating the maximum build heights around a mill is done with a simple formula
called the ‘biotope formula’:
Hx = X/n+c*z
In which:
H = Height of obstacle (in metres)
X = Distance obstacle to mill (in metres)
n = Coefficient
c = Constant (0.2)
z = Height of the cannister from ground level (including height of mound)
The coefficient (n) is used to account for the area surrounding the mill. There are three categories:
n= 140; open terrain (flat, open, generally where polder mills would operate)
n= 75; rough terrain (hilly, naturally occurring vegetation)
n= 50; closed terrain (towns, cities, where the mill is surrounded by houses, buildings, other mills,
etc.)
The distance is divided by the coefficient, meaning the lower the coefficient, the greater the rate of
increase in permissible build height within a 400 metre radius.
These coefficients account for the difference in wind turbulences present in areas with natural undulation
compared to a completely flat landscape (e.g. The Broads, Norfolk). An object placed in a flat landscape
would cause a greater disturbance in airflow than if the same object were placed in a hilly area.
The area surrounding Berkswell Mill is designated as rough terrain, n=75.
The windmill biotope standard also dictates that the first 100 metres should be free of obstacles. All
objects within a 100 metre radius must be lower than the lowest point of the sail. Starting from 100 metres
an increasing line showing the maximum, permissible build height applies. This is calculated with the
above formula. Hereunder an example:
Assuming the ground is flat (no undulation in the landscape, the ground level is the same within a 400
metre radius), what is the maximum build height for an object 280 metres away from the windmill? For this
example, the data for Berkswell Mill (found on page 7) is used.
Berkswell Windmill Wind flow Study Report: 119019 19 August 2019 – CONCEPT
11
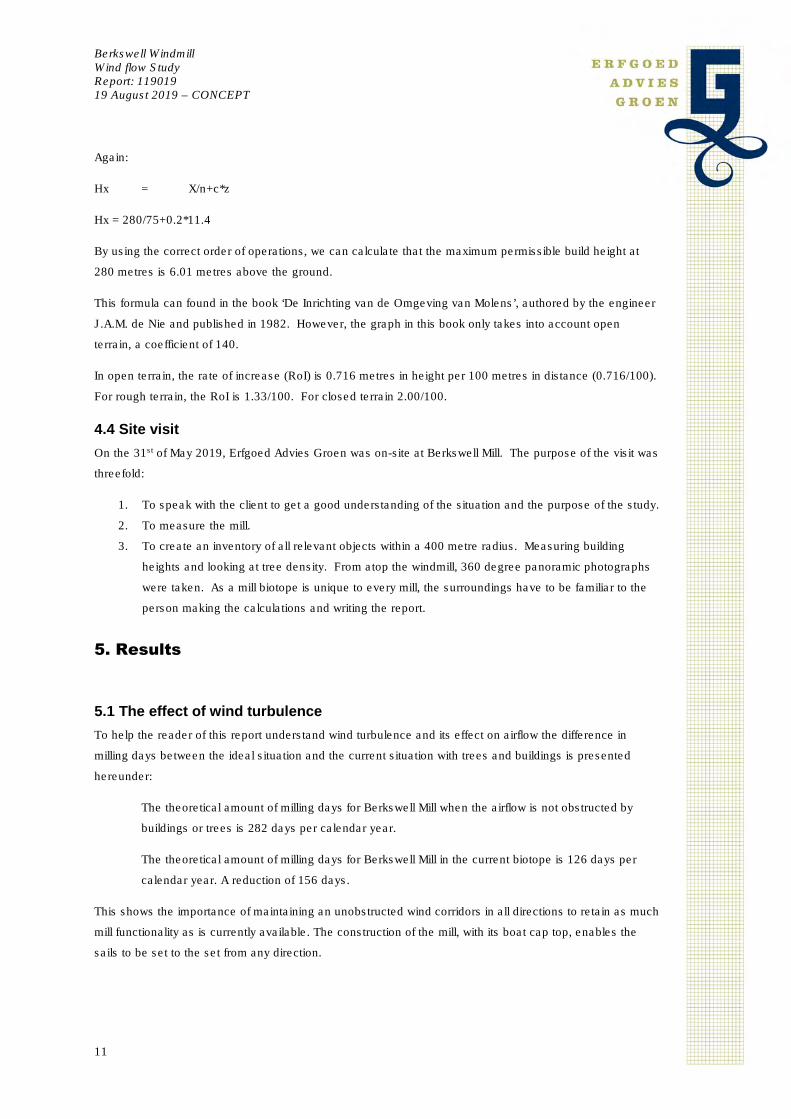
Again:
Hx = X/n+c*z
Hx = 280/75+0.2*11.4
By using the correct order of operations, we can calculate that the maximum permissible build height at
280 metres is 6.01 metres above the ground.
This formula can found in the book ‘De Inrichting van de Omgeving van Molens’, authored by the engineer
J.A.M. de Nie and published in 1982. However, the graph in this book only takes into account open
terrain, a coefficient of 140.
In open terrain, the rate of increase (RoI) is 0.716 metres in height per 100 metres in distance (0.716/100).
For rough terrain, the RoI is 1.33/100. For closed terrain 2.00/100.
4.4 Site visit
On the 31st of May 2019, Erfgoed Advies Groen was on-site at Berkswell Mill. The purpose of the visit was
threefold:
1. To speak with the client to get a good understanding of the situation and the purpose of the study.
2. To measure the mill.
3. To create an inventory of all relevant objects within a 400 metre radius. Measuring building
heights and looking at tree density. From atop the windmill, 360 degree panoramic photographs
were taken. As a mill biotope is unique to every mill, the surroundings have to be familiar to the
person making the calculations and writing the report.
5. Results
5.1 The effect of wind turbulence
To help the reader of this report understand wind turbulence and its effect on airflow the difference in
milling days between the ideal situation and the current situation with trees and buildings is presented
hereunder:
The theoretical amount of milling days for Berkswell Mill when the airflow is not obstructed by
buildings or trees is 282 days per calendar year.
The theoretical amount of milling days for Berkswell Mill in the current biotope is 126 days per
calendar year. A reduction of 156 days.
This shows the importance of maintaining an unobstructed wind corridors in all directions to retain as much
mill functionality as is currently available. The construction of the mill, with its boat cap top, enables the
sails to be set to the set from any direction.

Berkswell Windmill Wind flow Study Report: 119019 19 August 2019 – CONCEPT
12
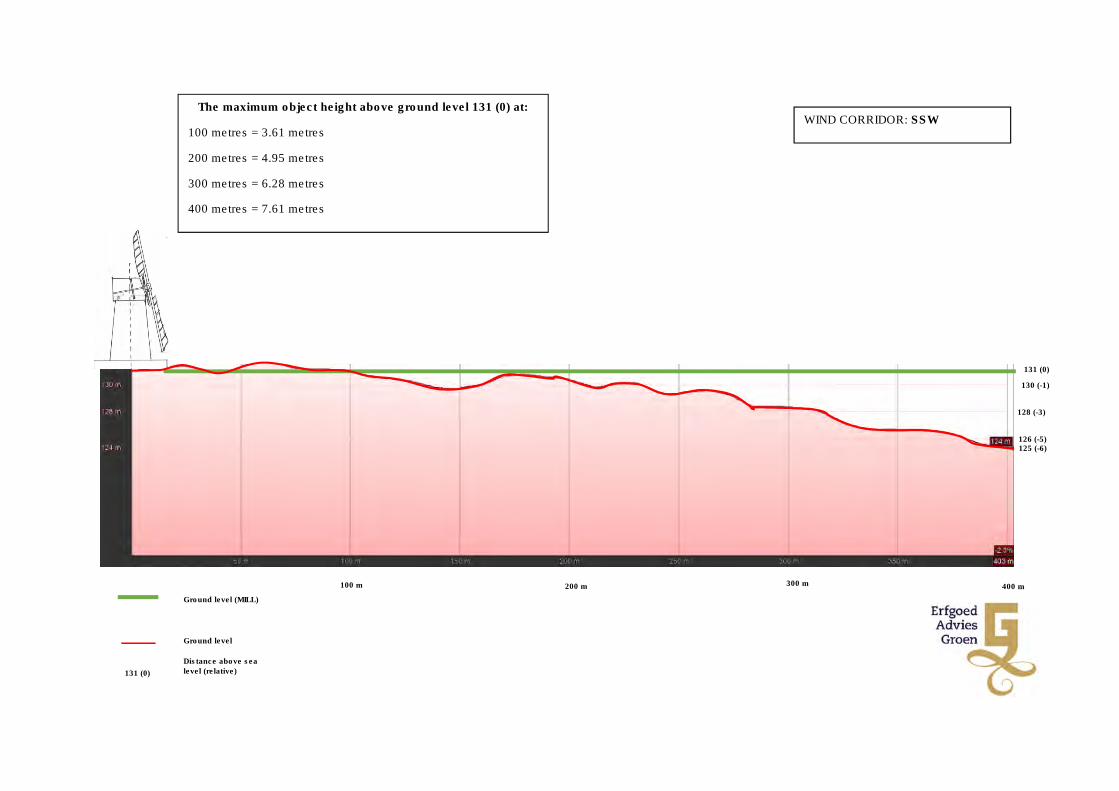
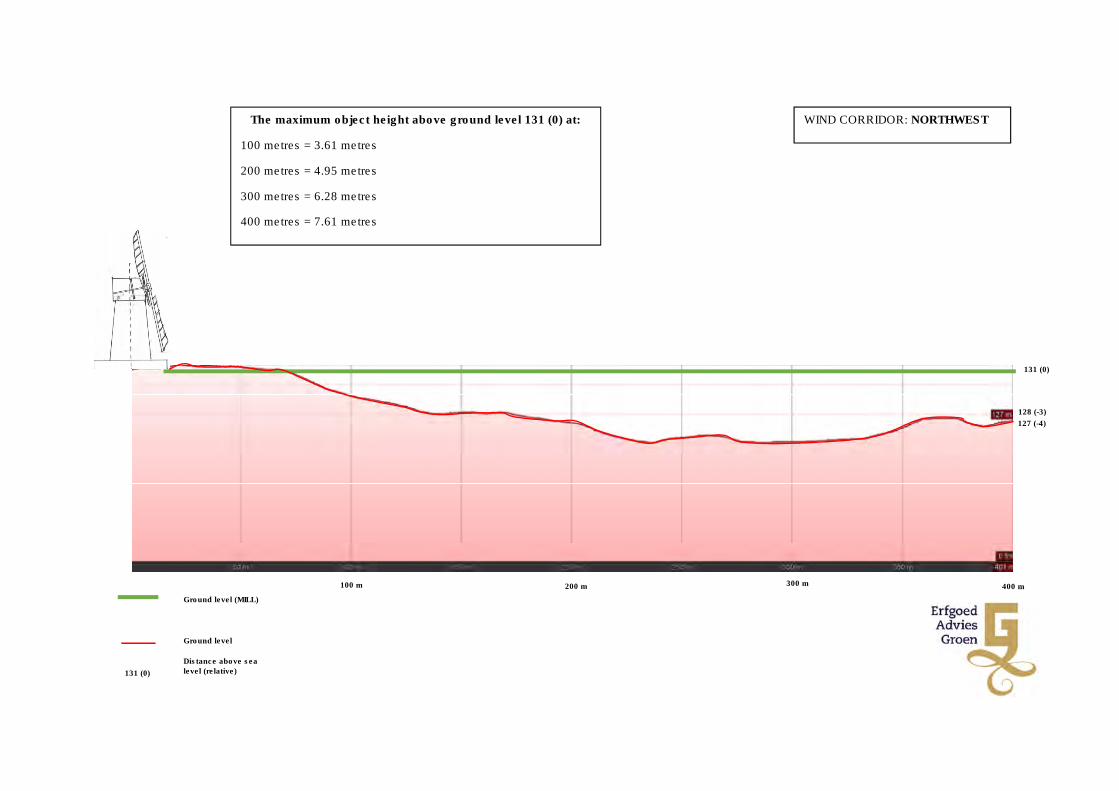
5.2 Maximum object height per wind direction
In this chapter the maximum allowable object height according to the windmill biotope formula and the
elevation profile is presented per wind corridor.
This report contains the graphs for each of the wind directions in the 16-rose compass:
N, NNE, NE, ENE, E, ESE, SE, SSE, S, SSW, SW, WSW, W, WNW, NW, NNW
Each of the graphs shows the following information:
• A elevation profile graph*, starting at the centre point of the mill. The starting point is 0 metres at
131 metres elevation above sea level. To clarify: the red shaded area is the ground level above
sea level.
• A sketch of the mill at the 0 metre mark – not to scale.
• A solid green line showing the ground level of the mill over the 400 metre radius (not the mound
height).
As an example, wind corridor EAST is shown:
At 400 metres from the mill (x-axis), the ground level is 122 metres above sea level, or 9 metres lower (-9)
than the ground level at the mill (131-122=9). According to the biotope formula, the maximum allowable
build height at 400 metres is 7.61 metres (y-axis) above 131 metres. Because the terrain is 9 metres
lower at 400 metres than at 0, the maximum object height at 400 metres is 7.61 + 9 = 16.61 metres. . The
shaded red area is the height above sea level.
The first graph on the following page shows only the maximum building heights, valid for all wind corridors.
*Graph data from SIO, NOAA, U.S. Navy, NGA and GEBCO acquired through Google Earth Pro.
400 metres

131 (0)
133.18 (+2.18)
100 m 200 m
300 m 400 m
138.61 (+7.61)
134.61 (+3.61)
131 (0)
Ground level (MILL)
Tip of under sail
Maximum build
height
Distance above sea
level (relative)
MAXIMUM HEIGHTS ALL WIND
CORRIDORS
The maximum object height above ground level 131 (0) at:
100 metres = 3.61 metres
200 metres = 4.95 metres
300 metres = 6.28 metres
400 metres = 7.61 metres
0 m

131 (0)
100 m 200 m 300 m 400 m
130 (-1)
127 (-4)
131 (0)
Ground level (MILL)
Ground level
Distance above sea
level (relative)
WIND CORRIDOR: NORTH The maximum object height above ground level 131 (0) at:
100 metres = 3.61 metres
200 metres = 4.95 metres
300 metres = 6.28 metres
400 metres = 7.61 metres
128 (-3)

131 (0)
100 m 200 m 300 m 400 m
130 (-1)
131 (0)
Ground level (MILL)
Ground level
Distance above sea
level (relative)
WIND CORRIDOR: NNE
127 (-4)
The maximum object height above ground level 131 (0) at:
100 metres = 3.61 metres
200 metres = 4.95 metres
300 metres = 6.28 metres
400 metres = 7.61 metres
128 (-3)

131 (0)
100 m 200 m 300 m 400 m
130 (-1)
128 (-3)
131 (0)
Ground level (MILL)
Ground level
Distance above sea
level (relative)
WIND CORRIDOR: NORTHEAST The maximum object height above ground level 131 (0) at:
100 metres = 3.61 metres
200 metres = 4.95 metres
300 metres = 6.28 metres
400 metres = 7.61 metres

131 (0)
100 m 200 m 300 m 400 m
130 (-1)
131 (0)
Ground level (MILL)
Ground level
Distance above sea
level (relative)
WIND CORRIDOR: ENE
125 (-6)
The maximum object height above ground level 131 (0) at:
100 metres = 3.61 metres
200 metres = 4.95 metres
300 metres = 6.28 metres
400 metres = 7.61 metres
128 (-3)

131 (0)
100 m 200 m 300 m 400 m
130 (-1)
122 (-9)
131 (0)
Ground level (MILL)
Ground level
Distance above sea
level (relative)
WIND CORRIDOR: EAST
128 (-3)
The maximum object height above ground level 131 (0) at:
100 metres = 3.61 metres
200 metres = 4.95 metres
300 metres = 6.28 metres
400 metres = 7.61 metres
126 (-5)

131 (0)
100 m 200 m 300 m 400 m
128 (-3)
131 (0)
Ground level (MILL)
Ground level
Distance above sea
level (relative)
WIND CORRIDOR: ESE
121 (-10)
The maximum object height above ground level 131 (0) at:
100 metres = 3.61 metres
200 metres = 4.95 metres
300 metres = 6.28 metres
400 metres = 7.61 metres
124 (-7)
126 (-5)
122 (-9)
130 (-1)

131 (0)
100 m 200 m 300 m 400 m
131 (0)
Ground level (MILL)
Ground level
Distance above sea
level (relative)
WIND CORRIDOR: SOUTHEAST
118 (-13)
128 (-3)
The maximum object height above ground level 131 (0) at:
100 metres = 3.61 metres
200 metres = 4.95 metres
300 metres = 6.28 metres
400 metres = 7.61 metres
125 (-6)
122 (-9)
119 (-12)

131 (0)
100 m 200 m 300 m 400 m
130 (-1)
131 (0)
Ground level (MILL)
Ground level
Distance above sea
level (relative)
WIND CORRIDOR: SSE
122 (-9)
The maximum object height above ground level 131 (0) at:
100 metres = 3.61 metres
200 metres = 4.95 metres
300 metres = 6.28 metres
400 metres = 7.61 metres
128 (-3)
125 (-6)

131 (0)
100 m 200 m 300 m 400 m
130 (-1)
131 (0)
Ground level (MILL)
Ground level
Distance above sea
level (relative)
WIND CORRIDOR: SOUTH
129 (-2)
The maximum object height above ground level 131 (0) at:
100 metres = 3.61 metres
200 metres = 4.95 metres
300 metres = 6.28 metres
400 metres = 7.61 metres
131 (0)
100 m 200 m 300 m 400 m
128 (-3)
131 (0)
Ground level (MILL)
Ground level
Distance above sea
level (relative)
WIND CORRIDOR: SSW
125 (-6)
The maximum object height above ground level 131 (0) at:
100 metres = 3.61 metres
200 metres = 4.95 metres
300 metres = 6.28 metres
400 metres = 7.61 metres
130 (-1)
126 (-5)

131 (0)
100 m 200 m 300 m 400 m
130 (-1)
131 (0)
Ground level (MILL)
Ground level
Distance above sea
level (relative)
WIND CORRIDOR: SOUTHWEST
120 (-11)
126 (-6)
The maximum object height above ground level 131 (0) at:
100 metres = 3.61 metres
200 metres = 4.95 metres
300 metres = 6.28 metres
400 metres = 7.61 metres
128 (-3)
123 (-9)

131 (0)
100 m 200 m 300 m 400 m
128 (-3)
131 (0)
Ground level (MILL)
Ground level
Distance above sea
level (relative)
WIND CORRIDOR: WSW
125 (-6)
The maximum object height above ground level 131 (0) at:
100 metres = 3.61 metres
200 metres = 4.95 metres
300 metres = 6.28 metres
400 metres = 7.61 metres
130 (-1)
126 (-5)
132 (+1)

131 (0)
100 m 200 m 300 m 400 m
130 (-1)
131 (0)
Ground level (MILL)
Ground level
Distance above sea
level (relative)
WIND CORRIDOR: WEST
127 (-4)
The maximum object height above ground level 131 (0) at:
100 metres = 3.61 metres
200 metres = 4.95 metres
300 metres = 6.28 metres
400 metres = 7.61 metres
128 (-3)
132 (+1)

131 (0)
100 m 200 m 300 m 400 m
128 (-3)
131 (0)
Ground level (MILL)
Ground level
Distance above sea
level (relative)
WIND CORRIDOR: WNW
The maximum object height above ground level 131 (0) at:
100 metres = 3.61 metres
200 metres = 4.95 metres
300 metres = 6.28 metres
400 metres = 7.61 metres
130 (-1)
126 (-5)
132 (+1)
131 (0)
100 m 200 m 300 m 400 m
131 (0)
Ground level (MILL)
Ground level
Distance above sea
level (relative)
WIND CORRIDOR: NORTHWEST
127 (-4)
The maximum object height above ground level 131 (0) at:
100 metres = 3.61 metres
200 metres = 4.95 metres
300 metres = 6.28 metres
400 metres = 7.61 metres
128 (-3)

131 (0)
100 m 200 m 300 m 400 m
127 (-4)
131 (0)
Ground level (MILL)
Ground level
Distance above sea
level (relative)
WIND CORRIDOR: NNW
The maximum object height above ground level 131 (0) at:
100 metres = 3.61 metres
200 metres = 4.95 metres
300 metres = 6.28 metres
400 metres = 7.61 metres
130 (-1)
128 (-3)