Berkshire’s Performance vs. the S&P 500 · Berkshire’s Performance vs. the S&P 500 Annual...
13
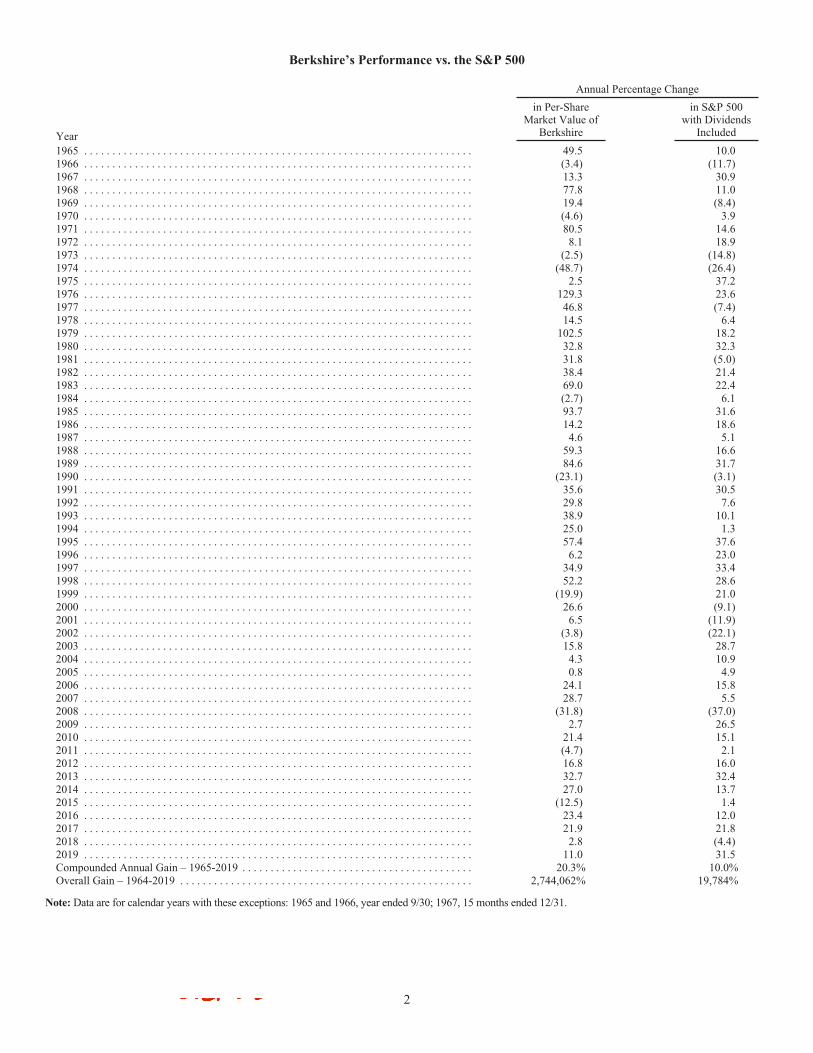
Berkshire’s Performance vs. the S&P 500 Annual Percentage Change Year in Per-Share Market Value of Berkshire in S&P 500 with Dividends Included 1965 ..................................................................... 49.5 10.0 1966 ..................................................................... (3.4) (11.7) 1967 ..................................................................... 13.3 30.9 1968 ..................................................................... 77.8 11.0 1969 ..................................................................... 19.4 (8.4) 1970 ..................................................................... (4.6) 3.9 1971 ..................................................................... 80.5 14.6 1972 ..................................................................... 8.1 18.9 1973 ..................................................................... (2.5) (14.8) 1974 ..................................................................... (48.7) (26.4) 1975 ..................................................................... 2.5 37.2 1976 ..................................................................... 129.3 23.6 1977 ..................................................................... 46.8 (7.4) 1978 ..................................................................... 14.5 6.4 1979 ..................................................................... 102.5 18.2 1980 ..................................................................... 32.8 32.3 1981 ..................................................................... 31.8 (5.0) 1982 ..................................................................... 38.4 21.4 1983 ..................................................................... 69.0 22.4 1984 ..................................................................... (2.7) 6.1 1985 ..................................................................... 93.7 31.6 1986 ..................................................................... 14.2 18.6 1987 ..................................................................... 4.6 5.1 1988 ..................................................................... 59.3 16.6 1989 ..................................................................... 84.6 31.7 1990 ..................................................................... (23.1) (3.1) 1991 ..................................................................... 35.6 30.5 1992 ..................................................................... 29.8 7.6 1993 ..................................................................... 38.9 10.1 1994 ..................................................................... 25.0 1.3 1995 ..................................................................... 57.4 37.6 1996 ..................................................................... 6.2 23.0 1997 ..................................................................... 34.9 33.4 1998 ..................................................................... 52.2 28.6 1999 ..................................................................... (19.9) 21.0 2000 ..................................................................... 26.6 (9.1) 2001 ..................................................................... 6.5 (11.9) 2002 ..................................................................... (3.8) (22.1) 2003 ..................................................................... 15.8 28.7 2004 ..................................................................... 4.3 10.9 2005 ..................................................................... 0.8 4.9 2006 ..................................................................... 24.1 15.8 2007 ..................................................................... 28.7 5.5 2008 ..................................................................... (31.8) (37.0) 2009 ..................................................................... 2.7 26.5 2010 ..................................................................... 21.4 15.1 2011 ..................................................................... (4.7) 2.1 2012 ..................................................................... 16.8 16.0 2013 ..................................................................... 32.7 32.4 2014 ..................................................................... 27.0 13.7 2015 ..................................................................... (12.5) 1.4 2016 ..................................................................... 23.4 12.0 2017 ..................................................................... 21.9 21.8 2018 ..................................................................... 2.8 (4.4) 2019 ..................................................................... 11.0 31.5 Compounded Annual Gain – 1965-2019 ......................................... 20.3% 10.0% Overall Gain – 1964-2019 .................................................... 2,744,062% 19,784% Note: Data are for calendar years with these exceptions: 1965 and 1966, year ended 9/30; 1967, 15 months ended 12/31. 2
Transcript of Berkshire’s Performance vs. the S&P 500 · Berkshire’s Performance vs. the S&P 500 Annual...
Berkshire’s Performance vs. the S&P 500
Annual Percentage Change
Year
in Per-ShareMarket Value of
Berkshire
in S&P 500with Dividends
Included
1965 . . . . . . . . . . . . . . . . . . . . . . . . . . . . . . . . . . . . . . . . . . . . . . . . . . . . . . . . . . . . . . . . . . . . . 49.5 10.01966 . . . . . . . . . . . . . . . . . . . . . . . . . . . . . . . . . . . . . . . . . . . . . . . . . . . . . . . . . . . . . . . . . . . . . (3.4) (11.7)1967 . . . . . . . . . . . . . . . . . . . . . . . . . . . . . . . . . . . . . . . . . . . . . . . . . . . . . . . . . . . . . . . . . . . . . 13.3 30.91968 . . . . . . . . . . . . . . . . . . . . . . . . . . . . . . . . . . . . . . . . . . . . . . . . . . . . . . . . . . . . . . . . . . . . . 77.8 11.01969 . . . . . . . . . . . . . . . . . . . . . . . . . . . . . . . . . . . . . . . . . . . . . . . . . . . . . . . . . . . . . . . . . . . . . 19.4 (8.4)1970 . . . . . . . . . . . . . . . . . . . . . . . . . . . . . . . . . . . . . . . . . . . . . . . . . . . . . . . . . . . . . . . . . . . . . (4.6) 3.91971 . . . . . . . . . . . . . . . . . . . . . . . . . . . . . . . . . . . . . . . . . . . . . . . . . . . . . . . . . . . . . . . . . . . . . 80.5 14.61972 . . . . . . . . . . . . . . . . . . . . . . . . . . . . . . . . . . . . . . . . . . . . . . . . . . . . . . . . . . . . . . . . . . . . . 8.1 18.91973 . . . . . . . . . . . . . . . . . . . . . . . . . . . . . . . . . . . . . . . . . . . . . . . . . . . . . . . . . . . . . . . . . . . . . (2.5) (14.8)1974 . . . . . . . . . . . . . . . . . . . . . . . . . . . . . . . . . . . . . . . . . . . . . . . . . . . . . . . . . . . . . . . . . . . . . (48.7) (26.4)1975 . . . . . . . . . . . . . . . . . . . . . . . . . . . . . . . . . . . . . . . . . . . . . . . . . . . . . . . . . . . . . . . . . . . . . 2.5 37.21976 . . . . . . . . . . . . . . . . . . . . . . . . . . . . . . . . . . . . . . . . . . . . . . . . . . . . . . . . . . . . . . . . . . . . . 129.3 23.61977 . . . . . . . . . . . . . . . . . . . . . . . . . . . . . . . . . . . . . . . . . . . . . . . . . . . . . . . . . . . . . . . . . . . . . 46.8 (7.4)1978 . . . . . . . . . . . . . . . . . . . . . . . . . . . . . . . . . . . . . . . . . . . . . . . . . . . . . . . . . . . . . . . . . . . . . 14.5 6.41979 . . . . . . . . . . . . . . . . . . . . . . . . . . . . . . . . . . . . . . . . . . . . . . . . . . . . . . . . . . . . . . . . . . . . . 102.5 18.21980 . . . . . . . . . . . . . . . . . . . . . . . . . . . . . . . . . . . . . . . . . . . . . . . . . . . . . . . . . . . . . . . . . . . . . 32.8 32.31981 . . . . . . . . . . . . . . . . . . . . . . . . . . . . . . . . . . . . . . . . . . . . . . . . . . . . . . . . . . . . . . . . . . . . . 31.8 (5.0)1982 . . . . . . . . . . . . . . . . . . . . . . . . . . . . . . . . . . . . . . . . . . . . . . . . . . . . . . . . . . . . . . . . . . . . . 38.4 21.41983 . . . . . . . . . . . . . . . . . . . . . . . . . . . . . . . . . . . . . . . . . . . . . . . . . . . . . . . . . . . . . . . . . . . . . 69.0 22.41984 . . . . . . . . . . . . . . . . . . . . . . . . . . . . . . . . . . . . . . . . . . . . . . . . . . . . . . . . . . . . . . . . . . . . . (2.7) 6.11985 . . . . . . . . . . . . . . . . . . . . . . . . . . . . . . . . . . . . . . . . . . . . . . . . . . . . . . . . . . . . . . . . . . . . . 93.7 31.61986 . . . . . . . . . . . . . . . . . . . . . . . . . . . . . . . . . . . . . . . . . . . . . . . . . . . . . . . . . . . . . . . . . . . . . 14.2 18.61987 . . . . . . . . . . . . . . . . . . . . . . . . . . . . . . . . . . . . . . . . . . . . . . . . . . . . . . . . . . . . . . . . . . . . . 4.6 5.11988 . . . . . . . . . . . . . . . . . . . . . . . . . . . . . . . . . . . . . . . . . . . . . . . . . . . . . . . . . . . . . . . . . . . . . 59.3 16.61989 . . . . . . . . . . . . . . . . . . . . . . . . . . . . . . . . . . . . . . . . . . . . . . . . . . . . . . . . . . . . . . . . . . . . . 84.6 31.71990 . . . . . . . . . . . . . . . . . . . . . . . . . . . . . . . . . . . . . . . . . . . . . . . . . . . . . . . . . . . . . . . . . . . . . (23.1) (3.1)1991 . . . . . . . . . . . . . . . . . . . . . . . . . . . . . . . . . . . . . . . . . . . . . . . . . . . . . . . . . . . . . . . . . . . . . 35.6 30.51992 . . . . . . . . . . . . . . . . . . . . . . . . . . . . . . . . . . . . . . . . . . . . . . . . . . . . . . . . . . . . . . . . . . . . . 29.8 7.61993 . . . . . . . . . . . . . . . . . . . . . . . . . . . . . . . . . . . . . . . . . . . . . . . . . . . . . . . . . . . . . . . . . . . . . 38.9 10.11994 . . . . . . . . . . . . . . . . . . . . . . . . . . . . . . . . . . . . . . . . . . . . . . . . . . . . . . . . . . . . . . . . . . . . . 25.0 1.31995 . . . . . . . . . . . . . . . . . . . . . . . . . . . . . . . . . . . . . . . . . . . . . . . . . . . . . . . . . . . . . . . . . . . . . 57.4 37.61996 . . . . . . . . . . . . . . . . . . . . . . . . . . . . . . . . . . . . . . . . . . . . . . . . . . . . . . . . . . . . . . . . . . . . . 6.2 23.01997 . . . . . . . . . . . . . . . . . . . . . . . . . . . . . . . . . . . . . . . . . . . . . . . . . . . . . . . . . . . . . . . . . . . . . 34.9 33.41998 . . . . . . . . . . . . . . . . . . . . . . . . . . . . . . . . . . . . . . . . . . . . . . . . . . . . . . . . . . . . . . . . . . . . . 52.2 28.61999 . . . . . . . . . . . . . . . . . . . . . . . . . . . . . . . . . . . . . . . . . . . . . . . . . . . . . . . . . . . . . . . . . . . . . (19.9) 21.02000 . . . . . . . . . . . . . . . . . . . . . . . . . . . . . . . . . . . . . . . . . . . . . . . . . . . . . . . . . . . . . . . . . . . . . 26.6 (9.1)2001 . . . . . . . . . . . . . . . . . . . . . . . . . . . . . . . . . . . . . . . . . . . . . . . . . . . . . . . . . . . . . . . . . . . . . 6.5 (11.9)2002 . . . . . . . . . . . . . . . . . . . . . . . . . . . . . . . . . . . . . . . . . . . . . . . . . . . . . . . . . . . . . . . . . . . . . (3.8) (22.1)2003 . . . . . . . . . . . . . . . . . . . . . . . . . . . . . . . . . . . . . . . . . . . . . . . . . . . . . . . . . . . . . . . . . . . . . 15.8 28.72004 . . . . . . . . . . . . . . . . . . . . . . . . . . . . . . . . . . . . . . . . . . . . . . . . . . . . . . . . . . . . . . . . . . . . . 4.3 10.92005 . . . . . . . . . . . . . . . . . . . . . . . . . . . . . . . . . . . . . . . . . . . . . . . . . . . . . . . . . . . . . . . . . . . . . 0.8 4.92006 . . . . . . . . . . . . . . . . . . . . . . . . . . . . . . . . . . . . . . . . . . . . . . . . . . . . . . . . . . . . . . . . . . . . . 24.1 15.82007 . . . . . . . . . . . . . . . . . . . . . . . . . . . . . . . . . . . . . . . . . . . . . . . . . . . . . . . . . . . . . . . . . . . . . 28.7 5.52008 . . . . . . . . . . . . . . . . . . . . . . . . . . . . . . . . . . . . . . . . . . . . . . . . . . . . . . . . . . . . . . . . . . . . . (31.8) (37.0)2009 . . . . . . . . . . . . . . . . . . . . . . . . . . . . . . . . . . . . . . . . . . . . . . . . . . . . . . . . . . . . . . . . . . . . . 2.7 26.52010 . . . . . . . . . . . . . . . . . . . . . . . . . . . . . . . . . . . . . . . . . . . . . . . . . . . . . . . . . . . . . . . . . . . . . 21.4 15.12011 . . . . . . . . . . . . . . . . . . . . . . . . . . . . . . . . . . . . . . . . . . . . . . . . . . . . . . . . . . . . . . . . . . . . . (4.7) 2.12012 . . . . . . . . . . . . . . . . . . . . . . . . . . . . . . . . . . . . . . . . . . . . . . . . . . . . . . . . . . . . . . . . . . . . . 16.8 16.02013 . . . . . . . . . . . . . . . . . . . . . . . . . . . . . . . . . . . . . . . . . . . . . . . . . . . . . . . . . . . . . . . . . . . . . 32.7 32.42014 . . . . . . . . . . . . . . . . . . . . . . . . . . . . . . . . . . . . . . . . . . . . . . . . . . . . . . . . . . . . . . . . . . . . . 27.0 13.72015 . . . . . . . . . . . . . . . . . . . . . . . . . . . . . . . . . . . . . . . . . . . . . . . . . . . . . . . . . . . . . . . . . . . . . (12.5) 1.42016 . . . . . . . . . . . . . . . . . . . . . . . . . . . . . . . . . . . . . . . . . . . . . . . . . . . . . . . . . . . . . . . . . . . . . 23.4 12.02017 . . . . . . . . . . . . . . . . . . . . . . . . . . . . . . . . . . . . . . . . . . . . . . . . . . . . . . . . . . . . . . . . . . . . . 21.9 21.82018 . . . . . . . . . . . . . . . . . . . . . . . . . . . . . . . . . . . . . . . . . . . . . . . . . . . . . . . . . . . . . . . . . . . . . 2.8 (4.4)2019 . . . . . . . . . . . . . . . . . . . . . . . . . . . . . . . . . . . . . . . . . . . . . . . . . . . . . . . . . . . . . . . . . . . . . 11.0 31.5Compounded Annual Gain – 1965-2019 . . . . . . . . . . . . . . . . . . . . . . . . . . . . . . . . . . . . . . . . . 20.3% 10.0%Overall Gain – 1964-2019 . . . . . . . . . . . . . . . . . . . . . . . . . . . . . . . . . . . . . . . . . . . . . . . . . . . . 2,744,062% 19,784%
Note: Data are for calendar years with these exceptions: 1965 and 1966, year ended 9/30; 1967, 15 months ended 12/31.
2
Vishal
Vishal
Vishal
Vishal
Vishal
Vishal
Vishal
Vishal
Vishal
Vishal
Vishal
Vishal
Vishal
Vishal
BERKSHIRE HATHAWAY INC.
To the Shareholders of Berkshire Hathaway Inc.:
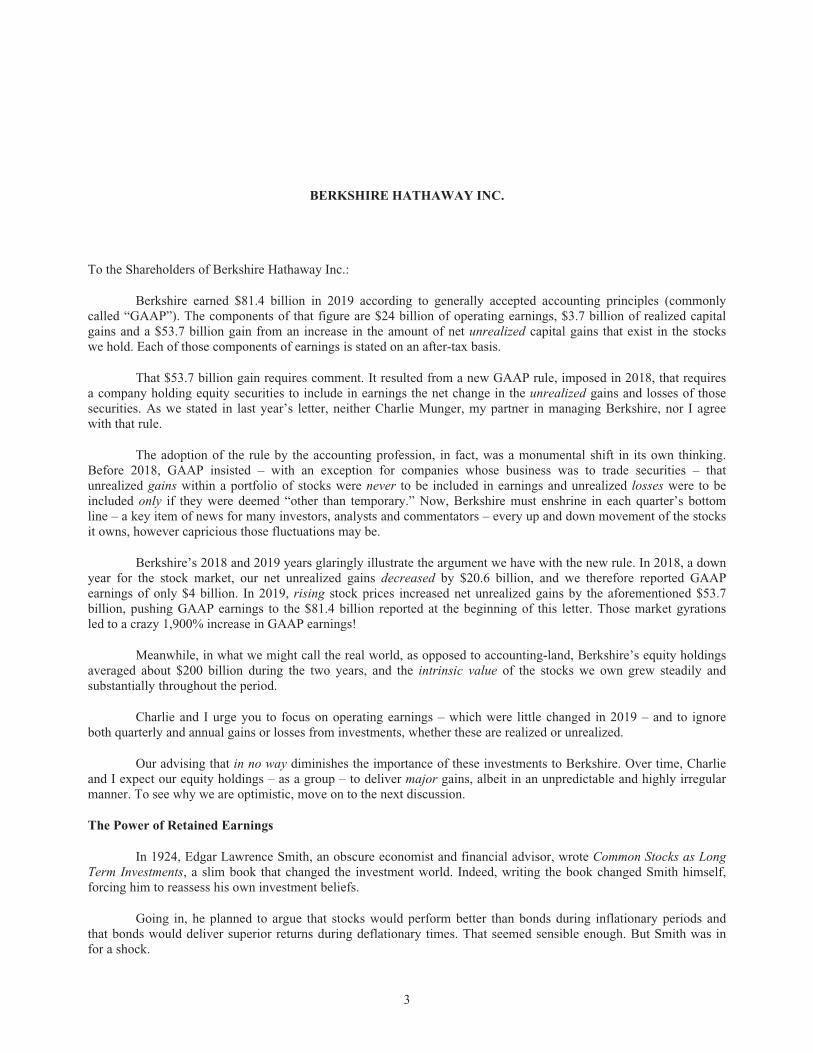
Berkshire earned $81.4 billion in 2019 according to generally accepted accounting principles (commonlycalled “GAAP”). The components of that figure are $24 billion of operating earnings, $3.7 billion of realized capitalgains and a $53.7 billion gain from an increase in the amount of net unrealized capital gains that exist in the stockswe hold. Each of those components of earnings is stated on an after-tax basis.
That $53.7 billion gain requires comment. It resulted from a new GAAP rule, imposed in 2018, that requiresa company holding equity securities to include in earnings the net change in the unrealized gains and losses of thosesecurities. As we stated in last year’s letter, neither Charlie Munger, my partner in managing Berkshire, nor I agreewith that rule.
The adoption of the rule by the accounting profession, in fact, was a monumental shift in its own thinking.Before 2018, GAAP insisted – with an exception for companies whose business was to trade securities – thatunrealized gains within a portfolio of stocks were never to be included in earnings and unrealized losses were to beincluded only if they were deemed “other than temporary.” Now, Berkshire must enshrine in each quarter’s bottomline – a key item of news for many investors, analysts and commentators – every up and down movement of the stocksit owns, however capricious those fluctuations may be.
Berkshire’s 2018 and 2019 years glaringly illustrate the argument we have with the new rule. In 2018, a downyear for the stock market, our net unrealized gains decreased by $20.6 billion, and we therefore reported GAAPearnings of only $4 billion. In 2019, rising stock prices increased net unrealized gains by the aforementioned $53.7billion, pushing GAAP earnings to the $81.4 billion reported at the beginning of this letter. Those market gyrationsled to a crazy 1,900% increase in GAAP earnings!
Meanwhile, in what we might call the real world, as opposed to accounting-land, Berkshire’s equity holdingsaveraged about $200 billion during the two years, and the intrinsic value of the stocks we own grew steadily andsubstantially throughout the period.
Charlie and I urge you to focus on operating earnings – which were little changed in 2019 – and to ignoreboth quarterly and annual gains or losses from investments, whether these are realized or unrealized.
Our advising that in no way diminishes the importance of these investments to Berkshire. Over time, Charlieand I expect our equity holdings – as a group – to deliver major gains, albeit in an unpredictable and highly irregularmanner. To see why we are optimistic, move on to the next discussion.
The Power of Retained Earnings
In 1924, Edgar Lawrence Smith, an obscure economist and financial advisor, wrote Common Stocks as LongTerm Investments, a slim book that changed the investment world. Indeed, writing the book changed Smith himself,forcing him to reassess his own investment beliefs.
Going in, he planned to argue that stocks would perform better than bonds during inflationary periods andthat bonds would deliver superior returns during deflationary times. That seemed sensible enough. But Smith was infor a shock.
3
Vishal
Vishal
Vishal
Vishal
Vishal
Vishal
Vishal
Vishal
Vishal
Vishal
Vishal
Vishal
Vishal
Vishal
Vishal
Vishal
His book began, therefore, with a confession: “These studies are the record of a failure – the failure of factsto sustain a preconceived theory.” Luckily for investors, that failure led Smith to think more deeply about how stocksshould be evaluated.
For the crux of Smith’s insight, I will quote an early reviewer of his book, none other than John MaynardKeynes: “I have kept until last what is perhaps Mr. Smith’s most important, and is certainly his most novel, point.Well-managed industrial companies do not, as a rule, distribute to the shareholders the whole of their earned profits.In good years, if not in all years, they retain a part of their profits and put them back into the business. Thus there isan element of compound interest (Keynes’ italics) operating in favour of a sound industrial investment. Over a periodof years, the real value of the property of a sound industrial is increasing at compound interest, quite apart from thedividends paid out to the shareholders.”
And with that sprinkling of holy water, Smith was no longer obscure.
It’s difficult to understand why retained earnings were unappreciated by investors before Smith’s book waspublished. After all, it was no secret that mind-boggling wealth had earlier been amassed by such titans as Carnegie,Rockefeller and Ford, all of whom had retained a huge portion of their business earnings to fund growth and produceever-greater profits. Throughout America, also, there had long been small-time capitalists who became rich followingthe same playbook.
Nevertheless, when business ownership was sliced into small pieces – “stocks” – buyers in the pre-Smithyears usually thought of their shares as a short-term gamble on market movements. Even at their best, stocks wereconsidered speculations. Gentlemen preferred bonds.
Though investors were slow to wise up, the math of retaining and reinvesting earnings is now wellunderstood. Today, school children learn what Keynes termed “novel”: combining savings with compound interestworks wonders.
* * * * * * * * * * * *At Berkshire, Charlie and I have long focused on using retained earnings advantageously. Sometimes this
job has been easy – at other times, more than difficult, particularly when we began working with huge and ever-growing sums of money.
In our deployment of the funds we retain, we first seek to invest in the many and diverse businesses wealready own. During the past decade, Berkshire’s depreciation charges have aggregated $65 billion whereas thecompany’s internal investments in property, plant and equipment have totaled $121 billion. Reinvestment inproductive operational assets will forever remain our top priority.
In addition, we constantly seek to buy new businesses that meet three criteria. First, they must earn goodreturns on the net tangible capital required in their operation. Second, they must be run by able and honest managers.Finally, they must be available at a sensible price.
When we spot such businesses, our preference would be to buy 100% of them. But the opportunities to makemajor acquisitions possessing our required attributes are rare. Far more often, a fickle stock market serves upopportunities for us to buy large, but non-controlling, positions in publicly-traded companies that meet our standards.
Whichever way we go – controlled companies or only a major stake by way of the stock market – Berkshire’sfinancial results from the commitment will in large part be determined by the future earnings of the business we havepurchased. Nonetheless, there is between the two investment approaches a hugely important accounting difference,essential for you to understand.
4
Vishal
Vishal
Vishal
Vishal
Vishal
Vishal
Vishal
Vishal
Vishal
Vishal
Vishal
Vishal
Vishal
Vishal
Vishal
Vishal
Vishal
Vishal
Vishal
Vishal
Vishal
Vishal
Vishal
Vishal
Vishal
Vishal
Vishal
Vishal
Vishal
Vishal
Vishal
Vishal
Vishal
Vishal
Vishal
Vishal
Vishal
Vishal
Vishal
Vishal
Vishal
Vishal
Vishal
Vishal
Vishal
Vishal
Vishal
Vishal
Vishal

In our controlled companies, (defined as those in which Berkshire owns more than 50% of the shares), theearnings of each business flow directly into the operating earnings that we report to you. What you see is what youget.
In the non-controlled companies, in which we own marketable stocks, only the dividends that Berkshirereceives are recorded in the operating earnings we report. The retained earnings? They’re working hard and creatingmuch added value, but not in a way that deposits those gains directly into Berkshire’s reported earnings.
At almost all major companies other than Berkshire, investors would not find what we’ll call this “non-recognition of earnings” important. For us, however, it is a standout omission, of a magnitude that we lay out for youbelow.
Here, we list our 10 largest stock-market holdings of businesses. The list distinguishes between their earningsthat are reported to you under GAAP accounting – these are the dividends Berkshire receives from those 10 investees– and our share, so to speak, of the earnings the investees retain and put to work. Normally, those companies useretained earnings to expand their business and increase its efficiency. Or sometimes they use those funds to repurchasesignificant portions of their own stock, an act that enlarges Berkshire’s share of the company’s future earnings.
YearendOwnership
Berkshire’s Share (in millions)
Company Dividends(1) Retained Earnings(2)
American Express 18.7% $ 261 $ 998Apple 5.7% 773 2,519Bank of America 10.7% 682 2,167Bank of New York Mellon 9.0% 101 288Coca-Cola 9.3% 640 194Delta Airlines 11.0% 114 416J.P. Morgan Chase 1.9% 216 476Moody’s 13.1% 55 137U.S. Bancorp 9.7% 251 407Wells Fargo 8.4% 705 730
Total $3,798 $8,332
(1) Based on current annual rate.(2) Based on 2019 earnings minus common and preferred dividends paid.
Obviously, the realized gains we will eventually record from partially owning each of these companies willnot neatly correspond to “our” share of their retained earnings. Sometimes, alas, retentions produce nothing. But bothlogic and our past experience indicate that from the group we will realize capital gains at least equal to – and probablybetter than – the earnings of ours that they retained. (When we sell shares and realize gains, we will pay income tax onthe gain at whatever rate then prevails. Currently, the federal rate is 21%.)
It is certain that Berkshire’s rewards from these 10 companies, as well as those from our many other equityholdings, will manifest themselves in a highly irregular manner. Periodically, there will be losses, sometimescompany-specific, sometimes linked to stock-market swoons. At other times – last year was one of those – our gainwill be outsized. Overall, the retained earnings of our investees are certain to be of major importance in the growth ofBerkshire’s value.
Mr. Smith got it right.
5
Vishal
Vishal
Vishal
Vishal
Vishal
Vishal

Non-Insurance Operations
Tom Murphy, a valued director of Berkshire and an all-time great among business managers, long ago gaveme some important advice about acquisitions: “To achieve a reputation as a good manager, just be sure you buy goodbusinesses.”
Over the years Berkshire has acquired many dozens of companies, all of which I initially regarded as “goodbusinesses.” Some, however, proved disappointing; more than a few were outright disasters. A reasonable number, onthe other hand, have exceeded my hopes.
In reviewing my uneven record, I’ve concluded that acquisitions are similar to marriage: They start, of course,with a joyful wedding – but then reality tends to diverge from pre-nuptial expectations. Sometimes, wonderfully, thenew union delivers bliss beyond either party’s hopes. In other cases, disillusionment is swift. Applying those imagesto corporate acquisitions, I’d have to say it is usually the buyer who encounters unpleasant surprises. It’s easy to getdreamy-eyed during corporate courtships.
Pursuing that analogy, I would say that our marital record remains largely acceptable, with all parties happywith the decisions they made long ago. Some of our tie-ups have been positively idyllic. A meaningful number,however, have caused me all too quickly to wonder what I was thinking when I proposed.
Fortunately, the fallout from many of my errors has been reduced by a characteristic shared by mostbusinesses that disappoint: As the years pass, the “poor” business tends to stagnate, thereupon entering a state in whichits operations require an ever-smaller percentage of Berkshire’s capital. Meanwhile, our “good” businesses often tendto grow and find opportunities for investing additional capital at attractive rates. Because of these contrastingtrajectories, the assets employed at Berkshire’s winners gradually become an expanding portion of our total capital.
As an extreme example of those financial movements, witness Berkshire’s original textile business. Whenwe acquired control of the company in early 1965, this beleaguered operation required nearly all of Berkshire’s capital.For some time, therefore, Berkshire’s non-earning textile assets were a huge drag on our overall returns. Eventually,though, we acquired a spread of “good” businesses, a shift that by the early 1980s caused the dwindling textileoperation to employ only a tiny portion of our capital.
Today, we have most of your money deployed in controlled businesses that achieve good-to-excellent returnson the net tangible assets each requires for its operations. Our insurance business has been the superstar. That operationhas special characteristics that give it a unique metric for calibrating success, one unfamiliar to many investors. Wewill save that discussion for the next section.
In the paragraphs that follow, we group our wide array of non-insurance businesses by size of earnings, afterinterest, depreciation, taxes, non-cash compensation, restructuring charges – all of those pesky, but very real, coststhat CEOs and Wall Street sometimes urge investors to ignore. Additional information about these operations can befound on pages K-6 – K-21 and pages K-40 – K-52.
Our BNSF railroad and Berkshire Hathaway Energy (“BHE”) – the two lead dogs of Berkshire’s non-insurance group – earned a combined $8.3 billion in 2019 (including only our 91% share of BHE), an increase of 6%from 2018.
Our next five non-insurance subsidiaries, as ranked by earnings (but presented here alphabetically), ClaytonHomes, International Metalworking, Lubrizol, Marmon and Precision Castparts, had aggregate earnings in 2019 of$4.8 billion, little changed from what these companies earned in 2018.
The next five, similarly ranked and listed (Berkshire Hathaway Automotive, Johns Manville, NetJets, Shawand TTI) earned $1.9 billion last year, up from the $1.7 billion earned by this tier in 2018.
6
Vishal
Vishal
Vishal
Vishal
Vishal
Vishal
Vishal
Vishal
Vishal
Vishal
Vishal
Vishal
Vishal
Vishal
Vishal
Vishal
Vishal
Vishal
Vishal
Vishal
Vishal
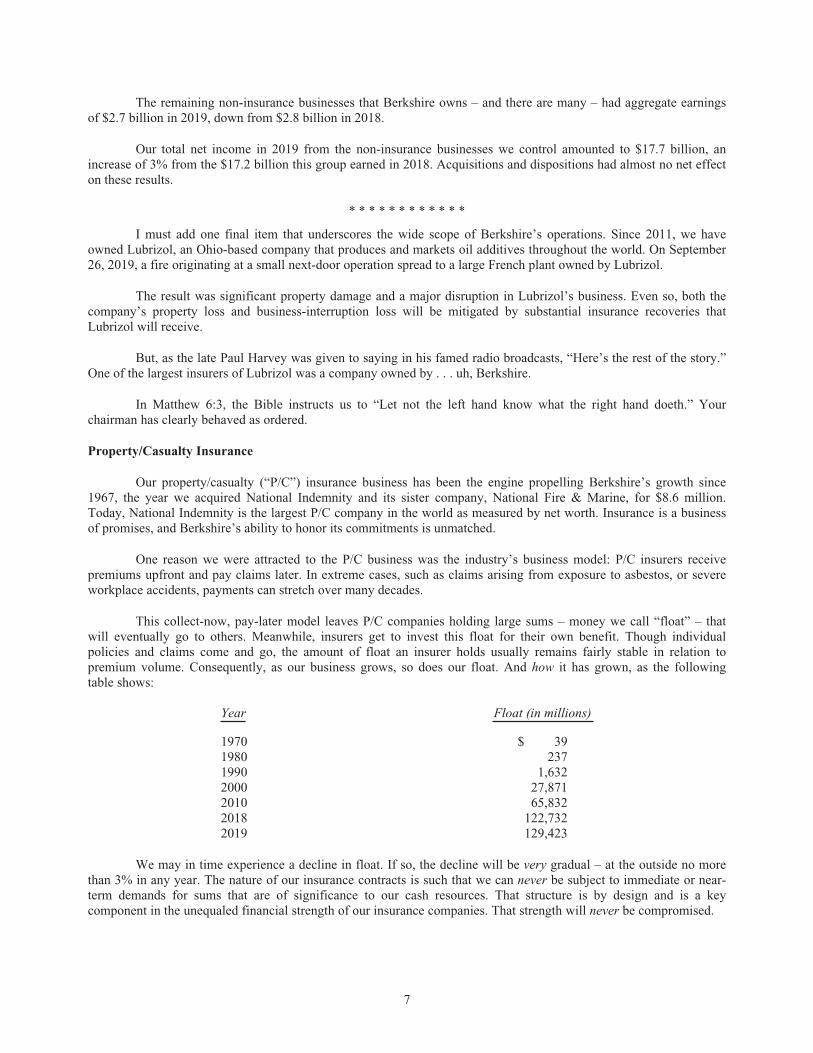
The remaining non-insurance businesses that Berkshire owns – and there are many – had aggregate earningsof $2.7 billion in 2019, down from $2.8 billion in 2018.
Our total net income in 2019 from the non-insurance businesses we control amounted to $17.7 billion, anincrease of 3% from the $17.2 billion this group earned in 2018. Acquisitions and dispositions had almost no net effecton these results.
* * * * * * * * * * * *
I must add one final item that underscores the wide scope of Berkshire’s operations. Since 2011, we haveowned Lubrizol, an Ohio-based company that produces and markets oil additives throughout the world. On September26, 2019, a fire originating at a small next-door operation spread to a large French plant owned by Lubrizol.
The result was significant property damage and a major disruption in Lubrizol’s business. Even so, both thecompany’s property loss and business-interruption loss will be mitigated by substantial insurance recoveries thatLubrizol will receive.
But, as the late Paul Harvey was given to saying in his famed radio broadcasts, “Here’s the rest of the story.”One of the largest insurers of Lubrizol was a company owned by . . . uh, Berkshire.
In Matthew 6:3, the Bible instructs us to “Let not the left hand know what the right hand doeth.” Yourchairman has clearly behaved as ordered.
Property/Casualty Insurance
Our property/casualty (“P/C”) insurance business has been the engine propelling Berkshire’s growth since1967, the year we acquired National Indemnity and its sister company, National Fire & Marine, for $8.6 million.Today, National Indemnity is the largest P/C company in the world as measured by net worth. Insurance is a businessof promises, and Berkshire’s ability to honor its commitments is unmatched.
One reason we were attracted to the P/C business was the industry’s business model: P/C insurers receivepremiums upfront and pay claims later. In extreme cases, such as claims arising from exposure to asbestos, or severeworkplace accidents, payments can stretch over many decades.
This collect-now, pay-later model leaves P/C companies holding large sums – money we call “float” – thatwill eventually go to others. Meanwhile, insurers get to invest this float for their own benefit. Though individualpolicies and claims come and go, the amount of float an insurer holds usually remains fairly stable in relation topremium volume. Consequently, as our business grows, so does our float. And how it has grown, as the followingtable shows:
Year Float (in millions)
1970 $ 391980 2371990 1,6322000 27,8712010 65,8322018 122,7322019 129,423
We may in time experience a decline in float. If so, the decline will be very gradual – at the outside no morethan 3% in any year. The nature of our insurance contracts is such that we can never be subject to immediate or near-term demands for sums that are of significance to our cash resources. That structure is by design and is a keycomponent in the unequaled financial strength of our insurance companies. That strength will never be compromised.
7
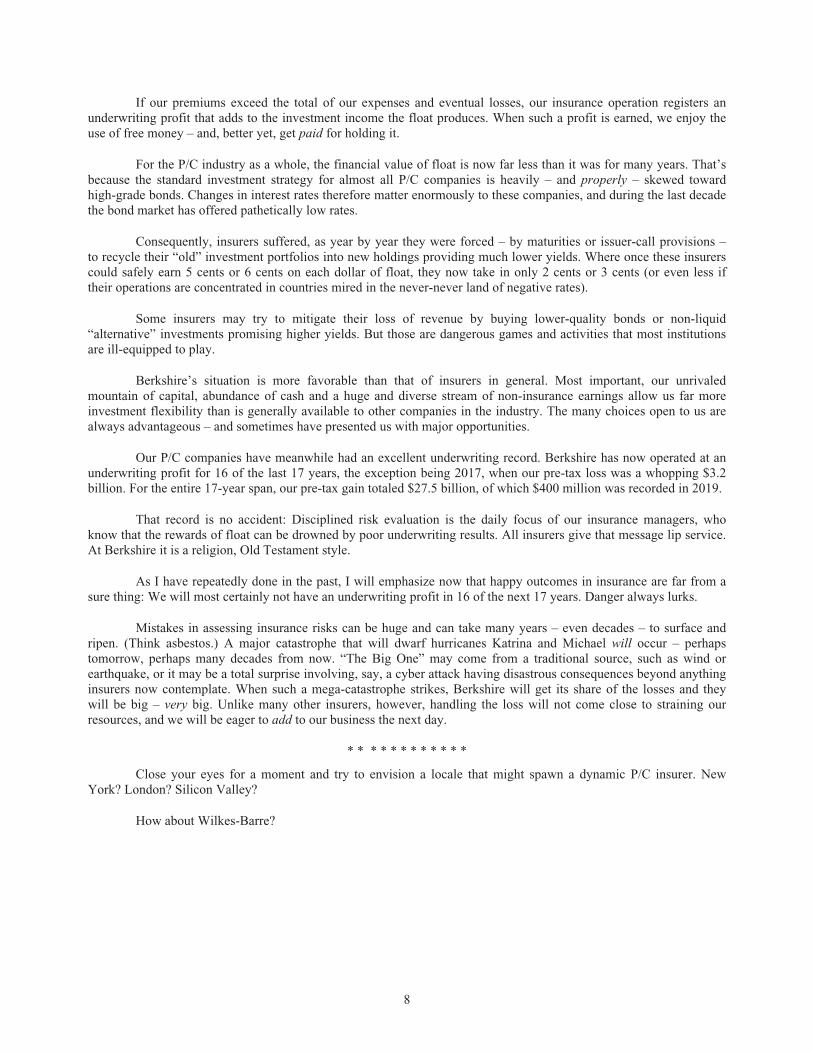
If our premiums exceed the total of our expenses and eventual losses, our insurance operation registers anunderwriting profit that adds to the investment income the float produces. When such a profit is earned, we enjoy theuse of free money – and, better yet, get paid for holding it.
For the P/C industry as a whole, the financial value of float is now far less than it was for many years. That’sbecause the standard investment strategy for almost all P/C companies is heavily – and properly – skewed towardhigh-grade bonds. Changes in interest rates therefore matter enormously to these companies, and during the last decadethe bond market has offered pathetically low rates.
Consequently, insurers suffered, as year by year they were forced – by maturities or issuer-call provisions –to recycle their “old” investment portfolios into new holdings providing much lower yields. Where once these insurerscould safely earn 5 cents or 6 cents on each dollar of float, they now take in only 2 cents or 3 cents (or even less iftheir operations are concentrated in countries mired in the never-never land of negative rates).
Some insurers may try to mitigate their loss of revenue by buying lower-quality bonds or non-liquid“alternative” investments promising higher yields. But those are dangerous games and activities that most institutionsare ill-equipped to play.
Berkshire’s situation is more favorable than that of insurers in general. Most important, our unrivaledmountain of capital, abundance of cash and a huge and diverse stream of non-insurance earnings allow us far moreinvestment flexibility than is generally available to other companies in the industry. The many choices open to us arealways advantageous – and sometimes have presented us with major opportunities.
Our P/C companies have meanwhile had an excellent underwriting record. Berkshire has now operated at anunderwriting profit for 16 of the last 17 years, the exception being 2017, when our pre-tax loss was a whopping $3.2billion. For the entire 17-year span, our pre-tax gain totaled $27.5 billion, of which $400 million was recorded in 2019.
That record is no accident: Disciplined risk evaluation is the daily focus of our insurance managers, whoknow that the rewards of float can be drowned by poor underwriting results. All insurers give that message lip service.At Berkshire it is a religion, Old Testament style.
As I have repeatedly done in the past, I will emphasize now that happy outcomes in insurance are far from asure thing: We will most certainly not have an underwriting profit in 16 of the next 17 years. Danger always lurks.
Mistakes in assessing insurance risks can be huge and can take many years – even decades – to surface andripen. (Think asbestos.) A major catastrophe that will dwarf hurricanes Katrina and Michael will occur – perhapstomorrow, perhaps many decades from now. “The Big One” may come from a traditional source, such as wind orearthquake, or it may be a total surprise involving, say, a cyber attack having disastrous consequences beyond anythinginsurers now contemplate. When such a mega-catastrophe strikes, Berkshire will get its share of the losses and theywill be big – very big. Unlike many other insurers, however, handling the loss will not come close to straining ourresources, and we will be eager to add to our business the next day.
* * * * * * * * * * * *
Close your eyes for a moment and try to envision a locale that might spawn a dynamic P/C insurer. NewYork? London? Silicon Valley?
How about Wilkes-Barre?
8

Late in 2012, Ajit Jain, the invaluable manager of our insurance operations, called to tell me that he wasbuying a tiny company – GUARD Insurance Group – in that small Pennsylvania city for $221 million (roughly its networth at the time). He added that Sy Foguel, GUARD’s CEO, was going to be a star at Berkshire. Both GUARD andSy were new names to me.
Bingo and bingo: In 2019, GUARD had premium volume of $1.9 billion, up 379% since 2012, and alsodelivered a satisfactory underwriting profit. Since joining Berkshire, Sy has led the company into both new productsand new regions of the country and has increased GUARD’s float by 265%.
In 1967, Omaha seemed an unlikely launching pad for a P/C giant. Wilkes-Barre may well deliver a similarsurprise.
Berkshire Hathaway Energy
Berkshire Hathaway Energy is now celebrating its 20th year under our ownership. That anniversary suggeststhat we should be catching up with the company’s accomplishments.
We’ll start with the topic of electricity rates. When Berkshire entered the utility business in 2000, purchasing76% of BHE, the company’s residential customers in Iowa paid an average of 8.8 cents per kilowatt-hour (kWh).Prices for residential customers have since risen less than 1% a year, and we have promised that there will be no baserate price increases through 2028. In contrast, here’s what is happening at the other large investor-owned Iowa utility:Last year, the rates it charged its residential customers were 61% higher than BHE’s. Recently, that utility received arate increase that will widen the gap to 70%.
The extraordinary differential between our rates and theirs is largely the result of our huge accomplishmentsin converting wind into electricity. In 2021, we expect BHE’s operation to generate about 25.2 million megawatt-hoursof electricity (MWh) in Iowa from wind turbines that it both owns and operates. That output will totally cover theannual needs of its Iowa customers, which run to about 24.6 million MWh. In other words, our utility will have attainedwind self-sufficiency in the state of Iowa.
In still another contrast, that other Iowa utility generates less than 10% of its power from wind. Furthermore,we know of no other investor-owned utility, wherever located, that by 2021 will have achieved a position of windself-sufficiency. In 2000, BHE was serving an agricultural-based economy; today, three of its five largest customersare high-tech giants. I believe their decisions to site plants in Iowa were in part based upon BHE’s ability to deliverrenewable, low-cost energy.
Of course, wind is intermittent, and our blades in Iowa turn only part of the time. In certain periods, whenthe air is still, we look to our non-wind generating capacity to secure the electricity we need. At opposite times, wesell the excess power that wind provides us to other utilities, serving them through what’s called “the grid.” The powerwe sell them supplants their need for a carbon resource – coal, say, or natural gas.
Berkshire Hathaway now owns 91% of BHE in partnership with Walter Scott, Jr. and Greg Abel. BHE hasnever paid Berkshire Hathaway a dividend since our purchase and has, as the years have passed, retained $28 billionof earnings. That pattern is an outlier in the world of utilities, whose companies customarily pay big dividends –sometimes reaching, or even exceeding, 80% of earnings. Our view: The more we can invest, the more we like it.
Today, BHE has the operating talent and experience to manage truly huge utility projects – requiringinvestments of $100 billion or more – that could support infrastructure benefitting our country, our communities andour shareholders. We stand ready, willing and able to take on such opportunities.
9
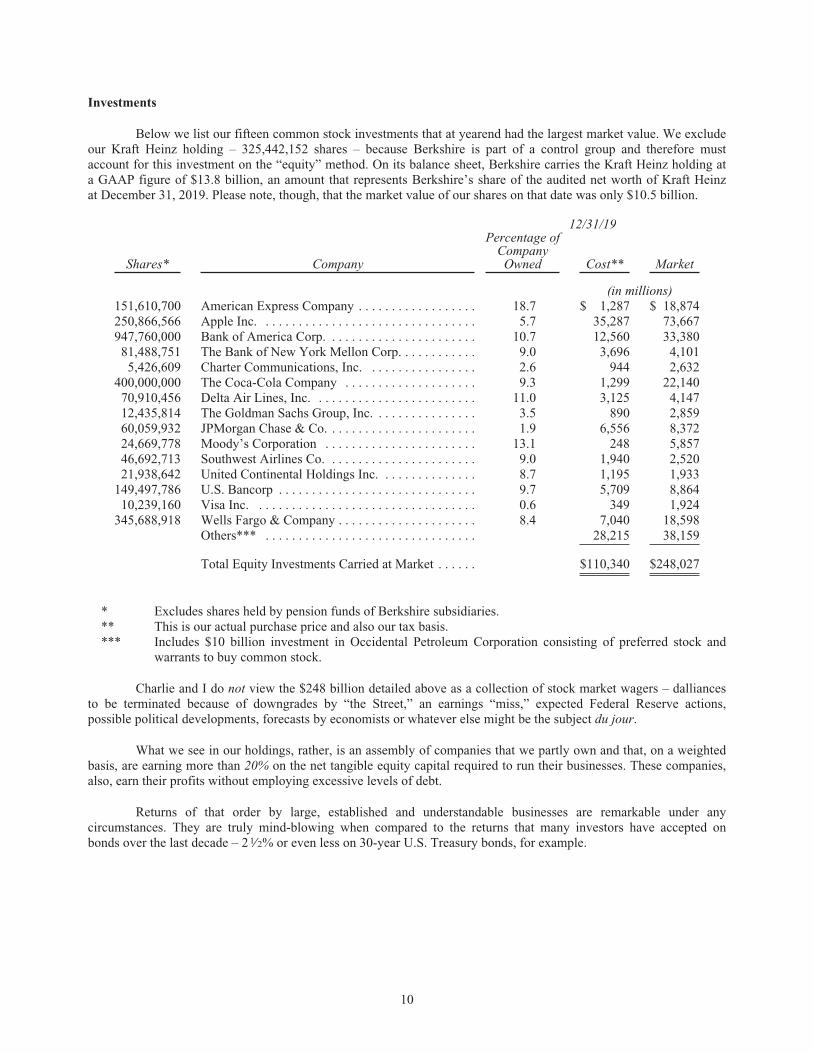
Investments
Below we list our fifteen common stock investments that at yearend had the largest market value. We excludeour Kraft Heinz holding – 325,442,152 shares – because Berkshire is part of a control group and therefore mustaccount for this investment on the “equity” method. On its balance sheet, Berkshire carries the Kraft Heinz holding ata GAAP figure of $13.8 billion, an amount that represents Berkshire’s share of the audited net worth of Kraft Heinzat December 31, 2019. Please note, though, that the market value of our shares on that date was only $10.5 billion.
12/31/19
Shares* Company
Percentage ofCompanyOwned Cost** Market
(in millions)151,610,700 American Express Company . . . . . . . . . . . . . . . . . . 18.7 $ 1,287 $ 18,874250,866,566 Apple Inc. . . . . . . . . . . . . . . . . . . . . . . . . . . . . . . . . 5.7 35,287 73,667947,760,000 Bank of America Corp. . . . . . . . . . . . . . . . . . . . . . . 10.7 12,560 33,380
81,488,751 The Bank of New York Mellon Corp. . . . . . . . . . . . 9.0 3,696 4,1015,426,609 Charter Communications, Inc. . . . . . . . . . . . . . . . . 2.6 944 2,632
400,000,000 The Coca-Cola Company . . . . . . . . . . . . . . . . . . . . 9.3 1,299 22,14070,910,456 Delta Air Lines, Inc. . . . . . . . . . . . . . . . . . . . . . . . . 11.0 3,125 4,14712,435,814 The Goldman Sachs Group, Inc. . . . . . . . . . . . . . . . 3.5 890 2,85960,059,932 JPMorgan Chase & Co. . . . . . . . . . . . . . . . . . . . . . . 1.9 6,556 8,37224,669,778 Moody’s Corporation . . . . . . . . . . . . . . . . . . . . . . . 13.1 248 5,85746,692,713 Southwest Airlines Co. . . . . . . . . . . . . . . . . . . . . . . 9.0 1,940 2,52021,938,642 United Continental Holdings Inc. . . . . . . . . . . . . . . 8.7 1,195 1,933
149,497,786 U.S. Bancorp . . . . . . . . . . . . . . . . . . . . . . . . . . . . . . 9.7 5,709 8,86410,239,160 Visa Inc. . . . . . . . . . . . . . . . . . . . . . . . . . . . . . . . . . 0.6 349 1,924
345,688,918 Wells Fargo & Company . . . . . . . . . . . . . . . . . . . . . 8.4 7,040 18,598Others*** . . . . . . . . . . . . . . . . . . . . . . . . . . . . . . . . 28,215 38,159
Total Equity Investments Carried at Market . . . . . . $110,340 $248,027
* Excludes shares held by pension funds of Berkshire subsidiaries.** This is our actual purchase price and also our tax basis.*** Includes $10 billion investment in Occidental Petroleum Corporation consisting of preferred stock and
warrants to buy common stock.
Charlie and I do not view the $248 billion detailed above as a collection of stock market wagers – dalliancesto be terminated because of downgrades by “the Street,” an earnings “miss,” expected Federal Reserve actions,possible political developments, forecasts by economists or whatever else might be the subject du jour.
What we see in our holdings, rather, is an assembly of companies that we partly own and that, on a weightedbasis, are earning more than 20% on the net tangible equity capital required to run their businesses. These companies,also, earn their profits without employing excessive levels of debt.
Returns of that order by large, established and understandable businesses are remarkable under anycircumstances. They are truly mind-blowing when compared to the returns that many investors have accepted onbonds over the last decade – 21⁄2% or even less on 30-year U.S. Treasury bonds, for example.
10
Vishal
Vishal
Vishal
Vishal
Forecasting interest rates has never been our game, and Charlie and I have no idea what rates will averageover the next year, or ten or thirty years. Our perhaps jaundiced view is that the pundits who opine on these subjectsreveal, by that very behavior, far more about themselves than they reveal about the future.
What we can say is that if something close to current rates should prevail over the coming decades and ifcorporate tax rates also remain near the low level businesses now enjoy, it is almost certain that equities will over timeperform far better than long-term, fixed-rate debt instruments.
That rosy prediction comes with a warning: Anything can happen to stock prices tomorrow. Occasionally,there will be major drops in the market, perhaps of 50% magnitude or even greater. But the combination of TheAmerican Tailwind, about which I wrote last year, and the compounding wonders described by Mr. Smith, will makeequities the much better long-term choice for the individual who does not use borrowed money and who can controlhis or her emotions. Others? Beware!
The Road Ahead
Three decades ago, my Midwestern friend, Joe Rosenfield, then in his 80s, received an irritating letter fromhis local newspaper. In blunt words, the paper asked for biographical data it planned to use in Joe’s obituary. Joedidn’t respond. So? A month later, he got a second letter from the paper, this one labeled “URGENT.”
Charlie and I long ago entered the urgent zone. That’s not exactly great news for us. But Berkshireshareholders need not worry: Your company is 100% prepared for our departure.
The two of us base our optimism upon five factors. First, Berkshire’s assets are deployed in an extraordinaryvariety of wholly or partly-owned businesses that, averaged out, earn attractive returns on the capital they use. Second,Berkshire’s positioning of its “controlled” businesses within a single entity endows it with some important andenduring economic advantages. Third, Berkshire’s financial affairs will unfailingly be managed in a manner allowingthe company to withstand external shocks of an extreme nature. Fourth, we possess skilled and devoted top managersfor whom running Berkshire is far more than simply having a high-paying and/or prestigious job. Finally, Berkshire’sdirectors – your guardians – are constantly focused on both the welfare of owners and the nurturing of a culture thatis rare among giant corporations. (The value of this culture is explored in Margin of Trust, a new book by LarryCunningham and Stephanie Cuba that will be available at our annual meeting.)
Charlie and I have very pragmatic reasons for wanting to assure Berkshire’s prosperity in the years followingour exit: The Mungers have Berkshire holdings that dwarf any of the family’s other investments, and I have a full 99%of my net worth lodged in Berkshire stock. I have never sold any shares and have no plans to do so. My only disposalof Berkshire shares, aside from charitable donations and minor personal gifts, took place in 1980, when I, along withother Berkshire stockholders who elected to participate, exchanged some of our Berkshire shares for the shares of anIllinois bank that Berkshire had purchased in 1969 and that, in 1980, needed to be offloaded because of changes in thebank holding company law.
Today, my will specifically directs its executors – as well as the trustees who will succeed them inadministering my estate after the will is closed – not to sell any Berkshire shares. My will also absolves both theexecutors and the trustees from liability for maintaining what obviously will be an extreme concentration of assets.
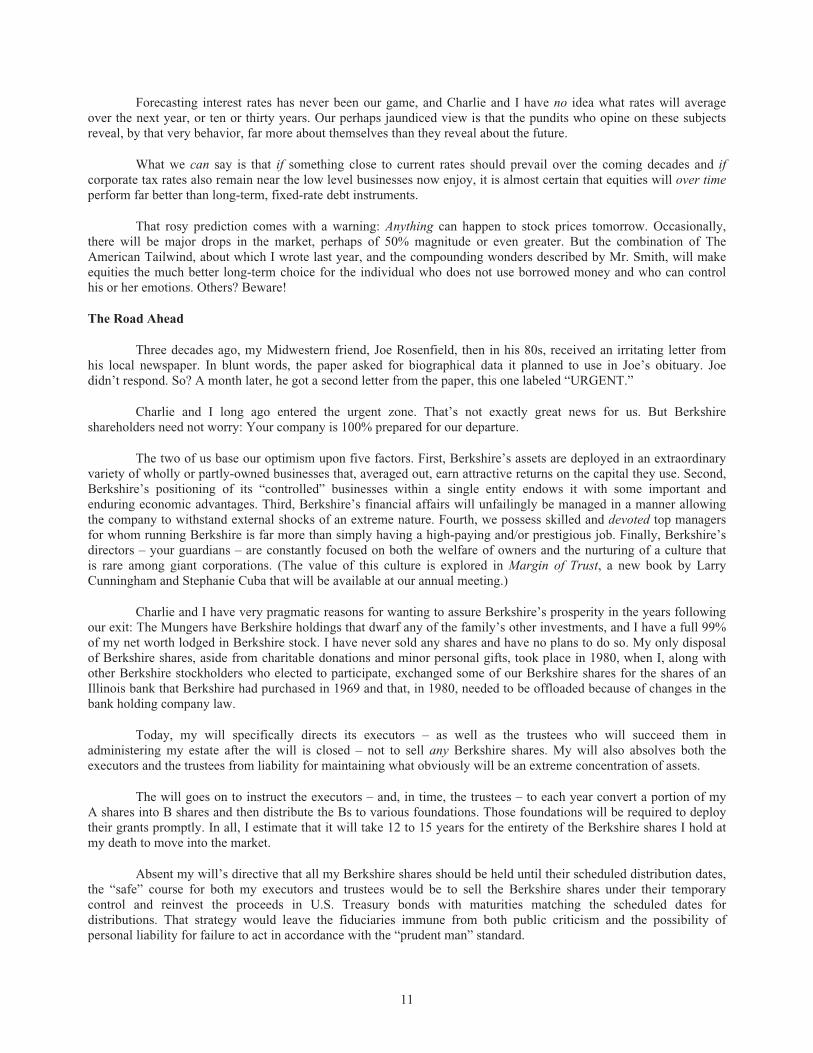
The will goes on to instruct the executors – and, in time, the trustees – to each year convert a portion of myA shares into B shares and then distribute the Bs to various foundations. Those foundations will be required to deploytheir grants promptly. In all, I estimate that it will take 12 to 15 years for the entirety of the Berkshire shares I hold atmy death to move into the market.
Absent my will’s directive that all my Berkshire shares should be held until their scheduled distribution dates,the “safe” course for both my executors and trustees would be to sell the Berkshire shares under their temporarycontrol and reinvest the proceeds in U.S. Treasury bonds with maturities matching the scheduled dates fordistributions. That strategy would leave the fiduciaries immune from both public criticism and the possibility ofpersonal liability for failure to act in accordance with the “prudent man” standard.
11
Vishal
Vishal
Vishal
Vishal
Vishal
Vishal
Vishal
Vishal
Vishal
Vishal
Vishal
Vishal
Vishal
Vishal
Vishal
Vishal
Vishal
Vishal
Vishal
Vishal
Vishal
Vishal
Vishal
Vishal
Vishal
Vishal
Vishal
Vishal
Vishal
Vishal
I myself feel comfortable that Berkshire shares will provide a safe and rewarding investment during thedisposal period. There is always a chance – unlikely, but not negligible – that events will prove me wrong. I believe,however, that there is a high probability that my directive will deliver substantially greater resources to society thanwould result from a conventional course of action.
Key to my “Berkshire-only” instructions is my faith in the future judgment and fidelity of Berkshire directors.They will regularly be tested by Wall Streeters bearing fees. At many companies, these super-salesmen might win. Ido not, however, expect that to happen at Berkshire.
Boards of Directors
In recent years, both the composition of corporate boards and their purpose have become hot topics. Once,debate about the responsibilities of boards was largely limited to lawyers; today, institutional investors and politicianshave weighed in as well.
My credentials for discussing corporate governance include the fact that, over the last 62 years, I have servedas a director of 21 publicly-owned companies (listed below). In all but two of them, I have represented a substantialholding of stock. In a few cases, I have tried to implement important change.
During the first 30 or so years of my services, it was rare to find a woman in the room unless she representeda family controlling the enterprise. This year, it should be noted, marks the 100th anniversary of the 19th Amendment,which guaranteed American women the right to have their voices heard in a voting booth. Their attaining similar statusin a board room remains a work in progress.
Over the years, many new rules and guidelines pertaining to board composition and duties have come intobeing. The bedrock challenge for directors, nevertheless, remains constant: Find and retain a talented CEO –possessing integrity, for sure – who will be devoted to the company for his/her business lifetime. Often, that task ishard. When directors get it right, though, they need to do little else. But when they mess it up, . . . . . .
Audit committees now work much harder than they once did and almost always view the job with appropriateseriousness. Nevertheless, these committees remain no match for managers who wish to game numbers, an offensethat has been encouraged by the scourge of earnings “guidance” and the desire of CEOs to “hit the number.” My directexperience (limited, thankfully) with CEOs who have played with a company’s numbers indicates that they were moreoften prompted by ego than by a desire for financial gain.
Compensation committees now rely much more heavily on consultants than they used to. Consequently,compensation arrangements have become more complicated – what committee member wants to explain paying largefees year after year for a simple plan? – and the reading of proxy material has become a mind-numbing experience.
One very important improvement in corporate governance has been mandated: a regularly-scheduled“executive session” of directors at which the CEO is barred. Prior to that change, truly frank discussions of a CEO’sskills, acquisition decisions and compensation were rare.
Acquisition proposals remain a particularly vexing problem for board members. The legal orchestration formaking deals has been refined and expanded (a word aptly describing attendant costs as well). But I have yet to see aCEO who craves an acquisition bring in an informed and articulate critic to argue against it. And yes, include meamong the guilty.
Berkshire, Blue Chip Stamps, Cap Cities-ABC, Coca-Cola, Data Documents, Dempster, General Growth, Gillette,Kraft Heinz, Maracaibo Oil, Munsingwear, Omaha National Bank, Pinkerton’s, Portland Gas Light, Salomon,Sanborn Map, Tribune Oil, U.S. Air, Vornado, Washington Post, Wesco Financial
12
Overall, the deck is stacked in favor of the deal that’s coveted by the CEO and his/her obliging staff. It wouldbe an interesting exercise for a company to hire two “expert” acquisition advisors, one pro and one con, to deliver hisor her views on a proposed deal to the board – with the winning advisor to receive, say, ten times a token sum paid tothe loser. Don’t hold your breath awaiting this reform: The current system, whatever its shortcomings for shareholders,works magnificently for CEOs and the many advisors and other professionals who feast on deals. A venerable cautionwill forever be true when advice from Wall Street is contemplated: Don’t ask the barber whether you need a haircut.
Over the years, board “independence” has become a new area of emphasis. One key point relating to thistopic, though, is almost invariably overlooked: Director compensation has now soared to a level that inevitably makespay a subconscious factor affecting the behavior of many non-wealthy members. Think, for a moment, of the directorearning $250,000-300,000 for board meetings consuming a pleasant couple of days six or so times a year. Frequently,the possession of one such directorship bestows on its holder three to four times the annual median income of U.S.households. (I missed much of this gravy train: As a director of Portland Gas Light in the early 1960s, I received $100annually for my service. To earn this princely sum, I commuted to Maine four times a year.)
And job security now? It’s fabulous. Board members may get politely ignored, but they seldom get fired.Instead, generous age limits – usually 70 or higher – act as the standard method for the genteel ejection of directors.
Is it any wonder that a non-wealthy director (“NWD”) now hopes – or even yearns – to be asked to join asecond board, thereby vaulting into the $500,000-600,000 class? To achieve this goal, the NWD will need help. TheCEO of a company searching for board members will almost certainly check with the NWD’s current CEO as towhether NWD is a “good” director. “Good,” of course, is a code word. If the NWD has seriously challenged his/herpresent CEO’s compensation or acquisition dreams, his or her candidacy will silently die. When seeking directors,CEOs don’t look for pit bulls. It’s the cocker spaniel that gets taken home.
Despite the illogic of it all, the director for whom fees are important – indeed, craved – is almost universallyclassified as “independent” while many directors possessing fortunes very substantially linked to the welfare of thecorporation are deemed lacking in independence. Not long ago, I looked at the proxy material of a large Americancompany and found that eight directors had never purchased a share of the company’s stock using their own money.(They, of course, had received grants of stock as a supplement to their generous cash compensation.) This particularcompany had long been a laggard, but the directors were doing wonderfully.
Paid-with-my-own-money ownership, of course, does not create wisdom or ensure business smarts.Nevertheless, I feel better when directors of our portfolio companies have had the experience of purchasing shareswith their savings, rather than simply having been the recipients of grants.
* * * * * * * * * * * *
Here, a pause is due: I’d like you to know that almost all of the directors I have met over the years have beendecent, likable and intelligent. They dressed well, made good neighbors and were fine citizens. I’ve enjoyed theircompany. Among the group are some men and women that I would not have met except for our mutual board serviceand who have become close friends.
Nevertheless, many of these good souls are people whom I would never have chosen to handle money orbusiness matters. It simply was not their game.
They, in turn, would never have asked me for help in removing a tooth, decorating their home or improvingtheir golf swing. Moreover, if I were ever scheduled to appear on Dancing With the Stars, I would immediately seekrefuge in the Witness Protection Program. We are all duds at one thing or another. For most of us, the list is long. Theimportant point to recognize is that if you are Bobby Fischer, you must play only chess for money.
At Berkshire, we will continue to look for business-savvy directors who are owner-oriented and arrive witha strong specific interest in our company. Thought and principles, not robot-like “process,” will guide their actions.In representing your interests, they will, of course, seek managers whose goals include delighting their customers,cherishing their associates and acting as good citizens of both their communities and our country.
13
Vishal
Vishal
Vishal
Vishal
Vishal
Vishal
Vishal
Vishal
Vishal
Vishal
Vishal
Vishal
Vishal
Vishal
Vishal
Those objectives are not new. They were the goals of able CEOs sixty years ago and remain so. Who wouldhave it otherwise?
Short Subjects
In past reports, we’ve discussed both the sense and nonsense of stock repurchases. Our thinking, boiled down:Berkshire will buy back its stock only if a) Charlie and I believe that it is selling for less than it is worth and b) thecompany, upon completing the repurchase, is left with ample cash.
Calculations of intrinsic value are far from precise. Consequently, neither of us feels any urgency to buy anestimated $1 of value for a very real 95 cents. In 2019, the Berkshire price/value equation was modestly favorable attimes, and we spent $5 billion in repurchasing about 1% of the company.
Over time, we want Berkshire’s share count to go down. If the price-to-value discount (as we estimate it)widens, we will likely become more aggressive in purchasing shares. We will not, however, prop the stock at anylevel.
Shareholders having at least $20 million in value of A or B shares and an inclination to sell shares to Berkshiremay wish to have their broker contact Berkshire’s Mark Millard at 402-346-1400. We request that you phone Markbetween 8:00-8:30 a.m. or 3:00-3:30 p.m. Central Time, calling only if you are ready to sell.
* * * * * * * * * * * *
In 2019, Berkshire sent $3.6 billion to the U.S. Treasury to pay its current income tax. The U.S. governmentcollected $243 billion from corporate income tax payments during the same period. From these statistics, you can takepride that your company delivered 11⁄2% of the federal income taxes paid by all of corporate America.
Fifty-five years ago, when Berkshire entered its current incarnation, the company paid nothing in federalincome tax. (For good reason, too: Over the previous decade, the struggling business had recorded a net loss.) Sincethen, as Berkshire retained nearly all of its earnings, the beneficiaries of that policy became not only the company’sshareholders but also the federal government. In most future years, we both hope and expect to send far larger sumsto the Treasury.
* * * * * * * * * * * *
On pages A-2 – A-3, you will find details about our annual meeting, which will be held on May 2, 2020.Yahoo, as usual, will be streaming the event worldwide. There will be one important change, however, in our format:I’ve had suggestions from shareholders, media and board members that Ajit Jain and Greg Abel – our two keyoperating managers – be given more exposure at the meeting. That change makes great sense. They are outstandingindividuals, both as managers and as human beings, and you should hear more from them.
Shareholders who this year send a question to be asked by our three long-serving journalists may specify thatit be posed to Ajit or Greg. They, like Charlie and me, will not have even a hint of what the questions will be.
The journalists will alternate questions with those from the audience, who also can direct questions to any ofthe four of us. So polish up your zingers.
* * * * * * * * * * * *
On May 2nd, come to Omaha. Meet your fellow capitalists. Buy some Berkshire products. Have fun. Charlieand I – along with the entire Berkshire gang – are looking forward to seeing you.
February 22, 2020 Warren E. BuffettChairman of the Board
14
Vishal
Vishal
Vishal
Vishal
Vishal
Vishal
Vishal
Vishal
Vishal
Vishal
Vishal
Vishal
Vishal
Vishal
Vishal
Vishal
Vishal
Vishal
Vishal
Vishal
Vishal
Vishal
Vishal
Vishal
Vishal
Vishal
Vishal