Berenberg European AerospaceDefence sector report Jun 17 2014 330pgs (Initiations)
330
BERENBERG EQUITY RESEARCH Aerospace & Defence Flying through the turbulence Andrew Gollan Analyst +44 20 3207 7891 [email protected] Chris Armstrong Specialist Sales +44 20 3207 7809 [email protected] 16 June 2014 Aerospace & Defence
-
Upload
angadsawhney -
Category
Documents
-
view
79 -
download
8
description
Berenberg European AerospaceDefence sector report Jun 17 2014 330pgs .
Transcript of Berenberg European AerospaceDefence sector report Jun 17 2014 330pgs (Initiations)
BERENBERG EQUITY RESEARCH BERENBERG EQUITY RESEARCH
Aerospace & Defence
Flying through the turbulence
Andrew Gollan
Analyst
+44 20 3207 7891
Chris Armstrong
Specialist Sales
+44 20 3207 7809
16 June 2014
Aerospace & Defence

What is Berenberg THOUGHT LEADERSHIP?
Berenberg's analysts are recognised by investors and by corporates for their in-depth research into the industries they cover.
Our THOUGHT LEADERSHIP brand will highlight the deep-dive fundamental industry research that we feel is most important to informing our forecasts and ratings.
For our disclosures in respect of section 34b of the German Securities Trading Act (Wertpapierhandelsgesetz – WpHG) and our disclaimer please see the end of this document. Please note that the use of this research report is subject to the conditions and restrictions set forth in the disclosures and the disclaimer at the end of this document.
Aerospace & Defence
Table of contents Flying through the turbulence 1
Sector overview 2
Aerospace and defence – 10 charts to bring us up to speed 6
Stock summary – five key picks 8
Stock summary – the rest 11
UK and European aerospace and defence valuation table 14
US aerospace and defence valuation table 15
Share price performance 16
Valuation charts 18
Civil aerospace – OE 20
Commercial jets delivery profile 25
Civil aerospace – aftermarket 26
Defence – market outlook 28
Global trends 28
US defence – a stabilising situation 29
Appendix 1: Financial performance – growth and margins 33
Appendix 2: Financial performance – returns, cash, balance sheet 34
Appendix 3: EPS forecast trends by company 35
Appendix 4: Upcoming events 37
Companies
Airbus Group 38
BAE Systems 65
Cobham 89
GKN 112
Meggitt 142
MTU Aero Engines 169
QinetiQ 196
Aerospace & Defence
Rheinmetall 219
Rolls-Royce 244
Safran 269
Ultra Electronics 296
Contacts: Investment Banking 321
Disclosures in respect of section 34b of the German Securities Trading Act (Wertpapierhandelsgesetz – WpHG) 322
Aerospace & Defence
1
Flying through the turbulence
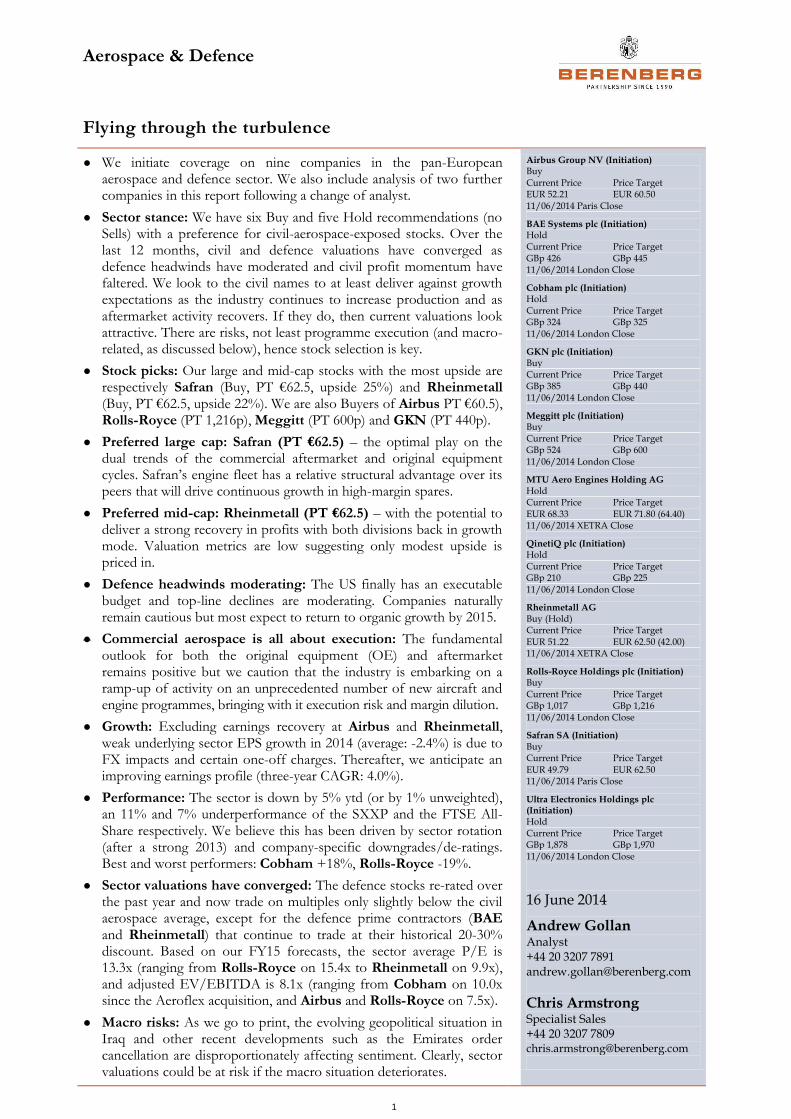
● We initiate coverage on nine companies in the pan-European aerospace and defence sector. We also include analysis of two further companies in this report following a change of analyst.
● Sector stance: We have six Buy and five Hold recommendations (no Sells) with a preference for civil-aerospace-exposed stocks. Over the last 12 months, civil and defence valuations have converged as defence headwinds have moderated and civil profit momentum have faltered. We look to the civil names to at least deliver against growth expectations as the industry continues to increase production and as aftermarket activity recovers. If they do, then current valuations look attractive. There are risks, not least programme execution (and macro-related, as discussed below), hence stock selection is key.
● Stock picks: Our large and mid-cap stocks with the most upside are respectively Safran (Buy, PT €62.5, upside 25%) and Rheinmetall (Buy, PT €62.5, upside 22%). We are also Buyers of Airbus PT €60.5), Rolls-Royce (PT 1,216p), Meggitt (PT 600p) and GKN (PT 440p).
● Preferred large cap: Safran (PT €62.5) – the optimal play on the dual trends of the commercial aftermarket and original equipment cycles. Safran’s engine fleet has a relative structural advantage over its peers that will drive continuous growth in high-margin spares.
● Preferred mid-cap: Rheinmetall (PT €62.5) – with the potential to deliver a strong recovery in profits with both divisions back in growth mode. Valuation metrics are low suggesting only modest upside is priced in.
● Defence headwinds moderating: The US finally has an executable budget and top-line declines are moderating. Companies naturally remain cautious but most expect to return to organic growth by 2015.
● Commercial aerospace is all about execution: The fundamental outlook for both the original equipment (OE) and aftermarket remains positive but we caution that the industry is embarking on a ramp-up of activity on an unprecedented number of new aircraft and engine programmes, bringing with it execution risk and margin dilution.
● Growth: Excluding earnings recovery at Airbus and Rheinmetall, weak underlying sector EPS growth in 2014 (average: -2.4%) is due to FX impacts and certain one-off charges. Thereafter, we anticipate an improving earnings profile (three-year CAGR: 4.0%).
● Performance: The sector is down by 5% ytd (or by 1% unweighted), an 11% and 7% underperformance of the SXXP and the FTSE All-Share respectively. We believe this has been driven by sector rotation (after a strong 2013) and company-specific downgrades/de-ratings. Best and worst performers: Cobham +18%, Rolls-Royce -19%.
● Sector valuations have converged: The defence stocks re-rated over the past year and now trade on multiples only slightly below the civil aerospace average, except for the defence prime contractors (BAE and Rheinmetall) that continue to trade at their historical 20-30% discount. Based on our FY15 forecasts, the sector average P/E is 13.3x (ranging from Rolls-Royce on 15.4x to Rheinmetall on 9.9x), and adjusted EV/EBITDA is 8.1x (ranging from Cobham on 10.0x since the Aeroflex acquisition, and Airbus and Rolls-Royce on 7.5x).
● Macro risks: As we go to print, the evolving geopolitical situation in Iraq and other recent developments such as the Emirates order cancellation are disproportionately affecting sentiment. Clearly, sector valuations could be at risk if the macro situation deteriorates.
Airbus Group NV (Initiation) Buy Current Price EUR 52.21
Price Target EUR 60.50
11/06/2014 Paris Close
BAE Systems plc (Initiation) Hold Current Price GBp 426
Price Target GBp 445
11/06/2014 London Close
Cobham plc (Initiation) Hold Current Price GBp 324
Price Target GBp 325
11/06/2014 London Close
GKN plc (Initiation) Buy Current Price GBp 385
Price Target GBp 440
11/06/2014 London Close
Meggitt plc (Initiation) Buy Current Price GBp 524
Price Target GBp 600
11/06/2014 London Close
MTU Aero Engines Holding AG Hold Current Price EUR 68.33
Price Target EUR 71.80 (64.40)
11/06/2014 XETRA Close
QinetiQ plc (Initiation) Hold Current Price GBp 210
Price Target GBp 225
11/06/2014 London Close
Rheinmetall AG Buy (Hold) Current Price EUR 51.22
Price Target EUR 62.50 (42.00)
11/06/2014 XETRA Close
Rolls-Royce Holdings plc (Initiation) Buy Current Price GBp 1,017
Price Target GBp 1,216
11/06/2014 London Close
Safran SA (Initiation) Buy Current Price EUR 49.79
Price Target EUR 62.50
11/06/2014 Paris Close
Ultra Electronics Holdings plc (Initiation) Hold
Current Price GBp 1,878
Price Target GBp 1,970
11/06/2014 London Close
16 June 2014
Andrew Gollan Analyst +44 20 3207 7891 [email protected]
Chris Armstrong
Specialist Sales +44 20 3207 7809 [email protected]
Aerospace & Defence
2
Sector overview
Initiating coverage on the European aerospace and defence sector
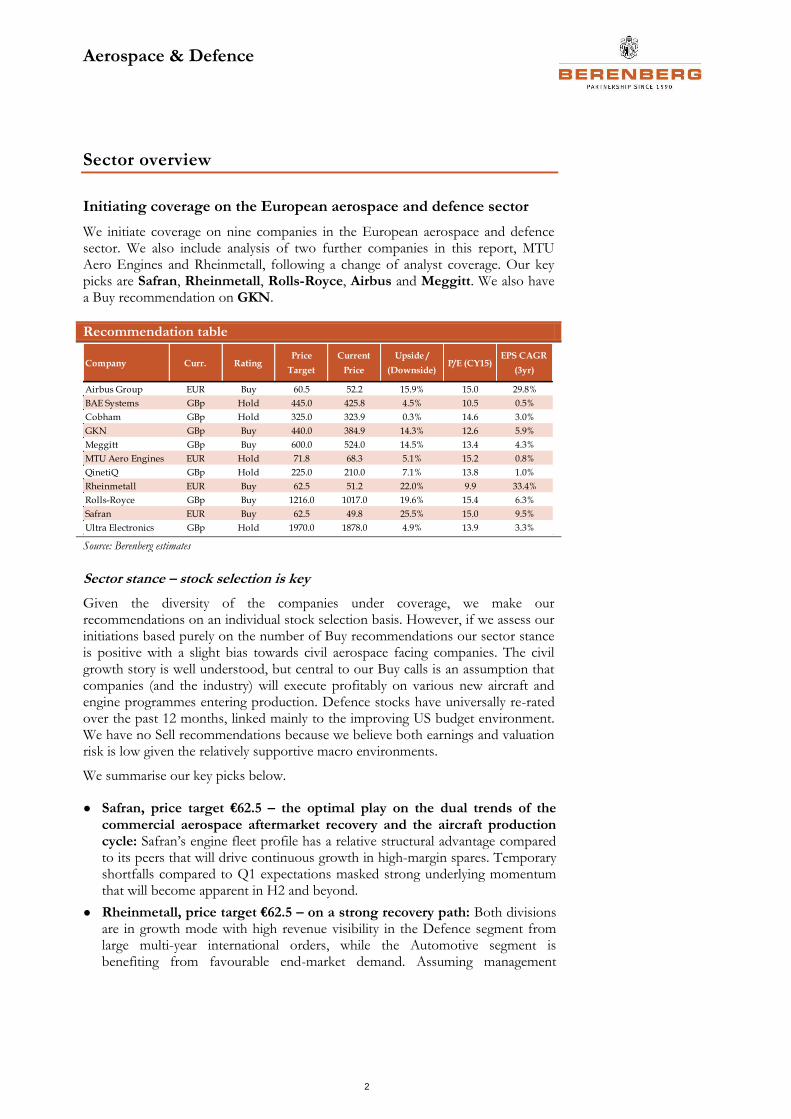
We initiate coverage on nine companies in the European aerospace and defence sector. We also include analysis of two further companies in this report, MTU Aero Engines and Rheinmetall, following a change of analyst coverage. Our key picks are Safran, Rheinmetall, Rolls-Royce, Airbus and Meggitt. We also have a Buy recommendation on GKN.
Recommendation table
Source: Berenberg estimates
Sector stance – stock selection is key
Given the diversity of the companies under coverage, we make our recommendations on an individual stock selection basis. However, if we assess our initiations based purely on the number of Buy recommendations our sector stance is positive with a slight bias towards civil aerospace facing companies. The civil growth story is well understood, but central to our Buy calls is an assumption that companies (and the industry) will execute profitably on various new aircraft and engine programmes entering production. Defence stocks have universally re-rated over the past 12 months, linked mainly to the improving US budget environment. We have no Sell recommendations because we believe both earnings and valuation risk is low given the relatively supportive macro environments.
We summarise our key picks below.
● Safran, price target €62.5 – the optimal play on the dual trends of the commercial aerospace aftermarket recovery and the aircraft production cycle: Safran’s engine fleet profile has a relative structural advantage compared to its peers that will drive continuous growth in high-margin spares. Temporary shortfalls compared to Q1 expectations masked strong underlying momentum that will become apparent in H2 and beyond.
● Rheinmetall, price target €62.5 – on a strong recovery path: Both divisions are in growth mode with high revenue visibility in the Defence segment from large multi-year international orders, while the Automotive segment is benefiting from favourable end-market demand. Assuming management
Company Curr. RatingPrice
Target
Current
Price
Upside /
(Downside)P/E (CY15)
EPS CAGR
(3yr)
Airbus Group EUR Buy 60.5 52.2 15.9% 15.0 29.8%
BAE Systems GBp Hold 445.0 425.8 4.5% 10.5 0.5%
Cobham GBp Hold 325.0 323.9 0.3% 14.6 3.0%
GKN GBp Buy 440.0 384.9 14.3% 12.6 5.9%
Meggitt GBp Buy 600.0 524.0 14.5% 13.4 4.3%
MTU Aero Engines EUR Hold 71.8 68.3 5.1% 15.2 0.8%
QinetiQ GBp Hold 225.0 210.0 7.1% 13.8 1.0%
Rheinmetall EUR Buy 62.5 51.2 22.0% 9.9 33.4%
Rolls-Royce GBp Buy 1216.0 1017.0 19.6% 15.4 6.3%
Safran EUR Buy 62.5 49.8 25.5% 15.0 9.5%
Ultra Electronics GBp Hold 1970.0 1878.0 4.9% 13.9 3.3%
Aerospace & Defence
3
continues to deliver against its mid-term “Two-Pillar” strategy, Rheinmetall ranks as the highest EPS growth and lowest P/E stock in our coverage.
● Rolls-Royce, price target 1,216p – out of favour following two profit warnings and the Emirates order cancellation: The shares are down by 19% ytd compared to 11% consensus earnings downgrades. We see no structural issues to detract from the long-term growth and margin expansion story, and we expect investor confidence to steadily rebuild through the year. A crucial investor briefing event is to be held on 19 June.
● Airbus, price target €60.5 – strong earnings growth driven by margin expansion as legacy headwinds fade and programme risks diminish: The market has over-reacted to the Emirates order cancellation; the shares have underperformed the SXXP by 12% ytd. There is potential for progressively positive newsflow through H2, such as A350 XWB certification and first customer delivery (in Q3 and Q4 respectively), and order announcements at the Farnborough Air Show (week commencing 14 July).
● Meggitt, price target 600p – well positioned in attractive end-markets (civil aerospace and energy) translating to sustained earnings growth in the mid- to high single-digit range: 48% of sales are derived from high-margin aftermarket activity, which is a key differentiator. Investor interest is starting to return after the November 2013 profit warning, which was caused largely by one-off events. We see scope for valuation multiples to expand if positive aftermarket trends continue.
A few sector observations
The (really) big picture
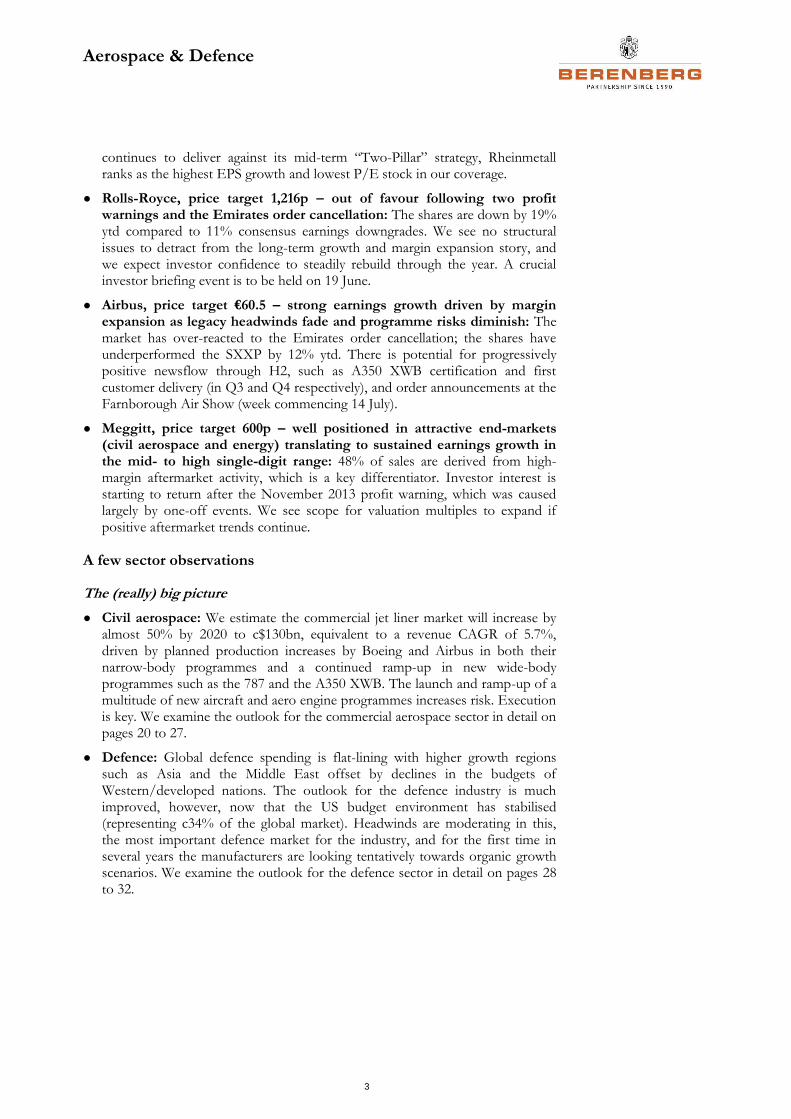
● Civil aerospace: We estimate the commercial jet liner market will increase by almost 50% by 2020 to c$130bn, equivalent to a revenue CAGR of 5.7%, driven by planned production increases by Boeing and Airbus in both their narrow-body programmes and a continued ramp-up in new wide-body programmes such as the 787 and the A350 XWB. The launch and ramp-up of a multitude of new aircraft and aero engine programmes increases risk. Execution is key. We examine the outlook for the commercial aerospace sector in detail on pages 20 to 27.
● Defence: Global defence spending is flat-lining with higher growth regions such as Asia and the Middle East offset by declines in the budgets of Western/developed nations. The outlook for the defence industry is much improved, however, now that the US budget environment has stabilised (representing c34% of the global market). Headwinds are moderating in this, the most important defence market for the industry, and for the first time in several years the manufacturers are looking tentatively towards organic growth scenarios. We examine the outlook for the defence sector in detail on pages 28 to 32.
Aerospace & Defence
4
Commercial jet market ($m) Total US DoD spending ($bn)
Source: Airframers/Airline Monitor/Berenberg estimates Source: US DoD, Berenberg estimates
Performance: A&D Index has underperformed in 2014
Despite the recent rally, a combination of rotation and negative forecast revisions has seen the sector underperform the broader UK and European indices in the ytd (the FTSE All-share by 7% and Stoxx600 by 11%). Within this is a wide range of individual share price performances with Cobham and Rheinmetall leading our coverage list, up by 18% and 14% respectively ytd, while Rolls-Royce is the notable underperforming outlier, down by 19% with Airbus and MTU Aero Engines the next relative underperformers, down by 7% and 5% respectively. We examine sector and stock performance in more detail on pages 16 and 17.
Growth – forecast momentum stalled towards the end of 2013
Positive sector earnings momentum that had for many years been driven by civil aerospace strength started to slow through the second half of 2013 and turned negative in early 2014 (as evidenced by downgrades to consensus earnings in the ytd for nine out of the 11 companies we cover, by an average of 6%). Adverse currency effects have been a key factor, with the majority of the companies exposed to the US dollar and the effects of the strengthening of the euro and sterling. Sterling-denominated companies have fared slightly worse in this respect (we factor in our 2014 forecasts an average adverse EBIT effect of c3.5% for the UK stocks we cover). In addition, a number of companies have reduced guidance unexpectedly for a variety of company-specific reasons. Overall, underlying sector earnings growth in 2014 is weak – we forecast an average underlying EPS decline of -2.2%, split civil aerospace 0.7% and defence -5.7% (excluding the distorting effects of Airbus and Rheinmetall). Thereafter, we anticipate an improving earnings with an average forecast EPS CAGR of 4.0% to 2017 for the sector, split 5.4% civil and 2.0% defence, on the same basis.
Valuation – the sector P/E has expanded by one turn over the past year
On a 12-month forward earnings basis, the sector average P/E has increased by one turn over the past year to 14.4x, a 9% premium to the 20-year average of 13.2x. Both the defence and civil aerospace subsectors have contributed; for our coverage universe the defence multiple has expanded by 2.2 turns to 11.3x while the civil aero multiple has increased by 0.7 turns to 14.8x. The re-rating of defence stocks was driven initially by receding concerns around the sequestration cuts and then by improved US Budget visibility. We note an average share price increase of
40,000
80,000
120,000
160,000
Narrow-body Wide-body Regional jets
0
200
400
600
800
FY
00
FY
01
FY
02
FY
03
FY
04
FY
05
FY
06
FY
07
FY
08
FY
09
FY
10
FY
11
FY
12
FY
13
FY
14
FY
15
FY
16
FY
17
FY
18
FY
19
CAGR -4.3%

Aerospace & Defence
5
18% for our defence stocks over the last year. Expansion of the civil aero P/E is the combined effect of an average 4% increase in share prices and modest earnings cuts over the same period. As a result of these re-ratings, the valuation differential between the civil aerospace and defence subsectors has narrowed to just 1.6 turns with civil stocks trading on an average P/E multiple of 14.4x with defence stocks on 12.8x (based on our FY15 forecasts). We examine sector and stock performance in more detail on pages 18 and 19.
Aerospace & Defence
6
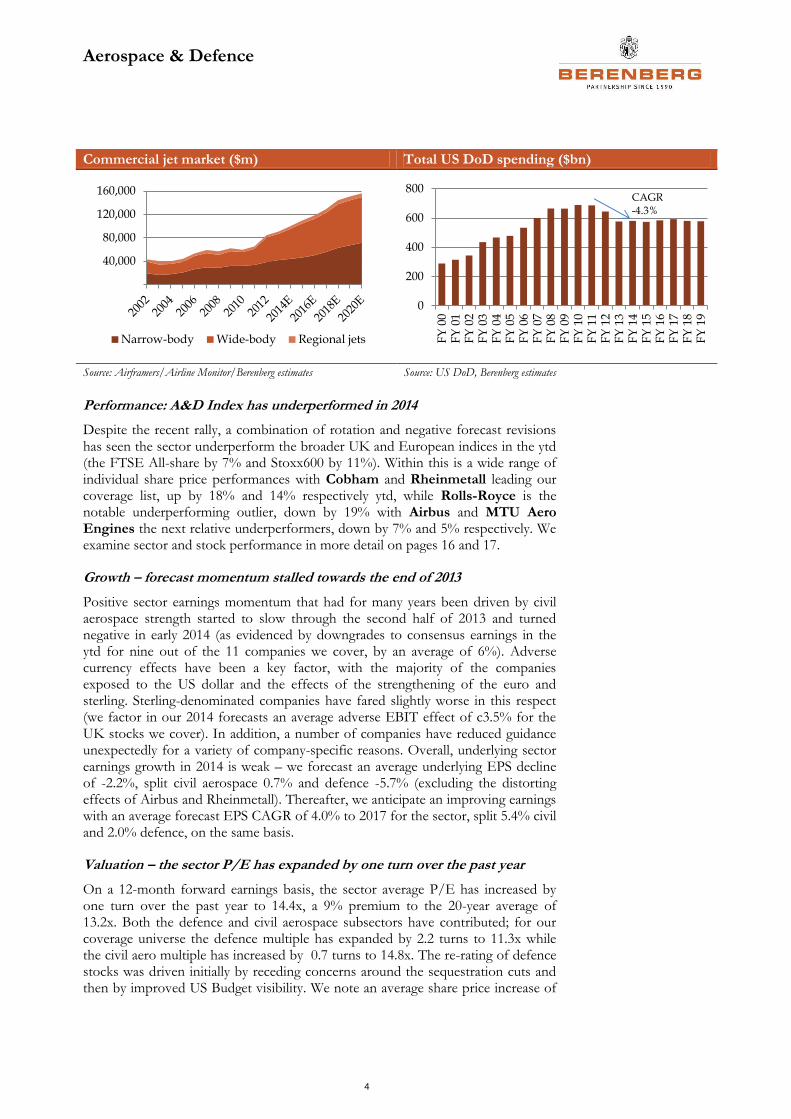
Aerospace and defence – 10 charts to bring us up to speed
Sector performance – 12-month A&D Index versus FTSE All-Share and DJSTOXX600
Sector earnings momentum turned negative in 2014; FX is partly to blame
Source: Datastream Source: Bloomberg
Changes to company FY14 EPS forecasts since January 2014; Average downgrade: 5.6%
Sector valuation – 12-month forward P/E; sector has re-rated over one year driven largely by defence
Source: Datastream Source: Datastream
Company P/Es (average) CY14 – 15.2x, CY15 – 13.7x; multiples have converged
P/E versus EPS growth (three-year CAGR)
Source: Berenberg estimates Source: Berenberg estimates
90
100
110
120
130
Jun
-13
Au
g-1
3
Oct
-13
Dec
-13
Feb
-14
Ap
r-14
Jun
-14
A&D Index DJ Stoxx 600 FTSE A-S
10.0
10.4
10.8
11.2
11.6
May
-13
Jun
-13
Jul-
13
Au
g-1
3
Sep
-13
Oct
-13
No
v-1
3
Dec
-13
Jan
-14
Feb
-14
Mar
-14
Ap
r-14
May
-14
Jun
-14
-15%
-10%
-5%
0%
5%
SA
F
UL
E
CO
B
MG
GT
BA
E
GK
N
MT
X
AIR RR
RH
M
% diff to est at 1/1/14 average
5
10
15
20
Jun
-04
Jun
-05
Jun
-06
Jun
-07
Jun
-08
Jun
-09
Jun
-10
Jun
-11
Jun
-12
Jun
-13
Jun
-14
Euro A&D Average
0
5
10
15
20
AIR
SA
F
RR
CO
B
RH
MG
MT
XG
n
UL
E
MG
GT
GK
N
BA
ES
FY1 FY2
AIR
BAES
COB
GKN
MGGT
MTXGn
QQRHMG
RRSAF
ULE
8
10
12
14
16
18
20
0% 10% 20% 30% 40% 50%
P/E
(F
Y1
4)
EPS Growth (14-16)
Aerospace & Defence
7
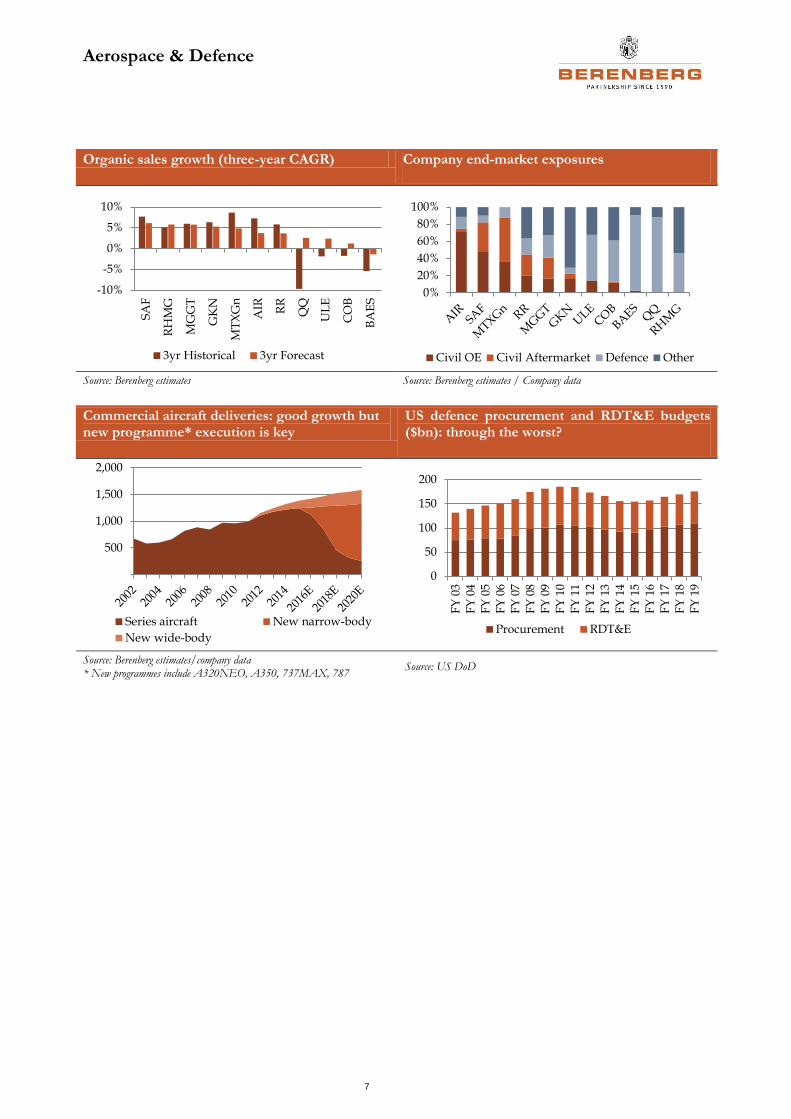
Organic sales growth (three-year CAGR) Company end-market exposures
Source: Berenberg estimates Source: Berenberg estimates / Company data
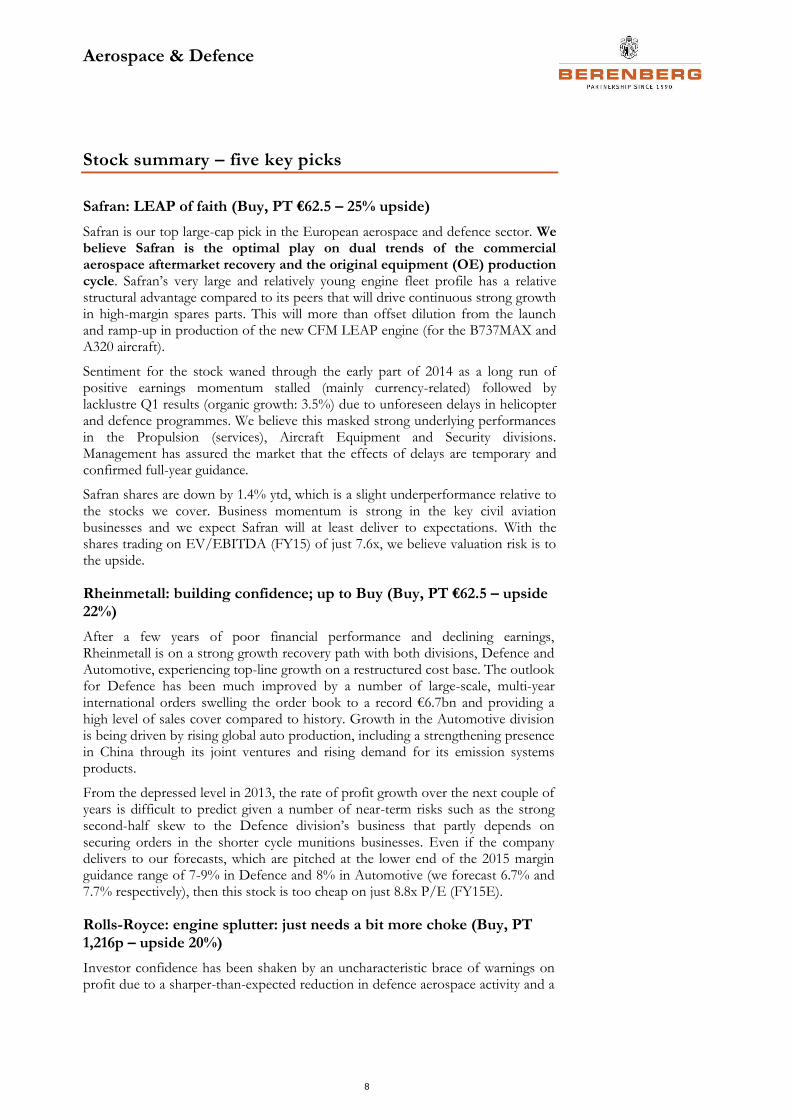
Commercial aircraft deliveries: good growth but new programme* execution is key
US defence procurement and RDT&E budgets ($bn): through the worst?
Source: Berenberg estimates/company data * New programmes include A320NEO, A350, 737MAX, 787
Source: US DoD
-10%
-5%
0%
5%
10%
SA
F
RH
MG
MG
GT
GK
N
MT
XG
n
AIR RR
UL
E
CO
B
BA
ES
3yr Historical 3yr Forecast
0%
20%
40%
60%
80%
100%
Civil OE Civil Aftermarket Defence Other
500
1,000
1,500
2,000
Series aircraft New narrow-body
New wide-body
0
50
100
150
200
FY
03
FY
04
FY
05
FY
06
FY
07
FY
08
FY
09
FY
10
FY
11
FY
12
FY
13
FY
14
FY
15
FY
16
FY
17
FY
18
FY
19
Procurement RDT&E
Aerospace & Defence
8
Stock summary – five key picks
Safran: LEAP of faith (Buy, PT €62.5 – 25% upside)
Safran is our top large-cap pick in the European aerospace and defence sector. We believe Safran is the optimal play on dual trends of the commercial aerospace aftermarket recovery and the original equipment (OE) production cycle. Safran’s very large and relatively young engine fleet profile has a relative structural advantage compared to its peers that will drive continuous strong growth in high-margin spares parts. This will more than offset dilution from the launch and ramp-up in production of the new CFM LEAP engine (for the B737MAX and A320 aircraft).
Sentiment for the stock waned through the early part of 2014 as a long run of positive earnings momentum stalled (mainly currency-related) followed by lacklustre Q1 results (organic growth: 3.5%) due to unforeseen delays in helicopter and defence programmes. We believe this masked strong underlying performances in the Propulsion (services), Aircraft Equipment and Security divisions. Management has assured the market that the effects of delays are temporary and confirmed full-year guidance.
Safran shares are down by 1.4% ytd, which is a slight underperformance relative to the stocks we cover. Business momentum is strong in the key civil aviation businesses and we expect Safran will at least deliver to expectations. With the shares trading on EV/EBITDA (FY15) of just 7.6x, we believe valuation risk is to the upside.
Rheinmetall: building confidence; up to Buy (Buy, PT €62.5 – upside 22%)
After a few years of poor financial performance and declining earnings, Rheinmetall is on a strong growth recovery path with both divisions, Defence and Automotive, experiencing top-line growth on a restructured cost base. The outlook for Defence has been much improved by a number of large-scale, multi-year international orders swelling the order book to a record €6.7bn and providing a high level of sales cover compared to history. Growth in the Automotive division is being driven by rising global auto production, including a strengthening presence in China through its joint ventures and rising demand for its emission systems products.
From the depressed level in 2013, the rate of profit growth over the next couple of years is difficult to predict given a number of near-term risks such as the strong second-half skew to the Defence division’s business that partly depends on securing orders in the shorter cycle munitions businesses. Even if the company delivers to our forecasts, which are pitched at the lower end of the 2015 margin guidance range of 7-9% in Defence and 8% in Automotive (we forecast 6.7% and 7.7% respectively), then this stock is too cheap on just 8.8x P/E (FY15E).
Rolls-Royce: engine splutter: just needs a bit more choke (Buy, PT 1,216p – upside 20%)
Investor confidence has been shaken by an uncharacteristic brace of warnings on profit due to a sharper-than-expected reduction in defence aerospace activity and a
Aerospace & Defence
9
one-off charge in the Marine division. In effect, this translates to a lost year of growth in 2014, the first time in over a decade that operating profits have declined yoy. In reaction, the stock has significantly underperformed ytd, down by 19% against an average decline of the sector of 1%. In our view, there are no structural issues to de-rail the long-term growth story, backed by a c£70bn orderbook and the planned ramp-up in civil engine (Trent XWB) production. The high profile Emirates cancellation of its 70 aircraft A350 XWB order last week is clearly a disappointment but does not affect the programme, which still has a seven-year backlog.
The key debate is around margin progression – in particular, the net impact of dilution from the A350 XWB launch and declining high-margin services revenues on legacy programmes, offset by growth in the revenues derived from long-term service agreements (LTSAs) and the benefits of restructuring and efficiency initiatives. Our view is that the maturing LTSA model will prevail driving a return to continuing profits growth from 2015.
We acknowledge the possibility of further share price volatility in the short term with an investor briefing on 19 June when agenda items include an update on strategy and long-term contract accounting. Long-term contract accounting will be extremely important for investors’ understanding of the LTSA value proposition. Provided management can communicate this effectively, it should allay concerns about the quality and pace of the growth story and drive the rating higher, we believe. Failure to do so will delay the sentiment recovery. Regardless, in 12 months’ time, we believe the market will be feeling more confident about the Rolls-Royce story as the A350 XWB and LTSA effects become clearer and are better understood.
Separately, investor appetite for large-scale M&A appears muted after the approach to Wärtsilä (market cap: €8bn) was rejected earlier this year. This threat of a potential re-bid is weighing on the stock. Again, the 19 June investor briefing will be key, given that the company has said it will address the subject of capital allocation at the event.
Airbus: stand and deliver (Buy, PT €60.5 – upside 16%)
Major programme risk continues to reduce as legacy issues fade (the A380 is progressing towards achieving the 2015 breakeven objective and production of the A400M is steadily ramping up) and new programmes mature (the A350 XWB is nearing entry into service and the A320NEO development programme is advancing). This together with operational improvements across the group is resulting in steady margin expansion and improving profits quality, despite growing losses related to launch of the A350 XWB.
As ever, Airbus faces a multitude of business challenges including the production ramp-up of the A350 XWB, the launch of the A320NEO and the navigation of a complex, multi-year restructuring of the Defence and Space business. We believe that these risks are being well managed and the market’s confidence will build as further milestones are passed, which in turn could drive upgrades to consensus forecasts. Flight certification of the A350 XWB is expected in Q3, with first customer delivery (to Qatar Airways) to follow in Q4. Other significant news before the year is out could include a decision on whether to re-engine the A330 and/or the A380 which, if pursued, would commit more development dollars, not a major concern for us because R&D spend is trending down and it would extend
Aerospace & Defence
10
the life of existing platforms, deferring the need for more expensive all-new aircraft developments.
Emirates’ cancellation of its order for 70 A350 XWB aircraft, while large, has little bearing on the financial performance of the group in the near term or the success of the overall programme (there is still c7 years of A350 XWB backlog to execute). However, it raises the broader question of whether the aircraft order cycle is softening and hence the risk of further cancellations. In the context of the group’s c5,500 aircraft backlog, we are not concerned but we recognise sentiment towards Airbus (and the sector generally) will be adversely affected by this development. Airbus continues to talk of a healthy order environment and has confirmed it still expects to achieve a book-to-bill greater than 1x in 2014. We expect positive order activity during the Farnborough Air Show (14 July).
Year-to-date, Airbus shares have underperformed the European peer group by 6% and Boeing by 8%, and in our view look good value if the company delivers continued profit growth at the current trajectory.
Meggitt: under-rated (Buy, PT 600p – upside 15%)
Meggitt is nearing the peak of an intensive product investment cycle and we believe it is fundamentally well positioned in attractive end-markets (civil aerospace and energy) to deliver long-term growth. High-margin aftersales activity is a key differentiator to peer aerospace suppliers, accounting for almost half of group sales and providing resilience in the military aerospace business.
The shares have rallied in recent weeks, indicating investors’ confidence is returning following the November 2013 profit warning and the FX-led downgrades in March 2014. Continued recovery of high-margin civil aftermarket activity (27% of sales) is key to sustaining this confidence, particularly through the interims which are expected to indicate a greater-than-normal H2 bias to financial performance. Assuming it does, and management is able to confirm full-year guidance, we see scope for valuation multiples to expand further (the shares currently trade at an 10% FY15 P/E discount to civil aerospace peers on our forecasts). Over the longer term, we expect Meggitt to deliver sustained earnings growth (we forecast an EPS CAGR of 7% to 2017), which should continue to drive the shares.
Aerospace & Defence
11
Stock summary – the rest
BAE Systems: stabilising outlook (Hold, PT 445p – upside 5%)
BAE has suffered a protracted downgrade cycle primarily due to weakness in its budget-constrained US businesses which has translated into stagnant earnings since 2009. Improving budget visibility in the US, finalisation of Saudi contract terms and agreement on the UK naval programme point to a more stable outlook, both in the near and longer term. However, BAE is still the lowest earnings growth company in our coverage, despite a £1bn share buyback (we forecast a three-year EPS CAGR of 0.5%) and with few major contract opportunities in prospect and budget constraints likely to endure, we see limited upside to this scenario. Higher-growth commercial activities represent 5% of the group, too small to do more than offset defence headwind.
The key investment attraction for us is the rock solid dividend, yielding 4.8% and providing strong support to already depressed valuation multiples. The main risk to our neutral stance is multiple expansion. We are just not sure of a meaningful catalyst in the short term.
Cobham: Aeroflex is a good deal but shares are fairly valued (Hold, PT 325p – upside/downside 0%)
The stock has significantly outperformed since the US defence budget agreement in December and the market further welcomed the announcement in May of Cobham’s largest-ever acquisition, Aeroflex, for £870m. We agree that Aeroflex appears to be an excellent strategic and technological fit, and in raw earnings terms we estimate the transaction is c8% earnings-accretive in 2015 on an underlying basis. Integration costs are high, however, at c£130m over 3-4 years for an annualised benefit of c£50m.
Management has been consistent in longer-term guidance of delivering organic growth in 2015 (for the first time since 2008) and the outlook is enhanced by Aeroflex’s greater mix of sales in commercial sectors. As a result, Cobham has been the best-performing share in the sector ytd, up by 19% versus the sector (which is itself up by 1%) and valuation metrics are relatively full (a c14% premium to the sector on a 2015 P/E basis). Now the war chest has been spent, there is a lack of near-term catalysts and we see little upside to the equity story, hence our neutral stance.
GKN: driving through the headwinds (Buy, PT 440p – upside 14%)
The fundamentals of the business are positive with the group’s two core end-markets, global automotive and aerospace, representing c85% of sales, growing concurrently. This, we believe, will translate to management’s stated ambition of sustaining revenue growth ahead of end-markets over the mid- to long term (we forecasts a sales CAGR of 4.5% and an EBIT CAGR of 7.2% to 2017). In the short term, we recognise that performance and earnings growth will be tempered by a combination of currency headwinds, the phasing of aerospace programmes (a slow ramp-up in commercial and wind-down of profitable military activity) and higher tax, which we believe will translate to a muted H1 result and flat earnings for the year.
Aerospace & Defence
12
Uncertainty about potential large-scale M&A may also affect sentiment, with discussions ongoing (we believe) with Spirit Aerosystems to acquire its underperforming Wing Systems (WS) business. WS would be highly complementary to GKN’s existing Airbus wing structures business, significantly increasing the group’s exposure to Boeing and other airframers. Management has a good M&A track record and hence we are confident it will not overpay if a transaction progresses. We believe the market is price-neutral on a potential deal and hence we think it should be viewed as upside should it progress. In summary, while we see potential for some share price volatility over the shorter term, the fundamental outlook for GKN is positive. The rating is not particularly demanding and we expect the shares price to steadily advance as the growth trend resumes.
MTU Aero Engines: in for the long haul (Hold, PT €71.8 – upside 5%)
MTU generates c80% of its revenues in the commercial aerospace sector and the group is well positioned for significant top-line growth in all areas: new engines driven by the ramp-up in geared turbofan production (GTF); increasing aftermarket from the V2500 engine fleet; and market share opportunities in the engine maintenance business (MRO).
However, the rapid transition to GTF production over the next three to four years is ambitious, industrially challenging and dilutive to margin due to losses on new engine sales. We believe mix headwinds from the GTF will largely neutralise the positive impacts of volume growth and continuous strong momentum in the high margin V2500 spare parts business, as the expanding fleet of engines mature. The ramp-up of activity on the GTF will also lead to cash challenges over the next few years which, although well understood by the market, will combine with low profits growth to constrain the valuation in the near term. We think MTU remains a great long-term growth story once GTF production matures and the V2500 aftermarket story develops further, and we are comfortable that investors with long-term horizons will enjoy positive long-term returns. However, following the recent rally in the share price, MTU’s valuation metrics have converged with Safran and Rolls-Royce and hence we see limited upside in the near term on both an absolute and relative basis.
QinetiQ: looking ahead again (Hold, PT 225p – upside 7%)
The valuation achieved on disposal of the US Services business (up to £130m) was below market expectations but it concludes a flawed strategy of the previous management and removes a drag on profit. QinetiQ has commenced returning excess cash through a £150m buyback (equivalent to 12% of the current market cap) and we suggest there is scope to extend this indefinitely at c£50m pa based on continued strong cash generation. After years of top-line decline, it is encouraging that the group’s core EMEA Services division has stabilised and returned to low organic growth with the emergence of new opportunities, for example in international markets. However, the main value hook for investors is the momentum building in the Global Products (GP) division. While the strategy to broaden the GP product range has been slow, recent strategically important developments indicate significant potential for the OptaSense™ acoustic sensing technology. It is still too early to quantify the opportunity and we monitor developments closely but given the share’s relatively high valuation, it implies to us that investors are already pricing in an element of positive
Aerospace & Defence
13
expectation. The shares have bounced by 8% since the results in May and trade on a CY15 P/E of 13.8x, a 15% premium to the sector.
Ultra Electronics: cautious optimism (Hold, PT 1,970p – 5% upside)
Ultra is a high-quality, technology-rich electronics company with a broad range of specialist capabilities in the defence, security, transport and energy sectors. Set against the group’s high standards and long-term record of growth, the business has weathered a difficult three years in slowing defence markets which in 2014 is likely to culminate in another year of flat earnings with low organic and M&A-driven growth offset by currency effects. However, we are cautiously optimistic that Ultra can return to sustained EPS growth driven by large contract opportunities, growing non-defence activities and further potential upside from acquisitions. Indeed, M&A activity has already picked up, with over £100m of transactions announced ytd. In addition, Ultra has recently announced a number of sizable new contracts supporting our view that the company can deliver steady earnings growth over the next few years. The shares oversold following the March prelims but have since rallied on the back of the contract newsflow and acquisitions. In summary, notwithstanding the potential for some volatility through the interim results (due to a strong weighting to H2), we view Ultra as a high-quality, low-risk investment proposition, but now with insufficient valuation upside on a 12-month view to Buy.
Aerospace & Defence
14
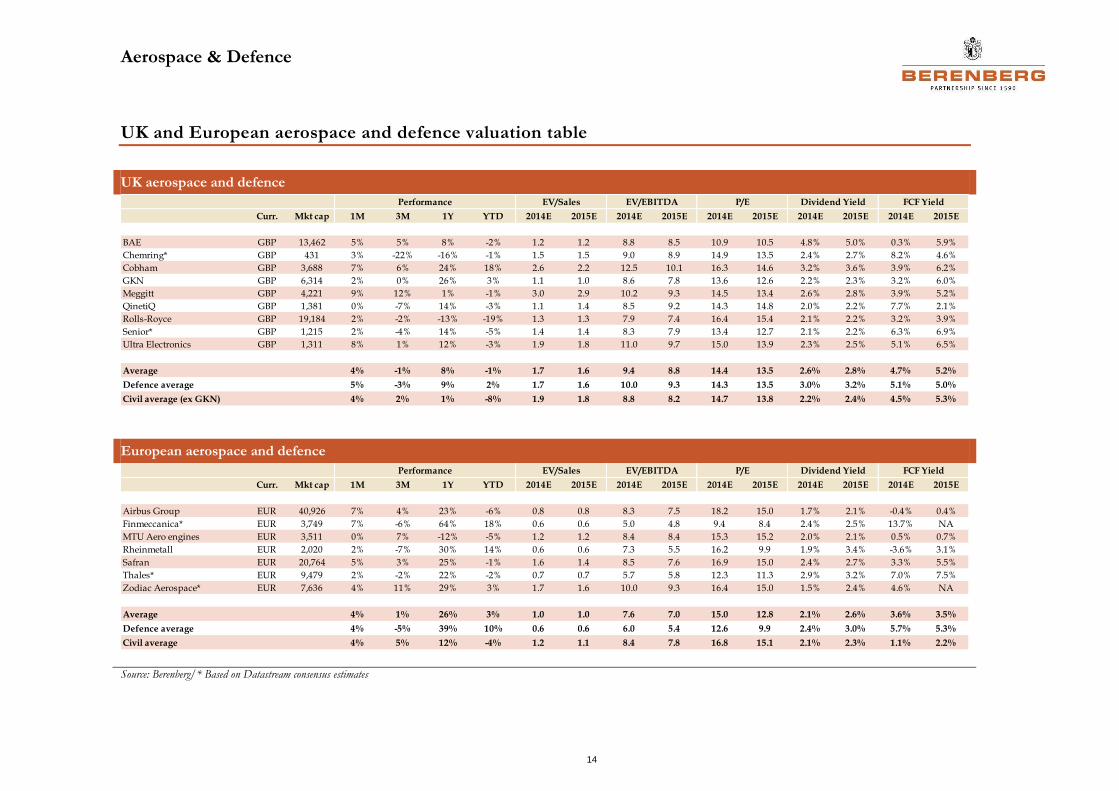
UK and European aerospace and defence valuation table
UK aerospace and defence
European aerospace and defence
Source: Berenberg/* Based on Datastream consensus estimates
Curr. Mkt cap 1M 3M 1Y YTD 2014E 2015E 2014E 2015E 2014E 2015E 2014E 2015E 2014E 2015E
BAE GBP 13,462 5% 5% 8% -2% 1.2 1.2 8.8 8.5 10.9 10.5 4.8% 5.0% 0.3% 5.9%
Chemring* GBP 431 3% -22% -16% -1% 1.5 1.5 9.0 8.9 14.9 13.5 2.4% 2.7% 8.2% 4.6%
Cobham GBP 3,688 7% 6% 24% 18% 2.6 2.2 12.5 10.1 16.3 14.6 3.2% 3.6% 3.9% 6.2%
GKN GBP 6,314 2% 0% 26% 3% 1.1 1.0 8.6 7.8 13.6 12.6 2.2% 2.3% 3.2% 6.0%
Meggitt GBP 4,221 9% 12% 1% -1% 3.0 2.9 10.2 9.3 14.5 13.4 2.6% 2.8% 3.9% 5.2%
QinetiQ GBP 1,381 0% -7% 14% -3% 1.1 1.4 8.5 9.2 14.3 14.8 2.0% 2.2% 7.7% 2.1%
Rolls-Royce GBP 19,184 2% -2% -13% -19% 1.3 1.3 7.9 7.4 16.4 15.4 2.1% 2.2% 3.2% 3.9%
Senior* GBP 1,215 2% -4% 14% -5% 1.4 1.4 8.3 7.9 13.4 12.7 2.1% 2.2% 6.3% 6.9%
Ultra Electronics GBP 1,311 8% 1% 12% -3% 1.9 1.8 11.0 9.7 15.0 13.9 2.3% 2.5% 5.1% 6.5%
Average 4% -1% 8% -1% 1.7 1.6 9.4 8.8 14.4 13.5 2.6% 2.8% 4.7% 5.2%
Defence average 5% -3% 9% 2% 1.7 1.6 10.0 9.3 14.3 13.5 3.0% 3.2% 5.1% 5.0%
Civil average (ex GKN) 4% 2% 1% -8% 1.9 1.8 8.8 8.2 14.7 13.8 2.2% 2.4% 4.5% 5.3%
FCF YieldPerformance EV/Sales EV/EBITDA P/E Dividend Yield
Curr. Mkt cap 1M 3M 1Y YTD 2014E 2015E 2014E 2015E 2014E 2015E 2014E 2015E 2014E 2015E
Airbus Group EUR 40,926 7% 4% 23% -6% 0.8 0.8 8.3 7.5 18.2 15.0 1.7% 2.1% -0.4% 0.4%
Finmeccanica* EUR 3,749 7% -6% 64% 18% 0.6 0.6 5.0 4.8 9.4 8.4 2.4% 2.5% 13.7% NA
MTU Aero engines EUR 3,511 0% 7% -12% -5% 1.2 1.2 8.4 8.4 15.3 15.2 2.0% 2.1% 0.5% 0.7%
Rheinmetall EUR 2,020 2% -7% 30% 14% 0.6 0.6 7.3 5.5 16.2 9.9 1.9% 3.4% -3.6% 3.1%
Safran EUR 20,764 5% 3% 25% -1% 1.6 1.4 8.5 7.6 16.9 15.0 2.4% 2.7% 3.3% 5.5%
Thales* EUR 9,479 2% -2% 22% -2% 0.7 0.7 5.7 5.8 12.3 11.3 2.9% 3.2% 7.0% 7.5%
Zodiac Aerospace* EUR 7,636 4% 11% 29% 3% 1.7 1.6 10.0 9.3 16.4 15.0 1.5% 2.4% 4.6% NA
Average 4% 1% 26% 3% 1.0 1.0 7.6 7.0 15.0 12.8 2.1% 2.6% 3.6% 3.5%
Defence average 4% -5% 39% 10% 0.6 0.6 6.0 5.4 12.6 9.9 2.4% 3.0% 5.7% 5.3%
Civil average 4% 5% 12% -4% 1.2 1.1 8.4 7.8 16.8 15.1 2.1% 2.3% 1.1% 2.2%
Performance EV/Sales EV/EBITDA P/E Dividend Yield FCF Yield
Aerospace & Defence
15
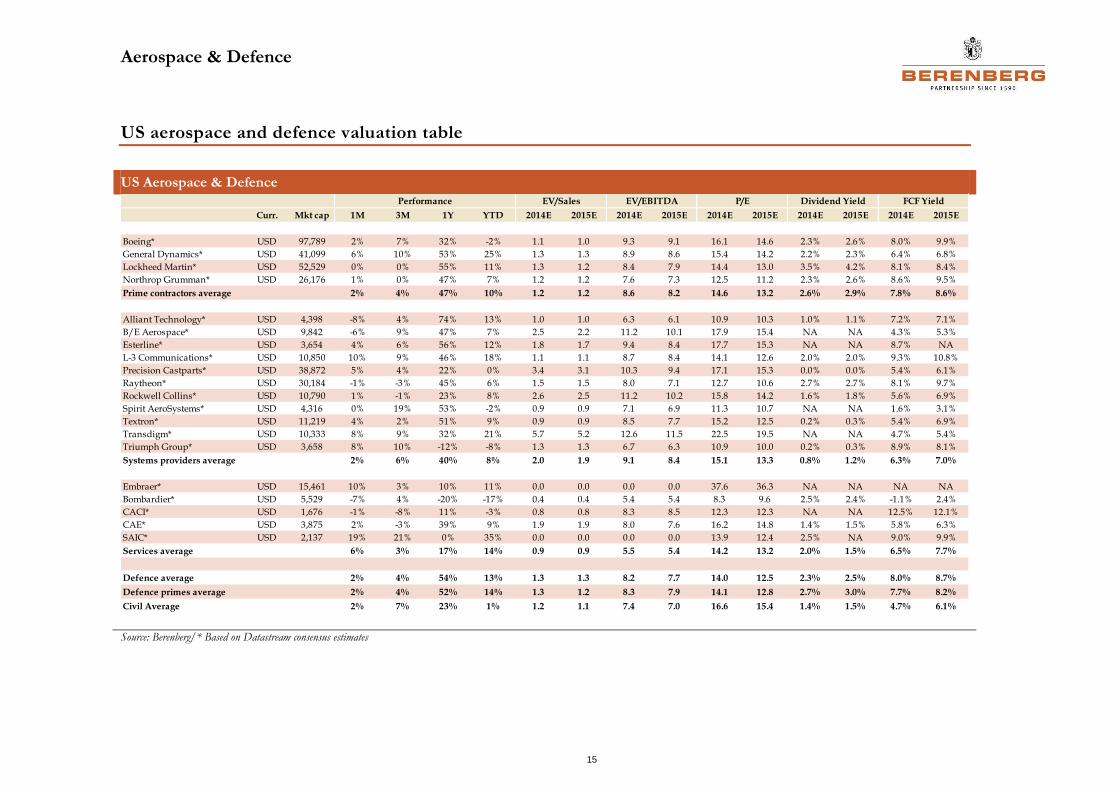
US aerospace and defence valuation table
US Aerospace & Defence
Source: Berenberg/* Based on Datastream consensus estimates
Curr. Mkt cap 1M 3M 1Y YTD 2014E 2015E 2014E 2015E 2014E 2015E 2014E 2015E 2014E 2015E
Boeing* USD 97,789 2% 7% 32% -2% 1.1 1.0 9.3 9.1 16.1 14.6 2.3% 2.6% 8.0% 9.9%
General Dynamics* USD 41,099 6% 10% 53% 25% 1.3 1.3 8.9 8.6 15.4 14.2 2.2% 2.3% 6.4% 6.8%
Lockheed Martin* USD 52,529 0% 0% 55% 11% 1.3 1.2 8.4 7.9 14.4 13.0 3.5% 4.2% 8.1% 8.4%
Northrop Grumman* USD 26,176 1% 0% 47% 7% 1.2 1.2 7.6 7.3 12.5 11.2 2.3% 2.6% 8.6% 9.5%
Prime contractors average 2% 4% 47% 10% 1.2 1.2 8.6 8.2 14.6 13.2 2.6% 2.9% 7.8% 8.6%
Alliant Technology* USD 4,398 -8% 4% 74% 13% 1.0 1.0 6.3 6.1 10.9 10.3 1.0% 1.1% 7.2% 7.1%
B/E Aerospace* USD 9,842 -6% 9% 47% 7% 2.5 2.2 11.2 10.1 17.9 15.4 NA NA 4.3% 5.3%
Esterline* USD 3,654 4% 6% 56% 12% 1.8 1.7 9.4 8.4 17.7 15.3 NA NA 8.7% NA
L-3 Communications* USD 10,850 10% 9% 46% 18% 1.1 1.1 8.7 8.4 14.1 12.6 2.0% 2.0% 9.3% 10.8%
Precision Castparts* USD 38,872 5% 4% 22% 0% 3.4 3.1 10.3 9.4 17.1 15.3 0.0% 0.0% 5.4% 6.1%
Raytheon* USD 30,184 -1% -3% 45% 6% 1.5 1.5 8.0 7.1 12.7 10.6 2.7% 2.7% 8.1% 9.7%
Rockwell Collins* USD 10,790 1% -1% 23% 8% 2.6 2.5 11.2 10.2 15.8 14.2 1.6% 1.8% 5.6% 6.9%
Spirit AeroSystems* USD 4,316 0% 19% 53% -2% 0.9 0.9 7.1 6.9 11.3 10.7 NA NA 1.6% 3.1%
Textron* USD 11,219 4% 2% 51% 9% 0.9 0.9 8.5 7.7 15.2 12.5 0.2% 0.3% 5.4% 6.9%
Transdigm* USD 10,333 8% 9% 32% 21% 5.7 5.2 12.6 11.5 22.5 19.5 NA NA 4.7% 5.4%
Triumph Group* USD 3,658 8% 10% -12% -8% 1.3 1.3 6.7 6.3 10.9 10.0 0.2% 0.3% 8.9% 8.1%
Systems providers average 2% 6% 40% 8% 2.0 1.9 9.1 8.4 15.1 13.3 0.8% 1.2% 6.3% 7.0%
Embraer* USD 15,461 10% 3% 10% 11% 0.0 0.0 0.0 0.0 37.6 36.3 NA NA NA NA
Bombardier* USD 5,529 -7% 4% -20% -17% 0.4 0.4 5.4 5.4 8.3 9.6 2.5% 2.4% -1.1% 2.4%
CACI* USD 1,676 -1% -8% 11% -3% 0.8 0.8 8.3 8.5 12.3 12.3 NA NA 12.5% 12.1%
CAE* USD 3,875 2% -3% 39% 9% 1.9 1.9 8.0 7.6 16.2 14.8 1.4% 1.5% 5.8% 6.3%
SAIC* USD 2,137 19% 21% 0% 35% 0.0 0.0 0.0 0.0 13.9 12.4 2.5% NA 9.0% 9.9%
Services average 6% 3% 17% 14% 0.9 0.9 5.5 5.4 14.2 13.2 2.0% 1.5% 6.5% 7.7%
Defence average 2% 4% 54% 13% 1.3 1.3 8.2 7.7 14.0 12.5 2.3% 2.5% 8.0% 8.7%
Defence primes average 2% 4% 52% 14% 1.3 1.2 8.3 7.9 14.1 12.8 2.7% 3.0% 7.7% 8.2%
Civil Average 2% 7% 23% 1% 1.2 1.1 7.4 7.0 16.6 15.4 1.4% 1.5% 4.7% 6.1%
FCF YieldPerformance EV/Sales EV/EBITDA P/E Dividend Yield
Aerospace & Defence
16
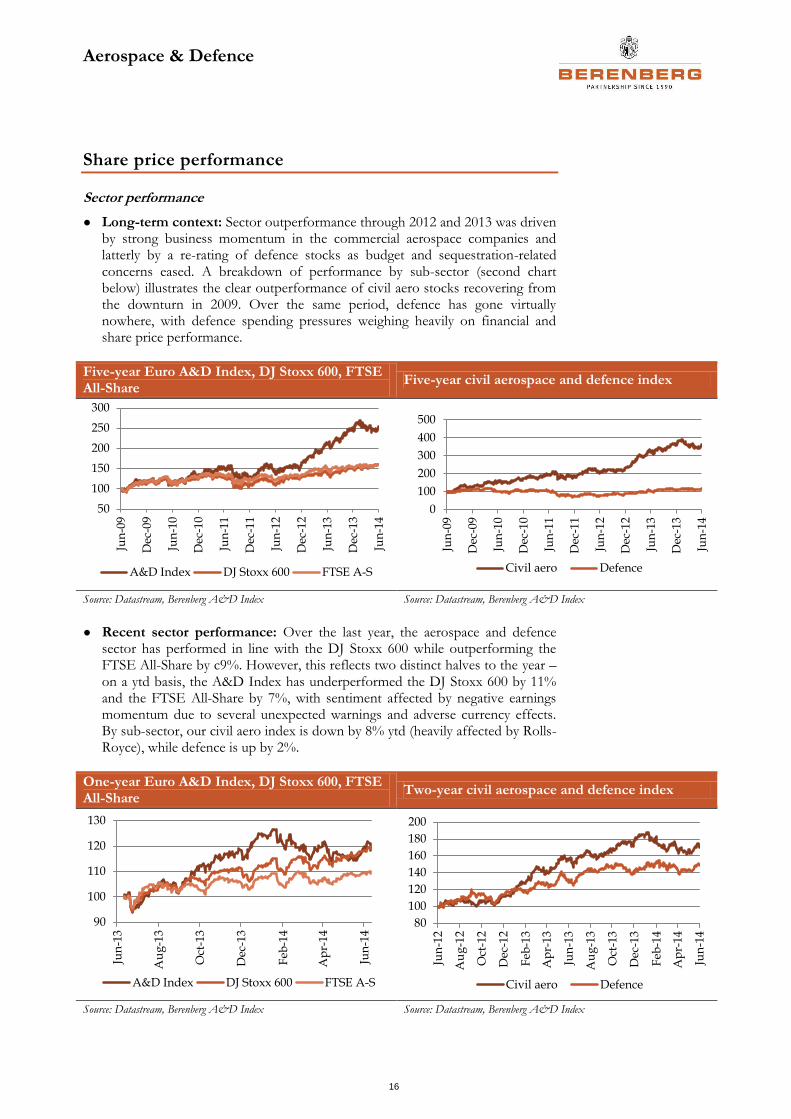
Share price performance
Sector performance
● Long-term context: Sector outperformance through 2012 and 2013 was driven by strong business momentum in the commercial aerospace companies and latterly by a re-rating of defence stocks as budget and sequestration-related concerns eased. A breakdown of performance by sub-sector (second chart below) illustrates the clear outperformance of civil aero stocks recovering from the downturn in 2009. Over the same period, defence has gone virtually nowhere, with defence spending pressures weighing heavily on financial and share price performance.
Five-year Euro A&D Index, DJ Stoxx 600, FTSE All-Share
Five-year civil aerospace and defence index
Source: Datastream, Berenberg A&D Index Source: Datastream, Berenberg A&D Index
● Recent sector performance: Over the last year, the aerospace and defence sector has performed in line with the DJ Stoxx 600 while outperforming the FTSE All-Share by c9%. However, this reflects two distinct halves to the year – on a ytd basis, the A&D Index has underperformed the DJ Stoxx 600 by 11% and the FTSE All-Share by 7%, with sentiment affected by negative earnings momentum due to several unexpected warnings and adverse currency effects. By sub-sector, our civil aero index is down by 8% ytd (heavily affected by Rolls-Royce), while defence is up by 2%.
One-year Euro A&D Index, DJ Stoxx 600, FTSE All-Share
Two-year civil aerospace and defence index
Source: Datastream, Berenberg A&D Index Source: Datastream, Berenberg A&D Index
50
100
150
200
250
300
Jun
-09
Dec
-09
Jun
-10
Dec
-10
Jun
-11
Dec
-11
Jun
-12
Dec
-12
Jun
-13
Dec
-13
Jun
-14
A&D Index DJ Stoxx 600 FTSE A-S
0
100
200
300
400
500
Jun
-09
Dec
-09
Jun
-10
Dec
-10
Jun
-11
Dec
-11
Jun
-12
Dec
-12
Jun
-13
Dec
-13
Jun
-14
Civil aero Defence
90
100
110
120
130
Jun
-13
Au
g-1
3
Oct
-13
Dec
-13
Feb
-14
Ap
r-1
4
Jun
-14
A&D Index DJ Stoxx 600 FTSE A-S
80
100
120
140
160
180
200
Jun
-12
Au
g-1
2
Oct
-12
Dec
-12
Feb
-13
Ap
r-1
3
Jun
-13
Au
g-1
3
Oct
-13
Dec
-13
Feb
-14
Ap
r-1
4
Jun
-14
Civil aero Defence
Aerospace & Defence
17
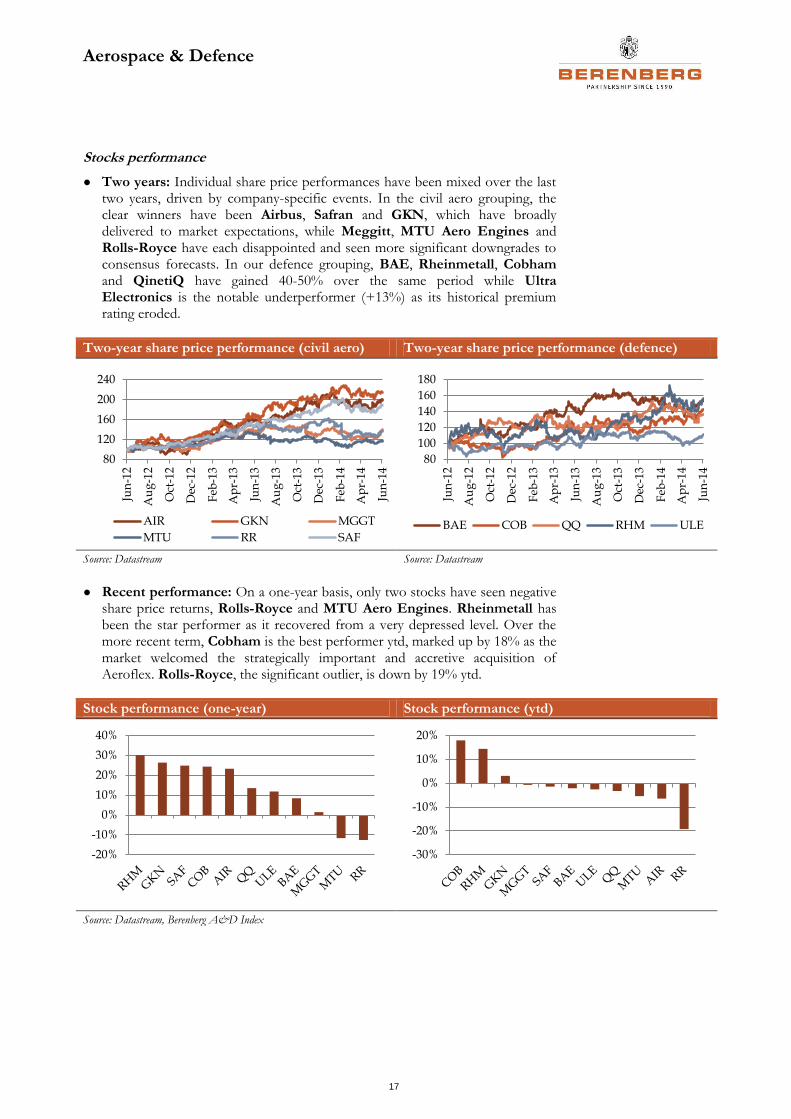
Stocks performance
● Two years: Individual share price performances have been mixed over the last two years, driven by company-specific events. In the civil aero grouping, the clear winners have been Airbus, Safran and GKN, which have broadly delivered to market expectations, while Meggitt, MTU Aero Engines and Rolls-Royce have each disappointed and seen more significant downgrades to consensus forecasts. In our defence grouping, BAE, Rheinmetall, Cobham and QinetiQ have gained 40-50% over the same period while Ultra Electronics is the notable underperformer (+13%) as its historical premium rating eroded.
Two-year share price performance (civil aero) Two-year share price performance (defence)
Source: Datastream Source: Datastream
● Recent performance: On a one-year basis, only two stocks have seen negative share price returns, Rolls-Royce and MTU Aero Engines. Rheinmetall has been the star performer as it recovered from a very depressed level. Over the more recent term, Cobham is the best performer ytd, marked up by 18% as the market welcomed the strategically important and accretive acquisition of Aeroflex. Rolls-Royce, the significant outlier, is down by 19% ytd.
Stock performance (one-year) Stock performance (ytd)
Source: Datastream, Berenberg A&D Index
80
120
160
200
240
Jun
-12
Au
g-1
2
Oct
-12
Dec
-12
Feb
-13
Ap
r-13
Jun
-13
Au
g-1
3
Oct
-13
Dec
-13
Feb
-14
Ap
r-14
Jun
-14
AIR GKN MGGT
MTU RR SAF
80
100
120
140
160
180
Jun
-12
Au
g-1
2
Oct
-12
Dec
-12
Feb
-13
Ap
r-1
3
Jun
-13
Au
g-1
3
Oct
-13
Dec
-13
Feb
-14
Ap
r-1
4
Jun
-14
BAE COB QQ RHM ULE
-20%
-10%
0%
10%
20%
30%
40%
-30%
-20%
-10%
0%
10%
20%
Aerospace & Defence
18
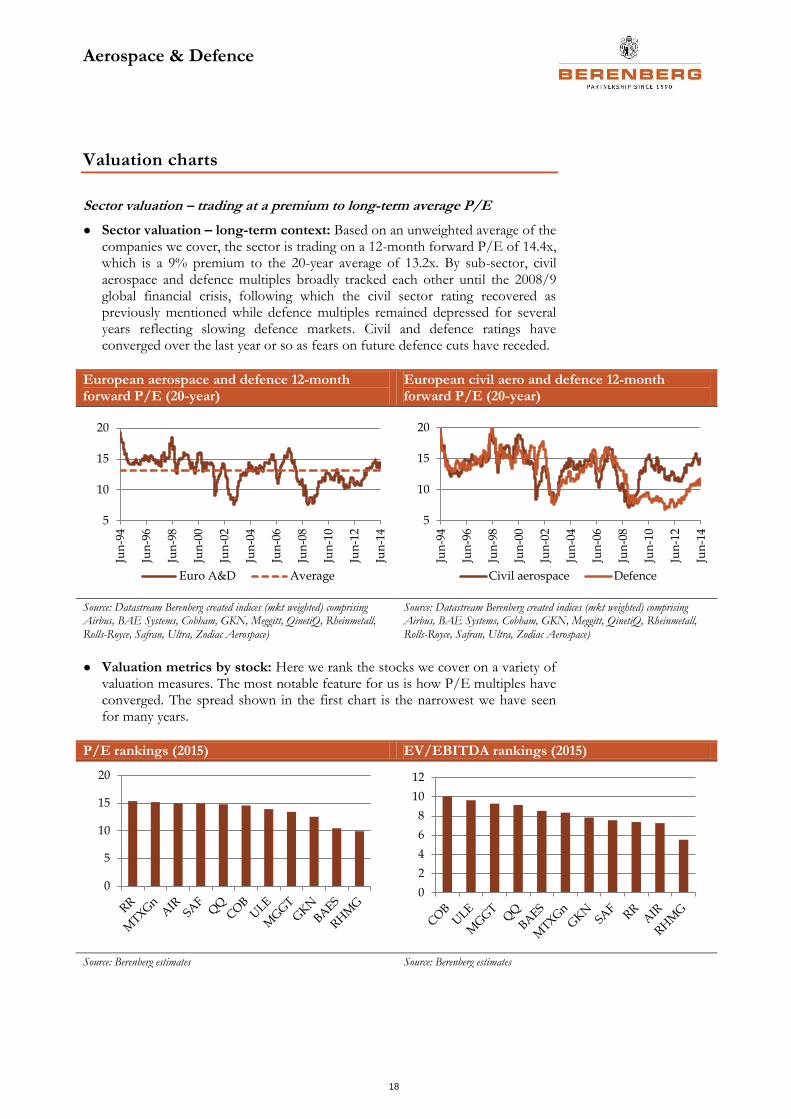
Valuation charts
Sector valuation – trading at a premium to long-term average P/E
● Sector valuation – long-term context: Based on an unweighted average of the companies we cover, the sector is trading on a 12-month forward P/E of 14.4x, which is a 9% premium to the 20-year average of 13.2x. By sub-sector, civil aerospace and defence multiples broadly tracked each other until the 2008/9 global financial crisis, following which the civil sector rating recovered as previously mentioned while defence multiples remained depressed for several years reflecting slowing defence markets. Civil and defence ratings have converged over the last year or so as fears on future defence cuts have receded.
European aerospace and defence 12-month forward P/E (20-year)
European civil aero and defence 12-month forward P/E (20-year)
Source: Datastream Berenberg created indices (mkt weighted) comprising Airbus, BAE Systems, Cobham, GKN, Meggitt, QinetiQ, Rheinmetall, Rolls-Royce, Safran, Ultra, Zodiac Aerospace)
Source: Datastream Berenberg created indices (mkt weighted) comprising Airbus, BAE Systems, Cobham, GKN, Meggitt, QinetiQ, Rheinmetall, Rolls-Royce, Safran, Ultra, Zodiac Aerospace)
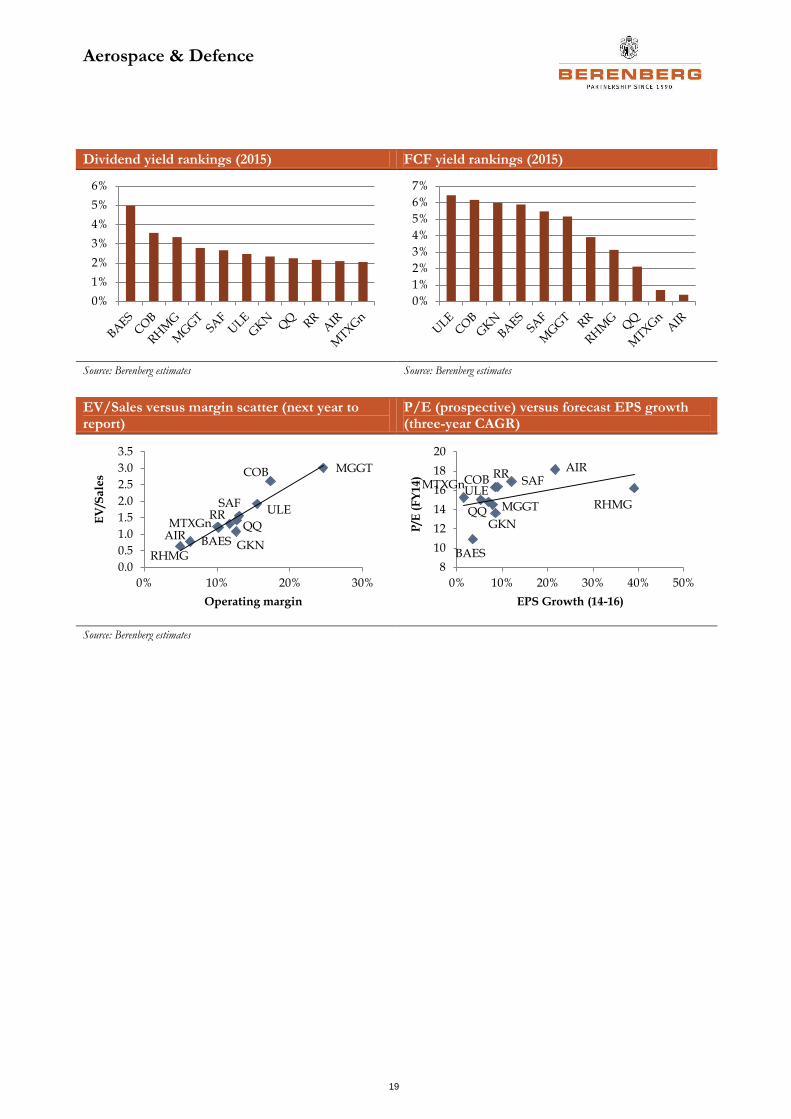
● Valuation metrics by stock: Here we rank the stocks we cover on a variety of valuation measures. The most notable feature for us is how P/E multiples have converged. The spread shown in the first chart is the narrowest we have seen for many years.
P/E rankings (2015) EV/EBITDA rankings (2015)
Source: Berenberg estimates Source: Berenberg estimates
5
10
15
20
Jun
-94
Jun
-96
Jun
-98
Jun
-00
Jun
-02
Jun
-04
Jun
-06
Jun
-08
Jun
-10
Jun
-12
Jun
-14
Euro A&D Average
5
10
15
20Ju
n-9
4
Jun
-96
Jun
-98
Jun
-00
Jun
-02
Jun
-04
Jun
-06
Jun
-08
Jun
-10
Jun
-12
Jun
-14
Civil aerospace Defence
0
5
10
15
20
0
2
4
6
8
10
12
Aerospace & Defence
19
Dividend yield rankings (2015) FCF yield rankings (2015)
Source: Berenberg estimates Source: Berenberg estimates
EV/Sales versus margin scatter (next year to report)
P/E (prospective) versus forecast EPS growth (three-year CAGR)
Source: Berenberg estimates
0%
1%
2%
3%
4%
5%
6%
0%
1%
2%
3%
4%
5%
6%
7%
AIR BAES
COB
GKN
MGGT
MTXGn QQ
RHMG
RRSAF
ULE
0.0
0.5
1.0
1.5
2.0
2.5
3.0
3.5
0% 10% 20% 30%
EV
/Sa
les
Operating margin
AIR
BAES
COB
GKN
MGGT
MTXGn
QQRHMG
RRSAF
ULE
8
10
12
14
16
18
20
0% 10% 20% 30% 40% 50%
P/E
(F
Y1
4)
EPS Growth (14-16)
Aerospace & Defence
20
Civil aerospace – OE
The commercial aerospace sector is in the middle of an extended production up-cycle, with the order backlog in the large commercial jet sector, which accounts for over 85% of the civil aircraft market by value, covering an average eight years production. A combination of structural factors is driving demand for new aircraft pointing to sustained high production.
● Replacement demand: The aging global fleet of first and second generation airliners is increasingly being retired. According to Ascend, the replacement rate has averaged 48% of aircraft deliveries during the past five years. Over time, we expect this to increase both in absolute (unit) terms and as a proportion because, by definition, the trend will increase in line with the historical fleet profile.
● Fuel efficiency: Aviation fuel represents 40-50% of airline operating cost compared to 15-25% a decade ago when the oil price was 80% below where it is today. Thus, the economic pressure to replace inefficient fleets remains a significant demand driver and we suggest it will continue to do so at even a materially lower oil price. We note the recent tensions relating to the situation in Iraq has driven the price of oil up by another 6%. The same applies to other environmental factors such as emissions and noise regulations driving the need for new aircraft.
● Economic growth: Commercial Aerospace is ultimately driven by economic growth and can be surmised as a “GDP plus” sector, growing by 1.5-2.0% above global GDP over the long term. While there are always short-term cycle and regional variations, powerful structural trends such as emerging market growth and low-cost travel have transformed the demand picture over the past 10-20 years. We note non-US and non-European markets account for over 50% of the total backlog (higher excluding leasing companies) compared to 22% in 2000.
Backlog growth
The commercial large jet backlog has grown by a factor of four since 2004 to almost 10,700 aircraft (11,500 including regional jets), representing around 55% of the in-service fleet and dwarfs the previous cycle peak of 3,900 in 2000. Over this period, more than 18,000 new aircraft orders have been placed (approximately equivalent in number to the entire global fleet in 2004) despite spanning a severe global financial crisis and aviation downturn,.
Aerospace & Defence
21
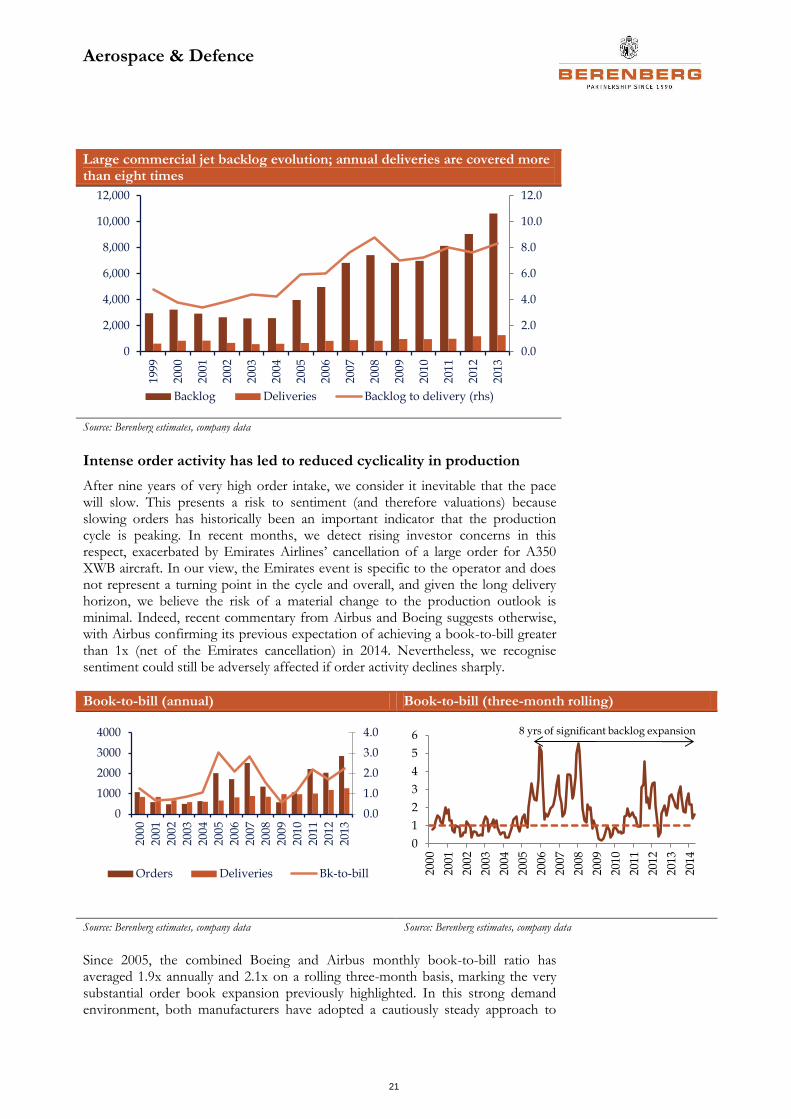
Large commercial jet backlog evolution; annual deliveries are covered more than eight times
Source: Berenberg estimates, company data
Intense order activity has led to reduced cyclicality in production
After nine years of very high order intake, we consider it inevitable that the pace will slow. This presents a risk to sentiment (and therefore valuations) because slowing orders has historically been an important indicator that the production cycle is peaking. In recent months, we detect rising investor concerns in this respect, exacerbated by Emirates Airlines’ cancellation of a large order for A350 XWB aircraft. In our view, the Emirates event is specific to the operator and does not represent a turning point in the cycle and overall, and given the long delivery horizon, we believe the risk of a material change to the production outlook is minimal. Indeed, recent commentary from Airbus and Boeing suggests otherwise, with Airbus confirming its previous expectation of achieving a book-to-bill greater than 1x (net of the Emirates cancellation) in 2014. Nevertheless, we recognise sentiment could still be adversely affected if order activity declines sharply.
Book-to-bill (annual) Book-to-bill (three-month rolling)
Source: Berenberg estimates, company data Source: Berenberg estimates, company data
Since 2005, the combined Boeing and Airbus monthly book-to-bill ratio has averaged 1.9x annually and 2.1x on a rolling three-month basis, marking the very substantial order book expansion previously highlighted. In this strong demand environment, both manufacturers have adopted a cautiously steady approach to
0.0
2.0
4.0
6.0
8.0
10.0
12.0
0
2,000
4,000
6,000
8,000
10,000
12,000
199
9
200
0
200
1
200
2
200
3
200
4
200
5
200
6
200
7
200
8
200
9
201
0
201
1
201
2
201
3
Backlog Deliveries Backlog to delivery (rhs)
0.0
1.0
2.0
3.0
4.0
0
1000
2000
3000
4000
200
0
200
1
200
2
200
3
200
4
200
5
200
6
200
7
200
8
200
9
201
0
201
1
201
2
201
3
Orders Deliveries Bk-to-bill
0
1
2
3
4
5
6
200
0
200
1
200
2
200
3
2004
200
5
200
6
200
7
200
8
200
9
201
0
2011
201
2
201
3
2014
8 yrs of significant backlog expansion
Aerospace & Defence
22
production increases. By way of illustration, annual aircraft deliveries have more than doubled from the trough in 2003 at a CAGR of 8%, which compares to previous cycles when the average trough-to-peak increase of c50% over three to four years, implied a CAGR of c12%. The result is lower volatility in the production cycle as evidenced by the fact there were no production cuts through the 2008/9 downturn, despite a sharp drop in air travel and a temporary period of depressed order activity.
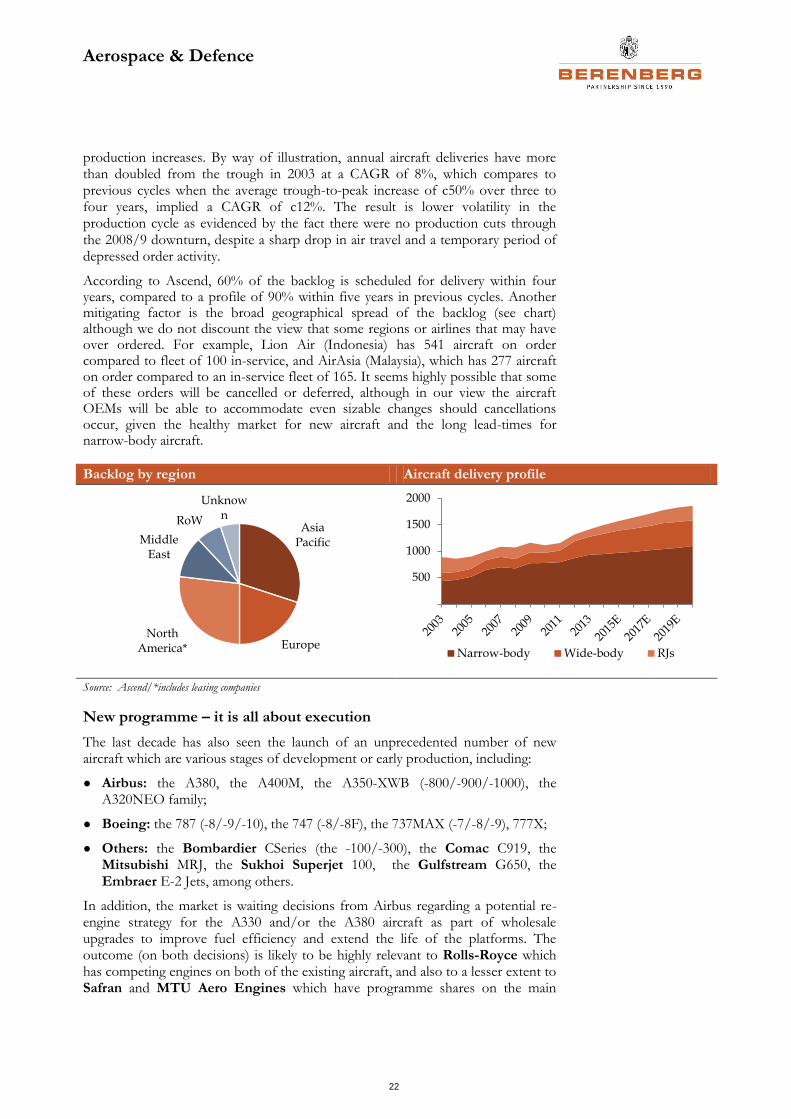
According to Ascend, 60% of the backlog is scheduled for delivery within four years, compared to a profile of 90% within five years in previous cycles. Another mitigating factor is the broad geographical spread of the backlog (see chart) although we do not discount the view that some regions or airlines that may have over ordered. For example, Lion Air (Indonesia) has 541 aircraft on order compared to fleet of 100 in-service, and AirAsia (Malaysia), which has 277 aircraft on order compared to an in-service fleet of 165. It seems highly possible that some of these orders will be cancelled or deferred, although in our view the aircraft OEMs will be able to accommodate even sizable changes should cancellations occur, given the healthy market for new aircraft and the long lead-times for narrow-body aircraft.
Backlog by region Aircraft delivery profile
Source: Ascend/*includes leasing companies
New programme – it is all about execution
The last decade has also seen the launch of an unprecedented number of new aircraft which are various stages of development or early production, including:
● Airbus: the A380, the A400M, the A350-XWB (-800/-900/-1000), the A320NEO family;
● Boeing: the 787 (-8/-9/-10), the 747 (-8/-8F), the 737MAX (-7/-8/-9), 777X;
● Others: the Bombardier CSeries (the -100/-300), the Comac C919, the Mitsubishi MRJ, the Sukhoi Superjet 100, the Gulfstream G650, the Embraer E-2 Jets, among others.
In addition, the market is waiting decisions from Airbus regarding a potential re-engine strategy for the A330 and/or the A380 aircraft as part of wholesale upgrades to improve fuel efficiency and extend the life of the platforms. The outcome (on both decisions) is likely to be highly relevant to Rolls-Royce which has competing engines on both of the existing aircraft, and also to a lesser extent to Safran and MTU Aero Engines which have programme shares on the main
Asia Pacific
EuropeNorth
America*
Middle East
RoW
Unknown
500
1000
1500
2000
Narrow-body Wide-body RJs
Aerospace & Defence
23
competing engines from GE and Engine Alliance, the 50:50 joint venture between GE and Pratt and Whitney.
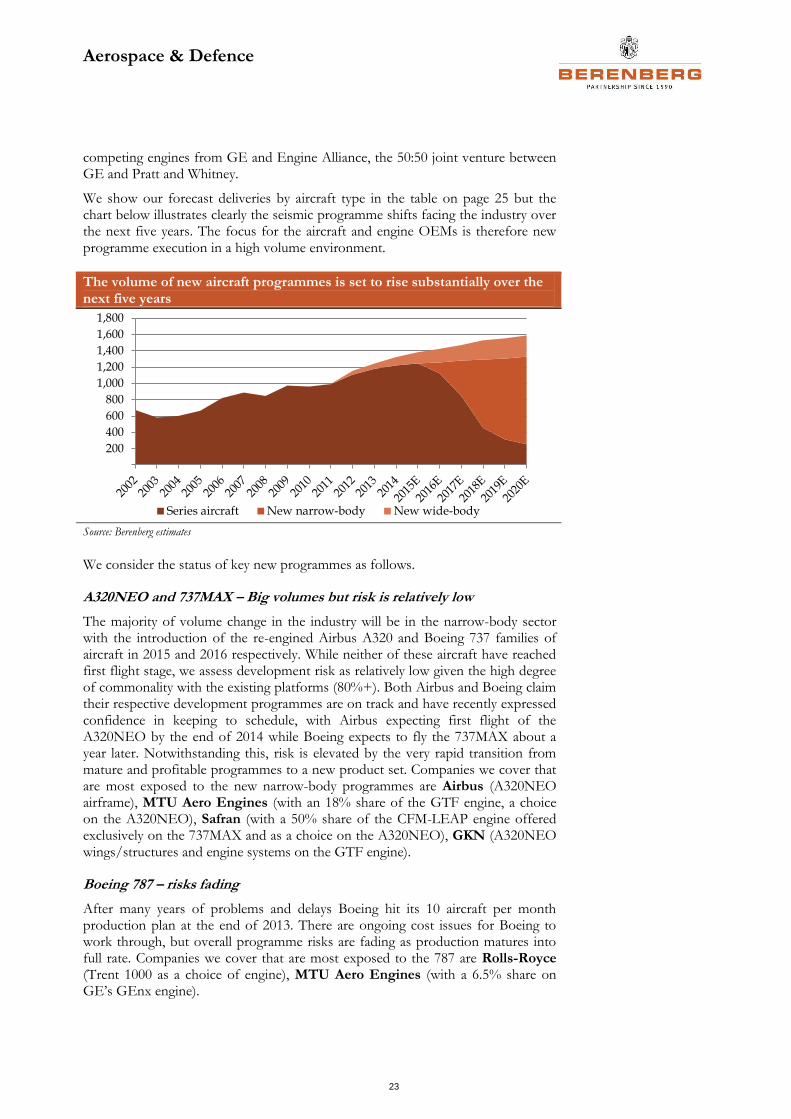
We show our forecast deliveries by aircraft type in the table on page 25 but the chart below illustrates clearly the seismic programme shifts facing the industry over the next five years. The focus for the aircraft and engine OEMs is therefore new programme execution in a high volume environment.
The volume of new aircraft programmes is set to rise substantially over the next five years
Source: Berenberg estimates
We consider the status of key new programmes as follows.
A320NEO and 737MAX – Big volumes but risk is relatively low
The majority of volume change in the industry will be in the narrow-body sector with the introduction of the re-engined Airbus A320 and Boeing 737 families of aircraft in 2015 and 2016 respectively. While neither of these aircraft have reached first flight stage, we assess development risk as relatively low given the high degree of commonality with the existing platforms (80%+). Both Airbus and Boeing claim their respective development programmes are on track and have recently expressed confidence in keeping to schedule, with Airbus expecting first flight of the A320NEO by the end of 2014 while Boeing expects to fly the 737MAX about a year later. Notwithstanding this, risk is elevated by the very rapid transition from mature and profitable programmes to a new product set. Companies we cover that are most exposed to the new narrow-body programmes are Airbus (A320NEO airframe), MTU Aero Engines (with an 18% share of the GTF engine, a choice on the A320NEO), Safran (with a 50% share of the CFM-LEAP engine offered exclusively on the 737MAX and as a choice on the A320NEO), GKN (A320NEO wings/structures and engine systems on the GTF engine).
Boeing 787 – risks fading
After many years of problems and delays Boeing hit its 10 aircraft per month production plan at the end of 2013. There are ongoing cost issues for Boeing to work through, but overall programme risks are fading as production matures into full rate. Companies we cover that are most exposed to the 787 are Rolls-Royce (Trent 1000 as a choice of engine), MTU Aero Engines (with a 6.5% share on GE’s GEnx engine).
200
400
600
800
1,000
1,200
1,400
1,600
1,800
Series aircraft New narrow-body New wide-body
Aerospace & Defence
24
A350 XWB – the next big all-new programme; ramp-up from 2016
Flight testing of the first variant of the A350-XWB (extra wide-body), the A350-900, is nearing completion, with Airbus confident of achieving aircraft certification in Q3 before first customer delivery to Qatar Airways in Q4. Early rate production commences in 2015 with a sharp increase planned thereafter. Two more variants, the smaller A350-800 and the larger A350-1000, are in early development but there is speculation that: 1) Airbus may not proceed with the -800, especially if the A330 is re-engined, on which a decision is expected by the year-end, 2) a stretched -1000 variant may be a future option to compete more effectively with Boeing’s new 777X. Companies that we cover that are most exposed to the A350 XWB programme are Airbus (airframe), Rolls-Royce (Trent XWB engines – currently sole source) and GKN (wing structures and engine systems on the Trent 1000).
B777X – A long way out
Production of the recently launched successor to Boeing’s 777 aircraft is set to begin in 2017 with first delivery targeted for late 2019/early 2020. The 777X will compete at a seating capacity level at, and just above the A350-1000. Development of the 777X is at an early stage and suppliers are still being selected. Both Safran and MTU Aero Engines are bidding for a share on GE’s GE9X engine which has been selected as the sole power plant for the 777X with decisions likely to be announced before the end of the year.
CSeries – A troubled upstart
Bombardier’s CSeries is a new family of narrow-body aircraft designed to compete at the smaller end of the Boeing 737 and Airbus A320 ranges. The programme, which is in the late stages of testing and early production, has been beset by problems and entry-in-to-service of the smaller 110-seat variant (C100) has again been delayed to the second half of 2015. The CSeries is the first aircraft to be powered by Pratt & Whitney’s PurePower GTF engine (the PW1500G), on which MTU Aero Engines has a 17% share. In late May, Bombardier reported an engine incident during ground testing which caused significant damaged and the flight testing programme remains temporarily halted. Recent comments from Pratt & Whitney suggest the problem can be fixed rapidly and flight testing is expected to resume in the next few weeks. It therefore appears this latest issue does not represent a fundamental or structural problem that could de-rail the GTF or whole CSeries programme. In volume terms, the A320NEO is a far more important programme for the GTF engine where deliveries are expected to commence in late 2015 and ramp up aggressively thereafter.
Aerospace & Defence
25
Commercial jets delivery profile
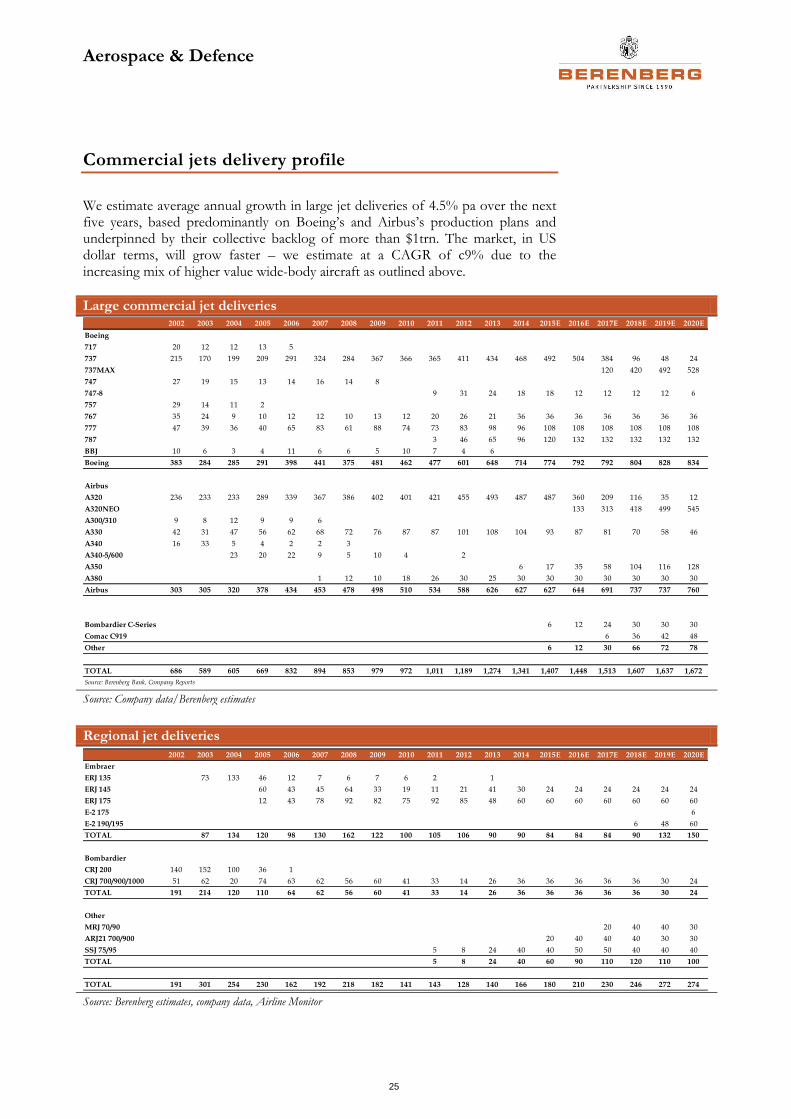
We estimate average annual growth in large jet deliveries of 4.5% pa over the next five years, based predominantly on Boeing’s and Airbus’s production plans and underpinned by their collective backlog of more than $1trn. The market, in US dollar terms, will grow faster – we estimate at a CAGR of c9% due to the increasing mix of higher value wide-body aircraft as outlined above.
Large commercial jet deliveries
Source: Company data/Berenberg estimates
Regional jet deliveries
Source: Berenberg estimates, company data, Airline Monitor
2002 2003 2004 2005 2006 2007 2008 2009 2010 2011 2012 2013 2014 2015E 2016E 2017E 2018E 2019E 2020E
Boeing
717 20 12 12 13 5
737 215 170 199 209 291 324 284 367 366 365 411 434 468 492 504 384 96 48 24
737MAX 120 420 492 528
747 27 19 15 13 14 16 14 8
747-8 9 31 24 18 18 12 12 12 12 6
757 29 14 11 2
767 35 24 9 10 12 12 10 13 12 20 26 21 36 36 36 36 36 36 36
777 47 39 36 40 65 83 61 88 74 73 83 98 96 108 108 108 108 108 108
787 3 46 65 96 120 132 132 132 132 132
BBJ 10 6 3 4 11 6 6 5 10 7 4 6
Boeing 383 284 285 291 398 441 375 481 462 477 601 648 714 774 792 792 804 828 834
Airbus
A320 236 233 233 289 339 367 386 402 401 421 455 493 487 487 360 209 116 35 12
A320NEO 133 313 418 499 545
A300/310 9 8 12 9 9 6
A330 42 31 47 56 62 68 72 76 87 87 101 108 104 93 87 81 70 58 46
A340 16 33 5 4 2 2 3
A340-5/600 23 20 22 9 5 10 4 2
A350 6 17 35 58 104 116 128
A380 1 12 10 18 26 30 25 30 30 30 30 30 30 30
Airbus 303 305 320 378 434 453 478 498 510 534 588 626 627 627 644 691 737 737 760
Bombardier C-Series 6 12 24 30 30 30
Comac C919 6 36 42 48
Other 6 12 30 66 72 78
TOTAL 686 589 605 669 832 894 853 979 972 1,011 1,189 1,274 1,341 1,407 1,448 1,513 1,607 1,637 1,672
Source: Berenberg Bank, Company Reports
2002 2003 2004 2005 2006 2007 2008 2009 2010 2011 2012 2013 2014 2015E 2016E 2017E 2018E 2019E 2020E
Embraer
ERJ 135 73 133 46 12 7 6 7 6 2 1
ERJ 145 60 43 45 64 33 19 11 21 41 30 24 24 24 24 24 24
ERJ 175 12 43 78 92 82 75 92 85 48 60 60 60 60 60 60 60
E-2 175 6
E-2 190/195 6 48 60
TOTAL 87 134 120 98 130 162 122 100 105 106 90 90 84 84 84 90 132 150
Bombardier
CRJ 200 140 152 100 36 1
CRJ 700/900/1000 51 62 20 74 63 62 56 60 41 33 14 26 36 36 36 36 36 30 24
TOTAL 191 214 120 110 64 62 56 60 41 33 14 26 36 36 36 36 36 30 24
Other
MRJ 70/90 20 40 40 30
ARJ21 700/900 20 40 40 40 30 30
SSJ 75/95 5 8 24 40 40 50 50 40 40 40
TOTAL 5 8 24 40 60 90 110 120 110 100
TOTAL 191 301 254 230 162 192 218 182 141 143 128 140 166 180 210 230 246 272 274
Aerospace & Defence
26
Civil aerospace – aftermarket
Attractive sector
Given the very long lifecycle of aircraft, we view the civil aftermarket as an attractive sector, typically characterised by high margins, strong pricing and high barriers to entry and long-term structural growth (driven by growing and aging fleets). The civil aero aftermarket, incorporating spare parts, maintenance, overhaul and repair (MRO) is inherently more cyclical than aircraft production because demand is closely linked to growth in air traffic and fleet utilisation trends.
Industry aftermarket growth was below trend growth through 2013
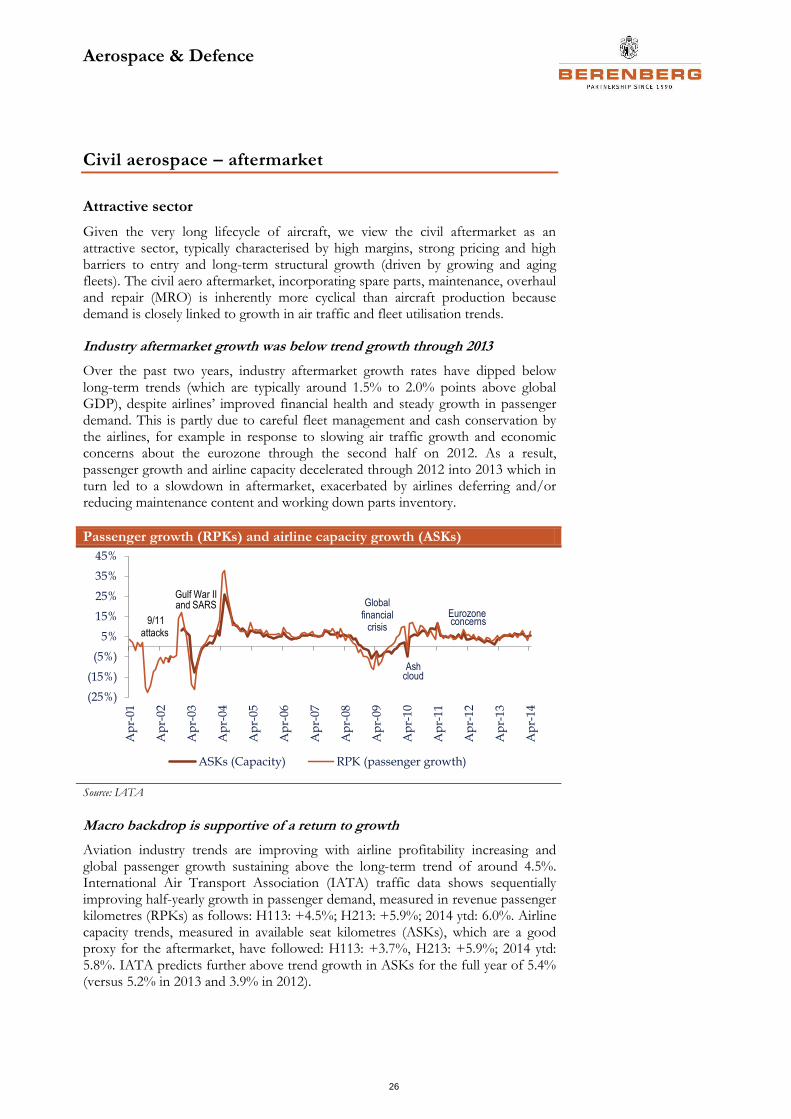
Over the past two years, industry aftermarket growth rates have dipped below long-term trends (which are typically around 1.5% to 2.0% points above global GDP), despite airlines’ improved financial health and steady growth in passenger demand. This is partly due to careful fleet management and cash conservation by the airlines, for example in response to slowing air traffic growth and economic concerns about the eurozone through the second half on 2012. As a result, passenger growth and airline capacity decelerated through 2012 into 2013 which in turn led to a slowdown in aftermarket, exacerbated by airlines deferring and/or reducing maintenance content and working down parts inventory.
Passenger growth (RPKs) and airline capacity growth (ASKs)
Source: IATA
Macro backdrop is supportive of a return to growth
Aviation industry trends are improving with airline profitability increasing and global passenger growth sustaining above the long-term trend of around 4.5%. International Air Transport Association (IATA) traffic data shows sequentially improving half-yearly growth in passenger demand, measured in revenue passenger kilometres (RPKs) as follows: H113: +4.5%; H213: +5.9%; 2014 ytd: 6.0%. Airline capacity trends, measured in available seat kilometres (ASKs), which are a good proxy for the aftermarket, have followed: H113: +3.7%, H213: +5.9%; 2014 ytd: 5.8%. IATA predicts further above trend growth in ASKs for the full year of 5.4% (versus 5.2% in 2013 and 3.9% in 2012).
(25%)
(15%)
(5%)
5%
15%
25%
35%
45%
Ap
r-0
1
Ap
r-0
2
Ap
r-0
3
Ap
r-0
4
Ap
r-0
5
Ap
r-0
6
Ap
r-0
7
Ap
r-0
8
Ap
r-0
9
Ap
r-1
0
Ap
r-1
1
Ap
r-1
2
Ap
r-1
3
Ap
r-1
4
ASKs (Capacity) RPK (passenger growth)
9/11 attacks
Gulf War II and SARS Global
financial crisis
Ash cloud
Eurozone concerns
Aerospace & Defence
27
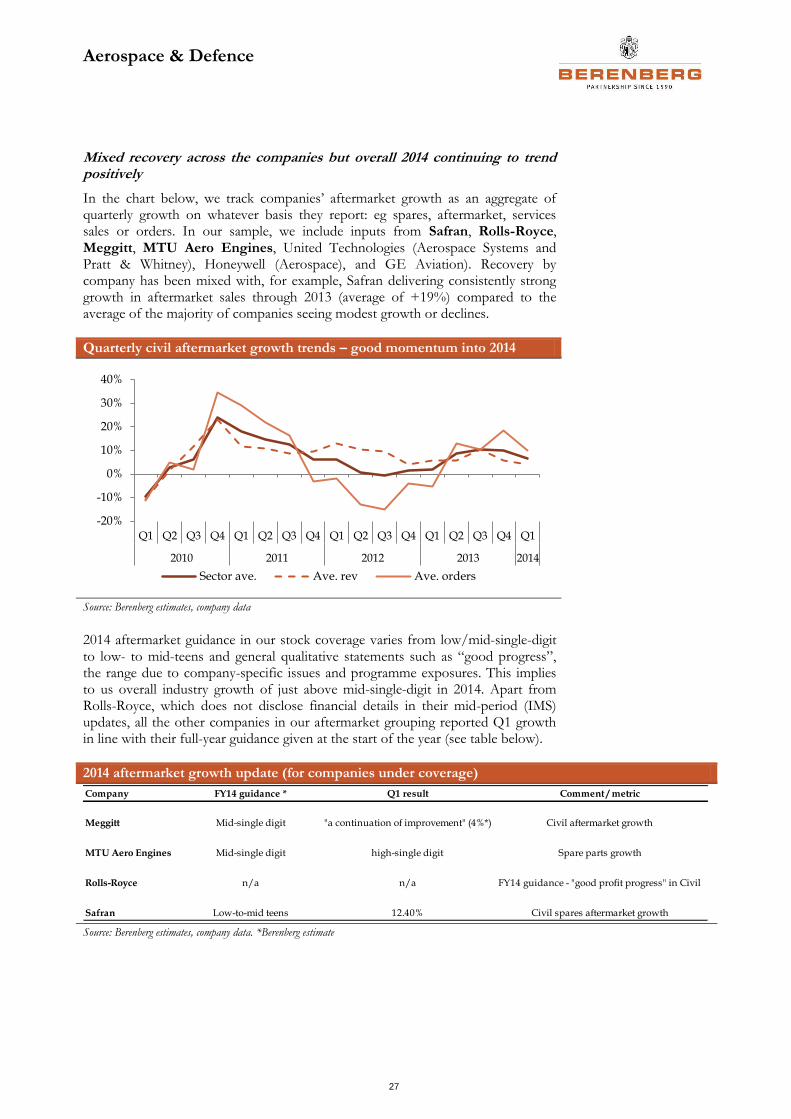
Mixed recovery across the companies but overall 2014 continuing to trend positively
In the chart below, we track companies’ aftermarket growth as an aggregate of quarterly growth on whatever basis they report: eg spares, aftermarket, services sales or orders. In our sample, we include inputs from Safran, Rolls-Royce, Meggitt, MTU Aero Engines, United Technologies (Aerospace Systems and Pratt & Whitney), Honeywell (Aerospace), and GE Aviation). Recovery by company has been mixed with, for example, Safran delivering consistently strong growth in aftermarket sales through 2013 (average of +19%) compared to the average of the majority of companies seeing modest growth or declines.
Quarterly civil aftermarket growth trends – good momentum into 2014
Source: Berenberg estimates, company data
2014 aftermarket guidance in our stock coverage varies from low/mid-single-digit to low- to mid-teens and general qualitative statements such as “good progress”, the range due to company-specific issues and programme exposures. This implies to us overall industry growth of just above mid-single-digit in 2014. Apart from Rolls-Royce, which does not disclose financial details in their mid-period (IMS) updates, all the other companies in our aftermarket grouping reported Q1 growth in line with their full-year guidance given at the start of the year (see table below).
2014 aftermarket growth update (for companies under coverage)
Source: Berenberg estimates, company data. *Berenberg estimate
-20%
-10%
0%
10%
20%
30%
40%
Q1 Q2 Q3 Q4 Q1 Q2 Q3 Q4 Q1 Q2 Q3 Q4 Q1 Q2 Q3 Q4 Q1
2010 2011 2012 2013 2014
Sector ave. Ave. rev Ave. orders
Company FY14 guidance * Q1 result Comment / metric
Meggitt Mid-single digit "a continuation of improvement" (4%*) Civil aftermarket growth
MTU Aero Engines Mid-single digit high-single digit Spare parts growth
Rolls-Royce n/a n/a FY14 guidance - "good profit progress" in Civil
Safran Low-to-mid teens 12.40% Civil spares aftermarket growth
Aerospace & Defence
28
Defence – market outlook
Global trends
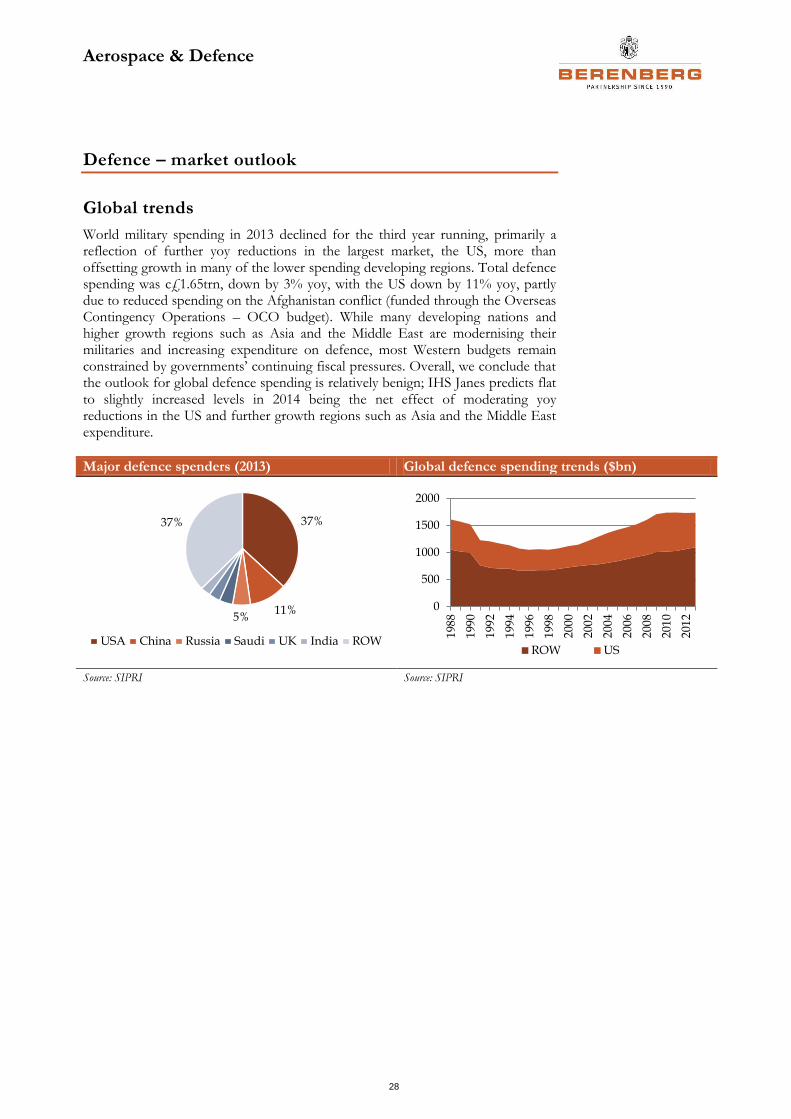
World military spending in 2013 declined for the third year running, primarily a reflection of further yoy reductions in the largest market, the US, more than offsetting growth in many of the lower spending developing regions. Total defence spending was c£1.65trn, down by 3% yoy, with the US down by 11% yoy, partly due to reduced spending on the Afghanistan conflict (funded through the Overseas Contingency Operations – OCO budget). While many developing nations and higher growth regions such as Asia and the Middle East are modernising their militaries and increasing expenditure on defence, most Western budgets remain constrained by governments’ continuing fiscal pressures. Overall, we conclude that the outlook for global defence spending is relatively benign; IHS Janes predicts flat to slightly increased levels in 2014 being the net effect of moderating yoy reductions in the US and further growth regions such as Asia and the Middle East expenditure.
Major defence spenders (2013) Global defence spending trends ($bn)
Source: SIPRI Source: SIPRI
37%
11%5%
37%
USA China Russia Saudi UK India ROW
0
500
1000
1500
2000
198
8
199
0
199
2
199
4
199
6
199
8
200
0
200
2
200
4
200
6
200
8
2010
201
2
ROW US
Aerospace & Defence
29
US defence – a stabilising situation
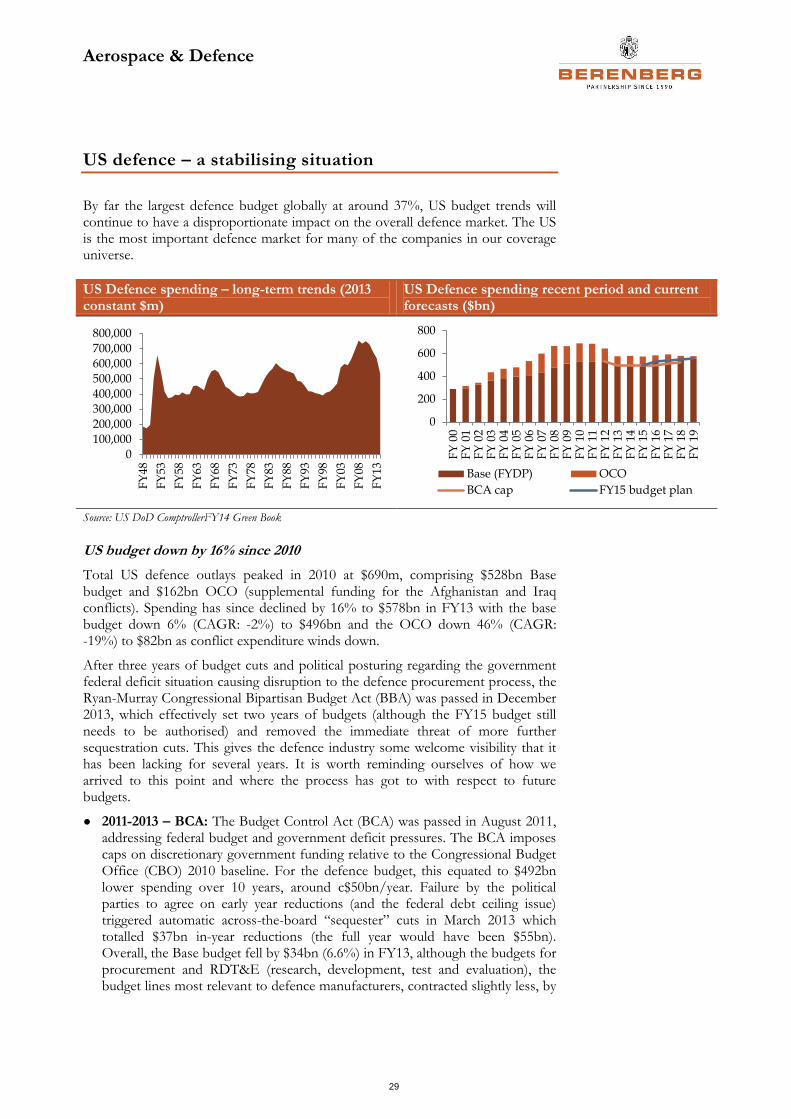
By far the largest defence budget globally at around 37%, US budget trends will continue to have a disproportionate impact on the overall defence market. The US is the most important defence market for many of the companies in our coverage universe.
US Defence spending – long-term trends (2013 constant $m)
US Defence spending recent period and current forecasts ($bn)
Source: US DoD ComptrollerFY14 Green Book
US budget down by 16% since 2010
Total US defence outlays peaked in 2010 at $690m, comprising $528bn Base budget and $162bn OCO (supplemental funding for the Afghanistan and Iraq conflicts). Spending has since declined by 16% to $578bn in FY13 with the base budget down 6% (CAGR: -2%) to $496bn and the OCO down 46% (CAGR: -19%) to $82bn as conflict expenditure winds down.
After three years of budget cuts and political posturing regarding the government federal deficit situation causing disruption to the defence procurement process, the Ryan-Murray Congressional Bipartisan Budget Act (BBA) was passed in December 2013, which effectively set two years of budgets (although the FY15 budget still needs to be authorised) and removed the immediate threat of more further sequestration cuts. This gives the defence industry some welcome visibility that it has been lacking for several years. It is worth reminding ourselves of how we arrived to this point and where the process has got to with respect to future budgets.
● 2011-2013 – BCA: The Budget Control Act (BCA) was passed in August 2011, addressing federal budget and government deficit pressures. The BCA imposes caps on discretionary government funding relative to the Congressional Budget Office (CBO) 2010 baseline. For the defence budget, this equated to $492bn lower spending over 10 years, around c$50bn/year. Failure by the political parties to agree on early year reductions (and the federal debt ceiling issue) triggered automatic across-the-board “sequester” cuts in March 2013 which totalled $37bn in-year reductions (the full year would have been $55bn). Overall, the Base budget fell by $34bn (6.6%) in FY13, although the budgets for procurement and RDT&E (research, development, test and evaluation), the budget lines most relevant to defence manufacturers, contracted slightly less, by
0
100,000
200,000
300,000
400,000
500,000
600,000
700,000
800,000
FY
48
FY
53
FY
58
FY
63
FY
68
FY
73
FY
78
FY
83
FY
88
FY
93
FY
98
FY
03
FY
08
FY
13
0
200
400
600
800
FY
00
FY
01
FY
02
FY
03
FY
04
FY
05
FY
06
FY
07
FY
08
FY
09
FY
10
FY
11
FY
12
FY
13
FY
14
FY
15
FY
16
FY
17
FY
18
FY
19
Base (FYDP) OCO
BCA cap FY15 budget plan
Aerospace & Defence
30
4.1% to £155bn. Through this period there was significant uncertainty around the exact nature of cuts and risks to future funding lines, which was exacerbated by late annual budget agreements (forcing prolonged periods of budgeting under multi- part-year Continuing Resolutions) and resulted in a dislocated procurement environment. As a result, order and contract approval delays have been commonplace.
● December 2013 – January 2014: The BBA was passed in December 2013. This is a two-year budget agreement which avoids a further government shut down and replaces sequester spending cuts with savings from future-year cuts. In January, the “Omnibus Appropriations Bill” was passed containing the FY14 Defense Appropriations Bill and outline of the FY15 request.
● May 2015: In the route to finalising the FY15 Defense budget, the Senate Armed Services Committee passed its version of the 2015 National Defense Authorisation Act (NDAA) on 22 May at levels consistent with spending caps for FY15 set out in the BBA; namely authorisations of $496bn (flat yoy) for the Base budget including $91bn for procurement (-2.1% yoy) and $64bn for RDT&E (+1.2% yoy)
● OCO: The OCO is separate from Base defence spending and indeed exempt from BCA spending caps. OCO spending peaked in 2008 at $187bn falling to $82bn in 2013. The FY14 budget actually increased 3.9% yoy to $85bn but reduces by 6.8% in FY15 to $79bn. As troop drawdown continues, we expect annual OCO spending will decline for foreseeable future. We expect a reduction to a much lower number when troop drawdown is complete, and when remaining in-country commitments are defined.
Longer-term budget outlook is flat although sequestration risks remain
In summary, the BBA and subsequent defence appropriation bills have afforded a level of visibility for the industry not seen for several years. We conclude that the worst of the cuts to the Base budget has occurred (as shown in the chart above). Even with future Base spending in line with BCA caps, and taking into account future reductions in OCO budgets, total top line spending is likely to remain flat at around $600bn for much of the rest of the decade. Indeed at the procurement and RDT&E level the expectation is for modest rises (see chat below). This profile incorporates the very substantial reductions to expected long-term spending which have totalled almost $600bn to date against the expected level in 2010 (incorporating BCA reductions of $492bn over 10 years), $32bn of sequestration cuts in 2013 and $76bn total reductions in the FY14 and FY15 budgets compared with the US president’s original budget request. Or to it put another way, the reductions “absorbed” so far are against a growth plan of many years ago. In absolute terms, the dollar amount is set to rise (albeit modestly).
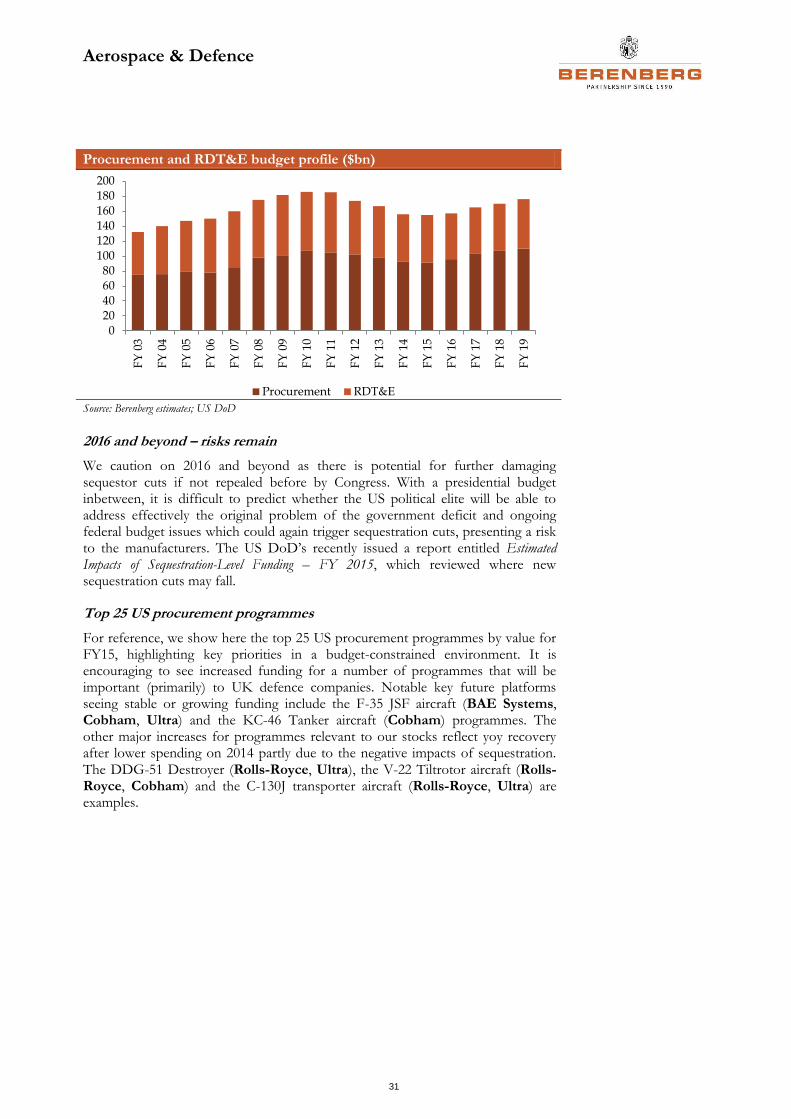
Aerospace & Defence
31
Procurement and RDT&E budget profile ($bn)
Source: Berenberg estimates; US DoD
2016 and beyond – risks remain
We caution on 2016 and beyond as there is potential for further damaging sequestor cuts if not repealed before by Congress. With a presidential budget inbetween, it is difficult to predict whether the US political elite will be able to address effectively the original problem of the government deficit and ongoing federal budget issues which could again trigger sequestration cuts, presenting a risk to the manufacturers. The US DoD’s recently issued a report entitled Estimated Impacts of Sequestration-Level Funding – FY 2015, which reviewed where new sequestration cuts may fall.
Top 25 US procurement programmes
For reference, we show here the top 25 US procurement programmes by value for FY15, highlighting key priorities in a budget-constrained environment. It is encouraging to see increased funding for a number of programmes that will be important (primarily) to UK defence companies. Notable key future platforms seeing stable or growing funding include the F-35 JSF aircraft (BAE Systems, Cobham, Ultra) and the KC-46 Tanker aircraft (Cobham) programmes. The other major increases for programmes relevant to our stocks reflect yoy recovery after lower spending on 2014 partly due to the negative impacts of sequestration. The DDG-51 Destroyer (Rolls-Royce, Ultra), the V-22 Tiltrotor aircraft (Rolls-Royce, Cobham) and the C-130J transporter aircraft (Rolls-Royce, Ultra) are examples.
020406080
100120140160180200
FY
03
FY
04
FY
05
FY
06
FY
07
FY
08
FY
09
FY
10
FY
11
FY
12
FY
13
FY
14
FY
15
FY
16
FY
17
FY
18
FY
19
Procurement RDT&E

Aerospace & Defence
32
Top 25 US procurement programmes ($m)
Source: DoD
Programme Title
Organisatio
n Budget Activity
FY
2014
Qty
(units)
FY 2014
Budget
($m)
FY
2015
Qty
(units)
FY 2015
Budget
($m)
Delta
($m)
%
Change
Virginia Class Submarine NAVY Other Warships 2 5,409,326 2 5,288,668 -120,658 -2%
F-35 AF Tactical Forces 19 3,183,002 26 3,892,579 709,577 22%
DDG-51 NAVY Other Warships 1 1,729,604 2 2,969,354 1,239,750 72%
Virginia Class Submarine NAVY Other Warships 0 2,354,612 0 2,330,325 -24,287 -1%
P-8A Poseidon NAVY Combat Aircraft 16 3,347,044 8 2,166,487 -1,180,557 -35%
KC-46A Tanker AF Tactical Airlift - - 7 1,582,685 1,582,685 -
V-22 (Medium Lift) NAVY Combat Aircraft 19 1,435,731 19 1,546,359 110,628 8%
Littoral Combat Ship NAVY Other Warships 4 1,793,014 3 1,427,049 -365,965 -20%
JSF STOVL NAVY Combat Aircraft 6 1,274,559 6 1,303,605 29,046 2%
Carrier Replacement Program NAVY Other Warships 0 917,553 0 1,300,000 382,447 42%
UH-60 Blackhawk M Model (MYP) ARMY Rotary 70 1,218,916 79 1,237,001 18,085 1%
Spares and Repair Parts NAVY Aircraft Spares and Repair Parts 0 965,238 0 1,229,651 264,413 27%
Trident II Mods NAVY Modification of Missiles 0 1,130,865 0 1,190,455 59,590 5%
MH-60R (MYP) NAVY Combat Aircraft 19 704,329 29 1,131,712 427,383 61%
E-2D Adv Hawkeye NAVY Combat Aircraft 5 1,083,588 4 945,370 -138,218 -13%
CH-47 Helicopter ARMY Rotary 28 868,791 32 892,504 23,713 3%
H-1 Upgrades (UH-1Y/AH-1Z) NAVY Combat Aircraft 21 668,945 26 838,757 169,812 25%
Win-T - Ground Forces Tactical Network ARMY Comm - Joint Communications 1,725 769,477 1,280 763,087 -6,390 -1%
Evolved Expendable Launch Veh (Infrast.) AF Space Programs 0 559,413 0 750,143 190,730 34%
Joint Strike Fighter CV NAVY Combat Aircraft 4 1,059,114 2 689,668 -369,446 -35%
F-18 Series NAVY Modification of Aircraft 0 725,912 0 679,177 -46,735 -6%
Evolved Expendable Launch Veh(Space) AF Space Programs 5 807,991 3 630,903 -177,088 -22%
Chem Demilitarization - RDT&E ARMY RDT&E 0 633,911 0 595,913 -37,998 -6%
C-130J AF Other Airlift 6 477,517 7 580,396 102,879 22%
AH-64 Apache Block IIIA Reman ARMY Rotary 42 722,311 25 494,009 -228,302 -32%
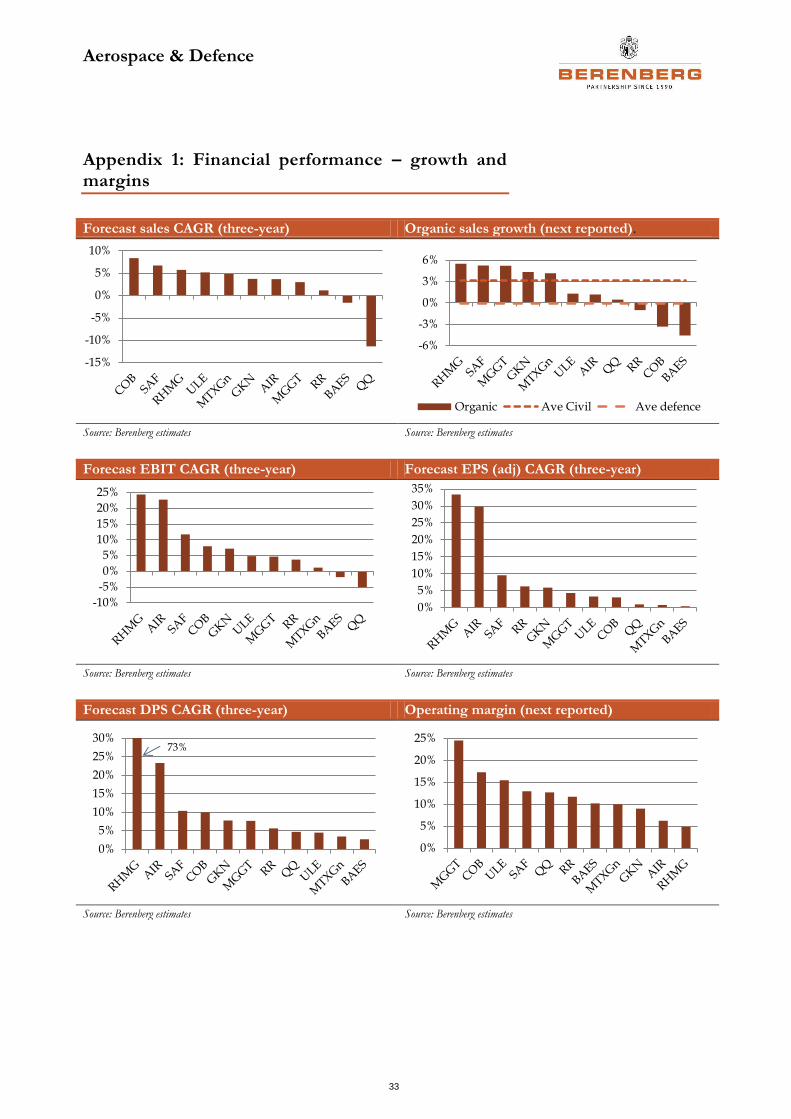
Aerospace & Defence
33
Appendix 1: Financial performance – growth and margins
Forecast sales CAGR (three-year) Organic sales growth (next reported).
Source: Berenberg estimates Source: Berenberg estimates
Forecast EBIT CAGR (three-year) Forecast EPS (adj) CAGR (three-year)
Source: Berenberg estimates Source: Berenberg estimates
Forecast DPS CAGR (three-year) Operating margin (next reported)
Source: Berenberg estimates Source: Berenberg estimates
-15%
-10%
-5%
0%
5%
10%
-6%
-3%
0%
3%
6%
Organic Ave Civil Ave defence
-10%
-5%
0%
5%
10%
15%
20%
25%
0%
5%
10%
15%
20%
25%
30%
35%
0%
5%
10%
15%
20%
25%
30%73%
0%
5%
10%
15%
20%
25%
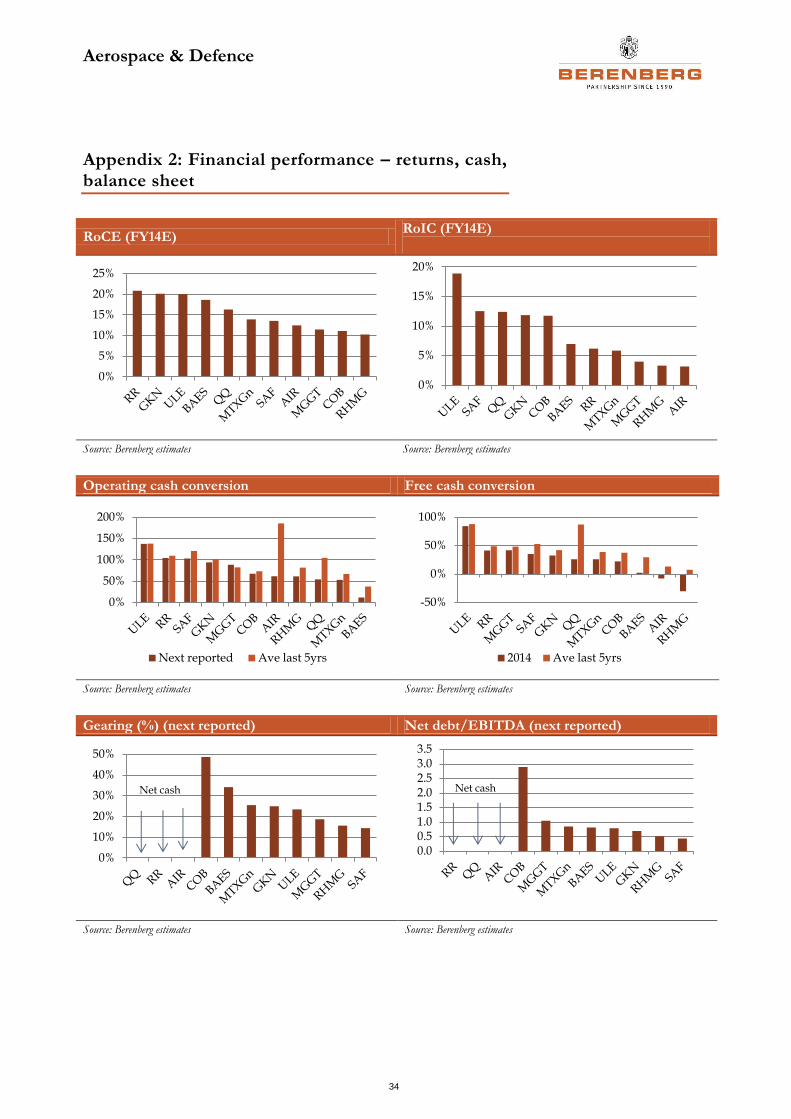
Aerospace & Defence
34
Appendix 2: Financial performance – returns, cash, balance sheet
RoCE (FY14E) RoIC (FY14E)
Source: Berenberg estimates Source: Berenberg estimates
Operating cash conversion Free cash conversion
Source: Berenberg estimates Source: Berenberg estimates
Gearing (%) (next reported) Net debt/EBITDA (next reported)
Source: Berenberg estimates Source: Berenberg estimates
0%
5%
10%
15%
20%
25%
0%
5%
10%
15%
20%
0%
50%
100%
150%
200%
Next reported Ave last 5yrs
-50%
0%
50%
100%
2014 Ave last 5yrs
0%
10%
20%
30%
40%
50%
Net cash
0.00.51.01.52.02.53.03.5
Net cash
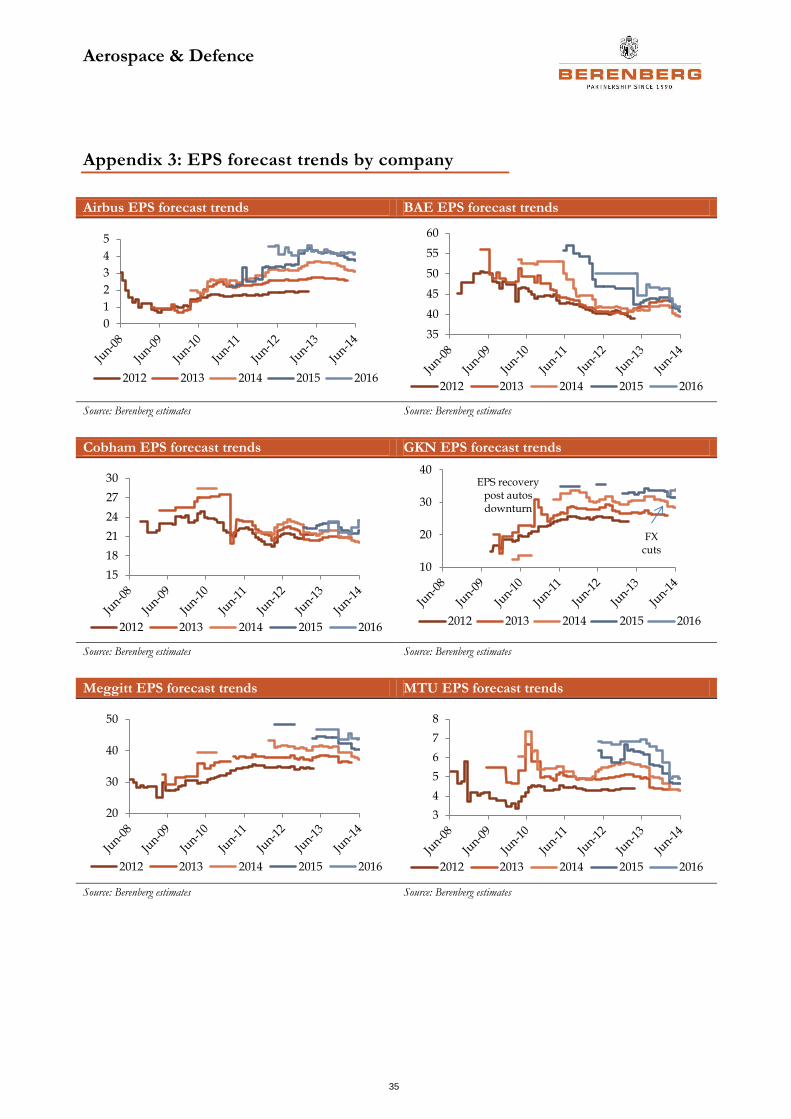
Aerospace & Defence
35
Appendix 3: EPS forecast trends by company
Airbus EPS forecast trends BAE EPS forecast trends
Source: Berenberg estimates Source: Berenberg estimates
Cobham EPS forecast trends GKN EPS forecast trends
Source: Berenberg estimates Source: Berenberg estimates
Meggitt EPS forecast trends MTU EPS forecast trends
Source: Berenberg estimates Source: Berenberg estimates
0
1
2
3
4
5
2012 2013 2014 2015 2016
35
40
45
50
55
60
2012 2013 2014 2015 2016
15
18
21
24
27
30
2012 2013 2014 2015 2016
10
20
30
40
2012 2013 2014 2015 2016
EPS recovery post autos downturn
FX cuts
20
30
40
50
2012 2013 2014 2015 2016
3
4
5
6
7
8
2012 2013 2014 2015 2016
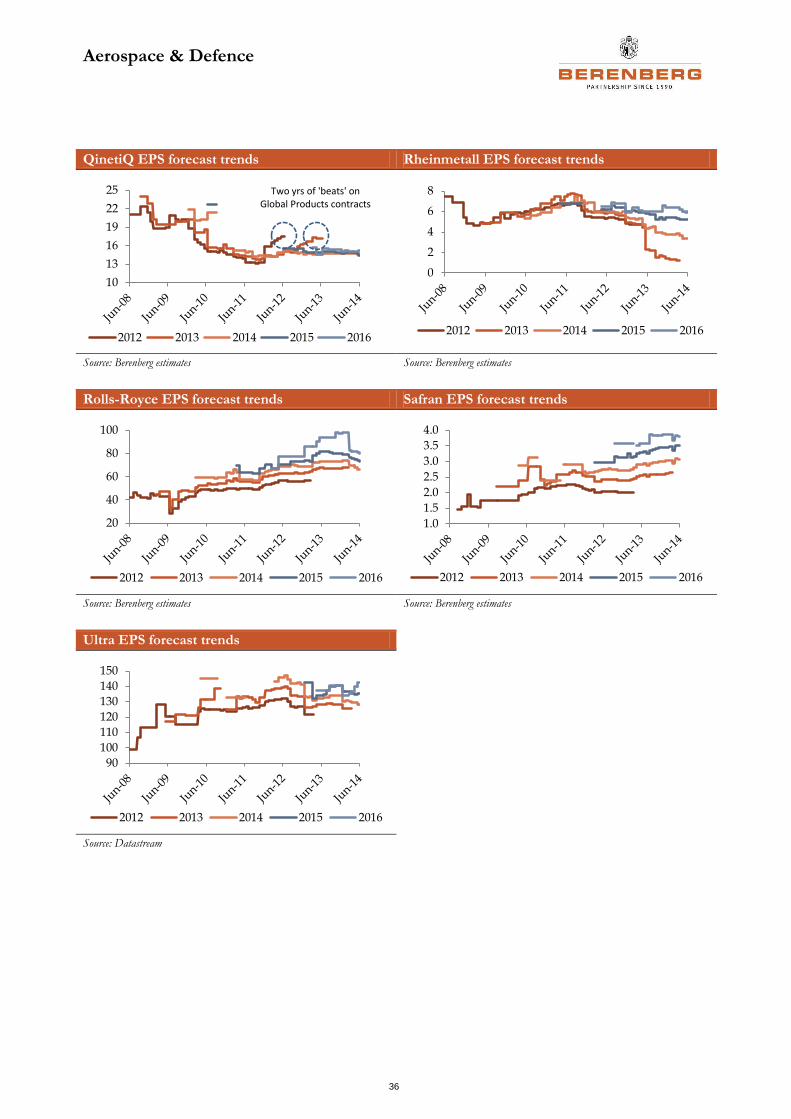
Aerospace & Defence
36
QinetiQ EPS forecast trends Rheinmetall EPS forecast trends
Source: Berenberg estimates Source: Berenberg estimates
Rolls-Royce EPS forecast trends Safran EPS forecast trends
Source: Berenberg estimates Source: Berenberg estimates
Ultra EPS forecast trends
Source: Datastream
10
13
16
19
22
25
2012 2013 2014 2015 2016
Two yrs of 'beats' on Global Products contracts
0
2
4
6
8
2012 2013 2014 2015 2016
20
40
60
80
100
2012 2013 2014 2015 2016
1.0
1.5
2.0
2.5
3.0
3.5
4.0
2012 2013 2014 2015 2016
90
100
110
120
130
140
150
2012 2013 2014 2015 2016
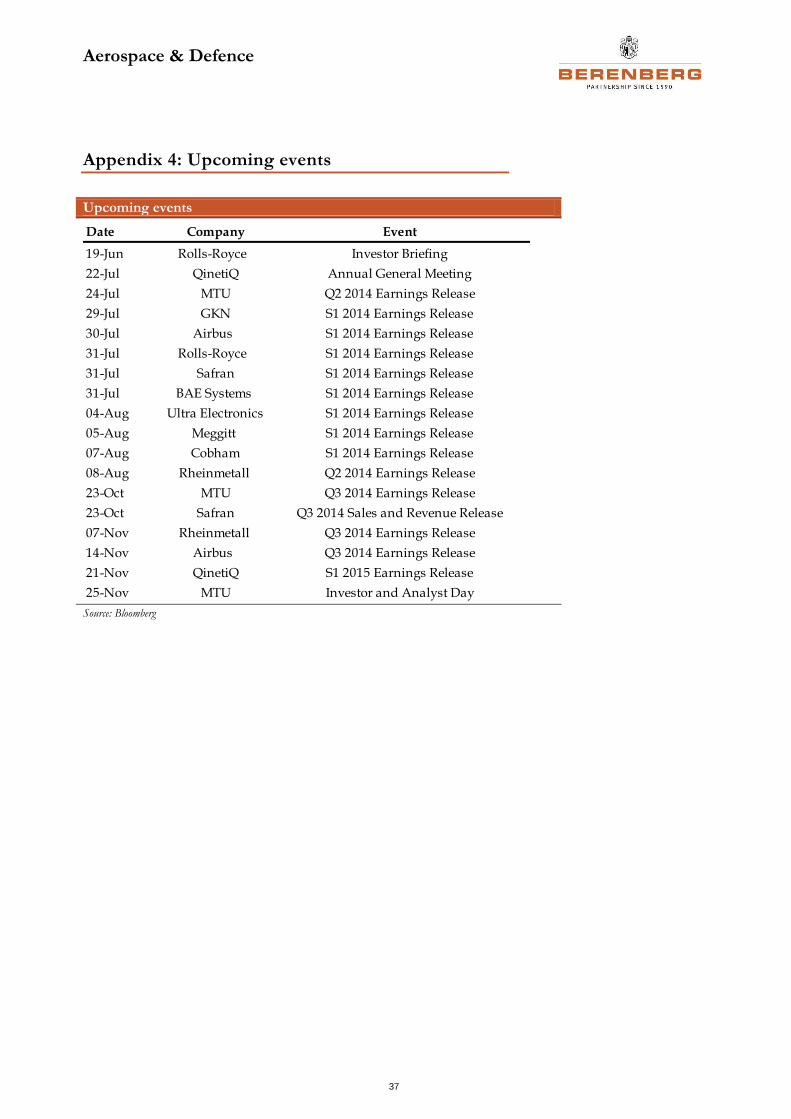
Aerospace & Defence
37
Appendix 4: Upcoming events
Upcoming events
Source: Bloomberg
Date Company Event
19-Jun Rolls-Royce Investor Briefing
22-Jul QinetiQ Annual General Meeting
24-Jul MTU Q2 2014 Earnings Release
29-Jul GKN S1 2014 Earnings Release
30-Jul Airbus S1 2014 Earnings Release
31-Jul Rolls-Royce S1 2014 Earnings Release
31-Jul Safran S1 2014 Earnings Release
31-Jul BAE Systems S1 2014 Earnings Release
04-Aug Ultra Electronics S1 2014 Earnings Release
05-Aug Meggitt S1 2014 Earnings Release
07-Aug Cobham S1 2014 Earnings Release
08-Aug Rheinmetall Q2 2014 Earnings Release
23-Oct MTU Q3 2014 Earnings Release
23-Oct Safran Q3 2014 Sales and Revenue Release
07-Nov Rheinmetall Q3 2014 Earnings Release
14-Nov Airbus Q3 2014 Earnings Release
21-Nov QinetiQ S1 2015 Earnings Release
25-Nov MTU Investor and Analyst Day
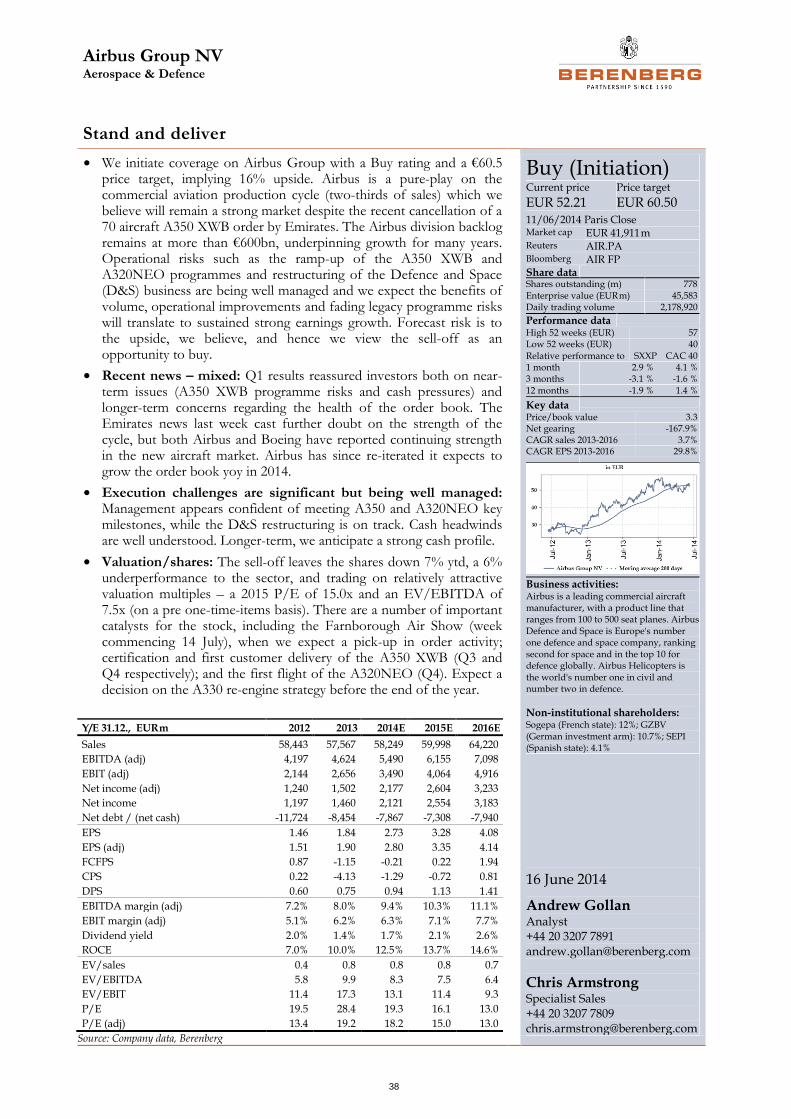
Airbus Group NV Aerospace & Defence
38
Stand and deliver
• We initiate coverage on Airbus Group with a Buy rating and a €60.5 price target, implying 16% upside. Airbus is a pure-play on the commercial aviation production cycle (two-thirds of sales) which we believe will remain a strong market despite the recent cancellation of a 70 aircraft A350 XWB order by Emirates. The Airbus division backlog remains at more than €600bn, underpinning growth for many years. Operational risks such as the ramp-up of the A350 XWB and A320NEO programmes and restructuring of the Defence and Space (D&S) business are being well managed and we expect the benefits of volume, operational improvements and fading legacy programme risks will translate to sustained strong earnings growth. Forecast risk is to the upside, we believe, and hence we view the sell-off as an opportunity to buy.
• Recent news – mixed: Q1 results reassured investors both on near-term issues (A350 XWB programme risks and cash pressures) and longer-term concerns regarding the health of the order book. The Emirates news last week cast further doubt on the strength of the cycle, but both Airbus and Boeing have reported continuing strength in the new aircraft market. Airbus has since re-iterated it expects to grow the order book yoy in 2014.
• Execution challenges are significant but being well managed: Management appears confident of meeting A350 and A320NEO key milestones, while the D&S restructuring is on track. Cash headwinds are well understood. Longer-term, we anticipate a strong cash profile.
• Valuation/shares: The sell-off leaves the shares down 7% ytd, a 6% underperformance to the sector, and trading on relatively attractive valuation multiples – a 2015 P/E of 15.0x and an EV/EBITDA of 7.5x (on a pre one-time-items basis). There are a number of important catalysts for the stock, including the Farnborough Air Show (week commencing 14 July), when we expect a pick-up in order activity; certification and first customer delivery of the A350 XWB (Q3 and Q4 respectively); and the first flight of the A320NEO (Q4). Expect a decision on the A330 re-engine strategy before the end of the year.
Buy (Initiation) Current price
EUR 52.21 Price target
EUR 60.50 11/06/2014 Paris Close Market cap EUR 41,911 m Reuters AIR.PA Bloomberg AIR FP Share data
Shares outstanding (m) 778 Enterprise value (EUR m) 45,583 Daily trading volume 2,178,920
Performance data
High 52 weeks (EUR) 57 Low 52 weeks (EUR) 40
Relative performance to SXXP CAC 40 1 month 2.9 % 4.1 % 3 months -3.1 % -1.6 % 12 months -1.9 % 1.4 %
Key data
Price/book value 3.3 Net gearing -167.9% CAGR sales 2013-2016 3.7% CAGR EPS 2013-2016 29.8%
Business activities: Airbus is a leading commercial aircraft manufacturer, with a product line that ranges from 100 to 500 seat planes. Airbus Defence and Space is Europe's number one defence and space company, ranking second for space and in the top 10 for defence globally. Airbus Helicopters is the world's number one in civil and number two in defence.
Non-institutional shareholders: Sogepa (French state): 12%; GZBV (German investment arm): 10.7%; SEPI (Spanish state): 4.1%
16 June 2014
Andrew Gollan Analyst +44 20 3207 7891 [email protected]
Chris Armstrong
Specialist Sales +44 20 3207 7809 [email protected]
Y/E 31.12., EUR m 2012 2013 2014E 2015E 2016E
Sales 58,443 57,567 58,249 59,998 64,220
EBITDA (adj) 4,197 4,624 5,490 6,155 7,098
EBIT (adj) 2,144 2,656 3,490 4,064 4,916
Net income (adj) 1,240 1,502 2,177 2,604 3,233
Net income 1,197 1,460 2,121 2,554 3,183
Net debt / (net cash) -11,724 -8,454 -7,867 -7,308 -7,940
EPS 1.46 1.84 2.73 3.28 4.08
EPS (adj) 1.51 1.90 2.80 3.35 4.14
FCFPS 0.87 -1.15 -0.21 0.22 1.94
CPS 0.22 -4.13 -1.29 -0.72 0.81
DPS 0.60 0.75 0.94 1.13 1.41
EBITDA margin (adj) 7.2% 8.0% 9.4% 10.3% 11.1%
EBIT margin (adj) 5.1% 6.2% 6.3% 7.1% 7.7%
Dividend yield 2.0% 1.4% 1.7% 2.1% 2.6%
ROCE 7.0% 10.0% 12.5% 13.7% 14.6%
EV/sales 0.4 0.8 0.8 0.8 0.7
EV/EBITDA 5.8 9.9 8.3 7.5 6.4
EV/EBIT 11.4 17.3 13.1 11.4 9.3
P/E 19.5 28.4 19.3 16.1 13.0
P/E (adj) 13.4 19.2 18.2 15.0 13.0
Source: Company data, Berenberg
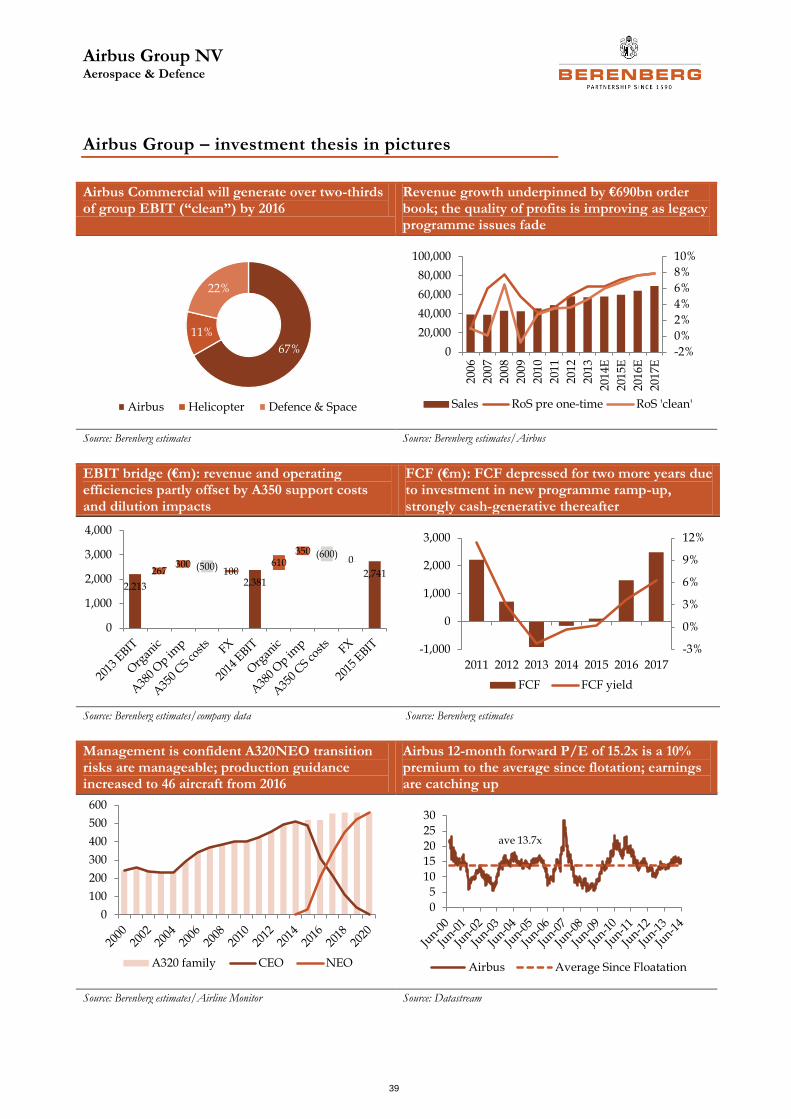
Airbus Group NV Aerospace & Defence
39
Airbus Group – investment thesis in pictures
Airbus Commercial will generate over two-thirds of group EBIT (“clean”) by 2016
Revenue growth underpinned by €690bn order book; the quality of profits is improving as legacy programme issues fade
Source: Berenberg estimates Source: Berenberg estimates/Airbus
EBIT bridge (€m): revenue and operating efficiencies partly offset by A350 support costs and dilution impacts
FCF (€m): FCF depressed for two more years due to investment in new programme ramp-up, strongly cash-generative thereafter
Source: Berenberg estimates/company data Source: Berenberg estimates
Management is confident A320NEO transition risks are manageable; production guidance increased to 46 aircraft from 2016
Airbus 12-month forward P/E of 15.2x is a 10% premium to the average since flotation; earnings are catching up
Source: Berenberg estimates/Airline Monitor Source: Datastream
67%
11%
22%
Airbus Helicopter Defence & Space
-2%
0%
2%
4%
6%
8%
10%
0
20,000
40,000
60,000
80,000
100,000
200
6
200
7
200
8
200
9
201
0
201
1
201
2
201
3
201
4E
201
5E
201
6E
201
7E
Sales RoS pre one-time RoS 'clean'
2,213
267300 (500) 100
2,381
610350 (600)
0
2,741
0
1,000
2,000
3,000
4,000
-3%
0%
3%
6%
9%
12%
-1,000
0
1,000
2,000
3,000
2011 2012 2013 2014 2015 2016 2017
FCF FCF yield
0
100
200
300
400
500
600
A320 family CEO NEO
0
5
10
15
20
25
30
Airbus Average Since Floatation
ave 13.7x
Airbus Group NV Aerospace & Defence
40
Airbus Group – investment thesis
What’s new: We initiate coverage on Airbus with a Buy rating and a €60.5 price target, implying 14% upside.
Two-minute summary: Airbus is a pure-play on the commercial aircraft production cycle with a c€660bn order book providing a clear path to growth, not least from an almost nine-year backlog in its core commercial aircraft business. In light of such unprecedented demand, slowing order activity is inevitable, raising the question of a softening order cycle. Emirates’ cancellation of an order for 70 A350 XWB aircraft has served to heighten concerns. We do not believe this event indicates a general slowdown. On the contrary, Airbus has said the new aircraft market remains active and has again confirmed its guidance for order book growth in 2014. In the light of this and the existing 5,500 aircraft backlog (c8.8 years’ production), we do not believe the Emirates development signals a change in the outlook for production. In our view, the most important driver of valuation over the next 12-24 months is the company’s ability to execute on several challenging programmes and deliver promised margin expansion. We are gaining confidence that new programme risks are being well managed: A350 XWB certification and first customer delivery milestones are edging closer (Q3 and Q4 respectively), the first flight of the A320NEO aircraft (new engine option) is expected this year, and industrial preparations for transition from the A320CEO (current engine option) appear to be on track.
Also key to margin expansion is progress on the Defence and Space (D&S) restructuring which management recently said will accelerate in H214. These are complex business challenges, and there are many other pockets of risk across the portfolio, but in our view they are more than countered by strong underlying business momentum and fading legacy programme risks. Following the Emirates-induced sell-off, the shares are down by 7% ytd, the second-worst-performing stock in our coverage. If the company continues to deliver a consistent message of steady progress on key programmes, we see upside risk to both to forecasts and the valuation.
Key investment point one: multi-year improving margins; double-digit upside at upper target range
Airbus is the second highest earnings growth company in our coverage with a four-year “clean” EPS CAGR of 30%. A number factors are driving multi-year margin progression, including strong momentum in Airbus Commercial, an improving programme risk profile and cost reduction and operating improvements across the group. At the Q1 results, management confirmed the 2015 target margin of 7-8% despite growing A350 XWB losses. Our forecasts (and consensus’s, we believe) are pitched conservatively given significant business challenges relating to the ramp-up of the A350 XWB, the development and ramp-up of the A320NEO and a complex restructuring of the D&S business. Nevertheless, we sense a growing confidence that these risks can be managed. Delivery to the upper end of the target range implies 15% upside to our estimates.
Key investment point two: do not get hung up on the book-to-bill – the backlog profile is robust
Given the scale of the backlog (8.8 years), lower aircraft order activity is unlikely to indicate future production cuts as it has done in historical cycles, although it could weigh on investor sentiment if orders slow significantly and/or order cancellations
Airbus Group NV Aerospace & Defence
41
and deferral rates pick up. The Emirates cancellation has served to heighten concerns in the market. Airbus’s book-to-bill ratio has averaged 1.9x over the past 10 years, building a record backlog of 5,500 aircraft, more than 3.5x the previous peak in 2000. From this point, is reasonable to expect order rates to slow, we believe, although we were encouraged to hear management refer to a continuing healthy level of sales campaigns at the time of the Q1s and again following the Emirates announcement. By aircraft type, the A330 poses a modest risk in the short term given that the backlog of 260 aircraft gives only 2.5 years cover. A lack of orders or a decision not to pursue a re-engine option (called the A330NEO) would necessitate a production ramp-down of the current type over the next few years. A decision on whether to re-engine is expected by the end of the year. In summary, we believe the risk of a material reduction in aircraft production over the next three to five years is very low, in spite of the level of order activity.
Key investment point three: cash headwinds for two more years
Current weak cash performance is a result of heavy investments ahead of growth and planned ramp-ups in the A350 and A320NEO programmes. Historically, Airbus has been highly cash-generative, averaging 63% free cash conversion over the five years to 2012. However, we expect low free cash flows to persist through 2015 due to continuing investment commitments, leading to a trough net cash position of c€7bn, followed by a strengthening of cash performance thereafter.
Investment point four: D&S restructuring is complex – management has committed to an 8% RoS
At a cost of €232m a major restructuring of the group’s underperforming D&S businesses is underway, incorporating the merger of Astrium (space), Cassidian (defence) and Airbus Military (aircraft). The objective is to improve operational performance and leverage group synergies in the face of continuing difficult markets, but the company has not quantified mid-/longer-term benefit objectives other than re-iterating a previous target operating margin of 8% in 2015. We err on the side of caution given the poor financial track record of these businesses, implying c2% upside to our group EBIT forecast if the target is achieved.
Share price performance and valuation
Airbus shares are down by 7% ytd, slightly below consensus EPS downgrades of 9% (FY14) and equivalent to a 6% underperformance relative to the sector. This followed an 85% appreciation in 2013 driven by both positive business momentum and a strong re-rating as sentiment recovered after the BAE merger proposal collapsed and significant structural, operational, shareholder and governance changes were implemented. Through 2013, the 12-month forward P/E increased by 4.9 turns (43%) implying upgrades accounted for around half of the share gains. The shares now trade on a 15.0x FY15 P/E (on a pre-one-time items basis), a 13% premium to the long-run average of 13.7x.
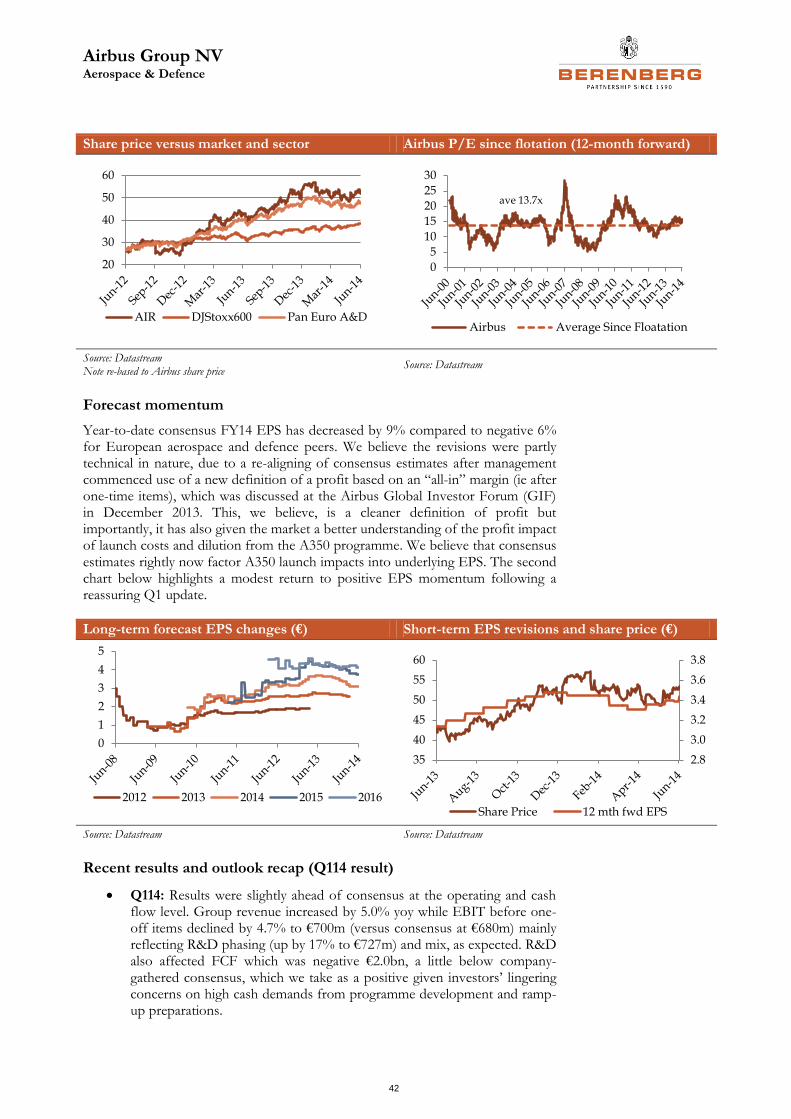
Airbus Group NV Aerospace & Defence
42
Share price versus market and sector Airbus P/E since flotation (12-month forward)
Source: Datastream Note re-based to Airbus share price
Source: Datastream
Forecast momentum
Year-to-date consensus FY14 EPS has decreased by 9% compared to negative 6% for European aerospace and defence peers. We believe the revisions were partly technical in nature, due to a re-aligning of consensus estimates after management commenced use of a new definition of a profit based on an “all-in” margin (ie after one-time items), which was discussed at the Airbus Global Investor Forum (GIF) in December 2013. This, we believe, is a cleaner definition of profit but importantly, it has also given the market a better understanding of the profit impact of launch costs and dilution from the A350 programme. We believe that consensus estimates rightly now factor A350 launch impacts into underlying EPS. The second chart below highlights a modest return to positive EPS momentum following a reassuring Q1 update.
Long-term forecast EPS changes (€) Short-term EPS revisions and share price (€)
Source: Datastream Source: Datastream
Recent results and outlook recap (Q114 result)
Q114: Results were slightly ahead of consensus at the operating and cash flow level. Group revenue increased by 5.0% yoy while EBIT before one-off items declined by 4.7% to €700m (versus consensus at €680m) mainly reflecting R&D phasing (up by 17% to €727m) and mix, as expected. R&D also affected FCF which was negative €2.0bn, a little below company-gathered consensus, which we take as a positive given investors’ lingering concerns on high cash demands from programme development and ramp-up preparations.
20
30
40
50
60
AIR DJStoxx600 Pan Euro A&D
0
5
10
15
20
25
30
Airbus Average Since Floatation
ave 13.7x
0
1
2
3
4
5
2012 2013 2014 2015 2016
2.8
3.0
3.2
3.4
3.6
3.8
35
40
45
50
55
60
Share Price 12 mth fwd EPS
Airbus Group NV Aerospace & Defence
43
In the detail: 1) Management confirmed the plan for 30 A380 deliveries in 2014 and that the 2015 breakeven objective is on track. Also, it confirmed that the A350 is progressing towards full certification in Q3, and that the first flight of the A320NEO will be achieved by the year-end. 2) The strong profit recovery in Helicopters (margin: +300bp to 4.9%) was driven by volume and recovery of Super Puma activity. 3) D&S revenue growth of 3% was driven by project execution in Space with profits held yoy despite adverse R&D phasing. The D&S restructuring programme is progressing with full implementation from H214. 4) Hedging activity slowed due to unfavourable rates. €2.2bn of new contracts were added versus €6.0bn matured. The hedge portfolio totals $72.1bn at average rate of $1 = €1.34 with 2014 fully covered at €1.35 and 2015 substantially covered (we estimate 75% cover) at the same rate.
Key take-away for us – profit quality is improving: Q114 was the first quarter in over four years without one-off charges affecting EBIT, other than a small (non-controllable) €19m currency mismatch credit on pre-delivery payments. In other words, the reported P&L was not burdened by unexpected programme charges or large non-recurring costs such as restructuring and hence “clean” EBIT has converged with Airbus’s definition of EBIT “before one-offs”.
2014 outlook confirmed: Guidance was confirmed as stable revenues yoy based on a similar level of Airbus deliveries as in 2013 (2013: 216 aircraft), with a “moderate return on sales growth” on an EBIT before one-off basis. We factor +10bp yoy to 6.3% in our forecast.
Airbus Group NV Aerospace & Defence
44
Investment risks and concerns
• Programme delay/cost overruns (especially A350): Over the past few years, Airbus has taken charges totalling €558m against delays and higher costs on the A350-XWB development programme. The flight testing programme appears to be progressing well and management appears relatively confident about entry-into-service (EIS) risks. However, an aggressive ramp-up will follow EIS and there are two further variants still to bring to market, the A350-1000 in 2017 and the A350-800 in 2016 (but more likely in 2020). Any further cost overruns will negatively affect the shares.
• Book-to-bill ratio falls – de-rating on cycle slowdown: After eight years of very high order intake, we consider it inevitable that the pace will slow, leading to fears in the market that the cycle has peaked. The Emirates order cancellation raises further questions about the strength of the cycle and the robustness of the order book. Airbus has said the market for new aircraft remains active and management has confirmed it expects another year of orders at least equal to deliveries (ie a book-to-bill of at least 1.0x) in 2014. Anything less may further spook the market. We explore this in more detail on pages 16 and 17, and aside from modest risk in the A330 programme which has a thinning backlog, we are comfortable that Airbus’s overall production outlook is secure and that cancellation risk is limited. Nevertheless, sentiment could deteriorate if the book-to-bill ratio falls significantly, or indeed the cycle is merely perceived to be slowing, resulting in a lower rating (as it would for all commercial aerospace stocks).
• A320NEO transition: The A320NEO enters service in late 2015 which will signal the start of a rapid ramp-up in production while at the same time activity on the A320CEO (the current engine option), will begin winding down. A high level of commonality between the two aircraft (c85%) mitigates development risk but elements of new manufacturing processes, supply chain changes and the mere fact that the NEO is a less mature aircraft raises operational risks through the transition.
• Cash flow weakness: Airbus is in a heavy investment phase (R&D, capex and working capital) ahead of planned new product launches and further increases in production in prospect, as well as a build-up of A380 inventory currently affecting cash. We interpret guidance of “persisting cash pressures” as two years of almost flat FCF, translating to net cash outflows approaching €1bn pa post-dividends over the next two years. However, we are confident that Airbus will become highly cash-generative from 2016.
• Programme losses could increase or stay higher for longer (A380/A350): Airbus is continuing to reduce fixed and recurring costs on the poorly performing A380 programme and management confirmed in the Q1 results that it expects to achieve break even by the end of 2015. Since its first flight in 2006, the A380 has been a painful programme for Airbus. Missing this target will disappoint the market. Also on A350, implicit in the guidance is €1.5bn-1.9bn of losses on early-stage production after consumption of loss-making contract (LMC) provisions. The launch costs associated with new programmes are now better understood by the market and as a result, we believe the market is increasingly assessing Airbus’s underlying profitability on the basis of profits after launch costs. Unexpected cost escalation above this amount will negatively affect the shares.

Airbus Group NV Aerospace & Defence
45
• D&S restructuring execution risk: The business is undertaking a complex restructuring programme over three to four years and apart from the communication of broad mid-term margin targets, we currently have little information to assess the mid- and longer-term benefits (we discuss this in more detail on page 21). Full implementation of the programme starts in the H214. In our view, the defence and space end-markets are unlikely to materially improve soon, so slow progress on “self-help” could disappoint.
• Currency exposure: Airbus’s c$6bn pa net dollar exposure is well hedged by a €72bn hedgebook with an average rate of $1:€1.34. However, if current spot rates were to persist, and based on sensitivity if 1c equates to c€100m, we estimate €40m-100m pa of P&L headwind from 2016.
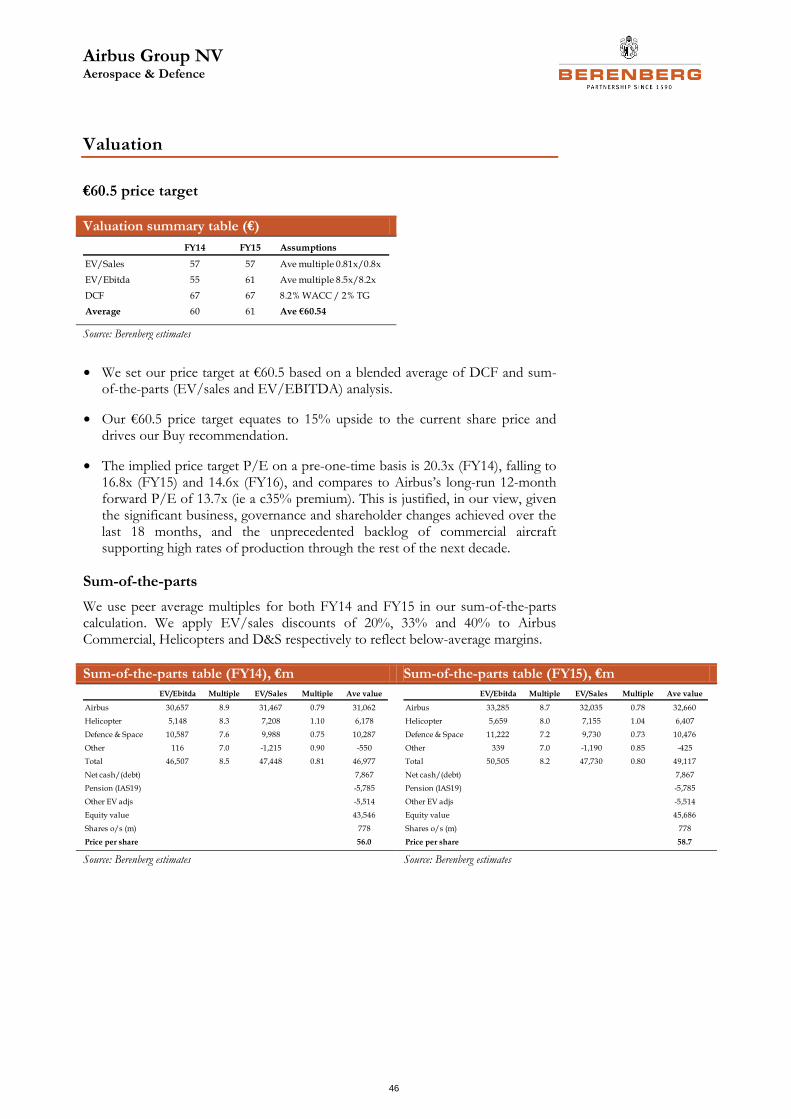
Airbus Group NV Aerospace & Defence
46
Valuation
€60.5 price target
Valuation summary table (€)
Source: Berenberg estimates
• We set our price target at €60.5 based on a blended average of DCF and sum-of-the-parts (EV/sales and EV/EBITDA) analysis.
• Our €60.5 price target equates to 15% upside to the current share price and drives our Buy recommendation.
• The implied price target P/E on a pre-one-time basis is 20.3x (FY14), falling to 16.8x (FY15) and 14.6x (FY16), and compares to Airbus’s long-run 12-month forward P/E of 13.7x (ie a c35% premium). This is justified, in our view, given the significant business, governance and shareholder changes achieved over the last 18 months, and the unprecedented backlog of commercial aircraft supporting high rates of production through the rest of the next decade.
Sum-of-the-parts
We use peer average multiples for both FY14 and FY15 in our sum-of-the-parts calculation. We apply EV/sales discounts of 20%, 33% and 40% to Airbus Commercial, Helicopters and D&S respectively to reflect below-average margins.
Sum-of-the-parts table (FY14), €m Sum-of-the-parts table (FY15), €m
Source: Berenberg estimates Source: Berenberg estimates
FY14 FY15 Assumptions
EV/Sales 57 57 Ave multiple 0.81x/0.8x
EV/Ebitda 55 61 Ave multiple 8.5x/8.2x
DCF 67 67 8.2% WACC / 2% TG
Average 60 61 Ave €60.54
EV/Ebitda Multiple EV/Sales Multiple Ave value
Airbus 30,657 8.9 31,467 0.79 31,062
Helicopter 5,148 8.3 7,208 1.10 6,178
Defence & Space 10,587 7.6 9,988 0.75 10,287
Other 116 7.0 -1,215 0.90 -550
Total 46,507 8.5 47,448 0.81 46,977
Net cash/(debt) 7,867
Pension (IAS19) -5,785
Other EV adjs -5,514
Equity value 43,546
Shares o/s (m) 778
Price per share 56.0
EV/Ebitda Multiple EV/Sales Multiple Ave value
Airbus 33,285 8.7 32,035 0.78 32,660
Helicopter 5,659 8.0 7,155 1.04 6,407
Defence & Space 11,222 7.2 9,730 0.73 10,476
Other 339 7.0 -1,190 0.85 -425
Total 50,505 8.2 47,730 0.80 49,117
Net cash/(debt) 7,867
Pension (IAS19) -5,785
Other EV adjs -5,514
Equity value 45,686
Shares o/s (m) 778
Price per share 58.7
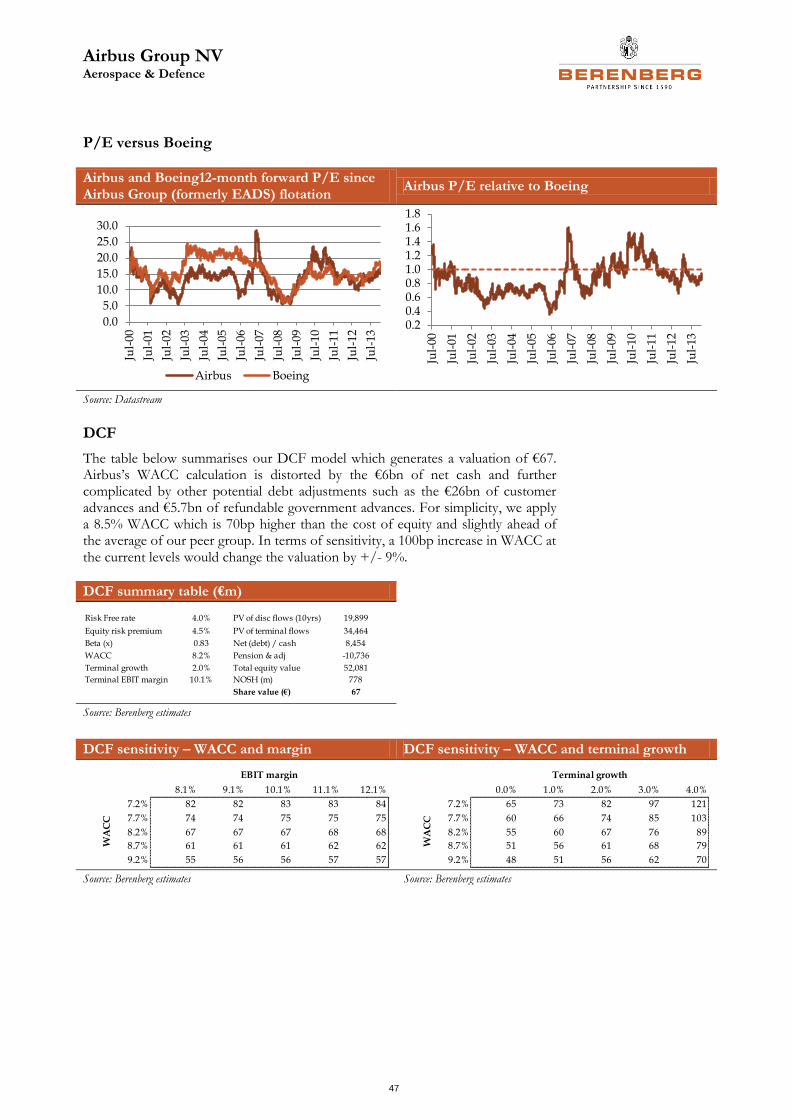
Airbus Group NV Aerospace & Defence
47
P/E versus Boeing
Airbus and Boeing12-month forward P/E since Airbus Group (formerly EADS) flotation
Airbus P/E relative to Boeing
Source: Datastream
DCF
The table below summarises our DCF model which generates a valuation of €67. Airbus’s WACC calculation is distorted by the €6bn of net cash and further complicated by other potential debt adjustments such as the €26bn of customer advances and €5.7bn of refundable government advances. For simplicity, we apply a 8.5% WACC which is 70bp higher than the cost of equity and slightly ahead of the average of our peer group. In terms of sensitivity, a 100bp increase in WACC at the current levels would change the valuation by +/- 9%.
DCF summary table (€m)
Source: Berenberg estimates
DCF sensitivity – WACC and margin DCF sensitivity – WACC and terminal growth
Source: Berenberg estimates Source: Berenberg estimates
0.0
5.0
10.0
15.0
20.0
25.0
30.0
Jul-
00
Jul-
01
Jul-
02
Jul-
03
Jul-
04
Jul-
05
Jul-
06
Jul-
07
Jul-
08
Jul-
09
Jul-
10
Jul-
11
Jul-
12
Jul-
13Airbus Boeing
0.20.40.60.81.01.21.41.61.8
Jul-
00
Jul-
01
Jul-
02
Jul-
03
Jul-
04
Jul-
05
Jul-
06
Jul-
07
Jul-
08
Jul-
09
Jul-
10
Jul-
11
Jul-
12
Jul-
13
Risk Free rate 4.0% PV of disc flows (10yrs) 19,899
Equity risk premium 4.5% PV of terminal flows 34,464
Beta (x) 0.83 Net (debt) / cash 8,454
WACC 8.2% Pension & adj -10,736
Terminal growth 2.0% Total equity value 52,081
Terminal EBIT margin 10.1% NOSH (m) 778
Share value (€) 67
67 8.1% 9.1% 10.1% 11.1% 12.1%
7.2% 82 82 83 83 84
7.7% 74 74 75 75 75
8.2% 67 67 67 68 68
8.7% 61 61 61 62 62
9.2% 55 56 56 57 57
EBIT margin
WA
CC
67 0.0% 1.0% 2.0% 3.0% 4.0%
7.2% 65 73 82 97 121
7.7% 60 66 74 85 103
8.2% 55 60 67 76 89
8.7% 51 56 61 68 79
9.2% 48 51 56 62 70
Terminal growth
WA
CC
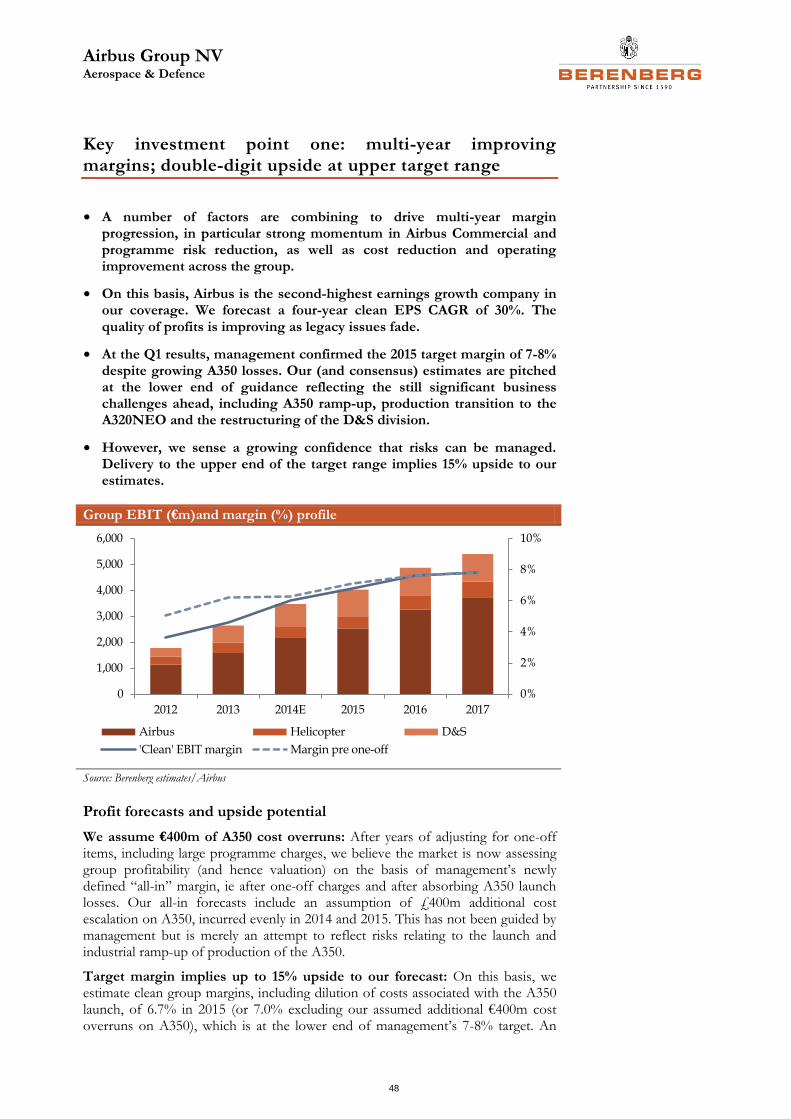
Airbus Group NV Aerospace & Defence
48
Key investment point one: multi-year improving margins; double-digit upside at upper target range
• A number of factors are combining to drive multi-year margin progression, in particular strong momentum in Airbus Commercial and programme risk reduction, as well as cost reduction and operating improvement across the group.
• On this basis, Airbus is the second-highest earnings growth company in our coverage. We forecast a four-year clean EPS CAGR of 30%. The quality of profits is improving as legacy issues fade.
• At the Q1 results, management confirmed the 2015 target margin of 7-8% despite growing A350 losses. Our (and consensus) estimates are pitched at the lower end of guidance reflecting the still significant business challenges ahead, including A350 ramp-up, production transition to the A320NEO and the restructuring of the D&S division.
• However, we sense a growing confidence that risks can be managed. Delivery to the upper end of the target range implies 15% upside to our estimates.
Group EBIT (€m)and margin (%) profile
Source: Berenberg estimates/Airbus
Profit forecasts and upside potential
We assume €400m of A350 cost overruns: After years of adjusting for one-off items, including large programme charges, we believe the market is now assessing group profitability (and hence valuation) on the basis of management’s newly defined “all-in” margin, ie after one-off charges and after absorbing A350 launch losses. Our all-in forecasts include an assumption of £400m additional cost escalation on A350, incurred evenly in 2014 and 2015. This has not been guided by management but is merely an attempt to reflect risks relating to the launch and industrial ramp-up of production of the A350.
Target margin implies up to 15% upside to our forecast: On this basis, we estimate clean group margins, including dilution of costs associated with the A350 launch, of 6.7% in 2015 (or 7.0% excluding our assumed additional €400m cost overruns on A350), which is at the lower end of management’s 7-8% target. An
0%
2%
4%
6%
8%
10%
0
1,000
2,000
3,000
4,000
5,000
6,000
2012 2013 2014E 2015 2016 2017
Airbus Helicopter D&S
'Clean' EBIT margin Margin pre one-off
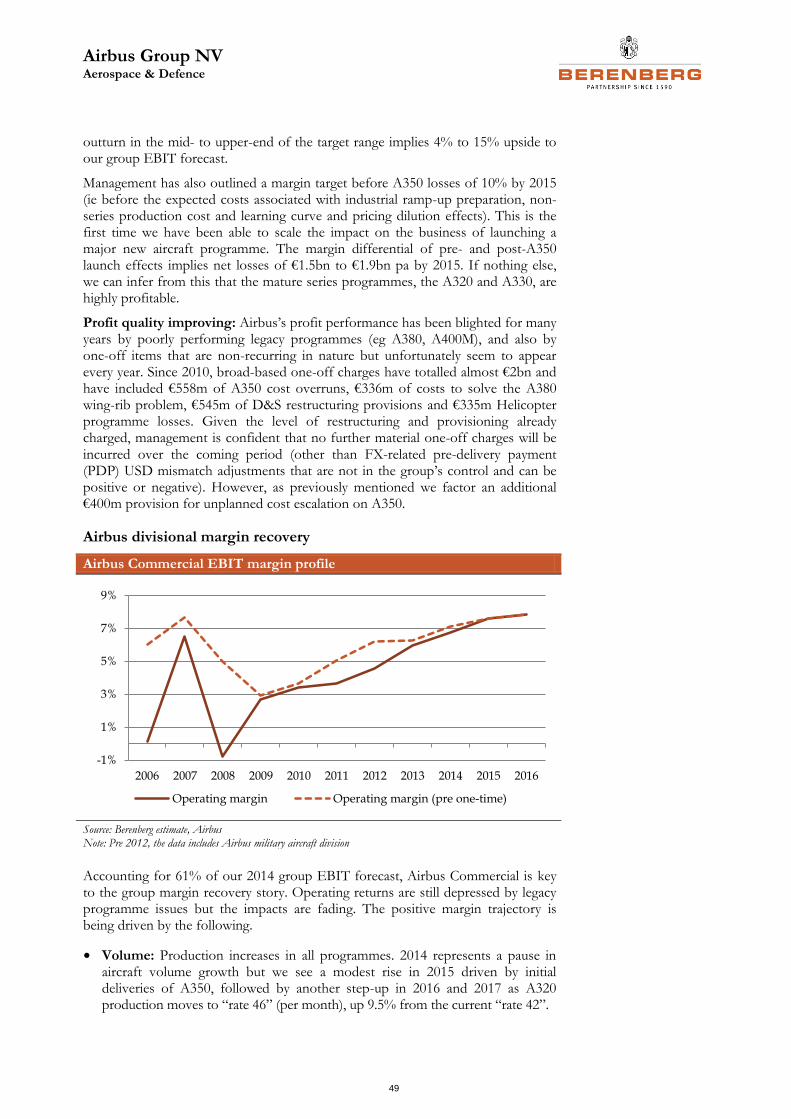
Airbus Group NV Aerospace & Defence
49
outturn in the mid- to upper-end of the target range implies 4% to 15% upside to our group EBIT forecast.
Management has also outlined a margin target before A350 losses of 10% by 2015 (ie before the expected costs associated with industrial ramp-up preparation, non-series production cost and learning curve and pricing dilution effects). This is the first time we have been able to scale the impact on the business of launching a major new aircraft programme. The margin differential of pre- and post-A350 launch effects implies net losses of €1.5bn to €1.9bn pa by 2015. If nothing else, we can infer from this that the mature series programmes, the A320 and A330, are highly profitable.
Profit quality improving: Airbus’s profit performance has been blighted for many years by poorly performing legacy programmes (eg A380, A400M), and also by one-off items that are non-recurring in nature but unfortunately seem to appear every year. Since 2010, broad-based one-off charges have totalled almost €2bn and have included €558m of A350 cost overruns, €336m of costs to solve the A380 wing-rib problem, €545m of D&S restructuring provisions and €335m Helicopter programme losses. Given the level of restructuring and provisioning already charged, management is confident that no further material one-off charges will be incurred over the coming period (other than FX-related pre-delivery payment (PDP) USD mismatch adjustments that are not in the group’s control and can be positive or negative). However, as previously mentioned we factor an additional €400m provision for unplanned cost escalation on A350.
Airbus divisional margin recovery
Airbus Commercial EBIT margin profile
Source: Berenberg estimate, Airbus Note: Pre 2012, the data includes Airbus military aircraft division
Accounting for 61% of our 2014 group EBIT forecast, Airbus Commercial is key to the group margin recovery story. Operating returns are still depressed by legacy programme issues but the impacts are fading. The positive margin trajectory is being driven by the following.
• Volume: Production increases in all programmes. 2014 represents a pause in aircraft volume growth but we see a modest rise in 2015 driven by initial deliveries of A350, followed by another step-up in 2016 and 2017 as A320 production moves to “rate 46” (per month), up 9.5% from the current “rate 42”.
-1%
1%
3%
5%
7%
9%
2006 2007 2008 2009 2010 2011 2012 2013 2014 2015 2016
Operating margin Operating margin (pre one-time)
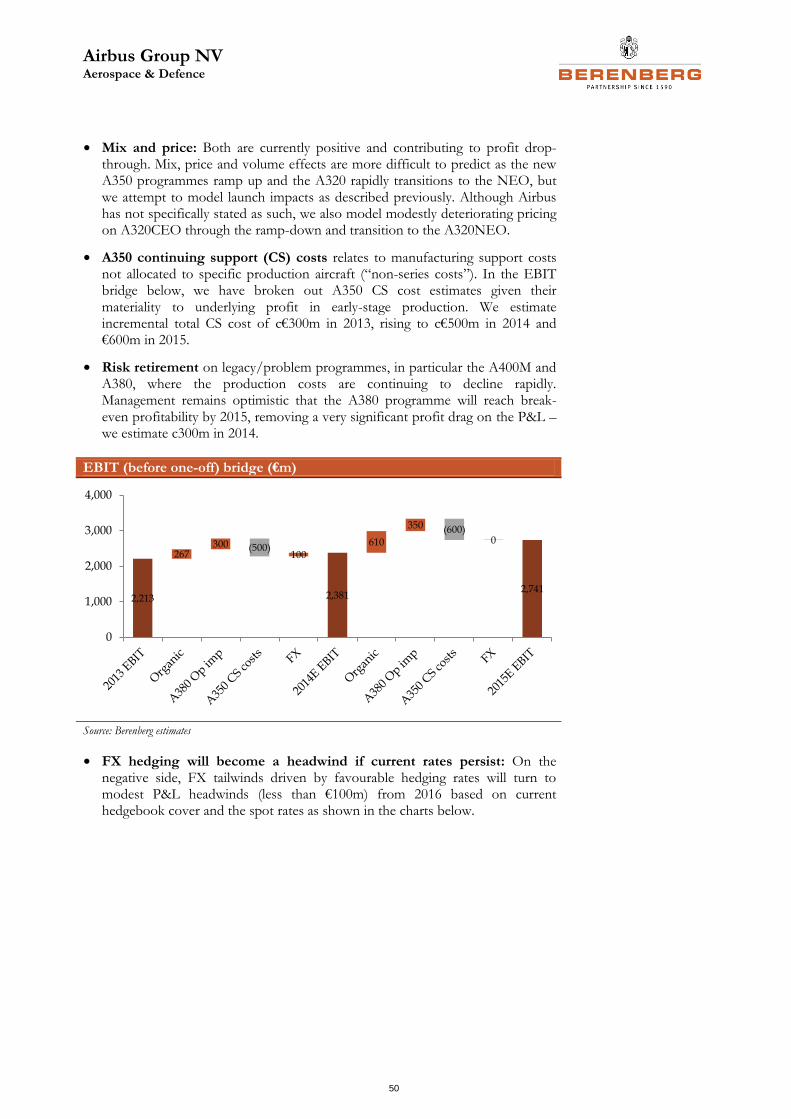
Airbus Group NV Aerospace & Defence
50
• Mix and price: Both are currently positive and contributing to profit drop-through. Mix, price and volume effects are more difficult to predict as the new A350 programmes ramp up and the A320 rapidly transitions to the NEO, but we attempt to model launch impacts as described previously. Although Airbus has not specifically stated as such, we also model modestly deteriorating pricing on A320CEO through the ramp-down and transition to the A320NEO.
• A350 continuing support (CS) costs relates to manufacturing support costs not allocated to specific production aircraft (“non-series costs”). In the EBIT bridge below, we have broken out A350 CS cost estimates given their materiality to underlying profit in early-stage production. We estimate incremental total CS cost of c€300m in 2013, rising to c€500m in 2014 and €600m in 2015.
• Risk retirement on legacy/problem programmes, in particular the A400M and A380, where the production costs are continuing to decline rapidly. Management remains optimistic that the A380 programme will reach break-even profitability by 2015, removing a very significant profit drag on the P&L – we estimate c300m in 2014.
EBIT (before one-off) bridge (€m)
Source: Berenberg estimates
• FX hedging will become a headwind if current rates persist: On the negative side, FX tailwinds driven by favourable hedging rates will turn to modest P&L headwinds (less than €100m) from 2016 based on current hedgebook cover and the spot rates as shown in the charts below.
2,213
267300 (500)
100
2,381
610
350 (600)0
2,741
0
1,000
2,000
3,000
4,000
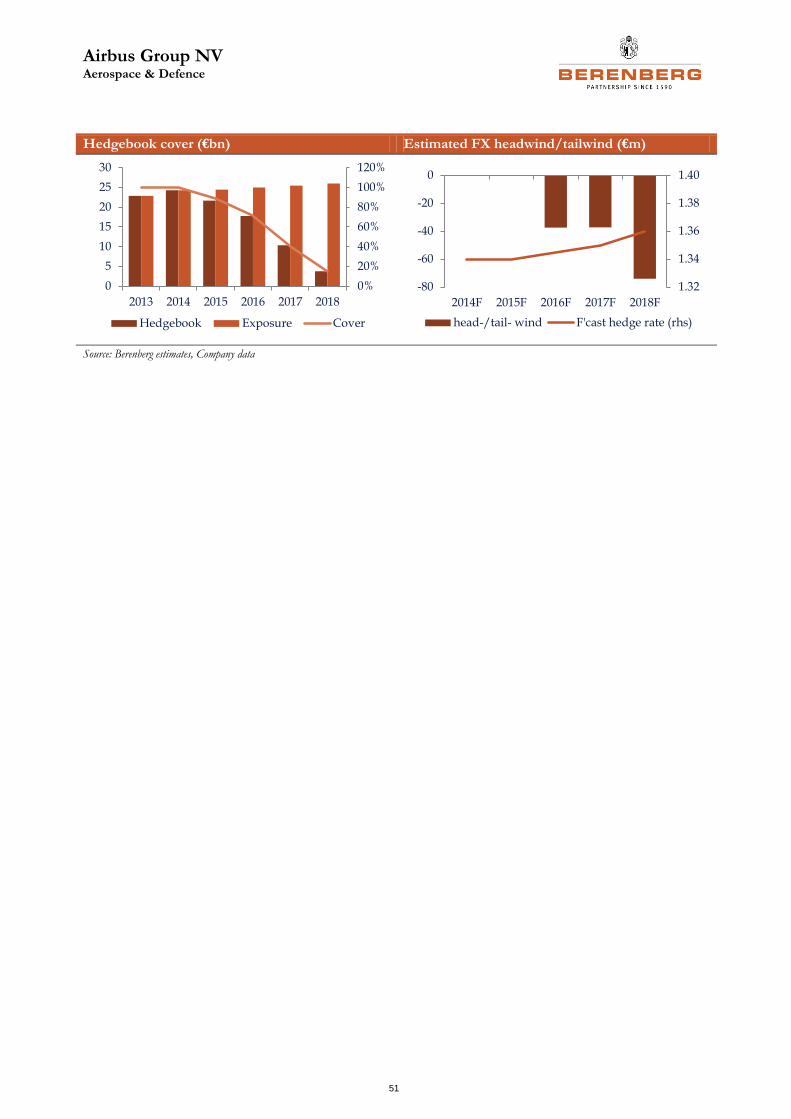
Airbus Group NV Aerospace & Defence
51
Hedgebook cover (€bn) Estimated FX headwind/tailwind (€m)
Source: Berenberg estimates, Company data
0%
20%
40%
60%
80%
100%
120%
0
5
10
15
20
25
30
2013 2014 2015 2016 2017 2018
Hedgebook Exposure Cover
1.32
1.34
1.36
1.38
1.40
-80
-60
-40
-20
0
2014F 2015F 2016F 2017F 2018F
head-/tail- wind F'cast hedge rate (rhs)
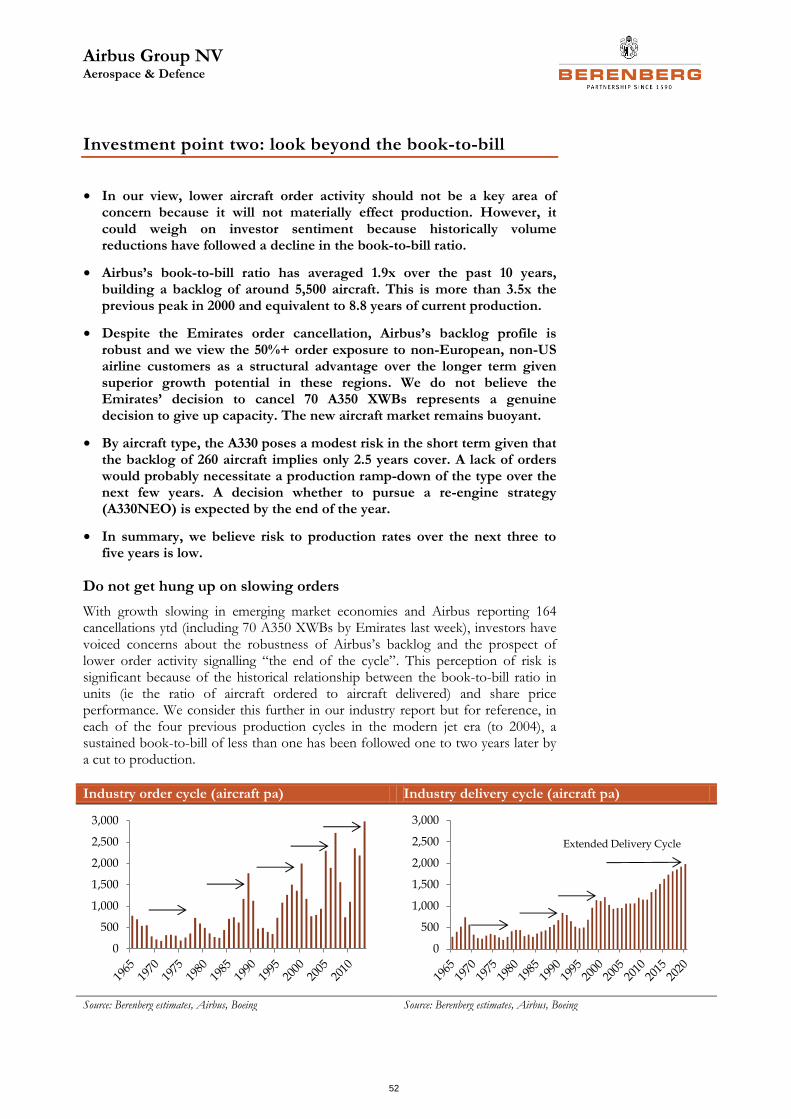
Airbus Group NV Aerospace & Defence
52
Investment point two: look beyond the book-to-bill
• In our view, lower aircraft order activity should not be a key area of concern because it will not materially effect production. However, it could weigh on investor sentiment because historically volume reductions have followed a decline in the book-to-bill ratio.
• Airbus’s book-to-bill ratio has averaged 1.9x over the past 10 years, building a backlog of around 5,500 aircraft. This is more than 3.5x the previous peak in 2000 and equivalent to 8.8 years of current production.
• Despite the Emirates order cancellation, Airbus’s backlog profile is robust and we view the 50%+ order exposure to non-European, non-US airline customers as a structural advantage over the longer term given superior growth potential in these regions. We do not believe the Emirates’ decision to cancel 70 A350 XWBs represents a genuine decision to give up capacity. The new aircraft market remains buoyant.
• By aircraft type, the A330 poses a modest risk in the short term given that the backlog of 260 aircraft implies only 2.5 years cover. A lack of orders would probably necessitate a production ramp-down of the type over the next few years. A decision whether to pursue a re-engine strategy (A330NEO) is expected by the end of the year.
• In summary, we believe risk to production rates over the next three to five years is low.
Do not get hung up on slowing orders
With growth slowing in emerging market economies and Airbus reporting 164 cancellations ytd (including 70 A350 XWBs by Emirates last week), investors have voiced concerns about the robustness of Airbus’s backlog and the prospect of lower order activity signalling “the end of the cycle”. This perception of risk is significant because of the historical relationship between the book-to-bill ratio in units (ie the ratio of aircraft ordered to aircraft delivered) and share price performance. We consider this further in our industry report but for reference, in each of the four previous production cycles in the modern jet era (to 2004), a sustained book-to-bill of less than one has been followed one to two years later by a cut to production.
Industry order cycle (aircraft pa) Industry delivery cycle (aircraft pa)
Source: Berenberg estimates, Airbus, Boeing Source: Berenberg estimates, Airbus, Boeing
0
500
1,000
1,500
2,000
2,500
3,000
0
500
1,000
1,500
2,000
2,500
3,000
Extended Delivery Cycle
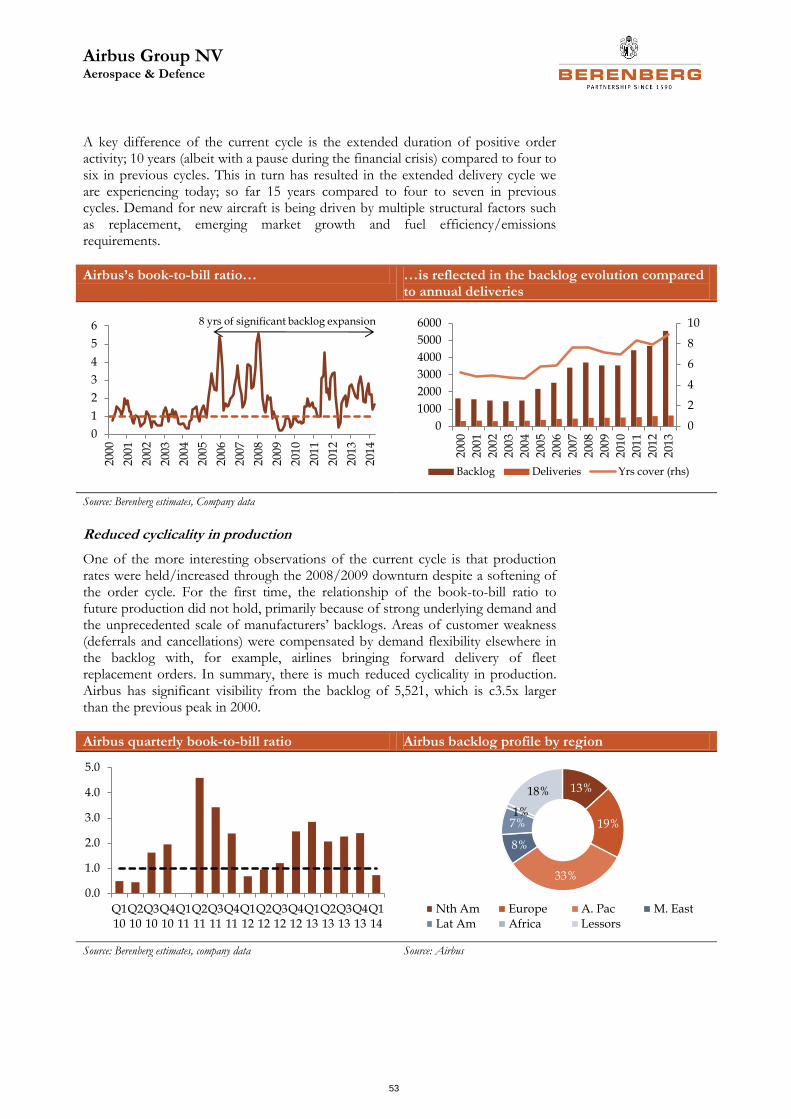
Airbus Group NV Aerospace & Defence
53
A key difference of the current cycle is the extended duration of positive order activity; 10 years (albeit with a pause during the financial crisis) compared to four to six in previous cycles. This in turn has resulted in the extended delivery cycle we are experiencing today; so far 15 years compared to four to seven in previous cycles. Demand for new aircraft is being driven by multiple structural factors such as replacement, emerging market growth and fuel efficiency/emissions requirements.
Airbus’s book-to-bill ratio… …is reflected in the backlog evolution compared to annual deliveries
Source: Berenberg estimates, Company data
Reduced cyclicality in production
One of the more interesting observations of the current cycle is that production rates were held/increased through the 2008/2009 downturn despite a softening of the order cycle. For the first time, the relationship of the book-to-bill ratio to future production did not hold, primarily because of strong underlying demand and the unprecedented scale of manufacturers’ backlogs. Areas of customer weakness (deferrals and cancellations) were compensated by demand flexibility elsewhere in the backlog with, for example, airlines bringing forward delivery of fleet replacement orders. In summary, there is much reduced cyclicality in production. Airbus has significant visibility from the backlog of 5,521, which is c3.5x larger than the previous peak in 2000.
Airbus quarterly book-to-bill ratio Airbus backlog profile by region
Source: Berenberg estimates, company data Source: Airbus
0
1
2
3
4
5
6
200
0
200
1
200
2
200
3
200
4
200
5
200
6
200
7
200
8
200
9
201
0
201
1
201
2
201
3
201
4
8 yrs of significant backlog expansion
0
2
4
6
8
10
0
1000
2000
3000
4000
5000
6000
200
0
200
1
200
2
200
3
200
4
200
5
200
6
200
7
200
8
200
9
201
0
201
1
201
2
201
3
Backlog Deliveries Yrs cover (rhs)
0.0
1.0
2.0
3.0
4.0
5.0
Q110
Q210
Q310
Q410
Q111
Q211
Q311
Q411
Q112
Q212
Q312
Q412
Q113
Q213
Q313
Q413
Q114
13%
19%
33%
8%
7%1%
18%
Nth Am Europe A. Pac M. EastLat Am Africa Lessors
Airbus Group NV Aerospace & Defence
54
Emirates A350 XWB cancellation – a setback, but we do not believe it indicates an inflection point in the cycle
Emirates is a major global airline and hence its decision to cancel such a large order with Airbus (c2.5% of the division backlog) is a major setback. In terms of the cycle, we do not believe this represents a decision by Emirates to give up capacity based on, for example, a less favourable view of the long-term demand environment. Hence, we do not subscribe to the view the cancellation marks a cycle turning point and view this as a far more complex Emirates-specific fleet decision, the outcome of which will become apparent some unspecified time in the future. Airbus has since reported that the new aircraft market remains buoyant and confirmed its expectation for new orders in 2014 to exceed deliveries (ie another year of backlog growth).
The A330 is at modest risk of a production cut
A330 order activity has slowed over the last 18 months and with annual production at just over 100 aircraft, the backlog reduced to 260 aircraft at the end of Q1. Without new orders we suggest a rate cut will occur probably within the next year. The A330 is a mature and therefore profitable programme, we estimate contributing around €11.5bn of revenue (c19% of group). In our forecasts, we assume a slow fade in A330 production from 2015.
Airbus is considering whether to pursue a re-engine strategy as a potential strategy to extend the life of the A330 platform. A decision will ultimately hinge on the availability of engine options, but if pursued, it will trigger an increase in R&D, albeit much less than for development of an all-new aircraft, we suggest c20% less or around c€2bn total investment. Management has said it expects to reach a decision on A330NEO by the end of 2014.
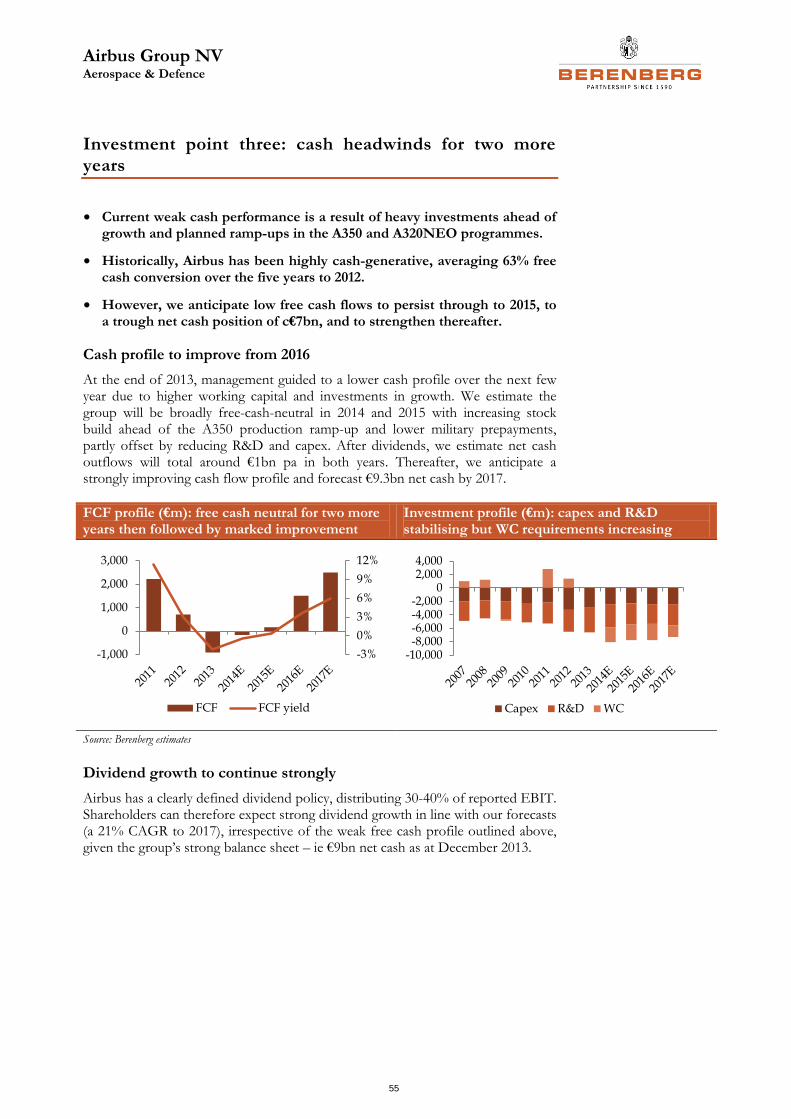
Airbus Group NV Aerospace & Defence
55
Investment point three: cash headwinds for two more years
• Current weak cash performance is a result of heavy investments ahead of growth and planned ramp-ups in the A350 and A320NEO programmes.
• Historically, Airbus has been highly cash-generative, averaging 63% free cash conversion over the five years to 2012.
• However, we anticipate low free cash flows to persist through to 2015, to a trough net cash position of c€7bn, and to strengthen thereafter.
Cash profile to improve from 2016
At the end of 2013, management guided to a lower cash profile over the next few year due to higher working capital and investments in growth. We estimate the group will be broadly free-cash-neutral in 2014 and 2015 with increasing stock build ahead of the A350 production ramp-up and lower military prepayments, partly offset by reducing R&D and capex. After dividends, we estimate net cash outflows will total around €1bn pa in both years. Thereafter, we anticipate a strongly improving cash flow profile and forecast €9.3bn net cash by 2017.
FCF profile (€m): free cash neutral for two more years then followed by marked improvement
Investment profile (€m): capex and R&D stabilising but WC requirements increasing
Source: Berenberg estimates
Dividend growth to continue strongly
Airbus has a clearly defined dividend policy, distributing 30-40% of reported EBIT. Shareholders can therefore expect strong dividend growth in line with our forecasts (a 21% CAGR to 2017), irrespective of the weak free cash profile outlined above, given the group’s strong balance sheet – ie €9bn net cash as at December 2013.
-3%
0%
3%
6%
9%
12%
-1,000
0
1,000
2,000
3,000
FCF FCF yield
-10,000-8,000-6,000-4,000-2,000
02,0004,000
Capex R&D WC
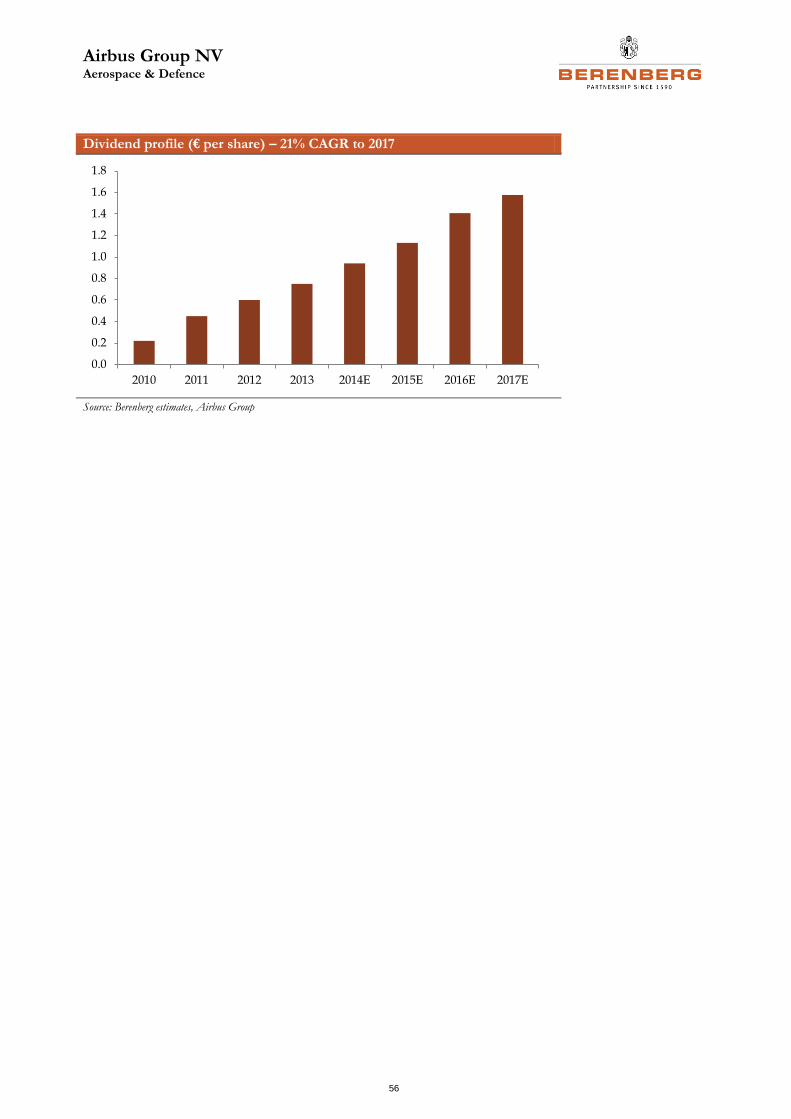
Airbus Group NV Aerospace & Defence
56
Dividend profile (€ per share) – 21% CAGR to 2017
Source: Berenberg estimates, Airbus Group
0.0
0.2
0.4
0.6
0.8
1.0
1.2
1.4
1.6
1.8
2010 2011 2012 2013 2014E 2015E 2016E 2017E
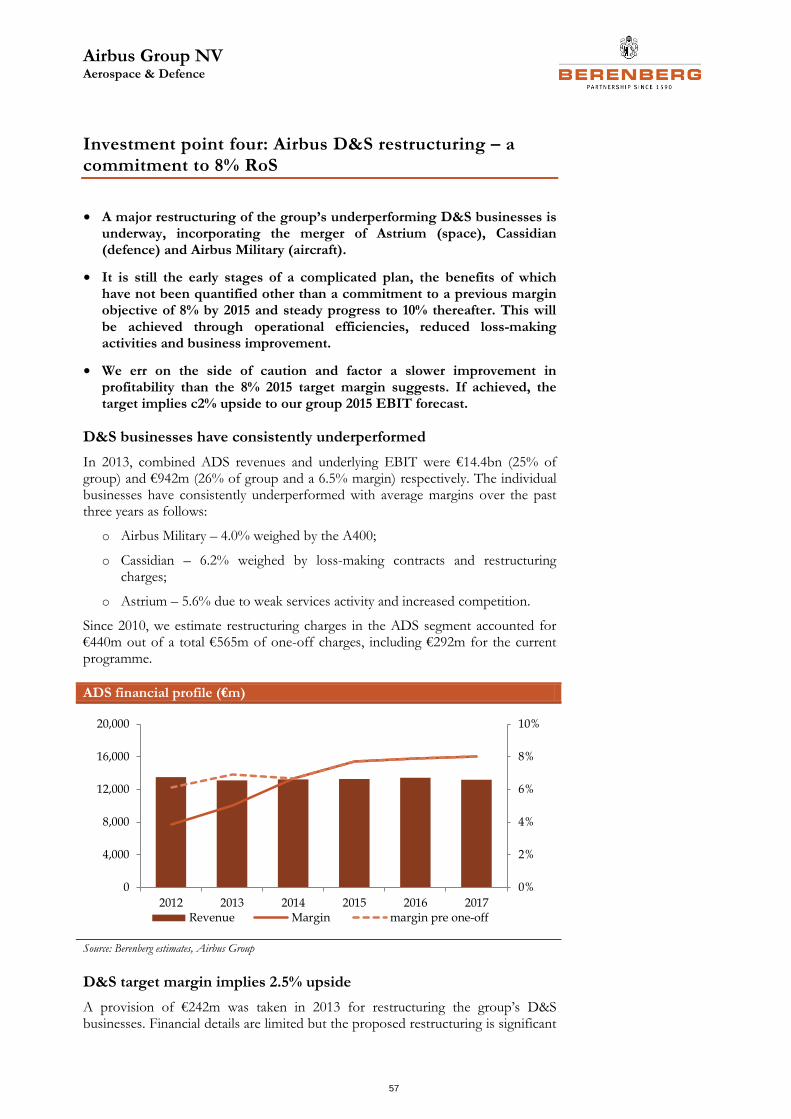
Airbus Group NV Aerospace & Defence
57
Investment point four: Airbus D&S restructuring – a commitment to 8% RoS
• A major restructuring of the group’s underperforming D&S businesses is underway, incorporating the merger of Astrium (space), Cassidian (defence) and Airbus Military (aircraft).
• It is still the early stages of a complicated plan, the benefits of which have not been quantified other than a commitment to a previous margin objective of 8% by 2015 and steady progress to 10% thereafter. This will be achieved through operational efficiencies, reduced loss-making activities and business improvement.
• We err on the side of caution and factor a slower improvement in profitability than the 8% 2015 target margin suggests. If achieved, the target implies c2% upside to our group 2015 EBIT forecast.
D&S businesses have consistently underperformed
In 2013, combined ADS revenues and underlying EBIT were €14.4bn (25% of group) and €942m (26% of group and a 6.5% margin) respectively. The individual businesses have consistently underperformed with average margins over the past three years as follows:
o Airbus Military – 4.0% weighed by the A400;
o Cassidian – 6.2% weighed by loss-making contracts and restructuring charges;
o Astrium – 5.6% due to weak services activity and increased competition.
Since 2010, we estimate restructuring charges in the ADS segment accounted for €440m out of a total €565m of one-off charges, including €292m for the current programme.
ADS financial profile (€m)
Source: Berenberg estimates, Airbus Group
D&S target margin implies 2.5% upside
A provision of €242m was taken in 2013 for restructuring the group’s D&S businesses. Financial details are limited but the proposed restructuring is significant
0%
2%
4%
6%
8%
10%
0
4,000
8,000
12,000
16,000
20,000
2012 2013 2014 2015 2016 2017Revenue Margin margin pre one-off
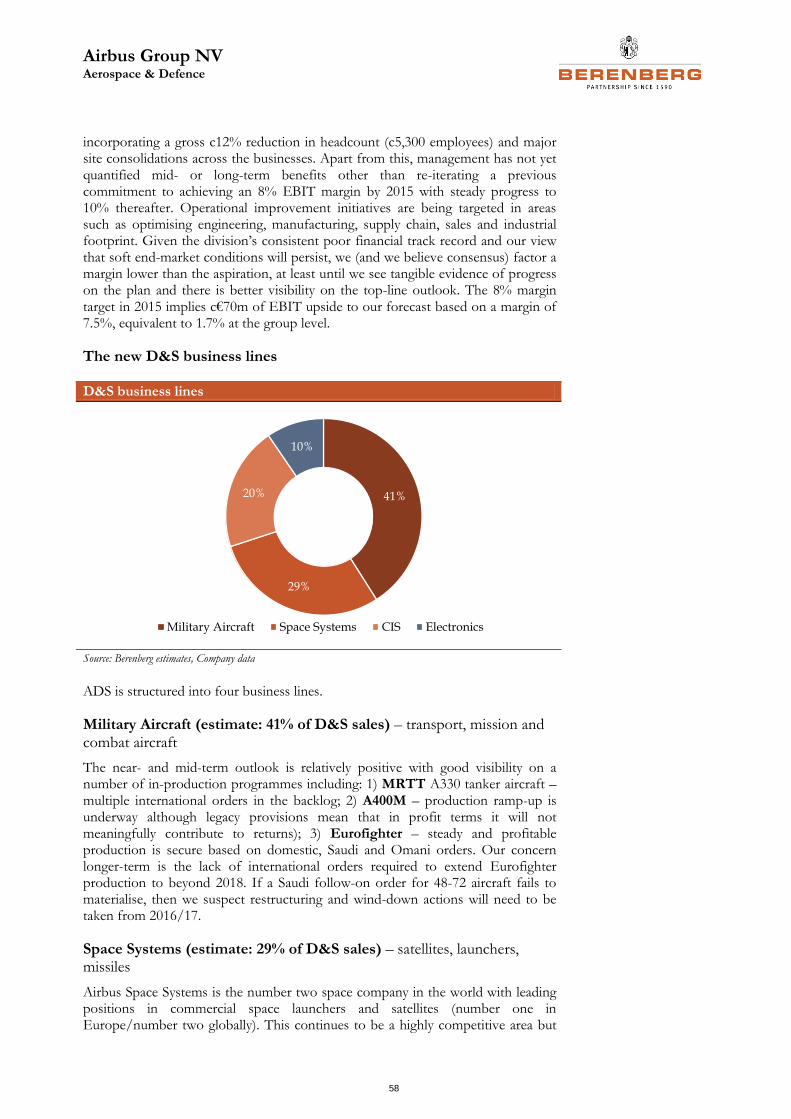
Airbus Group NV Aerospace & Defence
58
incorporating a gross c12% reduction in headcount (c5,300 employees) and major site consolidations across the businesses. Apart from this, management has not yet quantified mid- or long-term benefits other than re-iterating a previous commitment to achieving an 8% EBIT margin by 2015 with steady progress to 10% thereafter. Operational improvement initiatives are being targeted in areas such as optimising engineering, manufacturing, supply chain, sales and industrial footprint. Given the division’s consistent poor financial track record and our view that soft end-market conditions will persist, we (and we believe consensus) factor a margin lower than the aspiration, at least until we see tangible evidence of progress on the plan and there is better visibility on the top-line outlook. The 8% margin target in 2015 implies c€70m of EBIT upside to our forecast based on a margin of 7.5%, equivalent to 1.7% at the group level.
The new D&S business lines
D&S business lines
Source: Berenberg estimates, Company data
ADS is structured into four business lines.
Military Aircraft (estimate: 41% of D&S sales) – transport, mission and combat aircraft
The near- and mid-term outlook is relatively positive with good visibility on a number of in-production programmes including: 1) MRTT A330 tanker aircraft – multiple international orders in the backlog; 2) A400M – production ramp-up is underway although legacy provisions mean that in profit terms it will not meaningfully contribute to returns); 3) Eurofighter – steady and profitable production is secure based on domestic, Saudi and Omani orders. Our concern longer-term is the lack of international orders required to extend Eurofighter production to beyond 2018. If a Saudi follow-on order for 48-72 aircraft fails to materialise, then we suspect restructuring and wind-down actions will need to be taken from 2016/17.
Space Systems (estimate: 29% of D&S sales) – satellites, launchers, missiles
Airbus Space Systems is the number two space company in the world with leading positions in commercial space launchers and satellites (number one in Europe/number two globally). This continues to be a highly competitive area but
41%
29%
20%
10%
Military Aircraft Space Systems CIS Electronics
Airbus Group NV Aerospace & Defence
59
integration of the launch and satellite activities is expected to achieve improved efficiencies and cost reduction. A pick-up in orders in 2013 gives some comfort about the nearer-term outlook.
Communications, Intelligence & Security (CIS) (estimate: 20% of D&S sales)
Airbus has a strong position in satellite communications, borders security systems and public mobile radios. The objective of the restructuring is to combine communication and services activities to offer higher value-add solutions including long-term service contracts. Frankly, we have little feel for the prospects and longer-term outlook for these business, although we note loss-making security contracts that have adversely affected financial performance should wind down over the next 12-18 months, removing a drag on profits. Management has hinted that business disposals are possible in CIS as part of “portfolio optimisation”.
Electronic (estimate: 10% of D&S sales)
This includes C4 defence (command, control, communications and computers) with defence electronics capabilities that are described by management as “enablers” to the other sub-sectors.
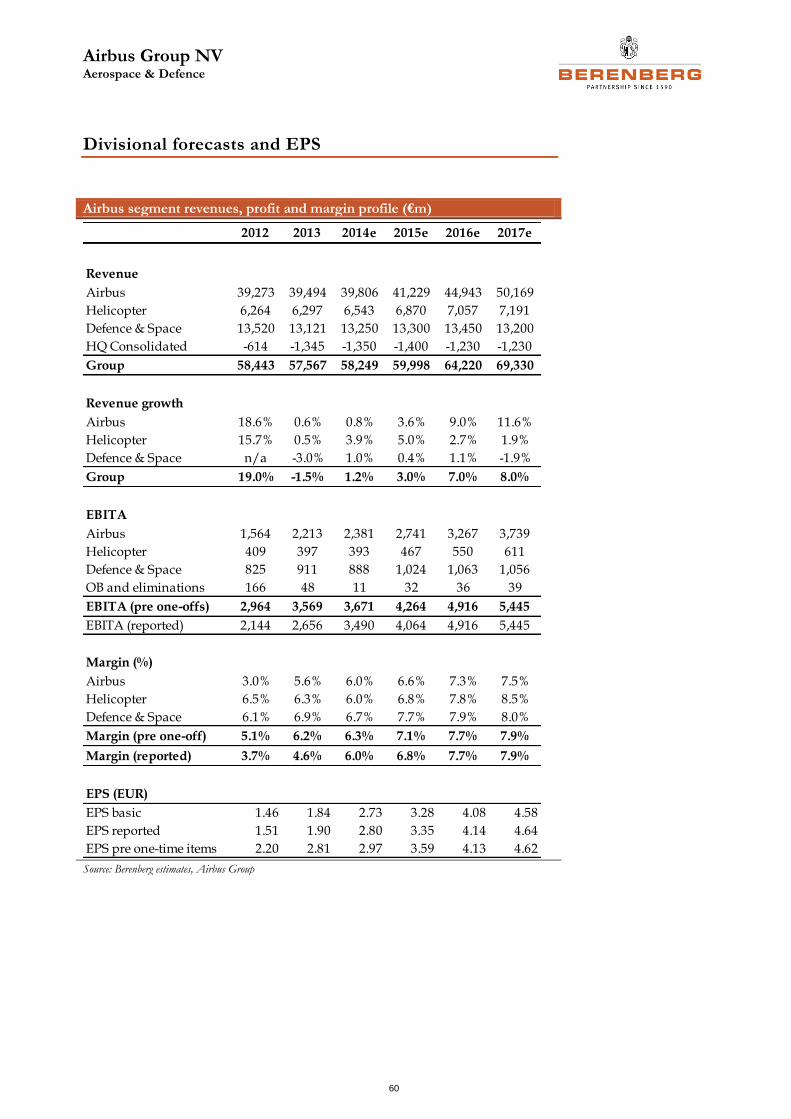
Airbus Group NV Aerospace & Defence
60
Divisional forecasts and EPS
Airbus segment revenues, profit and margin profile (€m)
Source: Berenberg estimates, Airbus Group
2012 2013 2014e 2015e 2016e 2017e
Revenue
Airbus 39,273 39,494 39,806 41,229 44,943 50,169
Helicopter 6,264 6,297 6,543 6,870 7,057 7,191
Defence & Space 13,520 13,121 13,250 13,300 13,450 13,200
HQ Consolidated -614 -1,345 -1,350 -1,400 -1,230 -1,230
Group 58,443 57,567 58,249 59,998 64,220 69,330
Revenue growth
Airbus 18.6% 0.6% 0.8% 3.6% 9.0% 11.6%
Helicopter 15.7% 0.5% 3.9% 5.0% 2.7% 1.9%
Defence & Space n/a -3.0% 1.0% 0.4% 1.1% -1.9%
Group 19.0% -1.5% 1.2% 3.0% 7.0% 8.0%
EBITA
Airbus 1,564 2,213 2,381 2,741 3,267 3,739
Helicopter 409 397 393 467 550 611
Defence & Space 825 911 888 1,024 1,063 1,056
OB and eliminations 166 48 11 32 36 39
EBITA (pre one-offs) 2,964 3,569 3,671 4,264 4,916 5,445
EBITA (reported) 2,144 2,656 3,490 4,064 4,916 5,445
Margin (%)
Airbus 3.0% 5.6% 6.0% 6.6% 7.3% 7.5%
Helicopter 6.5% 6.3% 6.0% 6.8% 7.8% 8.5%
Defence & Space 6.1% 6.9% 6.7% 7.7% 7.9% 8.0%
Margin (pre one-off) 5.1% 6.2% 6.3% 7.1% 7.7% 7.9%
Margin (reported) 3.7% 4.6% 6.0% 6.8% 7.7% 7.9%
EPS (EUR)
EPS basic 1.46 1.84 2.73 3.28 4.08 4.58
EPS reported 1.51 1.90 2.80 3.35 4.14 4.64
EPS pre one-time items 2.20 2.81 2.97 3.59 4.13 4.62
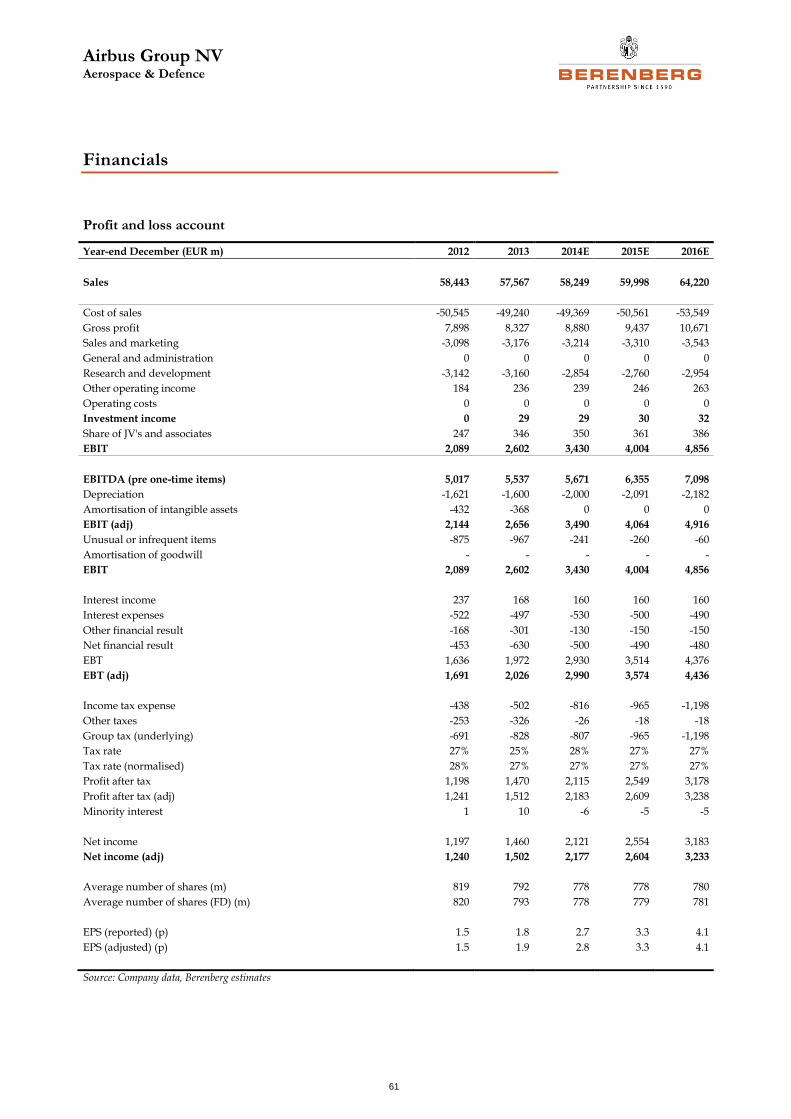
Airbus Group NV Aerospace & Defence
61
Financials
Profit and loss account
Year-end December (EUR m) 2012 2013 2014E 2015E 2016E
Sales 58,443 57,567 58,249 59,998 64,220
Cost of sales -50,545 -49,240 -49,369 -50,561 -53,549
Gross profit 7,898 8,327 8,880 9,437 10,671
Sales and marketing -3,098 -3,176 -3,214 -3,310 -3,543
General and administration 0 0 0 0 0
Research and development -3,142 -3,160 -2,854 -2,760 -2,954
Other operating income 184 236 239 246 263
Operating costs 0 0 0 0 0
Investment income 0 29 29 30 32
Share of JV's and associates 247 346 350 361 386
EBIT 2,089 2,602 3,430 4,004 4,856
EBITDA (pre one-time items) 5,017 5,537 5,671 6,355 7,098
Depreciation -1,621 -1,600 -2,000 -2,091 -2,182
Amortisation of intangible assets -432 -368 0 0 0
EBIT (adj) 2,144 2,656 3,490 4,064 4,916
Unusual or infrequent items -875 -967 -241 -260 -60
Amortisation of goodwill - - - - -
EBIT 2,089 2,602 3,430 4,004 4,856
Interest income 237 168 160 160 160
Interest expenses -522 -497 -530 -500 -490
Other financial result -168 -301 -130 -150 -150
Net financial result -453 -630 -500 -490 -480
EBT 1,636 1,972 2,930 3,514 4,376
EBT (adj) 1,691 2,026 2,990 3,574 4,436
Income tax expense -438 -502 -816 -965 -1,198
Other taxes -253 -326 -26 -18 -18
Group tax (underlying) -691 -828 -807 -965 -1,198
Tax rate 27% 25% 28% 27% 27%
Tax rate (normalised) 28% 27% 27% 27% 27%
Profit after tax 1,198 1,470 2,115 2,549 3,178
Profit after tax (adj) 1,241 1,512 2,183 2,609 3,238
Minority interest 1 10 -6 -5 -5
Net income 1,197 1,460 2,121 2,554 3,183
Net income (adj) 1,240 1,502 2,177 2,604 3,233
Average number of shares (m) 819 792 778 778 780
Average number of shares (FD) (m) 820 793 778 779 781
EPS (reported) (p) 1.5 1.8 2.7 3.3 4.1
EPS (adjusted) (p) 1.5 1.9 2.8 3.3 4.1
Source: Company data, Berenberg estimates
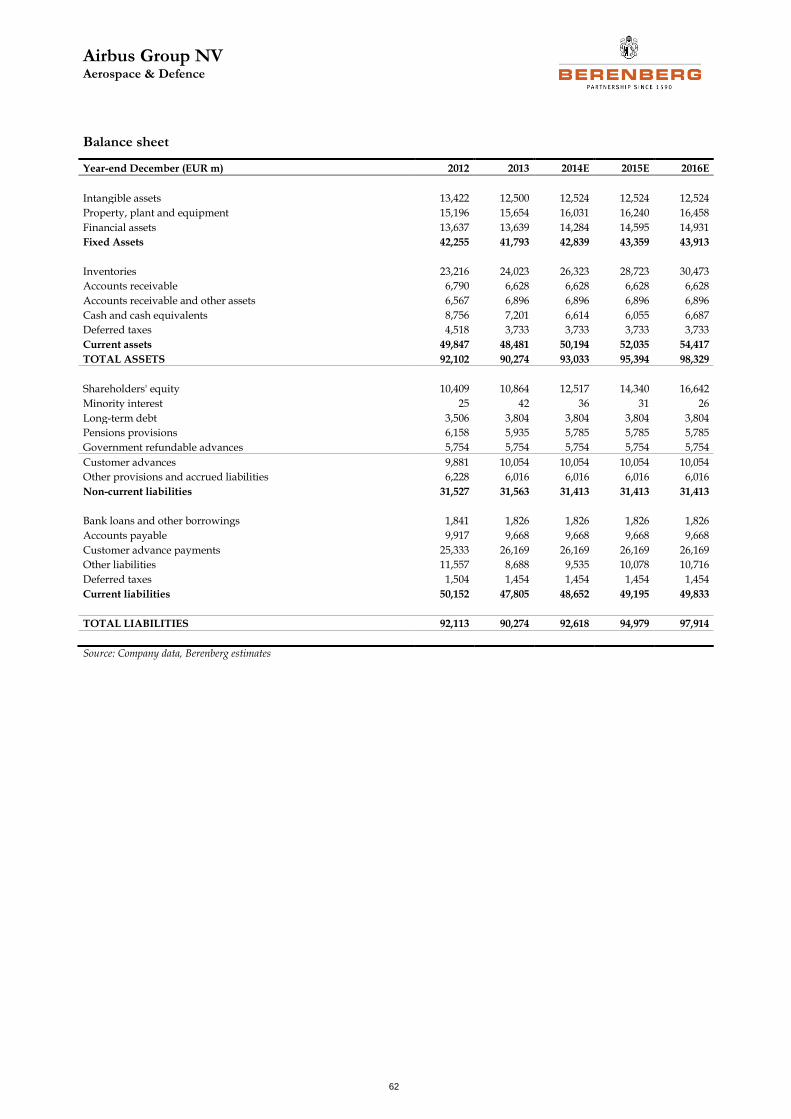
Airbus Group NV Aerospace & Defence
62
Balance sheet
Year-end December (EUR m) 2012 2013 2014E 2015E 2016E
Intangible assets 13,422 12,500 12,524 12,524 12,524
Property, plant and equipment 15,196 15,654 16,031 16,240 16,458
Financial assets 13,637 13,639 14,284 14,595 14,931
Fixed Assets 42,255 41,793 42,839 43,359 43,913
Inventories 23,216 24,023 26,323 28,723 30,473
Accounts receivable 6,790 6,628 6,628 6,628 6,628
Accounts receivable and other assets 6,567 6,896 6,896 6,896 6,896
Cash and cash equivalents 8,756 7,201 6,614 6,055 6,687
Deferred taxes 4,518 3,733 3,733 3,733 3,733
Current assets 49,847 48,481 50,194 52,035 54,417
TOTAL ASSETS 92,102 90,274 93,033 95,394 98,329
Shareholders' equity 10,409 10,864 12,517 14,340 16,642
Minority interest 25 42 36 31 26
Long-term debt 3,506 3,804 3,804 3,804 3,804
Pensions provisions 6,158 5,935 5,785 5,785 5,785
Government refundable advances 5,754 5,754 5,754 5,754 5,754
Customer advances 9,881 10,054 10,054 10,054 10,054
Other provisions and accrued liabilities 6,228 6,016 6,016 6,016 6,016
Non-current liabilities 31,527 31,563 31,413 31,413 31,413
Bank loans and other borrowings 1,841 1,826 1,826 1,826 1,826
Accounts payable 9,917 9,668 9,668 9,668 9,668
Customer advance payments 25,333 26,169 26,169 26,169 26,169
Other liabilities 11,557 8,688 9,535 10,078 10,716
Deferred taxes 1,504 1,454 1,454 1,454 1,454
Current liabilities 50,152 47,805 48,652 49,195 49,833
TOTAL LIABILITIES 92,113 90,274 92,618 94,979 97,914
Source: Company data, Berenberg estimates
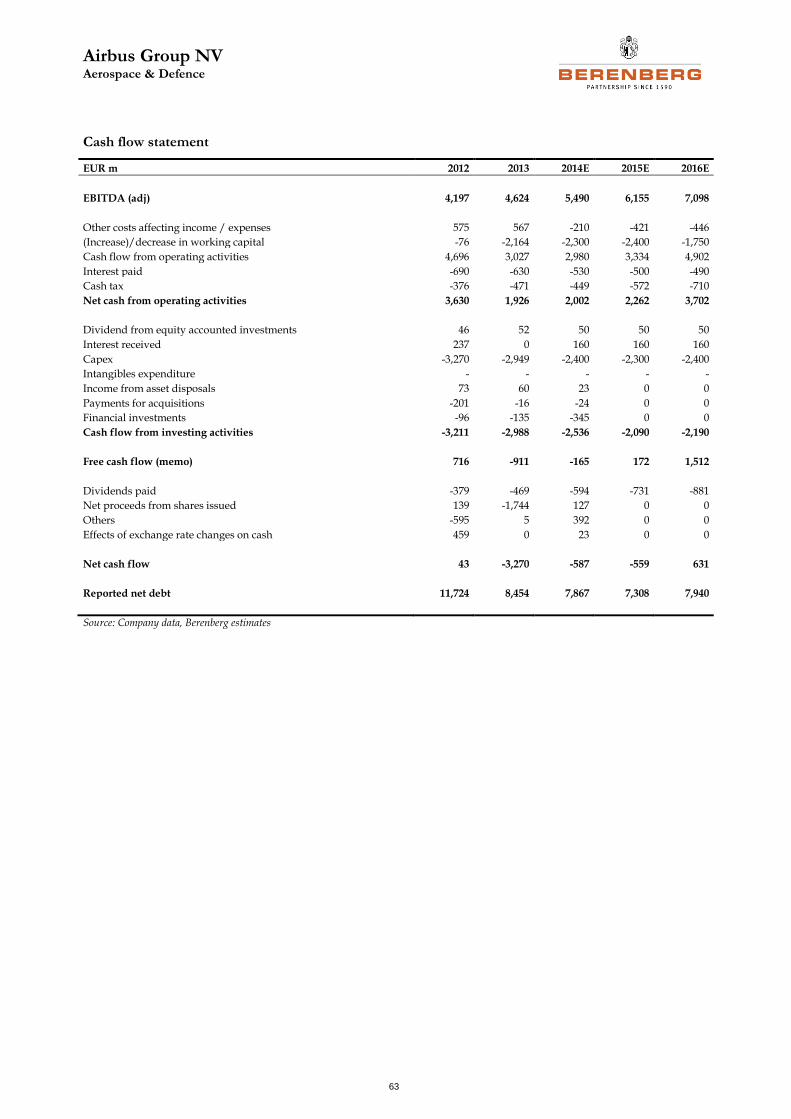
Airbus Group NV Aerospace & Defence
63
Cash flow statement
EUR m 2012 2013 2014E 2015E 2016E
EBITDA (adj) 4,197 4,624 5,490 6,155 7,098
Other costs affecting income / expenses 575 567 -210 -421 -446
(Increase)/decrease in working capital -76 -2,164 -2,300 -2,400 -1,750
Cash flow from operating activities 4,696 3,027 2,980 3,334 4,902
Interest paid -690 -630 -530 -500 -490
Cash tax -376 -471 -449 -572 -710
Net cash from operating activities 3,630 1,926 2,002 2,262 3,702
Dividend from equity accounted investments 46 52 50 50 50
Interest received 237 0 160 160 160
Capex -3,270 -2,949 -2,400 -2,300 -2,400
Intangibles expenditure - - - - -
Income from asset disposals 73 60 23 0 0
Payments for acquisitions -201 -16 -24 0 0
Financial investments -96 -135 -345 0 0
Cash flow from investing activities -3,211 -2,988 -2,536 -2,090 -2,190
Free cash flow (memo) 716 -911 -165 172 1,512
Dividends paid -379 -469 -594 -731 -881
Net proceeds from shares issued 139 -1,744 127 0 0
Others -595 5 392 0 0
Effects of exchange rate changes on cash 459 0 23 0 0
Net cash flow 43 -3,270 -587 -559 631
Reported net debt 11,724 8,454 7,867 7,308 7,940
Source: Company data, Berenberg estimates
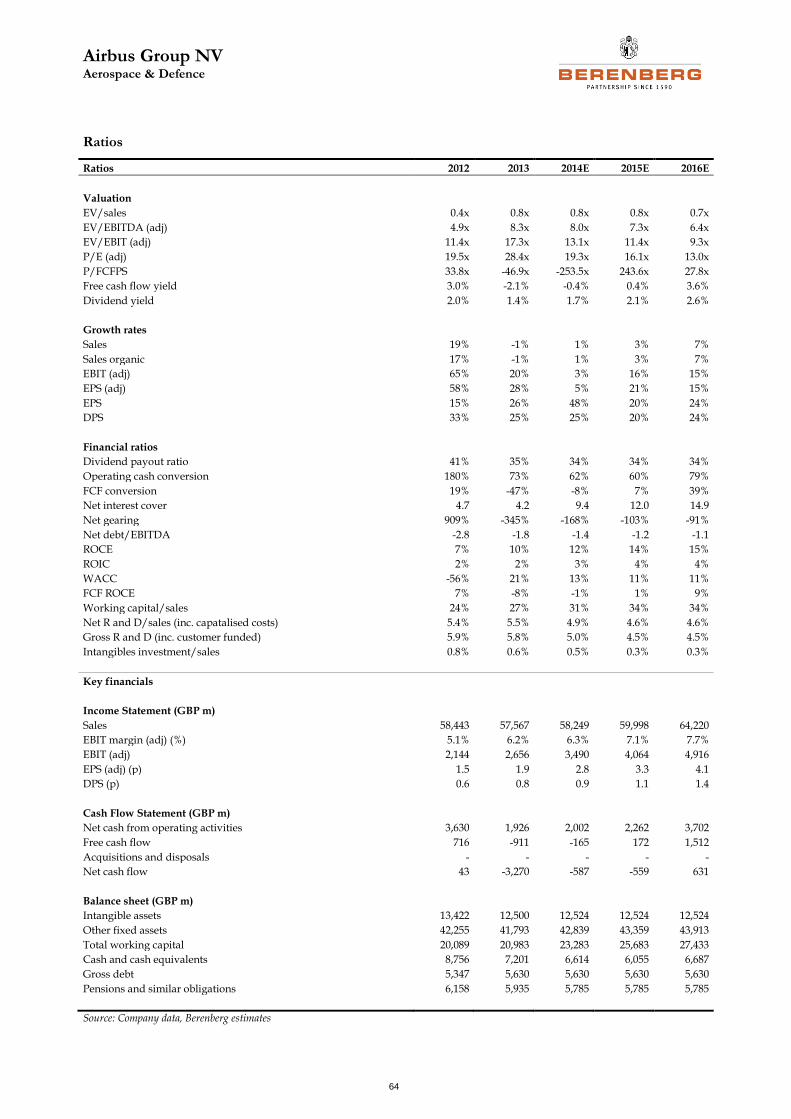
Airbus Group NV Aerospace & Defence
64
Ratios
Ratios 2012 2013 2014E 2015E 2016E
Valuation
EV/sales 0.4x 0.8x 0.8x 0.8x 0.7x
EV/EBITDA (adj) 4.9x 8.3x 8.0x 7.3x 6.4x
EV/EBIT (adj) 11.4x 17.3x 13.1x 11.4x 9.3x
P/E (adj) 19.5x 28.4x 19.3x 16.1x 13.0x
P/FCFPS 33.8x -46.9x -253.5x 243.6x 27.8x
Free cash flow yield 3.0% -2.1% -0.4% 0.4% 3.6%
Dividend yield 2.0% 1.4% 1.7% 2.1% 2.6%
Growth rates
Sales 19% -1% 1% 3% 7%
Sales organic 17% -1% 1% 3% 7%
EBIT (adj) 65% 20% 3% 16% 15%
EPS (adj) 58% 28% 5% 21% 15%
EPS 15% 26% 48% 20% 24%
DPS 33% 25% 25% 20% 24%
Financial ratios
Dividend payout ratio 41% 35% 34% 34% 34%
Operating cash conversion 180% 73% 62% 60% 79%
FCF conversion 19% -47% -8% 7% 39%
Net interest cover 4.7 4.2 9.4 12.0 14.9
Net gearing 909% -345% -168% -103% -91%
Net debt/EBITDA -2.8 -1.8 -1.4 -1.2 -1.1
ROCE 7% 10% 12% 14% 15%
ROIC 2% 2% 3% 4% 4%
WACC -56% 21% 13% 11% 11%
FCF ROCE 7% -8% -1% 1% 9%
Working capital/sales 24% 27% 31% 34% 34%
Net R and D/sales (inc. capatalised costs) 5.4% 5.5% 4.9% 4.6% 4.6%
Gross R and D (inc. customer funded) 5.9% 5.8% 5.0% 4.5% 4.5%
Intangibles investment/sales 0.8% 0.6% 0.5% 0.3% 0.3%
Key financials
Income Statement (GBP m)
Sales 58,443 57,567 58,249 59,998 64,220
EBIT margin (adj) (%) 5.1% 6.2% 6.3% 7.1% 7.7%
EBIT (adj) 2,144 2,656 3,490 4,064 4,916
EPS (adj) (p) 1.5 1.9 2.8 3.3 4.1
DPS (p) 0.6 0.8 0.9 1.1 1.4
Cash Flow Statement (GBP m)
Net cash from operating activities 3,630 1,926 2,002 2,262 3,702
Free cash flow 716 -911 -165 172 1,512
Acquisitions and disposals - - - - -
Net cash flow 43 -3,270 -587 -559 631
Balance sheet (GBP m)
Intangible assets 13,422 12,500 12,524 12,524 12,524
Other fixed assets 42,255 41,793 42,839 43,359 43,913
Total working capital 20,089 20,983 23,283 25,683 27,433
Cash and cash equivalents 8,756 7,201 6,614 6,055 6,687
Gross debt 5,347 5,630 5,630 5,630 5,630
Pensions and similar obligations 6,158 5,935 5,785 5,785 5,785
Source: Company data, Berenberg estimates
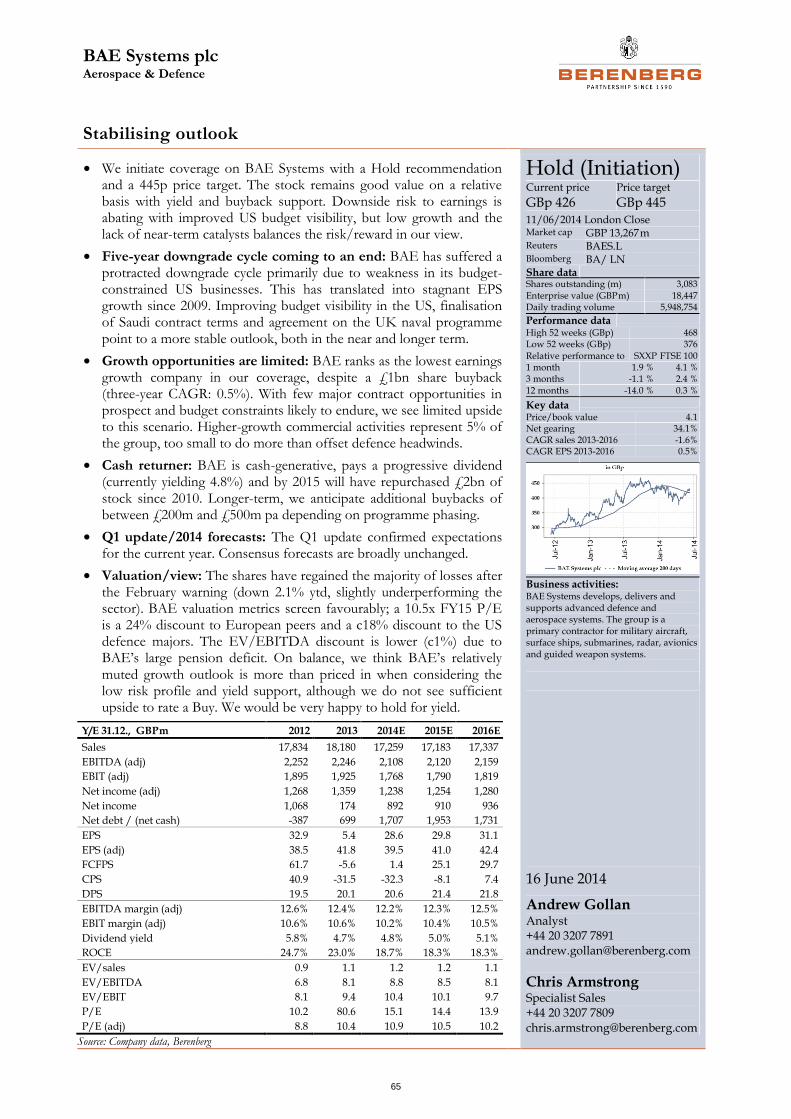
BAE Systems plc Aerospace & Defence
65
Stabilising outlook
• We initiate coverage on BAE Systems with a Hold recommendation and a 445p price target. The stock remains good value on a relative basis with yield and buyback support. Downside risk to earnings is abating with improved US budget visibility, but low growth and the lack of near-term catalysts balances the risk/reward in our view.
• Five-year downgrade cycle coming to an end: BAE has suffered a protracted downgrade cycle primarily due to weakness in its budget-constrained US businesses. This has translated into stagnant EPS growth since 2009. Improving budget visibility in the US, finalisation of Saudi contract terms and agreement on the UK naval programme point to a more stable outlook, both in the near and longer term.
• Growth opportunities are limited: BAE ranks as the lowest earnings growth company in our coverage, despite a £1bn share buyback (three-year CAGR: 0.5%). With few major contract opportunities in prospect and budget constraints likely to endure, we see limited upside to this scenario. Higher-growth commercial activities represent 5% of the group, too small to do more than offset defence headwinds.
• Cash returner: BAE is cash-generative, pays a progressive dividend (currently yielding 4.8%) and by 2015 will have repurchased £2bn of stock since 2010. Longer-term, we anticipate additional buybacks of between £200m and £500m pa depending on programme phasing.
• Q1 update/2014 forecasts: The Q1 update confirmed expectations for the current year. Consensus forecasts are broadly unchanged.
• Valuation/view: The shares have regained the majority of losses after the February warning (down 2.1% ytd, slightly underperforming the sector). BAE valuation metrics screen favourably; a 10.5x FY15 P/E is a 24% discount to European peers and a c18% discount to the US defence majors. The EV/EBITDA discount is lower (c1%) due to BAE’s large pension deficit. On balance, we think BAE’s relatively muted growth outlook is more than priced in when considering the low risk profile and yield support, although we do not see sufficient upside to rate a Buy. We would be very happy to hold for yield.
Hold (Initiation) Current price
GBp 426 Price target
GBp 445 11/06/2014 London Close Market cap GBP 13,267 m Reuters BAES.L Bloomberg BA/ LN Share data
Shares outstanding (m) 3,083 Enterprise value (GBP m) 18,447 Daily trading volume 5,948,754
Performance data
High 52 weeks (GBp) 468 Low 52 weeks (GBp) 376
Relative performance to SXXP FTSE 100 1 month 1.9 % 4.1 % 3 months -1.1 % 2.4 % 12 months -14.0 % 0.3 %
Key data
Price/book value 4.1 Net gearing 34.1% CAGR sales 2013-2016 -1.6% CAGR EPS 2013-2016 0.5%
Business activities: BAE Systems develops, delivers and supports advanced defence and aerospace systems. The group is a primary contractor for military aircraft, surface ships, submarines, radar, avionics and guided weapon systems.
16 June 2014
Andrew Gollan Analyst +44 20 3207 7891 [email protected]
Chris Armstrong
Specialist Sales +44 20 3207 7809 [email protected]
Y/E 31.12., GBP m 2012 2013 2014E 2015E 2016E
Sales 17,834 18,180 17,259 17,183 17,337
EBITDA (adj) 2,252 2,246 2,108 2,120 2,159
EBIT (adj) 1,895 1,925 1,768 1,790 1,819
Net income (adj) 1,268 1,359 1,238 1,254 1,280
Net income 1,068 174 892 910 936
Net debt / (net cash) -387 699 1,707 1,953 1,731
EPS 32.9 5.4 28.6 29.8 31.1
EPS (adj) 38.5 41.8 39.5 41.0 42.4
FCFPS 61.7 -5.6 1.4 25.1 29.7
CPS 40.9 -31.5 -32.3 -8.1 7.4
DPS 19.5 20.1 20.6 21.4 21.8
EBITDA margin (adj) 12.6% 12.4% 12.2% 12.3% 12.5%
EBIT margin (adj) 10.6% 10.6% 10.2% 10.4% 10.5%
Dividend yield 5.8% 4.7% 4.8% 5.0% 5.1%
ROCE 24.7% 23.0% 18.7% 18.3% 18.3%
EV/sales 0.9 1.1 1.2 1.2 1.1
EV/EBITDA 6.8 8.1 8.8 8.5 8.1
EV/EBIT 8.1 9.4 10.4 10.1 9.7
P/E 10.2 80.6 15.1 14.4 13.9
P/E (adj) 8.8 10.4 10.9 10.5 10.2
Source: Company data, Berenberg
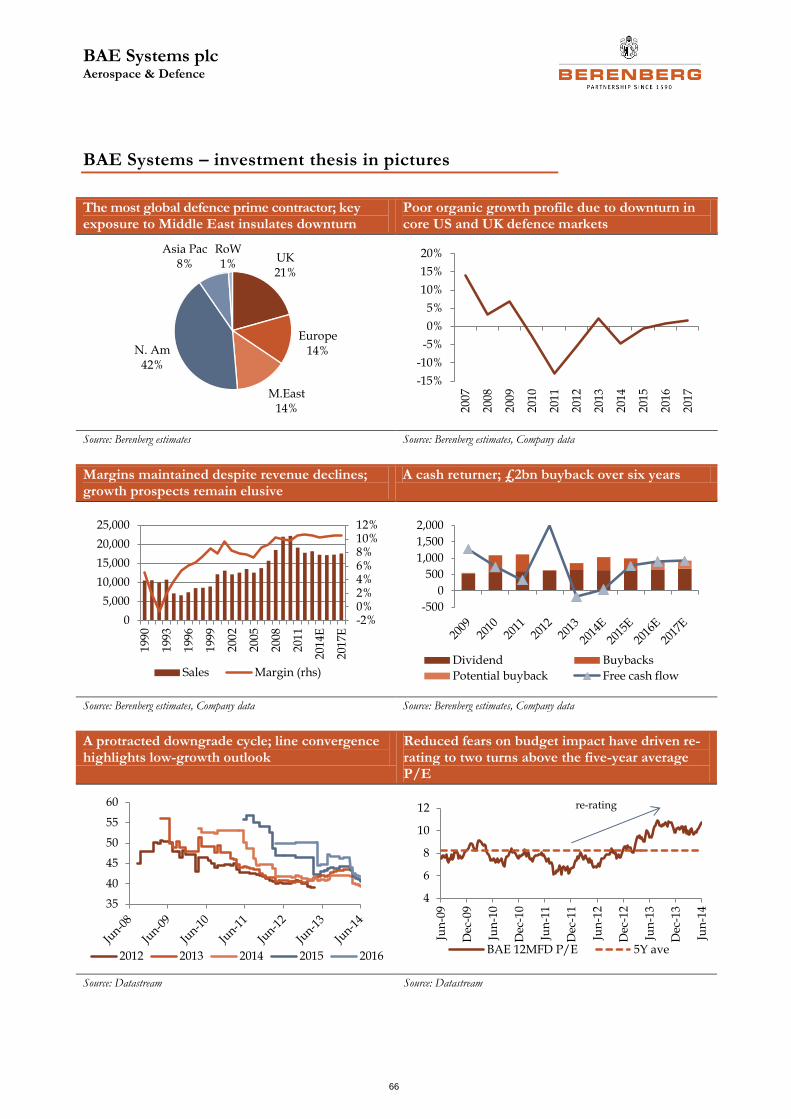
BAE Systems plc Aerospace & Defence
66
BAE Systems – investment thesis in pictures
The most global defence prime contractor; key exposure to Middle East insulates downturn
Poor organic growth profile due to downturn in core US and UK defence markets
Source: Berenberg estimates Source: Berenberg estimates, Company data
Margins maintained despite revenue declines; growth prospects remain elusive
A cash returner; £2bn buyback over six years
Source: Berenberg estimates, Company data Source: Berenberg estimates, Company data
A protracted downgrade cycle; line convergence highlights low-growth outlook
Reduced fears on budget impact have driven re-rating to two turns above the five-year average P/E
Source: Datastream Source: Datastream
UK21%
Europe14%
M.East14%
N. Am42%
Asia Pac8%
RoW1%
-15%
-10%
-5%
0%
5%
10%
15%
20%
2007
2008
2009
2010
2011
2012
2013
2014
2015
2016
2017
-2%0%2%4%6%8%10%12%
0
5,000
10,000
15,000
20,000
25,000
199
0
1993
199
6
199
9
200
2
200
5
200
8
201
1
2014
E
201
7E
Sales Margin (rhs)
-500
0
500
1,000
1,500
2,000
Dividend Buybacks
Potential buyback Free cash flow
35
40
45
50
55
60
2012 2013 2014 2015 2016
4
6
8
10
12
Jun
-09
Dec
-09
Jun
-10
Dec
-10
Jun
-11
Dec
-11
Jun
-12
Dec
-12
Jun
-13
Dec
-13
Jun
-14
BAE 12MFD P/E 5Y ave
re-rating
BAE Systems plc Aerospace & Defence
67
BAE Systems – investment thesis
We initiate on BAE Systems with a Hold rating and a price target of 445p. Despite the re-rating through 2013, the share’s relative valuation remains depressed reflecting a protracted downgrade cycle, largely due to weakness in the group’s core US defence businesses. We believe downside risks are abating with improved visibility from recent US budget deals and moderating future spending cuts. Near-term growth opportunities remain limited, however. BAE is financially strong and we view the principle investment attraction currently as income from dividends. The dividend is secure and yields a sector-topping 4.8% while the £1bn share repurchase programme is ongoing. This provides support to a valuation that screens relatively well despite the recent rally. However, we struggle to identify near-term catalysts to re-rate the shares further and view the stock as a market performer.
• Risk reduction: 2014 performance continues to be hampered by budget pressures, although the rate of yoy reduction in US defence spending is approaching the trough (probably 2015), we believe, even within Budget Control Act 2011 (BCA) spending caps. In the nearer term, improving budget visibility from the Bipartisan Budget Act is a clear positive for BAE (36% sales exposure), and with a stable outlook in the group’s UK/major programme activity and positive momentum in Saudi activities, we believe downside risks to earnings are abating.
• Weak growth outlook, however: Earnings per share have stagnated around the 40p level since 2009, despite c£1.5bn of share buybacks (rising to £2bn by 2015). In forecast terms, BAE ranks lowest in earnings growth terms within our group of covered companies; we see limited opportunities/upside scenarios for this to change at any time soon.
• Programmes stable: BAE’s major equipment programmes are stable. The lack of success in recent Eurofighter export campaigns, notably in the UAE and India, is disappointing and raises questions about the long-term sustainability of the programme beyond the existing European, Saudi and Omani contracts (2017/18). We are relatively sanguine given the potential for a Saudi follow-on order, continuing sustainment and upgrade activities on the aircraft type and phasing of the F-35/Jump Strike Fighter (JSF) ramp-up in the latter part of the decade. On the maritime programmes side, the agreement signed in 2013 with the UK government on the UK’s long-term Naval Programme eases risk beyond the CVF (aircraft carrier) programme that completes in 2016, although we still consider this business to be in long-term decline. The outlook for submarines is positive, with the Astute submarine programme maturing and workload building on the nuclear Successor programme through the next decade.
• High cash returns: BAE remains an attractive income play with a secure dividend yielding 4.8% and a £1bn share buyback programme underway. The combined payout to shareholders in 2013 was £836m, rising to over £1bn in 2014 with higher share repurchases planned. Dividend growth has slowed in line with earnings but BAE is cash-generative and there is plenty of scope to flex the payout to less than 2x cover, which we forecast. We also see potential to extend the share buyback by £200m-500m per annum, depending on major
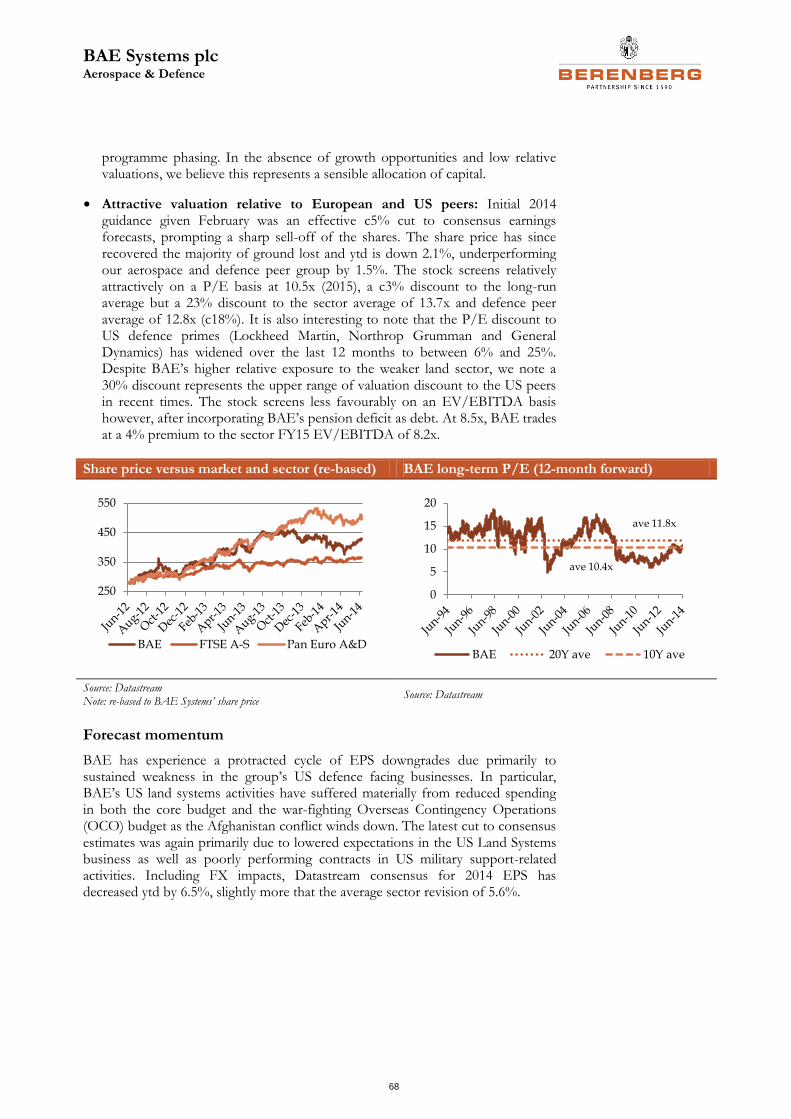
BAE Systems plc Aerospace & Defence
68
programme phasing. In the absence of growth opportunities and low relative valuations, we believe this represents a sensible allocation of capital.
• Attractive valuation relative to European and US peers: Initial 2014 guidance given February was an effective c5% cut to consensus earnings forecasts, prompting a sharp sell-off of the shares. The share price has since recovered the majority of ground lost and ytd is down 2.1%, underperforming our aerospace and defence peer group by 1.5%. The stock screens relatively attractively on a P/E basis at 10.5x (2015), a c3% discount to the long-run average but a 23% discount to the sector average of 13.7x and defence peer average of 12.8x (c18%). It is also interesting to note that the P/E discount to US defence primes (Lockheed Martin, Northrop Grumman and General Dynamics) has widened over the last 12 months to between 6% and 25%. Despite BAE’s higher relative exposure to the weaker land sector, we note a 30% discount represents the upper range of valuation discount to the US peers in recent times. The stock screens less favourably on an EV/EBITDA basis however, after incorporating BAE’s pension deficit as debt. At 8.5x, BAE trades at a 4% premium to the sector FY15 EV/EBITDA of 8.2x.
Share price versus market and sector (re-based) BAE long-term P/E (12-month forward)
Source: Datastream Note: re-based to BAE Systems’ share price
Source: Datastream
Forecast momentum
BAE has experience a protracted cycle of EPS downgrades due primarily to sustained weakness in the group’s US defence facing businesses. In particular, BAE’s US land systems activities have suffered materially from reduced spending in both the core budget and the war-fighting Overseas Contingency Operations (OCO) budget as the Afghanistan conflict winds down. The latest cut to consensus estimates was again primarily due to lowered expectations in the US Land Systems business as well as poorly performing contracts in US military support-related activities. Including FX impacts, Datastream consensus for 2014 EPS has decreased ytd by 6.5%, slightly more that the average sector revision of 5.6%.
250
350
450
550
BAE FTSE A-S Pan Euro A&D
0
5
10
15
20
BAE 20Y ave 10Y ave
ave 10.4x
ave 11.8x
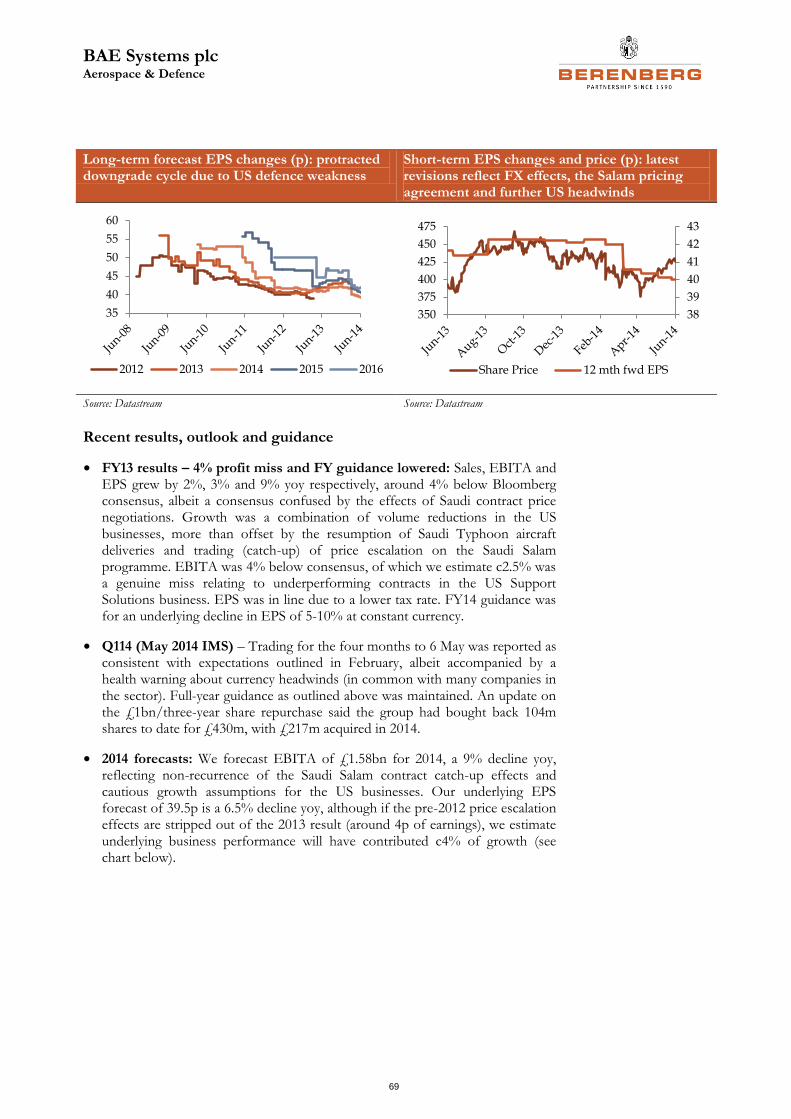
BAE Systems plc Aerospace & Defence
69
Long-term forecast EPS changes (p): protracted downgrade cycle due to US defence weakness
Short-term EPS changes and price (p): latest revisions reflect FX effects, the Salam pricing agreement and further US headwinds
Source: Datastream Source: Datastream
Recent results, outlook and guidance
• FY13 results – 4% profit miss and FY guidance lowered: Sales, EBITA and EPS grew by 2%, 3% and 9% yoy respectively, around 4% below Bloomberg consensus, albeit a consensus confused by the effects of Saudi contract price negotiations. Growth was a combination of volume reductions in the US businesses, more than offset by the resumption of Saudi Typhoon aircraft deliveries and trading (catch-up) of price escalation on the Saudi Salam programme. EBITA was 4% below consensus, of which we estimate c2.5% was a genuine miss relating to underperforming contracts in the US Support Solutions business. EPS was in line due to a lower tax rate. FY14 guidance was for an underlying decline in EPS of 5-10% at constant currency.
• Q114 (May 2014 IMS) – Trading for the four months to 6 May was reported as consistent with expectations outlined in February, albeit accompanied by a health warning about currency headwinds (in common with many companies in the sector). Full-year guidance as outlined above was maintained. An update on the £1bn/three-year share repurchase said the group had bought back 104m shares to date for £430m, with £217m acquired in 2014.
• 2014 forecasts: We forecast EBITA of £1.58bn for 2014, a 9% decline yoy, reflecting non-recurrence of the Saudi Salam contract catch-up effects and cautious growth assumptions for the US businesses. Our underlying EPS forecast of 39.5p is a 6.5% decline yoy, although if the pre-2012 price escalation effects are stripped out of the 2013 result (around 4p of earnings), we estimate underlying business performance will have contributed c4% of growth (see chart below).
35
40
45
50
55
60
2012 2013 2014 2015 2016
38
39
40
41
42
43
350
375
400
425
450
475
Share Price 12 mth fwd EPS
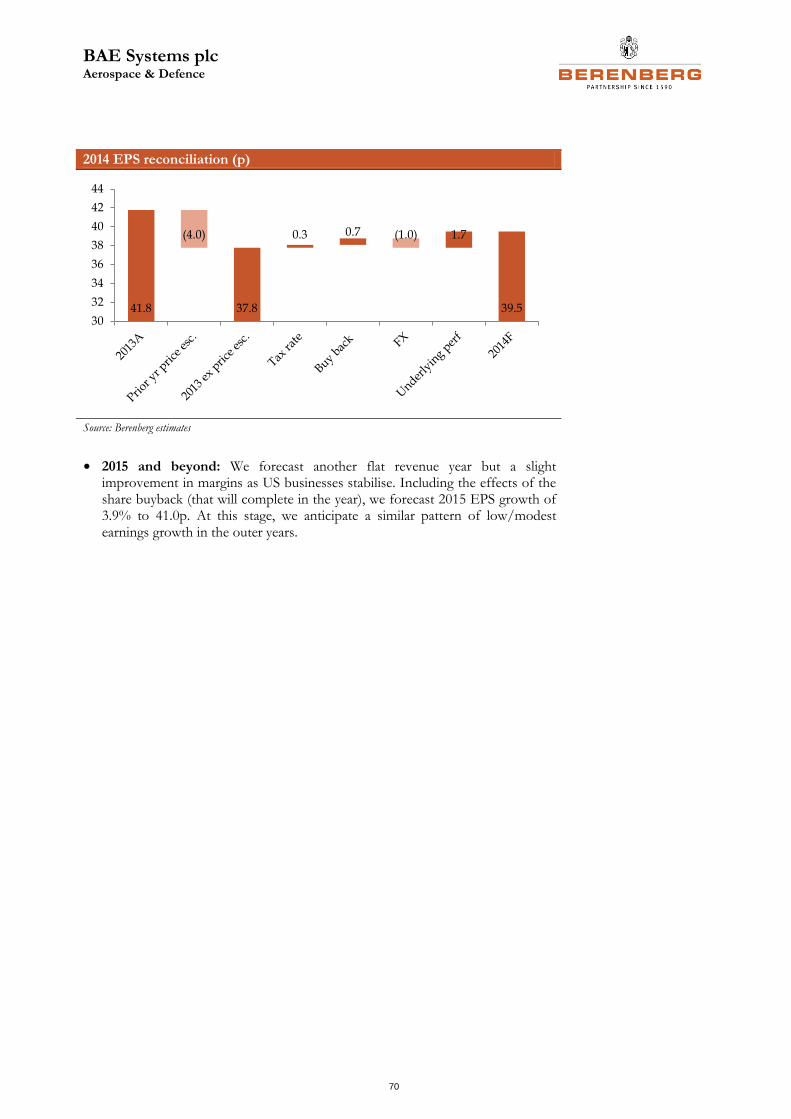
BAE Systems plc Aerospace & Defence
70
2014 EPS reconciliation (p)
Source: Berenberg estimates
• 2015 and beyond: We forecast another flat revenue year but a slight improvement in margins as US businesses stabilise. Including the effects of the share buyback (that will complete in the year), we forecast 2015 EPS growth of 3.9% to 41.0p. At this stage, we anticipate a similar pattern of low/modest earnings growth in the outer years.
41.8
(4.0)
37.8
0.3 0.7 (1.0) 1.7
39.530
32
34
36
38
40
42
44
BAE Systems plc Aerospace & Defence
71
Investment risks and concerns
• Pension deficit: BAE’s IAS 19 accounting deficit is £4.5bn (£3.5bn pre-tax), comprising £26bn gross liabilities and £21bn gross assets. The annual service cost is £250m with a total cash cost of £650m including c£400m of deficit reduction payments. The latest triennial review is underway and is expected to complete in H2. The actuarial deficit (not disclosed) is likely to have increased, we believe, but management is confident that deficit reduction payments will not be required to increase. We can expect an update at the half-year results or at the Q3 IMS.
• Commercial growth insufficient to make a difference: Given that commercial activities (non-defence/non-government) account for less than 5% of sales, even strong growth can only modestly affect group performance. Indeed we estimate strong gains in commercial activities (aerospace and cyber), which we factor into our forecasts, could easily be wiped out by small negative moves in the remaining business.
• US defence headwinds to persist: We estimate direct sales exposure to US Department of Defense (DoD) budgets is c36%. The two-year budget agreement reduces near-term uncertainty, but beyond 2015 we suspect downward pressure will persist as BCA spending caps come into play and the prospect of sequestration looms again. However, we understand that BAE, in common with most other defence companies we cover, is assuming little more than a flat overall budget scenario over the mid- to long term, in line with a realistic outcome tied to the BCA.
• Contract execution: BAE’s programme execution has been strong in recent years, with risk retirement on major equipment programmes such as the Type-45 Destroyer and Eurofighter Typhoon contributing significantly to group profits. However, profitability in 2013 was adversely affected by a $47m charge against the US Radford munitions supply contract due to lower-than-expected activity, and also a $30m charge against cost overruns on commercial shipbuild activity. While these individual issues have been addressed, it serves to highlight that contract execution risks remain a feature of BAE’s business.
• Dividend growth slowing: BAE’s progressive dividend policy is based around 2x cover and hence payout is naturally tied to earnings, where growth is slowing. However, given BAE’s typically strong balance sheet and cash generation profile, in times of volatile earnings the company has flexed the cover ratio in a range of 1.8x (2005) to 2.6x (2008). In 2013, the dividend was raised by just 3%, equivalent to 2.1x cover. We forecast flat EPS in 2014 implying that cover must fall to around 1.92x to ensure an element of progression. In summary, we are confident of BAE’s ability to fund future growth in dividends but we suggest it will be at a historically low rate limited, in line with earnings.
BAE Systems plc Aerospace & Defence
72
• Impairments – an ugly feature: An £865m non-cash impairment charge in 2013 was taken against goodwill in the US Land & Armaments (Armor Holdings) and Intelligence & Security businesses (electronic systems) due to a weaker long-term view of US defence spending. This follows a £856m write-down of goodwill in 2010, also against the Land Systems business, Armour Holdings (£592m), and impairment against the US-based Products businesses (£264m). The NBV of goodwill in the balance sheet is £9.4bn (2012: £10.4bn; 2011: £10.7bn). On the positive side, return-on-investment-based calculations look optically better.
• Export contracts: International sales successes would be unlikely to affect near-term forecasts materially but it would boost sentiment towards the stock and build confidence in the longer-term outlook. We speculate that the next tranche of Hawk trainer aircraft for India could be announced in the current year. While the most material prospect, both financially (in the mid- to longer term) and for sentiment, is a potential Eurofighter Typhoon follow-on order from Saudi for 48-72 aircraft, worth c£10bn including weapons systems. Our best guess is that no announcement will be made before the end of the current year.
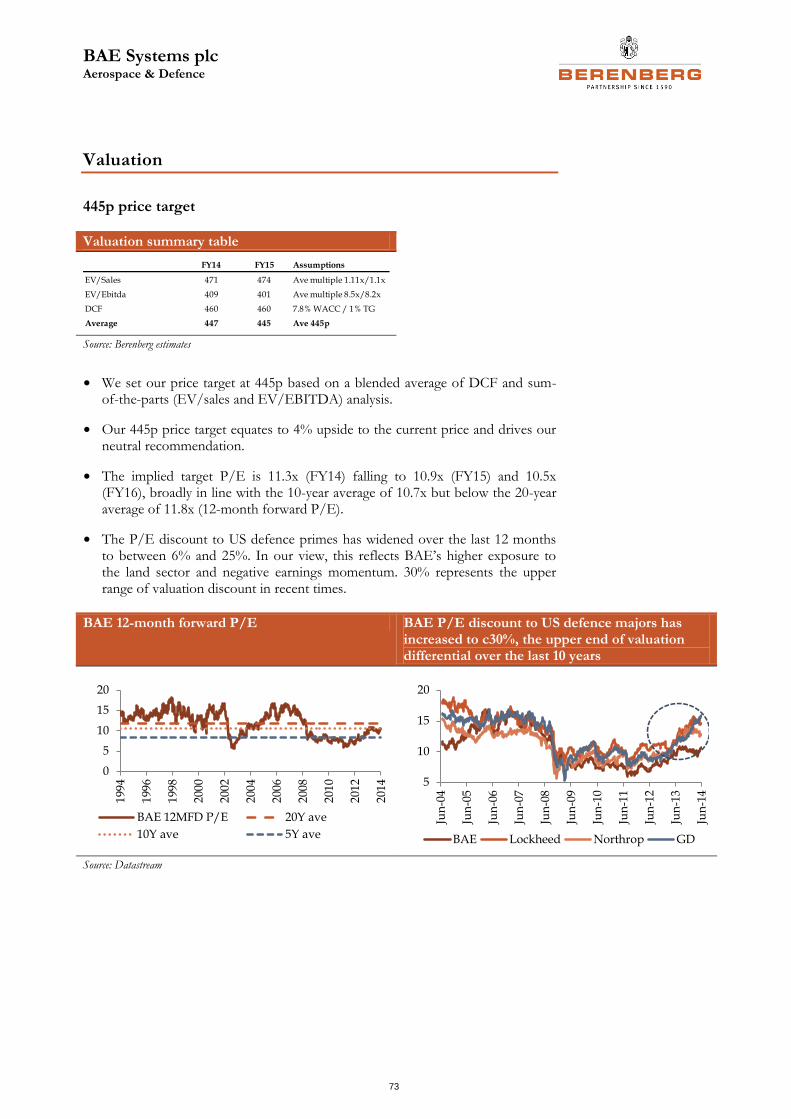
BAE Systems plc Aerospace & Defence
73
Valuation
445p price target
Valuation summary table
Source: Berenberg estimates
• We set our price target at 445p based on a blended average of DCF and sum-of-the-parts (EV/sales and EV/EBITDA) analysis.
• Our 445p price target equates to 4% upside to the current price and drives our neutral recommendation.
• The implied target P/E is 11.3x (FY14) falling to 10.9x (FY15) and 10.5x (FY16), broadly in line with the 10-year average of 10.7x but below the 20-year average of 11.8x (12-month forward P/E).
• The P/E discount to US defence primes has widened over the last 12 months to between 6% and 25%. In our view, this reflects BAE’s higher exposure to the land sector and negative earnings momentum. 30% represents the upper range of valuation discount in recent times.
BAE 12-month forward P/E BAE P/E discount to US defence majors has increased to c30%, the upper end of valuation differential over the last 10 years
Source: Datastream
FY14 FY15 Assumptions
EV/Sales 471 474 Ave multiple 1.11x/1.1x
EV/Ebitda 409 401 Ave multiple 8.5x/8.2x
DCF 460 460 7.8% WACC / 1% TG
Average 447 445 Ave 445p
0
5
10
15
20
199
4
199
6
199
8
2000
200
2
200
4
200
6
200
8
2010
201
2
201
4
BAE 12MFD P/E 20Y ave
10Y ave 5Y ave
5
10
15
20
Jun
-04
Jun
-05
Jun
-06
Jun
-07
Jun
-08
Jun
-09
Jun
-10
Jun
-11
Jun
-12
Jun
-13
Jun
-14
BAE Lockheed Northrop GD
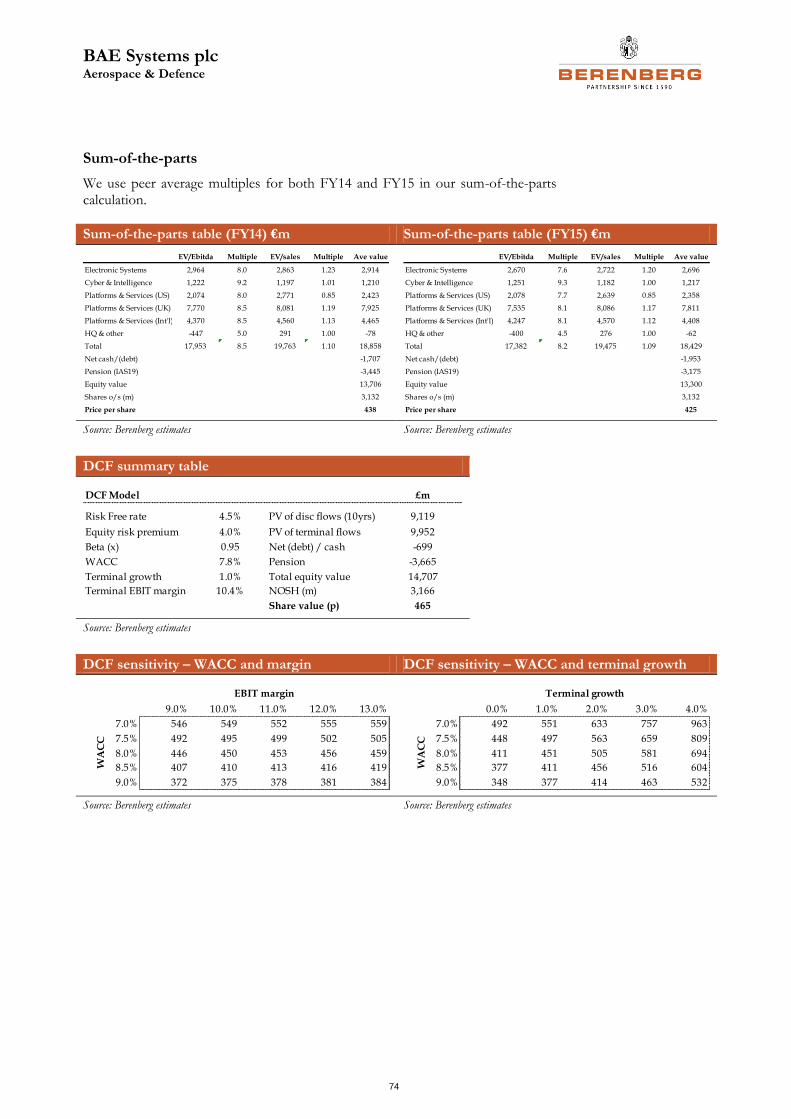
BAE Systems plc Aerospace & Defence
74
Sum-of-the-parts
We use peer average multiples for both FY14 and FY15 in our sum-of-the-parts calculation.
Sum-of-the-parts table (FY14) €m Sum-of-the-parts table (FY15) €m
Source: Berenberg estimates Source: Berenberg estimates
DCF summary table
Source: Berenberg estimates
DCF sensitivity – WACC and margin DCF sensitivity – WACC and terminal growth
Source: Berenberg estimates Source: Berenberg estimates
EV/Ebitda Multiple EV/sales Multiple Ave value
Electronic Systems 2,964 8.0 2,863 1.23 2,914
Cyber & Intelligence 1,222 9.2 1,197 1.01 1,210
Platforms & Services (US) 2,074 8.0 2,771 0.85 2,423
Platforms & Services (UK) 7,770 8.5 8,081 1.19 7,925
Platforms & Services (Int'l) 4,370 8.5 4,560 1.13 4,465
HQ & other -447 5.0 291 1.00 -78
Total 17,953 8.5 19,763 1.10 18,858
Net cash/(debt) -1,707
Pension (IAS19) -3,445
Equity value 13,706
Shares o/s (m) 3,132
Price per share 438
EV/Ebitda Multiple EV/sales Multiple Ave value
Electronic Systems 2,670 7.6 2,722 1.20 2,696
Cyber & Intelligence 1,251 9.3 1,182 1.00 1,217
Platforms & Services (US) 2,078 7.7 2,639 0.85 2,358
Platforms & Services (UK) 7,535 8.1 8,086 1.17 7,811
Platforms & Services (Int'l) 4,247 8.1 4,570 1.12 4,408
HQ & other -400 4.5 276 1.00 -62
Total 17,382 8.2 19,475 1.09 18,429
Net cash/(debt) -1,953
Pension (IAS19) -3,175
Equity value 13,300
Shares o/s (m) 3,132
Price per share 425
DCF Model £m
Risk Free rate 4.5% PV of disc flows (10yrs) 9,119
Equity risk premium 4.0% PV of terminal flows 9,952
Beta (x) 0.95 Net (debt) / cash -699
WACC 7.8% Pension -3,665
Terminal growth 1.0% Total equity value 14,707
Terminal EBIT margin 10.4% NOSH (m) 3,166
Share value (p) 465
465 9.0% 10.0% 11.0% 12.0% 13.0%
7.0% 546 549 552 555 559
7.5% 492 495 499 502 505
8.0% 446 450 453 456 459
8.5% 407 410 413 416 419
9.0% 372 375 378 381 384
EBIT margin
WA
CC
465 0.0% 1.0% 2.0% 3.0% 4.0%
7.0% 492 551 633 757 963
7.5% 448 497 563 659 809
8.0% 411 451 505 581 694
8.5% 377 411 456 516 604
9.0% 348 377 414 463 532
Terminal growth
WA
CC
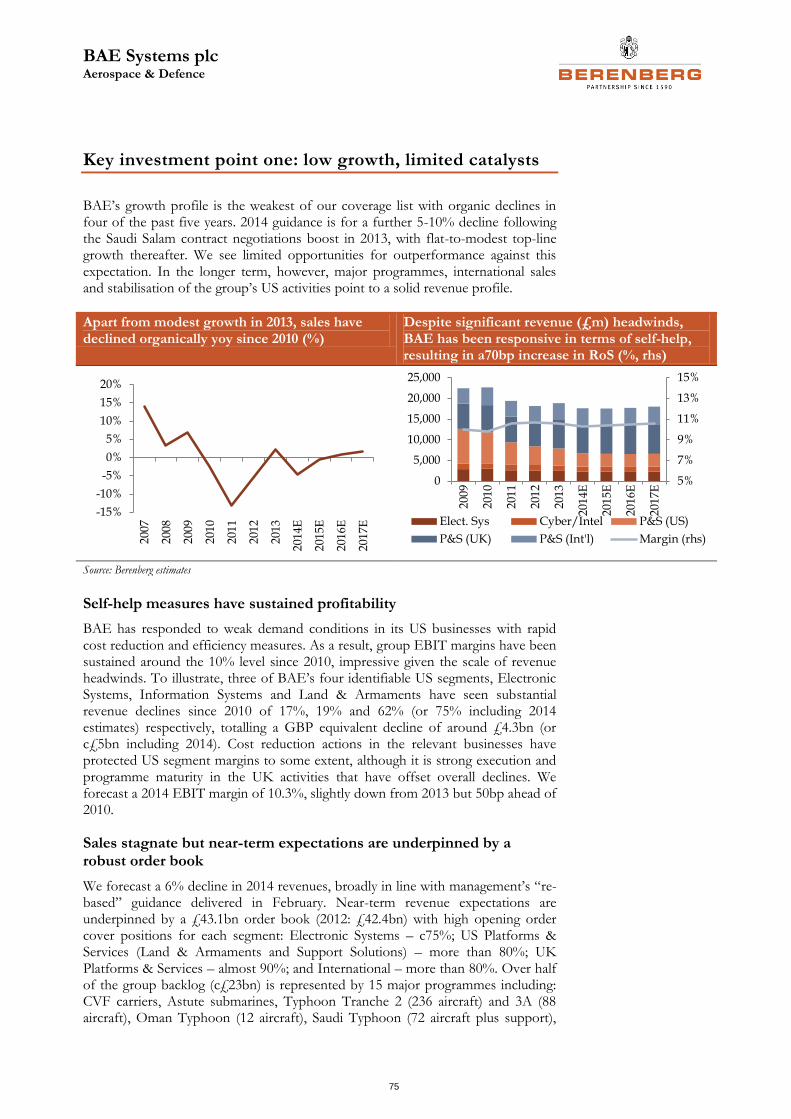
BAE Systems plc Aerospace & Defence
75
Key investment point one: low growth, limited catalysts
BAE’s growth profile is the weakest of our coverage list with organic declines in four of the past five years. 2014 guidance is for a further 5-10% decline following the Saudi Salam contract negotiations boost in 2013, with flat-to-modest top-line growth thereafter. We see limited opportunities for outperformance against this expectation. In the longer term, however, major programmes, international sales and stabilisation of the group’s US activities point to a solid revenue profile.
Apart from modest growth in 2013, sales have declined organically yoy since 2010 (%)
Despite significant revenue (£m) headwinds, BAE has been responsive in terms of self-help, resulting in a70bp increase in RoS (%, rhs)
Source: Berenberg estimates
Self-help measures have sustained profitability
BAE has responded to weak demand conditions in its US businesses with rapid cost reduction and efficiency measures. As a result, group EBIT margins have been sustained around the 10% level since 2010, impressive given the scale of revenue headwinds. To illustrate, three of BAE’s four identifiable US segments, Electronic Systems, Information Systems and Land & Armaments have seen substantial revenue declines since 2010 of 17%, 19% and 62% (or 75% including 2014 estimates) respectively, totalling a GBP equivalent decline of around £4.3bn (or c£5bn including 2014). Cost reduction actions in the relevant businesses have protected US segment margins to some extent, although it is strong execution and programme maturity in the UK activities that have offset overall declines. We forecast a 2014 EBIT margin of 10.3%, slightly down from 2013 but 50bp ahead of 2010.
Sales stagnate but near-term expectations are underpinned by a robust order book
We forecast a 6% decline in 2014 revenues, broadly in line with management’s “re-based” guidance delivered in February. Near-term revenue expectations are underpinned by a £43.1bn order book (2012: £42.4bn) with high opening order cover positions for each segment: Electronic Systems – c75%; US Platforms & Services (Land & Armaments and Support Solutions) – more than 80%; UK Platforms & Services – almost 90%; and International – more than 80%. Over half of the group backlog (c£23bn) is represented by 15 major programmes including: CVF carriers, Astute submarines, Typhoon Tranche 2 (236 aircraft) and 3A (88 aircraft), Oman Typhoon (12 aircraft), Saudi Typhoon (72 aircraft plus support),
-15%
-10%
-5%
0%
5%
10%
15%
20%
200
7
200
8
200
9
201
0
201
1
201
2
201
3
201
4E
201
5E
201
6E
201
7E
5%
7%
9%
11%
13%
15%
0
5,000
10,000
15,000
20,000
25,000
200
9
2010
201
1
2012
201
3
201
4E
201
5E
201
6E
201
7E
Elect. Sys Cyber/Intel P&S (US)
P&S (UK) P&S (Int'l) Margin (rhs)
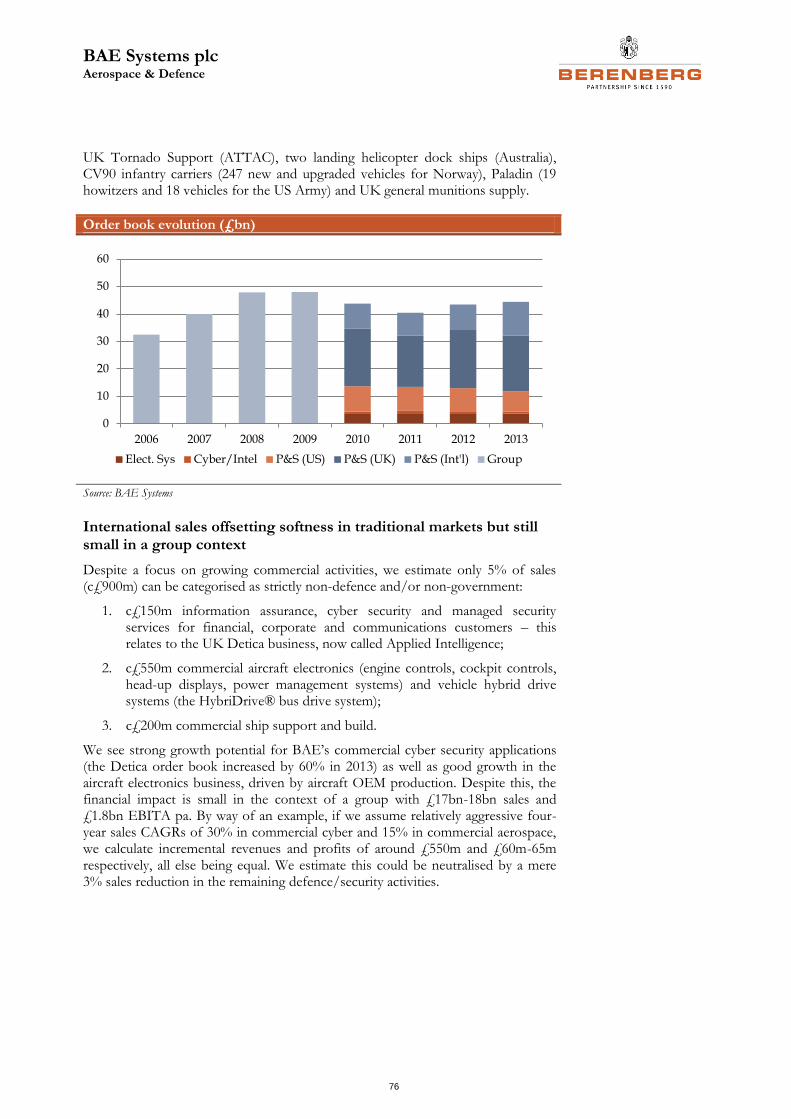
BAE Systems plc Aerospace & Defence
76
UK Tornado Support (ATTAC), two landing helicopter dock ships (Australia), CV90 infantry carriers (247 new and upgraded vehicles for Norway), Paladin (19 howitzers and 18 vehicles for the US Army) and UK general munitions supply.
Order book evolution (£bn)
Source: BAE Systems
International sales offsetting softness in traditional markets but still small in a group context
Despite a focus on growing commercial activities, we estimate only 5% of sales (c£900m) can be categorised as strictly non-defence and/or non-government:
1. c£150m information assurance, cyber security and managed security services for financial, corporate and communications customers – this relates to the UK Detica business, now called Applied Intelligence;
2. c£550m commercial aircraft electronics (engine controls, cockpit controls, head-up displays, power management systems) and vehicle hybrid drive systems (the HybriDrive® bus drive system);
3. c£200m commercial ship support and build.
We see strong growth potential for BAE’s commercial cyber security applications (the Detica order book increased by 60% in 2013) as well as good growth in the aircraft electronics business, driven by aircraft OEM production. Despite this, the financial impact is small in the context of a group with £17bn-18bn sales and £1.8bn EBITA pa. By way of an example, if we assume relatively aggressive four-year sales CAGRs of 30% in commercial cyber and 15% in commercial aerospace, we calculate incremental revenues and profits of around £550m and £60m-65m respectively, all else being equal. We estimate this could be neutralised by a mere 3% sales reduction in the remaining defence/security activities.
0
10
20
30
40
50
60
2006 2007 2008 2009 2010 2011 2012 2013
Elect. Sys Cyber/Intel P&S (US) P&S (UK) P&S (Int'l) Group
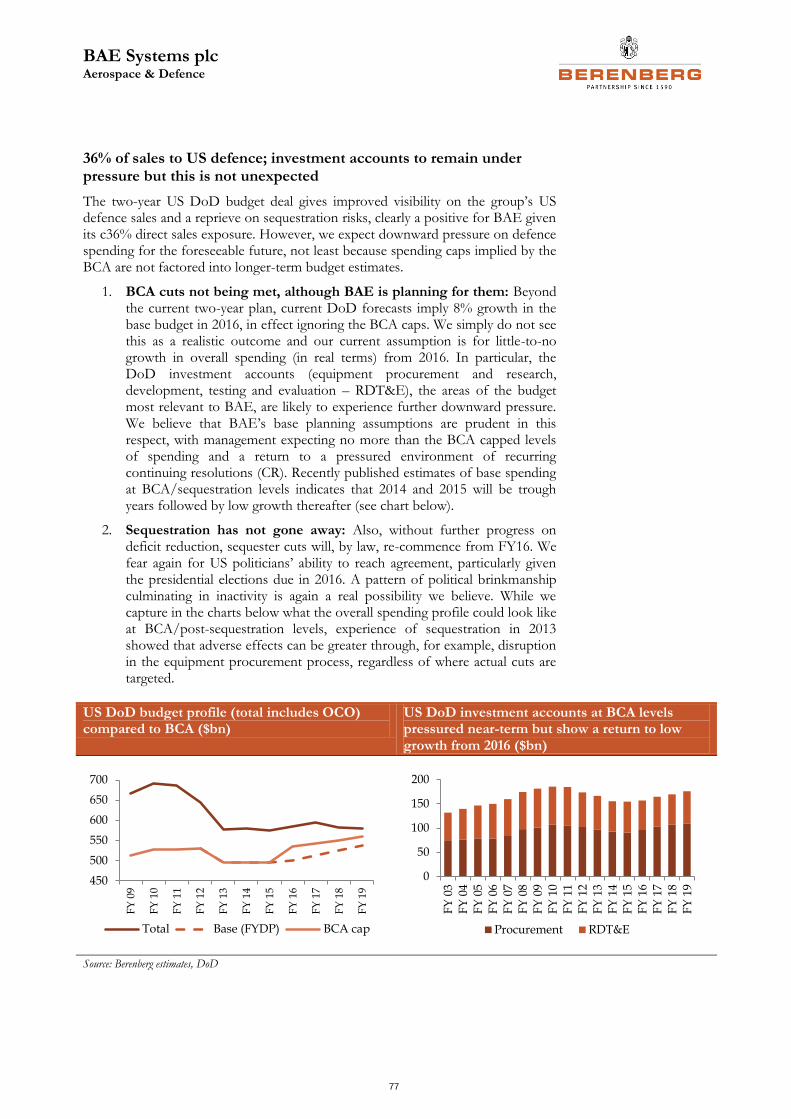
BAE Systems plc Aerospace & Defence
77
36% of sales to US defence; investment accounts to remain under pressure but this is not unexpected
The two-year US DoD budget deal gives improved visibility on the group’s US defence sales and a reprieve on sequestration risks, clearly a positive for BAE given its c36% direct sales exposure. However, we expect downward pressure on defence spending for the foreseeable future, not least because spending caps implied by the BCA are not factored into longer-term budget estimates.
1. BCA cuts not being met, although BAE is planning for them: Beyond the current two-year plan, current DoD forecasts imply 8% growth in the base budget in 2016, in effect ignoring the BCA caps. We simply do not see this as a realistic outcome and our current assumption is for little-to-no growth in overall spending (in real terms) from 2016. In particular, the DoD investment accounts (equipment procurement and research, development, testing and evaluation – RDT&E), the areas of the budget most relevant to BAE, are likely to experience further downward pressure. We believe that BAE’s base planning assumptions are prudent in this respect, with management expecting no more than the BCA capped levels of spending and a return to a pressured environment of recurring continuing resolutions (CR). Recently published estimates of base spending at BCA/sequestration levels indicates that 2014 and 2015 will be trough years followed by low growth thereafter (see chart below).
2. Sequestration has not gone away: Also, without further progress on deficit reduction, sequester cuts will, by law, re-commence from FY16. We fear again for US politicians’ ability to reach agreement, particularly given the presidential elections due in 2016. A pattern of political brinkmanship culminating in inactivity is again a real possibility we believe. While we capture in the charts below what the overall spending profile could look like at BCA/post-sequestration levels, experience of sequestration in 2013 showed that adverse effects can be greater through, for example, disruption in the equipment procurement process, regardless of where actual cuts are targeted.
US DoD budget profile (total includes OCO) compared to BCA ($bn)
US DoD investment accounts at BCA levels pressured near-term but show a return to low growth from 2016 ($bn)
Source: Berenberg estimates, DoD
450
500
550
600
650
700
FY
09
FY
10
FY
11
FY
12
FY
13
FY
14
FY
15
FY
16
FY
17
FY
18
FY
19
Total Base (FYDP) BCA cap
0
50
100
150
200
FY
03
FY
04
FY
05
FY
06
FY
07
FY
08
FY
09
FY
10
FY
11
FY
12
FY
13
FY
14
FY
15
FY
16
FY
17
FY
18
FY
19
Procurement RDT&E
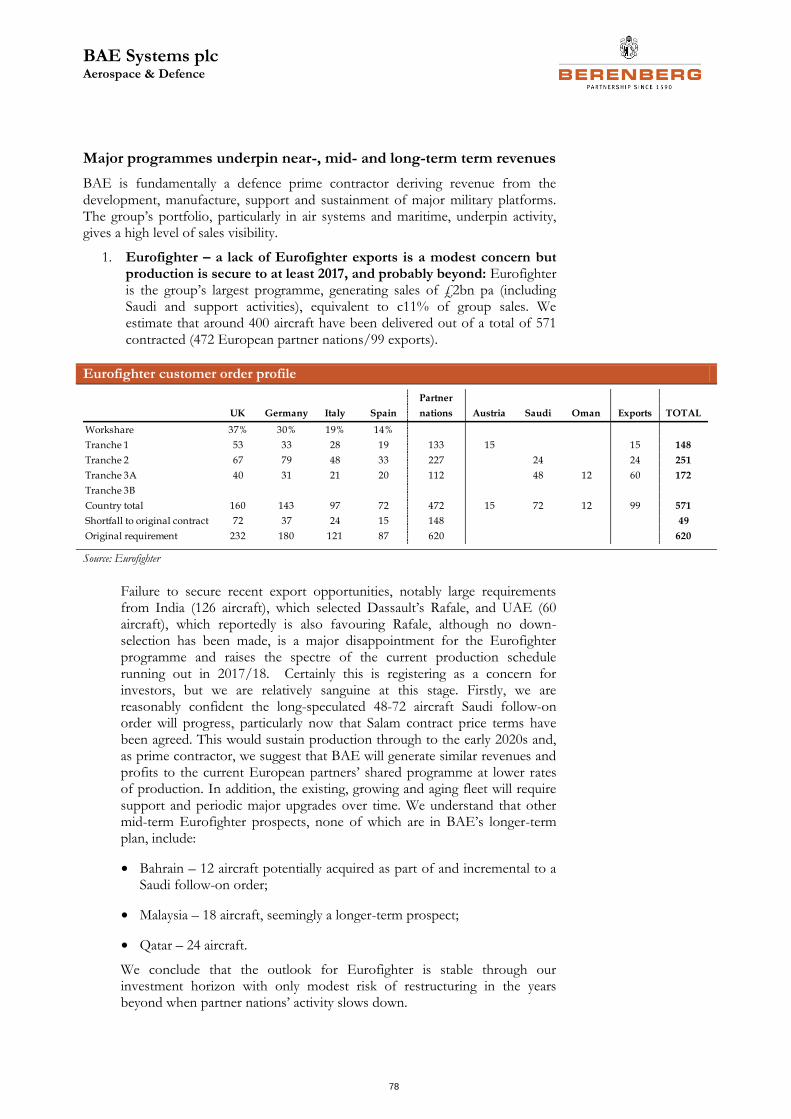
BAE Systems plc Aerospace & Defence
78
Major programmes underpin near-, mid- and long-term term revenues
BAE is fundamentally a defence prime contractor deriving revenue from the development, manufacture, support and sustainment of major military platforms. The group’s portfolio, particularly in air systems and maritime, underpin activity, gives a high level of sales visibility.
1. Eurofighter – a lack of Eurofighter exports is a modest concern but production is secure to at least 2017, and probably beyond: Eurofighter is the group’s largest programme, generating sales of £2bn pa (including Saudi and support activities), equivalent to c11% of group sales. We estimate that around 400 aircraft have been delivered out of a total of 571 contracted (472 European partner nations/99 exports).
Eurofighter customer order profile
Source: Eurofighter
Failure to secure recent export opportunities, notably large requirements from India (126 aircraft), which selected Dassault’s Rafale, and UAE (60 aircraft), which reportedly is also favouring Rafale, although no down-selection has been made, is a major disappointment for the Eurofighter programme and raises the spectre of the current production schedule running out in 2017/18. Certainly this is registering as a concern for investors, but we are relatively sanguine at this stage. Firstly, we are reasonably confident the long-speculated 48-72 aircraft Saudi follow-on order will progress, particularly now that Salam contract price terms have been agreed. This would sustain production through to the early 2020s and, as prime contractor, we suggest that BAE will generate similar revenues and profits to the current European partners’ shared programme at lower rates of production. In addition, the existing, growing and aging fleet will require support and periodic major upgrades over time. We understand that other mid-term Eurofighter prospects, none of which are in BAE’s longer-term plan, include:
• Bahrain – 12 aircraft potentially acquired as part of and incremental to a Saudi follow-on order;
• Malaysia – 18 aircraft, seemingly a longer-term prospect;
• Qatar – 24 aircraft.
We conclude that the outlook for Eurofighter is stable through our investment horizon with only modest risk of restructuring in the years beyond when partner nations’ activity slows down.
UK Germany Italy Spain
Partner
nations Austria Saudi Oman Exports TOTAL
Workshare 37% 30% 19% 14%
Tranche 1 53 33 28 19 133 15 15 148
Tranche 2 67 79 48 33 227 24 24 251
Tranche 3A 40 31 21 20 112 48 12 60 172
Tranche 3B
Country total 160 143 97 72 472 15 72 12 99 571
Shortfall to original contract 72 37 24 15 148 49
Original requirement 232 180 121 87 620 620
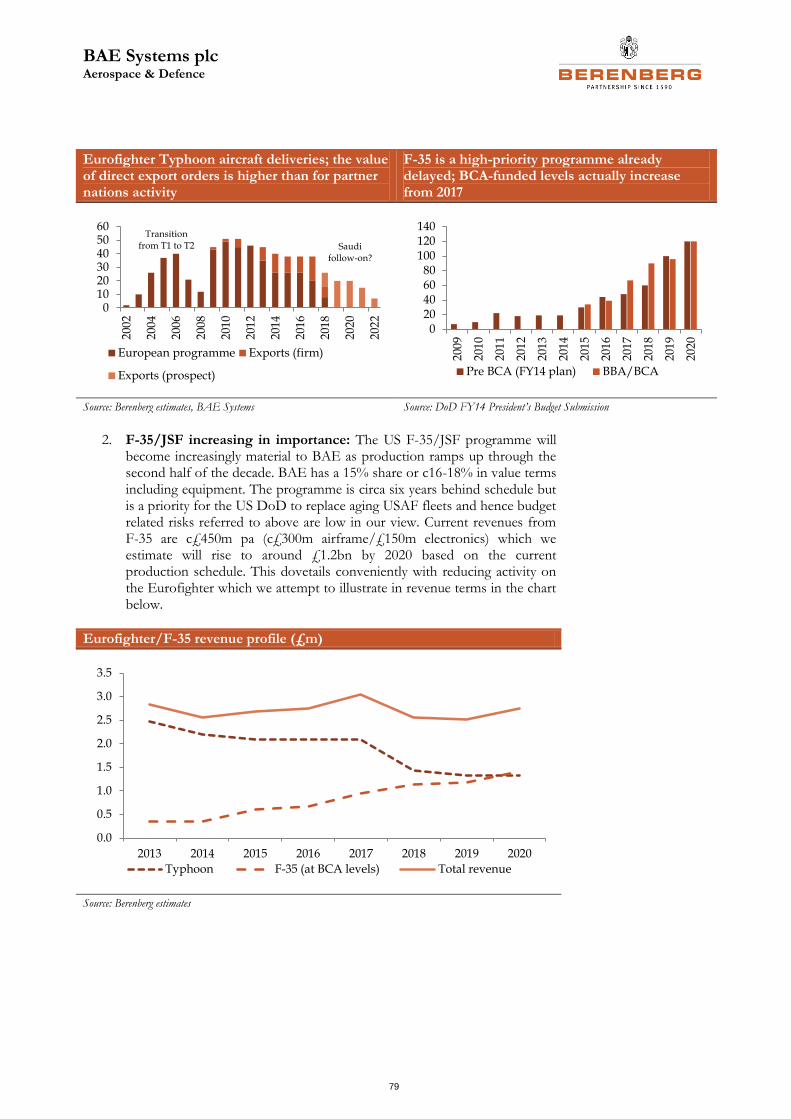
BAE Systems plc Aerospace & Defence
79
Eurofighter Typhoon aircraft deliveries; the value of direct export orders is higher than for partner nations activity
F-35 is a high-priority programme already delayed; BCA-funded levels actually increase from 2017
Source: Berenberg estimates, BAE Systems Source: DoD FY14 President’s Budget Submission
2. F-35/JSF increasing in importance: The US F-35/JSF programme will become increasingly material to BAE as production ramps up through the second half of the decade. BAE has a 15% share or c16-18% in value terms including equipment. The programme is circa six years behind schedule but is a priority for the US DoD to replace aging USAF fleets and hence budget related risks referred to above are low in our view. Current revenues from F-35 are c£450m pa (c£300m airframe/£150m electronics) which we estimate will rise to around £1.2bn by 2020 based on the current production schedule. This dovetails conveniently with reducing activity on the Eurofighter which we attempt to illustrate in revenue terms in the chart below.
Eurofighter/F-35 revenue profile (£m)
Source: Berenberg estimates
0102030405060
200
2
200
4
200
6
200
8
201
0
201
2
2014
201
6
201
8
202
0
2022
European programme Exports (firm)
Exports (prospect)
Transition
from T1 to T2 Saudi
follow-on?
020406080
100120140
200
9
201
0
201
1
201
2
201
3
201
4
201
5
201
6
201
7
201
8
201
9
202
0
Pre BCA (FY14 plan) BBA/BCA
0.0
0.5
1.0
1.5
2.0
2.5
3.0
3.5
2013 2014 2015 2016 2017 2018 2019 2020
Typhoon F-35 (at BCA levels) Total revenue
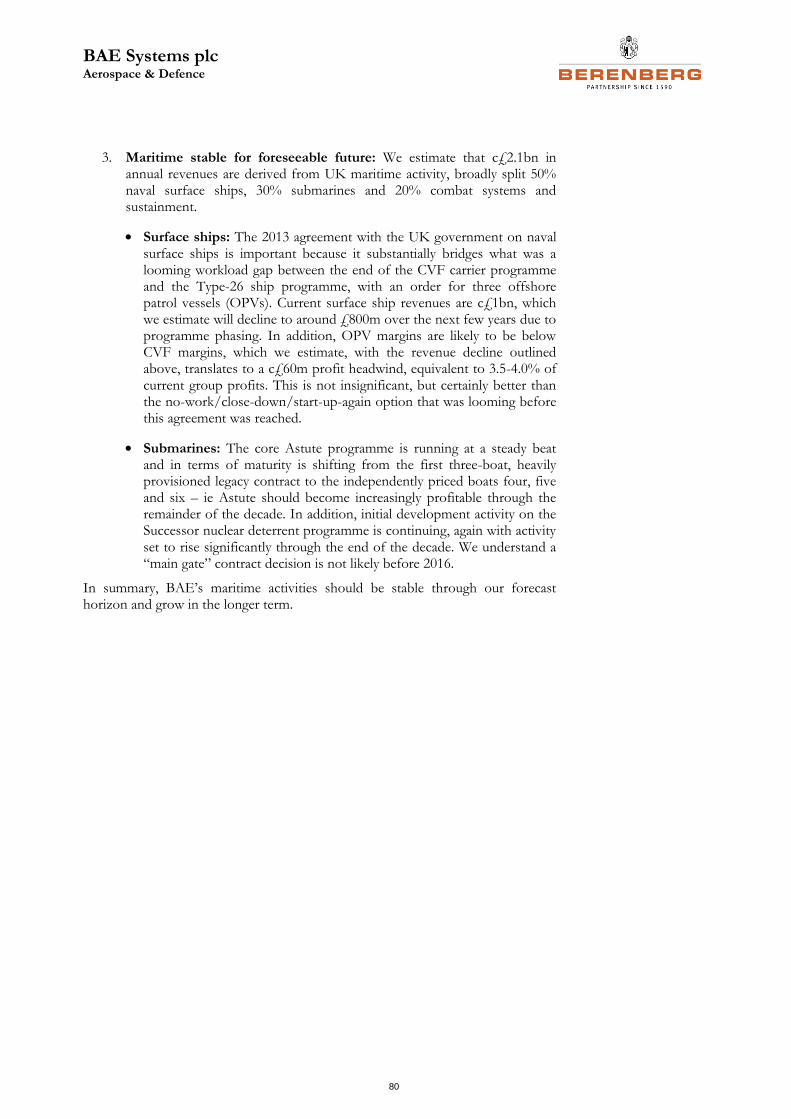
BAE Systems plc Aerospace & Defence
80
3. Maritime stable for foreseeable future: We estimate that c£2.1bn in annual revenues are derived from UK maritime activity, broadly split 50% naval surface ships, 30% submarines and 20% combat systems and sustainment.
• Surface ships: The 2013 agreement with the UK government on naval surface ships is important because it substantially bridges what was a looming workload gap between the end of the CVF carrier programme and the Type-26 ship programme, with an order for three offshore patrol vessels (OPVs). Current surface ship revenues are c£1bn, which we estimate will decline to around £800m over the next few years due to programme phasing. In addition, OPV margins are likely to be below CVF margins, which we estimate, with the revenue decline outlined above, translates to a c£60m profit headwind, equivalent to 3.5-4.0% of current group profits. This is not insignificant, but certainly better than the no-work/close-down/start-up-again option that was looming before this agreement was reached.
• Submarines: The core Astute programme is running at a steady beat and in terms of maturity is shifting from the first three-boat, heavily provisioned legacy contract to the independently priced boats four, five and six – ie Astute should become increasingly profitable through the remainder of the decade. In addition, initial development activity on the Successor nuclear deterrent programme is continuing, again with activity set to rise significantly through the end of the decade. We understand a “main gate” contract decision is not likely before 2016.
In summary, BAE’s maritime activities should be stable through our forecast horizon and grow in the longer term.
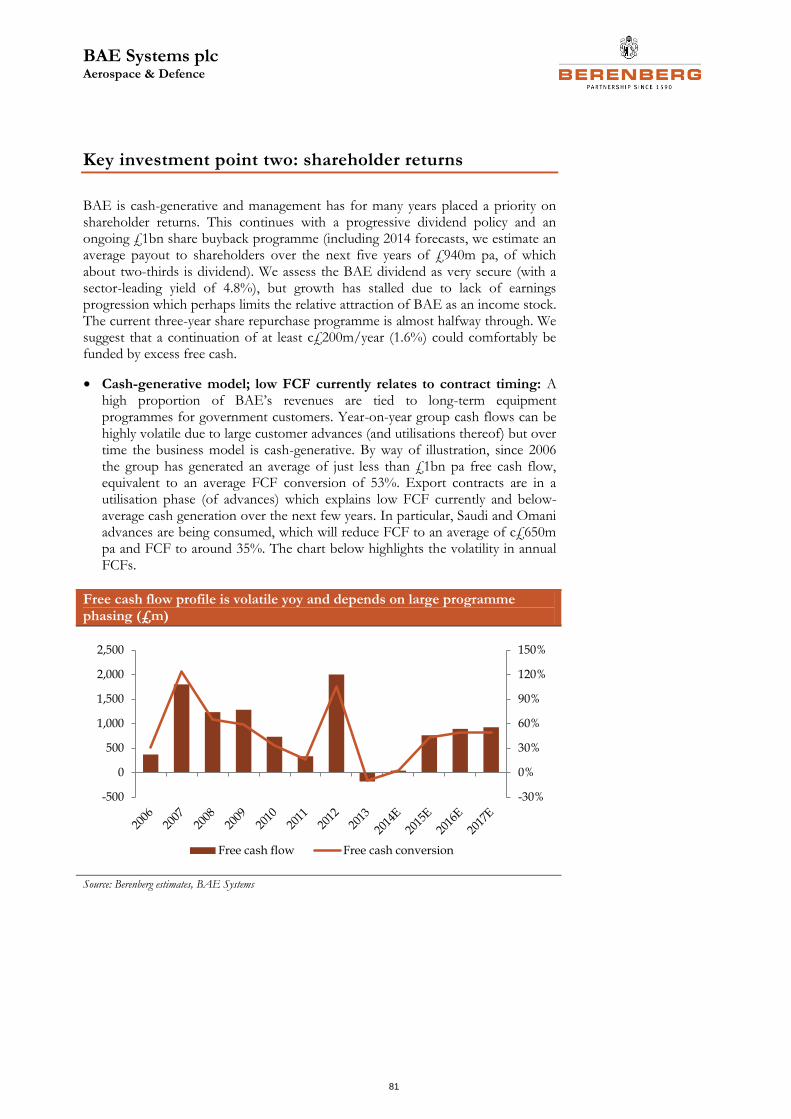
BAE Systems plc Aerospace & Defence
81
Key investment point two: shareholder returns
BAE is cash-generative and management has for many years placed a priority on shareholder returns. This continues with a progressive dividend policy and an ongoing £1bn share buyback programme (including 2014 forecasts, we estimate an average payout to shareholders over the next five years of £940m pa, of which about two-thirds is dividend). We assess the BAE dividend as very secure (with a sector-leading yield of 4.8%), but growth has stalled due to lack of earnings progression which perhaps limits the relative attraction of BAE as an income stock. The current three-year share repurchase programme is almost halfway through. We suggest that a continuation of at least c£200m/year (1.6%) could comfortably be funded by excess free cash.
• Cash-generative model; low FCF currently relates to contract timing: A high proportion of BAE’s revenues are tied to long-term equipment programmes for government customers. Year-on-year group cash flows can be highly volatile due to large customer advances (and utilisations thereof) but over time the business model is cash-generative. By way of illustration, since 2006 the group has generated an average of just less than £1bn pa free cash flow, equivalent to an average FCF conversion of 53%. Export contracts are in a utilisation phase (of advances) which explains low FCF currently and below-average cash generation over the next few years. In particular, Saudi and Omani advances are being consumed, which will reduce FCF to an average of c£650m pa and FCF to around 35%. The chart below highlights the volatility in annual FCFs.
Free cash flow profile is volatile yoy and depends on large programme phasing (£m)
Source: Berenberg estimates, BAE Systems
-30%
0%
30%
60%
90%
120%
150%
-500
0
500
1,000
1,500
2,000
2,500
Free cash flow Free cash conversion
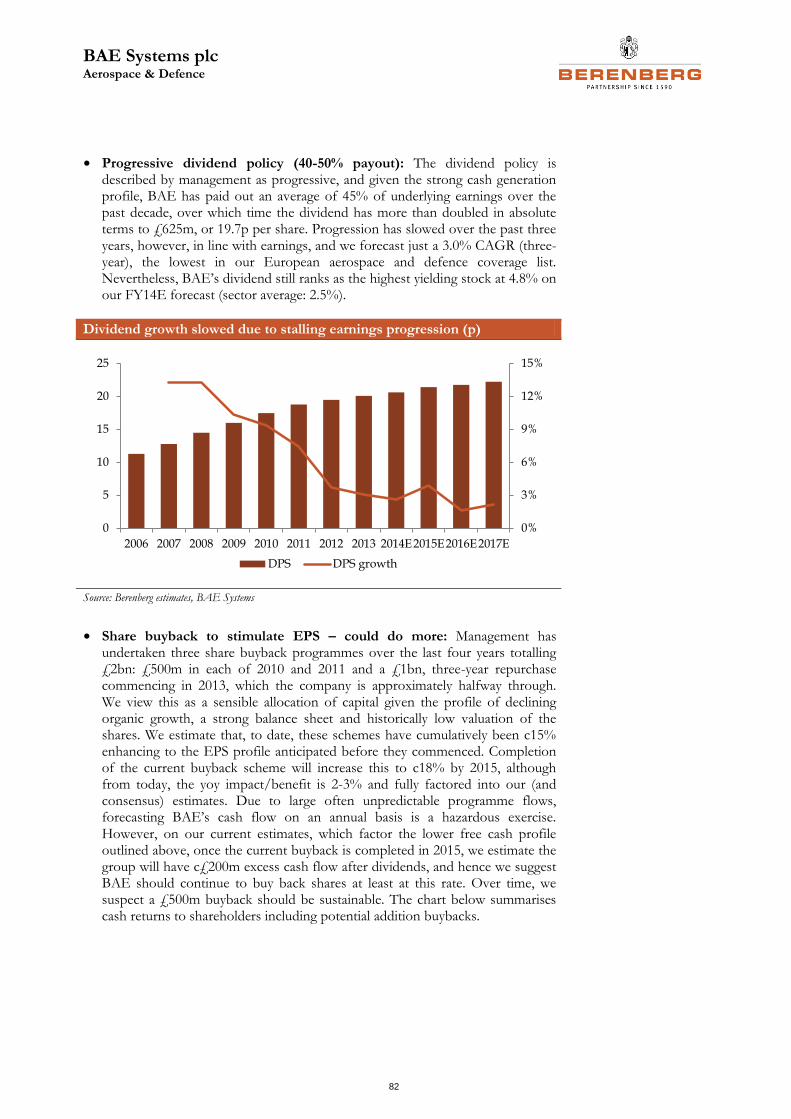
BAE Systems plc Aerospace & Defence
82
• Progressive dividend policy (40-50% payout): The dividend policy is described by management as progressive, and given the strong cash generation profile, BAE has paid out an average of 45% of underlying earnings over the past decade, over which time the dividend has more than doubled in absolute terms to £625m, or 19.7p per share. Progression has slowed over the past three years, however, in line with earnings, and we forecast just a 3.0% CAGR (three-year), the lowest in our European aerospace and defence coverage list. Nevertheless, BAE’s dividend still ranks as the highest yielding stock at 4.8% on our FY14E forecast (sector average: 2.5%).
Dividend growth slowed due to stalling earnings progression (p)
Source: Berenberg estimates, BAE Systems
• Share buyback to stimulate EPS – could do more: Management has undertaken three share buyback programmes over the last four years totalling £2bn: £500m in each of 2010 and 2011 and a £1bn, three-year repurchase commencing in 2013, which the company is approximately halfway through. We view this as a sensible allocation of capital given the profile of declining organic growth, a strong balance sheet and historically low valuation of the shares. We estimate that, to date, these schemes have cumulatively been c15% enhancing to the EPS profile anticipated before they commenced. Completion of the current buyback scheme will increase this to c18% by 2015, although from today, the yoy impact/benefit is 2-3% and fully factored into our (and consensus) estimates. Due to large often unpredictable programme flows, forecasting BAE’s cash flow on an annual basis is a hazardous exercise. However, on our current estimates, which factor the lower free cash profile outlined above, once the current buyback is completed in 2015, we estimate the group will have c£200m excess cash flow after dividends, and hence we suggest BAE should continue to buy back shares at least at this rate. Over time, we suspect a £500m buyback should be sustainable. The chart below summarises cash returns to shareholders including potential addition buybacks.
0%
3%
6%
9%
12%
15%
0
5
10
15
20
25
2006 2007 2008 2009 2010 2011 2012 2013 2014E2015E2016E2017E
DPS DPS growth
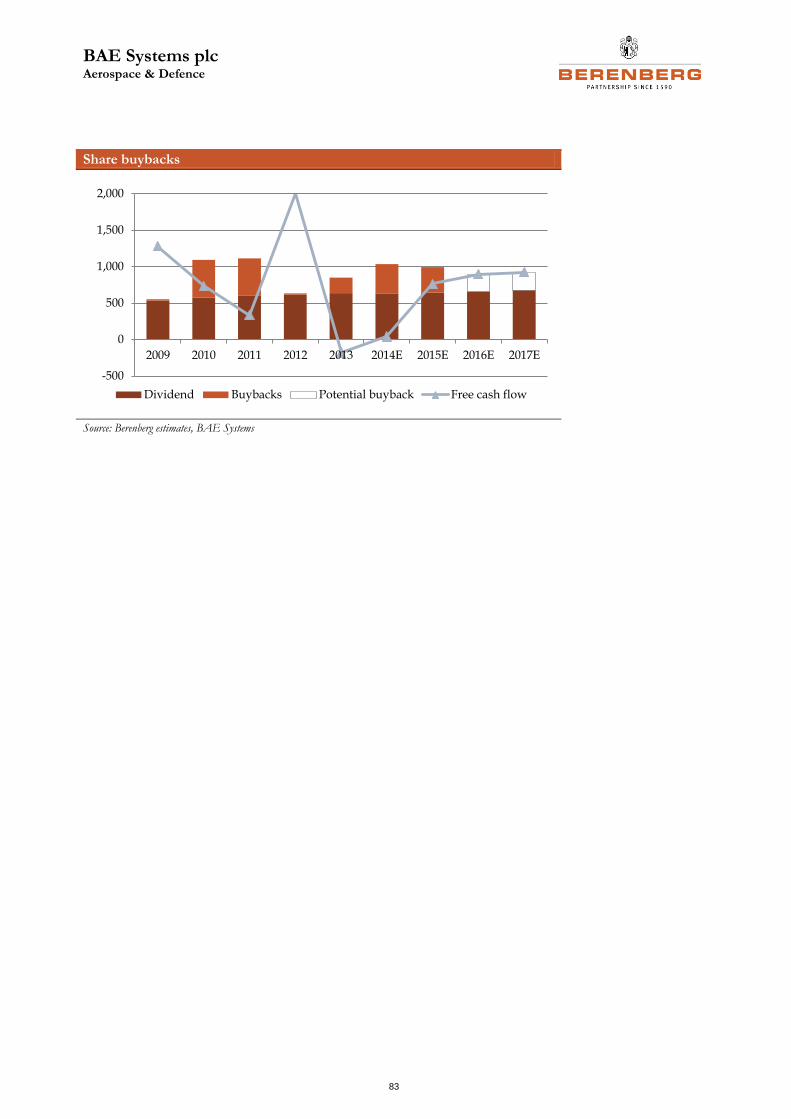
BAE Systems plc Aerospace & Defence
83
Share buybacks
Source: Berenberg estimates, BAE Systems
-500
0
500
1,000
1,500
2,000
2009 2010 2011 2012 2013 2014E 2015E 2016E 2017E
Dividend Buybacks Potential buyback Free cash flow
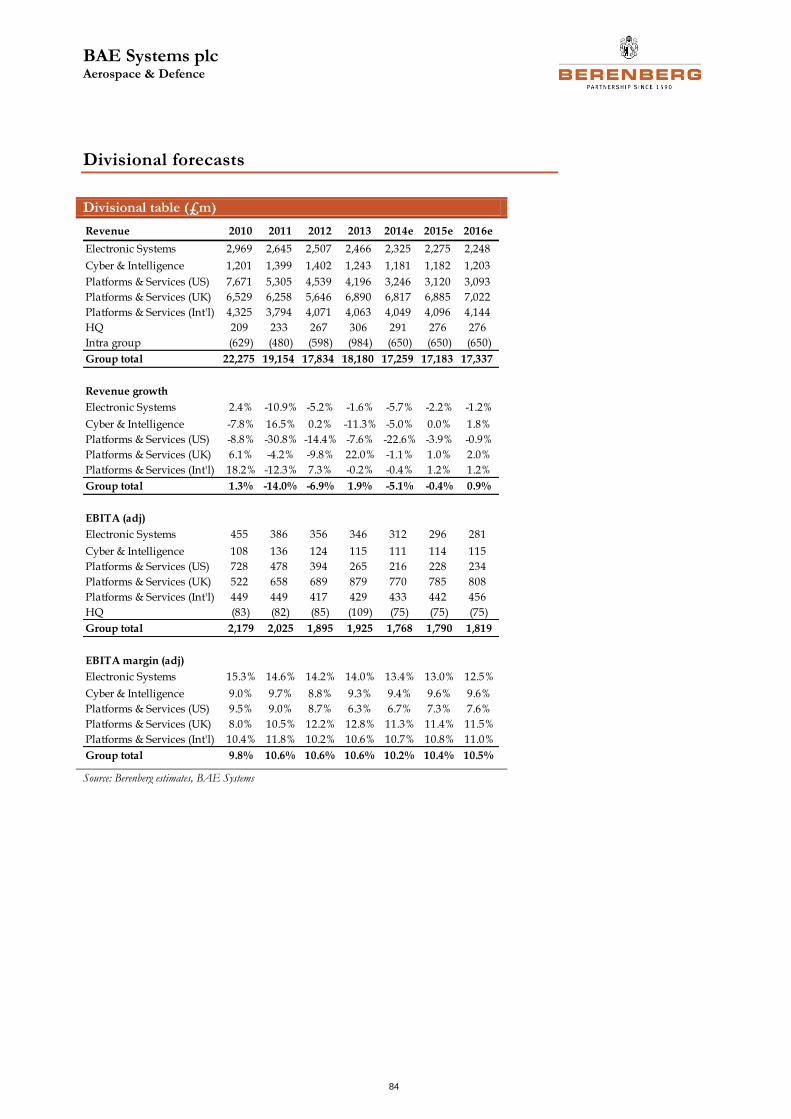
BAE Systems plc Aerospace & Defence
84
Divisional forecasts
Divisional table (£m)
Source: Berenberg estimates, BAE Systems
Revenue 2010 2011 2012 2013 2014e 2015e 2016e
Electronic Systems 2,969 2,645 2,507 2,466 2,325 2,275 2,248
Cyber & Intelligence 1,201 1,399 1,402 1,243 1,181 1,182 1,203
Platforms & Services (US) 7,671 5,305 4,539 4,196 3,246 3,120 3,093
Platforms & Services (UK) 6,529 6,258 5,646 6,890 6,817 6,885 7,022
Platforms & Services (Int'l) 4,325 3,794 4,071 4,063 4,049 4,096 4,144
HQ 209 233 267 306 291 276 276
Intra group (629) (480) (598) (984) (650) (650) (650)
Group total 22,275 19,154 17,834 18,180 17,259 17,183 17,337
Revenue growth
Electronic Systems 2.4% -10.9% -5.2% -1.6% -5.7% -2.2% -1.2%
Cyber & Intelligence -7.8% 16.5% 0.2% -11.3% -5.0% 0.0% 1.8%
Platforms & Services (US) -8.8% -30.8% -14.4% -7.6% -22.6% -3.9% -0.9%
Platforms & Services (UK) 6.1% -4.2% -9.8% 22.0% -1.1% 1.0% 2.0%
Platforms & Services (Int'l) 18.2% -12.3% 7.3% -0.2% -0.4% 1.2% 1.2%
Group total 1.3% -14.0% -6.9% 1.9% -5.1% -0.4% 0.9%
EBITA (adj)
Electronic Systems 455 386 356 346 312 296 281
Cyber & Intelligence 108 136 124 115 111 114 115
Platforms & Services (US) 728 478 394 265 216 228 234
Platforms & Services (UK) 522 658 689 879 770 785 808
Platforms & Services (Int'l) 449 449 417 429 433 442 456
HQ (83) (82) (85) (109) (75) (75) (75)
Group total 2,179 2,025 1,895 1,925 1,768 1,790 1,819
EBITA margin (adj)
Electronic Systems 15.3% 14.6% 14.2% 14.0% 13.4% 13.0% 12.5%
Cyber & Intelligence 9.0% 9.7% 8.8% 9.3% 9.4% 9.6% 9.6%
Platforms & Services (US) 9.5% 9.0% 8.7% 6.3% 6.7% 7.3% 7.6%
Platforms & Services (UK) 8.0% 10.5% 12.2% 12.8% 11.3% 11.4% 11.5%
Platforms & Services (Int'l) 10.4% 11.8% 10.2% 10.6% 10.7% 10.8% 11.0%
Group total 9.8% 10.6% 10.6% 10.6% 10.2% 10.4% 10.5%
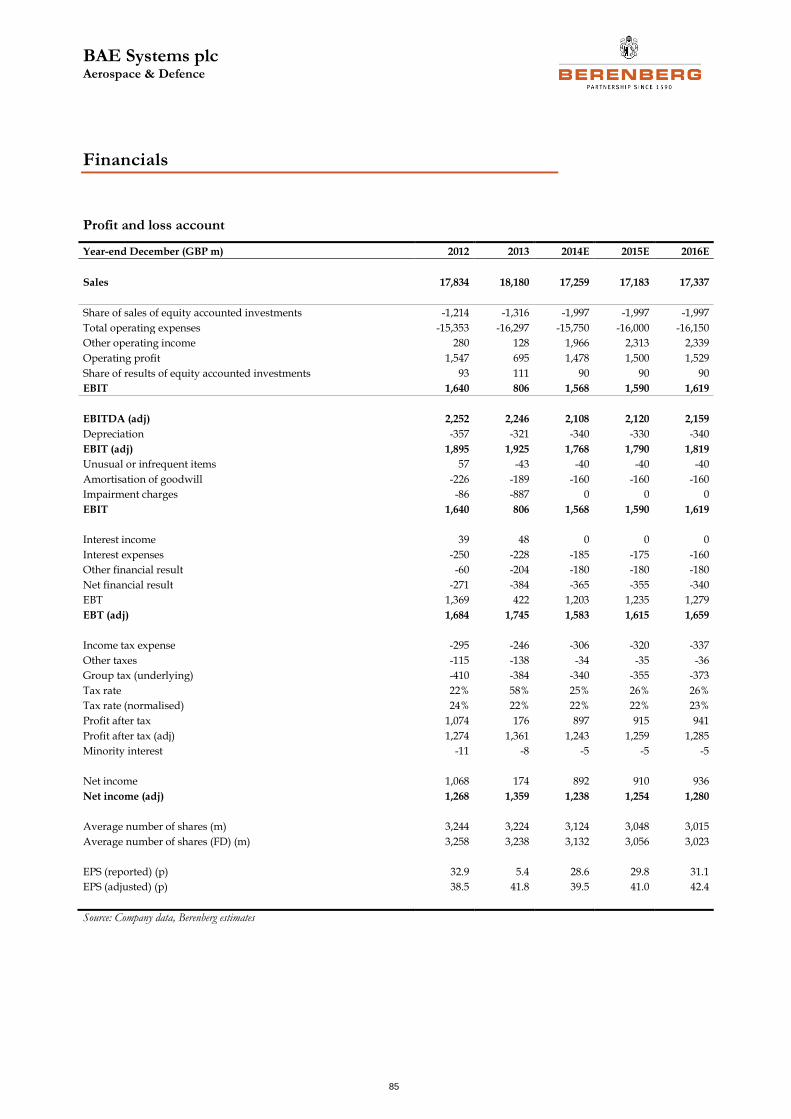
BAE Systems plc Aerospace & Defence
85
Financials
Profit and loss account
Year-end December (GBP m) 2012 2013 2014E 2015E 2016E
Sales 17,834 18,180 17,259 17,183 17,337
Share of sales of equity accounted investments -1,214 -1,316 -1,997 -1,997 -1,997
Total operating expenses -15,353 -16,297 -15,750 -16,000 -16,150
Other operating income 280 128 1,966 2,313 2,339
Operating profit 1,547 695 1,478 1,500 1,529
Share of results of equity accounted investments 93 111 90 90 90
EBIT 1,640 806 1,568 1,590 1,619
EBITDA (adj) 2,252 2,246 2,108 2,120 2,159
Depreciation -357 -321 -340 -330 -340
EBIT (adj) 1,895 1,925 1,768 1,790 1,819
Unusual or infrequent items 57 -43 -40 -40 -40
Amortisation of goodwill -226 -189 -160 -160 -160
Impairment charges -86 -887 0 0 0
EBIT 1,640 806 1,568 1,590 1,619
Interest income 39 48 0 0 0
Interest expenses -250 -228 -185 -175 -160
Other financial result -60 -204 -180 -180 -180
Net financial result -271 -384 -365 -355 -340
EBT 1,369 422 1,203 1,235 1,279
EBT (adj) 1,684 1,745 1,583 1,615 1,659
Income tax expense -295 -246 -306 -320 -337
Other taxes -115 -138 -34 -35 -36
Group tax (underlying) -410 -384 -340 -355 -373
Tax rate 22% 58% 25% 26% 26%
Tax rate (normalised) 24% 22% 22% 22% 23%
Profit after tax 1,074 176 897 915 941
Profit after tax (adj) 1,274 1,361 1,243 1,259 1,285
Minority interest -11 -8 -5 -5 -5
Net income 1,068 174 892 910 936
Net income (adj) 1,268 1,359 1,238 1,254 1,280
Average number of shares (m) 3,244 3,224 3,124 3,048 3,015
Average number of shares (FD) (m) 3,258 3,238 3,132 3,056 3,023
EPS (reported) (p) 32.9 5.4 28.6 29.8 31.1
EPS (adjusted) (p) 38.5 41.8 39.5 41.0 42.4
Source: Company data, Berenberg estimates
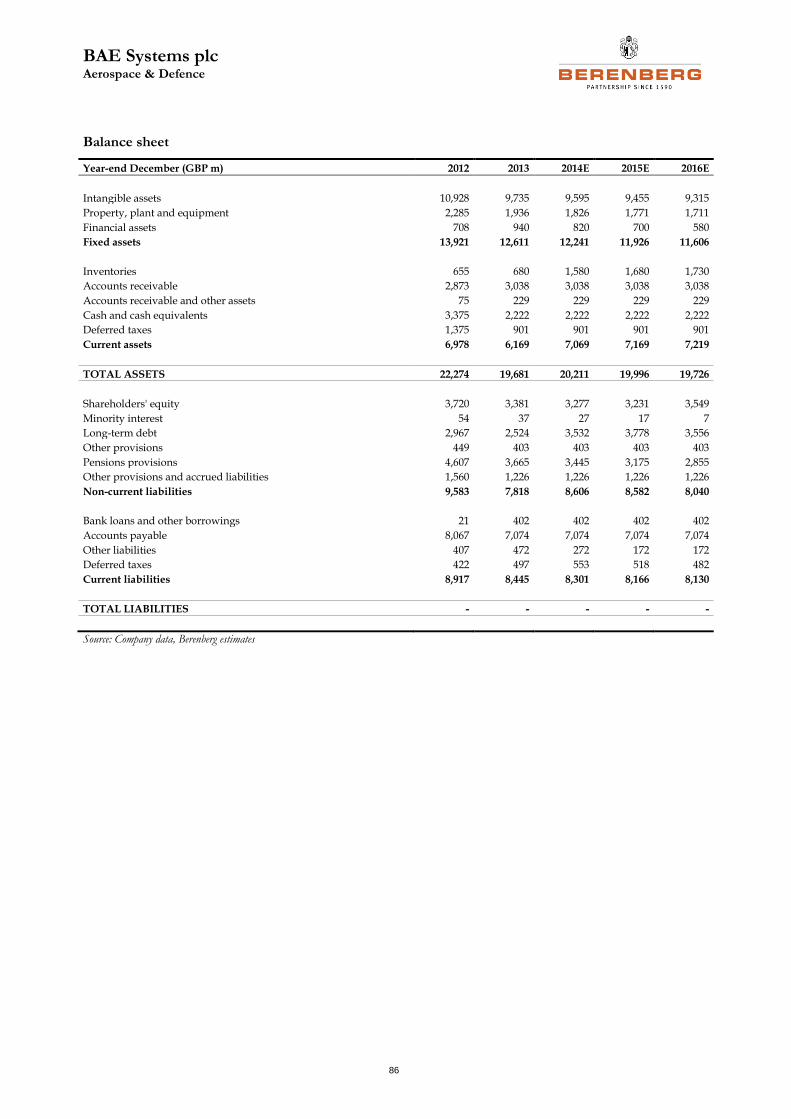
BAE Systems plc Aerospace & Defence
86
Balance sheet
Year-end December (GBP m) 2012 2013 2014E 2015E 2016E
Intangible assets 10,928 9,735 9,595 9,455 9,315
Property, plant and equipment 2,285 1,936 1,826 1,771 1,711
Financial assets 708 940 820 700 580
Fixed assets 13,921 12,611 12,241 11,926 11,606
Inventories 655 680 1,580 1,680 1,730
Accounts receivable 2,873 3,038 3,038 3,038 3,038
Accounts receivable and other assets 75 229 229 229 229
Cash and cash equivalents 3,375 2,222 2,222 2,222 2,222
Deferred taxes 1,375 901 901 901 901
Current assets 6,978 6,169 7,069 7,169 7,219
TOTAL ASSETS 22,274 19,681 20,211 19,996 19,726
Shareholders' equity 3,720 3,381 3,277 3,231 3,549
Minority interest 54 37 27 17 7
Long-term debt 2,967 2,524 3,532 3,778 3,556
Other provisions 449 403 403 403 403
Pensions provisions 4,607 3,665 3,445 3,175 2,855
Other provisions and accrued liabilities 1,560 1,226 1,226 1,226 1,226
Non-current liabilities 9,583 7,818 8,606 8,582 8,040
Bank loans and other borrowings 21 402 402 402 402
Accounts payable 8,067 7,074 7,074 7,074 7,074
Other liabilities 407 472 272 172 172
Deferred taxes 422 497 553 518 482
Current liabilities 8,917 8,445 8,301 8,166 8,130
TOTAL LIABILITIES - - - - -
Source: Company data, Berenberg estimates
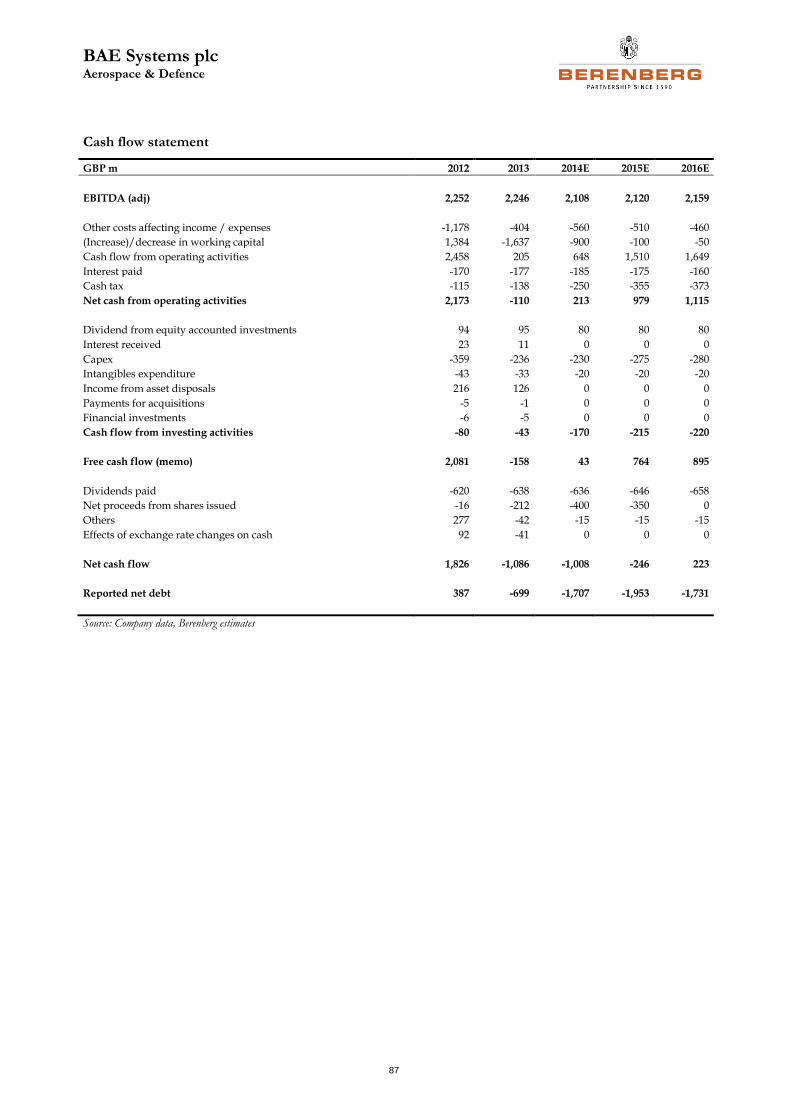
BAE Systems plc Aerospace & Defence
87
Cash flow statement
GBP m 2012 2013 2014E 2015E 2016E
EBITDA (adj) 2,252 2,246 2,108 2,120 2,159
Other costs affecting income / expenses -1,178 -404 -560 -510 -460
(Increase)/decrease in working capital 1,384 -1,637 -900 -100 -50
Cash flow from operating activities 2,458 205 648 1,510 1,649
Interest paid -170 -177 -185 -175 -160
Cash tax -115 -138 -250 -355 -373
Net cash from operating activities 2,173 -110 213 979 1,115
Dividend from equity accounted investments 94 95 80 80 80
Interest received 23 11 0 0 0
Capex -359 -236 -230 -275 -280
Intangibles expenditure -43 -33 -20 -20 -20
Income from asset disposals 216 126 0 0 0
Payments for acquisitions -5 -1 0 0 0
Financial investments -6 -5 0 0 0
Cash flow from investing activities -80 -43 -170 -215 -220
Free cash flow (memo) 2,081 -158 43 764 895
Dividends paid -620 -638 -636 -646 -658
Net proceeds from shares issued -16 -212 -400 -350 0
Others 277 -42 -15 -15 -15
Effects of exchange rate changes on cash 92 -41 0 0 0
Net cash flow 1,826 -1,086 -1,008 -246 223
Reported net debt 387 -699 -1,707 -1,953 -1,731
Source: Company data, Berenberg estimates
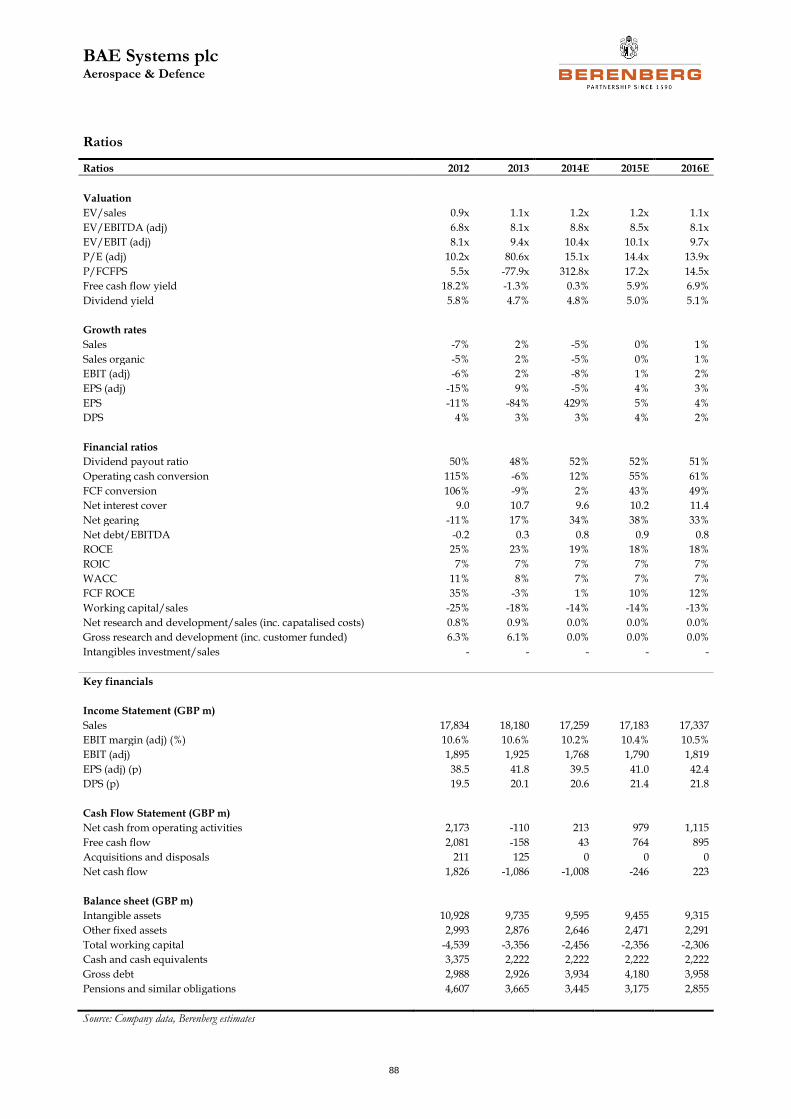
BAE Systems plc Aerospace & Defence
88
Ratios
Ratios 2012 2013 2014E 2015E 2016E
Valuation
EV/sales 0.9x 1.1x 1.2x 1.2x 1.1x
EV/EBITDA (adj) 6.8x 8.1x 8.8x 8.5x 8.1x
EV/EBIT (adj) 8.1x 9.4x 10.4x 10.1x 9.7x
P/E (adj) 10.2x 80.6x 15.1x 14.4x 13.9x
P/FCFPS 5.5x -77.9x 312.8x 17.2x 14.5x
Free cash flow yield 18.2% -1.3% 0.3% 5.9% 6.9%
Dividend yield 5.8% 4.7% 4.8% 5.0% 5.1%
Growth rates
Sales -7% 2% -5% 0% 1%
Sales organic -5% 2% -5% 0% 1%
EBIT (adj) -6% 2% -8% 1% 2%
EPS (adj) -15% 9% -5% 4% 3%
EPS -11% -84% 429% 5% 4%
DPS 4% 3% 3% 4% 2%
Financial ratios
Dividend payout ratio 50% 48% 52% 52% 51%
Operating cash conversion 115% -6% 12% 55% 61%
FCF conversion 106% -9% 2% 43% 49%
Net interest cover 9.0 10.7 9.6 10.2 11.4
Net gearing -11% 17% 34% 38% 33%
Net debt/EBITDA -0.2 0.3 0.8 0.9 0.8
ROCE 25% 23% 19% 18% 18%
ROIC 7% 7% 7% 7% 7%
WACC 11% 8% 7% 7% 7%
FCF ROCE 35% -3% 1% 10% 12%
Working capital/sales -25% -18% -14% -14% -13%
Net research and development/sales (inc. capatalised costs) 0.8% 0.9% 0.0% 0.0% 0.0%
Gross research and development (inc. customer funded) 6.3% 6.1% 0.0% 0.0% 0.0%
Intangibles investment/sales - - - - -
Key financials
Income Statement (GBP m)
Sales 17,834 18,180 17,259 17,183 17,337
EBIT margin (adj) (%) 10.6% 10.6% 10.2% 10.4% 10.5%
EBIT (adj) 1,895 1,925 1,768 1,790 1,819
EPS (adj) (p) 38.5 41.8 39.5 41.0 42.4
DPS (p) 19.5 20.1 20.6 21.4 21.8
Cash Flow Statement (GBP m)
Net cash from operating activities 2,173 -110 213 979 1,115
Free cash flow 2,081 -158 43 764 895
Acquisitions and disposals 211 125 0 0 0
Net cash flow 1,826 -1,086 -1,008 -246 223
Balance sheet (GBP m)
Intangible assets 10,928 9,735 9,595 9,455 9,315
Other fixed assets 2,993 2,876 2,646 2,471 2,291
Total working capital -4,539 -3,356 -2,456 -2,356 -2,306
Cash and cash equivalents 3,375 2,222 2,222 2,222 2,222
Gross debt 2,988 2,926 3,934 4,180 3,958
Pensions and similar obligations 4,607 3,665 3,445 3,175 2,855
Source: Company data, Berenberg estimates
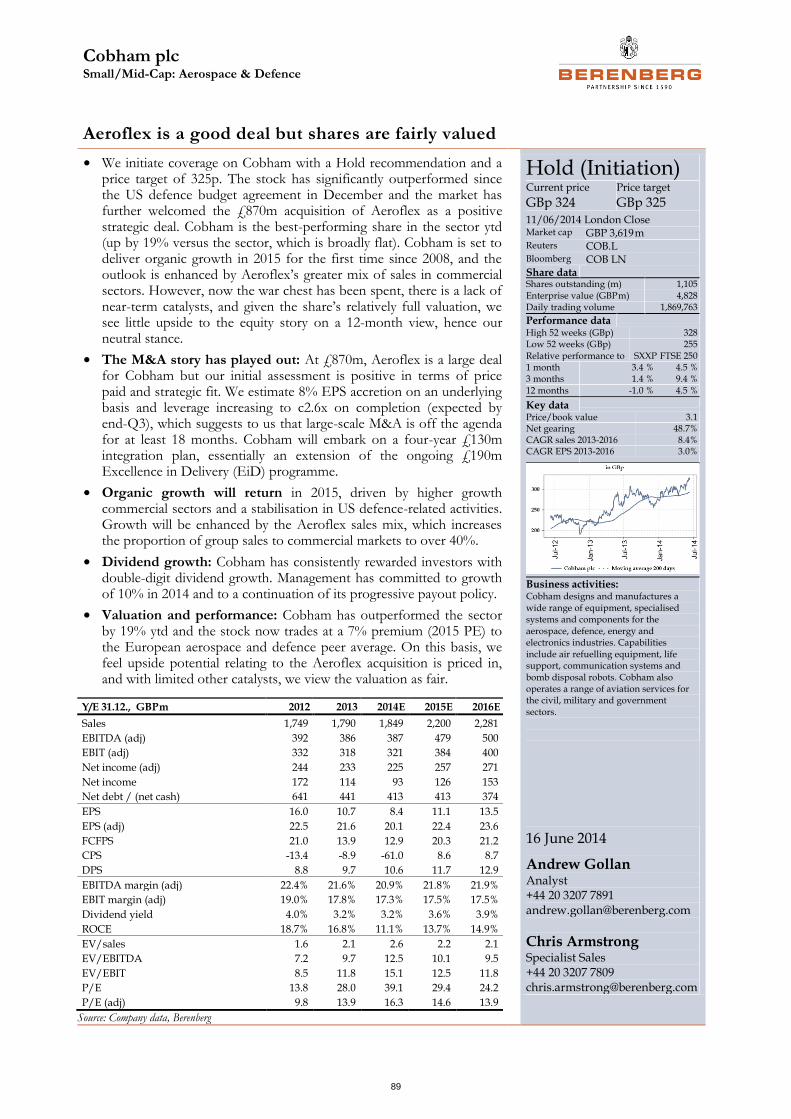
Cobham plc Small/Mid-Cap: Aerospace & Defence
89
Aeroflex is a good deal but shares are fairly valued
• We initiate coverage on Cobham with a Hold recommendation and a price target of 325p. The stock has significantly outperformed since the US defence budget agreement in December and the market has further welcomed the £870m acquisition of Aeroflex as a positive strategic deal. Cobham is the best-performing share in the sector ytd (up by 19% versus the sector, which is broadly flat). Cobham is set to deliver organic growth in 2015 for the first time since 2008, and the outlook is enhanced by Aeroflex’s greater mix of sales in commercial sectors. However, now the war chest has been spent, there is a lack of near-term catalysts, and given the share’s relatively full valuation, we see little upside to the equity story on a 12-month view, hence our neutral stance.
• The M&A story has played out: At £870m, Aeroflex is a large deal for Cobham but our initial assessment is positive in terms of price paid and strategic fit. We estimate 8% EPS accretion on an underlying basis and leverage increasing to c2.6x on completion (expected by end-Q3), which suggests to us that large-scale M&A is off the agenda for at least 18 months. Cobham will embark on a four-year £130m integration plan, essentially an extension of the ongoing £190m Excellence in Delivery (EiD) programme.
• Organic growth will return in 2015, driven by higher growth commercial sectors and a stabilisation in US defence-related activities. Growth will be enhanced by the Aeroflex sales mix, which increases the proportion of group sales to commercial markets to over 40%.
• Dividend growth: Cobham has consistently rewarded investors with double-digit dividend growth. Management has committed to growth of 10% in 2014 and to a continuation of its progressive payout policy.
• Valuation and performance: Cobham has outperformed the sector by 19% ytd and the stock now trades at a 7% premium (2015 PE) to the European aerospace and defence peer average. On this basis, we feel upside potential relating to the Aeroflex acquisition is priced in, and with limited other catalysts, we view the valuation as fair.
Hold (Initiation) Current price
GBp 324 Price target
GBp 325 11/06/2014 London Close Market cap GBP 3,619 m Reuters COB.L Bloomberg COB LN Share data
Shares outstanding (m) 1,105 Enterprise value (GBP m) 4,828 Daily trading volume 1,869,763
Performance data
High 52 weeks (GBp) 328 Low 52 weeks (GBp) 255
Relative performance to SXXP FTSE 250 1 month 3.4 % 4.5 % 3 months 1.4 % 9.4 % 12 months -1.0 % 4.5 %
Key data
Price/book value 3.1 Net gearing 48.7% CAGR sales 2013-2016 8.4% CAGR EPS 2013-2016 3.0%
Business activities: Cobham designs and manufactures a wide range of equipment, specialised systems and components for the aerospace, defence, energy and electronics industries. Capabilities include air refuelling equipment, life support, communication systems and bomb disposal robots. Cobham also operates a range of aviation services for the civil, military and government sectors.
16 June 2014
Andrew Gollan Analyst +44 20 3207 7891 [email protected]
Chris Armstrong
Specialist Sales +44 20 3207 7809 [email protected]
Y/E 31.12., GBP m 2012 2013 2014E 2015E 2016E
Sales 1,749 1,790 1,849 2,200 2,281
EBITDA (adj) 392 386 387 479 500
EBIT (adj) 332 318 321 384 400
Net income (adj) 244 233 225 257 271
Net income 172 114 93 126 153
Net debt / (net cash) 641 441 413 413 374
EPS 16.0 10.7 8.4 11.1 13.5
EPS (adj) 22.5 21.6 20.1 22.4 23.6
FCFPS 21.0 13.9 12.9 20.3 21.2
CPS -13.4 -8.9 -61.0 8.6 8.7
DPS 8.8 9.7 10.6 11.7 12.9
EBITDA margin (adj) 22.4% 21.6% 20.9% 21.8% 21.9%
EBIT margin (adj) 19.0% 17.8% 17.3% 17.5% 17.5%
Dividend yield 4.0% 3.2% 3.2% 3.6% 3.9%
ROCE 18.7% 16.8% 11.1% 13.7% 14.9%
EV/sales 1.6 2.1 2.6 2.2 2.1
EV/EBITDA 7.2 9.7 12.5 10.1 9.5
EV/EBIT 8.5 11.8 15.1 12.5 11.8
P/E 13.8 28.0 39.1 29.4 24.2
P/E (adj) 9.8 13.9 16.3 14.6 13.9
Source: Company data, Berenberg
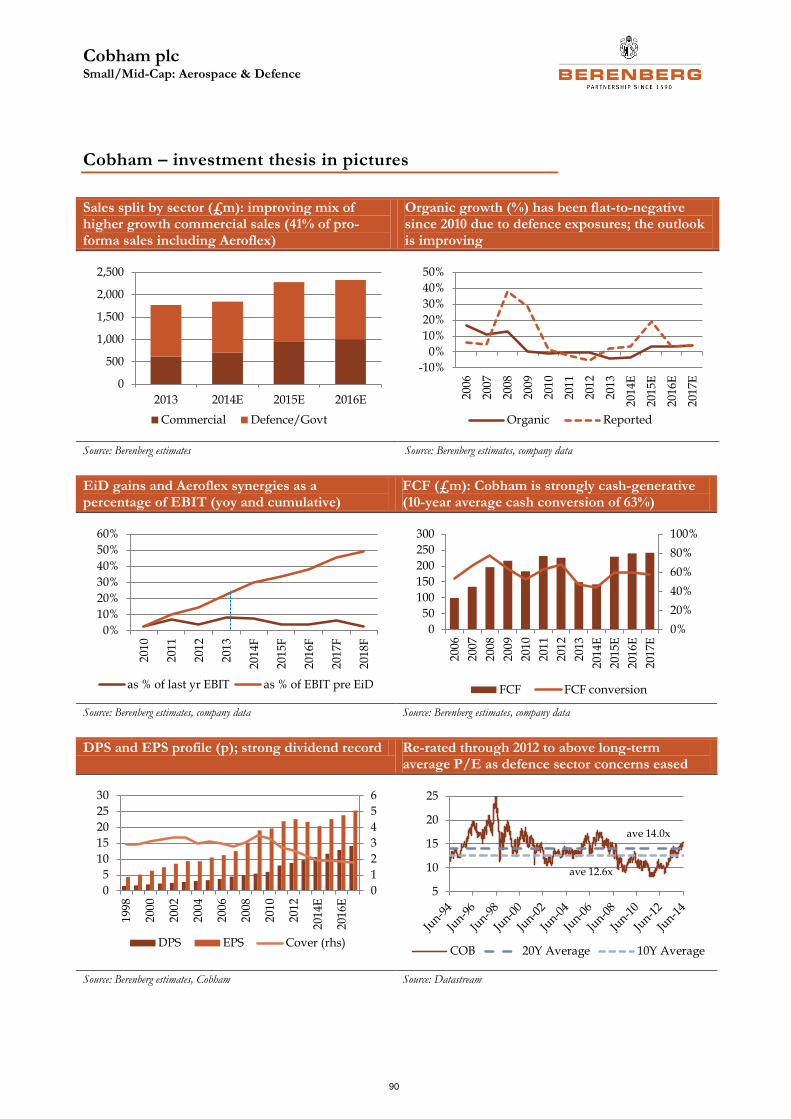
Cobham plc Small/Mid-Cap: Aerospace & Defence
90
Cobham – investment thesis in pictures
Sales split by sector (£m): improving mix of higher growth commercial sales (41% of pro-forma sales including Aeroflex)
Organic growth (%) has been flat-to-negative since 2010 due to defence exposures; the outlook is improving
Source: Berenberg estimates Source: Berenberg estimates, company data
EiD gains and Aeroflex synergies as a percentage of EBIT (yoy and cumulative)
FCF (£m): Cobham is strongly cash-generative (10-year average cash conversion of 63%)
Source: Berenberg estimates, company data Source: Berenberg estimates, company data
DPS and EPS profile (p); strong dividend record Re-rated through 2012 to above long-term average P/E as defence sector concerns eased
Source: Berenberg estimates, Cobham Source: Datastream
0
500
1,000
1,500
2,000
2,500
2013 2014E 2015E 2016E
Commercial Defence/Govt
-10%
0%
10%
20%
30%
40%
50%
200
6
200
7
200
8
200
9
201
0
201
1
201
2
201
3
201
4E
201
5E
201
6E
201
7E
Organic Reported
0%
10%
20%
30%
40%
50%
60%
201
0
201
1
201
2
201
3
201
4F
201
5F
201
6F
201
7F
201
8F
as % of last yr EBIT as % of EBIT pre EiD
0%
20%
40%
60%
80%
100%
0
50
100
150
200
250
300
200
6
200
7
200
8
200
9
201
0
201
1
201
2
201
3
201
4E
201
5E
201
6E
201
7E
FCF FCF conversion
0
1
2
3
4
5
6
0
5
10
15
20
25
30
199
8
200
0
200
2
200
4
200
6
200
8
201
0
201
2
201
4E
201
6E
DPS EPS Cover (rhs)
5
10
15
20
25
COB 20Y Average 10Y Average
ave 14.0x
ave 12.6x
Cobham plc Small/Mid-Cap: Aerospace & Defence
91
Cobham – investment thesis
What’s new? We initiate coverage on Cobham with a Hold rating and a 325p price target, implying 0% upside.
Two-minute summary: Our initial assessment of the strategic rationale for acquiring Aeroflex, a US specialist microelectronics and testing business, is positive. Aeroflex is highly complementary from both a technology and customer perspective and further broadens the group’s exposure to higher growth commercial sectors to over 40% of sales. In completing this £870m acquisition, Cobham’s largest-ever, the M&A war chest has been spent, implying to us that further upside for investors is limited to the potential for sales synergies from the enlarged group. We think this is eminently possible, but with completion of the deal not expected until Q314, it will take time to digest and drive the revenue opportunity, in our view. Cobham is the best-performing share in the sector on a ytd basis (+19%), despite c3% consensus FY14 EPS downgrades, resulting in a premium 12-month forward P/E rating of 15.4x, which compares to the sector average of 13.7x. This relatively full valuation and lack of near-term catalysts compels us to take a neutral stance on the share.
Key investment point one: low organic growth and margin squeeze but the outlook is improving
Cobham has not delivered positive organic growth since 2008. 2014 will be another year of declines, although headwinds are easing in the core US defence sector and with the addition of Aeroflex, higher growth commercial activities will represent over 40% sales. Management is confident of a return to mid-single-digit organic growth in 2015, now enhanced by the Aeroflex sales mix. We forecast slightly lower organic growth of 3.3% rising to 4.0% in 2016. At the profit level, benefits from the six-year EiD improvement programme continue to sustain margins and we applaud progress made to-date, which in financial terms translates to £76m annualised benefits and which is expected to rise to £105m pa by 2015. Integration, reorganisation and improvement of Aeroflex will kick-start another c£130m of multi-year, EiD-esque investment, taking the total spend of these programmes to over £300m for an annual benefit of £155m. This has been required to improve competitiveness, sustain margins in a continually pressured defence environment and ultimately to drive future growth opportunities. In summary, it is encouraging to see organic growth returning, enhanced by the Aeroflex acquisition, and despite the cost of EiD, Cobham is a fundamentally improved business, better organised and positioned for when cyclical pressures ease.
Key investment point two: the M&A card has been played:
Acquisitions are a key element of the growth strategy as evidenced by the £870m Aeroflex deal, Cobham’s largest-ever, and which takes total expenditure over the last 15 years to almost £3bn on over 50 acquisitions. Aeroflex is a provider of specialist electronic technologies in the communications and wireless sector, and appears to us to be an excellent strategic fit, both from a technology and customer perspective. Integration costs are high, however, as previously mentioned, but on an underlying basis, we estimate the transaction is 8% earnings-accretive in 2015 and increases pro-forma balance sheet leverage to 2.6x, which should fall to c2.2x by the end of 2015. On this basis, we conclude that large-scale M&A will be off the agenda for at least 18 months, limiting upside (or indeed downside) to deal execution, integration and potential sales synergies.
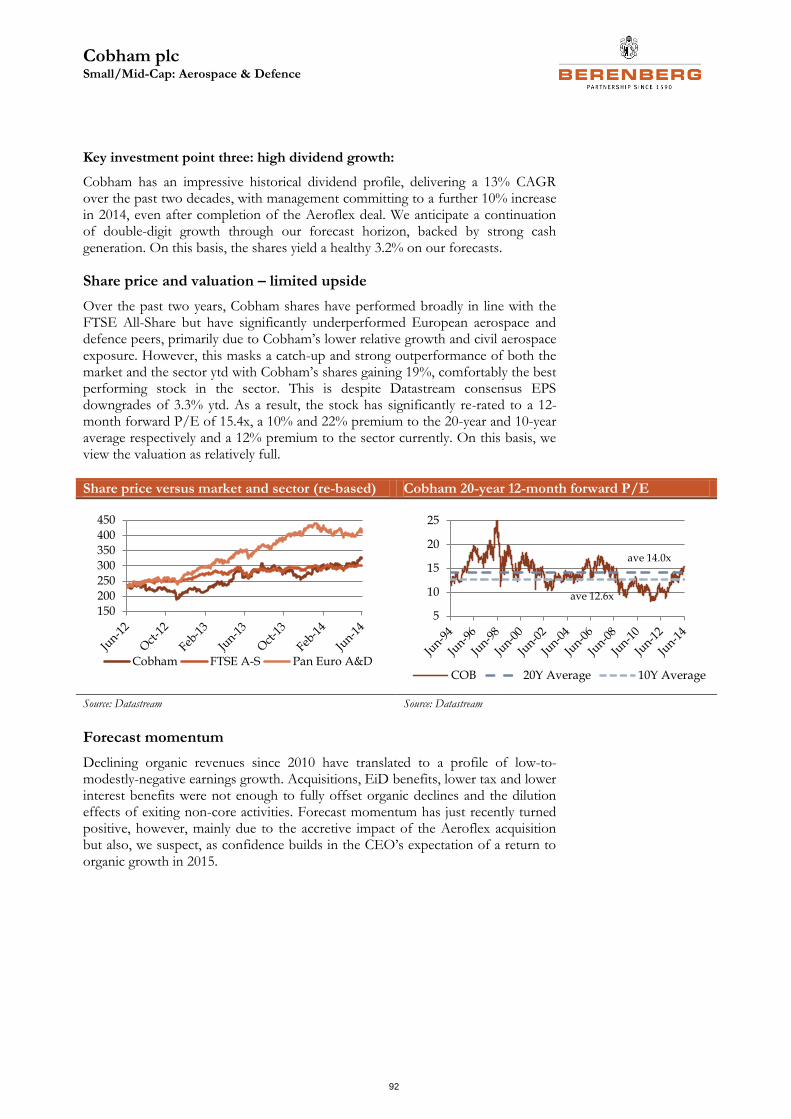
Cobham plc Small/Mid-Cap: Aerospace & Defence
92
Key investment point three: high dividend growth:
Cobham has an impressive historical dividend profile, delivering a 13% CAGR over the past two decades, with management committing to a further 10% increase in 2014, even after completion of the Aeroflex deal. We anticipate a continuation of double-digit growth through our forecast horizon, backed by strong cash generation. On this basis, the shares yield a healthy 3.2% on our forecasts.
Share price and valuation – limited upside
Over the past two years, Cobham shares have performed broadly in line with the FTSE All-Share but have significantly underperformed European aerospace and defence peers, primarily due to Cobham’s lower relative growth and civil aerospace exposure. However, this masks a catch-up and strong outperformance of both the market and the sector ytd with Cobham’s shares gaining 19%, comfortably the best performing stock in the sector. This is despite Datastream consensus EPS downgrades of 3.3% ytd. As a result, the stock has significantly re-rated to a 12-month forward P/E of 15.4x, a 10% and 22% premium to the 20-year and 10-year average respectively and a 12% premium to the sector currently. On this basis, we view the valuation as relatively full.
Share price versus market and sector (re-based) Cobham 20-year 12-month forward P/E
Source: Datastream Source: Datastream
Forecast momentum
Declining organic revenues since 2010 have translated to a profile of low-to-modestly-negative earnings growth. Acquisitions, EiD benefits, lower tax and lower interest benefits were not enough to fully offset organic declines and the dilution effects of exiting non-core activities. Forecast momentum has just recently turned positive, however, mainly due to the accretive impact of the Aeroflex acquisition but also, we suspect, as confidence builds in the CEO’s expectation of a return to organic growth in 2015.
150
200
250
300
350
400
450
Cobham FTSE A-S Pan Euro A&D
5
10
15
20
25
COB 20Y Average 10Y Average
ave 14.0x
ave 12.6x
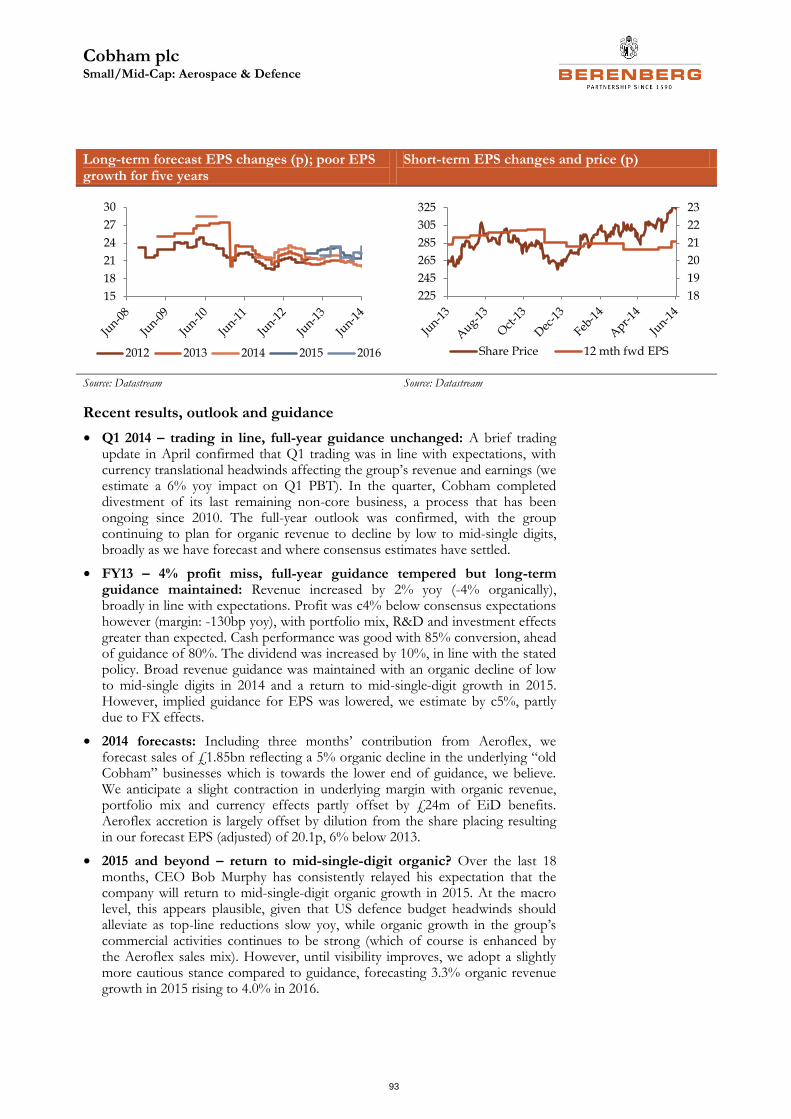
Cobham plc Small/Mid-Cap: Aerospace & Defence
93
Long-term forecast EPS changes (p); poor EPS growth for five years
Short-term EPS changes and price (p)
Source: Datastream Source: Datastream
Recent results, outlook and guidance
• Q1 2014 – trading in line, full-year guidance unchanged: A brief trading update in April confirmed that Q1 trading was in line with expectations, with currency translational headwinds affecting the group’s revenue and earnings (we estimate a 6% yoy impact on Q1 PBT). In the quarter, Cobham completed divestment of its last remaining non-core business, a process that has been ongoing since 2010. The full-year outlook was confirmed, with the group continuing to plan for organic revenue to decline by low to mid-single digits, broadly as we have forecast and where consensus estimates have settled.
• FY13 – 4% profit miss, full-year guidance tempered but long-term guidance maintained: Revenue increased by 2% yoy (-4% organically), broadly in line with expectations. Profit was c4% below consensus expectations however (margin: -130bp yoy), with portfolio mix, R&D and investment effects greater than expected. Cash performance was good with 85% conversion, ahead of guidance of 80%. The dividend was increased by 10%, in line with the stated policy. Broad revenue guidance was maintained with an organic decline of low to mid-single digits in 2014 and a return to mid-single-digit growth in 2015. However, implied guidance for EPS was lowered, we estimate by c5%, partly due to FX effects.
• 2014 forecasts: Including three months’ contribution from Aeroflex, we forecast sales of £1.85bn reflecting a 5% organic decline in the underlying “old Cobham” businesses which is towards the lower end of guidance, we believe. We anticipate a slight contraction in underlying margin with organic revenue, portfolio mix and currency effects partly offset by £24m of EiD benefits. Aeroflex accretion is largely offset by dilution from the share placing resulting in our forecast EPS (adjusted) of 20.1p, 6% below 2013.
• 2015 and beyond – return to mid-single-digit organic? Over the last 18 months, CEO Bob Murphy has consistently relayed his expectation that the company will return to mid-single-digit organic growth in 2015. At the macro level, this appears plausible, given that US defence budget headwinds should alleviate as top-line reductions slow yoy, while organic growth in the group’s commercial activities continues to be strong (which of course is enhanced by the Aeroflex sales mix). However, until visibility improves, we adopt a slightly more cautious stance compared to guidance, forecasting 3.3% organic revenue growth in 2015 rising to 4.0% in 2016.
15
18
21
24
27
30
2012 2013 2014 2015 2016
18
19
20
21
22
23
225
245
265
285
305
325
Share Price 12 mth fwd EPS
Cobham plc Small/Mid-Cap: Aerospace & Defence
94
Investment risks and concerns
• High restructuring charges: The EiD operational improvement programme has been running for three and a half years, with £156m associated costs incurred to date and another £35m still to go (over 18 months), reported as exceptional charges. Through integration of the Aeroflex acquisition, the programme is soon to be materially extended; the company has guided to a further c£130m investment in restructuring over the next four years or so, taking the total investment including EiD to over £300m. We applaud the scale of cost reductions and the fundamental improvements in the group’s operating structures achieved so far, all of which are reported in underlying performance, while costs are treated as exceptional. Treatment of multi-year charges as one-off in nature can be argued as reasonable in our view given that EiD and now Aeroflex are such large and defined programmes, although historically we note that Cobham has frequently incurred restructuring charges that are reported below the line.
• M&A/integration risk: Now that Cobham is in the process of acquiring Aeroflex for £870m, we consider that meaningful M&A will be off the agenda for at least 18 months. We have faith in Cobham’s rigorous M&A assessment processes in terms of targeting strategic, value-creative deals but, as previously indicated, the integration of a business the size of Aeroflex will be complex and time-consuming. In short, integration risk is inherently higher on this, Cobham’s latest deal.
• US defence headwinds to persist: Including Aeroflex, we estimate direct sales exposure to US defence and security spending will be around 34% (37% previously). The two-year US Department of Defense’s (DoD) budget agreement reduces near-term uncertainty, but beyond 2015 we suspect downward pressure will persist as spending caps of the Budget Control Act of 2011 (BCA) come into play and the prospect of sequestration looms again. However, we understand that Cobham, in common with most other defence companies that operate in the US market, is planning conservatively and to a base-case scenario that assumes BCA spending caps are the most likely outcome.
• Programme risk: Delays to new military equipment programmes could affect growth projection if delayed further. In particular, we look to increasing activity on the US KC-46 tanker and F-35 fighter aircraft programmes to phase with reductions in Cobham’s existing high shipset programmes such as the F/A18, the F16 and the C130J. Risk is mitigated by the US DoD classification of these new programmes as high priority, backed up with defined funding lines.
• FX: Transaction currency risk is mostly hedged c18 months forward for costs or revenues that are not in the underlying functional currency. Average hedge rates are modestly positive over the next few years. The company’s sensitivity to currency translation risk, principally the US dollar and Australian dollar, is that a 10c move (c6%) equates to a c£10m impact on PBT (c3%). We assume that spot rates will remain at the same level for the rest of the year and hence factor a £12m, or 4%, profit headwind into our forecasts. Net debt sensitivity is £30m per 10c move, which we also factor into our estimates.
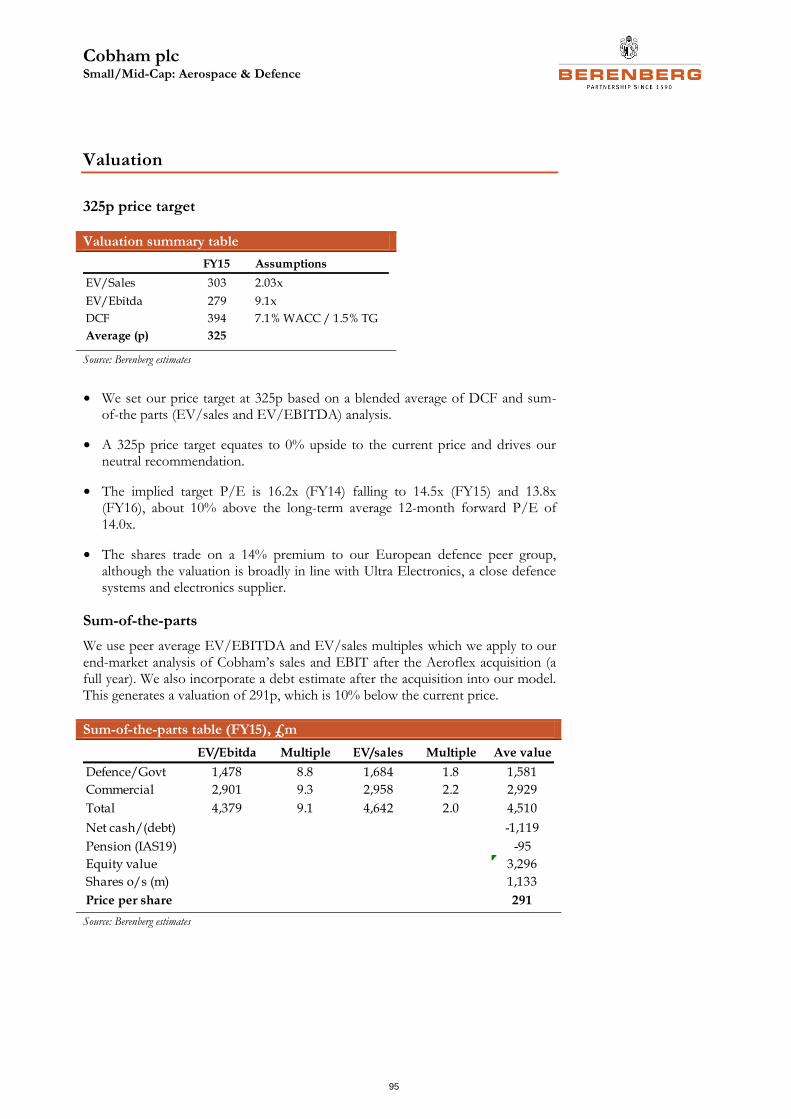
Cobham plc Small/Mid-Cap: Aerospace & Defence
95
Valuation
325p price target
Valuation summary table
Source: Berenberg estimates
• We set our price target at 325p based on a blended average of DCF and sum-of-the parts (EV/sales and EV/EBITDA) analysis.
• A 325p price target equates to 0% upside to the current price and drives our neutral recommendation.
• The implied target P/E is 16.2x (FY14) falling to 14.5x (FY15) and 13.8x (FY16), about 10% above the long-term average 12-month forward P/E of 14.0x.
• The shares trade on a 14% premium to our European defence peer group, although the valuation is broadly in line with Ultra Electronics, a close defence systems and electronics supplier.
Sum-of-the-parts
We use peer average EV/EBITDA and EV/sales multiples which we apply to our end-market analysis of Cobham’s sales and EBIT after the Aeroflex acquisition (a full year). We also incorporate a debt estimate after the acquisition into our model. This generates a valuation of 291p, which is 10% below the current price.
Sum-of-the-parts table (FY15), £m
Source: Berenberg estimates
FY15 Assumptions
EV/Sales 303 2.03x
EV/Ebitda 279 9.1x
DCF 394 7.1% WACC / 1.5% TG
Average (p) 325
EV/Ebitda Multiple EV/sales Multiple Ave value
Defence/Govt 1,478 8.8 1,684 1.8 1,581
Commercial 2,901 9.3 2,958 2.2 2,929
Total 4,379 9.1 4,642 2.0 4,510
Net cash/(debt) -1,119
Pension (IAS19) -95
Equity value 3,296
Shares o/s (m) 1,133
Price per share 291
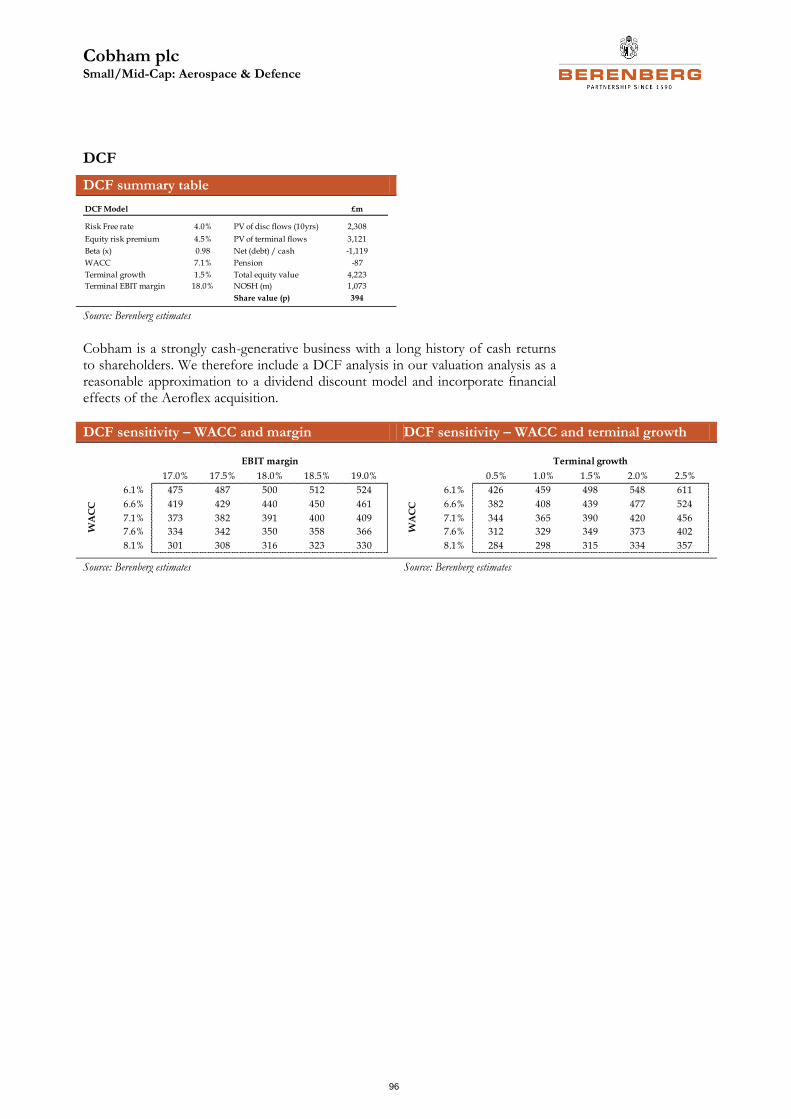
Cobham plc Small/Mid-Cap: Aerospace & Defence
96
DCF
DCF summary table
Source: Berenberg estimates
Cobham is a strongly cash-generative business with a long history of cash returns to shareholders. We therefore include a DCF analysis in our valuation analysis as a reasonable approximation to a dividend discount model and incorporate financial effects of the Aeroflex acquisition.
DCF sensitivity – WACC and margin DCF sensitivity – WACC and terminal growth
Source: Berenberg estimates Source: Berenberg estimates
DCF Model £m
Risk Free rate 4.0% PV of disc flows (10yrs) 2,308
Equity risk premium 4.5% PV of terminal flows 3,121
Beta (x) 0.98 Net (debt) / cash -1,119
WACC 7.1% Pension -87
Terminal growth 1.5% Total equity value 4,223
Terminal EBIT margin 18.0% NOSH (m) 1,073
Share value (p) 394
394 17.0% 17.5% 18.0% 18.5% 19.0%
6.1% 475 487 500 512 524
6.6% 419 429 440 450 461
7.1% 373 382 391 400 409
7.6% 334 342 350 358 366
8.1% 301 308 316 323 330
EBIT margin
WA
CC
394 0.5% 1.0% 1.5% 2.0% 2.5%
6.1% 426 459 498 548 611
6.6% 382 408 439 477 524
7.1% 344 365 390 420 456
7.6% 312 329 349 373 402
8.1% 284 298 315 334 357
Terminal growth
WA
CC
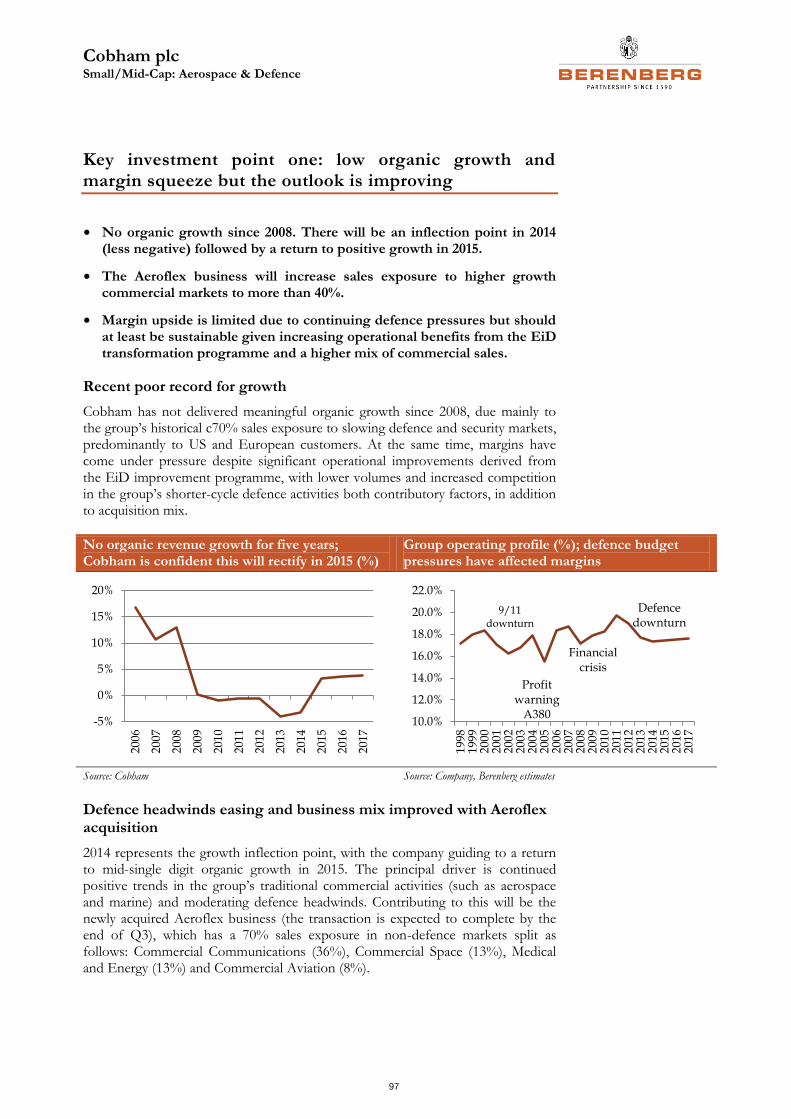
Cobham plc Small/Mid-Cap: Aerospace & Defence
97
Key investment point one: low organic growth and margin squeeze but the outlook is improving
• No organic growth since 2008. There will be an inflection point in 2014 (less negative) followed by a return to positive growth in 2015.
• The Aeroflex business will increase sales exposure to higher growth commercial markets to more than 40%.
• Margin upside is limited due to continuing defence pressures but should at least be sustainable given increasing operational benefits from the EiD transformation programme and a higher mix of commercial sales.
Recent poor record for growth
Cobham has not delivered meaningful organic growth since 2008, due mainly to the group’s historical c70% sales exposure to slowing defence and security markets, predominantly to US and European customers. At the same time, margins have come under pressure despite significant operational improvements derived from the EiD improvement programme, with lower volumes and increased competition in the group’s shorter-cycle defence activities both contributory factors, in addition to acquisition mix.
No organic revenue growth for five years; Cobham is confident this will rectify in 2015 (%)
Group operating profile (%); defence budget pressures have affected margins
Source: Cobham Source: Company, Berenberg estimates
Defence headwinds easing and business mix improved with Aeroflex acquisition
2014 represents the growth inflection point, with the company guiding to a return to mid-single digit organic growth in 2015. The principal driver is continued positive trends in the group’s traditional commercial activities (such as aerospace and marine) and moderating defence headwinds. Contributing to this will be the newly acquired Aeroflex business (the transaction is expected to complete by the end of Q3), which has a 70% sales exposure in non-defence markets split as follows: Commercial Communications (36%), Commercial Space (13%), Medical and Energy (13%) and Commercial Aviation (8%).
-5%
0%
5%
10%
15%
20%
2006
2007
200
8
200
9
201
0
201
1
201
2
201
3
201
4
201
5
201
6
201
7
10.0%
12.0%
14.0%
16.0%
18.0%
20.0%
22.0%
1998
199
92
000
2001
200
22
003
200
42
005
200
62
007
2008
200
92
010
2011
201
22
013
201
42
015
201
62
017
9/11 downturn
Profit warning
A380
Financial crisis
Defence downturn
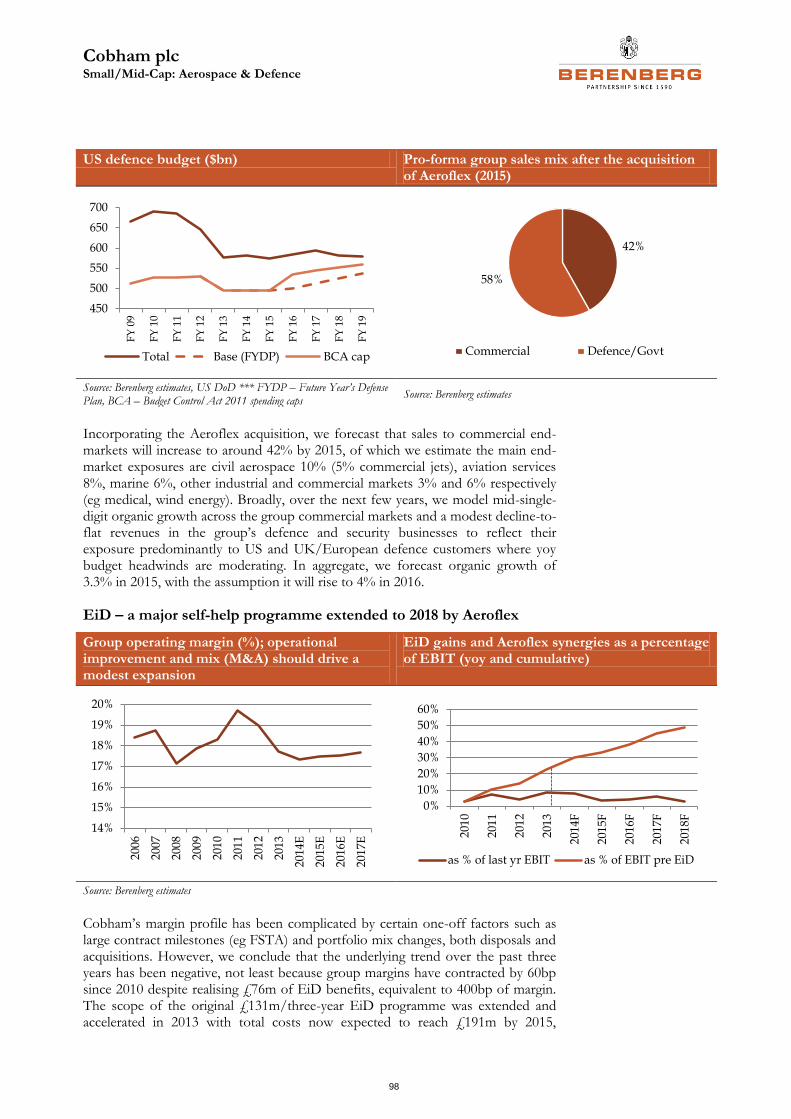
Cobham plc Small/Mid-Cap: Aerospace & Defence
98
US defence budget ($bn) Pro-forma group sales mix after the acquisition of Aeroflex (2015)
Source: Berenberg estimates, US DoD *** FYDP – Future Year’s Defense Plan, BCA – Budget Control Act 2011 spending caps
Source: Berenberg estimates
Incorporating the Aeroflex acquisition, we forecast that sales to commercial end-markets will increase to around 42% by 2015, of which we estimate the main end-market exposures are civil aerospace 10% (5% commercial jets), aviation services 8%, marine 6%, other industrial and commercial markets 3% and 6% respectively (eg medical, wind energy). Broadly, over the next few years, we model mid-single-digit organic growth across the group commercial markets and a modest decline-to-flat revenues in the group’s defence and security businesses to reflect their exposure predominantly to US and UK/European defence customers where yoy budget headwinds are moderating. In aggregate, we forecast organic growth of 3.3% in 2015, with the assumption it will rise to 4% in 2016.
EiD – a major self-help programme extended to 2018 by Aeroflex
Group operating margin (%); operational improvement and mix (M&A) should drive a modest expansion
EiD gains and Aeroflex synergies as a percentage of EBIT (yoy and cumulative)
Source: Berenberg estimates
Cobham’s margin profile has been complicated by certain one-off factors such as large contract milestones (eg FSTA) and portfolio mix changes, both disposals and acquisitions. However, we conclude that the underlying trend over the past three years has been negative, not least because group margins have contracted by 60bp since 2010 despite realising £76m of EiD benefits, equivalent to 400bp of margin. The scope of the original £131m/three-year EiD programme was extended and accelerated in 2013 with total costs now expected to reach £191m by 2015,
450
500
550
600
650
700
FY
09
FY
10
FY
11
FY
12
FY
13
FY
14
FY
15
FY
16
FY
17
FY
18
FY
19
Total Base (FYDP) BCA cap
42%
58%
Commercial Defence/Govt
14%
15%
16%
17%
18%
19%
20%
200
6
200
7
200
8
200
9
201
0
201
1
201
2
201
3
201
4E
201
5E
201
6E
201
7E
0%
10%
20%
30%
40%
50%
60%
201
0
201
1
201
2
201
3
201
4F
201
5F
201
6F
201
7F
201
8F
as % of last yr EBIT as % of EBIT pre EiD
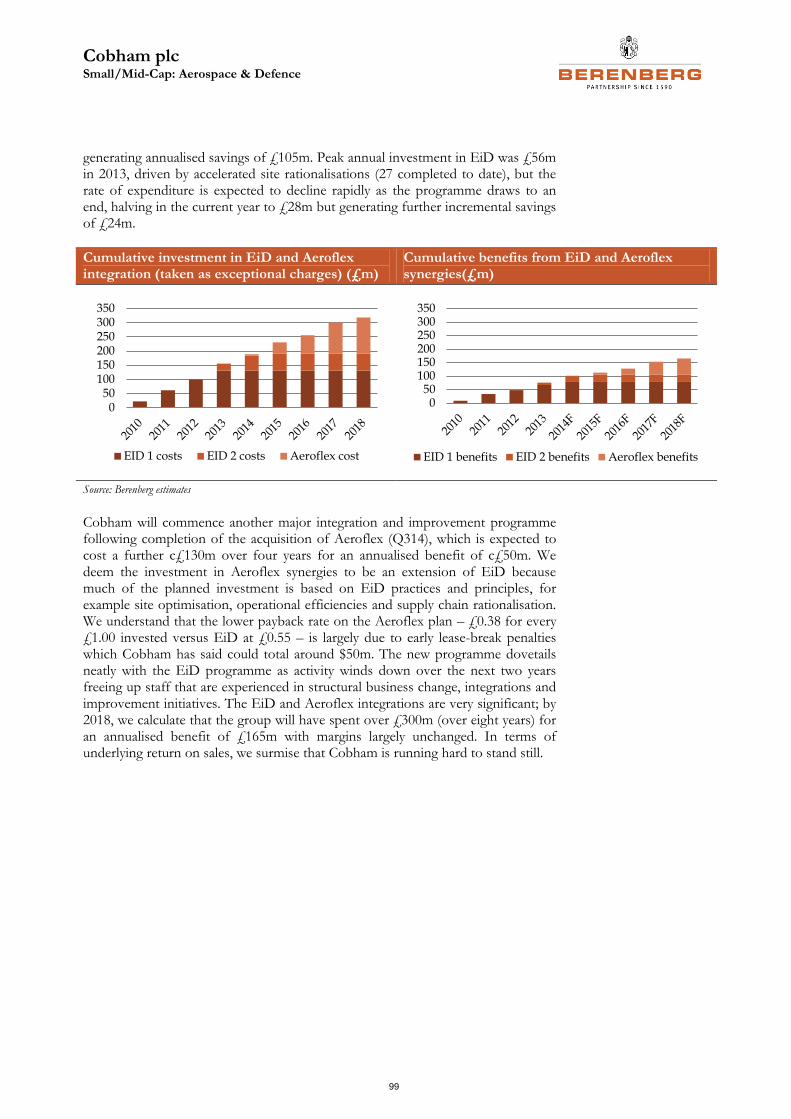
Cobham plc Small/Mid-Cap: Aerospace & Defence
99
generating annualised savings of £105m. Peak annual investment in EiD was £56m in 2013, driven by accelerated site rationalisations (27 completed to date), but the rate of expenditure is expected to decline rapidly as the programme draws to an end, halving in the current year to £28m but generating further incremental savings of £24m.
Cumulative investment in EiD and Aeroflex integration (taken as exceptional charges) (£m)
Cumulative benefits from EiD and Aeroflex synergies(£m)
Source: Berenberg estimates
Cobham will commence another major integration and improvement programme following completion of the acquisition of Aeroflex (Q314), which is expected to cost a further c£130m over four years for an annualised benefit of c£50m. We deem the investment in Aeroflex synergies to be an extension of EiD because much of the planned investment is based on EiD practices and principles, for example site optimisation, operational efficiencies and supply chain rationalisation. We understand that the lower payback rate on the Aeroflex plan – £0.38 for every £1.00 invested versus EiD at £0.55 – is largely due to early lease-break penalties which Cobham has said could total around $50m. The new programme dovetails neatly with the EiD programme as activity winds down over the next two years freeing up staff that are experienced in structural business change, integrations and improvement initiatives. The EiD and Aeroflex integrations are very significant; by 2018, we calculate that the group will have spent over £300m (over eight years) for an annualised benefit of £165m with margins largely unchanged. In terms of underlying return on sales, we surmise that Cobham is running hard to stand still.
050
100150200250300350
EID 1 costs EID 2 costs Aeroflex cost
050
100150200250300350
EID 1 benefits EID 2 benefits Aeroflex benefits
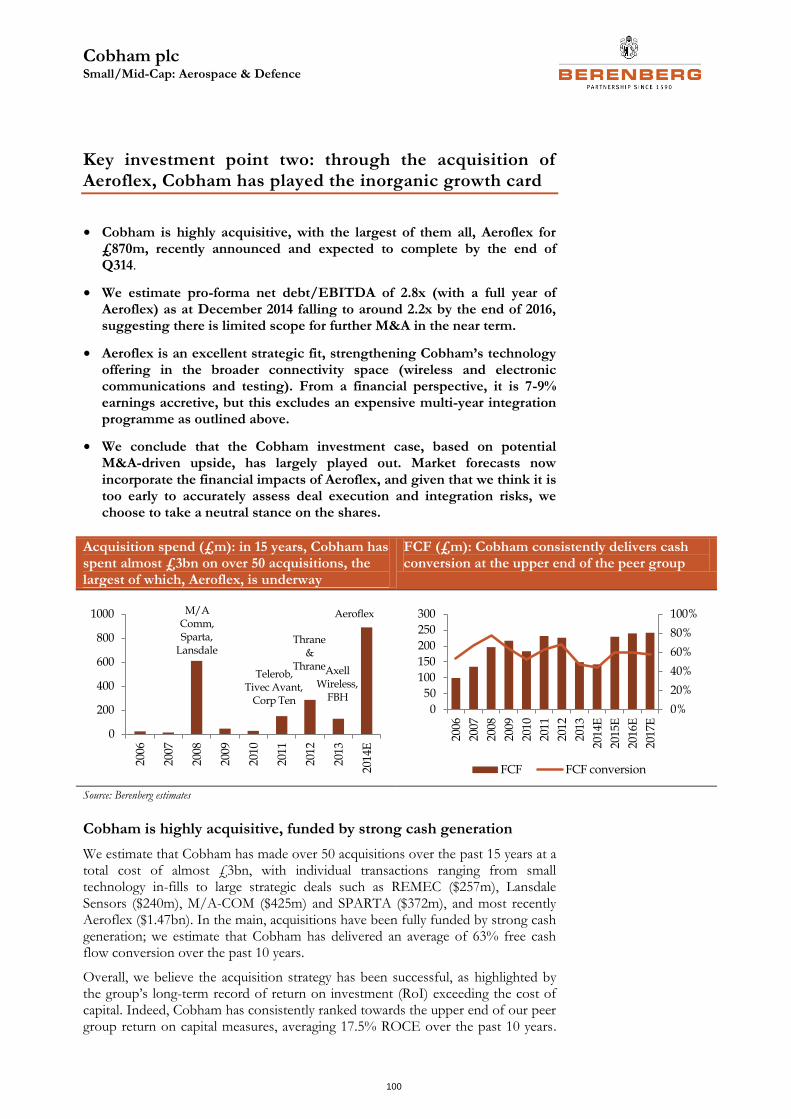
Cobham plc Small/Mid-Cap: Aerospace & Defence
100
Key investment point two: through the acquisition of Aeroflex, Cobham has played the inorganic growth card
• Cobham is highly acquisitive, with the largest of them all, Aeroflex for £870m, recently announced and expected to complete by the end of Q314.
• We estimate pro-forma net debt/EBITDA of 2.8x (with a full year of Aeroflex) as at December 2014 falling to around 2.2x by the end of 2016, suggesting there is limited scope for further M&A in the near term.
• Aeroflex is an excellent strategic fit, strengthening Cobham’s technology offering in the broader connectivity space (wireless and electronic communications and testing). From a financial perspective, it is 7-9% earnings accretive, but this excludes an expensive multi-year integration programme as outlined above.
• We conclude that the Cobham investment case, based on potential M&A-driven upside, has largely played out. Market forecasts now incorporate the financial impacts of Aeroflex, and given that we think it is too early to accurately assess deal execution and integration risks, we choose to take a neutral stance on the shares.
Acquisition spend (£m): in 15 years, Cobham has spent almost £3bn on over 50 acquisitions, the largest of which, Aeroflex, is underway
FCF (£m): Cobham consistently delivers cash conversion at the upper end of the peer group
Source: Berenberg estimates
Cobham is highly acquisitive, funded by strong cash generation
We estimate that Cobham has made over 50 acquisitions over the past 15 years at a total cost of almost £3bn, with individual transactions ranging from small technology in-fills to large strategic deals such as REMEC ($257m), Lansdale Sensors ($240m), M/A-COM ($425m) and SPARTA ($372m), and most recently Aeroflex ($1.47bn). In the main, acquisitions have been fully funded by strong cash generation; we estimate that Cobham has delivered an average of 63% free cash flow conversion over the past 10 years.
Overall, we believe the acquisition strategy has been successful, as highlighted by the group’s long-term record of return on investment (RoI) exceeding the cost of capital. Indeed, Cobham has consistently ranked towards the upper end of our peer group return on capital measures, averaging 17.5% ROCE over the past 10 years.
0
200
400
600
800
1000
2006
2007
2008
2009
2010
2011
2012
2013
2014
E
Axell Wireless,
FBH
Thrane &
Thrane
M/A Comm,Sparta,
Lansdale
Telerob,Tivec Avant,
Corp Ten
Aeroflex
0%
20%
40%
60%
80%
100%
0
50
100
150
200
250
300
2006
2007
2008
2009
2010
2011
2012
2013
2014
E
2015
E
2016
E
2017
E
FCF FCF conversion
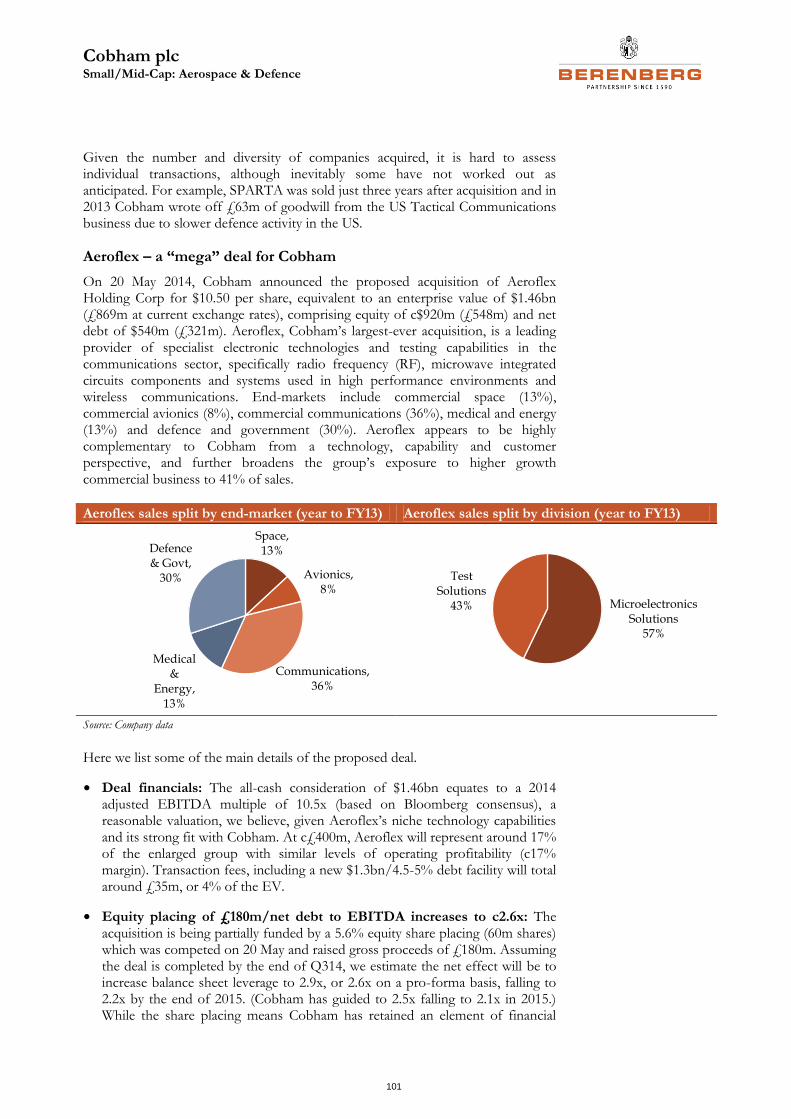
Cobham plc Small/Mid-Cap: Aerospace & Defence
101
Given the number and diversity of companies acquired, it is hard to assess individual transactions, although inevitably some have not worked out as anticipated. For example, SPARTA was sold just three years after acquisition and in 2013 Cobham wrote off £63m of goodwill from the US Tactical Communications business due to slower defence activity in the US.
Aeroflex – a “mega” deal for Cobham
On 20 May 2014, Cobham announced the proposed acquisition of Aeroflex Holding Corp for $10.50 per share, equivalent to an enterprise value of $1.46bn (£869m at current exchange rates), comprising equity of c$920m (£548m) and net debt of $540m (£321m). Aeroflex, Cobham’s largest-ever acquisition, is a leading provider of specialist electronic technologies and testing capabilities in the communications sector, specifically radio frequency (RF), microwave integrated circuits components and systems used in high performance environments and wireless communications. End-markets include commercial space (13%), commercial avionics (8%), commercial communications (36%), medical and energy (13%) and defence and government (30%). Aeroflex appears to be highly complementary to Cobham from a technology, capability and customer perspective, and further broadens the group’s exposure to higher growth commercial business to 41% of sales.
Aeroflex sales split by end-market (year to FY13) Aeroflex sales split by division (year to FY13)
Source: Company data
Here we list some of the main details of the proposed deal.
• Deal financials: The all-cash consideration of $1.46bn equates to a 2014 adjusted EBITDA multiple of 10.5x (based on Bloomberg consensus), a reasonable valuation, we believe, given Aeroflex’s niche technology capabilities and its strong fit with Cobham. At c£400m, Aeroflex will represent around 17% of the enlarged group with similar levels of operating profitability (c17% margin). Transaction fees, including a new $1.3bn/4.5-5% debt facility will total around £35m, or 4% of the EV.
• Equity placing of £180m/net debt to EBITDA increases to c2.6x: The acquisition is being partially funded by a 5.6% equity share placing (60m shares) which was competed on 20 May and raised gross proceeds of £180m. Assuming the deal is completed by the end of Q314, we estimate the net effect will be to increase balance sheet leverage to 2.9x, or 2.6x on a pro-forma basis, falling to 2.2x by the end of 2015. (Cobham has guided to 2.5x falling to 2.1x in 2015.) While the share placing means Cobham has retained an element of financial
Space, 13%
Avionics, 8%
Medical &
Energy, 13%
Defence & Govt,
30%
Communications, 36%
Test Solutions
43% Microelectronics Solutions
57%
Cobham plc Small/Mid-Cap: Aerospace & Defence
102
flexibility (should, for example, the opportunity arise to acquire small technology in-fill deals), we conclude that meaningful M&A is off the agenda for a while – in our view, probably for a year or more until balance sheet leverage trends towards 2x. This will at least afford management the time to focus on driving value from the Aeroflex integration.
• £128m integration costs for £50m pa synergies: Cobham expects to achieve annualised run-rate cost synergies of $85m/£50m for a total investment of $215m/£128m as outlined previously. Areas of synergy have been highlighted by the company as ~10% corporate overhead, ~50% site optimisation, ~15% operational efficiencies and ~25% supply chain. The costs and synergies are expected to be progressively incurred/realised over the next four years.
• Forecast changes: While we did not have published estimates prior to the announcement of the acquisition, our model confirms management’s guidance that the transaction is earnings neutral in 2014 and is “significantly” accretive thereafter; we estimate c8% EPS accretion in 2015.
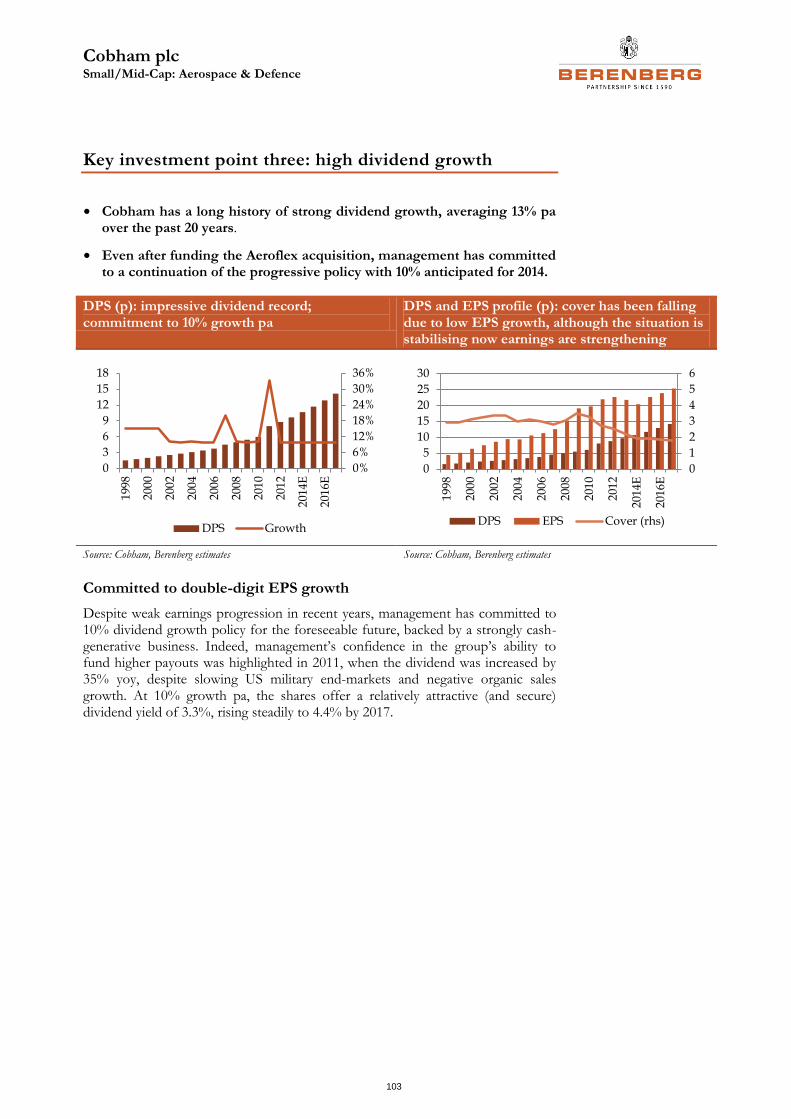
Cobham plc Small/Mid-Cap: Aerospace & Defence
103
Key investment point three: high dividend growth
• Cobham has a long history of strong dividend growth, averaging 13% pa over the past 20 years.
• Even after funding the Aeroflex acquisition, management has committed to a continuation of the progressive policy with 10% anticipated for 2014.
DPS (p): impressive dividend record; commitment to 10% growth pa
DPS and EPS profile (p): cover has been falling due to low EPS growth, although the situation is stabilising now earnings are strengthening
Source: Cobham, Berenberg estimates Source: Cobham, Berenberg estimates
Committed to double-digit EPS growth
Despite weak earnings progression in recent years, management has committed to 10% dividend growth policy for the foreseeable future, backed by a strongly cash-generative business. Indeed, management’s confidence in the group’s ability to fund higher payouts was highlighted in 2011, when the dividend was increased by 35% yoy, despite slowing US military end-markets and negative organic sales growth. At 10% growth pa, the shares offer a relatively attractive (and secure) dividend yield of 3.3%, rising steadily to 4.4% by 2017.
0%
6%
12%
18%
24%
30%
36%
0
3
6
9
12
15
18
199
8
200
0
200
2
200
4
200
6
200
8
201
0
201
2
201
4E
201
6E
DPS Growth
0
1
2
3
4
5
6
0
5
10
15
20
25
30
199
8
200
0
200
2
200
4
200
6
200
8
201
0
201
2
201
4E
201
6E
DPS EPS Cover (rhs)
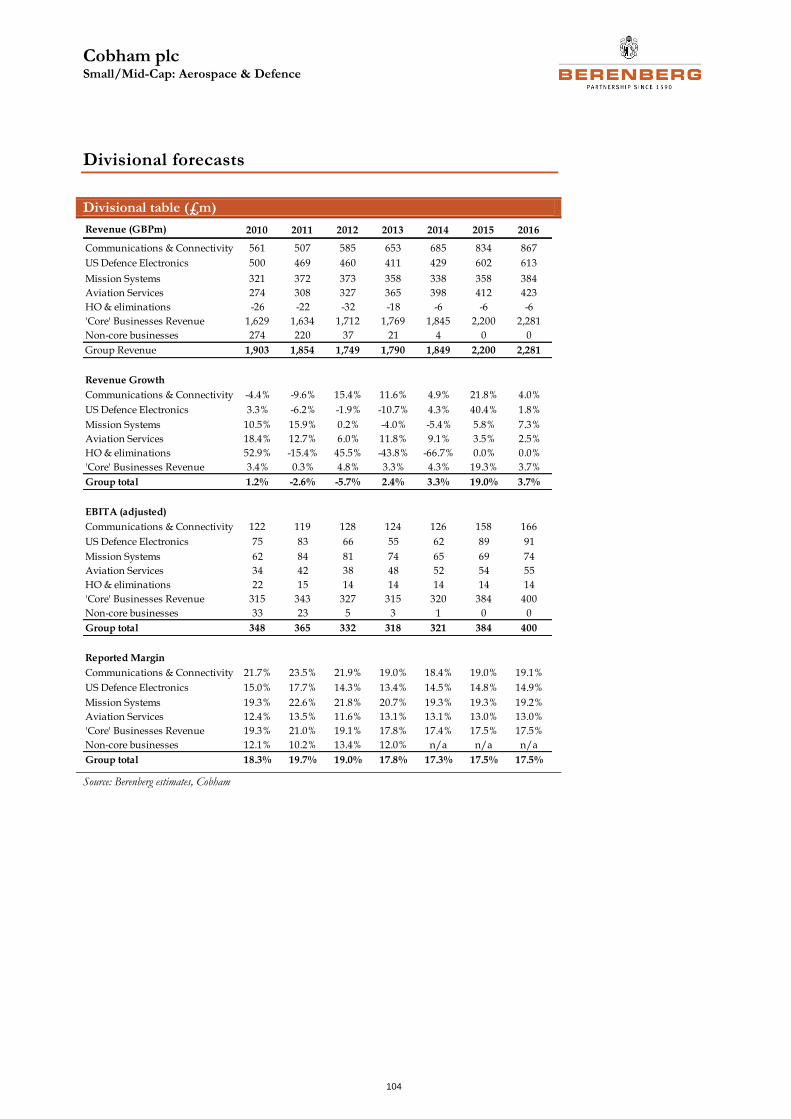
Cobham plc Small/Mid-Cap: Aerospace & Defence
104
Divisional forecasts
Divisional table (£m)
Source: Berenberg estimates, Cobham
Revenue (GBPm) 2010 2011 2012 2013 2014 2015 2016
Communications & Connectivity 561 507 585 653 685 834 867
US Defence Electronics 500 469 460 411 429 602 613
Mission Systems 321 372 373 358 338 358 384
Aviation Services 274 308 327 365 398 412 423
HO & eliminations -26 -22 -32 -18 -6 -6 -6
'Core' Businesses Revenue 1,629 1,634 1,712 1,769 1,845 2,200 2,281
Non-core businesses 274 220 37 21 4 0 0
Group Revenue 1,903 1,854 1,749 1,790 1,849 2,200 2,281
Revenue Growth
Communications & Connectivity -4.4% -9.6% 15.4% 11.6% 4.9% 21.8% 4.0%
US Defence Electronics 3.3% -6.2% -1.9% -10.7% 4.3% 40.4% 1.8%
Mission Systems 10.5% 15.9% 0.2% -4.0% -5.4% 5.8% 7.3%
Aviation Services 18.4% 12.7% 6.0% 11.8% 9.1% 3.5% 2.5%
HO & eliminations 52.9% -15.4% 45.5% -43.8% -66.7% 0.0% 0.0%
'Core' Businesses Revenue 3.4% 0.3% 4.8% 3.3% 4.3% 19.3% 3.7%
Group total 1.2% -2.6% -5.7% 2.4% 3.3% 19.0% 3.7%
EBITA (adjusted)
Communications & Connectivity 122 119 128 124 126 158 166
US Defence Electronics 75 83 66 55 62 89 91
Mission Systems 62 84 81 74 65 69 74
Aviation Services 34 42 38 48 52 54 55
HO & eliminations 22 15 14 14 14 14 14
'Core' Businesses Revenue 315 343 327 315 320 384 400
Non-core businesses 33 23 5 3 1 0 0
Group total 348 365 332 318 321 384 400
Reported Margin
Communications & Connectivity 21.7% 23.5% 21.9% 19.0% 18.4% 19.0% 19.1%
US Defence Electronics 15.0% 17.7% 14.3% 13.4% 14.5% 14.8% 14.9%
Mission Systems 19.3% 22.6% 21.8% 20.7% 19.3% 19.3% 19.2%
Aviation Services 12.4% 13.5% 11.6% 13.1% 13.1% 13.0% 13.0%
'Core' Businesses Revenue 19.3% 21.0% 19.1% 17.8% 17.4% 17.5% 17.5%
Non-core businesses 12.1% 10.2% 13.4% 12.0% n/a n/a n/a
Group total 18.3% 19.7% 19.0% 17.8% 17.3% 17.5% 17.5%
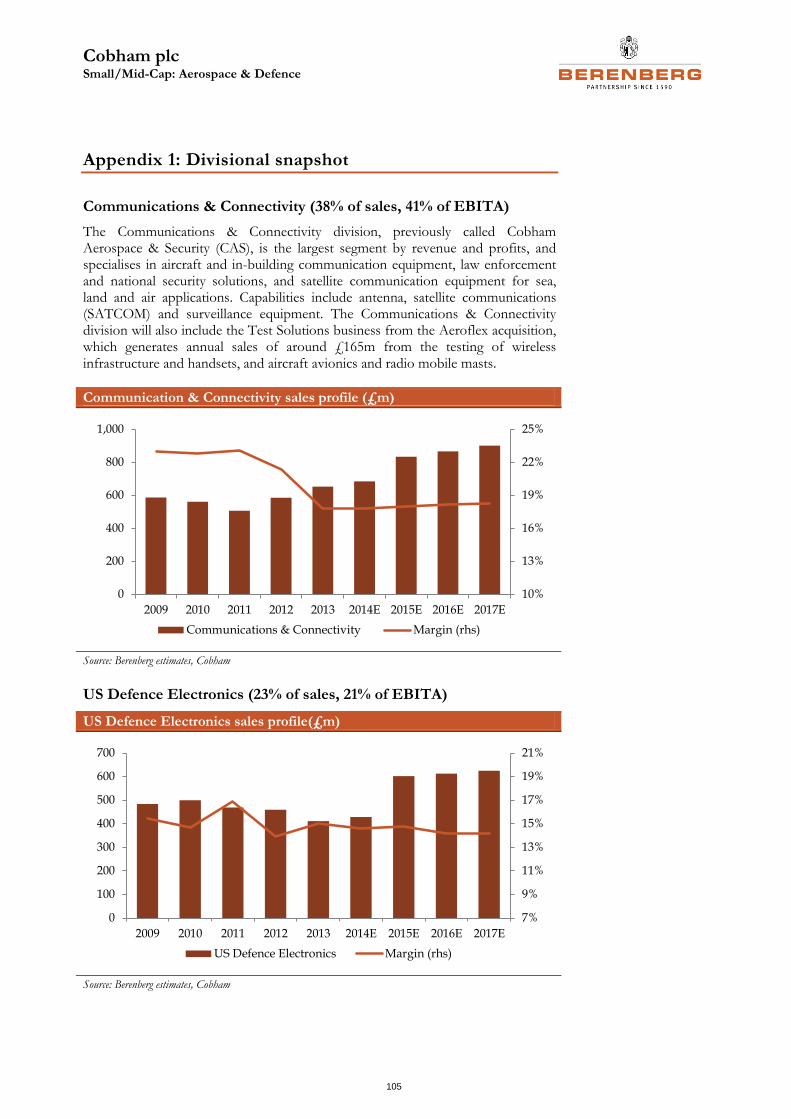
Cobham plc Small/Mid-Cap: Aerospace & Defence
105
Appendix 1: Divisional snapshot
Communications & Connectivity (38% of sales, 41% of EBITA)
The Communications & Connectivity division, previously called Cobham Aerospace & Security (CAS), is the largest segment by revenue and profits, and specialises in aircraft and in-building communication equipment, law enforcement and national security solutions, and satellite communication equipment for sea, land and air applications. Capabilities include antenna, satellite communications (SATCOM) and surveillance equipment. The Communications & Connectivity division will also include the Test Solutions business from the Aeroflex acquisition, which generates annual sales of around £165m from the testing of wireless infrastructure and handsets, and aircraft avionics and radio mobile masts.
Communication & Connectivity sales profile (£m)
Source: Berenberg estimates, Cobham
US Defence Electronics (23% of sales, 21% of EBITA)
US Defence Electronics sales profile(£m)
Source: Berenberg estimates, Cobham
10%
13%
16%
19%
22%
25%
0
200
400
600
800
1,000
2009 2010 2011 2012 2013 2014E 2015E 2016E 2017E
Communications & Connectivity Margin (rhs)
7%
9%
11%
13%
15%
17%
19%
21%
0
100
200
300
400
500
600
700
2009 2010 2011 2012 2013 2014E 2015E 2016E 2017E
US Defence Electronics Margin (rhs)
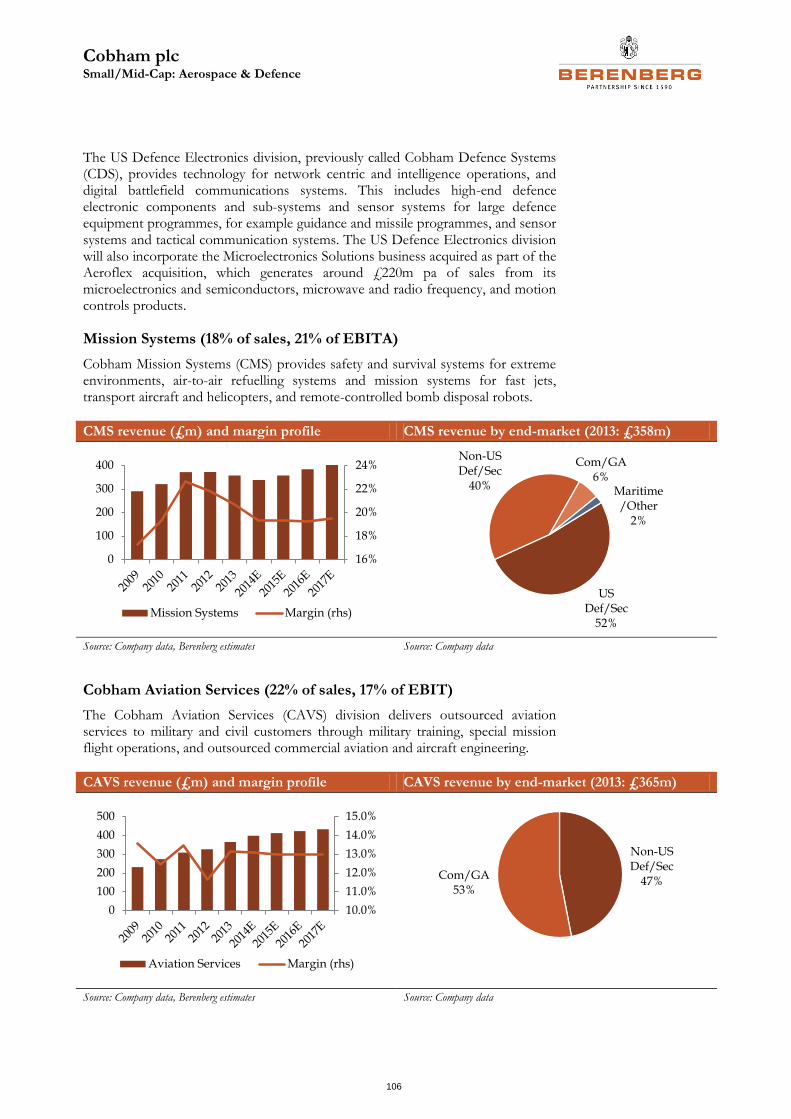
Cobham plc Small/Mid-Cap: Aerospace & Defence
106
The US Defence Electronics division, previously called Cobham Defence Systems (CDS), provides technology for network centric and intelligence operations, and digital battlefield communications systems. This includes high-end defence electronic components and sub-systems and sensor systems for large defence equipment programmes, for example guidance and missile programmes, and sensor systems and tactical communication systems. The US Defence Electronics division will also incorporate the Microelectronics Solutions business acquired as part of the Aeroflex acquisition, which generates around £220m pa of sales from its microelectronics and semiconductors, microwave and radio frequency, and motion controls products.
Mission Systems (18% of sales, 21% of EBITA)
Cobham Mission Systems (CMS) provides safety and survival systems for extreme environments, air-to-air refuelling systems and mission systems for fast jets, transport aircraft and helicopters, and remote-controlled bomb disposal robots.
CMS revenue (£m) and margin profile CMS revenue by end-market (2013: £358m)
Source: Company data, Berenberg estimates Source: Company data
Cobham Aviation Services (22% of sales, 17% of EBIT)
The Cobham Aviation Services (CAVS) division delivers outsourced aviation services to military and civil customers through military training, special mission flight operations, and outsourced commercial aviation and aircraft engineering.
CAVS revenue (£m) and margin profile CAVS revenue by end-market (2013: £365m)
Source: Company data, Berenberg estimates Source: Company data
16%
18%
20%
22%
24%
0
100
200
300
400
Mission Systems Margin (rhs)
US Def/Sec
52%
Non-US Def/Sec
40%
Com/GA 6%
Maritime/Other
2%
10.0%
11.0%
12.0%
13.0%
14.0%
15.0%
0
100
200
300
400
500
Aviation Services Margin (rhs)
Non-US Def/Sec
47%Com/GA
53%
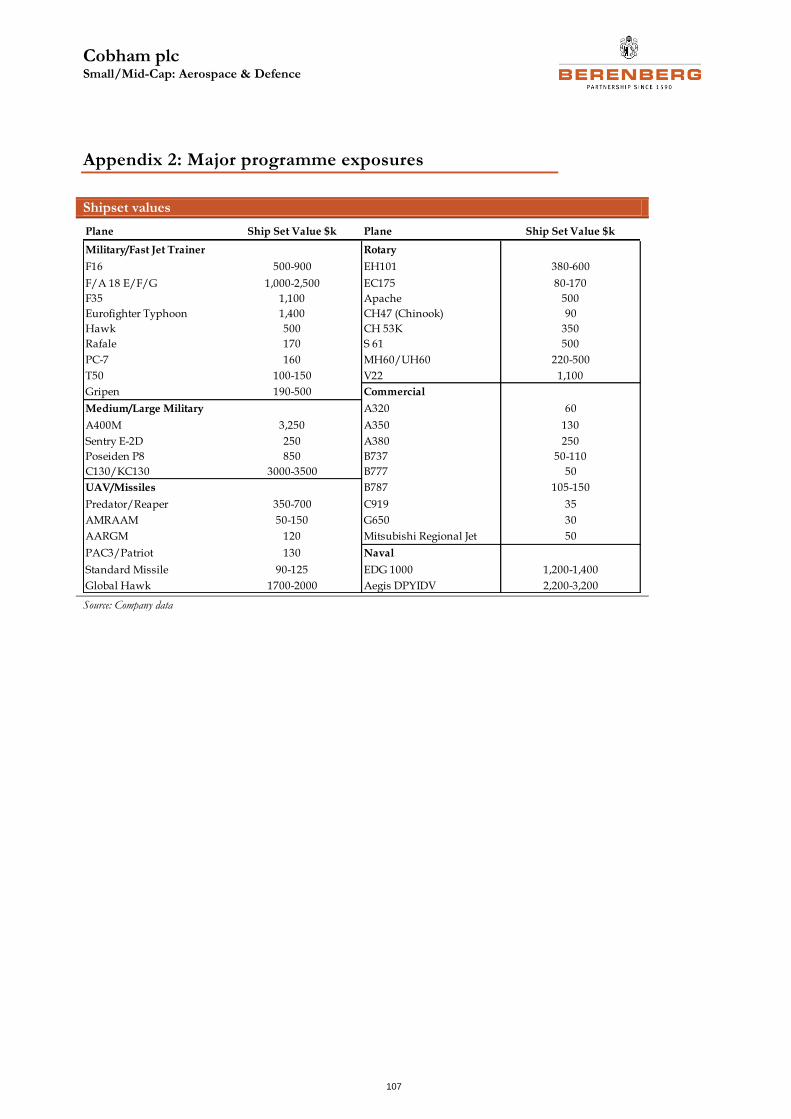
Cobham plc Small/Mid-Cap: Aerospace & Defence
107
Appendix 2: Major programme exposures
Shipset values
Source: Company data
Plane Ship Set Value $k Plane Ship Set Value $k
Military/Fast Jet Trainer Rotary
F16 500-900 EH101 380-600
F/A 18 E/F/G 1,000-2,500 EC175 80-170
F35 1,100 Apache 500
Eurofighter Typhoon 1,400 CH47 (Chinook) 90
Hawk 500 CH 53K 350
Rafale 170 S 61 500
PC-7 160 MH60/UH60 220-500
T50 100-150 V22 1,100
Gripen 190-500 Commercial
Medium/Large Military A320 60
A400M 3,250 A350 130
Sentry E-2D 250 A380 250
Poseiden P8 850 B737 50-110
C130/KC130 3000-3500 B777 50
UAV/Missiles B787 105-150
Predator/Reaper 350-700 C919 35
AMRAAM 50-150 G650 30
AARGM 120 Mitsubishi Regional Jet 50
PAC3/Patriot 130 Naval
Standard Missile 90-125 EDG 1000 1,200-1,400
Global Hawk 1700-2000 Aegis DPYIDV 2,200-3,200
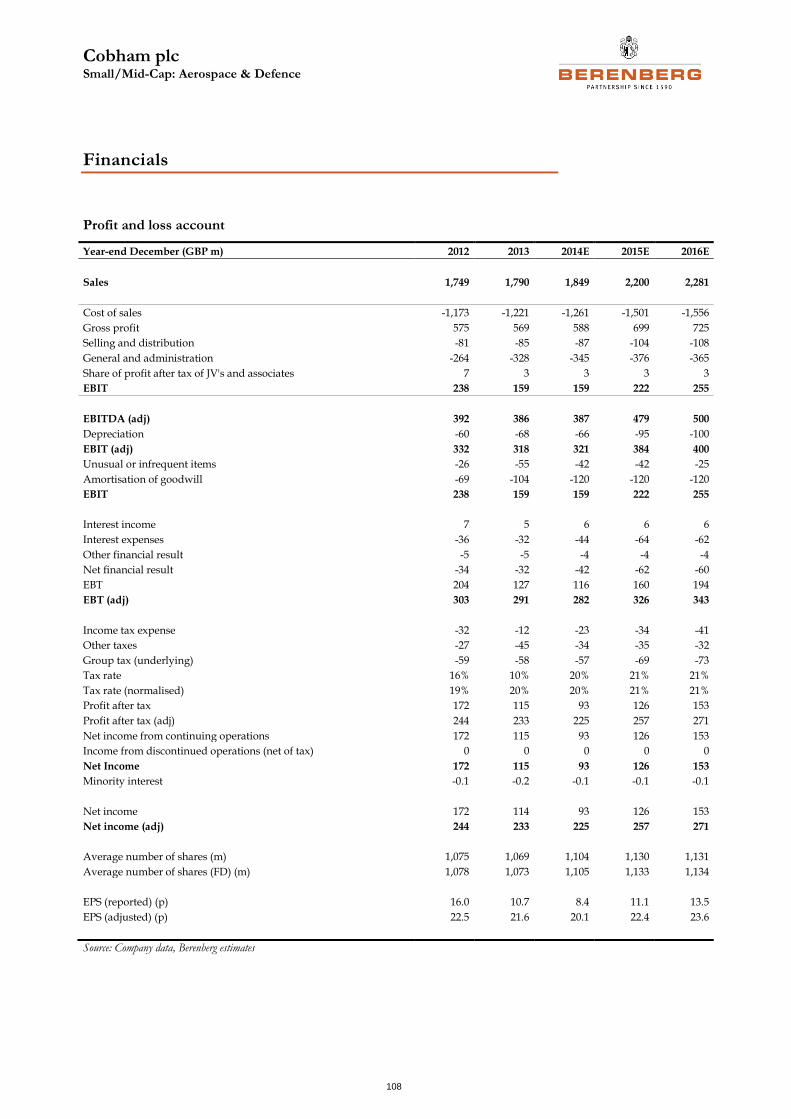
Cobham plc Small/Mid-Cap: Aerospace & Defence
108
Financials
Profit and loss account
Year-end December (GBP m) 2012 2013 2014E 2015E 2016E
Sales 1,749 1,790 1,849 2,200 2,281
Cost of sales -1,173 -1,221 -1,261 -1,501 -1,556
Gross profit 575 569 588 699 725
Selling and distribution -81 -85 -87 -104 -108
General and administration -264 -328 -345 -376 -365
Share of profit after tax of JV's and associates 7 3 3 3 3
EBIT 238 159 159 222 255
EBITDA (adj) 392 386 387 479 500
Depreciation -60 -68 -66 -95 -100
EBIT (adj) 332 318 321 384 400
Unusual or infrequent items -26 -55 -42 -42 -25
Amortisation of goodwill -69 -104 -120 -120 -120
EBIT 238 159 159 222 255
Interest income 7 5 6 6 6
Interest expenses -36 -32 -44 -64 -62
Other financial result -5 -5 -4 -4 -4
Net financial result -34 -32 -42 -62 -60
EBT 204 127 116 160 194
EBT (adj) 303 291 282 326 343
Income tax expense -32 -12 -23 -34 -41
Other taxes -27 -45 -34 -35 -32
Group tax (underlying) -59 -58 -57 -69 -73
Tax rate 16% 10% 20% 21% 21%
Tax rate (normalised) 19% 20% 20% 21% 21%
Profit after tax 172 115 93 126 153
Profit after tax (adj) 244 233 225 257 271
Net income from continuing operations 172 115 93 126 153
Income from discontinued operations (net of tax) 0 0 0 0 0
Net Income 172 115 93 126 153
Minority interest -0.1 -0.2 -0.1 -0.1 -0.1
Net income 172 114 93 126 153
Net income (adj) 244 233 225 257 271
Average number of shares (m) 1,075 1,069 1,104 1,130 1,131
Average number of shares (FD) (m) 1,078 1,073 1,105 1,133 1,134
EPS (reported) (p) 16.0 10.7 8.4 11.1 13.5
EPS (adjusted) (p) 22.5 21.6 20.1 22.4 23.6
Source: Company data, Berenberg estimates
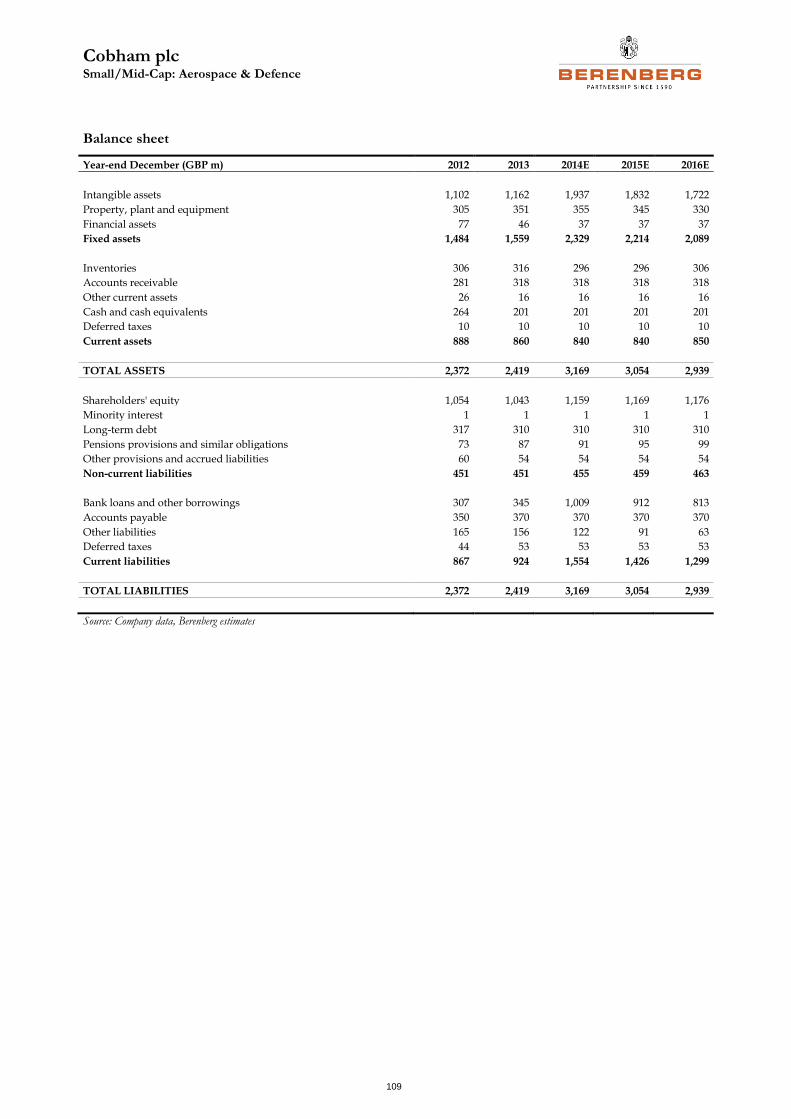
Cobham plc Small/Mid-Cap: Aerospace & Defence
109
Balance sheet
Year-end December (GBP m) 2012 2013 2014E 2015E 2016E
Intangible assets 1,102 1,162 1,937 1,832 1,722
Property, plant and equipment 305 351 355 345 330
Financial assets 77 46 37 37 37
Fixed assets 1,484 1,559 2,329 2,214 2,089
Inventories 306 316 296 296 306
Accounts receivable 281 318 318 318 318
Other current assets 26 16 16 16 16
Cash and cash equivalents 264 201 201 201 201
Deferred taxes 10 10 10 10 10
Current assets 888 860 840 840 850
TOTAL ASSETS 2,372 2,419 3,169 3,054 2,939
Shareholders' equity 1,054 1,043 1,159 1,169 1,176
Minority interest 1 1 1 1 1
Long-term debt 317 310 310 310 310
Pensions provisions and similar obligations 73 87 91 95 99
Other provisions and accrued liabilities 60 54 54 54 54
Non-current liabilities 451 451 455 459 463
Bank loans and other borrowings 307 345 1,009 912 813
Accounts payable 350 370 370 370 370
Other liabilities 165 156 122 91 63
Deferred taxes 44 53 53 53 53
Current liabilities 867 924 1,554 1,426 1,299
TOTAL LIABILITIES 2,372 2,419 3,169 3,054 2,939
Source: Company data, Berenberg estimates
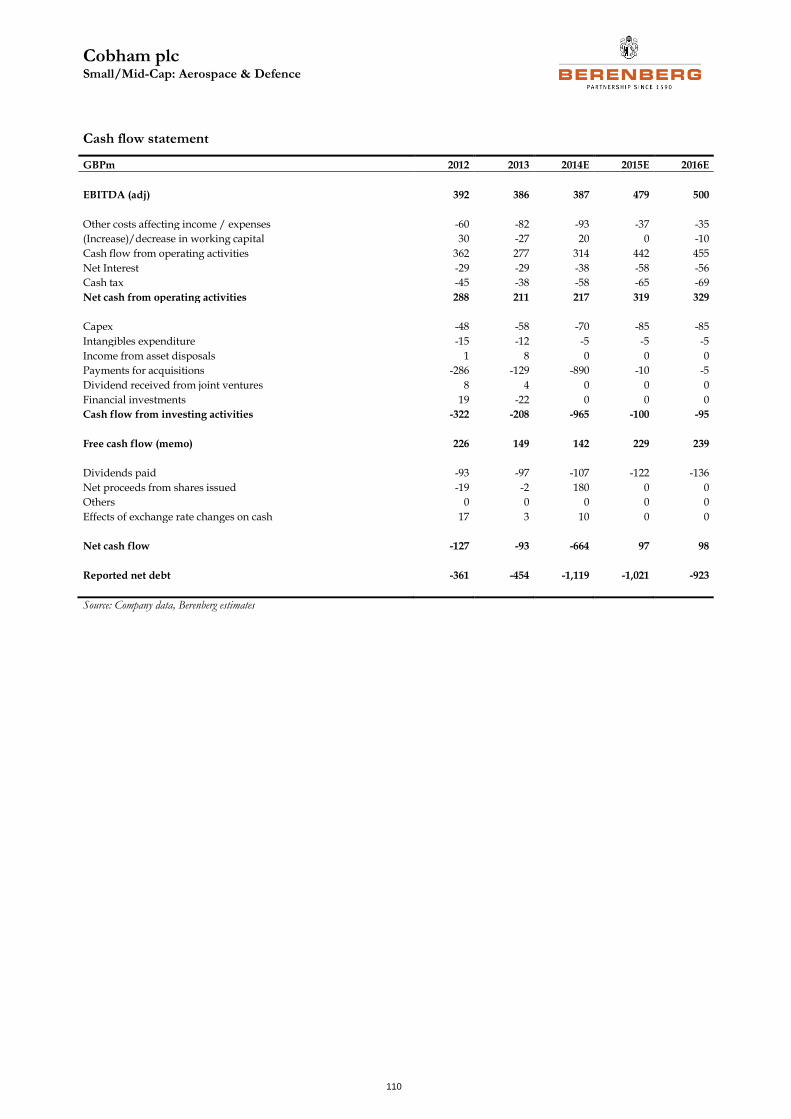
Cobham plc Small/Mid-Cap: Aerospace & Defence
110
Cash flow statement
GBPm 2012 2013 2014E 2015E 2016E
EBITDA (adj) 392 386 387 479 500
Other costs affecting income / expenses -60 -82 -93 -37 -35
(Increase)/decrease in working capital 30 -27 20 0 -10
Cash flow from operating activities 362 277 314 442 455
Net Interest -29 -29 -38 -58 -56
Cash tax -45 -38 -58 -65 -69
Net cash from operating activities 288 211 217 319 329
Capex -48 -58 -70 -85 -85
Intangibles expenditure -15 -12 -5 -5 -5
Income from asset disposals 1 8 0 0 0
Payments for acquisitions -286 -129 -890 -10 -5
Dividend received from joint ventures 8 4 0 0 0
Financial investments 19 -22 0 0 0
Cash flow from investing activities -322 -208 -965 -100 -95
Free cash flow (memo) 226 149 142 229 239
Dividends paid -93 -97 -107 -122 -136
Net proceeds from shares issued -19 -2 180 0 0
Others 0 0 0 0 0
Effects of exchange rate changes on cash 17 3 10 0 0
Net cash flow -127 -93 -664 97 98
Reported net debt -361 -454 -1,119 -1,021 -923
Source: Company data, Berenberg estimates
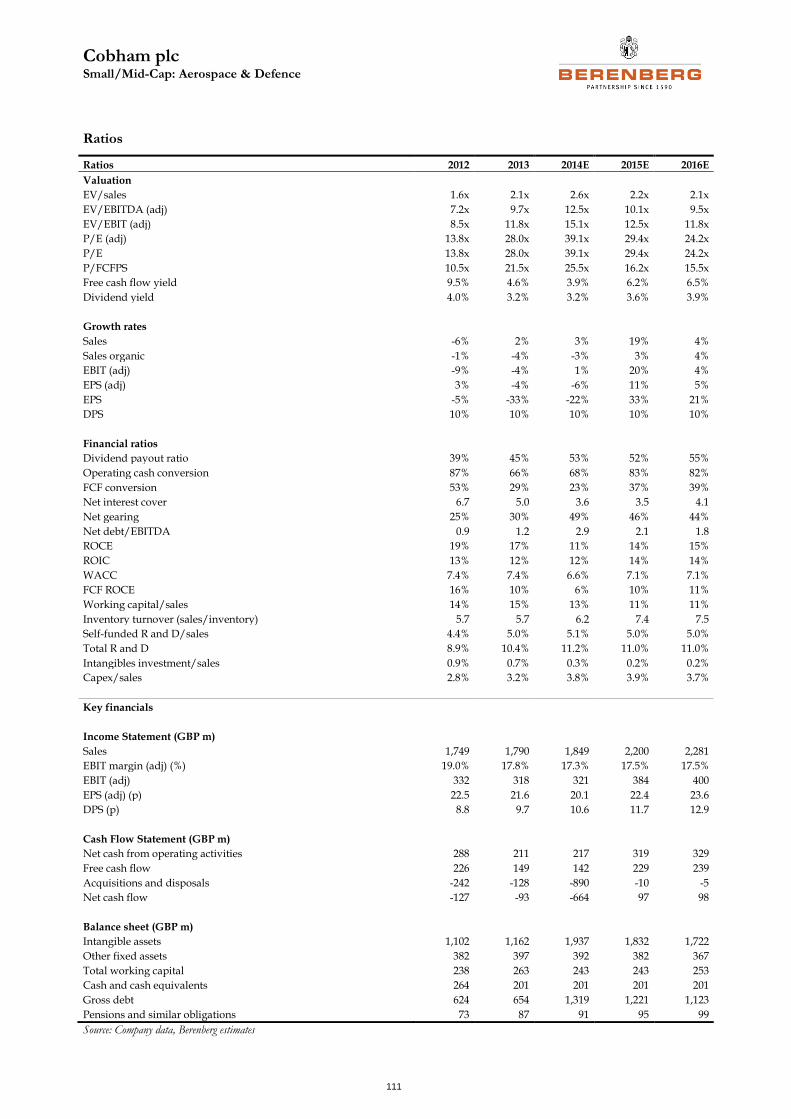
Cobham plc Small/Mid-Cap: Aerospace & Defence
111
Ratios
Ratios 2012 2013 2014E 2015E 2016E
Valuation
EV/sales 1.6x 2.1x 2.6x 2.2x 2.1x
EV/EBITDA (adj) 7.2x 9.7x 12.5x 10.1x 9.5x
EV/EBIT (adj) 8.5x 11.8x 15.1x 12.5x 11.8x
P/E (adj) 13.8x 28.0x 39.1x 29.4x 24.2x
P/E 13.8x 28.0x 39.1x 29.4x 24.2x
P/FCFPS 10.5x 21.5x 25.5x 16.2x 15.5x
Free cash flow yield 9.5% 4.6% 3.9% 6.2% 6.5%
Dividend yield 4.0% 3.2% 3.2% 3.6% 3.9%
Growth rates
Sales -6% 2% 3% 19% 4%
Sales organic -1% -4% -3% 3% 4%
EBIT (adj) -9% -4% 1% 20% 4%
EPS (adj) 3% -4% -6% 11% 5%
EPS -5% -33% -22% 33% 21%
DPS 10% 10% 10% 10% 10%
Financial ratios
Dividend payout ratio 39% 45% 53% 52% 55%
Operating cash conversion 87% 66% 68% 83% 82%
FCF conversion 53% 29% 23% 37% 39%
Net interest cover 6.7 5.0 3.6 3.5 4.1
Net gearing 25% 30% 49% 46% 44%
Net debt/EBITDA 0.9 1.2 2.9 2.1 1.8
ROCE 19% 17% 11% 14% 15%
ROIC 13% 12% 12% 14% 14%
WACC 7.4% 7.4% 6.6% 7.1% 7.1%
FCF ROCE 16% 10% 6% 10% 11%
Working capital/sales 14% 15% 13% 11% 11%
Inventory turnover (sales/inventory) 5.7 5.7 6.2 7.4 7.5
Self-funded R and D/sales 4.4% 5.0% 5.1% 5.0% 5.0%
Total R and D 8.9% 10.4% 11.2% 11.0% 11.0%
Intangibles investment/sales 0.9% 0.7% 0.3% 0.2% 0.2%
Capex/sales 2.8% 3.2% 3.8% 3.9% 3.7%
Key financials
Income Statement (GBP m)
Sales 1,749 1,790 1,849 2,200 2,281
EBIT margin (adj) (%) 19.0% 17.8% 17.3% 17.5% 17.5%
EBIT (adj) 332 318 321 384 400
EPS (adj) (p) 22.5 21.6 20.1 22.4 23.6
DPS (p) 8.8 9.7 10.6 11.7 12.9
Cash Flow Statement (GBP m)
Net cash from operating activities 288 211 217 319 329
Free cash flow 226 149 142 229 239
Acquisitions and disposals -242 -128 -890 -10 -5
Net cash flow -127 -93 -664 97 98
Balance sheet (GBP m)
Intangible assets 1,102 1,162 1,937 1,832 1,722
Other fixed assets 382 397 392 382 367
Total working capital 238 263 243 243 253
Cash and cash equivalents 264 201 201 201 201
Gross debt 624 654 1,319 1,221 1,123
Pensions and similar obligations 73 87 91 95 99
Source: Company data, Berenberg estimates
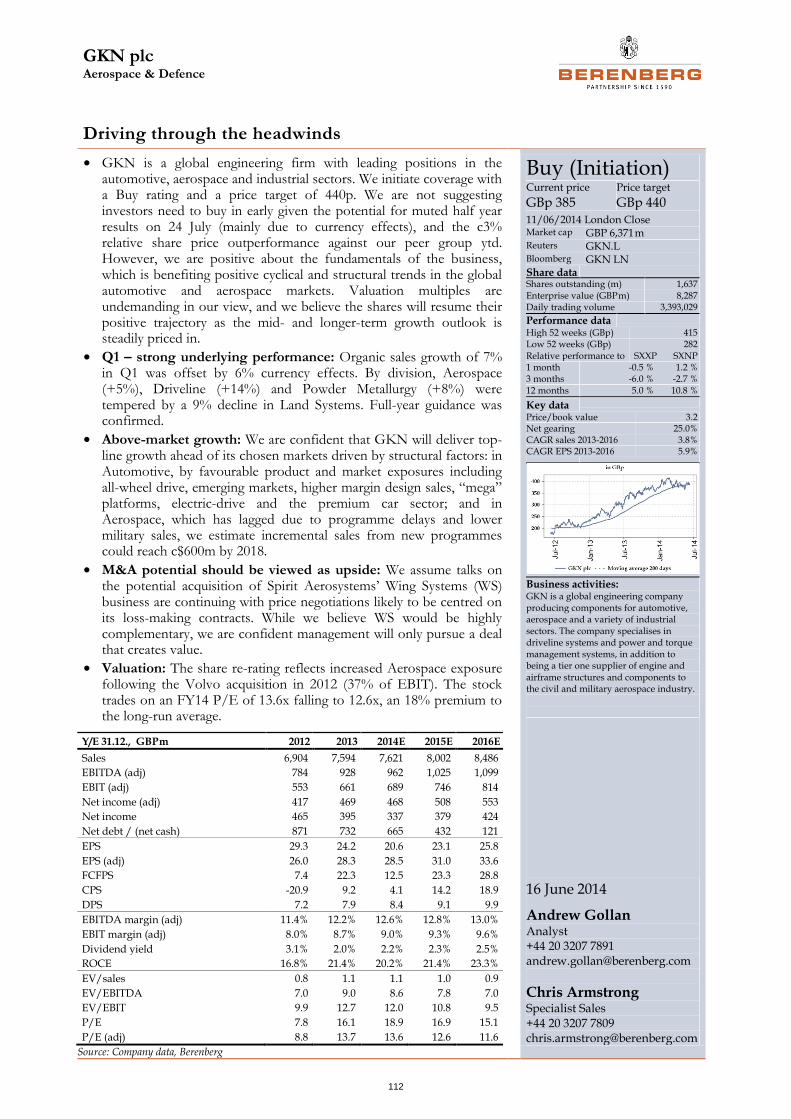
GKN plc Aerospace & Defence
112
Driving through the headwinds
• GKN is a global engineering firm with leading positions in the automotive, aerospace and industrial sectors. We initiate coverage with a Buy rating and a price target of 440p. We are not suggesting investors need to buy in early given the potential for muted half year results on 24 July (mainly due to currency effects), and the c3% relative share price outperformance against our peer group ytd. However, we are positive about the fundamentals of the business, which is benefiting positive cyclical and structural trends in the global automotive and aerospace markets. Valuation multiples are undemanding in our view, and we believe the shares will resume their positive trajectory as the mid- and longer-term growth outlook is steadily priced in.
• Q1 – strong underlying performance: Organic sales growth of 7% in Q1 was offset by 6% currency effects. By division, Aerospace (+5%), Driveline (+14%) and Powder Metallurgy (+8%) were tempered by a 9% decline in Land Systems. Full-year guidance was confirmed.
• Above-market growth: We are confident that GKN will deliver top-line growth ahead of its chosen markets driven by structural factors: in Automotive, by favourable product and market exposures including all-wheel drive, emerging markets, higher margin design sales, “mega” platforms, electric-drive and the premium car sector; and in Aerospace, which has lagged due to programme delays and lower military sales, we estimate incremental sales from new programmes could reach c$600m by 2018.
• M&A potential should be viewed as upside: We assume talks on the potential acquisition of Spirit Aerosystems’ Wing Systems (WS) business are continuing with price negotiations likely to be centred on its loss-making contracts. While we believe WS would be highly complementary, we are confident management will only pursue a deal that creates value.
• Valuation: The share re-rating reflects increased Aerospace exposure following the Volvo acquisition in 2012 (37% of EBIT). The stock trades on an FY14 P/E of 13.6x falling to 12.6x, an 18% premium to the long-run average.
Buy (Initiation) Current price
GBp 385 Price target
GBp 440 11/06/2014 London Close Market cap GBP 6,371 m Reuters GKN.L Bloomberg GKN LN Share data
Shares outstanding (m) 1,637 Enterprise value (GBP m) 8,287 Daily trading volume 3,393,029
Performance data
High 52 weeks (GBp) 415 Low 52 weeks (GBp) 282
Relative performance to SXXP SXNP 1 month -0.5 % 1.2 % 3 months -6.0 % -2.7 % 12 months 5.0 % 10.8 %
Key data
Price/book value 3.2 Net gearing 25.0% CAGR sales 2013-2016 3.8% CAGR EPS 2013-2016 5.9%
Business activities: GKN is a global engineering company producing components for automotive, aerospace and a variety of industrial sectors. The company specialises in driveline systems and power and torque management systems, in addition to being a tier one supplier of engine and airframe structures and components to the civil and military aerospace industry.
16 June 2014
Andrew Gollan Analyst +44 20 3207 7891 [email protected]
Chris Armstrong
Specialist Sales +44 20 3207 7809 [email protected]
Y/E 31.12., GBP m 2012 2013 2014E 2015E 2016E
Sales 6,904 7,594 7,621 8,002 8,486
EBITDA (adj) 784 928 962 1,025 1,099
EBIT (adj) 553 661 689 746 814
Net income (adj) 417 469 468 508 553
Net income 465 395 337 379 424
Net debt / (net cash) 871 732 665 432 121
EPS 29.3 24.2 20.6 23.1 25.8
EPS (adj) 26.0 28.3 28.5 31.0 33.6
FCFPS 7.4 22.3 12.5 23.3 28.8
CPS -20.9 9.2 4.1 14.2 18.9
DPS 7.2 7.9 8.4 9.1 9.9
EBITDA margin (adj) 11.4% 12.2% 12.6% 12.8% 13.0%
EBIT margin (adj) 8.0% 8.7% 9.0% 9.3% 9.6%
Dividend yield 3.1% 2.0% 2.2% 2.3% 2.5%
ROCE 16.8% 21.4% 20.2% 21.4% 23.3%
EV/sales 0.8 1.1 1.1 1.0 0.9
EV/EBITDA 7.0 9.0 8.6 7.8 7.0
EV/EBIT 9.9 12.7 12.0 10.8 9.5
P/E 7.8 16.1 18.9 16.9 15.1
P/E (adj) 8.8 13.7 13.6 12.6 11.6
Source: Company data, Berenberg
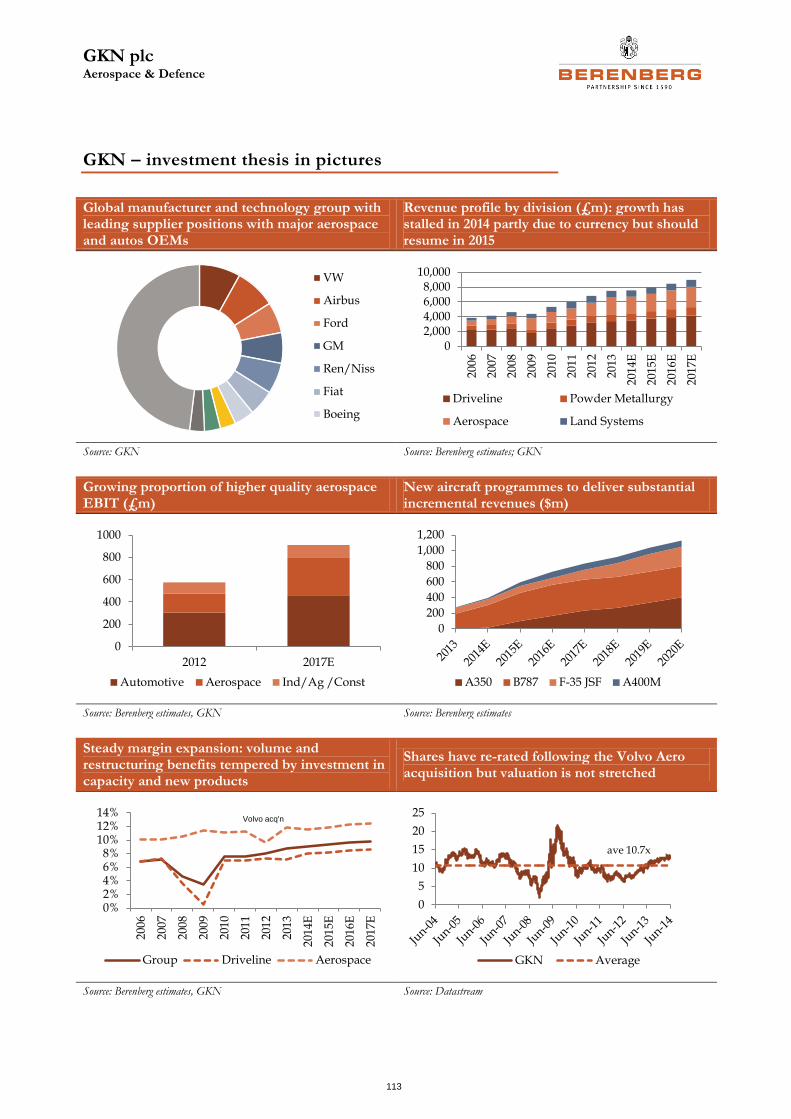
GKN plc Aerospace & Defence
113
GKN – investment thesis in pictures
Global manufacturer and technology group with leading supplier positions with major aerospace and autos OEMs
Revenue profile by division (£m): growth has stalled in 2014 partly due to currency but should resume in 2015
Source: GKN Source: Berenberg estimates; GKN
Growing proportion of higher quality aerospace EBIT (£m)
New aircraft programmes to deliver substantial incremental revenues ($m)
Source: Berenberg estimates, GKN Source: Berenberg estimates
Steady margin expansion: volume and restructuring benefits tempered by investment in capacity and new products
Shares have re-rated following the Volvo Aero acquisition but valuation is not stretched
Source: Berenberg estimates, GKN Source: Datastream
VW
Airbus
Ford
GM
Ren/Niss
Fiat
Boeing
02,0004,0006,0008,000
10,000
200
6
2007
200
8
200
9
2010
201
1
201
2
201
3
2014
E
201
5E
201
6E
2017
E
Driveline Powder Metallurgy
Aerospace Land Systems
0
200
400
600
800
1000
2012 2017E
Automotive Aerospace Ind/Ag /Const
0
200
400
600
800
1,000
1,200
A350 B787 F-35 JSF A400M
0%2%4%6%8%
10%12%14%
200
6
200
7
200
8
200
9
201
0
201
1
201
2
201
3
201
4E
201
5E
201
6E
201
7E
Group Driveline Aerospace
Volvo acq'n
0
5
10
15
20
25
GKN Average
ave 10.7x
GKN plc Aerospace & Defence
114
GKN – investment thesis
What’s new? We initiate coverage on GKN with a Buy rating and a 12-month price target of 440p.
Two-minute summary: The fundamentals of the business are positive, with the group’s two core end-markets, global automotive and aerospace, representing c85% of sales, growing concurrently. This we believe will translate to management’s stated ambition of sustaining revenue growth ahead of end-markets over the mid- to long term (we forecast a sales CAGR of 4.3% to 2017). However, in the near term, performance and earnings growth will be tempered by a combination of currency headwinds, phasing in Aerospace (with a slow ramp-up of new commercial programmes and wind-down of profitable military programmes) and higher tax, which we believe will translate to muted H1 results and flat earnings for the year. We see potential for some share price volatility as a consequence, but over time we expect the shares to advance as the growth trend resumes.
Key investment point one: sustainable growth above market rates
85% of sales are in the aerospace and automotive markets, both of which are in cyclical upswings. GKN is positioned to benefit from multiple structural factors that we believe will sustain top-line growth ahead of the market, which is a stated management target. In automotive, this includes an increasing mix of higher growth all-wheel drive (AWD) systems, product positions on a growing number of high volume global platforms (defined by the industry as “mega” – more than 1m vehicles – and “large” – 500k to 1m vehicles pa) and exposure to developing markets (eg China – 10%). In Aerospace, where revenue development has lagged due to commercial programme delays and lower military aircraft volumes, we estimate four new programmes, the Boeing 787, the Airbus A350 XWB, the F-35/JSF and the A400M aircraft, will generate over $600m of incremental revenues by 2018.
Key investment point two: M&A upside
M&A has been a key element of the GKN growth strategy in recent years, transforming the Aerospace portfolio through the Airbus Filton and Volvo Aero acquisitions and deepening the group’s penetration in higher growth Automotive sectors such as AWD and geared systems through the acquisition of Getrag.
Management declared an interest in Spirit Aerosystems’ WS business when it was effectively put up for sale last year and with no information to the contrary we assume a potential acquisition remains a prospect. We believe WS would be an excellent strategic fit, effectively replicating with Boeing GKN Aerospace’s position as the exclusive provider of primary wing structures to Airbus. We assume the key negotiation point is around legacy loss-making contracts within the WS business which makes it difficult to call the outcome or assess the financial implications of a possible deal.
For the purposes of illustration, we suggest a £1bn valuation if WS was generating industry margins of around 10%. The prospect of potential large-scale M&A and heightened valuation uncertainties particular to WS could constrain GKN’s share price upside in the near term. However, management has a good track record and a disciplined approach to capital allocation, and we are confident that it will not pursue an acquisition unless it creates value for shareholders. We therefore see limited downside risk, regardless of the outcome, and do not see uncertainty as a reason to shy away from the stock.
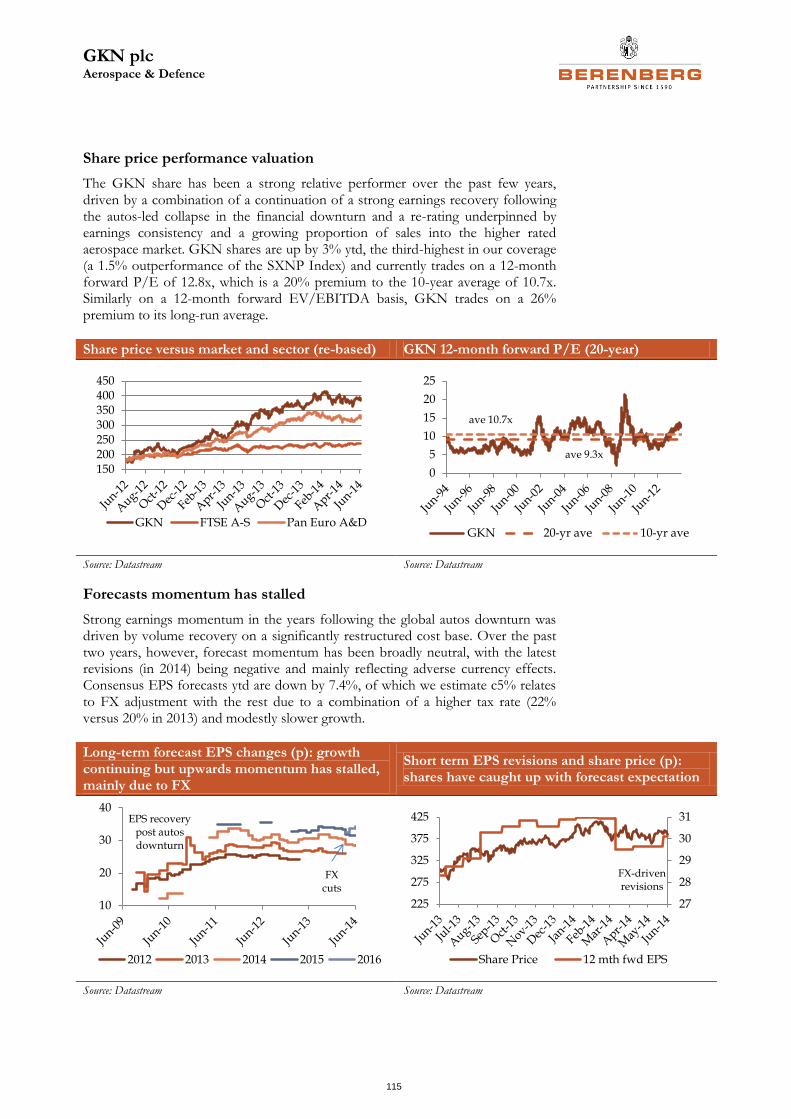
GKN plc Aerospace & Defence
115
Share price performance valuation
The GKN share has been a strong relative performer over the past few years, driven by a combination of a continuation of a strong earnings recovery following the autos-led collapse in the financial downturn and a re-rating underpinned by earnings consistency and a growing proportion of sales into the higher rated aerospace market. GKN shares are up by 3% ytd, the third-highest in our coverage (a 1.5% outperformance of the SXNP Index) and currently trades on a 12-month forward P/E of 12.8x, which is a 20% premium to the 10-year average of 10.7x. Similarly on a 12-month forward EV/EBITDA basis, GKN trades on a 26% premium to its long-run average.
Share price versus market and sector (re-based) GKN 12-month forward P/E (20-year)
Source: Datastream Source: Datastream
Forecasts momentum has stalled
Strong earnings momentum in the years following the global autos downturn was driven by volume recovery on a significantly restructured cost base. Over the past two years, however, forecast momentum has been broadly neutral, with the latest revisions (in 2014) being negative and mainly reflecting adverse currency effects. Consensus EPS forecasts ytd are down by 7.4%, of which we estimate c5% relates to FX adjustment with the rest due to a combination of a higher tax rate (22% versus 20% in 2013) and modestly slower growth.
Long-term forecast EPS changes (p): growth continuing but upwards momentum has stalled, mainly due to FX
Short term EPS revisions and share price (p): shares have caught up with forecast expectation
Source: Datastream Source: Datastream
150200250300350400450
GKN FTSE A-S Pan Euro A&D
0
5
10
15
20
25
GKN 20-yr ave 10-yr ave
ave 10.7x
ave 9.3x
10
20
30
40
2012 2013 2014 2015 2016
EPS recovery post autos downturn
FX cuts
27
28
29
30
31
225
275
325
375
425
Share Price 12 mth fwd EPS
FX-drivenrevisions
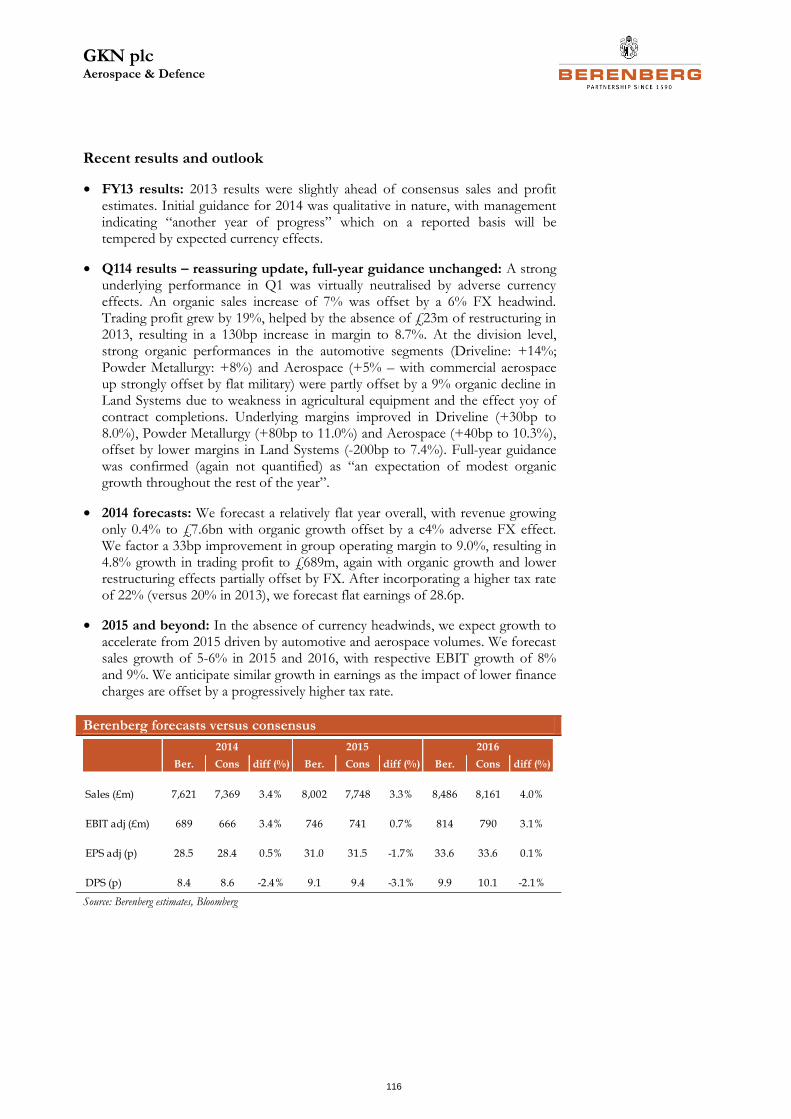
GKN plc Aerospace & Defence
116
Recent results and outlook
• FY13 results: 2013 results were slightly ahead of consensus sales and profit estimates. Initial guidance for 2014 was qualitative in nature, with management indicating “another year of progress” which on a reported basis will be tempered by expected currency effects.
• Q114 results – reassuring update, full-year guidance unchanged: A strong underlying performance in Q1 was virtually neutralised by adverse currency effects. An organic sales increase of 7% was offset by a 6% FX headwind. Trading profit grew by 19%, helped by the absence of £23m of restructuring in 2013, resulting in a 130bp increase in margin to 8.7%. At the division level, strong organic performances in the automotive segments (Driveline: +14%; Powder Metallurgy: +8%) and Aerospace (+5% – with commercial aerospace up strongly offset by flat military) were partly offset by a 9% organic decline in Land Systems due to weakness in agricultural equipment and the effect yoy of contract completions. Underlying margins improved in Driveline (+30bp to 8.0%), Powder Metallurgy (+80bp to 11.0%) and Aerospace (+40bp to 10.3%), offset by lower margins in Land Systems (-200bp to 7.4%). Full-year guidance was confirmed (again not quantified) as “an expectation of modest organic growth throughout the rest of the year”.
• 2014 forecasts: We forecast a relatively flat year overall, with revenue growing only 0.4% to £7.6bn with organic growth offset by a c4% adverse FX effect. We factor a 33bp improvement in group operating margin to 9.0%, resulting in 4.8% growth in trading profit to £689m, again with organic growth and lower restructuring effects partially offset by FX. After incorporating a higher tax rate of 22% (versus 20% in 2013), we forecast flat earnings of 28.6p.
• 2015 and beyond: In the absence of currency headwinds, we expect growth to accelerate from 2015 driven by automotive and aerospace volumes. We forecast sales growth of 5-6% in 2015 and 2016, with respective EBIT growth of 8% and 9%. We anticipate similar growth in earnings as the impact of lower finance charges are offset by a progressively higher tax rate.
Berenberg forecasts versus consensus
Source: Berenberg estimates, Bloomberg
Ber. Cons diff (%) Ber. Cons diff (%) Ber. Cons diff (%)
Sales (£m) 7,621 7,369 3.4% 8,002 7,748 3.3% 8,486 8,161 4.0%
EBIT adj (£m) 689 666 3.4% 746 741 0.7% 814 790 3.1%
EPS adj (p) 28.5 28.4 0.5% 31.0 31.5 -1.7% 33.6 33.6 0.1%
DPS (p) 8.4 8.6 -2.4% 9.1 9.4 -3.1% 9.9 10.1 -2.1%
2015 20162014
GKN plc Aerospace & Defence
117
Investment risks and concerns
• M&A upside/downside: GKN is an acquisitive company, as evidenced by the more than £1.4bn spent on transactions over the past decade, of which £1.1bn was in the last five years. We explore further in this note the potential acquisition of Spirit Aerosystems’ WS business, which has been looming for the best part of a year since Spirit’s decision to exit was announced. We believe WS is an excellent strategic fit with GKN’s existing wing structures business but it would also represent a significant transaction – we suggest at least high triple-digit millions to £1bn – in the context of the group’s current net debt of c£700m, gearing of c35% and leverage of 0.7x. Management has a good record of successfully executing large deals including the Airbus wings, Getrag (Driveline) and Volvo Aero (Engine components) acquisitions, so we are confident valuation downside risks relating to M&A is relatively low.
• Aerospace growth continues to lag: While growth in the commercial aircraft sector has surged in recent years, organic growth in the Aerospace division has lagged – delivering a four-year CAGR of just 1.8%. This is due to a combination of delayed commercial aircraft programmes (the 787 and the A350) and lower military aircraft volumes (the C-17, the F-18 and the F-15). The pace of production ramp-up on the A350 represents the greatest risk to near-term growth expectations, in our view, as volumes are set to increase sharply up from a low base. The A350 delay risks are mitigated by programme maturity and recent programme status updates communicated by Airbus. On the military side, we expect continued volume declines on mature aircraft programmes, although this will partly be offset by the steady ramp-up in production of new, well-funded core programmes such as the A400M, the F-35/JSF and the CH53-K helicopter.
• Land Systems strategy is less clear: The Land Systems division continues to underperform, having reported an organic decline in sales of 9% in Q114 which followed a 6% decline in the year ended 2013 and a 1% decline in 2012. This can be largely explained by end-market cyclicality, initially in the mining and construction sectors, and more recently in the agricultural equipment market. Notwithstanding market volatility, the long-term strategic direction of Land Systems is not clear to us. Only modest progress has been made against strategic objectives communicated at the time the division was created in 2010, which included to globalise and increase the proportion sales outside of Europe and to grow revenues both organically and by acquisition to £1.5bn within five years. We forecast sales of £860m in 2014.
• Cyclicality/valuation risk: GKN is one of the more cyclical companies in our coverage, due to its exposure to automotive and industrial end-markets. This has translated historically to share price volatility, with share price performance particularly correlated to the global automotive sector (c80% share price correlation over 30 years). However, the relationship is lessening as exposure to the less cyclical and higher rated aerospace sector has increased. Nevertheless, a slowdown in global auto production remains a central risk to the shares, initially to a de-rating rating and ultimately to forecasts revisions.
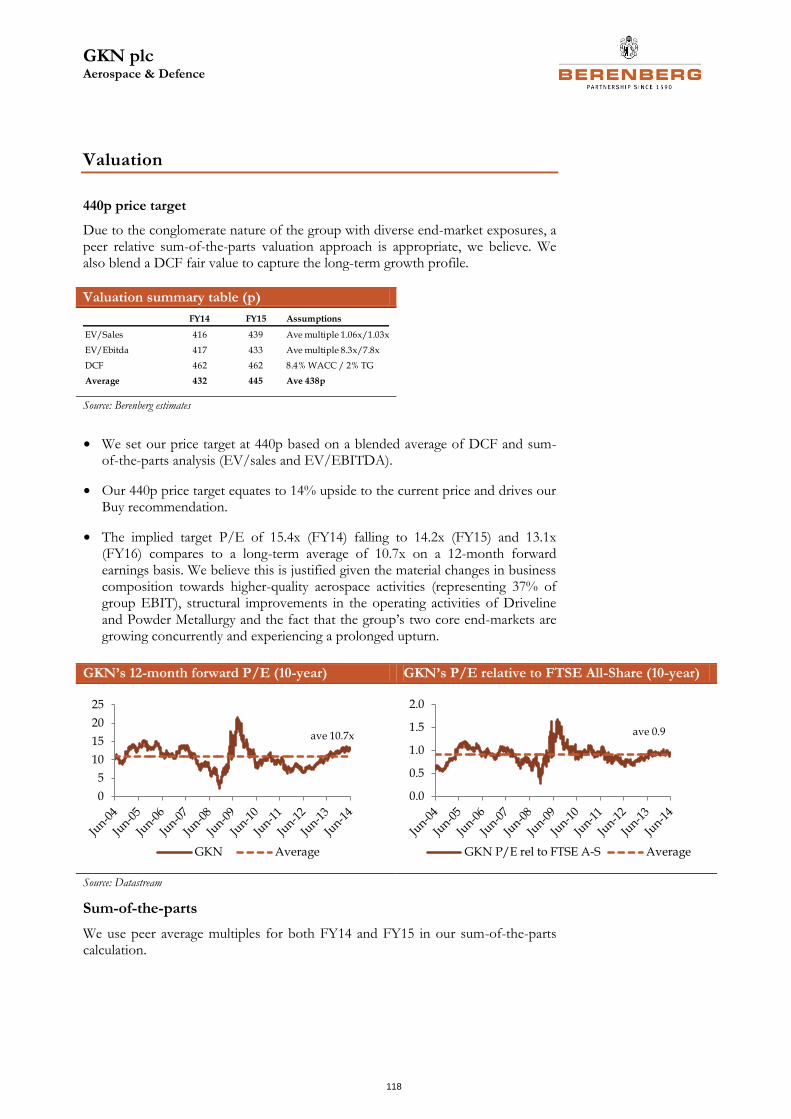
GKN plc Aerospace & Defence
118
Valuation
440p price target
Due to the conglomerate nature of the group with diverse end-market exposures, a peer relative sum-of-the-parts valuation approach is appropriate, we believe. We also blend a DCF fair value to capture the long-term growth profile.
Valuation summary table (p)
Source: Berenberg estimates
• We set our price target at 440p based on a blended average of DCF and sum-of-the-parts analysis (EV/sales and EV/EBITDA).
• Our 440p price target equates to 14% upside to the current price and drives our Buy recommendation.
• The implied target P/E of 15.4x (FY14) falling to 14.2x (FY15) and 13.1x (FY16) compares to a long-term average of 10.7x on a 12-month forward earnings basis. We believe this is justified given the material changes in business composition towards higher-quality aerospace activities (representing 37% of group EBIT), structural improvements in the operating activities of Driveline and Powder Metallurgy and the fact that the group’s two core end-markets are growing concurrently and experiencing a prolonged upturn.
Sum-of-the-parts
We use peer average multiples for both FY14 and FY15 in our sum-of-the-parts calculation.
FY14 FY15 Assumptions
EV/Sales 416 439 Ave multiple 1.06x/1.03x
EV/Ebitda 417 433 Ave multiple 8.3x/7.8x
DCF 462 462 8.4% WACC / 2% TG
Average 432 445 Ave 438p
GKN’s 12-month forward P/E (10-year) GKN’s P/E relative to FTSE All-Share (10-year)
Source: Datastream
0
5
10
15
20
25
GKN Average
ave 10.7x
0.0
0.5
1.0
1.5
2.0
GKN P/E rel to FTSE A-S Average
ave 0.9
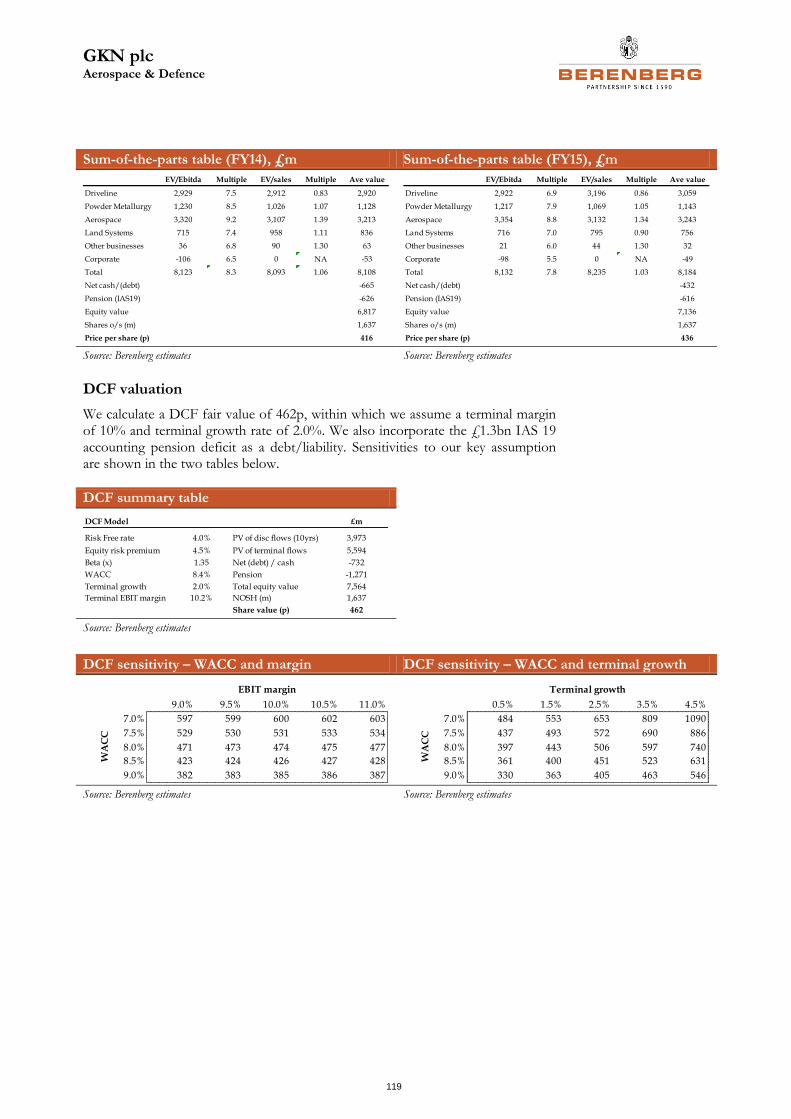
GKN plc Aerospace & Defence
119
Sum-of-the-parts table (FY14), £m Sum-of-the-parts table (FY15), £m
Source: Berenberg estimates Source: Berenberg estimates
DCF valuation
We calculate a DCF fair value of 462p, within which we assume a terminal margin of 10% and terminal growth rate of 2.0%. We also incorporate the £1.3bn IAS 19 accounting pension deficit as a debt/liability. Sensitivities to our key assumption are shown in the two tables below.
DCF summary table
Source: Berenberg estimates
DCF sensitivity – WACC and margin DCF sensitivity – WACC and terminal growth
Source: Berenberg estimates Source: Berenberg estimates
EV/Ebitda Multiple EV/sales Multiple Ave value
Driveline 2,929 7.5 2,912 0.83 2,920
Powder Metallurgy 1,230 8.5 1,026 1.07 1,128
Aerospace 3,320 9.2 3,107 1.39 3,213
Land Systems 715 7.4 958 1.11 836
Other businesses 36 6.8 90 1.30 63
Corporate -106 6.5 0 NA -53
Total 8,123 8.3 8,093 1.06 8,108
Net cash/(debt) -665
Pension (IAS19) -626
Equity value 6,817
Shares o/s (m) 1,637
Price per share (p) 416
EV/Ebitda Multiple EV/sales Multiple Ave value
Driveline 2,922 6.9 3,196 0.86 3,059
Powder Metallurgy 1,217 7.9 1,069 1.05 1,143
Aerospace 3,354 8.8 3,132 1.34 3,243
Land Systems 716 7.0 795 0.90 756
Other businesses 21 6.0 44 1.30 32
Corporate -98 5.5 0 NA -49
Total 8,132 7.8 8,235 1.03 8,184
Net cash/(debt) -432
Pension (IAS19) -616
Equity value 7,136
Shares o/s (m) 1,637
Price per share (p) 436
DCF Model £m
Risk Free rate 4.0% PV of disc flows (10yrs) 3,973
Equity risk premium 4.5% PV of terminal flows 5,594
Beta (x) 1.35 Net (debt) / cash -732
WACC 8.4% Pension -1,271
Terminal growth 2.0% Total equity value 7,564
Terminal EBIT margin 10.2% NOSH (m) 1,637
Share value (p) 462
462 9.0% 9.5% 10.0% 10.5% 11.0%
7.0% 597 599 600 602 603
7.5% 529 530 531 533 534
8.0% 471 473 474 475 477
8.5% 423 424 426 427 428
9.0% 382 383 385 386 387
EBIT margin
WA
CC
462 0.5% 1.5% 2.5% 3.5% 4.5%
7.0% 484 553 653 809 1090
7.5% 437 493 572 690 886
8.0% 397 443 506 597 740
8.5% 361 400 451 523 631
9.0% 330 363 405 463 546
Terminal growth
WA
CC
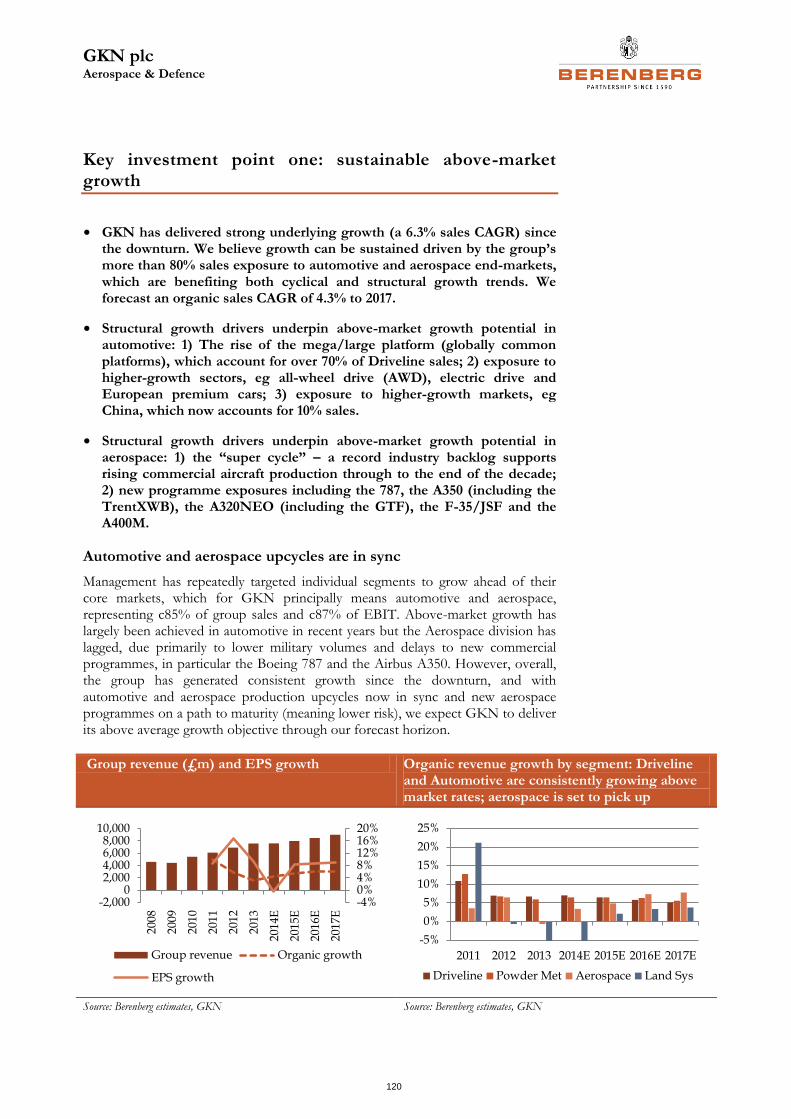
GKN plc Aerospace & Defence
120
Key investment point one: sustainable above-market growth
• GKN has delivered strong underlying growth (a 6.3% sales CAGR) since the downturn. We believe growth can be sustained driven by the group’s more than 80% sales exposure to automotive and aerospace end-markets, which are benefiting both cyclical and structural growth trends. We forecast an organic sales CAGR of 4.3% to 2017.
• Structural growth drivers underpin above-market growth potential in automotive: 1) The rise of the mega/large platform (globally common platforms), which account for over 70% of Driveline sales; 2) exposure to higher-growth sectors, eg all-wheel drive (AWD), electric drive and European premium cars; 3) exposure to higher-growth markets, eg China, which now accounts for 10% sales.
• Structural growth drivers underpin above-market growth potential in aerospace: 1) the “super cycle” – a record industry backlog supports rising commercial aircraft production through to the end of the decade; 2) new programme exposures including the 787, the A350 (including the TrentXWB), the A320NEO (including the GTF), the F-35/JSF and the A400M.
Automotive and aerospace upcycles are in sync
Management has repeatedly targeted individual segments to grow ahead of their core markets, which for GKN principally means automotive and aerospace, representing c85% of group sales and c87% of EBIT. Above-market growth has largely been achieved in automotive in recent years but the Aerospace division has lagged, due primarily to lower military volumes and delays to new commercial programmes, in particular the Boeing 787 and the Airbus A350. However, overall, the group has generated consistent growth since the downturn, and with automotive and aerospace production upcycles now in sync and new aerospace programmes on a path to maturity (meaning lower risk), we expect GKN to deliver its above average growth objective through our forecast horizon.
Group revenue (£m) and EPS growth Organic revenue growth by segment: Driveline and Automotive are consistently growing above market rates; aerospace is set to pick up
Source: Berenberg estimates, GKN Source: Berenberg estimates, GKN
-4%0%4%8%12%16%20%
-2,0000
2,0004,0006,0008,000
10,000
200
8
200
9
201
0
201
1
201
2
201
3
201
4E
201
5E
2016
E
2017
E
Group revenue Organic growth
EPS growth
-5%
0%
5%
10%
15%
20%
25%
2011 2012 2013 2014E 2015E 2016E 2017E
Driveline Powder Met Aerospace Land Sys
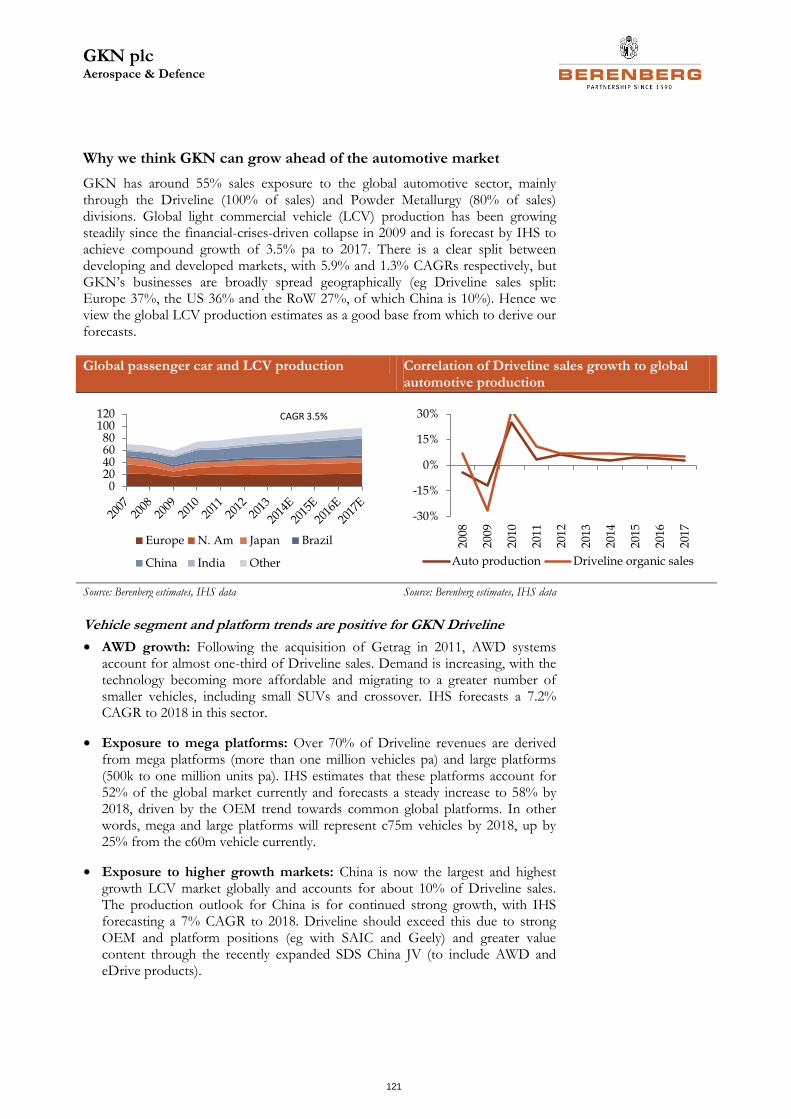
GKN plc Aerospace & Defence
121
Why we think GKN can grow ahead of the automotive market
GKN has around 55% sales exposure to the global automotive sector, mainly through the Driveline (100% of sales) and Powder Metallurgy (80% of sales) divisions. Global light commercial vehicle (LCV) production has been growing steadily since the financial-crises-driven collapse in 2009 and is forecast by IHS to achieve compound growth of 3.5% pa to 2017. There is a clear split between developing and developed markets, with 5.9% and 1.3% CAGRs respectively, but GKN’s businesses are broadly spread geographically (eg Driveline sales split: Europe 37%, the US 36% and the RoW 27%, of which China is 10%). Hence we view the global LCV production estimates as a good base from which to derive our forecasts.
Global passenger car and LCV production Correlation of Driveline sales growth to global automotive production
Source: Berenberg estimates, IHS data Source: Berenberg estimates, IHS data
Vehicle segment and platform trends are positive for GKN Driveline
• AWD growth: Following the acquisition of Getrag in 2011, AWD systems account for almost one-third of Driveline sales. Demand is increasing, with the technology becoming more affordable and migrating to a greater number of smaller vehicles, including small SUVs and crossover. IHS forecasts a 7.2% CAGR to 2018 in this sector.
• Exposure to mega platforms: Over 70% of Driveline revenues are derived from mega platforms (more than one million vehicles pa) and large platforms (500k to one million units pa). IHS estimates that these platforms account for 52% of the global market currently and forecasts a steady increase to 58% by 2018, driven by the OEM trend towards common global platforms. In other words, mega and large platforms will represent c75m vehicles by 2018, up by 25% from the c60m vehicle currently.
• Exposure to higher growth markets: China is now the largest and highest growth LCV market globally and accounts for about 10% of Driveline sales. The production outlook for China is for continued strong growth, with IHS forecasting a 7% CAGR to 2018. Driveline should exceed this due to strong OEM and platform positions (eg with SAIC and Geely) and greater value content through the recently expanded SDS China JV (to include AWD and eDrive products).
020406080
100120
Europe N. Am Japan Brazil
China India Other
CAGR 3.5%
-30%
-15%
0%
15%
30%
200
8
200
9
2010
201
1
201
2
201
3
2014
201
5
201
6
201
7
Auto production Driveline organic sales
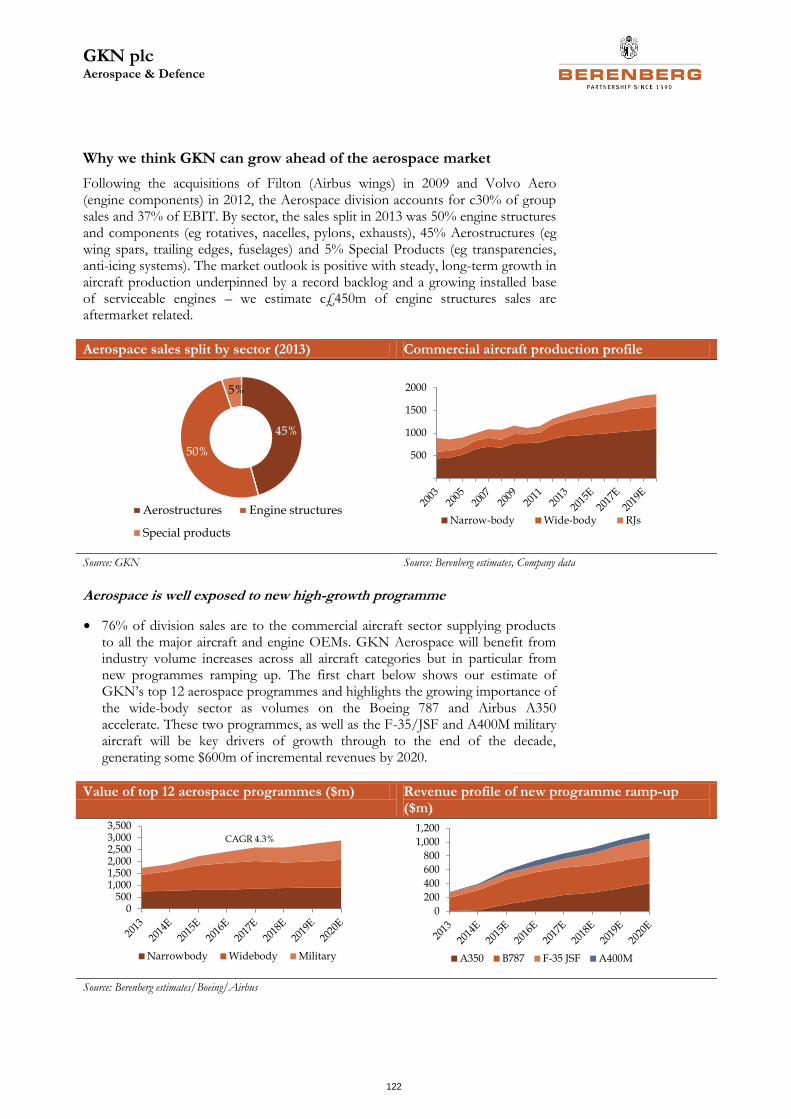
GKN plc Aerospace & Defence
122
Why we think GKN can grow ahead of the aerospace market
Following the acquisitions of Filton (Airbus wings) in 2009 and Volvo Aero (engine components) in 2012, the Aerospace division accounts for c30% of group sales and 37% of EBIT. By sector, the sales split in 2013 was 50% engine structures and components (eg rotatives, nacelles, pylons, exhausts), 45% Aerostructures (eg wing spars, trailing edges, fuselages) and 5% Special Products (eg transparencies, anti-icing systems). The market outlook is positive with steady, long-term growth in aircraft production underpinned by a record backlog and a growing installed base of serviceable engines – we estimate c£450m of engine structures sales are aftermarket related.
Aerospace sales split by sector (2013) Commercial aircraft production profile
Source: GKN Source: Berenberg estimates, Company data
Aerospace is well exposed to new high-growth programme
• 76% of division sales are to the commercial aircraft sector supplying products to all the major aircraft and engine OEMs. GKN Aerospace will benefit from industry volume increases across all aircraft categories but in particular from new programmes ramping up. The first chart below shows our estimate of GKN’s top 12 aerospace programmes and highlights the growing importance of the wide-body sector as volumes on the Boeing 787 and Airbus A350 accelerate. These two programmes, as well as the F-35/JSF and A400M military aircraft will be key drivers of growth through to the end of the decade, generating some $600m of incremental revenues by 2020.
Value of top 12 aerospace programmes ($m) Revenue profile of new programme ramp-up ($m)
Source: Berenberg estimates/Boeing/Airbus
45%
50%
5%
Aerostructures Engine structures
Special products
500
1000
1500
2000
Narrow-body Wide-body RJs
0500
1,0001,5002,0002,5003,0003,500
Narrowbody Widebody Military
CAGR 4.3%
0
200
400
600
800
1,000
1,200
A350 B787 F-35 JSF A400M

GKN plc Aerospace & Defence
123
• Commercial aerospace growth will be tempered by lower military aircraft volumes Military sales have declined by over £100m since 2009 (a -4% CAGR) as activity on mature programmes such as the C-17 and F/A-18 slowed. We expect further reductions over the coming years and assume in our model a -4% sales CAGR to 2017 (to around £500m), weighted to 2014 and 2015. Downside risk is mitigated by increasing A400M and the F-35/JSF volumes, both well-funded programmes where production is set to rise as previously mentioned.
GKN plc Aerospace & Defence
124
Investment point two: M&A upside
• Management has built a good track record of creating shareholder value through large-scale M&A (Filton/Airbus wings, Getrag/Driveline and Volvo Aero/engine systems).
• GKN has publically stated an interest in the WS division of Spirit Aerosystems (SPR US, not rated) which was put up for sale last year. WS would be an excellent strategic fit for the group’s existing wing structures business.
• At c$1.5bn of sales, WS would represent a large transaction. Valuation uncertainties centre on its recent poor financial performance, which is due to legacy contract structures. We have faith that GKN management will only pursue a deal that is value-creative for shareholders.
• If WS were achieving more “normal” margins of c10%, we suggest a £1bn valuation would be realistic. This could comfortably be financed from existing debt resources (taking leverage to c1.5x). On this basis, we estimate c5% earnings accretion.
Spirit WS – what is it?
Spirit WS is a division of Spirit Aerosystems, the aerospace structures business that was spun out of Boeing in 2005. WS specialises in the development and manufacture of aircraft wing structures and components such as flight control surfaces. Unsurprisingly, Boeing is Spirit’s largest customer by sales (85% of group revenues), although WS also has built positions with several other aircraft OEMs, most notably Gulfstream and Airbus.
WS would be a very complementary fit for GKN, in our view. It is the Boeing equivalent and direct peer to GKN’s existing wings business that was acquired from Airbus in 2009 and which designs and manufactures primary wing structures for all Airbus aircraft. WS would significantly increase exposure to Boeing Commercial Airplanes (BCA), which currently represents just 3% of sales, compared to c24% for Airbus. WS annual sales are around $1.5bn/£900m, larger than GKN’s existing wing activities at around £700m.
Poor financial record
WS revenues have been steadily rising in line with Boeing production over the past five years. Profit performance has been woeful, however, mainly due to poor contract execution and, most significantly, the impact of certain loss-making contract structures, most notably on the Gulfstream G280 and G650 programmes. We estimate that WS programme losses on fixed price contracts have totalled $747m over the past two years. Q114 saw an improvement in profitably to its highest level in five years (12% margin and $50m of EBIT), due in part to favourable cumulative catch-up adjustments on mature programmes. Margin performance in years prior has been highly volatile with performance ranging from heavily loss-making in 2012 and 2013 (more than $400m), to a peak annual margin of 9.5% in 2010.
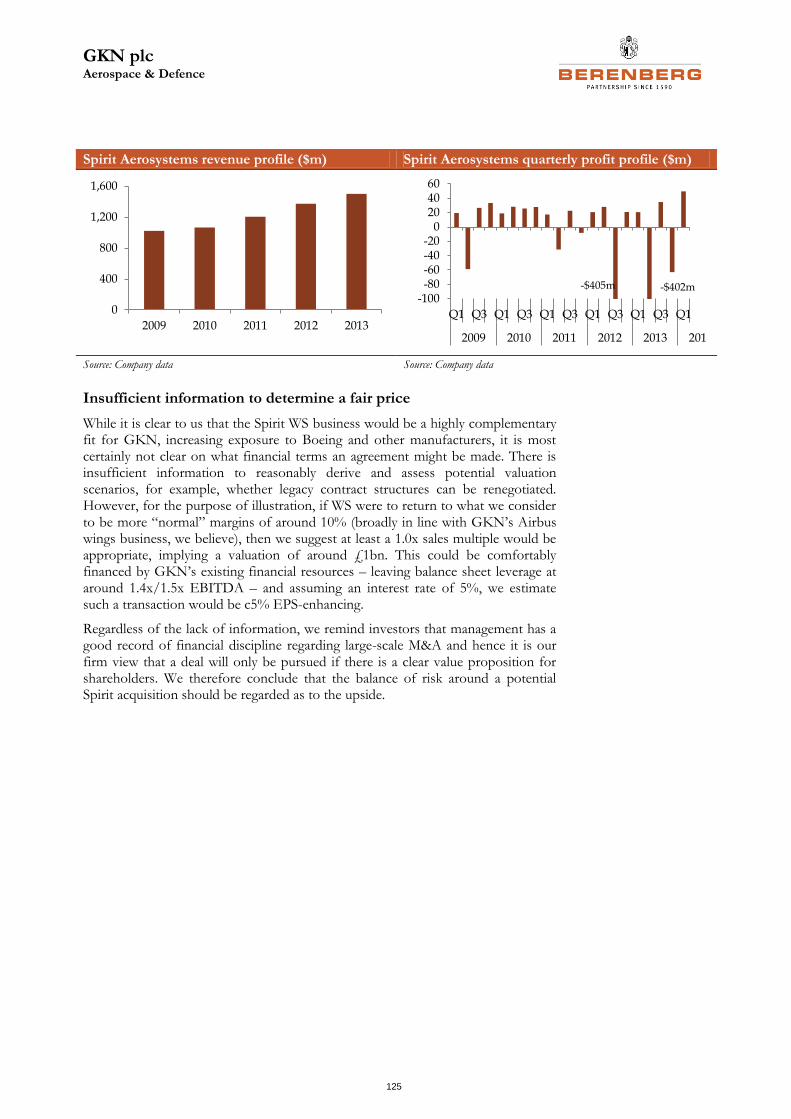
GKN plc Aerospace & Defence
125
Spirit Aerosystems revenue profile ($m) Spirit Aerosystems quarterly profit profile ($m)
Source: Company data Source: Company data
Insufficient information to determine a fair price
While it is clear to us that the Spirit WS business would be a highly complementary fit for GKN, increasing exposure to Boeing and other manufacturers, it is most certainly not clear on what financial terms an agreement might be made. There is insufficient information to reasonably derive and assess potential valuation scenarios, for example, whether legacy contract structures can be renegotiated. However, for the purpose of illustration, if WS were to return to what we consider to be more “normal” margins of around 10% (broadly in line with GKN’s Airbus wings business, we believe), then we suggest at least a 1.0x sales multiple would be appropriate, implying a valuation of around £1bn. This could be comfortably financed by GKN’s existing financial resources – leaving balance sheet leverage at around 1.4x/1.5x EBITDA – and assuming an interest rate of 5%, we estimate such a transaction would be c5% EPS-enhancing.
Regardless of the lack of information, we remind investors that management has a good record of financial discipline regarding large-scale M&A and hence it is our firm view that a deal will only be pursued if there is a clear value proposition for shareholders. We therefore conclude that the balance of risk around a potential Spirit acquisition should be regarded as to the upside.
0
400
800
1,200
1,600
2009 2010 2011 2012 2013
-100-80-60-40-20
0204060
Q1 Q3 Q1 Q3 Q1 Q3 Q1 Q3 Q1 Q3 Q1
2009 2010 2011 2012 2013 2014
-$405m -$402m
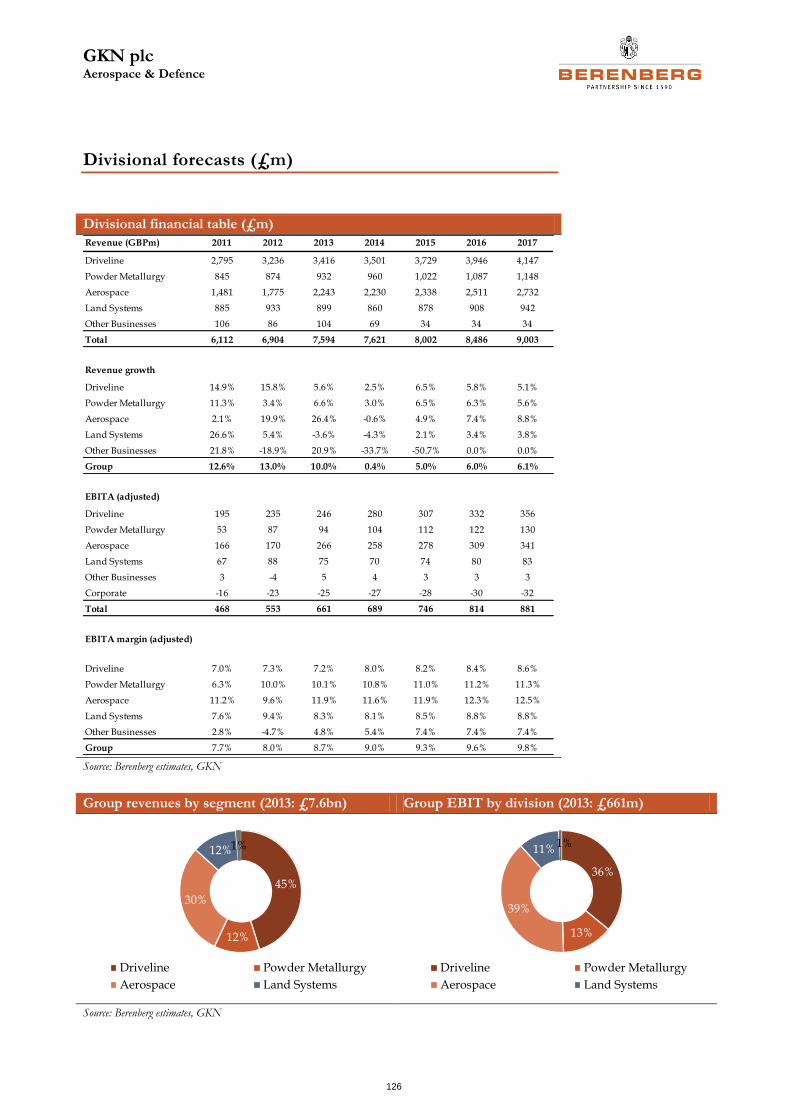
GKN plc Aerospace & Defence
126
Divisional forecasts (£m)
Divisional financial table (£m)
Source: Berenberg estimates, GKN
Group revenues by segment (2013: £7.6bn) Group EBIT by division (2013: £661m)
Source: Berenberg estimates, GKN
Revenue (GBPm) 2011 2012 2013 2014 2015 2016 2017
Driveline 2,795 3,236 3,416 3,501 3,729 3,946 4,147
Powder Metallurgy 845 874 932 960 1,022 1,087 1,148
Aerospace 1,481 1,775 2,243 2,230 2,338 2,511 2,732
Land Systems 885 933 899 860 878 908 942
Other Businesses 106 86 104 69 34 34 34
Total 6,112 6,904 7,594 7,621 8,002 8,486 9,003
Revenue growth
Driveline 14.9% 15.8% 5.6% 2.5% 6.5% 5.8% 5.1%
Powder Metallurgy 11.3% 3.4% 6.6% 3.0% 6.5% 6.3% 5.6%
Aerospace 2.1% 19.9% 26.4% -0.6% 4.9% 7.4% 8.8%
Land Systems 26.6% 5.4% -3.6% -4.3% 2.1% 3.4% 3.8%
Other Businesses 21.8% -18.9% 20.9% -33.7% -50.7% 0.0% 0.0%
Group 12.6% 13.0% 10.0% 0.4% 5.0% 6.0% 6.1%
EBITA (adjusted)
Driveline 195 235 246 280 307 332 356
Powder Metallurgy 53 87 94 104 112 122 130
Aerospace 166 170 266 258 278 309 341
Land Systems 67 88 75 70 74 80 83
Other Businesses 3 -4 5 4 3 3 3
Corporate -16 -23 -25 -27 -28 -30 -32
Total 468 553 661 689 746 814 881
EBITA margin (adjusted)
Driveline 7.0% 7.3% 7.2% 8.0% 8.2% 8.4% 8.6%
Powder Metallurgy 6.3% 10.0% 10.1% 10.8% 11.0% 11.2% 11.3%
Aerospace 11.2% 9.6% 11.9% 11.6% 11.9% 12.3% 12.5%
Land Systems 7.6% 9.4% 8.3% 8.1% 8.5% 8.8% 8.8%
Other Businesses 2.8% -4.7% 4.8% 5.4% 7.4% 7.4% 7.4%
Group 7.7% 8.0% 8.7% 9.0% 9.3% 9.6% 9.8%
45%
12%
30%
12%1%
Driveline Powder Metallurgy
Aerospace Land Systems
36%
13%
39%
11%1%
Driveline Powder Metallurgy
Aerospace Land Systems
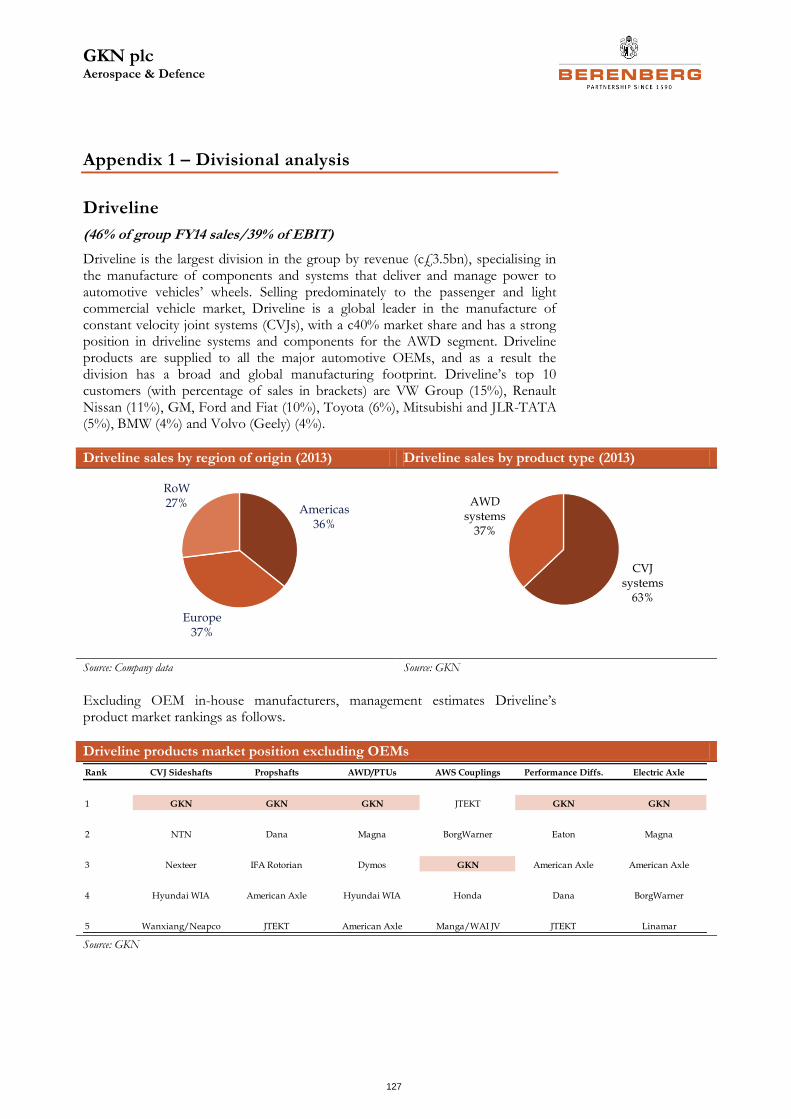
GKN plc Aerospace & Defence
127
Appendix 1 – Divisional analysis
Driveline
(46% of group FY14 sales/39% of EBIT)
Driveline is the largest division in the group by revenue (c£3.5bn), specialising in the manufacture of components and systems that deliver and manage power to automotive vehicles’ wheels. Selling predominately to the passenger and light commercial vehicle market, Driveline is a global leader in the manufacture of constant velocity joint systems (CVJs), with a c40% market share and has a strong position in driveline systems and components for the AWD segment. Driveline products are supplied to all the major automotive OEMs, and as a result the division has a broad and global manufacturing footprint. Driveline’s top 10 customers (with percentage of sales in brackets) are VW Group (15%), Renault Nissan (11%), GM, Ford and Fiat (10%), Toyota (6%), Mitsubishi and JLR-TATA (5%), BMW (4%) and Volvo (Geely) (4%).
Driveline sales by region of origin (2013) Driveline sales by product type (2013)
Source: Company data Source: GKN
Excluding OEM in-house manufacturers, management estimates Driveline’s product market rankings as follows.
Driveline products market position excluding OEMs
Source: GKN
Americas36%
Europe37%
RoW27%
CVJ systems
63%
AWD systems
37%
Rank CVJ Sideshafts Propshafts AWD/PTUs AWS Couplings Performance Diffs. Electric Axle
1 GKN GKN GKN JTEKT GKN GKN
2 NTN Dana Magna BorgWarner Eaton Magna
3 Nexteer IFA Rotorian Dymos GKN American Axle American Axle
4 Hyundai WIA American Axle Hyundai WIA Honda Dana BorgWarner
5 Wanxiang/Neapco JTEKT American Axle Manga/WAI JV JTEKT Linamar
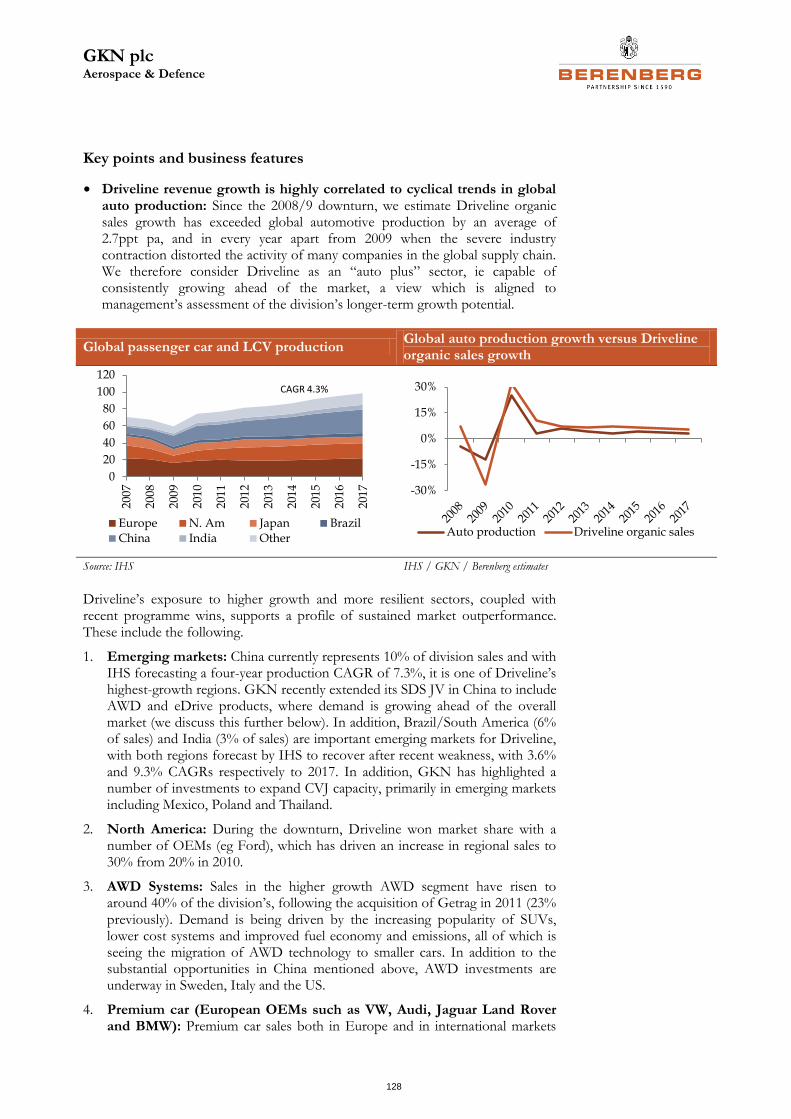
GKN plc Aerospace & Defence
128
Key points and business features
• Driveline revenue growth is highly correlated to cyclical trends in global auto production: Since the 2008/9 downturn, we estimate Driveline organic sales growth has exceeded global automotive production by an average of 2.7ppt pa, and in every year apart from 2009 when the severe industry contraction distorted the activity of many companies in the global supply chain. We therefore consider Driveline as an “auto plus” sector, ie capable of consistently growing ahead of the market, a view which is aligned to management’s assessment of the division’s longer-term growth potential.
Global passenger car and LCV production Global auto production growth versus Driveline organic sales growth
Source: IHS IHS / GKN / Berenberg estimates
Driveline’s exposure to higher growth and more resilient sectors, coupled with recent programme wins, supports a profile of sustained market outperformance. These include the following.
1. Emerging markets: China currently represents 10% of division sales and with IHS forecasting a four-year production CAGR of 7.3%, it is one of Driveline’s highest-growth regions. GKN recently extended its SDS JV in China to include AWD and eDrive products, where demand is growing ahead of the overall market (we discuss this further below). In addition, Brazil/South America (6% of sales) and India (3% of sales) are important emerging markets for Driveline, with both regions forecast by IHS to recover after recent weakness, with 3.6% and 9.3% CAGRs respectively to 2017. In addition, GKN has highlighted a number of investments to expand CVJ capacity, primarily in emerging markets including Mexico, Poland and Thailand.
2. North America: During the downturn, Driveline won market share with a number of OEMs (eg Ford), which has driven an increase in regional sales to 30% from 20% in 2010.
3. AWD Systems: Sales in the higher growth AWD segment have risen to around 40% of the division’s, following the acquisition of Getrag in 2011 (23% previously). Demand is being driven by the increasing popularity of SUVs, lower cost systems and improved fuel economy and emissions, all of which is seeing the migration of AWD technology to smaller cars. In addition to the substantial opportunities in China mentioned above, AWD investments are underway in Sweden, Italy and the US.
4. Premium car (European OEMs such as VW, Audi, Jaguar Land Rover and BMW): Premium car sales both in Europe and in international markets
0
20
40
60
80
100
120
200
7
2008
200
9
2010
201
1
2012
201
3
2014
201
5
2016
201
7
Europe N. Am Japan BrazilChina India Other
CAGR 4.3%
-30%
-15%
0%
15%
30%
Auto production Driveline organic sales
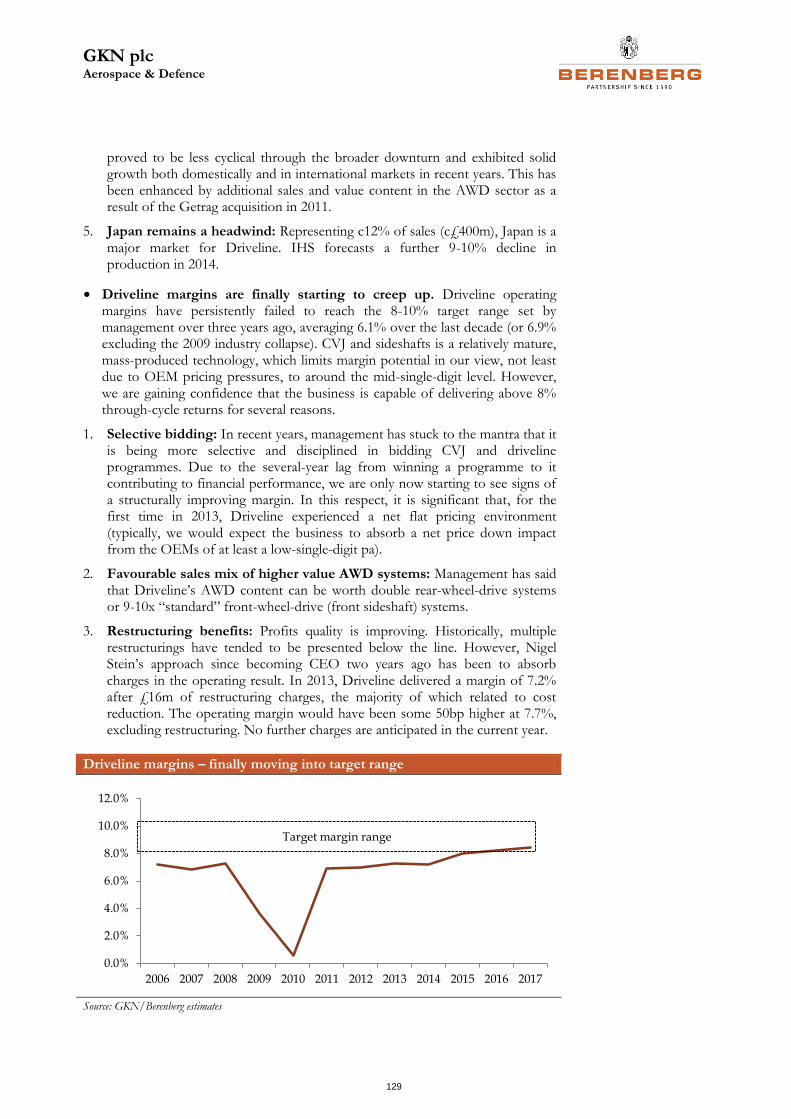
GKN plc Aerospace & Defence
129
proved to be less cyclical through the broader downturn and exhibited solid growth both domestically and in international markets in recent years. This has been enhanced by additional sales and value content in the AWD sector as a result of the Getrag acquisition in 2011.
5. Japan remains a headwind: Representing c12% of sales (c£400m), Japan is a major market for Driveline. IHS forecasts a further 9-10% decline in production in 2014.
• Driveline margins are finally starting to creep up. Driveline operating margins have persistently failed to reach the 8-10% target range set by management over three years ago, averaging 6.1% over the last decade (or 6.9% excluding the 2009 industry collapse). CVJ and sideshafts is a relatively mature, mass-produced technology, which limits margin potential in our view, not least due to OEM pricing pressures, to around the mid-single-digit level. However, we are gaining confidence that the business is capable of delivering above 8% through-cycle returns for several reasons.
1. Selective bidding: In recent years, management has stuck to the mantra that it is being more selective and disciplined in bidding CVJ and driveline programmes. Due to the several-year lag from winning a programme to it contributing to financial performance, we are only now starting to see signs of a structurally improving margin. In this respect, it is significant that, for the first time in 2013, Driveline experienced a net flat pricing environment (typically, we would expect the business to absorb a net price down impact from the OEMs of at least a low-single-digit pa).
2. Favourable sales mix of higher value AWD systems: Management has said that Driveline’s AWD content can be worth double rear-wheel-drive systems or 9-10x “standard” front-wheel-drive (front sideshaft) systems.
3. Restructuring benefits: Profits quality is improving. Historically, multiple restructurings have tended to be presented below the line. However, Nigel Stein’s approach since becoming CEO two years ago has been to absorb charges in the operating result. In 2013, Driveline delivered a margin of 7.2% after £16m of restructuring charges, the majority of which related to cost reduction. The operating margin would have been some 50bp higher at 7.7%, excluding restructuring. No further charges are anticipated in the current year.
Driveline margins – finally moving into target range
Source: GKN/Berenberg estimates
0.0%
2.0%
4.0%
6.0%
8.0%
10.0%
12.0%
2006 2007 2008 2009 2010 2011 2012 2013 2014 2015 2016 2017
Target margin range
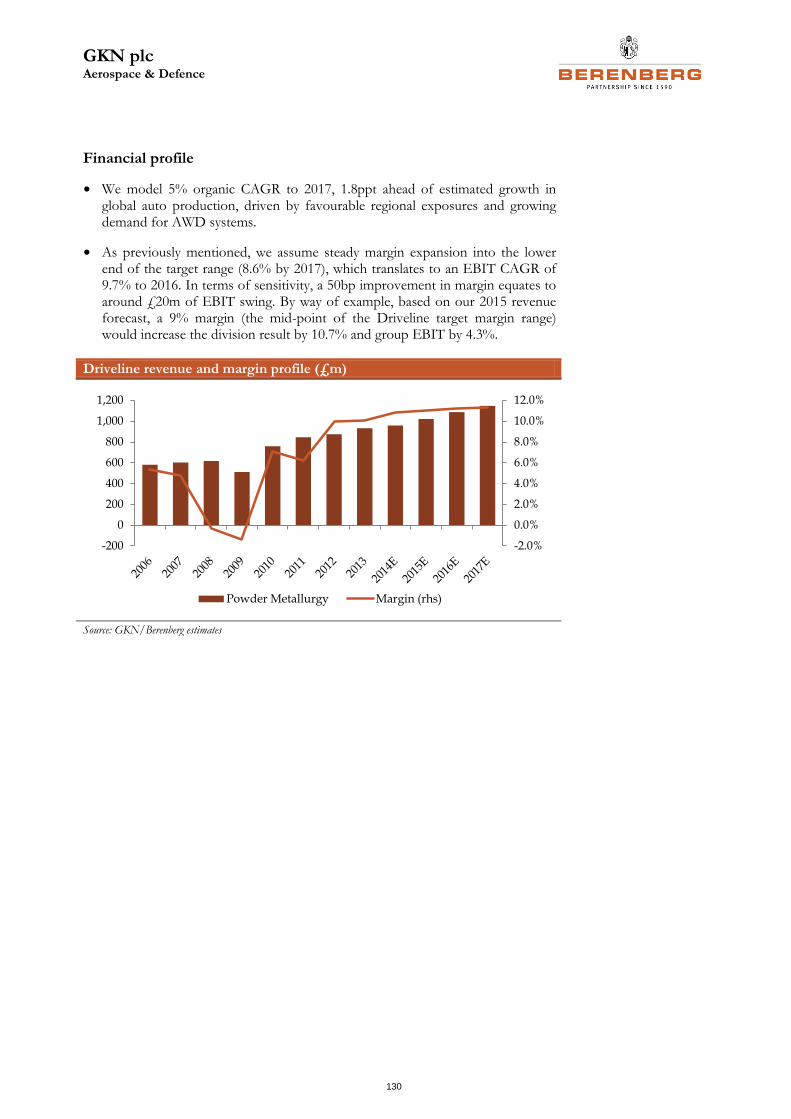
GKN plc Aerospace & Defence
130
Financial profile
• We model 5% organic CAGR to 2017, 1.8ppt ahead of estimated growth in global auto production, driven by favourable regional exposures and growing demand for AWD systems.
• As previously mentioned, we assume steady margin expansion into the lower end of the target range (8.6% by 2017), which translates to an EBIT CAGR of 9.7% to 2016. In terms of sensitivity, a 50bp improvement in margin equates to around £20m of EBIT swing. By way of example, based on our 2015 revenue forecast, a 9% margin (the mid-point of the Driveline target margin range) would increase the division result by 10.7% and group EBIT by 4.3%.
Driveline revenue and margin profile (£m)
Source: GKN/Berenberg estimates
-2.0%
0.0%
2.0%
4.0%
6.0%
8.0%
10.0%
12.0%
-200
0
200
400
600
800
1,000
1,200
Powder Metallurgy Margin (rhs)
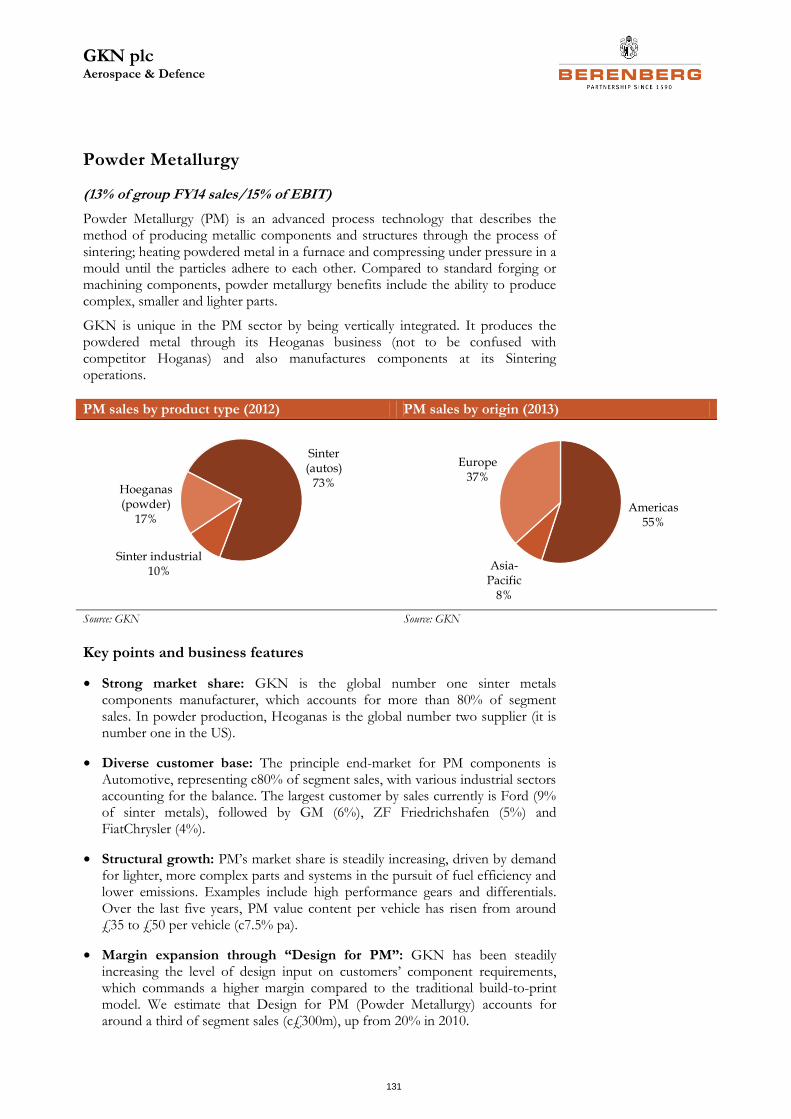
GKN plc Aerospace & Defence
131
Powder Metallurgy
(13% of group FY14 sales/15% of EBIT)
Powder Metallurgy (PM) is an advanced process technology that describes the method of producing metallic components and structures through the process of sintering; heating powdered metal in a furnace and compressing under pressure in a mould until the particles adhere to each other. Compared to standard forging or machining components, powder metallurgy benefits include the ability to produce complex, smaller and lighter parts.
GKN is unique in the PM sector by being vertically integrated. It produces the powdered metal through its Heoganas business (not to be confused with competitor Hoganas) and also manufactures components at its Sintering operations.
PM sales by product type (2012) PM sales by origin (2013)
Source: GKN Source: GKN
Key points and business features
• Strong market share: GKN is the global number one sinter metals components manufacturer, which accounts for more than 80% of segment sales. In powder production, Heoganas is the global number two supplier (it is number one in the US).
• Diverse customer base: The principle end-market for PM components is Automotive, representing c80% of segment sales, with various industrial sectors accounting for the balance. The largest customer by sales currently is Ford (9% of sinter metals), followed by GM (6%), ZF Friedrichshafen (5%) and FiatChrysler (4%).
• Structural growth: PM’s market share is steadily increasing, driven by demand for lighter, more complex parts and systems in the pursuit of fuel efficiency and lower emissions. Examples include high performance gears and differentials. Over the last five years, PM value content per vehicle has risen from around £35 to £50 per vehicle (c7.5% pa).
• Margin expansion through “Design for PM”: GKN has been steadily increasing the level of design input on customers’ component requirements, which commands a higher margin compared to the traditional build-to-print model. We estimate that Design for PM (Powder Metallurgy) accounts for around a third of segment sales (c£300m), up from 20% in 2010.
Sinter (autos)
73%Hoeganas (powder)
17%
Sinter industrial 10%
Americas55%
Asia-Pacific
8%
Europe37%
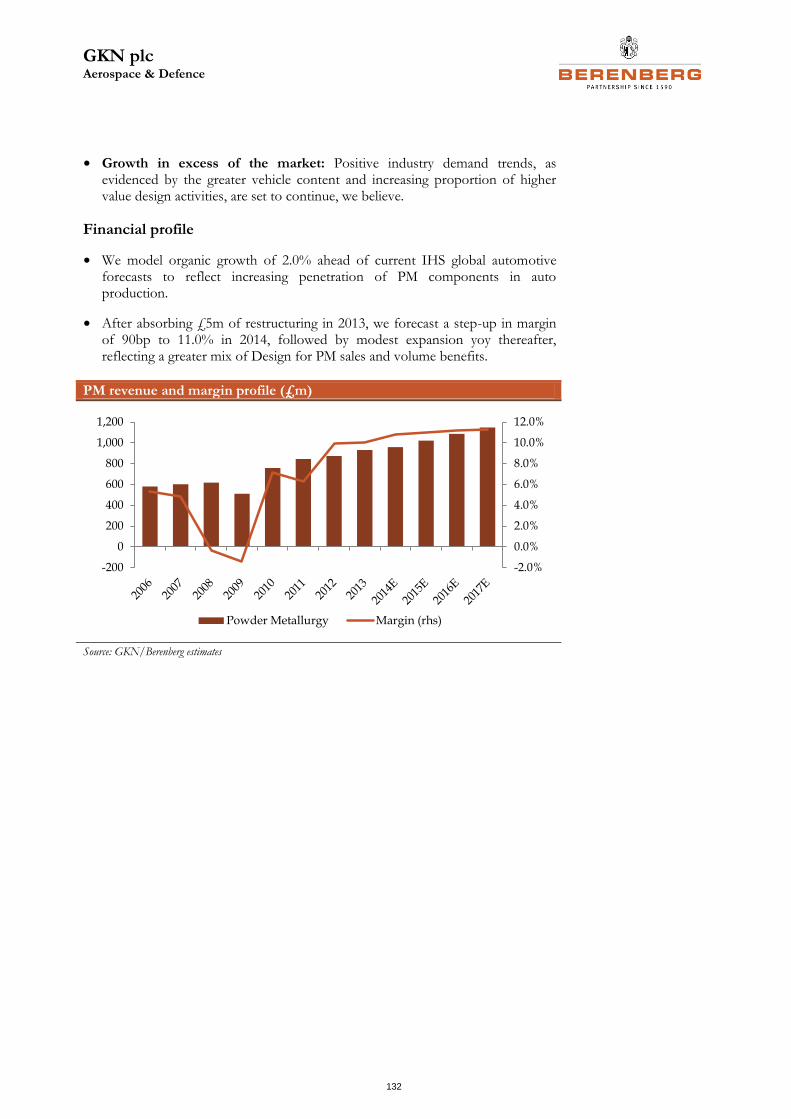
GKN plc Aerospace & Defence
132
• Growth in excess of the market: Positive industry demand trends, as evidenced by the greater vehicle content and increasing proportion of higher value design activities, are set to continue, we believe.
Financial profile
• We model organic growth of 2.0% ahead of current IHS global automotive forecasts to reflect increasing penetration of PM components in auto production.
• After absorbing £5m of restructuring in 2013, we forecast a step-up in margin of 90bp to 11.0% in 2014, followed by modest expansion yoy thereafter, reflecting a greater mix of Design for PM sales and volume benefits.
PM revenue and margin profile (£m)
Source: GKN/Berenberg estimates
-2.0%
0.0%
2.0%
4.0%
6.0%
8.0%
10.0%
12.0%
-200
0
200
400
600
800
1,000
1,200
Powder Metallurgy Margin (rhs)
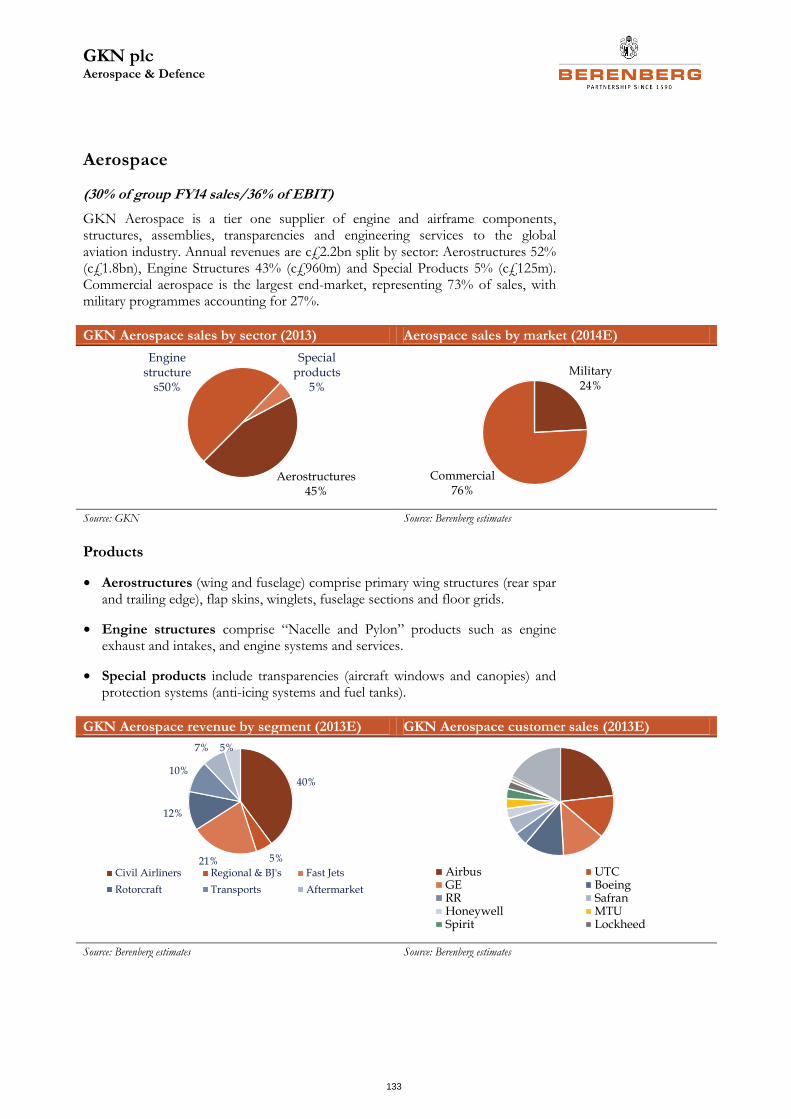
GKN plc Aerospace & Defence
133
Aerospace
(30% of group FY14 sales/36% of EBIT)
GKN Aerospace is a tier one supplier of engine and airframe components, structures, assemblies, transparencies and engineering services to the global aviation industry. Annual revenues are c£2.2bn split by sector: Aerostructures 52% (c£1.8bn), Engine Structures 43% (c£960m) and Special Products 5% (c£125m). Commercial aerospace is the largest end-market, representing 73% of sales, with military programmes accounting for 27%.
GKN Aerospace sales by sector (2013) Aerospace sales by market (2014E)
Source: GKN Source: Berenberg estimates
Products
• Aerostructures (wing and fuselage) comprise primary wing structures (rear spar and trailing edge), flap skins, winglets, fuselage sections and floor grids.
• Engine structures comprise “Nacelle and Pylon” products such as engine exhaust and intakes, and engine systems and services.
• Special products include transparencies (aircraft windows and canopies) and protection systems (anti-icing systems and fuel tanks).
GKN Aerospace revenue by segment (2013E) GKN Aerospace customer sales (2013E)
Source: Berenberg estimates Source: Berenberg estimates
Engine structure
s50%
Special products
5%
Aerostructures 45%
Commercial 76%
Military24%
40%
5%21%
12%
10%
7% 5%
Civil Airliners Regional & BJ's Fast Jets
Rotorcraft Transports Aftermarket
Airbus UTCGE BoeingRR SafranHoneywell MTUSpirit Lockheed
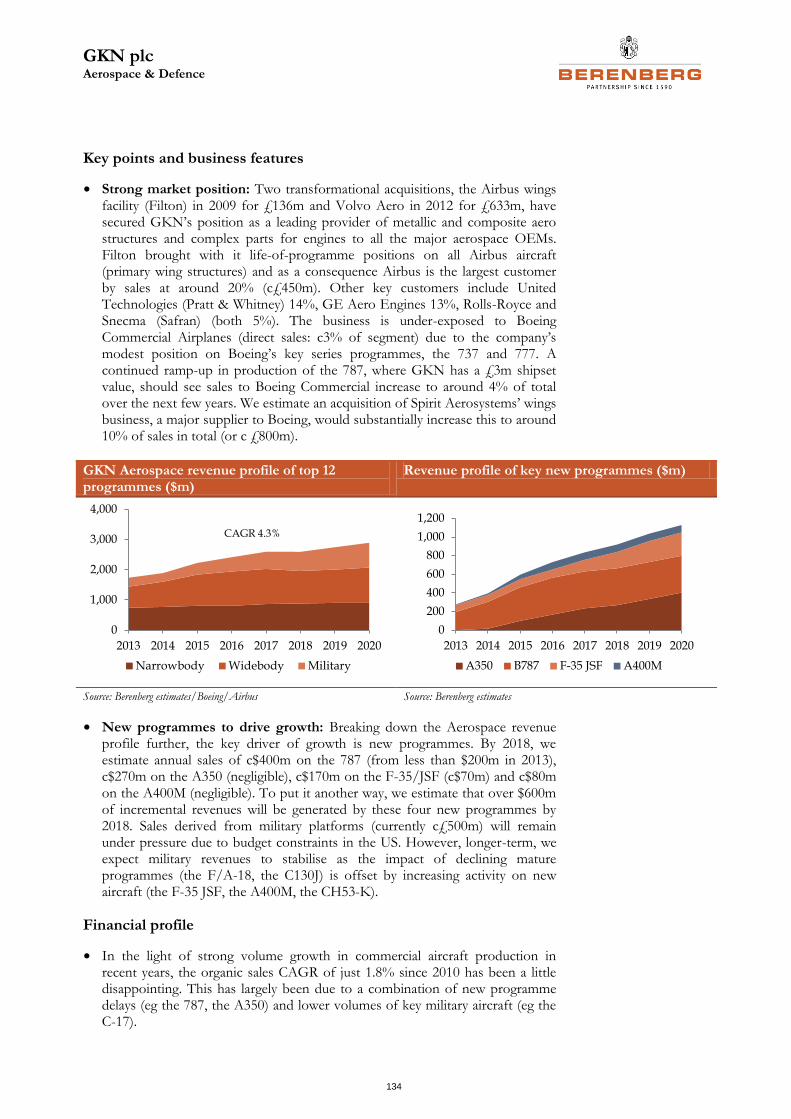
GKN plc Aerospace & Defence
134
Key points and business features
• Strong market position: Two transformational acquisitions, the Airbus wings facility (Filton) in 2009 for £136m and Volvo Aero in 2012 for £633m, have secured GKN’s position as a leading provider of metallic and composite aero structures and complex parts for engines to all the major aerospace OEMs. Filton brought with it life-of-programme positions on all Airbus aircraft (primary wing structures) and as a consequence Airbus is the largest customer by sales at around 20% (c£450m). Other key customers include United Technologies (Pratt & Whitney) 14%, GE Aero Engines 13%, Rolls-Royce and Snecma (Safran) (both 5%). The business is under-exposed to Boeing Commercial Airplanes (direct sales: c3% of segment) due to the company’s modest position on Boeing’s key series programmes, the 737 and 777. A continued ramp-up in production of the 787, where GKN has a £3m shipset value, should see sales to Boeing Commercial increase to around 4% of total over the next few years. We estimate an acquisition of Spirit Aerosystems’ wings business, a major supplier to Boeing, would substantially increase this to around 10% of sales in total (or c £800m).
GKN Aerospace revenue profile of top 12 programmes ($m)
Revenue profile of key new programmes ($m)
Source: Berenberg estimates/Boeing/Airbus Source: Berenberg estimates
• New programmes to drive growth: Breaking down the Aerospace revenue profile further, the key driver of growth is new programmes. By 2018, we estimate annual sales of c$400m on the 787 (from less than $200m in 2013), c$270m on the A350 (negligible), c$170m on the F-35/JSF (c$70m) and c$80m on the A400M (negligible). To put it another way, we estimate that over $600m of incremental revenues will be generated by these four new programmes by 2018. Sales derived from military platforms (currently c£500m) will remain under pressure due to budget constraints in the US. However, longer-term, we expect military revenues to stabilise as the impact of declining mature programmes (the F/A-18, the C130J) is offset by increasing activity on new aircraft (the F-35 JSF, the A400M, the CH53-K).
Financial profile
• In the light of strong volume growth in commercial aircraft production in recent years, the organic sales CAGR of just 1.8% since 2010 has been a little disappointing. This has largely been due to a combination of new programme delays (eg the 787, the A350) and lower volumes of key military aircraft (eg the C-17).
0
1,000
2,000
3,000
4,000
2013 2014 2015 2016 2017 2018 2019 2020
Narrowbody Widebody Military
CAGR 4.3%
0
200
400
600
800
1,000
1,200
2013 2014 2015 2016 2017 2018 2019 2020
A350 B787 F-35 JSF A400M
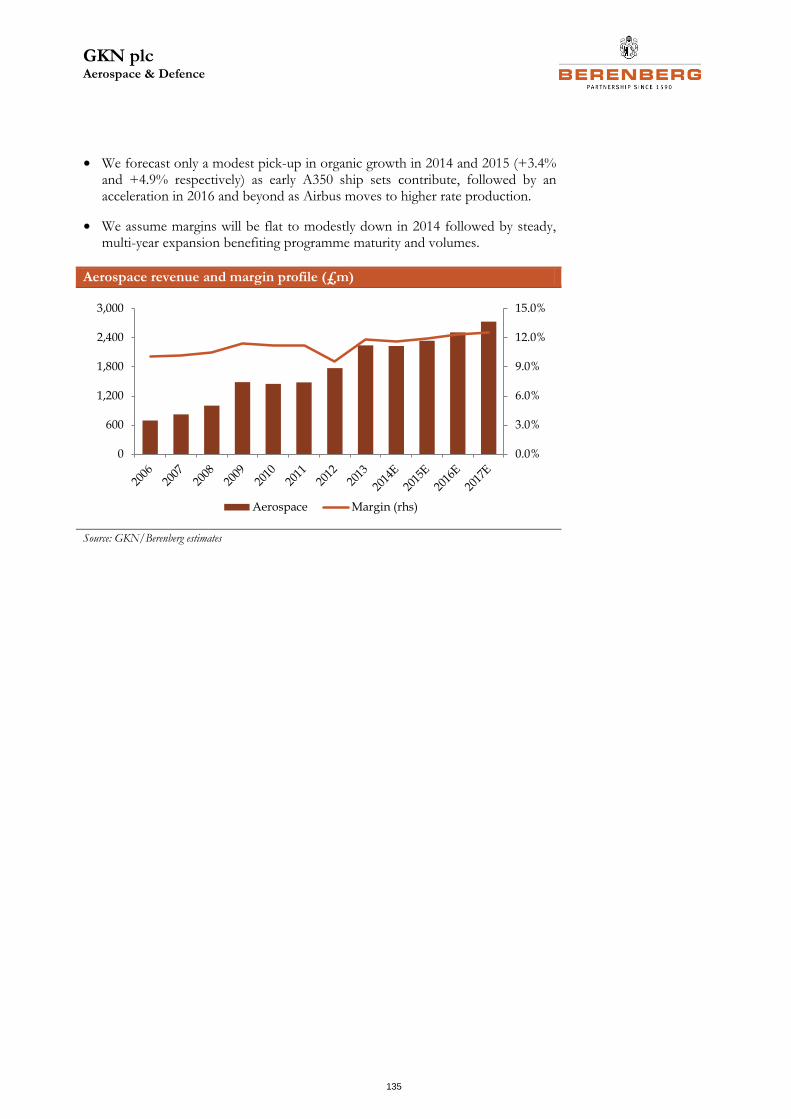
GKN plc Aerospace & Defence
135
• We forecast only a modest pick-up in organic growth in 2014 and 2015 (+3.4% and +4.9% respectively) as early A350 ship sets contribute, followed by an acceleration in 2016 and beyond as Airbus moves to higher rate production.
• We assume margins will be flat to modestly down in 2014 followed by steady, multi-year expansion benefiting programme maturity and volumes.
Aerospace revenue and margin profile (£m)
Source: GKN/Berenberg estimates
0.0%
3.0%
6.0%
9.0%
12.0%
15.0%
0
600
1,200
1,800
2,400
3,000
Aerospace Margin (rhs)
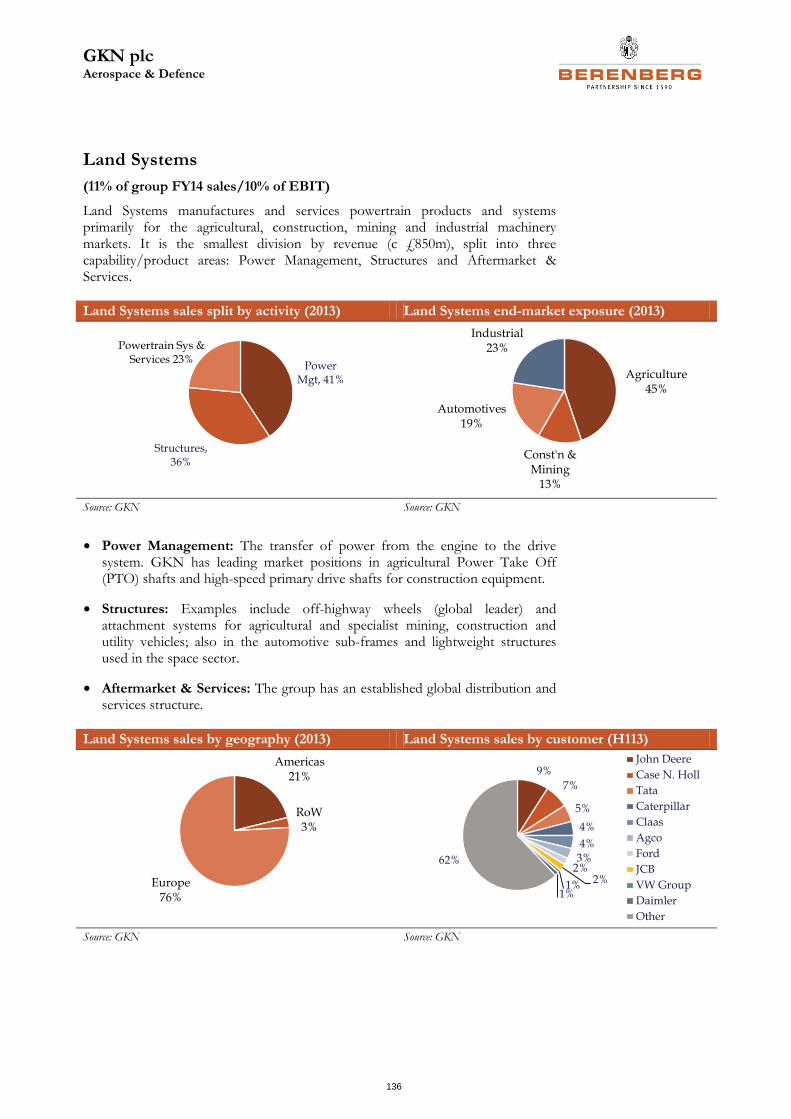
GKN plc Aerospace & Defence
136
Land Systems
(11% of group FY14 sales/10% of EBIT)
Land Systems manufactures and services powertrain products and systems primarily for the agricultural, construction, mining and industrial machinery markets. It is the smallest division by revenue (c £850m), split into three capability/product areas: Power Management, Structures and Aftermarket & Services.
Land Systems sales split by activity (2013) Land Systems end-market exposure (2013)
Source: GKN Source: GKN
• Power Management: The transfer of power from the engine to the drive system. GKN has leading market positions in agricultural Power Take Off (PTO) shafts and high-speed primary drive shafts for construction equipment.
• Structures: Examples include off-highway wheels (global leader) and attachment systems for agricultural and specialist mining, construction and utility vehicles; also in the automotive sub-frames and lightweight structures used in the space sector.
• Aftermarket & Services: The group has an established global distribution and services structure.
Land Systems sales by geography (2013) Land Systems sales by customer (H113)
Source: GKN Source: GKN
Power Mgt, 41%
Structures, 36%
Powertrain Sys & Services 23%
Const'n & Mining
13%
Industrial23%
Automotives19%
Agriculture45%
Americas21%
RoW3%
Europe76%
9%
7%
5%
4%
4%
3%2%
2%1%1%
62%
John Deere
Case N. Holl
Tata
Caterpillar
Claas
Agco
Ford
JCB
VW Group
Daimler
Other
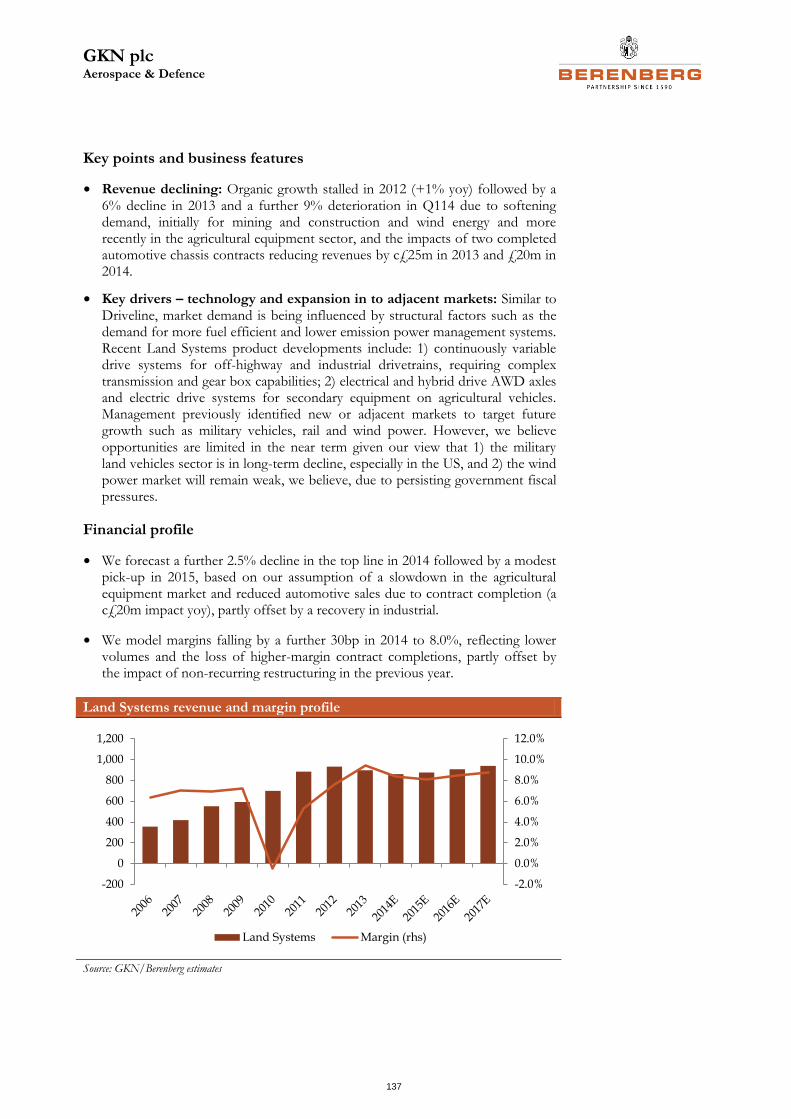
GKN plc Aerospace & Defence
137
Key points and business features
• Revenue declining: Organic growth stalled in 2012 (+1% yoy) followed by a 6% decline in 2013 and a further 9% deterioration in Q114 due to softening demand, initially for mining and construction and wind energy and more recently in the agricultural equipment sector, and the impacts of two completed automotive chassis contracts reducing revenues by c£25m in 2013 and £20m in 2014.
• Key drivers – technology and expansion in to adjacent markets: Similar to Driveline, market demand is being influenced by structural factors such as the demand for more fuel efficient and lower emission power management systems. Recent Land Systems product developments include: 1) continuously variable drive systems for off-highway and industrial drivetrains, requiring complex transmission and gear box capabilities; 2) electrical and hybrid drive AWD axles and electric drive systems for secondary equipment on agricultural vehicles. Management previously identified new or adjacent markets to target future growth such as military vehicles, rail and wind power. However, we believe opportunities are limited in the near term given our view that 1) the military land vehicles sector is in long-term decline, especially in the US, and 2) the wind power market will remain weak, we believe, due to persisting government fiscal pressures.
Financial profile
• We forecast a further 2.5% decline in the top line in 2014 followed by a modest pick-up in 2015, based on our assumption of a slowdown in the agricultural equipment market and reduced automotive sales due to contract completion (a c£20m impact yoy), partly offset by a recovery in industrial.
• We model margins falling by a further 30bp in 2014 to 8.0%, reflecting lower volumes and the loss of higher-margin contract completions, partly offset by the impact of non-recurring restructuring in the previous year.
Land Systems revenue and margin profile
Source: GKN/Berenberg estimates
-2.0%
0.0%
2.0%
4.0%
6.0%
8.0%
10.0%
12.0%
-200
0
200
400
600
800
1,000
1,200
Land Systems Margin (rhs)
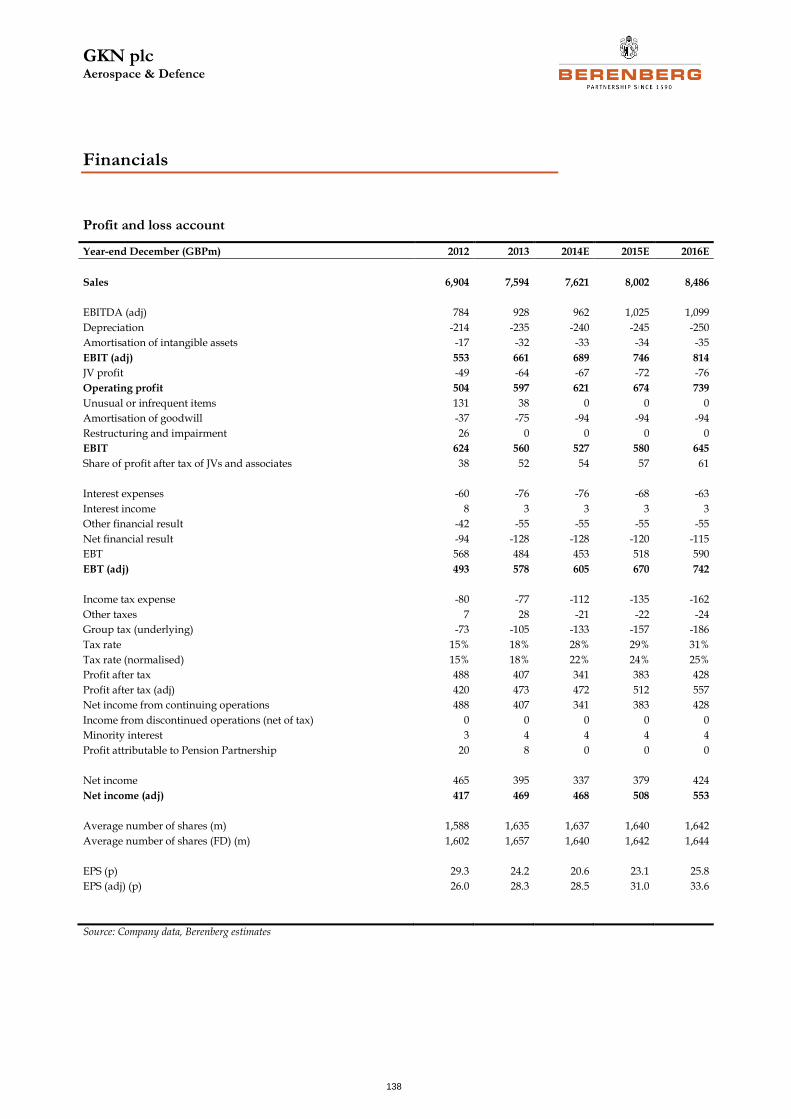
GKN plc Aerospace & Defence
138
Financials
Profit and loss account
Year-end December (GBPm) 2012 2013 2014E 2015E 2016E
Sales 6,904 7,594 7,621 8,002 8,486
EBITDA (adj) 784 928 962 1,025 1,099
Depreciation -214 -235 -240 -245 -250
Amortisation of intangible assets -17 -32 -33 -34 -35
EBIT (adj) 553 661 689 746 814
JV profit -49 -64 -67 -72 -76
Operating profit 504 597 621 674 739
Unusual or infrequent items 131 38 0 0 0
Amortisation of goodwill -37 -75 -94 -94 -94
Restructuring and impairment 26 0 0 0 0
EBIT 624 560 527 580 645
Share of profit after tax of JVs and associates 38 52 54 57 61
Interest expenses -60 -76 -76 -68 -63
Interest income 8 3 3 3 3
Other financial result -42 -55 -55 -55 -55
Net financial result -94 -128 -128 -120 -115
EBT 568 484 453 518 590
EBT (adj) 493 578 605 670 742
Income tax expense -80 -77 -112 -135 -162
Other taxes 7 28 -21 -22 -24
Group tax (underlying) -73 -105 -133 -157 -186
Tax rate 15% 18% 28% 29% 31%
Tax rate (normalised) 15% 18% 22% 24% 25%
Profit after tax 488 407 341 383 428
Profit after tax (adj) 420 473 472 512 557
Net income from continuing operations 488 407 341 383 428
Income from discontinued operations (net of tax) 0 0 0 0 0
Minority interest 3 4 4 4 4
Profit attributable to Pension Partnership 20 8 0 0 0
Net income 465 395 337 379 424
Net income (adj) 417 469 468 508 553
Average number of shares (m) 1,588 1,635 1,637 1,640 1,642
Average number of shares (FD) (m) 1,602 1,657 1,640 1,642 1,644
EPS (p) 29.3 24.2 20.6 23.1 25.8
EPS (adj) (p) 26.0 28.3 28.5 31.0 33.6
Source: Company data, Berenberg estimates
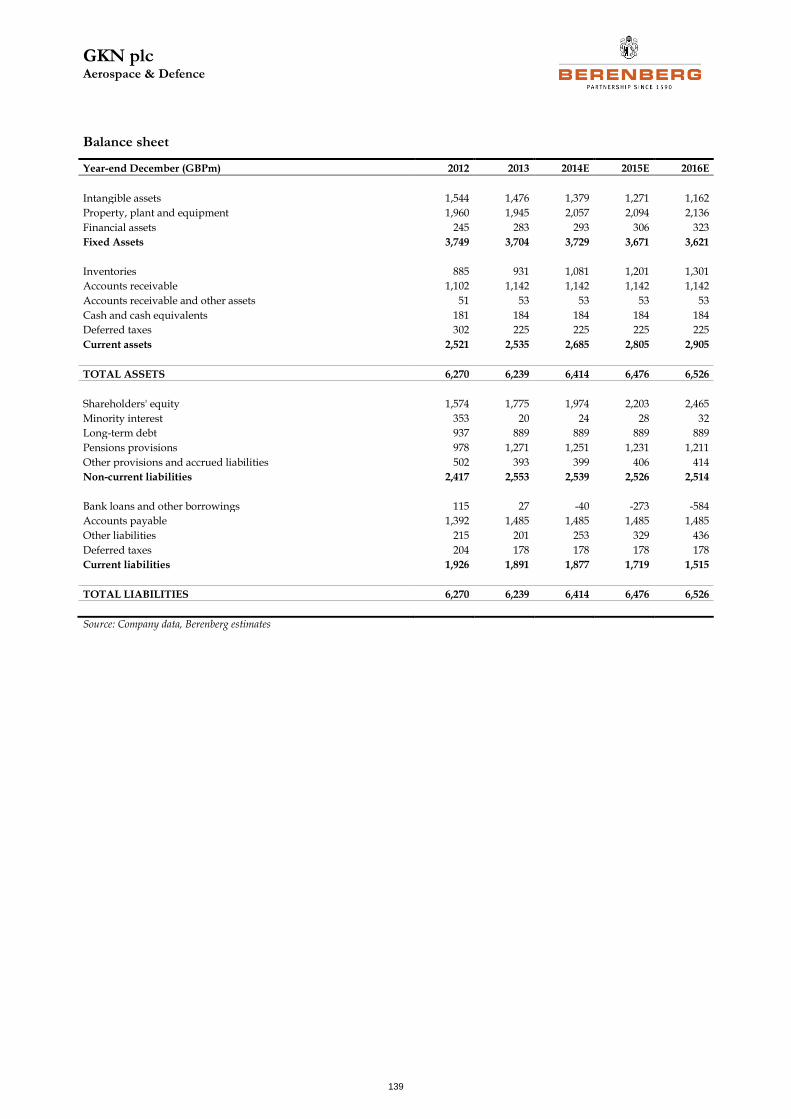
GKN plc Aerospace & Defence
139
Balance sheet
Year-end December (GBPm) 2012 2013 2014E 2015E 2016E
Intangible assets 1,544 1,476 1,379 1,271 1,162
Property, plant and equipment 1,960 1,945 2,057 2,094 2,136
Financial assets 245 283 293 306 323
Fixed Assets 3,749 3,704 3,729 3,671 3,621
Inventories 885 931 1,081 1,201 1,301
Accounts receivable 1,102 1,142 1,142 1,142 1,142
Accounts receivable and other assets 51 53 53 53 53
Cash and cash equivalents 181 184 184 184 184
Deferred taxes 302 225 225 225 225
Current assets 2,521 2,535 2,685 2,805 2,905
TOTAL ASSETS 6,270 6,239 6,414 6,476 6,526
Shareholders' equity 1,574 1,775 1,974 2,203 2,465
Minority interest 353 20 24 28 32
Long-term debt 937 889 889 889 889
Pensions provisions 978 1,271 1,251 1,231 1,211
Other provisions and accrued liabilities 502 393 399 406 414
Non-current liabilities 2,417 2,553 2,539 2,526 2,514
Bank loans and other borrowings 115 27 -40 -273 -584
Accounts payable 1,392 1,485 1,485 1,485 1,485
Other liabilities 215 201 253 329 436
Deferred taxes 204 178 178 178 178
Current liabilities 1,926 1,891 1,877 1,719 1,515
TOTAL LIABILITIES 6,270 6,239 6,414 6,476 6,526
Source: Company data, Berenberg estimates
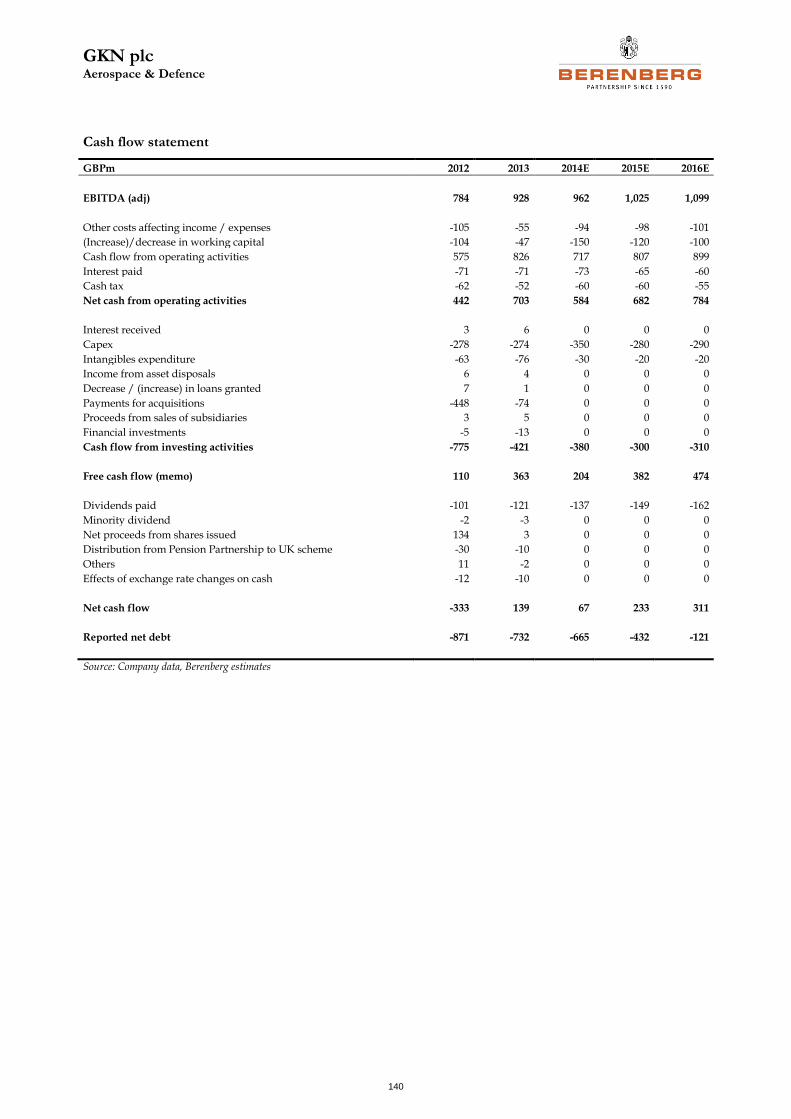
GKN plc Aerospace & Defence
140
Cash flow statement
GBPm 2012 2013 2014E 2015E 2016E
EBITDA (adj) 784 928 962 1,025 1,099
Other costs affecting income / expenses -105 -55 -94 -98 -101
(Increase)/decrease in working capital -104 -47 -150 -120 -100
Cash flow from operating activities 575 826 717 807 899
Interest paid -71 -71 -73 -65 -60
Cash tax -62 -52 -60 -60 -55
Net cash from operating activities 442 703 584 682 784
Interest received 3 6 0 0 0
Capex -278 -274 -350 -280 -290
Intangibles expenditure -63 -76 -30 -20 -20
Income from asset disposals 6 4 0 0 0
Decrease / (increase) in loans granted 7 1 0 0 0
Payments for acquisitions -448 -74 0 0 0
Proceeds from sales of subsidiaries 3 5 0 0 0
Financial investments -5 -13 0 0 0
Cash flow from investing activities -775 -421 -380 -300 -310
Free cash flow (memo) 110 363 204 382 474
Dividends paid -101 -121 -137 -149 -162
Minority dividend -2 -3 0 0 0
Net proceeds from shares issued 134 3 0 0 0
Distribution from Pension Partnership to UK scheme -30 -10 0 0 0
Others 11 -2 0 0 0
Effects of exchange rate changes on cash -12 -10 0 0 0
Net cash flow -333 139 67 233 311
Reported net debt -871 -732 -665 -432 -121
Source: Company data, Berenberg estimates
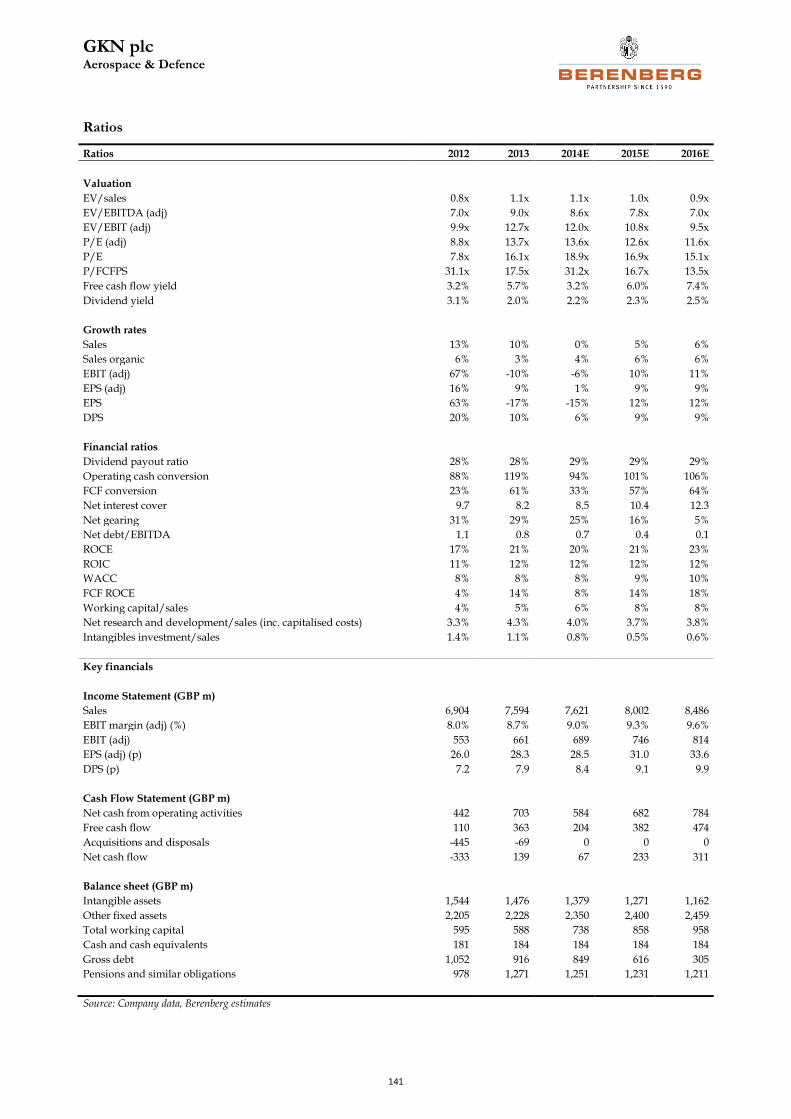
GKN plc Aerospace & Defence
141
Ratios
Ratios 2012 2013 2014E 2015E 2016E
Valuation
EV/sales 0.8x 1.1x 1.1x 1.0x 0.9x
EV/EBITDA (adj) 7.0x 9.0x 8.6x 7.8x 7.0x
EV/EBIT (adj) 9.9x 12.7x 12.0x 10.8x 9.5x
P/E (adj) 8.8x 13.7x 13.6x 12.6x 11.6x
P/E 7.8x 16.1x 18.9x 16.9x 15.1x
P/FCFPS 31.1x 17.5x 31.2x 16.7x 13.5x
Free cash flow yield 3.2% 5.7% 3.2% 6.0% 7.4%
Dividend yield 3.1% 2.0% 2.2% 2.3% 2.5%
Growth rates
Sales 13% 10% 0% 5% 6%
Sales organic 6% 3% 4% 6% 6%
EBIT (adj) 67% -10% -6% 10% 11%
EPS (adj) 16% 9% 1% 9% 9%
EPS 63% -17% -15% 12% 12%
DPS 20% 10% 6% 9% 9%
Financial ratios
Dividend payout ratio 28% 28% 29% 29% 29%
Operating cash conversion 88% 119% 94% 101% 106%
FCF conversion 23% 61% 33% 57% 64%
Net interest cover 9.7 8.2 8.5 10.4 12.3
Net gearing 31% 29% 25% 16% 5%
Net debt/EBITDA 1.1 0.8 0.7 0.4 0.1
ROCE 17% 21% 20% 21% 23%
ROIC 11% 12% 12% 12% 12%
WACC 8% 8% 8% 9% 10%
FCF ROCE 4% 14% 8% 14% 18%
Working capital/sales 4% 5% 6% 8% 8%
Net research and development/sales (inc. capitalised costs) 3.3% 4.3% 4.0% 3.7% 3.8%
Intangibles investment/sales 1.4% 1.1% 0.8% 0.5% 0.6%
Key financials
Income Statement (GBP m)
Sales 6,904 7,594 7,621 8,002 8,486
EBIT margin (adj) (%) 8.0% 8.7% 9.0% 9.3% 9.6%
EBIT (adj) 553 661 689 746 814
EPS (adj) (p) 26.0 28.3 28.5 31.0 33.6
DPS (p) 7.2 7.9 8.4 9.1 9.9
Cash Flow Statement (GBP m)
Net cash from operating activities 442 703 584 682 784
Free cash flow 110 363 204 382 474
Acquisitions and disposals -445 -69 0 0 0
Net cash flow -333 139 67 233 311
Balance sheet (GBP m)
Intangible assets 1,544 1,476 1,379 1,271 1,162
Other fixed assets 2,205 2,228 2,350 2,400 2,459
Total working capital 595 588 738 858 958
Cash and cash equivalents 181 184 184 184 184
Gross debt 1,052 916 849 616 305
Pensions and similar obligations 978 1,271 1,251 1,231 1,211
Source: Company data, Berenberg estimates
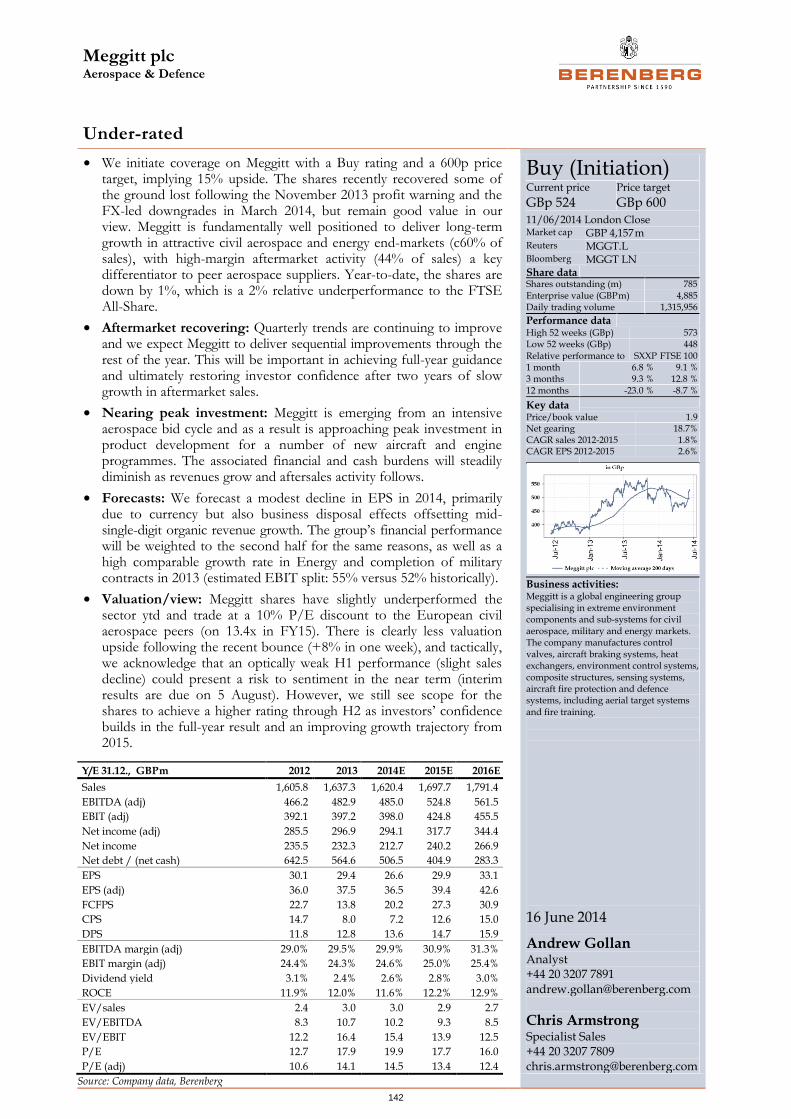
Meggitt plc Aerospace & Defence
142
Under-rated
• We initiate coverage on Meggitt with a Buy rating and a 600p price target, implying 15% upside. The shares recently recovered some of the ground lost following the November 2013 profit warning and the FX-led downgrades in March 2014, but remain good value in our view. Meggitt is fundamentally well positioned to deliver long-term growth in attractive civil aerospace and energy end-markets (c60% of sales), with high-margin aftermarket activity (44% of sales) a key differentiator to peer aerospace suppliers. Year-to-date, the shares are down by 1%, which is a 2% relative underperformance to the FTSE All-Share.
• Aftermarket recovering: Quarterly trends are continuing to improve and we expect Meggitt to deliver sequential improvements through the rest of the year. This will be important in achieving full-year guidance and ultimately restoring investor confidence after two years of slow growth in aftermarket sales.
• Nearing peak investment: Meggitt is emerging from an intensive aerospace bid cycle and as a result is approaching peak investment in product development for a number of new aircraft and engine programmes. The associated financial and cash burdens will steadily diminish as revenues grow and aftersales activity follows.
• Forecasts: We forecast a modest decline in EPS in 2014, primarily due to currency but also business disposal effects offsetting mid-single-digit organic revenue growth. The group’s financial performance will be weighted to the second half for the same reasons, as well as a high comparable growth rate in Energy and completion of military contracts in 2013 (estimated EBIT split: 55% versus 52% historically).
• Valuation/view: Meggitt shares have slightly underperformed the sector ytd and trade at a 10% P/E discount to the European civil aerospace peers (on 13.4x in FY15). There is clearly less valuation upside following the recent bounce (+8% in one week), and tactically, we acknowledge that an optically weak H1 performance (slight sales decline) could present a risk to sentiment in the near term (interim results are due on 5 August). However, we still see scope for the shares to achieve a higher rating through H2 as investors’ confidence builds in the full-year result and an improving growth trajectory from 2015.
Buy (Initiation) Current price
GBp 524 Price target
GBp 600 11/06/2014 London Close Market cap GBP 4,157 m Reuters MGGT.L Bloomberg MGGT LN Share data
Shares outstanding (m) 785 Enterprise value (GBP m) 4,885 Daily trading volume 1,315,956
Performance data
High 52 weeks (GBp) 573 Low 52 weeks (GBp) 448
Relative performance to SXXP FTSE 100 1 month 6.8 % 9.1 % 3 months 9.3 % 12.8 % 12 months -23.0 % -8.7 %
Key data
Price/book value 1.9 Net gearing 18.7% CAGR sales 2012-2015 1.8% CAGR EPS 2012-2015 2.6%
Business activities: Meggitt is a global engineering group specialising in extreme environment components and sub-systems for civil aerospace, military and energy markets. The company manufactures control valves, aircraft braking systems, heat exchangers, environment control systems, composite structures, sensing systems, aircraft fire protection and defence systems, including aerial target systems and fire training.
16 June 2014
Andrew Gollan Analyst +44 20 3207 7891 [email protected]
Chris Armstrong
Specialist Sales +44 20 3207 7809 [email protected]
Y/E 31.12., GBP m 2012 2013 2014E 2015E 2016E
Sales 1,605.8 1,637.3 1,620.4 1,697.7 1,791.4
EBITDA (adj) 466.2 482.9 485.0 524.8 561.5
EBIT (adj) 392.1 397.2 398.0 424.8 455.5
Net income (adj) 285.5 296.9 294.1 317.7 344.4
Net income 235.5 232.3 212.7 240.2 266.9
Net debt / (net cash) 642.5 564.6 506.5 404.9 283.3
EPS 30.1 29.4 26.6 29.9 33.1
EPS (adj) 36.0 37.5 36.5 39.4 42.6
FCFPS 22.7 13.8 20.2 27.3 30.9
CPS 14.7 8.0 7.2 12.6 15.0
DPS 11.8 12.8 13.6 14.7 15.9
EBITDA margin (adj) 29.0% 29.5% 29.9% 30.9% 31.3%
EBIT margin (adj) 24.4% 24.3% 24.6% 25.0% 25.4%
Dividend yield 3.1% 2.4% 2.6% 2.8% 3.0%
ROCE 11.9% 12.0% 11.6% 12.2% 12.9%
EV/sales 2.4 3.0 3.0 2.9 2.7
EV/EBITDA 8.3 10.7 10.2 9.3 8.5
EV/EBIT 12.2 16.4 15.4 13.9 12.5
P/E 12.7 17.9 19.9 17.7 16.0
P/E (adj) 10.6 14.1 14.5 13.4 12.4
Source: Company data, Berenberg
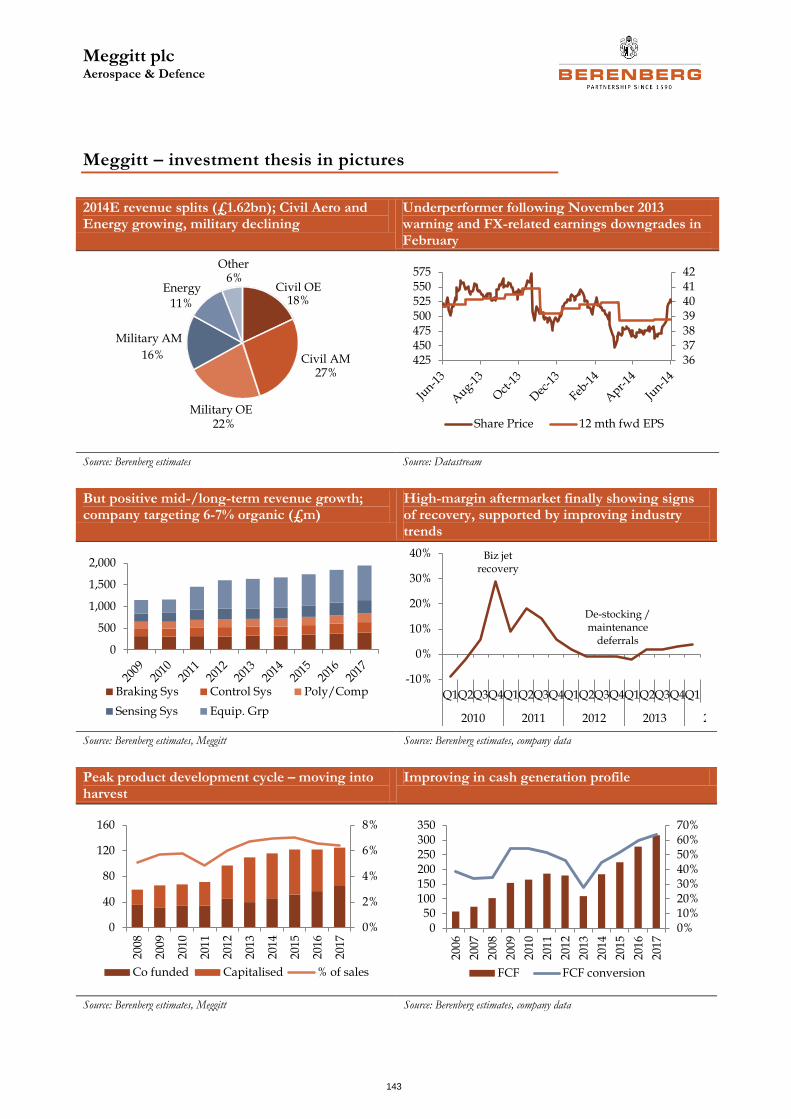
Meggitt plc Aerospace & Defence
143
Meggitt – investment thesis in pictures
2014E revenue splits (£1.62bn); Civil Aero and Energy growing, military declining
Underperformer following November 2013 warning and FX-related earnings downgrades in February
Source: Berenberg estimates Source: Datastream
But positive mid-/long-term revenue growth; company targeting 6-7% organic (£m)
High-margin aftermarket finally showing signs of recovery, supported by improving industry trends
Source: Berenberg estimates, Meggitt Source: Berenberg estimates, company data
Peak product development cycle – moving into harvest
Improving in cash generation profile
Source: Berenberg estimates, Meggitt Source: Berenberg estimates, company data
18%
27%
22%
16%
11%
6%Civil OE
Civil AM
Military OE
Military AM
Energy
Other
36373839404142
425450475500525550575
Share Price 12 mth fwd EPS
0
500
1,000
1,500
2,000
Braking Sys Control Sys Poly/Comp
Sensing Sys Equip. Grp
-10%
0%
10%
20%
30%
40%
Q1Q2Q3Q4Q1Q2Q3Q4Q1Q2Q3Q4Q1Q2Q3Q4Q1
2010 2011 2012 2013 2013
Biz jet recovery
De-stocking / maintenance
deferrals
0%
2%
4%
6%
8%
0
40
80
120
160
200
8
2009
201
0
201
1
201
2
201
3
2014
201
5
201
6
201
7
Co funded Capitalised % of sales
0%10%20%30%40%50%60%70%
050
100150200250300350
200
6
200
7
200
8
200
9
201
0
201
1
201
2
201
3
201
4
201
5
201
6
201
7
FCF FCF conversion
Meggitt plc Aerospace & Defence
144
Meggitt – investment thesis
What’s new: We initiate coverage on Meggitt with a Buy rating and a 600p price target, implying 15% upside.
Two-minute summary: Following a period of underperformance triggered by the November 2013 profit warning, investors’ interest in Meggitt appears to be returning. The shares have rallied by 8% in recent days apparently on no news, although on a ytd basis remain 1.0% under water, which is in line with the sector and a 2% underperformance the FTSE All-Share. For a long-term growth story, organic growth of 1% in 2013 was a disappointment against year-earlier expectations of mid-single-digit growth, but in our view, the issues that adversely affected the group in the second half were largely one-off in nature and not indicative of a structural increase in business risk. The long-term outlook for Meggitt is positive, we believe, given the group’s attractive end-market exposures (civil aerospace and energy) and its aftermarket-based business model. Nearer-term, the civil aftermarket is recovering and we expect sequential improvement as the year progresses. On a 12-month forward P/E basis, the shares trade at 13.5x, a c6% discount to civil aerospace peers. With investor confidence returning, we suggest that mere delivery of 2014 expectations will be sufficient to drive the rating higher.
Key investment point one: aftermarket trends are improving: 44% of group sales are derived from aftermarket activities, of which 27% relates to the high-margin civil aerospace sector. Meggitt supplies many of its spare parts and aftermarket services on a sole-source or principle supplier basis, which ensures an annuity-like revenue stream over the life of the aircraft. Continued recovery of the civil aftermarket is key to the company delivering near-term growth expectations and will be an important factor in improving investor sentiment towards the stock. The macro backdrop is positive with global air traffic and aircraft utilisations trending positively for over a year, indicating that demand for equipment spares and repairs will continue to rise over the coming quarters. Meggitt’s aftermarket activities have lagged the market recovery due to customer specific destocking and airlines/operators deferring discretionary spending, and while it is too early to factor into forecasts, we suggest an element of catch-up or volume upside is possible, albeit not likely before 2015, in our view.
Key investment point two: the product investment cycle is peaking: Meggitt is a long-cycle business with, in many cases, product development, production, support and service activities spanning several decades. The company has emerged successfully from an intensive aerospace bid cycle, having won significant new business on number of new aerospace programmes which is driving heavy investment in new product development. In addition, Meggitt is continuing to invest in expansion of its energy business and also in the group’s continuous improvement programme – the Meggitt Production System (MPS). We contend that Meggitt is nearing the peak of the product investment cycle in relative terms and that related financial and cash burdens will diminish as revenues grow and aftersales activity follows.
Confidence in mid-term organic growth target (6-7%)
Meggitt’s end-market exposures are favourable and despite the 2013 setback and currency affected 2014, management continues to re-iterate its mid-term organic growth target of 6-7%. Over half of sales (Civil Aerospace – 45%; and Energy –
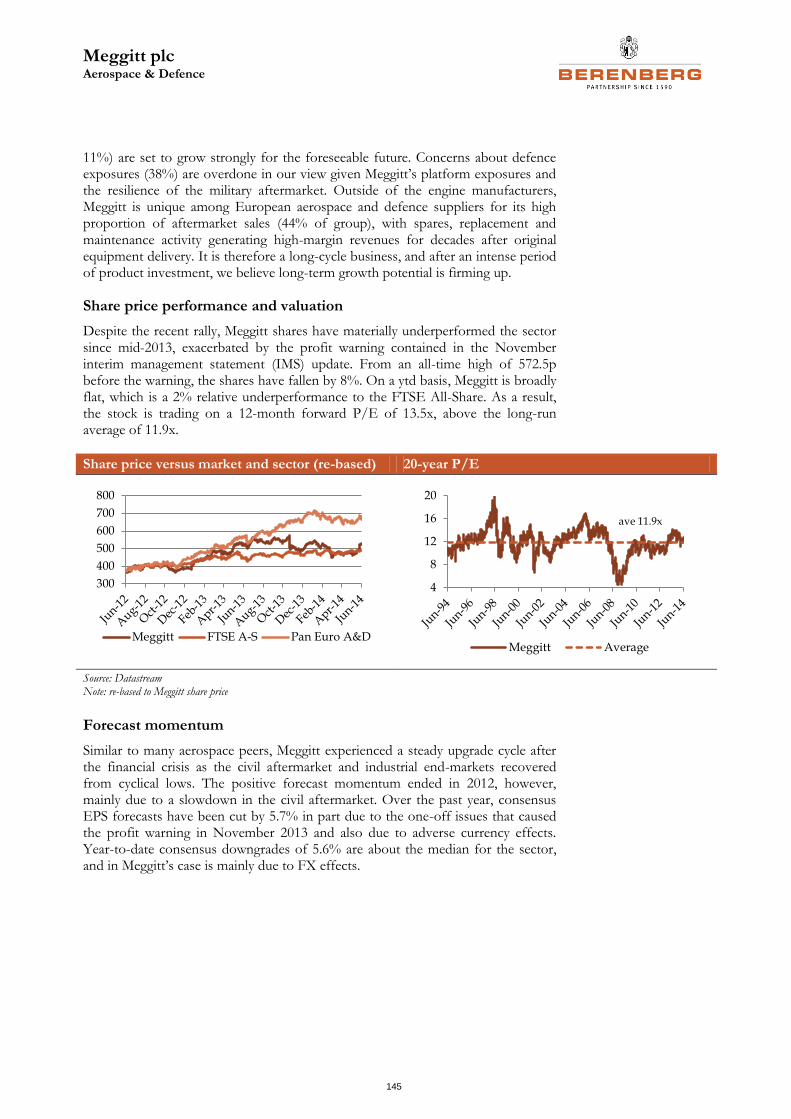
Meggitt plc Aerospace & Defence
145
11%) are set to grow strongly for the foreseeable future. Concerns about defence exposures (38%) are overdone in our view given Meggitt’s platform exposures and the resilience of the military aftermarket. Outside of the engine manufacturers, Meggitt is unique among European aerospace and defence suppliers for its high proportion of aftermarket sales (44% of group), with spares, replacement and maintenance activity generating high-margin revenues for decades after original equipment delivery. It is therefore a long-cycle business, and after an intense period of product investment, we believe long-term growth potential is firming up.
Share price performance and valuation
Despite the recent rally, Meggitt shares have materially underperformed the sector since mid-2013, exacerbated by the profit warning contained in the November interim management statement (IMS) update. From an all-time high of 572.5p before the warning, the shares have fallen by 8%. On a ytd basis, Meggitt is broadly flat, which is a 2% relative underperformance to the FTSE All-Share. As a result, the stock is trading on a 12-month forward P/E of 13.5x, above the long-run average of 11.9x.
Share price versus market and sector (re-based) 20-year P/E
Source: Datastream Note: re-based to Meggitt share price
Forecast momentum
Similar to many aerospace peers, Meggitt experienced a steady upgrade cycle after the financial crisis as the civil aftermarket and industrial end-markets recovered from cyclical lows. The positive forecast momentum ended in 2012, however, mainly due to a slowdown in the civil aftermarket. Over the past year, consensus EPS forecasts have been cut by 5.7% in part due to the one-off issues that caused the profit warning in November 2013 and also due to adverse currency effects. Year-to-date consensus downgrades of 5.6% are about the median for the sector, and in Meggitt’s case is mainly due to FX effects.
300
400
500
600
700
800
Meggitt FTSE A-S Pan Euro A&D
4
8
12
16
20
Meggitt Average
ave 11.9x
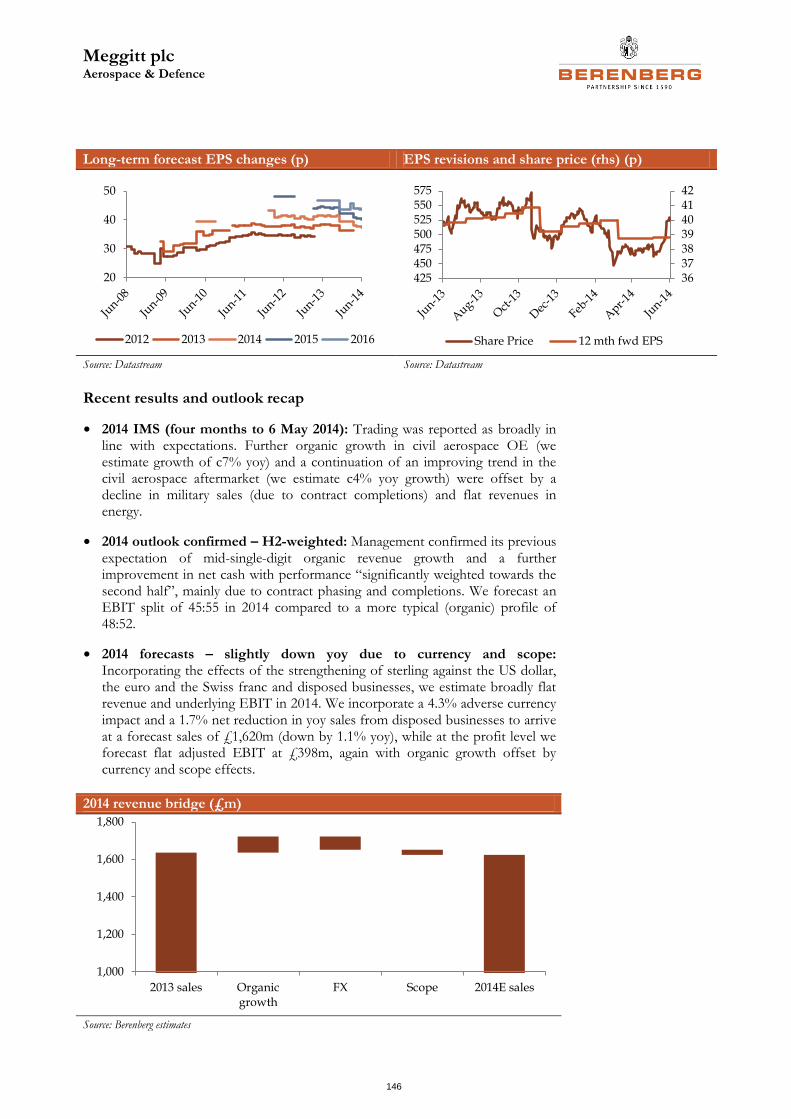
Meggitt plc Aerospace & Defence
146
Long-term forecast EPS changes (p) EPS revisions and share price (rhs) (p)
Source: Datastream Source: Datastream
Recent results and outlook recap
• 2014 IMS (four months to 6 May 2014): Trading was reported as broadly in line with expectations. Further organic growth in civil aerospace OE (we estimate growth of c7% yoy) and a continuation of an improving trend in the civil aerospace aftermarket (we estimate c4% yoy growth) were offset by a decline in military sales (due to contract completions) and flat revenues in energy.
• 2014 outlook confirmed – H2-weighted: Management confirmed its previous expectation of mid-single-digit organic revenue growth and a further improvement in net cash with performance “significantly weighted towards the second half”, mainly due to contract phasing and completions. We forecast an EBIT split of 45:55 in 2014 compared to a more typical (organic) profile of 48:52.
• 2014 forecasts – slightly down yoy due to currency and scope: Incorporating the effects of the strengthening of sterling against the US dollar, the euro and the Swiss franc and disposed businesses, we estimate broadly flat revenue and underlying EBIT in 2014. We incorporate a 4.3% adverse currency impact and a 1.7% net reduction in yoy sales from disposed businesses to arrive at a forecast sales of £1,620m (down by 1.1% yoy), while at the profit level we forecast flat adjusted EBIT at £398m, again with organic growth offset by currency and scope effects.
2014 revenue bridge (£m)
Source: Berenberg estimates
20
30
40
50
2012 2013 2014 2015 2016
36373839404142
425450475500525550575
Share Price 12 mth fwd EPS
1,000
1,200
1,400
1,600
1,800
2013 sales Organicgrowth
FX Scope 2014E sales
Meggitt plc Aerospace & Defence
147
Investment risks and concerns
• Aftermarket recovery continues to lag: Meggitt’s civil aero aftermarket (27% of sales) has lagged the industry average with customer destocking and bankruptcy having disproportionate impacts. Management expects mid-single-digit growth in aftermarket sales in 2014, but with momentum steadily building, recovery will be skewed to the second half. The IMS indicated a continuation of the improving trend in 2013, which we took to mean was around 4% yoy in Q1 following 2% and 3% in the previous two quarters. Given the importance of civil aftermarket to the Meggitt investment case, any hint of missing the full-year target would adversely affect sentiment, we believe.
• Defence exposure (38% of sales): The majority of Meggitt’s defence sales are to the US (61%) and Europe (23%), where downward pressure on budgets will persist. Over the past three years, Meggitt has seen minimal correlation to US Department of Defense (DoD) budget trends, with military revenues growing organically by 5.0% in 2011, 4.2% in 2012 and -2.7% in 2013, compared to total US DoD budget growth of 0%, -4.9% and -9.8% respectively. Meggitt’s military business is broadly spread, with a large and resilient aftermarket component (41%). Nevertheless, orders can be “lumpy” in nature, and visibility on spares orders can be very low, for example. 2014 guidance is for a modest underlying contraction: after taking account of the completion of two retrofit contracts during 2013, we interpret this contraction as -4% yoy.
• Relatively poor cash generation recently: Despite being a high-margin business, Meggitt currently screens poorly against peers on a cash generation basis. 2013 FCF conversion was 28% with a FCF RoE at 5.3%. This is largely due to the current level of high investment and product development expenditure ahead of new programme driven growth, a common theme among many of Meggitt’s civil aerospace peers. On our forecasts, Meggitt’s cash metrics will start to improve progressively from the current year (2014 operating cash conversion and FCF conversion of 89% and 40% respectively).
• Capitalisation: Rightly or wrongly, Meggitt’s capitalisation policy for R&D and programme participation costs (product “give-aways”) is a millstone for the rating and will continue to constrain valuation upside, we believe. We review the subject in more detail later in this note, but for the record, we are sanguine given Meggitt’s aftermarket business model which generates sustained high margins predominantly on a sole-source/primary supplier basis over the life of the platform. Nevertheless, we expect the capitalisation debate to remain at the fore, not least through 2014 as product investments near the peak.
• Currency risk: The group’s primary currency exposure is to the US dollar, given the almost two-thirds of sales that are generated from US businesses, but there is also exposure to the Swiss franc, to a lesser extent. In terms of sensitivities, a 10c move in the sterling: dollar rate affects PBT by c£16m/c4% and hence we factor a similar headwind in our 2014 forecasts which are struck at $1.68 (versus $1.57). This this is partly offset by favourable transaction-related effects of c£4m based on average hedged rate of $1.53.
• Low return on capital compared to peers: Meggitt screens as the lowest ROCE company in our peer group (2014 ROCE: 12% versus an average of 16%). This is in part due to the high level of goodwill carried on the balance

Meggitt plc Aerospace & Defence
148
sheet (c£1.5bn) from a number of large acquisitions and other intangibles such as capitalised development costs and programme participation costs (PPCs) (c£0.5bn). We highlight two reasons that exacerbate Meggitt’s optically low position: 1) several companies in our peer group with above-average ROCE have written down material goodwill balances in recent years (eg BAE – c£2bn; GKN – c£200m); 2) Meggitt’s capitalised R&D and PPCs should be assessed in the context of a long-cycle aftermarket model, where returns on investment are generated over a much longer timeframe than a pure equipment supply model. In short, Meggitt is yet to enjoy higher returns from through-life support and spare parts replacement on large part of its installed base of equipment.
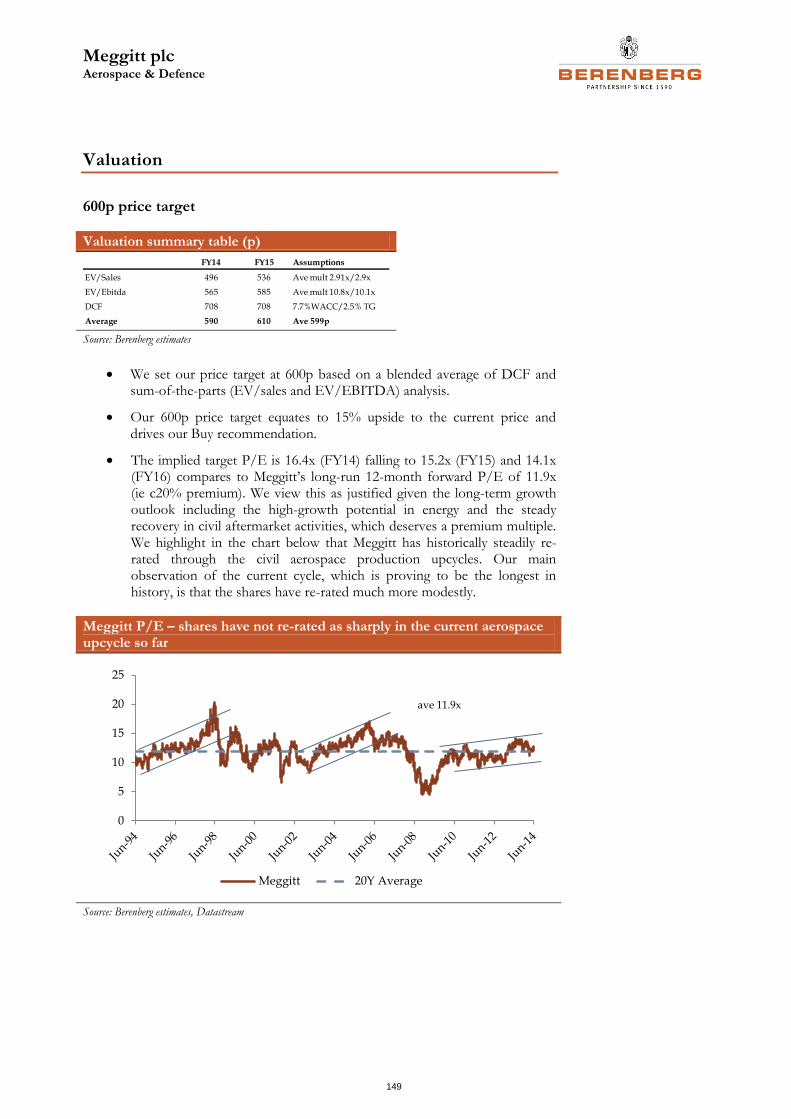
Meggitt plc Aerospace & Defence
149
Valuation
600p price target
Valuation summary table (p)
Source: Berenberg estimates
We set our price target at 600p based on a blended average of DCF and sum-of-the-parts (EV/sales and EV/EBITDA) analysis.
Our 600p price target equates to 15% upside to the current price and drives our Buy recommendation.
The implied target P/E is 16.4x (FY14) falling to 15.2x (FY15) and 14.1x (FY16) compares to Meggitt’s long-run 12-month forward P/E of 11.9x (ie c20% premium). We view this as justified given the long-term growth outlook including the high-growth potential in energy and the steady recovery in civil aftermarket activities, which deserves a premium multiple. We highlight in the chart below that Meggitt has historically steadily re-rated through the civil aerospace production upcycles. Our main observation of the current cycle, which is proving to be the longest in history, is that the shares have re-rated much more modestly.
Meggitt P/E – shares have not re-rated as sharply in the current aerospace upcycle so far
Source: Berenberg estimates, Datastream
FY14 FY15 Assumptions
EV/Sales 496 536 Ave mult 2.91x/2.9x
EV/Ebitda 565 585 Ave mult 10.8x/10.1x
DCF 708 708 7.7%WACC/2.5% TG
Average 590 610 Ave 599p
0
5
10
15
20
25
Meggitt 20Y Average
ave 11.9x
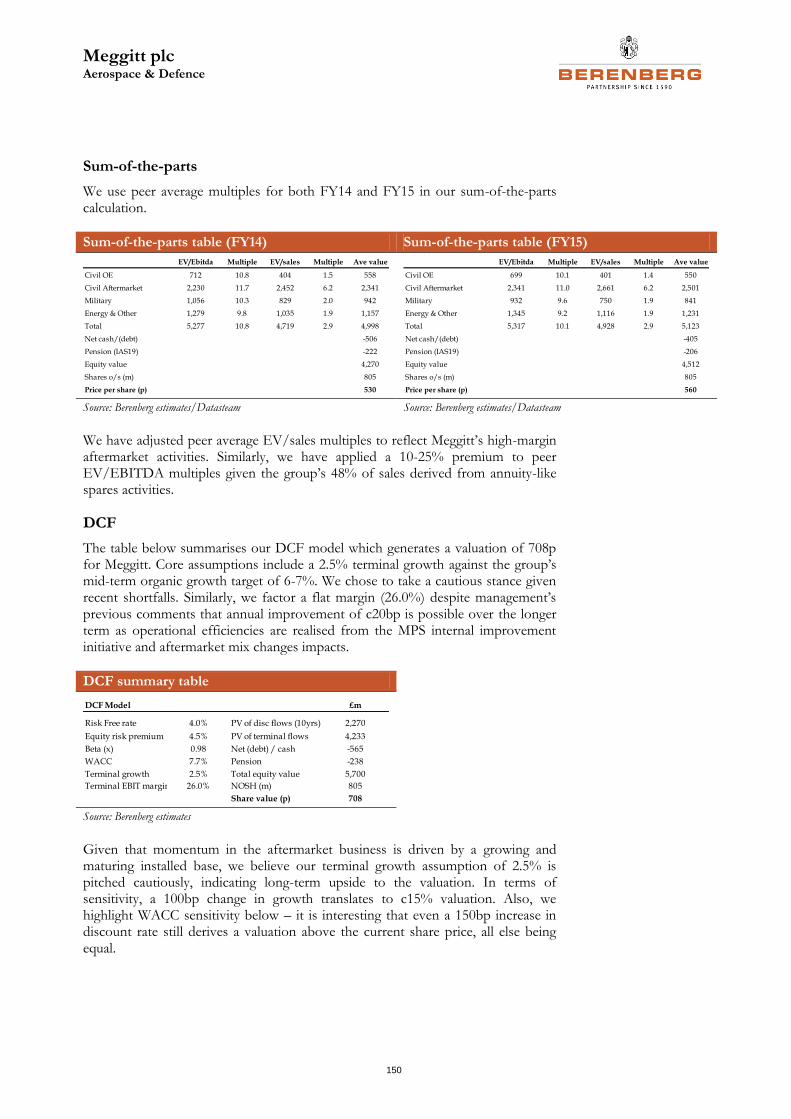
Meggitt plc Aerospace & Defence
150
Sum-of-the-parts
We use peer average multiples for both FY14 and FY15 in our sum-of-the-parts calculation.
Sum-of-the-parts table (FY14) Sum-of-the-parts table (FY15)
Source: Berenberg estimates/Datasteam Source: Berenberg estimates/Datasteam
We have adjusted peer average EV/sales multiples to reflect Meggitt’s high-margin aftermarket activities. Similarly, we have applied a 10-25% premium to peer EV/EBITDA multiples given the group’s 48% of sales derived from annuity-like spares activities.
DCF
The table below summarises our DCF model which generates a valuation of 708p for Meggitt. Core assumptions include a 2.5% terminal growth against the group’s mid-term organic growth target of 6-7%. We chose to take a cautious stance given recent shortfalls. Similarly, we factor a flat margin (26.0%) despite management’s previous comments that annual improvement of c20bp is possible over the longer term as operational efficiencies are realised from the MPS internal improvement initiative and aftermarket mix changes impacts.
DCF summary table
Source: Berenberg estimates
Given that momentum in the aftermarket business is driven by a growing and maturing installed base, we believe our terminal growth assumption of 2.5% is pitched cautiously, indicating long-term upside to the valuation. In terms of sensitivity, a 100bp change in growth translates to c15% valuation. Also, we highlight WACC sensitivity below – it is interesting that even a 150bp increase in discount rate still derives a valuation above the current share price, all else being equal.
EV/Ebitda Multiple EV/sales Multiple Ave value
Civil OE 712 10.8 404 1.5 558
Civil Aftermarket 2,230 11.7 2,452 6.2 2,341
Military 1,056 10.3 829 2.0 942
Energy & Other 1,279 9.8 1,035 1.9 1,157
Total 5,277 10.8 4,719 2.9 4,998
Net cash/(debt) -506
Pension (IAS19) -222
Equity value 4,270
Shares o/s (m) 805
Price per share (p) 530
EV/Ebitda Multiple EV/sales Multiple Ave value
Civil OE 699 10.1 401 1.4 550
Civil Aftermarket 2,341 11.0 2,661 6.2 2,501
Military 932 9.6 750 1.9 841
Energy & Other 1,345 9.2 1,116 1.9 1,231
Total 5,317 10.1 4,928 2.9 5,123
Net cash/(debt) -405
Pension (IAS19) -206
Equity value 4,512
Shares o/s (m) 805
Price per share (p) 560
DCF Model £m
Risk Free rate 4.0% PV of disc flows (10yrs) 2,270
Equity risk premium 4.5% PV of terminal flows 4,233
Beta (x) 0.98 Net (debt) / cash -565
WACC 7.7% Pension -238
Terminal growth 2.5% Total equity value 5,700
Terminal EBIT margin 26.0% NOSH (m) 805
Share value (p) 708
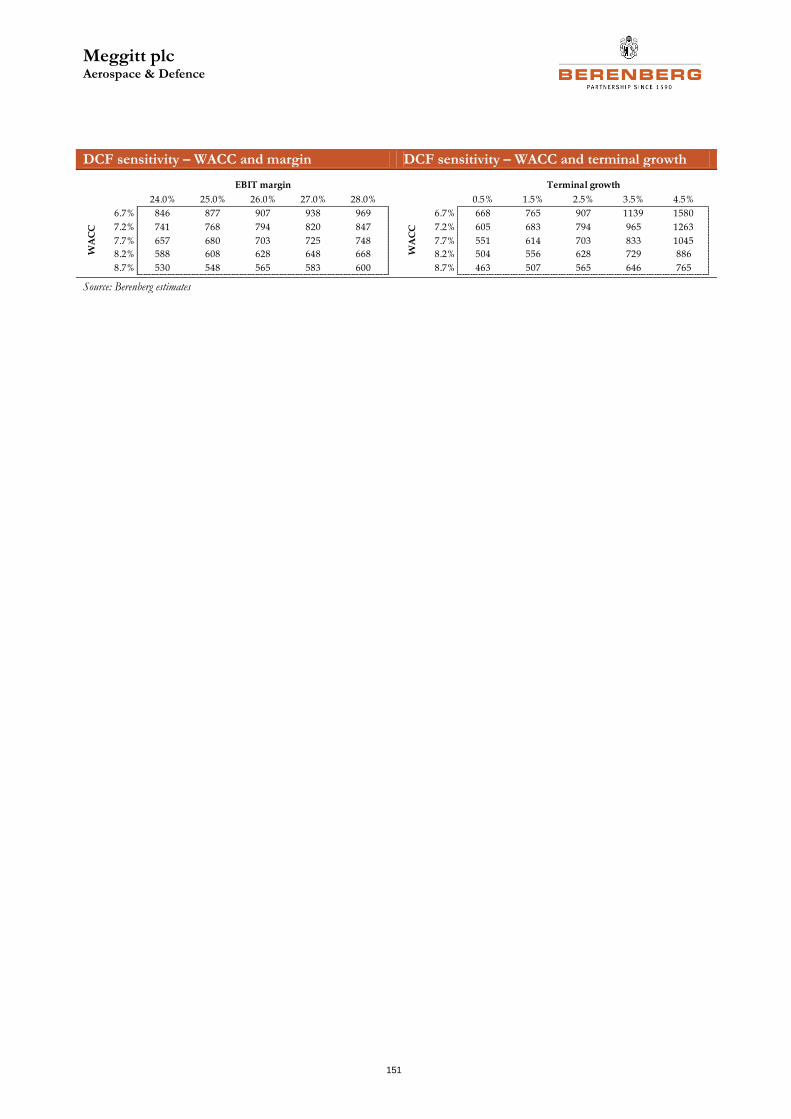
Meggitt plc Aerospace & Defence
151
DCF sensitivity – WACC and margin DCF sensitivity – WACC and terminal growth
Source: Berenberg estimates
708 24.0% 25.0% 26.0% 27.0% 28.0%
6.7% 846 877 907 938 969
7.2% 741 768 794 820 847
7.7% 657 680 703 725 748
8.2% 588 608 628 648 668
8.7% 530 548 565 583 600
EBIT margin
WA
CC
708 0.5% 1.5% 2.5% 3.5% 4.5%
6.7% 668 765 907 1139 1580
7.2% 605 683 794 965 1263
7.7% 551 614 703 833 1045
8.2% 504 556 628 729 886
8.7% 463 507 565 646 765
Terminal growth
WA
CC
Meggitt plc Aerospace & Defence
152
Key investment point one: aftermarket trends improving
• 44% of group sales are derived from aftermarket activities, of which 27% relates to the high-margin civil aerospace sector.
• Meggitt supplies many of its spare parts and aftermarket services on a sole-source or principle supplier basis ensuring an annuity-like revenue stream over the life of the aircraft.
• Meggitt’s civil aftermarket has lagged the industry recovery over the last year but the quarterly trend is improving.
• Industry indicators remain positive and with an ending of customer-specific de-stocking headwinds we expect Meggitt to deliver sequential improvements through the rest of the year. This will be an important factor in improving investor sentiment towards the stock.
Aftermarket play
At the group level, Meggitt derives 44% of its sales from aftermarket activities, supplying spare parts, repairs, overhaul and maintenance of its equipment on over 60,000 aircraft worldwide. Within this, 27ppt relates to the high-margin civil aerospace aftermarket; as a result, Meggitt generates the highest operating margin of the companies we cover (five-year historical average: 24.9%). Despite encouraging macro trends, Meggitt’s civil aftermarket revenues have disappointed over the last 18 months (eg an organic decline of 1% in 2013), partially due to a prolonged period of customer-specific de-stocking and also the effects of disciplined maintenance scheduling by airlines/operators.
Robust sector recovery
The industry aftermarket recovery commenced in early 2013 and momentum has carried through to 2014, with the latest IATA capacity data, a good proxy for determining demand for spares and repairs for large and regional aircraft trends, suggesting a robust upswing. IATA capacity data, defined as available seat kilometres (ASKs), saw an acceleration in the second half of 2013 (up by 5.9% yoy), which has continued through the first half of 2014, up by 5.8% ytd.
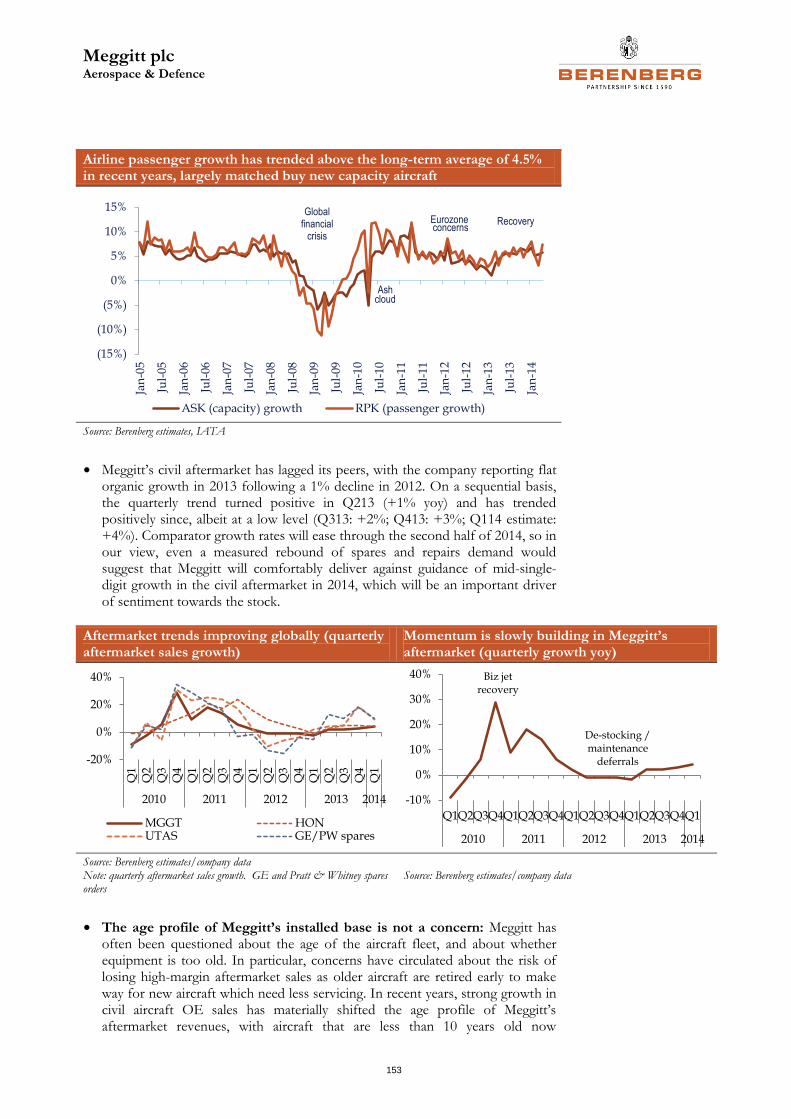
Meggitt plc Aerospace & Defence
153
Airline passenger growth has trended above the long-term average of 4.5% in recent years, largely matched buy new capacity aircraft
Source: Berenberg estimates, IATA
• Meggitt’s civil aftermarket has lagged its peers, with the company reporting flat organic growth in 2013 following a 1% decline in 2012. On a sequential basis, the quarterly trend turned positive in Q213 (+1% yoy) and has trended positively since, albeit at a low level (Q313: +2%; Q413: +3%; Q114 estimate: +4%). Comparator growth rates will ease through the second half of 2014, so in our view, even a measured rebound of spares and repairs demand would suggest that Meggitt will comfortably deliver against guidance of mid-single-digit growth in the civil aftermarket in 2014, which will be an important driver of sentiment towards the stock.
Aftermarket trends improving globally (quarterly aftermarket sales growth)
Momentum is slowly building in Meggitt’s aftermarket (quarterly growth yoy)
Source: Berenberg estimates/company data Note: quarterly aftermarket sales growth. GE and Pratt & Whitney spares orders
Source: Berenberg estimates/company data
• The age profile of Meggitt’s installed base is not a concern: Meggitt has often been questioned about the age of the aircraft fleet, and about whether equipment is too old. In particular, concerns have circulated about the risk of losing high-margin aftermarket sales as older aircraft are retired early to make way for new aircraft which need less servicing. In recent years, strong growth in civil aircraft OE sales has materially shifted the age profile of Meggitt’s aftermarket revenues, with aircraft that are less than 10 years old now
(15%)
(10%)
(5%)
0%
5%
10%
15%
Jan
-05
Jul-
05
Jan
-06
Jul-
06
Jan
-07
Jul-
07
Jan
-08
Jul-
08
Jan
-09
Jul-
09
Jan
-10
Jul-
10
Jan
-11
Jul-
11
Jan
-12
Jul-
12
Jan
-13
Jul-
13
Jan
-14
ASK (capacity) growth RPK (passenger growth)
Global financial
crisis
Ash cloud
Eurozone concerns
Recovery
-20%
0%
20%
40%
Q1
Q2
Q3
Q4
Q1
Q2
Q3
Q4
Q1
Q2
Q3
Q4
Q1
Q2
Q3
Q4
Q1
2010 2011 2012 2013 2014
MGGT HONUTAS GE/PW spares
-10%
0%
10%
20%
30%
40%
Q1Q2Q3Q4Q1Q2Q3Q4Q1Q2Q3Q4Q1Q2Q3Q4Q1
2010 2011 2012 2013 2014
Biz jet recovery
De-stocking / maintenance
deferrals
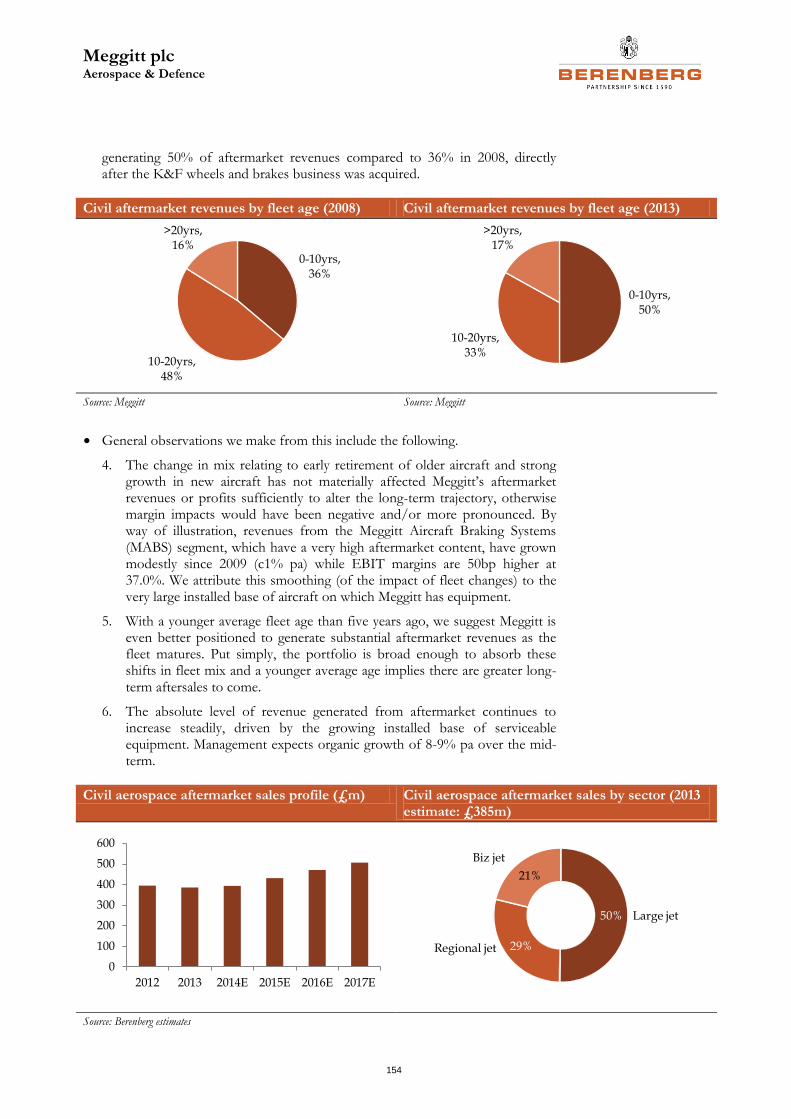
Meggitt plc Aerospace & Defence
154
generating 50% of aftermarket revenues compared to 36% in 2008, directly after the K&F wheels and brakes business was acquired.
Civil aftermarket revenues by fleet age (2008) Civil aftermarket revenues by fleet age (2013)
Source: Meggitt Source: Meggitt
• General observations we make from this include the following.
4. The change in mix relating to early retirement of older aircraft and strong growth in new aircraft has not materially affected Meggitt’s aftermarket revenues or profits sufficiently to alter the long-term trajectory, otherwise margin impacts would have been negative and/or more pronounced. By way of illustration, revenues from the Meggitt Aircraft Braking Systems (MABS) segment, which have a very high aftermarket content, have grown modestly since 2009 (c1% pa) while EBIT margins are 50bp higher at 37.0%. We attribute this smoothing (of the impact of fleet changes) to the very large installed base of aircraft on which Meggitt has equipment.
5. With a younger average fleet age than five years ago, we suggest Meggitt is even better positioned to generate substantial aftermarket revenues as the fleet matures. Put simply, the portfolio is broad enough to absorb these shifts in fleet mix and a younger average age implies there are greater long-term aftersales to come.
6. The absolute level of revenue generated from aftermarket continues to increase steadily, driven by the growing installed base of serviceable equipment. Management expects organic growth of 8-9% pa over the mid-term.
Civil aerospace aftermarket sales profile (£m) Civil aerospace aftermarket sales by sector (2013 estimate: £385m)
Source: Berenberg estimates
0-10yrs, 36%
10-20yrs, 48%
>20yrs, 16%
0-10yrs, 50%
10-20yrs, 33%
>20yrs, 17%
0
100
200
300
400
500
600
2012 2013 2014E 2015E 2016E 2017E
50%
29%
21%
Large jet
Regional jet
Biz jet
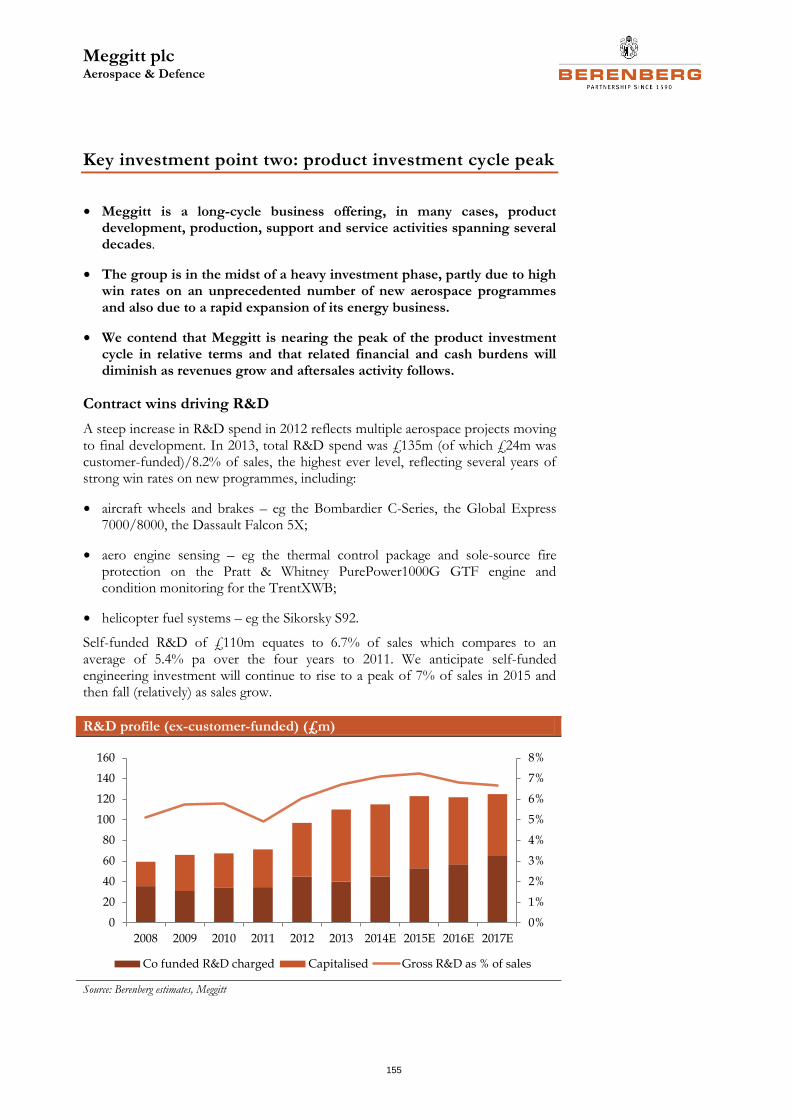
Meggitt plc Aerospace & Defence
155
Key investment point two: product investment cycle peak
• Meggitt is a long-cycle business offering, in many cases, product development, production, support and service activities spanning several decades.
• The group is in the midst of a heavy investment phase, partly due to high win rates on an unprecedented number of new aerospace programmes and also due to a rapid expansion of its energy business.
• We contend that Meggitt is nearing the peak of the product investment cycle in relative terms and that related financial and cash burdens will diminish as revenues grow and aftersales activity follows.
Contract wins driving R&D
A steep increase in R&D spend in 2012 reflects multiple aerospace projects moving to final development. In 2013, total R&D spend was £135m (of which £24m was customer-funded)/8.2% of sales, the highest ever level, reflecting several years of strong win rates on new programmes, including:
• aircraft wheels and brakes – eg the Bombardier C-Series, the Global Express 7000/8000, the Dassault Falcon 5X;
• aero engine sensing – eg the thermal control package and sole-source fire protection on the Pratt & Whitney PurePower1000G GTF engine and condition monitoring for the TrentXWB;
• helicopter fuel systems – eg the Sikorsky S92.
Self-funded R&D of £110m equates to 6.7% of sales which compares to an average of 5.4% pa over the four years to 2011. We anticipate self-funded engineering investment will continue to rise to a peak of 7% of sales in 2015 and then fall (relatively) as sales grow.
R&D profile (ex-customer-funded) (£m)
Source: Berenberg estimates, Meggitt
0%
1%
2%
3%
4%
5%
6%
7%
8%
0
20
40
60
80
100
120
140
160
2008 2009 2010 2011 2012 2013 2014E 2015E 2016E 2017E
Co funded R&D charged Capitalised Gross R&D as % of sales
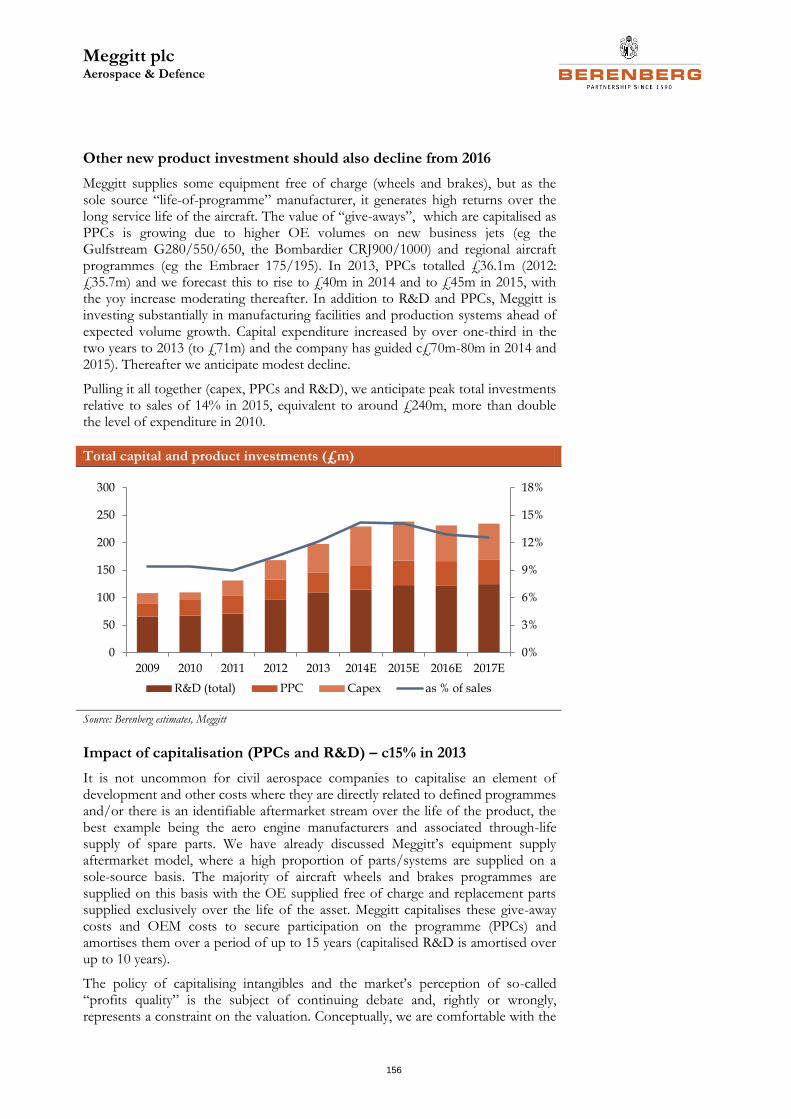
Meggitt plc Aerospace & Defence
156
Other new product investment should also decline from 2016
Meggitt supplies some equipment free of charge (wheels and brakes), but as the sole source “life-of-programme” manufacturer, it generates high returns over the long service life of the aircraft. The value of “give-aways”, which are capitalised as PPCs is growing due to higher OE volumes on new business jets (eg the Gulfstream G280/550/650, the Bombardier CRJ900/1000) and regional aircraft programmes (eg the Embraer 175/195). In 2013, PPCs totalled £36.1m (2012: £35.7m) and we forecast this to rise to £40m in 2014 and to £45m in 2015, with the yoy increase moderating thereafter. In addition to R&D and PPCs, Meggitt is investing substantially in manufacturing facilities and production systems ahead of expected volume growth. Capital expenditure increased by over one-third in the two years to 2013 (to £71m) and the company has guided c£70m-80m in 2014 and 2015). Thereafter we anticipate modest decline.
Pulling it all together (capex, PPCs and R&D), we anticipate peak total investments relative to sales of 14% in 2015, equivalent to around £240m, more than double the level of expenditure in 2010.
Total capital and product investments (£m)
Source: Berenberg estimates, Meggitt
Impact of capitalisation (PPCs and R&D) – c15% in 2013
It is not uncommon for civil aerospace companies to capitalise an element of development and other costs where they are directly related to defined programmes and/or there is an identifiable aftermarket stream over the life of the product, the best example being the aero engine manufacturers and associated through-life supply of spare parts. We have already discussed Meggitt’s equipment supply aftermarket model, where a high proportion of parts/systems are supplied on a sole-source basis. The majority of aircraft wheels and brakes programmes are supplied on this basis with the OE supplied free of charge and replacement parts supplied exclusively over the life of the asset. Meggitt capitalises these give-away costs and OEM costs to secure participation on the programme (PPCs) and amortises them over a period of up to 15 years (capitalised R&D is amortised over up to 10 years).
The policy of capitalising intangibles and the market’s perception of so-called “profits quality” is the subject of continuing debate and, rightly or wrongly, represents a constraint on the valuation. Conceptually, we are comfortable with the
0%
3%
6%
9%
12%
15%
18%
0
50
100
150
200
250
300
2009 2010 2011 2012 2013 2014E 2015E 2016E 2017E
R&D (total) PPC Capex as % of sales
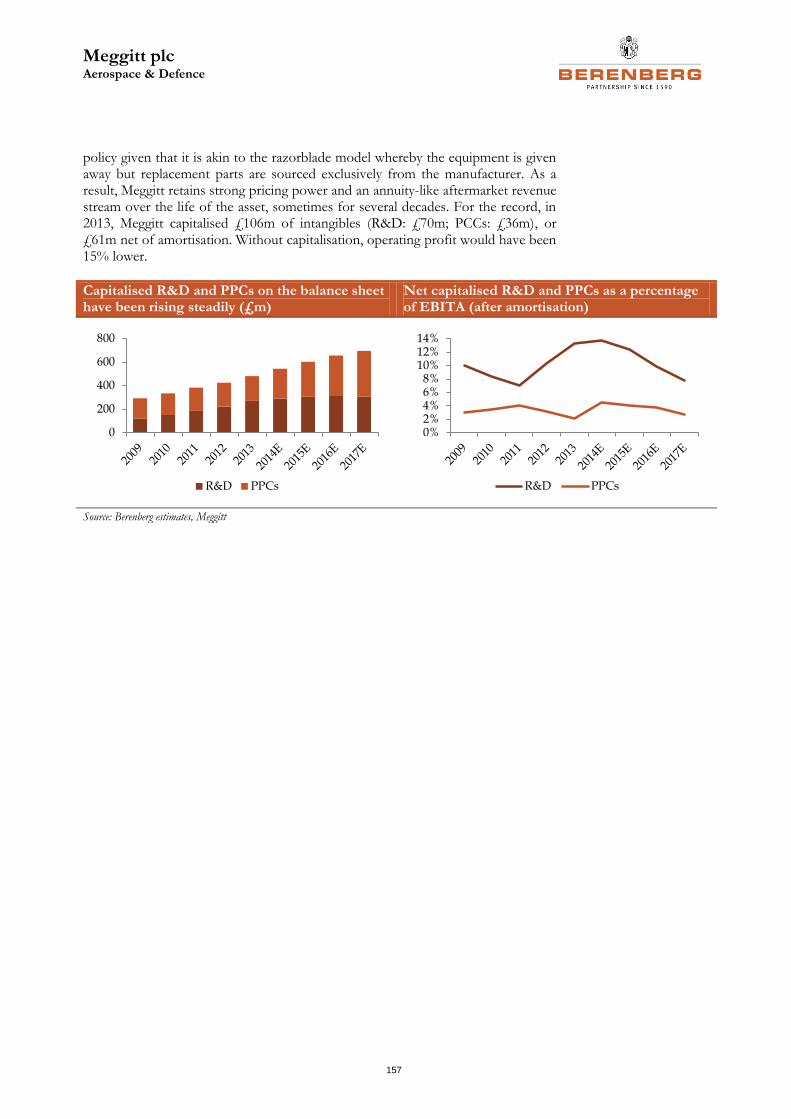
Meggitt plc Aerospace & Defence
157
policy given that it is akin to the razorblade model whereby the equipment is given away but replacement parts are sourced exclusively from the manufacturer. As a result, Meggitt retains strong pricing power and an annuity-like aftermarket revenue stream over the life of the asset, sometimes for several decades. For the record, in 2013, Meggitt capitalised £106m of intangibles (R&D: £70m; PCCs: £36m), or £61m net of amortisation. Without capitalisation, operating profit would have been 15% lower.
Capitalised R&D and PPCs on the balance sheet have been rising steadily (£m)
Net capitalised R&D and PPCs as a percentage of EBITA (after amortisation)
Source: Berenberg estimates, Meggitt
0
200
400
600
800
R&D PPCs
0%2%4%6%8%
10%12%14%
R&D PPCs
Meggitt plc Aerospace & Defence
158
Other investment considerations
Profit warning is not indicative of underlying issues
Meggitt does not give profit guidance, but the trading update in November 2013 was an effective warning that prompted a c7% cut to consensus EPS estimates. The warning was due to a number of largely supply-chain-related issues (re-capped below) and which we believe were mainly non-recurring in nature. A further downwards adjustment to reflect FX transaction effects was a further knock to sentiment, albeit due to uncontrollable factors. Any profit warning is a disappointment but our main conclusion is that there do not appear to be any long-term operational issues to suggest that risks within the business are structurally higher. The issues that led to the warning were as follows.
4. Raw material supply (1): This related to an incorrect raw material supplied by a third-party in 2012. Meggitt is liable to replace the equipment over a number of years “at the customer’s convenience”, for which the company booked a one-off £20m provision. Management does not expect this issue to repeat.
5. Raw material supply (2): This related to an unexpected shortage of a raw material called Tourmaline that is used in sensing equipment. We understand that it has now been designed out of most new products but that there have been some delays recertifying the products. The company says it has substantially rectified this issue but that the costs of transition and other impacts will create a small headwind in the 2014 profit bridge.
6. Contract award delay/project milestone slippage: This related to the Heatric (heat exchanger) energy business where an expected contract award was delayed until after the year-end (and subsequently received in May 2014). In addition, the energy business suffered from a one-month slip in a project milestone (which is now progressing), delaying revenue recognition under contract accounting. We estimate these two issues had an adverse impact on profit of around £5m, which was absorbed above the line.
7. Site consolidations: Meggitt encountered production difficulties and certification delays in the consolidation of two large sensing systems businesses. We understand buffer stocks and delayed Federal Aviation Administration (FAA) product certification have now cleared.
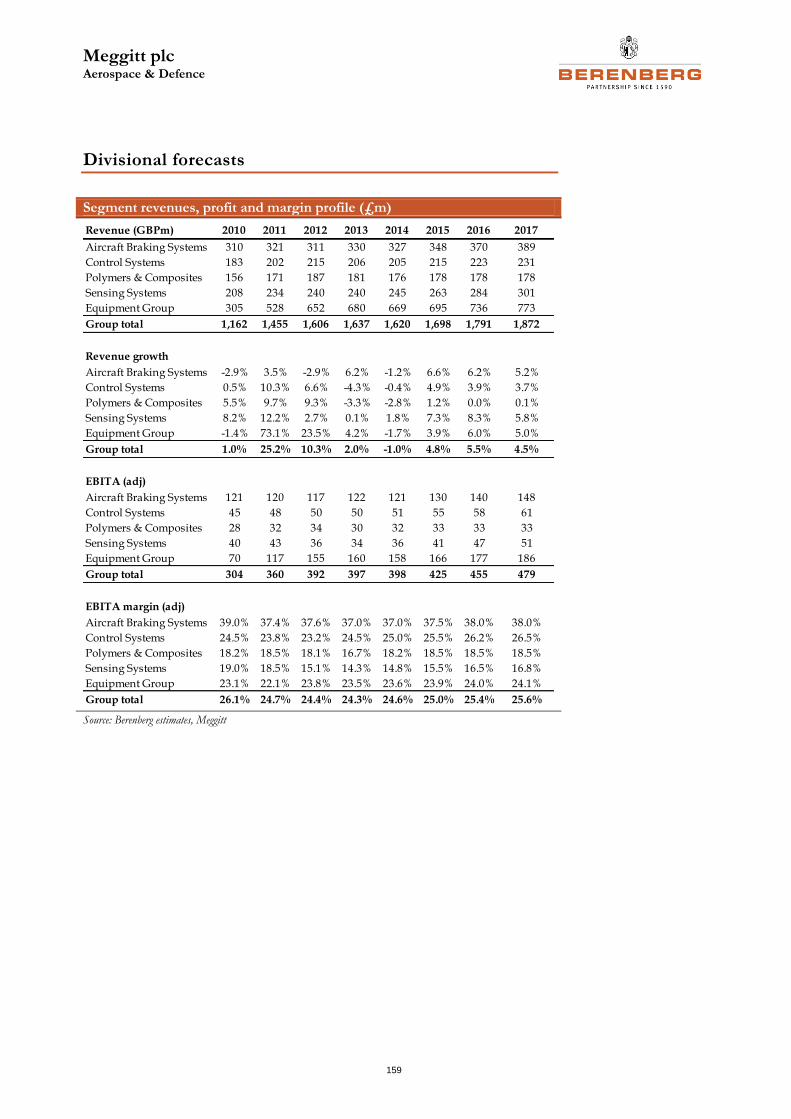
Meggitt plc Aerospace & Defence
159
Divisional forecasts
Segment revenues, profit and margin profile (£m)
Source: Berenberg estimates, Meggitt
Revenue (GBPm) 2010 2011 2012 2013 2014 2015 2016 2017
Aircraft Braking Systems 310 321 311 330 327 348 370 389
Control Systems 183 202 215 206 205 215 223 231
Polymers & Composites 156 171 187 181 176 178 178 178
Sensing Systems 208 234 240 240 245 263 284 301
Equipment Group 305 528 652 680 669 695 736 773
Group total 1,162 1,455 1,606 1,637 1,620 1,698 1,791 1,872
Revenue growth
Aircraft Braking Systems -2.9% 3.5% -2.9% 6.2% -1.2% 6.6% 6.2% 5.2%
Control Systems 0.5% 10.3% 6.6% -4.3% -0.4% 4.9% 3.9% 3.7%
Polymers & Composites 5.5% 9.7% 9.3% -3.3% -2.8% 1.2% 0.0% 0.1%
Sensing Systems 8.2% 12.2% 2.7% 0.1% 1.8% 7.3% 8.3% 5.8%
Equipment Group -1.4% 73.1% 23.5% 4.2% -1.7% 3.9% 6.0% 5.0%
Group total 1.0% 25.2% 10.3% 2.0% -1.0% 4.8% 5.5% 4.5%
EBITA (adj)
Aircraft Braking Systems 121 120 117 122 121 130 140 148
Control Systems 45 48 50 50 51 55 58 61
Polymers & Composites 28 32 34 30 32 33 33 33
Sensing Systems 40 43 36 34 36 41 47 51
Equipment Group 70 117 155 160 158 166 177 186
Group total 304 360 392 397 398 425 455 479
EBITA margin (adj)
Aircraft Braking Systems 39.0% 37.4% 37.6% 37.0% 37.0% 37.5% 38.0% 38.0%
Control Systems 24.5% 23.8% 23.2% 24.5% 25.0% 25.5% 26.2% 26.5%
Polymers & Composites 18.2% 18.5% 18.1% 16.7% 18.2% 18.5% 18.5% 18.5%
Sensing Systems 19.0% 18.5% 15.1% 14.3% 14.8% 15.5% 16.5% 16.8%
Equipment Group 23.1% 22.1% 23.8% 23.5% 23.6% 23.9% 24.0% 24.1%
Group total 26.1% 24.7% 24.4% 24.3% 24.6% 25.0% 25.4% 25.6%
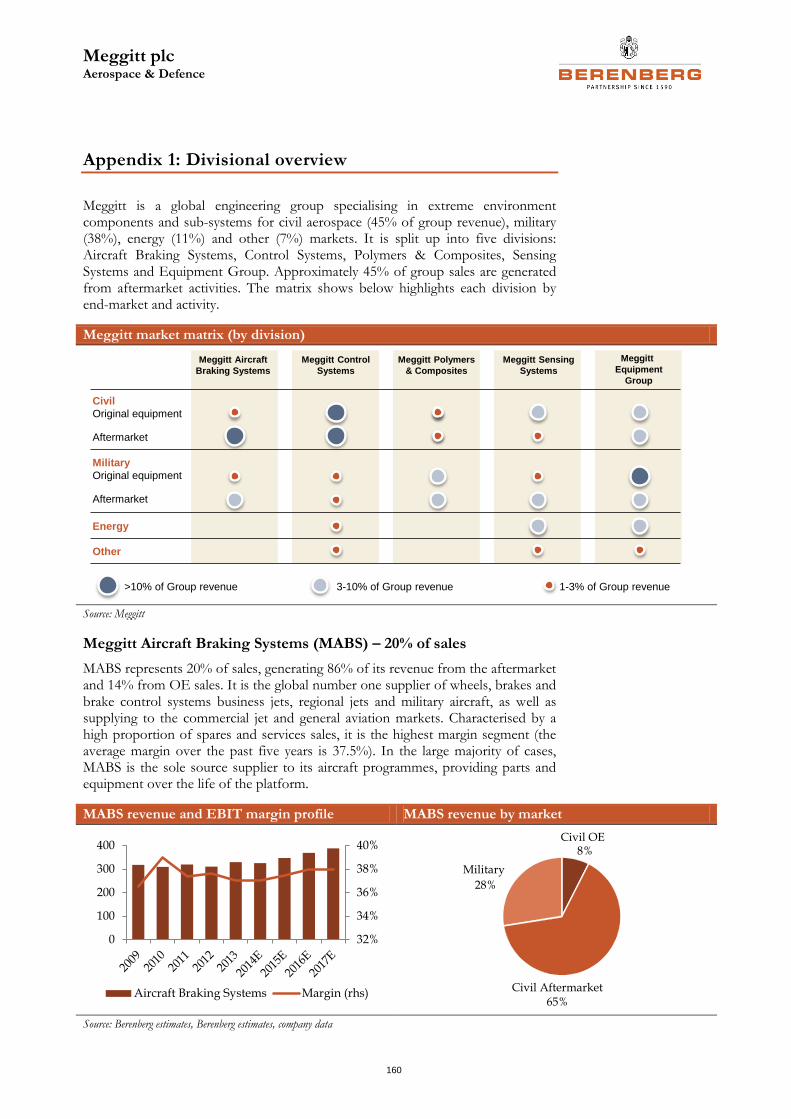
Meggitt plc Aerospace & Defence
160
Appendix 1: Divisional overview
Meggitt is a global engineering group specialising in extreme environment components and sub-systems for civil aerospace (45% of group revenue), military (38%), energy (11%) and other (7%) markets. It is split up into five divisions: Aircraft Braking Systems, Control Systems, Polymers & Composites, Sensing Systems and Equipment Group. Approximately 45% of group sales are generated from aftermarket activities. The matrix shows below highlights each division by end-market and activity.
Meggitt market matrix (by division)
Source: Meggitt
Meggitt Aircraft Braking Systems (MABS) – 20% of sales
MABS represents 20% of sales, generating 86% of its revenue from the aftermarket and 14% from OE sales. It is the global number one supplier of wheels, brakes and brake control systems business jets, regional jets and military aircraft, as well as supplying to the commercial jet and general aviation markets. Characterised by a high proportion of spares and services sales, it is the highest margin segment (the average margin over the past five years is 37.5%). In the large majority of cases, MABS is the sole source supplier to its aircraft programmes, providing parts and equipment over the life of the platform.
MABS revenue and EBIT margin profile MABS revenue by market
Source: Berenberg estimates, Berenberg estimates, company data
Civil
Original equipment
Aftermarket
Military
Original equipment
Aftermarket
Energy
Other
>10% of Group revenue 3-10% of Group revenue 1-3% of Group revenue
Meggitt Aircraft
Braking Systems
Meggitt Control
Systems
Meggitt Polymers
& Composites
Meggitt Sensing
Systems
Meggitt
Equipment
Group
32%
34%
36%
38%
40%
0
100
200
300
400
Aircraft Braking Systems Margin (rhs)
8%
65%
28%
Civil OE
Civil Aftermarket
Military
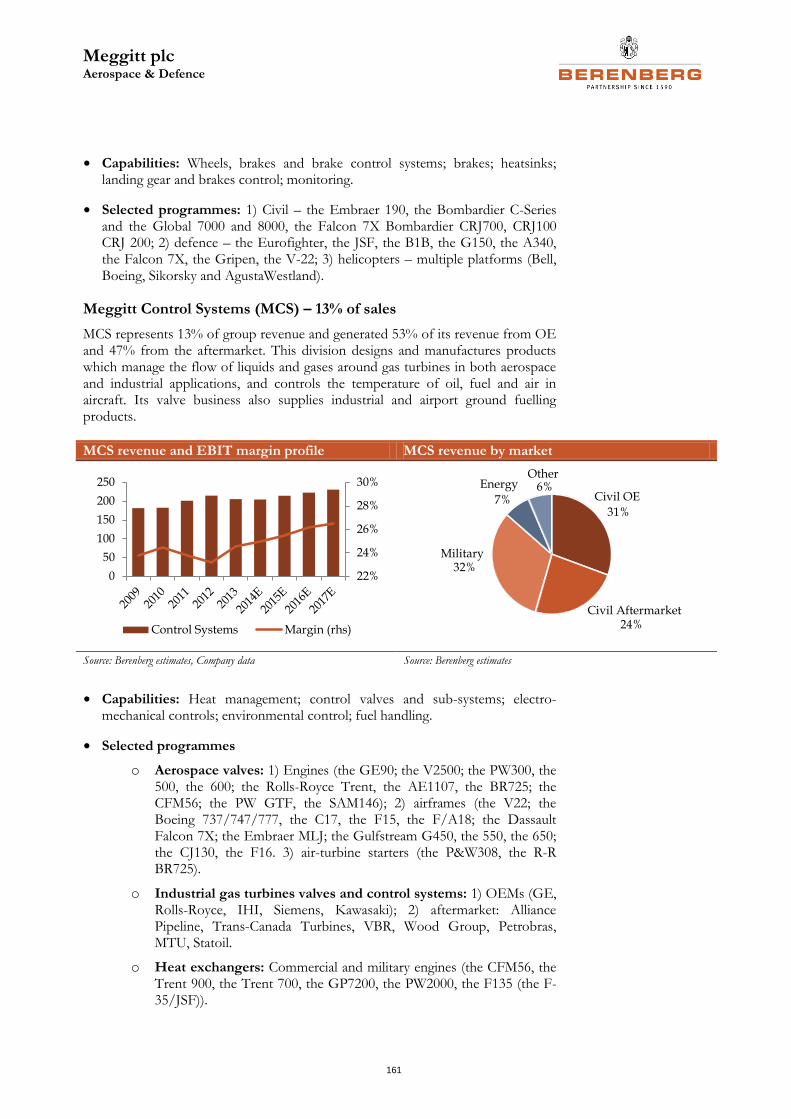
Meggitt plc Aerospace & Defence
161
• Capabilities: Wheels, brakes and brake control systems; brakes; heatsinks; landing gear and brakes control; monitoring.
• Selected programmes: 1) Civil – the Embraer 190, the Bombardier C-Series and the Global 7000 and 8000, the Falcon 7X Bombardier CRJ700, CRJ100 CRJ 200; 2) defence – the Eurofighter, the JSF, the B1B, the G150, the A340, the Falcon 7X, the Gripen, the V-22; 3) helicopters – multiple platforms (Bell, Boeing, Sikorsky and AgustaWestland).
Meggitt Control Systems (MCS) – 13% of sales
MCS represents 13% of group revenue and generated 53% of its revenue from OE and 47% from the aftermarket. This division designs and manufactures products which manage the flow of liquids and gases around gas turbines in both aerospace and industrial applications, and controls the temperature of oil, fuel and air in aircraft. Its valve business also supplies industrial and airport ground fuelling products.
MCS revenue and EBIT margin profile MCS revenue by market
Source: Berenberg estimates, Company data Source: Berenberg estimates
• Capabilities: Heat management; control valves and sub-systems; electro-mechanical controls; environmental control; fuel handling.
• Selected programmes
o Aerospace valves: 1) Engines (the GE90; the V2500; the PW300, the 500, the 600; the Rolls-Royce Trent, the AE1107, the BR725; the CFM56; the PW GTF, the SAM146); 2) airframes (the V22; the Boeing 737/747/777, the C17, the F15, the F/A18; the Dassault Falcon 7X; the Embraer MLJ; the Gulfstream G450, the 550, the 650; the CJ130, the F16. 3) air-turbine starters (the P&W308, the R-R BR725).
o Industrial gas turbines valves and control systems: 1) OEMs (GE, Rolls-Royce, IHI, Siemens, Kawasaki); 2) aftermarket: Alliance Pipeline, Trans-Canada Turbines, VBR, Wood Group, Petrobras, MTU, Statoil.
o Heat exchangers: Commercial and military engines (the CFM56, the Trent 900, the Trent 700, the GP7200, the PW2000, the F135 (the F-35/JSF)).
22%
24%
26%
28%
30%
0
50
100
150
200
250
Control Systems Margin (rhs)
31%
24%
32%
7%6%
Civil OE
Civil Aftermarket
Military
EnergyOther
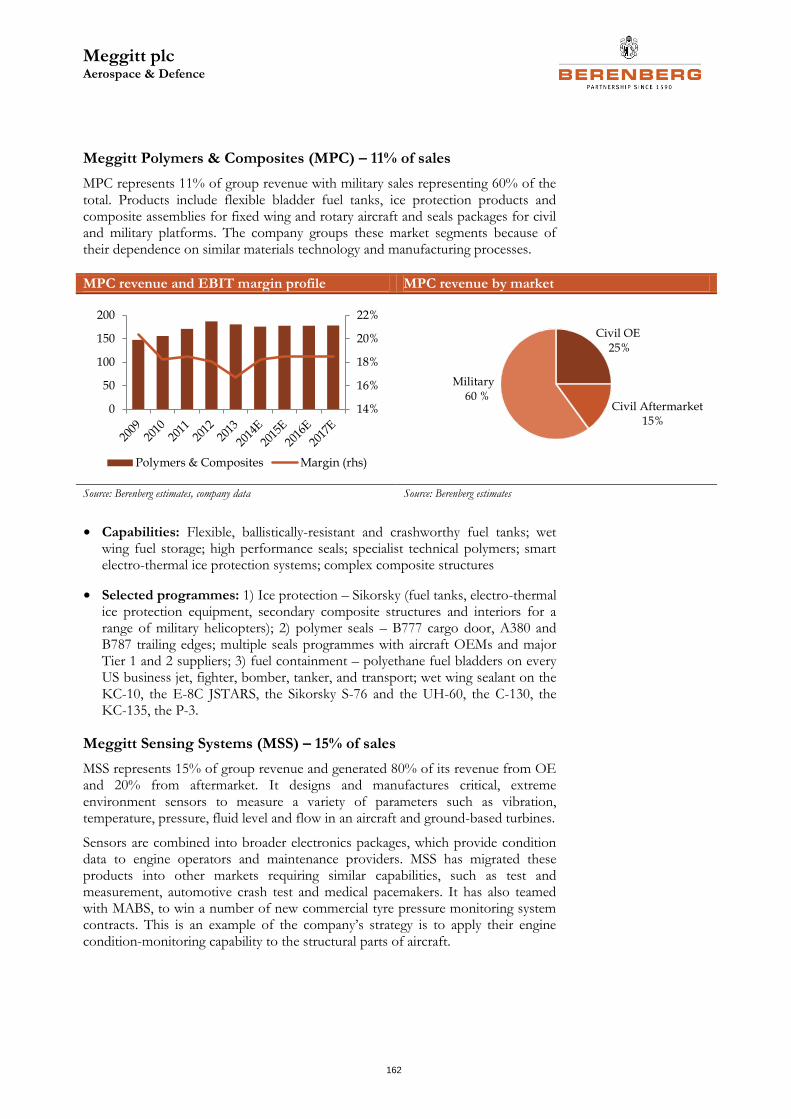
Meggitt plc Aerospace & Defence
162
Meggitt Polymers & Composites (MPC) – 11% of sales
MPC represents 11% of group revenue with military sales representing 60% of the total. Products include flexible bladder fuel tanks, ice protection products and composite assemblies for fixed wing and rotary aircraft and seals packages for civil and military platforms. The company groups these market segments because of their dependence on similar materials technology and manufacturing processes.
MPC revenue and EBIT margin profile MPC revenue by market
Source: Berenberg estimates, company data Source: Berenberg estimates
• Capabilities: Flexible, ballistically-resistant and crashworthy fuel tanks; wet wing fuel storage; high performance seals; specialist technical polymers; smart electro-thermal ice protection systems; complex composite structures
• Selected programmes: 1) Ice protection – Sikorsky (fuel tanks, electro-thermal ice protection equipment, secondary composite structures and interiors for a range of military helicopters); 2) polymer seals – B777 cargo door, A380 and B787 trailing edges; multiple seals programmes with aircraft OEMs and major Tier 1 and 2 suppliers; 3) fuel containment – polyethane fuel bladders on every US business jet, fighter, bomber, tanker, and transport; wet wing sealant on the KC-10, the E-8C JSTARS, the Sikorsky S-76 and the UH-60, the C-130, the KC-135, the P-3.
Meggitt Sensing Systems (MSS) – 15% of sales
MSS represents 15% of group revenue and generated 80% of its revenue from OE and 20% from aftermarket. It designs and manufactures critical, extreme environment sensors to measure a variety of parameters such as vibration, temperature, pressure, fluid level and flow in an aircraft and ground-based turbines.
Sensors are combined into broader electronics packages, which provide condition data to engine operators and maintenance providers. MSS has migrated these products into other markets requiring similar capabilities, such as test and measurement, automotive crash test and medical pacemakers. It has also teamed with MABS, to win a number of new commercial tyre pressure monitoring system contracts. This is an example of the company’s strategy is to apply their engine condition-monitoring capability to the structural parts of aircraft.
14%
16%
18%
20%
22%
0
50
100
150
200
Polymers & Composites Margin (rhs)
25%
15%
60 %
Civil OE
Civil Aftermarket
Military
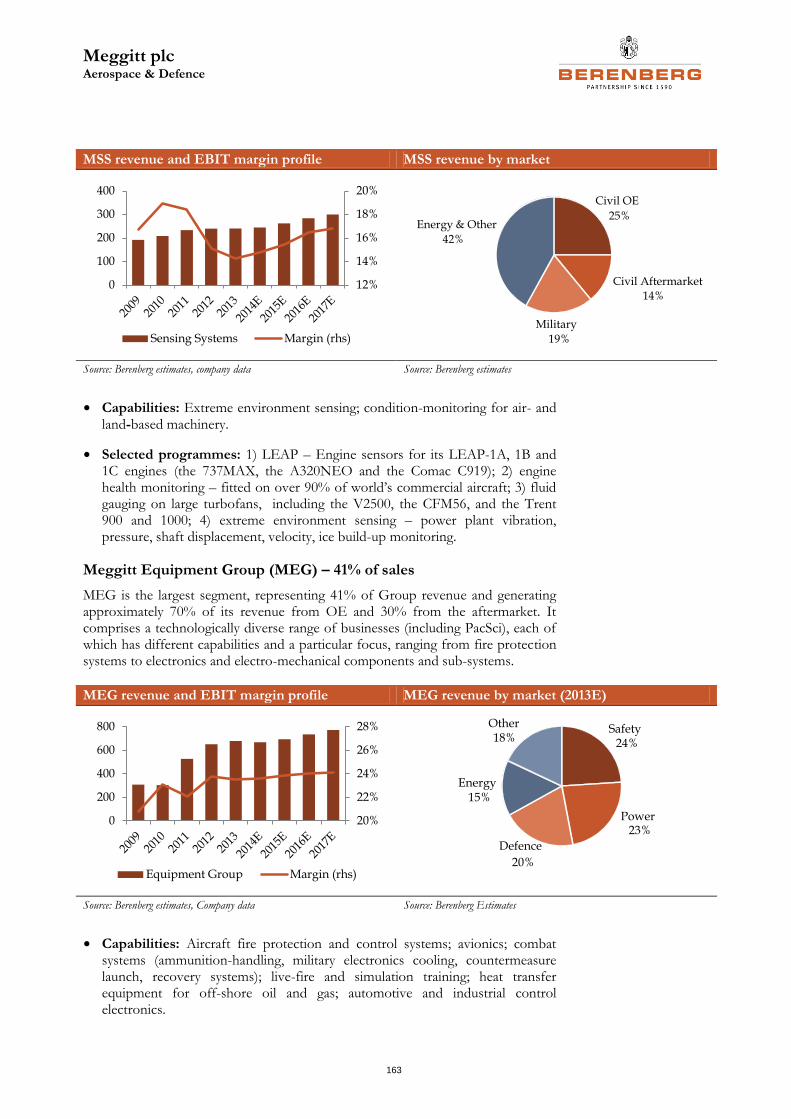
Meggitt plc Aerospace & Defence
163
MSS revenue and EBIT margin profile MSS revenue by market
Source: Berenberg estimates, company data Source: Berenberg estimates
• Capabilities: Extreme environment sensing; condition-monitoring for air- and land-based machinery.
• Selected programmes: 1) LEAP – Engine sensors for its LEAP-1A, 1B and 1C engines (the 737MAX, the A320NEO and the Comac C919); 2) engine health monitoring – fitted on over 90% of world’s commercial aircraft; 3) fluid gauging on large turbofans, including the V2500, the CFM56, and the Trent 900 and 1000; 4) extreme environment sensing – power plant vibration, pressure, shaft displacement, velocity, ice build-up monitoring.
Meggitt Equipment Group (MEG) – 41% of sales
MEG is the largest segment, representing 41% of Group revenue and generating approximately 70% of its revenue from OE and 30% from the aftermarket. It comprises a technologically diverse range of businesses (including PacSci), each of which has different capabilities and a particular focus, ranging from fire protection systems to electronics and electro-mechanical components and sub-systems.
MEG revenue and EBIT margin profile MEG revenue by market (2013E)
Source: Berenberg estimates, Company data Source: Berenberg Estimates
• Capabilities: Aircraft fire protection and control systems; avionics; combat systems (ammunition-handling, military electronics cooling, countermeasure launch, recovery systems); live-fire and simulation training; heat transfer equipment for off-shore oil and gas; automotive and industrial control electronics.
12%
14%
16%
18%
20%
0
100
200
300
400
Sensing Systems Margin (rhs)
25%
14%
19%
42%
Civil OE
Civil Aftermarket
Military
Energy & Other
20%
22%
24%
26%
28%
0
200
400
600
800
Equipment Group Margin (rhs)
24%
23%
20%
15%
18%Safety
Power
Defence
Energy
Other

Meggitt plc Aerospace & Defence
164
• Selected programmes: 1) Fire protection and control – overheat detectors fitted on more than 90% of western commercial aircraft. Fire protection on all Airbus aircraft, the 737NG and on all Dassault’s business and military aircraft. Fire protection and control products to multiple OEMS and tier 1 manufacturers; 2) power management – converters on all Airbus’s aircraft, a high proportion of Boeing aircraft, and also every US fighter, interceptor and bomber; 3) ammunition handling – the AH-64 Apache, the AC-130U, the UH-60 Blackhawk, the M-1128 Stryker 105 mm Mobile Gun System; 4) avionics – flight displays and threat warning indicators on a number of fast jet, cargo aircraft and helicopters.
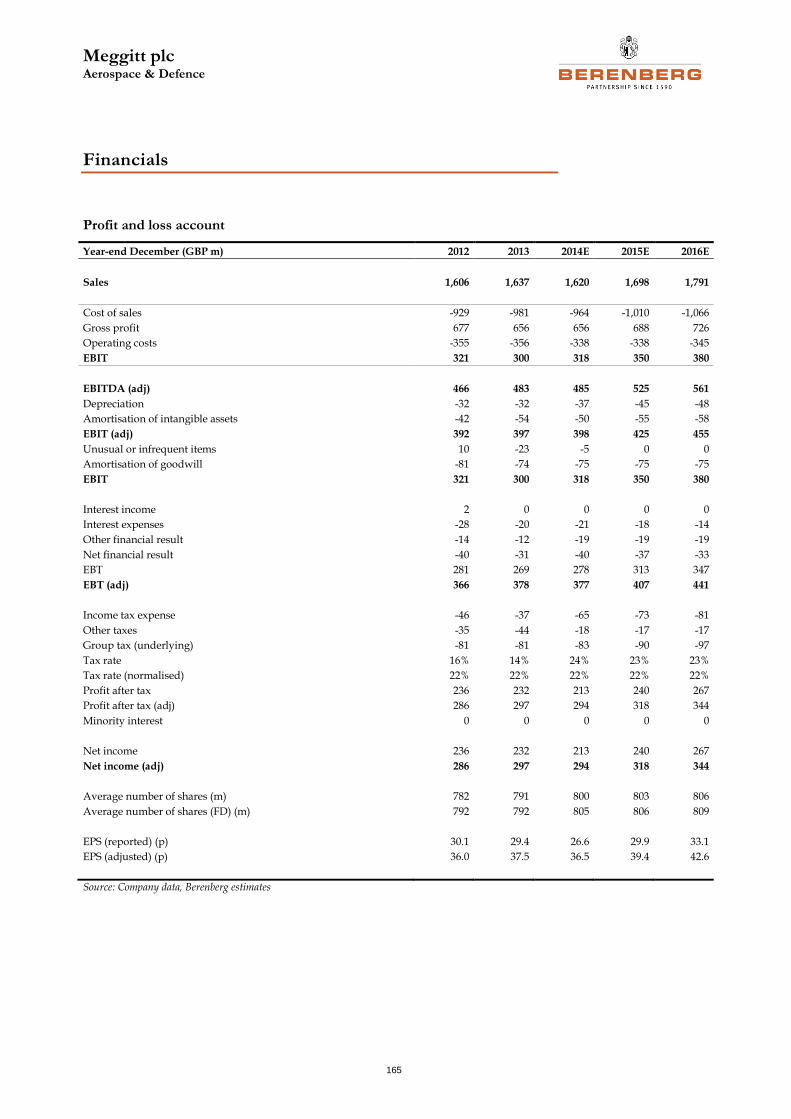
Meggitt plc Aerospace & Defence
165
Financials
Profit and loss account
Year-end December (GBP m) 2012 2013 2014E 2015E 2016E
Sales 1,606 1,637 1,620 1,698 1,791
Cost of sales -929 -981 -964 -1,010 -1,066
Gross profit 677 656 656 688 726
Operating costs -355 -356 -338 -338 -345
EBIT 321 300 318 350 380
EBITDA (adj) 466 483 485 525 561
Depreciation -32 -32 -37 -45 -48
Amortisation of intangible assets -42 -54 -50 -55 -58
EBIT (adj) 392 397 398 425 455
Unusual or infrequent items 10 -23 -5 0 0
Amortisation of goodwill -81 -74 -75 -75 -75
EBIT 321 300 318 350 380
Interest income 2 0 0 0 0
Interest expenses -28 -20 -21 -18 -14
Other financial result -14 -12 -19 -19 -19
Net financial result -40 -31 -40 -37 -33
EBT 281 269 278 313 347
EBT (adj) 366 378 377 407 441
Income tax expense -46 -37 -65 -73 -81
Other taxes -35 -44 -18 -17 -17
Group tax (underlying) -81 -81 -83 -90 -97
Tax rate 16% 14% 24% 23% 23%
Tax rate (normalised) 22% 22% 22% 22% 22%
Profit after tax 236 232 213 240 267
Profit after tax (adj) 286 297 294 318 344
Minority interest 0 0 0 0 0
Net income 236 232 213 240 267
Net income (adj) 286 297 294 318 344
Average number of shares (m) 782 791 800 803 806
Average number of shares (FD) (m) 792 792 805 806 809
EPS (reported) (p) 30.1 29.4 26.6 29.9 33.1
EPS (adjusted) (p) 36.0 37.5 36.5 39.4 42.6
Source: Company data, Berenberg estimates
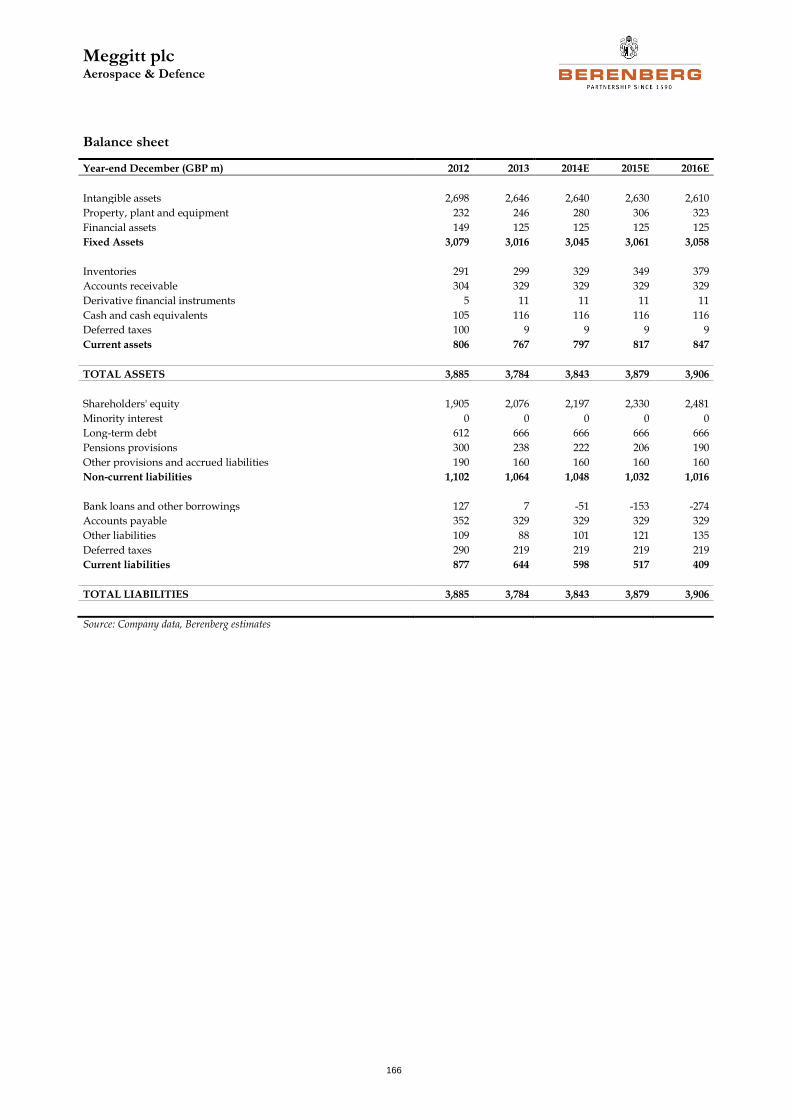
Meggitt plc Aerospace & Defence
166
Balance sheet
Year-end December (GBP m) 2012 2013 2014E 2015E 2016E
Intangible assets 2,698 2,646 2,640 2,630 2,610
Property, plant and equipment 232 246 280 306 323
Financial assets 149 125 125 125 125
Fixed Assets 3,079 3,016 3,045 3,061 3,058
Inventories 291 299 329 349 379
Accounts receivable 304 329 329 329 329
Derivative financial instruments 5 11 11 11 11
Cash and cash equivalents 105 116 116 116 116
Deferred taxes 100 9 9 9 9
Current assets 806 767 797 817 847
TOTAL ASSETS 3,885 3,784 3,843 3,879 3,906
Shareholders' equity 1,905 2,076 2,197 2,330 2,481
Minority interest 0 0 0 0 0
Long-term debt 612 666 666 666 666
Pensions provisions 300 238 222 206 190
Other provisions and accrued liabilities 190 160 160 160 160
Non-current liabilities 1,102 1,064 1,048 1,032 1,016
Bank loans and other borrowings 127 7 -51 -153 -274
Accounts payable 352 329 329 329 329
Other liabilities 109 88 101 121 135
Deferred taxes 290 219 219 219 219
Current liabilities 877 644 598 517 409
TOTAL LIABILITIES 3,885 3,784 3,843 3,879 3,906
Source: Company data, Berenberg estimates
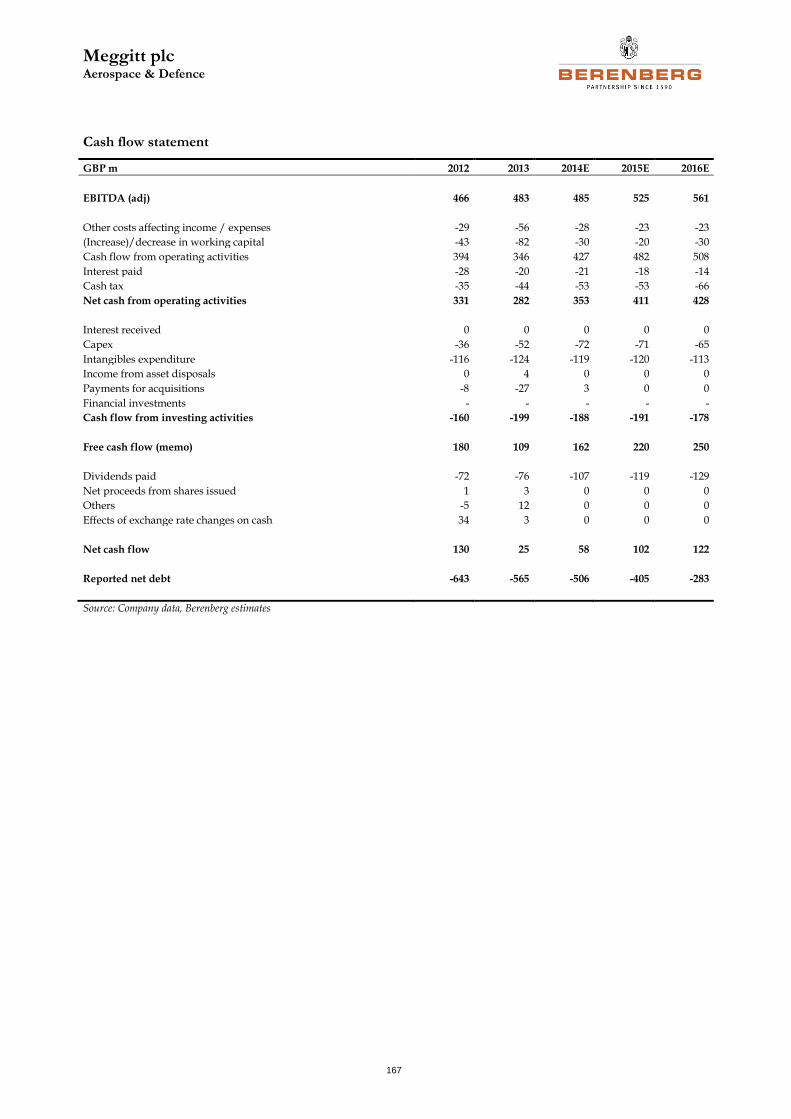
Meggitt plc Aerospace & Defence
167
Cash flow statement
GBP m 2012 2013 2014E 2015E 2016E
EBITDA (adj) 466 483 485 525 561
Other costs affecting income / expenses -29 -56 -28 -23 -23
(Increase)/decrease in working capital -43 -82 -30 -20 -30
Cash flow from operating activities 394 346 427 482 508
Interest paid -28 -20 -21 -18 -14
Cash tax -35 -44 -53 -53 -66
Net cash from operating activities 331 282 353 411 428
Interest received 0 0 0 0 0
Capex -36 -52 -72 -71 -65
Intangibles expenditure -116 -124 -119 -120 -113
Income from asset disposals 0 4 0 0 0
Payments for acquisitions -8 -27 3 0 0
Financial investments - - - - -
Cash flow from investing activities -160 -199 -188 -191 -178
Free cash flow (memo) 180 109 162 220 250
Dividends paid -72 -76 -107 -119 -129
Net proceeds from shares issued 1 3 0 0 0
Others -5 12 0 0 0
Effects of exchange rate changes on cash 34 3 0 0 0
Net cash flow 130 25 58 102 122
Reported net debt -643 -565 -506 -405 -283
Source: Company data, Berenberg estimates
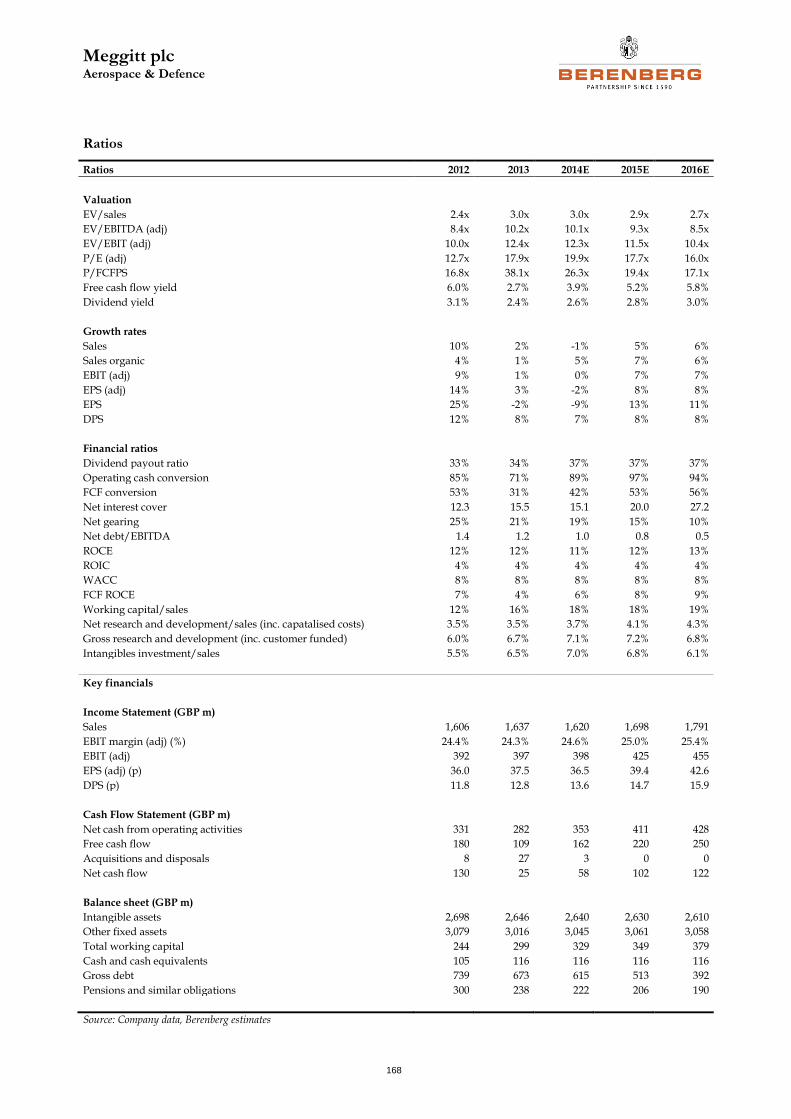
Meggitt plc Aerospace & Defence
168
Ratios
Ratios 2012 2013 2014E 2015E 2016E
Valuation
EV/sales 2.4x 3.0x 3.0x 2.9x 2.7x
EV/EBITDA (adj) 8.4x 10.2x 10.1x 9.3x 8.5x
EV/EBIT (adj) 10.0x 12.4x 12.3x 11.5x 10.4x
P/E (adj) 12.7x 17.9x 19.9x 17.7x 16.0x
P/FCFPS 16.8x 38.1x 26.3x 19.4x 17.1x
Free cash flow yield 6.0% 2.7% 3.9% 5.2% 5.8%
Dividend yield 3.1% 2.4% 2.6% 2.8% 3.0%
Growth rates
Sales 10% 2% -1% 5% 6%
Sales organic 4% 1% 5% 7% 6%
EBIT (adj) 9% 1% 0% 7% 7%
EPS (adj) 14% 3% -2% 8% 8%
EPS 25% -2% -9% 13% 11%
DPS 12% 8% 7% 8% 8%
Financial ratios
Dividend payout ratio 33% 34% 37% 37% 37%
Operating cash conversion 85% 71% 89% 97% 94%
FCF conversion 53% 31% 42% 53% 56%
Net interest cover 12.3 15.5 15.1 20.0 27.2
Net gearing 25% 21% 19% 15% 10%
Net debt/EBITDA 1.4 1.2 1.0 0.8 0.5
ROCE 12% 12% 11% 12% 13%
ROIC 4% 4% 4% 4% 4%
WACC 8% 8% 8% 8% 8%
FCF ROCE 7% 4% 6% 8% 9%
Working capital/sales 12% 16% 18% 18% 19%
Net research and development/sales (inc. capatalised costs) 3.5% 3.5% 3.7% 4.1% 4.3%
Gross research and development (inc. customer funded) 6.0% 6.7% 7.1% 7.2% 6.8%
Intangibles investment/sales 5.5% 6.5% 7.0% 6.8% 6.1%
Key financials
Income Statement (GBP m)
Sales 1,606 1,637 1,620 1,698 1,791
EBIT margin (adj) (%) 24.4% 24.3% 24.6% 25.0% 25.4%
EBIT (adj) 392 397 398 425 455
EPS (adj) (p) 36.0 37.5 36.5 39.4 42.6
DPS (p) 11.8 12.8 13.6 14.7 15.9
Cash Flow Statement (GBP m)
Net cash from operating activities 331 282 353 411 428
Free cash flow 180 109 162 220 250
Acquisitions and disposals 8 27 3 0 0
Net cash flow 130 25 58 102 122
Balance sheet (GBP m)
Intangible assets 2,698 2,646 2,640 2,630 2,610
Other fixed assets 3,079 3,016 3,045 3,061 3,058
Total working capital 244 299 329 349 379
Cash and cash equivalents 105 116 116 116 116
Gross debt 739 673 615 513 392
Pensions and similar obligations 300 238 222 206 190
Source: Company data, Berenberg estimates
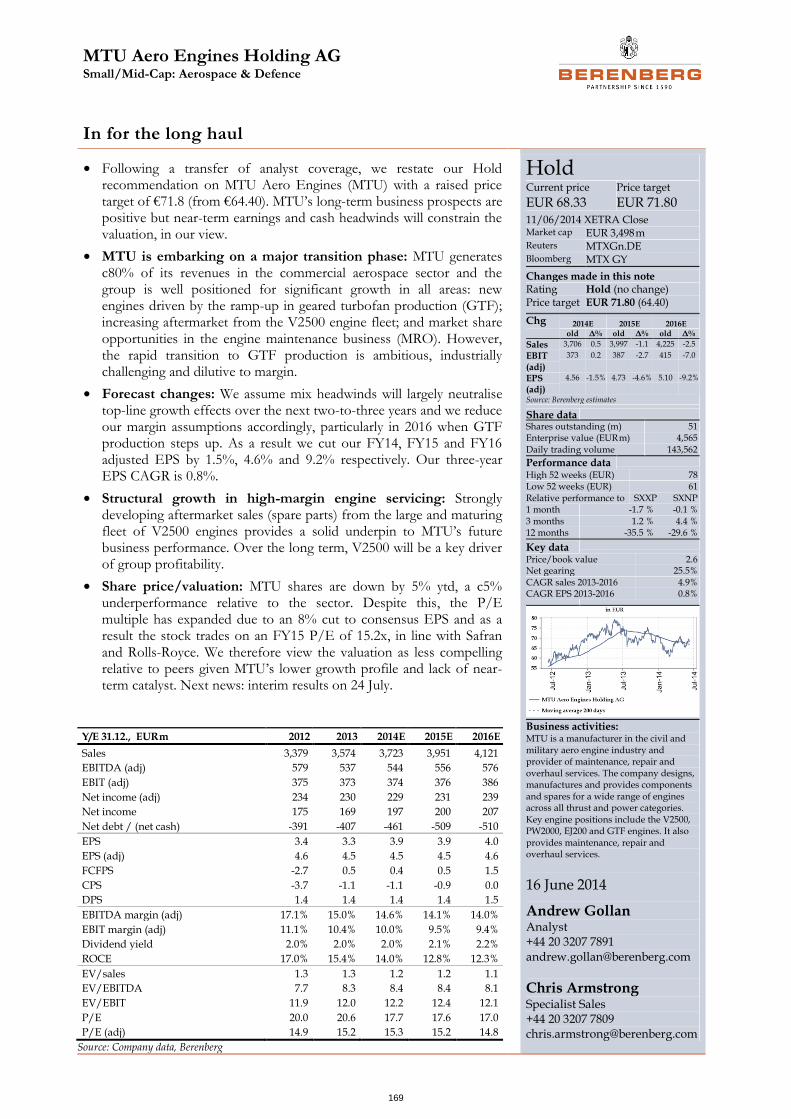
MTU Aero Engines Holding AG Small/Mid-Cap: Aerospace & Defence
169
In for the long haul
• Following a transfer of analyst coverage, we restate our Hold recommendation on MTU Aero Engines (MTU) with a raised price target of €71.8 (from €64.40). MTU’s long-term business prospects are positive but near-term earnings and cash headwinds will constrain the valuation, in our view.
• MTU is embarking on a major transition phase: MTU generates c80% of its revenues in the commercial aerospace sector and the group is well positioned for significant growth in all areas: new engines driven by the ramp-up in geared turbofan production (GTF); increasing aftermarket from the V2500 engine fleet; and market share opportunities in the engine maintenance business (MRO). However, the rapid transition to GTF production is ambitious, industrially challenging and dilutive to margin.
• Forecast changes: We assume mix headwinds will largely neutralise top-line growth effects over the next two-to-three years and we reduce our margin assumptions accordingly, particularly in 2016 when GTF production steps up. As a result we cut our FY14, FY15 and FY16 adjusted EPS by 1.5%, 4.6% and 9.2% respectively. Our three-year EPS CAGR is 0.8%.
• Structural growth in high-margin engine servicing: Strongly developing aftermarket sales (spare parts) from the large and maturing fleet of V2500 engines provides a solid underpin to MTU’s future business performance. Over the long term, V2500 will be a key driver of group profitability.
• Share price/valuation: MTU shares are down by 5% ytd, a c5% underperformance relative to the sector. Despite this, the P/E multiple has expanded due to an 8% cut to consensus EPS and as a result the stock trades on an FY15 P/E of 15.2x, in line with Safran and Rolls-Royce. We therefore view the valuation as less compelling relative to peers given MTU’s lower growth profile and lack of near-term catalyst. Next news: interim results on 24 July.
Hold Current price
EUR 68.33 Price target
EUR 71.80 11/06/2014 XETRA Close Market cap EUR 3,498 m Reuters MTXGn.DE Bloomberg MTX GY
Changes made in this note Rating Hold (no change) Price target EUR 71.80 (64.40) Chg 2014E 2015E 2016E
old Δ% old Δ% old Δ%
Sales 3,706 0.5 3,997 -1.1 4,225 -2.5
EBIT (adj)
373 0.2 387 -2.7 415 -7.0
EPS (adj)
4.56 -1.5% 4.73 -4.6% 5.10 -9.2%
Source: Berenberg estimates
Share data
Shares outstanding (m) 51 Enterprise value (EUR m) 4,565 Daily trading volume 143,562
Performance data
High 52 weeks (EUR) 78 Low 52 weeks (EUR) 61 Relative performance to SXXP SXNP 1 month -1.7 % -0.1 % 3 months 1.2 % 4.4 % 12 months -35.5 % -29.6 %
Key data
Price/book value 2.6 Net gearing 25.5% CAGR sales 2013-2016 4.9% CAGR EPS 2013-2016 0.8%
Business activities: MTU is a manufacturer in the civil and military aero engine industry and provider of maintenance, repair and overhaul services. The company designs, manufactures and provides components and spares for a wide range of engines across all thrust and power categories. Key engine positions include the V2500, PW2000, EJ200 and GTF engines. It also provides maintenance, repair and overhaul services.
16 June 2014
Andrew Gollan Analyst +44 20 3207 7891 [email protected]
Chris Armstrong
Specialist Sales +44 20 3207 7809 [email protected]
Y/E 31.12., EUR m 2012 2013 2014E 2015E 2016E
Sales 3,379 3,574 3,723 3,951 4,121
EBITDA (adj) 579 537 544 556 576
EBIT (adj) 375 373 374 376 386
Net income (adj) 234 230 229 231 239
Net income 175 169 197 200 207
Net debt / (net cash) -391 -407 -461 -509 -510
EPS 3.4 3.3 3.9 3.9 4.0
EPS (adj) 4.6 4.5 4.5 4.5 4.6
FCFPS -2.7 0.5 0.4 0.5 1.5
CPS -3.7 -1.1 -1.1 -0.9 0.0
DPS 1.4 1.4 1.4 1.4 1.5
EBITDA margin (adj) 17.1% 15.0% 14.6% 14.1% 14.0%
EBIT margin (adj) 11.1% 10.4% 10.0% 9.5% 9.4%
Dividend yield 2.0% 2.0% 2.0% 2.1% 2.2%
ROCE 17.0% 15.4% 14.0% 12.8% 12.3%
EV/sales 1.3 1.3 1.2 1.2 1.1
EV/EBITDA 7.7 8.3 8.4 8.4 8.1
EV/EBIT 11.9 12.0 12.2 12.4 12.1
P/E 20.0 20.6 17.7 17.6 17.0
P/E (adj) 14.9 15.2 15.3 15.2 14.8
Source: Company data, Berenberg
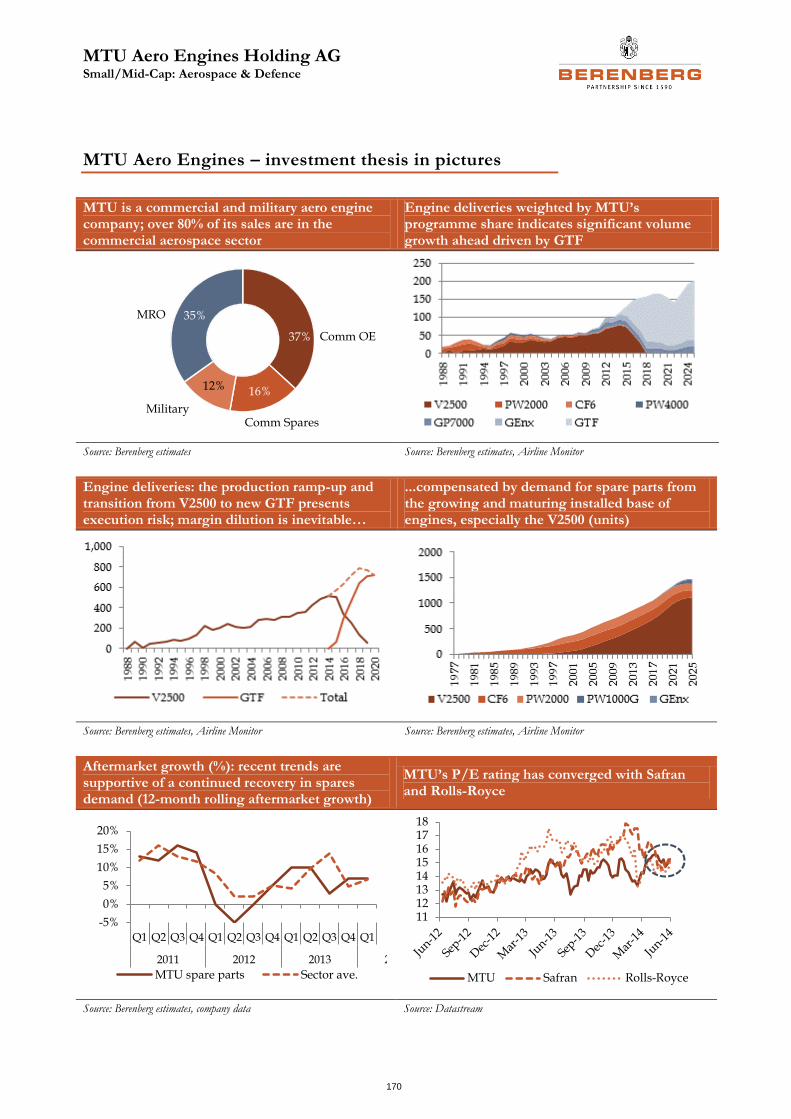
MTU Aero Engines Holding AG Small/Mid-Cap: Aerospace & Defence
170
MTU Aero Engines – investment thesis in pictures
MTU is a commercial and military aero engine company; over 80% of its sales are in the commercial aerospace sector
Engine deliveries weighted by MTU’s programme share indicates significant volume growth ahead driven by GTF
Source: Berenberg estimates Source: Berenberg estimates, Airline Monitor
Engine deliveries: the production ramp-up and transition from V2500 to new GTF presents execution risk; margin dilution is inevitable…
...compensated by demand for spare parts from the growing and maturing installed base of engines, especially the V2500 (units)
Source: Berenberg estimates, Airline Monitor Source: Berenberg estimates, Airline Monitor
Aftermarket growth (%): recent trends are supportive of a continued recovery in spares demand (12-month rolling aftermarket growth)
MTU’s P/E rating has converged with Safran and Rolls-Royce
Source: Berenberg estimates, company data Source: Datastream
37%
16%12%
35%
Comm OE
Comm SparesMilitary
MRO
-5%
0%
5%
10%
15%
20%
Q1 Q2 Q3 Q4 Q1 Q2 Q3 Q4 Q1 Q2 Q3 Q4 Q1
2011 2012 2013 2014
MTU spare parts Sector ave.
1112131415161718
MTU Safran Rolls-Royce
MTU Aero Engines Holding AG Small/Mid-Cap: Aerospace & Defence
171
MTU Aero Engines – investments thesis
What’s new: Following a transfer of analyst coverage, we are re-stating our neutral stance on MTU Aero Engines. We are cutting our EPS estimates by 2-9% due to the dilution effect of accelerating production of new engines but we raise our 12-month price target to €71.80, reflecting sector valuations and our positive view of the group’s long-term business prospects.
Two-minute summary: MTU is a victim of its own success. Earnings progression over the next two to three years will be muted by the dilutive effects of increasing engine production, and particularly due to the rapid transition from the established V2500 engine (for the Airbus A320) to production of the geared turbo fan (GTF) family of engines currently in development for five new aircraft programmes (the Airbus A320NEO, the Bombardier CSeries, the Mitsubishi MRJ, the Irkut MS-21 and Embraer E-Jets E2). Over the past 12 months, earnings momentum has been negative as the business challenges of transition have become clearer, although we feel comfortable now that downside risk is limited based on our lowered estimates. The shares have recently recovered their rating lost through the H213 downgrade period, and on a relative valuation basis look less attractive at 15.2x P/E (FY15E) versus the civil aero peer average of 14.4x. In summary, we are positive about MTU’s long-term prospects but a lack of catalysts and constrained growth near-term and the shares’ relatively full valuation compel us to maintain our neutral rating.
Key investment point one: positioned for growth in civil aero engine but at the cost of margin
MTU is strongly positioned for a significant ramp-up in new engine deliveries but it will be margin-dilutive due to higher losses on launch programmes. The mix headwind will be substantial, particularly through 2016 and 2017 when GTF production steps up – this will be sufficient, we believe, to largely offset the positive effects of both strongly developing aftermarket revenue and growth in the MRO aircraft maintenance businesses. At the group level, we forecast that the 5% sales CAGR to 2017 translates to just 2% EBIT CAGR, the second-lowest in our civil aero peer group.
Key investment point two: momentum is building in the high-margin spare parts activity
The V2500 is the group’s most important aftermarket engine and with only half the fleet having gone through their first major overhaul, we expect high-margin spares revenue to grow continuously through to a peak in the middle of the next decade. V2500 spares will therefore be a key driver and underpin of group profits for many years (by 2020, we estimate it could account for 50-60% of group profits), while in the nearer term, growth will offset reducing aftermarket on older engines (PW2000 and CF6) and the OE mix headwinds referred to above.
Key investment point three: potential to outgrow the commercial MRO market but competition is increasing
As the third-largest engine maintenance operator globally, with experience of servicing all major engine types, MTU’s MRO business is well placed to compete in the growth commercial MRO market. The company already has strong market shares in engine maintenance and overhaul (eg V2500 – c30%; CF6 and GE90 –
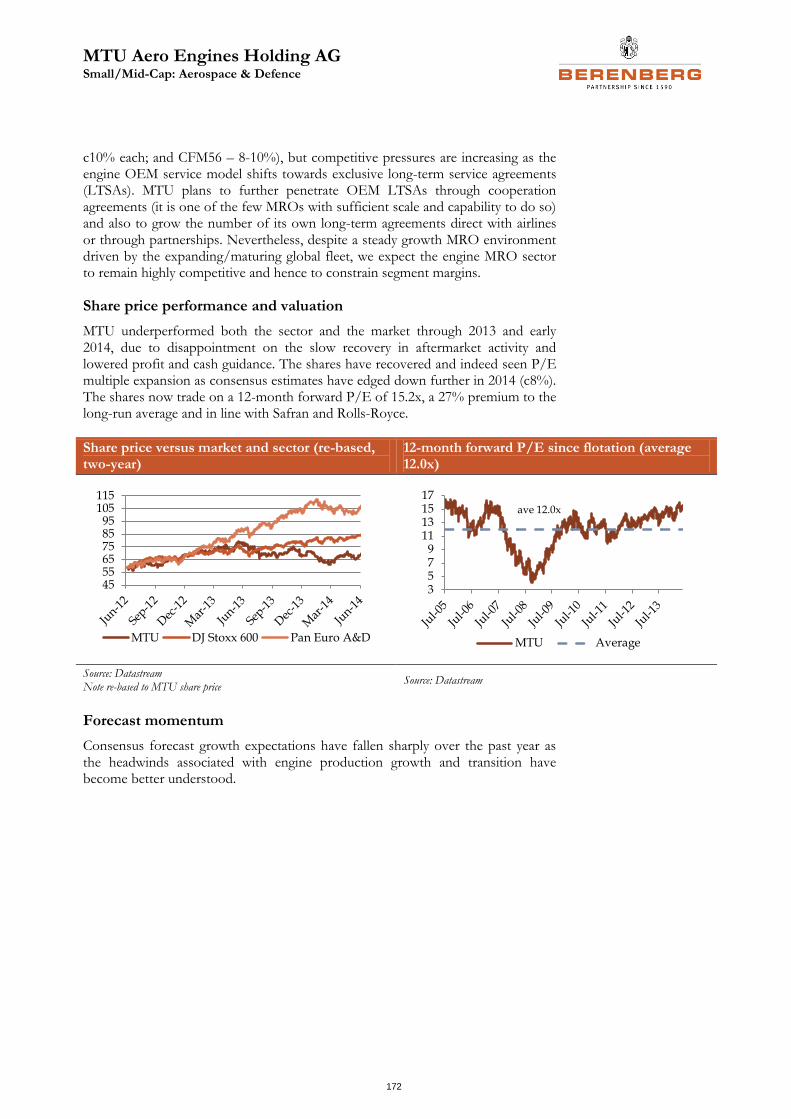
MTU Aero Engines Holding AG Small/Mid-Cap: Aerospace & Defence
172
c10% each; and CFM56 – 8-10%), but competitive pressures are increasing as the engine OEM service model shifts towards exclusive long-term service agreements (LTSAs). MTU plans to further penetrate OEM LTSAs through cooperation agreements (it is one of the few MROs with sufficient scale and capability to do so) and also to grow the number of its own long-term agreements direct with airlines or through partnerships. Nevertheless, despite a steady growth MRO environment driven by the expanding/maturing global fleet, we expect the engine MRO sector to remain highly competitive and hence to constrain segment margins.
Share price performance and valuation
MTU underperformed both the sector and the market through 2013 and early 2014, due to disappointment on the slow recovery in aftermarket activity and lowered profit and cash guidance. The shares have recovered and indeed seen P/E multiple expansion as consensus estimates have edged down further in 2014 (c8%). The shares now trade on a 12-month forward P/E of 15.2x, a 27% premium to the long-run average and in line with Safran and Rolls-Royce.
Share price versus market and sector (re-based, two-year)
12-month forward P/E since flotation (average 12.0x)
Source: Datastream Note re-based to MTU share price
Source: Datastream
Forecast momentum
Consensus forecast growth expectations have fallen sharply over the past year as the headwinds associated with engine production growth and transition have become better understood.
455565758595
105115
MTU DJ Stoxx 600 Pan Euro A&D
3579
11131517
MTU Average
ave 12.0x
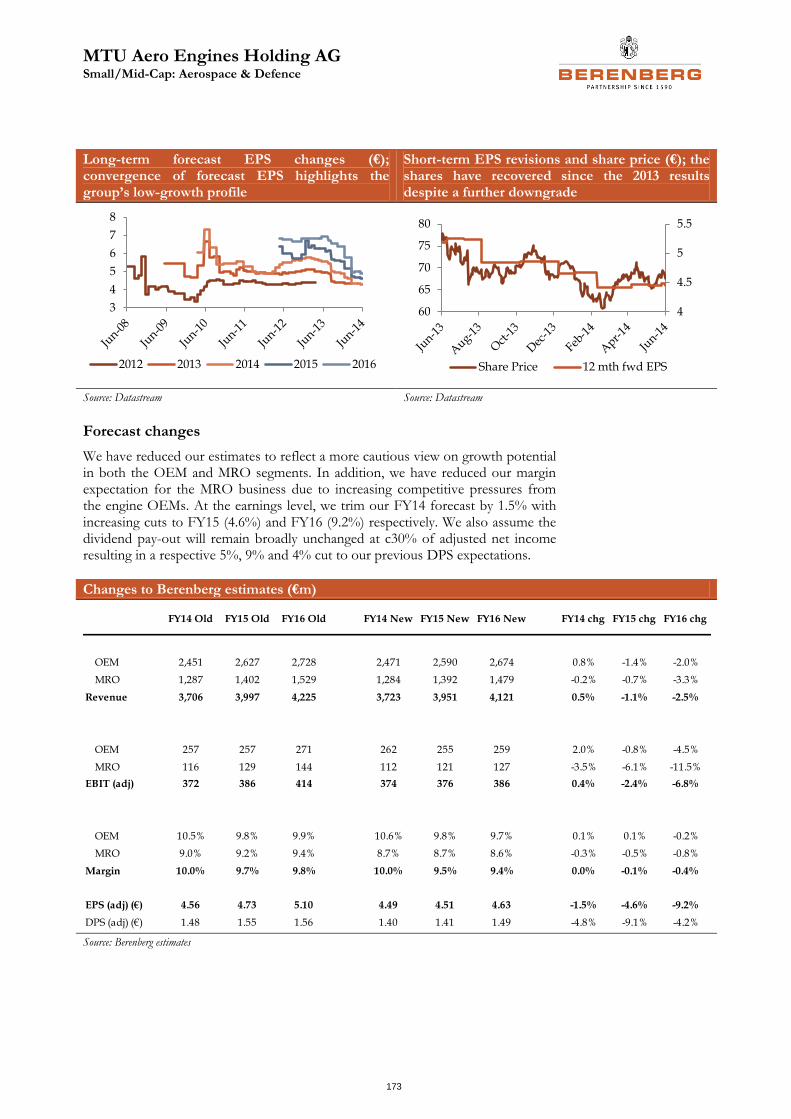
MTU Aero Engines Holding AG Small/Mid-Cap: Aerospace & Defence
173
Long-term forecast EPS changes (€); convergence of forecast EPS highlights the group’s low-growth profile
Short-term EPS revisions and share price (€); the shares have recovered since the 2013 results despite a further downgrade
Source: Datastream Source: Datastream
Forecast changes
We have reduced our estimates to reflect a more cautious view on growth potential in both the OEM and MRO segments. In addition, we have reduced our margin expectation for the MRO business due to increasing competitive pressures from the engine OEMs. At the earnings level, we trim our FY14 forecast by 1.5% with increasing cuts to FY15 (4.6%) and FY16 (9.2%) respectively. We also assume the dividend pay-out will remain broadly unchanged at c30% of adjusted net income resulting in a respective 5%, 9% and 4% cut to our previous DPS expectations.
Changes to Berenberg estimates (€m)
Source: Berenberg estimates
3
4
5
6
7
8
2012 2013 2014 2015 2016
4
4.5
5
5.5
60
65
70
75
80
Share Price 12 mth fwd EPS
FY14 Old FY15 Old FY16 Old FY14 New FY15 New FY16 New FY14 chg FY15 chg FY16 chg
OEM 2,451 2,627 2,728 2,471 2,590 2,674 0.8% -1.4% -2.0%
MRO 1,287 1,402 1,529 1,284 1,392 1,479 -0.2% -0.7% -3.3%
Revenue 3,706 3,997 4,225 3,723 3,951 4,121 0.5% -1.1% -2.5%
OEM 257 257 271 262 255 259 2.0% -0.8% -4.5%
MRO 116 129 144 112 121 127 -3.5% -6.1% -11.5%
EBIT (adj) 372 386 414 374 376 386 0.4% -2.4% -6.8%
OEM 10.5% 9.8% 9.9% 10.6% 9.8% 9.7% 0.1% 0.1% -0.2%
MRO 9.0% 9.2% 9.4% 8.7% 8.7% 8.6% -0.3% -0.5% -0.8%
Margin 10.0% 9.7% 9.8% 10.0% 9.5% 9.4% 0.0% -0.1% -0.4%
EPS (adj) (€) 4.56 4.73 5.10 4.49 4.51 4.63 -1.5% -4.6% -9.2%
DPS (adj) (€) 1.48 1.55 1.56 1.40 1.41 1.49 -4.8% -9.1% -4.2%
MTU Aero Engines Holding AG Small/Mid-Cap: Aerospace & Defence
174
Berenberg versus consensus
We remain 2-5% ahead of 2014 consensus estimates (EBIT and EPS) although by 2016 we are 5-6% below, reflecting our cautious stance on the growth/margin trajectory in both the OEM and MRO segments.
Berenberg forecasts versus consensus – we are now 5% below 2016 consensus estimates
Source: Berenberg estimates, Bloomberg
Ber. Cons diff (%) Ber. Cons diff (%) Ber. Cons diff (%)
Sales (£m) 3,720 3,778 -1.5% 3,895 4,043 -3.7% 4,009 4,305 -6.9%
EBIT adj (£m) 376 358 5.1% 382 377 1.5% 389 413 -5.9%
EPS adj (p) 4.5 4.4 2.9% 4.6 4.6 -0.9% 4.7 4.9 -5.0%
DPS (p) 1.4 1.5 -3.5% 1.43 1.59 -9.7% 1.50 1.84 -18.3%
201620152014
MTU Aero Engines Holding AG Small/Mid-Cap: Aerospace & Defence
175
Investment risks and concerns
• Low profit growth and cash generation to persist: Volume benefits from rising engine production and spare parts sales will be largely offset by a rapid mix change to loss-making new engines. We forecast operating profit and earnings CAGR of c2% over the next three years. Cash generation will also be constrained by capital requirements through the ramp-up, including working capital. We forecast FCF conversion at the lower end of our peer group (30-40%) throughout our forecast horizon resulting in flat net cash generation after dividends.
• Lower spare parts demand: If the development of spare parts demand falls below expectations due to reduced global flying or early fleet retirements for example (eg Boeing 757s, PW2000), group margins could be adversely affected. We believe consensus forecasts incorporate an overall assumption of sustained mid- to high single-digit growth in MTU’s commercial spares activity.
• Programmes delays – CSeries is behind schedule but NEO is on track: Delays and cost escalation on new programmes, either internally or through the supply chain, would adversely effect profitability and also sentiment. MTU’s main exposure is through its programme shares on the Pratt & Whitney GTF family of engines currently in development for five new aircraft types: the Airbus A320NEO, the Bombardier CSeries, the Mitsubishi MRJ, the Irkut MS-21 and Embraer E2 jets. The GTF engine for the CSeries regional jet is certified but the aircraft’s entry-into-service (EIS) is already 18 months behind schedule and a recent testing failure raises the possibility of further delays. Of more importance to MTU over the longer term (due to the very high volumes) is the A320NEO aircraft programme, which Airbus reports is on track for first flight and customer delivery before the end of the year which would be positive for sentiment.
• Execution risk associated with GTF ramp-up: The rapid industrial ramp-up of GTF volumes presents significant challenges for the group, both technical and industrial. We examine this in more detail further on in the report (page 179) but we summarise here our concerns in terms of the inherent risks associated with the rapid transition from production of a well-established programme (the V2500 engine) to the new and more complex GTF engine, while at the same time maintaining (and even increasing) overall volumes. We acknowledge that MTU’s industrial ramp-up preparations are advancing well, including investment in new facilities, logistics and capacity expansion. Nevertheless, execution risk remains a concern for us.
• MRO competition increasing: Competition is increasing in the global MRO sector as the engine OEMs increasingly look to secure a greater proportion of services work on their own engines, for example, through LTSAs. We think MTU is well placed to grow its overall share in the MRO market through its existing programme positions and licence agreements, but we believe margins will remain under pressure for the foreseeable future.
• Military pressures longer-term: Military OEM revenues are relatively stable underpinned by the EJ200 engine (Eurofighter) and TP400 engine (A400M) programmes. We see potential downside to out outer-year forecasts if Eurofighter production is further rescheduled (stretched) due to a lack of international orders. Conversely, any new export orders would be positively
MTU Aero Engines Holding AG Small/Mid-Cap: Aerospace & Defence
176
received not only extending production but also potentially enhancing cash flow through programme advances.
• MTU has low FX hedging cover compared to the peers: MTU’s principle currency risk is transactional, relating to excess US dollar sales over costs, currently around $1bn pa. The company actively hedges exposure through a rolling step hedge policy over the following 12 quarters, although there is some scope to vary timing depending on spot rates. We estimate MTU has c$1.5bn of cover (1.5 years) at an average dollar/euro rate of $1.29 with c70% of 2014 and 50% of 2015 net exposures covered. A one cent change in hedge rate equates to c€5m at the EBIT level, and based on a blended rate of hedge cover and spot rate, we estimate MTU will face a €4m/1.2% EBIT headwind in 2014 with no significant effects in 2015 but a €14m/3.6% headwind in 2016. We reflect this in our forecasts.
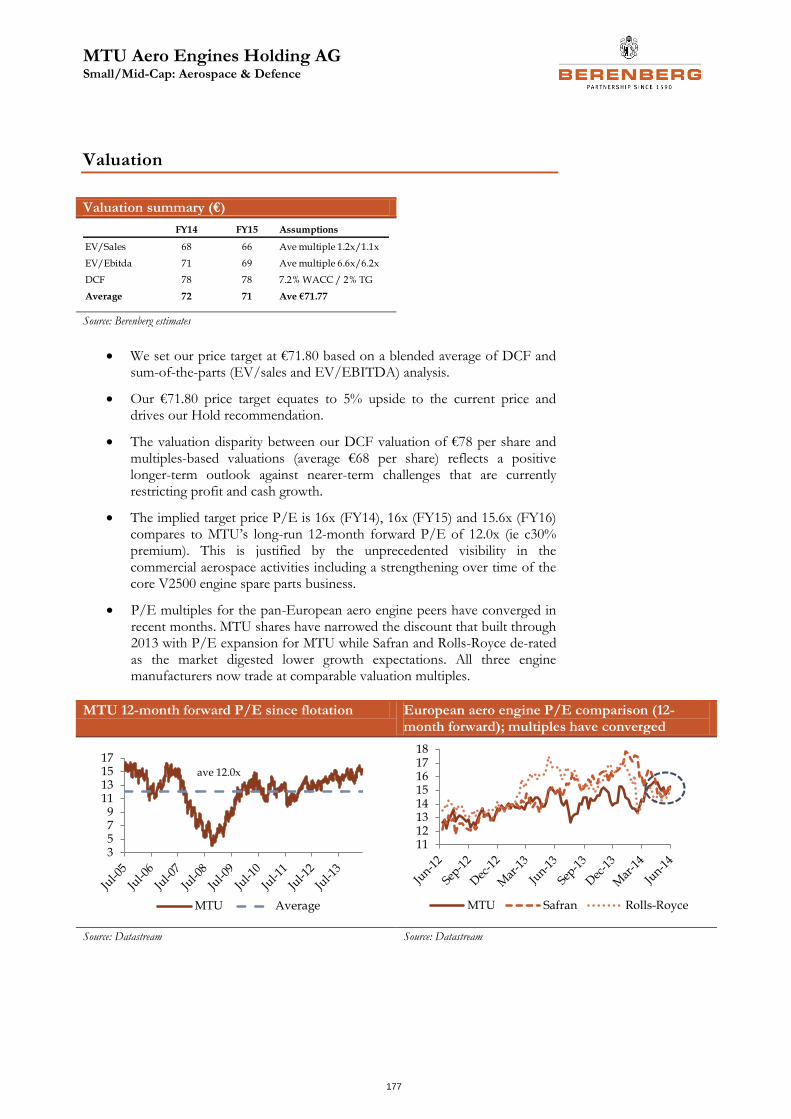
MTU Aero Engines Holding AG Small/Mid-Cap: Aerospace & Defence
177
Valuation
Valuation summary (€)
Source: Berenberg estimates
We set our price target at €71.80 based on a blended average of DCF and sum-of-the-parts (EV/sales and EV/EBITDA) analysis.
Our €71.80 price target equates to 5% upside to the current price and drives our Hold recommendation.
The valuation disparity between our DCF valuation of €78 per share and multiples-based valuations (average €68 per share) reflects a positive longer-term outlook against nearer-term challenges that are currently restricting profit and cash growth.
The implied target price P/E is 16x (FY14), 16x (FY15) and 15.6x (FY16) compares to MTU’s long-run 12-month forward P/E of 12.0x (ie c30% premium). This is justified by the unprecedented visibility in the commercial aerospace activities including a strengthening over time of the core V2500 engine spare parts business.
P/E multiples for the pan-European aero engine peers have converged in recent months. MTU shares have narrowed the discount that built through 2013 with P/E expansion for MTU while Safran and Rolls-Royce de-rated as the market digested lower growth expectations. All three engine manufacturers now trade at comparable valuation multiples.
MTU 12-month forward P/E since flotation European aero engine P/E comparison (12-month forward); multiples have converged
Source: Datastream Source: Datastream
FY14 FY15 Assumptions
EV/Sales 68 66 Ave multiple 1.2x/1.1x
EV/Ebitda 71 69 Ave multiple 6.6x/6.2x
DCF 78 78 7.2% WACC / 2% TG
Average 72 71 Ave €71.77
3579
11131517
MTU Average
ave 12.0x
1112131415161718
MTU Safran Rolls-Royce
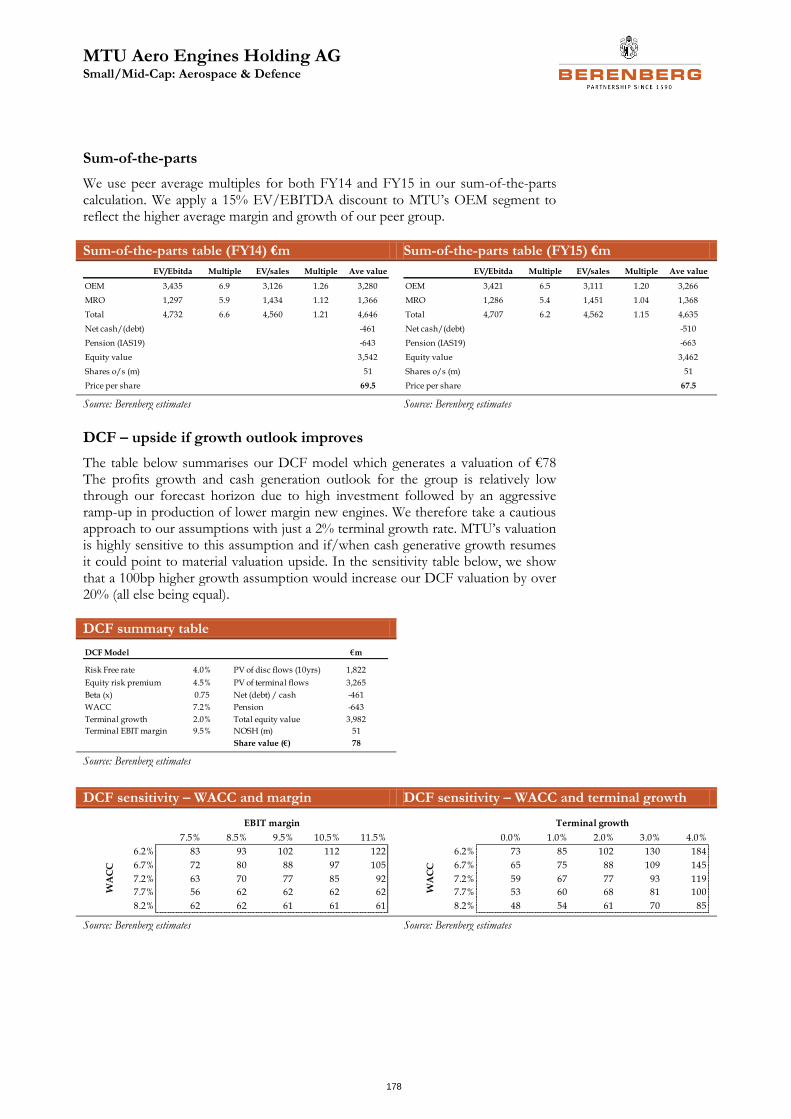
MTU Aero Engines Holding AG Small/Mid-Cap: Aerospace & Defence
178
Sum-of-the-parts
We use peer average multiples for both FY14 and FY15 in our sum-of-the-parts calculation. We apply a 15% EV/EBITDA discount to MTU’s OEM segment to reflect the higher average margin and growth of our peer group.
Sum-of-the-parts table (FY14) €m Sum-of-the-parts table (FY15) €m
Source: Berenberg estimates Source: Berenberg estimates
DCF – upside if growth outlook improves
The table below summarises our DCF model which generates a valuation of €78 The profits growth and cash generation outlook for the group is relatively low through our forecast horizon due to high investment followed by an aggressive ramp-up in production of lower margin new engines. We therefore take a cautious approach to our assumptions with just a 2% terminal growth rate. MTU’s valuation is highly sensitive to this assumption and if/when cash generative growth resumes it could point to material valuation upside. In the sensitivity table below, we show that a 100bp higher growth assumption would increase our DCF valuation by over 20% (all else being equal).
DCF summary table
Source: Berenberg estimates
DCF sensitivity – WACC and margin DCF sensitivity – WACC and terminal growth
Source: Berenberg estimates Source: Berenberg estimates
EV/Ebitda Multiple EV/sales Multiple Ave value
OEM 3,435 6.9 3,126 1.26 3,280
MRO 1,297 5.9 1,434 1.12 1,366
Total 4,732 6.6 4,560 1.21 4,646
Net cash/(debt) -461
Pension (IAS19) -643
Equity value 3,542
Shares o/s (m) 51
Price per share 69.5
EV/Ebitda Multiple EV/sales Multiple Ave value
OEM 3,421 6.5 3,111 1.20 3,266
MRO 1,286 5.4 1,451 1.04 1,368
Total 4,707 6.2 4,562 1.15 4,635
Net cash/(debt) -510
Pension (IAS19) -663
Equity value 3,462
Shares o/s (m) 51
Price per share 67.5
DCF Model €m
Risk Free rate 4.0% PV of disc flows (10yrs) 1,822
Equity risk premium 4.5% PV of terminal flows 3,265
Beta (x) 0.75 Net (debt) / cash -461
WACC 7.2% Pension -643
Terminal growth 2.0% Total equity value 3,982
Terminal EBIT margin 9.5% NOSH (m) 51
Share value (€) 78
78 7.5% 8.5% 9.5% 10.5% 11.5%
6.2% 83 93 102 112 122
6.7% 72 80 88 97 105
7.2% 63 70 77 85 92
7.7% 56 62 62 62 62
8.2% 62 62 61 61 61
EBIT margin
WA
CC
78 0.0% 1.0% 2.0% 3.0% 4.0%
6.2% 73 85 102 130 184
6.7% 65 75 88 109 145
7.2% 59 67 77 93 119
7.7% 53 60 68 81 100
8.2% 48 54 61 70 85
Terminal growth
WA
CC
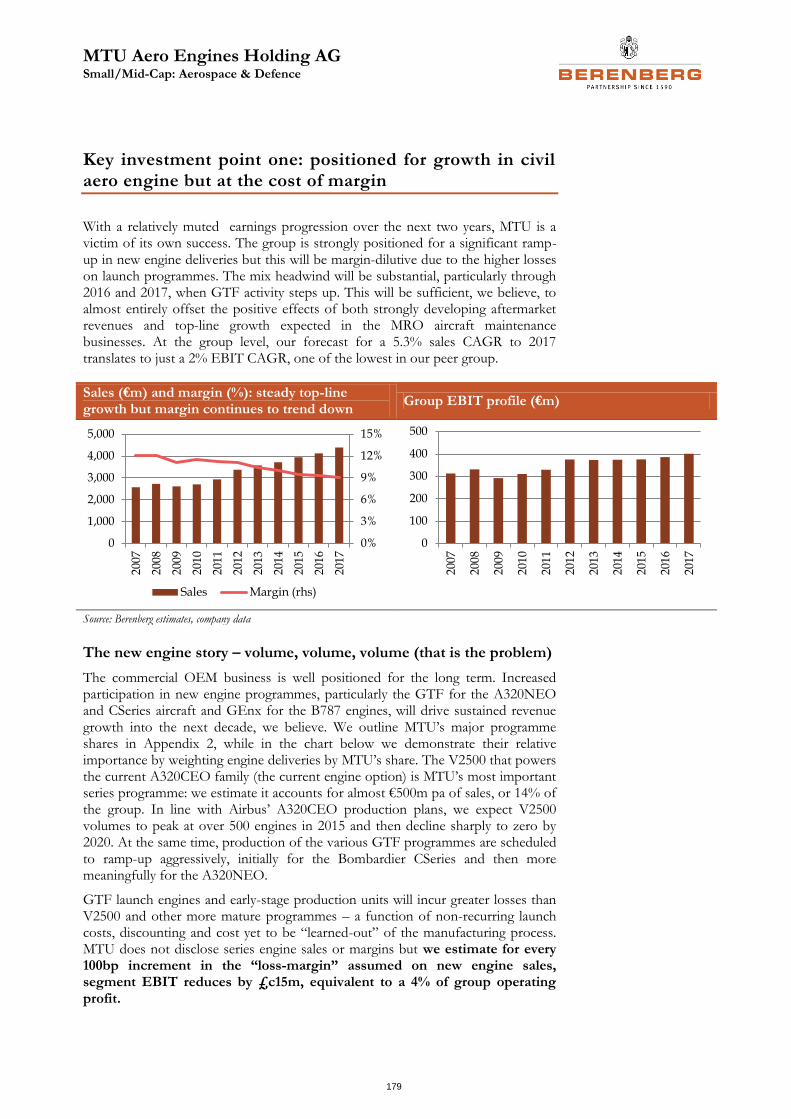
MTU Aero Engines Holding AG Small/Mid-Cap: Aerospace & Defence
179
Key investment point one: positioned for growth in civil aero engine but at the cost of margin
With a relatively muted earnings progression over the next two years, MTU is a victim of its own success. The group is strongly positioned for a significant ramp-up in new engine deliveries but this will be margin-dilutive due to the higher losses on launch programmes. The mix headwind will be substantial, particularly through 2016 and 2017, when GTF activity steps up. This will be sufficient, we believe, to almost entirely offset the positive effects of both strongly developing aftermarket revenues and top-line growth expected in the MRO aircraft maintenance businesses. At the group level, our forecast for a 5.3% sales CAGR to 2017 translates to just a 2% EBIT CAGR, one of the lowest in our peer group.
Sales (€m) and margin (%): steady top-line growth but margin continues to trend down
Group EBIT profile (€m)
Source: Berenberg estimates, company data
The new engine story – volume, volume, volume (that is the problem)
The commercial OEM business is well positioned for the long term. Increased participation in new engine programmes, particularly the GTF for the A320NEO and CSeries aircraft and GEnx for the B787 engines, will drive sustained revenue growth into the next decade, we believe. We outline MTU’s major programme shares in Appendix 2, while in the chart below we demonstrate their relative importance by weighting engine deliveries by MTU’s share. The V2500 that powers the current A320CEO family (the current engine option) is MTU’s most important series programme: we estimate it accounts for almost €500m pa of sales, or 14% of the group. In line with Airbus’ A320CEO production plans, we expect V2500 volumes to peak at over 500 engines in 2015 and then decline sharply to zero by 2020. At the same time, production of the various GTF programmes are scheduled to ramp-up aggressively, initially for the Bombardier CSeries and then more meaningfully for the A320NEO.
GTF launch engines and early-stage production units will incur greater losses than V2500 and other more mature programmes – a function of non-recurring launch costs, discounting and cost yet to be “learned-out” of the manufacturing process. MTU does not disclose series engine sales or margins but we estimate for every 100bp increment in the “loss-margin” assumed on new engine sales, segment EBIT reduces by £c15m, equivalent to a 4% of group operating profit.
0%
3%
6%
9%
12%
15%
0
1,000
2,000
3,000
4,000
5,000
200
7
200
8
200
9
201
0
2011
2012
201
3
201
4
201
5
201
6
201
7
Sales Margin (rhs)
0
100
200
300
400
500
200
7
200
8
200
9
201
0
201
1
201
2
201
3
201
4
201
5
2016
2017
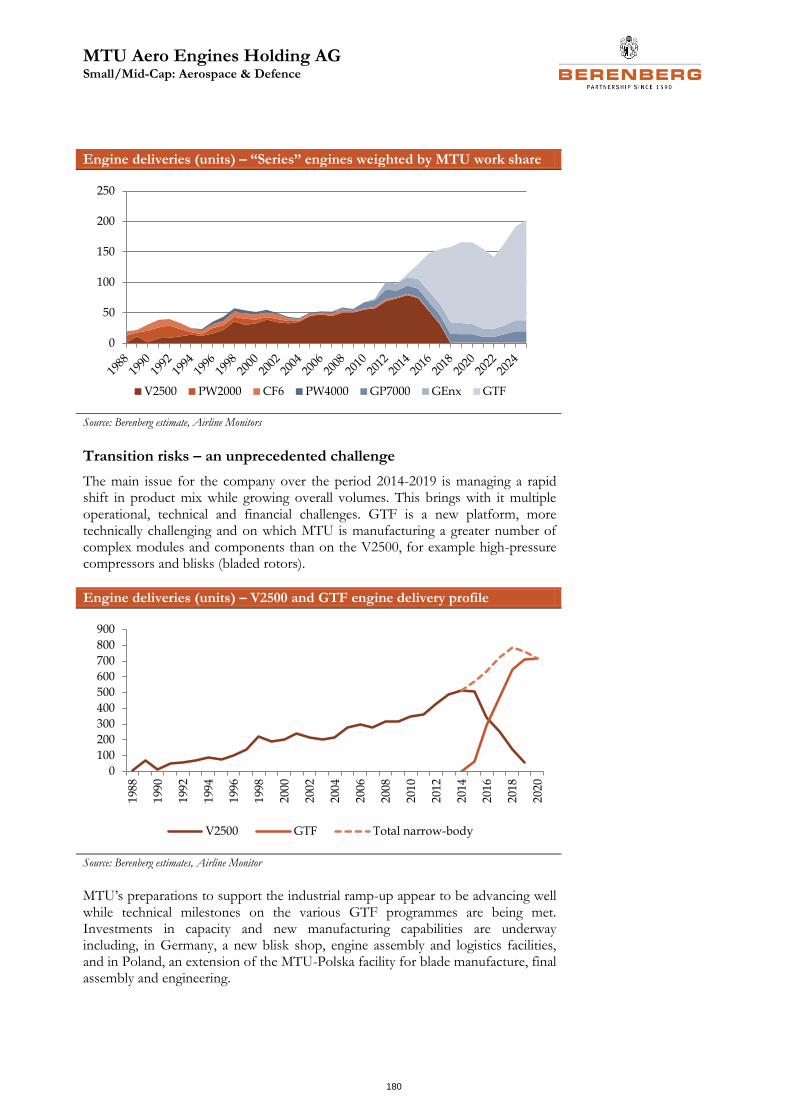
MTU Aero Engines Holding AG Small/Mid-Cap: Aerospace & Defence
180
Engine deliveries (units) – “Series” engines weighted by MTU work share
Source: Berenberg estimate, Airline Monitors
Transition risks – an unprecedented challenge
The main issue for the company over the period 2014-2019 is managing a rapid shift in product mix while growing overall volumes. This brings with it multiple operational, technical and financial challenges. GTF is a new platform, more technically challenging and on which MTU is manufacturing a greater number of complex modules and components than on the V2500, for example high-pressure compressors and blisks (bladed rotors).
Engine deliveries (units) – V2500 and GTF engine delivery profile
Source: Berenberg estimates, Airline Monitor
MTU’s preparations to support the industrial ramp-up appear to be advancing well while technical milestones on the various GTF programmes are being met. Investments in capacity and new manufacturing capabilities are underway including, in Germany, a new blisk shop, engine assembly and logistics facilities, and in Poland, an extension of the MTU-Polska facility for blade manufacture, final assembly and engineering.
0
50
100
150
200
250
V2500 PW2000 CF6 PW4000 GP7000 GEnx GTF
0
100
200
300
400
500
600
700
800
900
198
8
199
0
199
2
199
4
199
6
199
8
200
0
200
2
200
4
200
6
200
8
201
0
201
2
201
4
201
6
201
8
202
0
V2500 GTF Total narrow-body
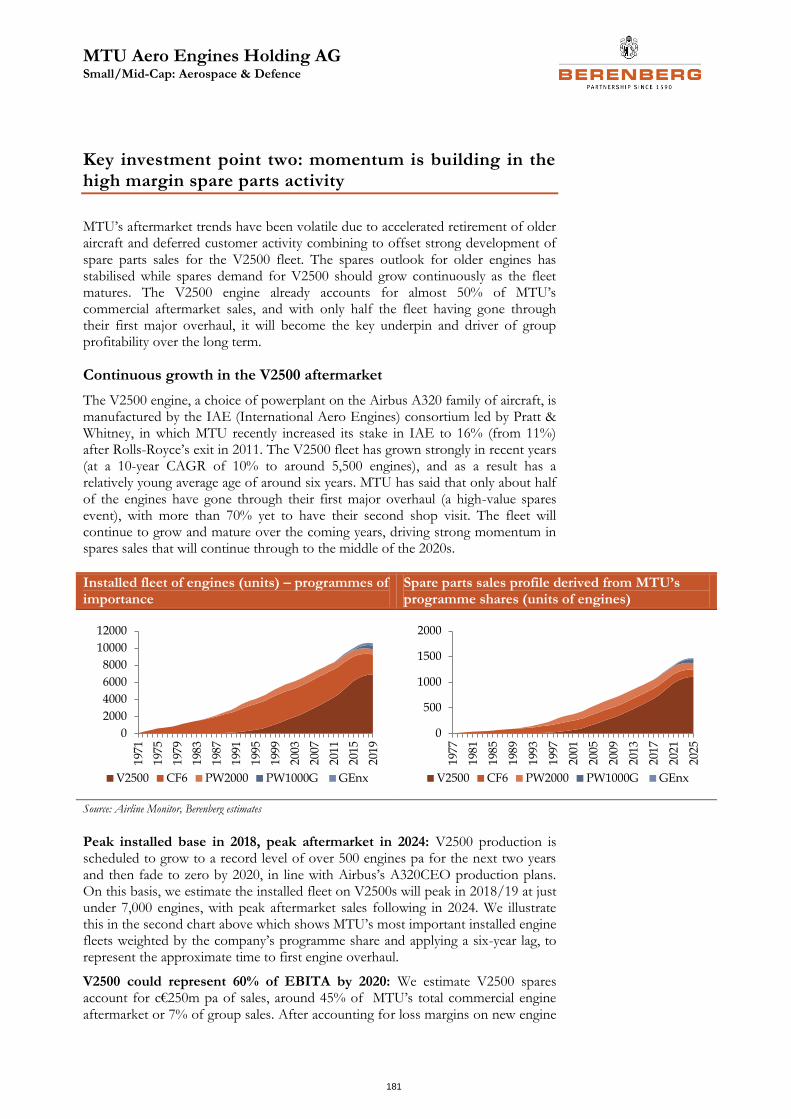
MTU Aero Engines Holding AG Small/Mid-Cap: Aerospace & Defence
181
Key investment point two: momentum is building in the high margin spare parts activity
MTU’s aftermarket trends have been volatile due to accelerated retirement of older aircraft and deferred customer activity combining to offset strong development of spare parts sales for the V2500 fleet. The spares outlook for older engines has stabilised while spares demand for V2500 should grow continuously as the fleet matures. The V2500 engine already accounts for almost 50% of MTU’s commercial aftermarket sales, and with only half the fleet having gone through their first major overhaul, it will become the key underpin and driver of group profitability over the long term.
Continuous growth in the V2500 aftermarket
The V2500 engine, a choice of powerplant on the Airbus A320 family of aircraft, is manufactured by the IAE (International Aero Engines) consortium led by Pratt & Whitney, in which MTU recently increased its stake in IAE to 16% (from 11%) after Rolls-Royce’s exit in 2011. The V2500 fleet has grown strongly in recent years (at a 10-year CAGR of 10% to around 5,500 engines), and as a result has a relatively young average age of around six years. MTU has said that only about half of the engines have gone through their first major overhaul (a high-value spares event), with more than 70% yet to have their second shop visit. The fleet will continue to grow and mature over the coming years, driving strong momentum in spares sales that will continue through to the middle of the 2020s.
Installed fleet of engines (units) – programmes of importance
Spare parts sales profile derived from MTU’s programme shares (units of engines)
Source: Airline Monitor, Berenberg estimates
Peak installed base in 2018, peak aftermarket in 2024: V2500 production is scheduled to grow to a record level of over 500 engines pa for the next two years and then fade to zero by 2020, in line with Airbus’s A320CEO production plans. On this basis, we estimate the installed fleet on V2500s will peak in 2018/19 at just under 7,000 engines, with peak aftermarket sales following in 2024. We illustrate this in the second chart above which shows MTU’s most important installed engine fleets weighted by the company’s programme share and applying a six-year lag, to represent the approximate time to first engine overhaul.
V2500 could represent 60% of EBITA by 2020: We estimate V2500 spares account for c€250m pa of sales, around 45% of MTU’s total commercial engine aftermarket or 7% of group sales. After accounting for loss margins on new engine
0
2000
4000
6000
8000
10000
12000
197
1
197
5
197
9
1983
198
7
199
1
199
5
1999
200
3
200
7
201
1
2015
201
9
V2500 CF6 PW2000 PW1000G GEnx
0
500
1000
1500
2000
197
7
198
1
1985
198
9
199
3
199
7
200
1
200
5
200
9
2013
201
7
202
1
202
5
V2500 CF6 PW2000 PW1000G GEnx
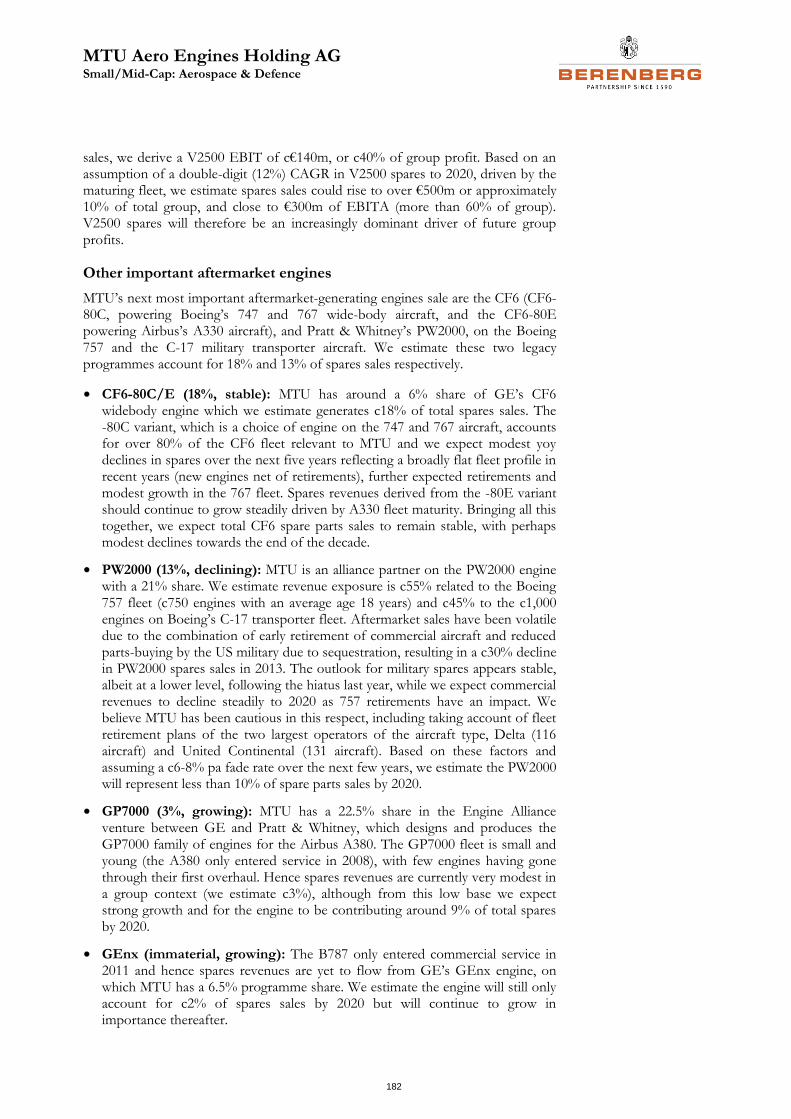
MTU Aero Engines Holding AG Small/Mid-Cap: Aerospace & Defence
182
sales, we derive a V2500 EBIT of c€140m, or c40% of group profit. Based on an assumption of a double-digit (12%) CAGR in V2500 spares to 2020, driven by the maturing fleet, we estimate spares sales could rise to over €500m or approximately 10% of total group, and close to €300m of EBITA (more than 60% of group). V2500 spares will therefore be an increasingly dominant driver of future group profits.
Other important aftermarket engines
MTU’s next most important aftermarket-generating engines sale are the CF6 (CF6-80C, powering Boeing’s 747 and 767 wide-body aircraft, and the CF6-80E powering Airbus’s A330 aircraft), and Pratt & Whitney’s PW2000, on the Boeing 757 and the C-17 military transporter aircraft. We estimate these two legacy programmes account for 18% and 13% of spares sales respectively.
• CF6-80C/E (18%, stable): MTU has around a 6% share of GE’s CF6 widebody engine which we estimate generates c18% of total spares sales. The -80C variant, which is a choice of engine on the 747 and 767 aircraft, accounts for over 80% of the CF6 fleet relevant to MTU and we expect modest yoy declines in spares over the next five years reflecting a broadly flat fleet profile in recent years (new engines net of retirements), further expected retirements and modest growth in the 767 fleet. Spares revenues derived from the -80E variant should continue to grow steadily driven by A330 fleet maturity. Bringing all this together, we expect total CF6 spare parts sales to remain stable, with perhaps modest declines towards the end of the decade.
• PW2000 (13%, declining): MTU is an alliance partner on the PW2000 engine with a 21% share. We estimate revenue exposure is c55% related to the Boeing 757 fleet (c750 engines with an average age 18 years) and c45% to the c1,000 engines on Boeing’s C-17 transporter fleet. Aftermarket sales have been volatile due to the combination of early retirement of commercial aircraft and reduced parts-buying by the US military due to sequestration, resulting in a c30% decline in PW2000 spares sales in 2013. The outlook for military spares appears stable, albeit at a lower level, following the hiatus last year, while we expect commercial revenues to decline steadily to 2020 as 757 retirements have an impact. We believe MTU has been cautious in this respect, including taking account of fleet retirement plans of the two largest operators of the aircraft type, Delta (116 aircraft) and United Continental (131 aircraft). Based on these factors and assuming a c6-8% pa fade rate over the next few years, we estimate the PW2000 will represent less than 10% of spare parts sales by 2020.
• GP7000 (3%, growing): MTU has a 22.5% share in the Engine Alliance venture between GE and Pratt & Whitney, which designs and produces the GP7000 family of engines for the Airbus A380. The GP7000 fleet is small and young (the A380 only entered service in 2008), with few engines having gone through their first overhaul. Hence spares revenues are currently very modest in a group context (we estimate c3%), although from this low base we expect strong growth and for the engine to be contributing around 9% of total spares by 2020.
• GEnx (immaterial, growing): The B787 only entered commercial service in 2011 and hence spares revenues are yet to flow from GE’s GEnx engine, on which MTU has a 6.5% programme share. We estimate the engine will still only account for c2% of spares sales by 2020 but will continue to grow in importance thereafter.
MTU Aero Engines Holding AG Small/Mid-Cap: Aerospace & Defence
183
Positive near-term macro trends supports outlook for spares demand
Against management’s initial guidance of 15% growth in 2013, commercial spare parts growth of 5% was disappointing and was the key driver of forecast downgrades and ultimately share price underperformance through the second half of the year. A significant factor driving the lower-than-expected outturn was softness in PW2000 spares (referred to above). Guidance for 2014 is for a further 5% growth in commercial aftermarket comprising the three main major programmes: V2500 “mid-20s” growth and roughly flat expectations for PW2000 and CF6. The 2014 Q1 result was slightly ahead of full-year guidance at c7% driven by strong V2500 sales in the “high-20s”, although management said it expects the rate to revert to guidance over the coming quarters.
Air traffic (RPK) and airline capacity growth trends remain at or above the long-term trend (c4.5%)
MTU spare parts growth lagged the sector in 2013 but recovered to 7% yoy in Q1, slightly ahead of guidance for mid-single digits
Source: Berenberg estimates, IATA
• Air traffic growth: While quarterly results can be misleading as to the long-term trend, the underlying macro backdrop supports a steady growth outlook for aftermarket-related activities. Global passenger growth measured as revenue per passenger kilometre (RPK) is trending above the long-term average of 4.5-5% (5.8% in 2013 with IATA forecasting a further 5.2% in 2014). In addition, airline load factors are at a historically high 79%, indicating the in-service global fleet of aircraft is being well-utilised. An additional factor driving current spares demand is the recovery of maintenance that was deferred by airlines through the downturn.
0%
2%
4%
6%
8%
10%
Feb
-12
Ap
r-1
2
Jun
-12
Au
g-1
2
Oct
-12
Dec
-12
Feb
-13
Ap
r-1
3
Jun
-13
Au
g-1
3
Oct
-13
Dec
-13
Feb
-14
Ap
r-1
4
RPK (passenger) ASK (capacity)ASK (6m rolling)
-5%
0%
5%
10%
15%
20%
Q1 Q2 Q3 Q4 Q1 Q2 Q3 Q4 Q1 Q2 Q3 Q4 Q1
2011 2012 2013 2014
MTU spare parts Sector ave.
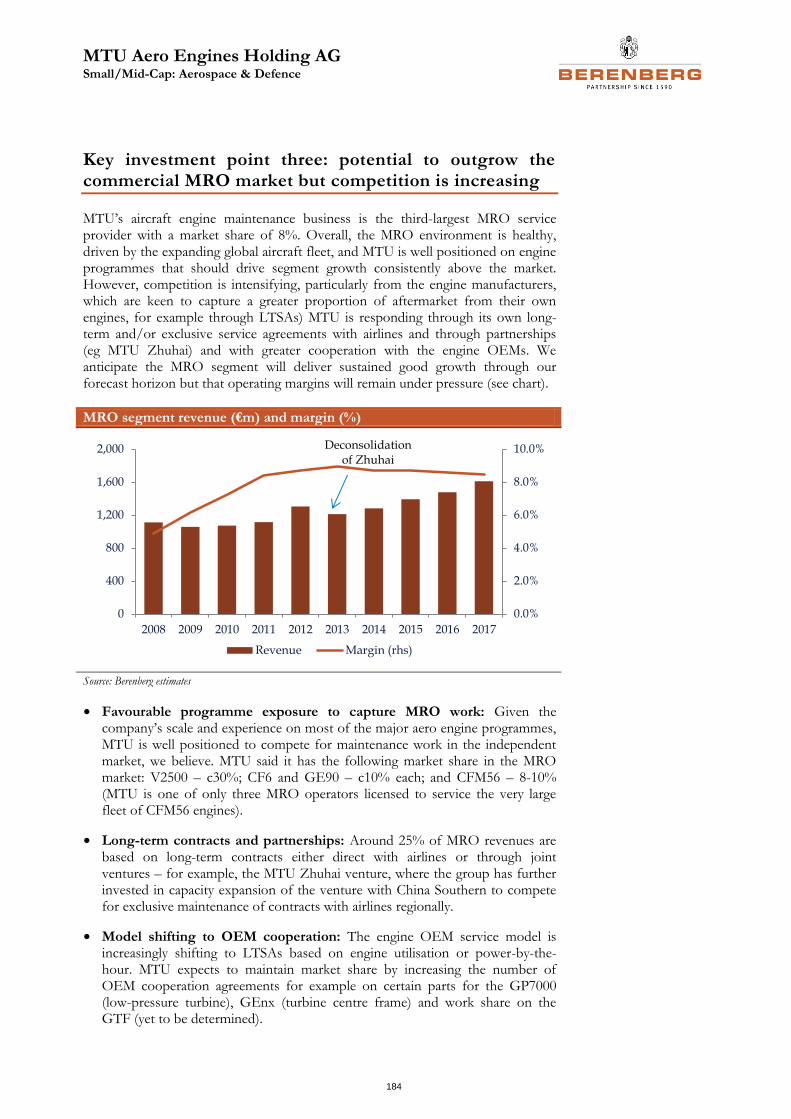
MTU Aero Engines Holding AG Small/Mid-Cap: Aerospace & Defence
184
Key investment point three: potential to outgrow the commercial MRO market but competition is increasing
MTU’s aircraft engine maintenance business is the third-largest MRO service provider with a market share of 8%. Overall, the MRO environment is healthy, driven by the expanding global aircraft fleet, and MTU is well positioned on engine programmes that should drive segment growth consistently above the market. However, competition is intensifying, particularly from the engine manufacturers, which are keen to capture a greater proportion of aftermarket from their own engines, for example through LTSAs) MTU is responding through its own long-term and/or exclusive service agreements with airlines and through partnerships (eg MTU Zhuhai) and with greater cooperation with the engine OEMs. We anticipate the MRO segment will deliver sustained good growth through our forecast horizon but that operating margins will remain under pressure (see chart).
MRO segment revenue (€m) and margin (%)
Source: Berenberg estimates
• Favourable programme exposure to capture MRO work: Given the company’s scale and experience on most of the major aero engine programmes, MTU is well positioned to compete for maintenance work in the independent market, we believe. MTU said it has the following market share in the MRO market: V2500 – c30%; CF6 and GE90 – c10% each; and CFM56 – 8-10% (MTU is one of only three MRO operators licensed to service the very large fleet of CFM56 engines).
• Long-term contracts and partnerships: Around 25% of MRO revenues are based on long-term contracts either direct with airlines or through joint ventures – for example, the MTU Zhuhai venture, where the group has further invested in capacity expansion of the venture with China Southern to compete for exclusive maintenance of contracts with airlines regionally.
• Model shifting to OEM cooperation: The engine OEM service model is increasingly shifting to LTSAs based on engine utilisation or power-by-the-hour. MTU expects to maintain market share by increasing the number of OEM cooperation agreements for example on certain parts for the GP7000 (low-pressure turbine), GEnx (turbine centre frame) and work share on the GTF (yet to be determined).
0.0%
2.0%
4.0%
6.0%
8.0%
10.0%
0
400
800
1,200
1,600
2,000
2008 2009 2010 2011 2012 2013 2014 2015 2016 2017
Revenue Margin (rhs)
Deconsolidation of Zhuhai
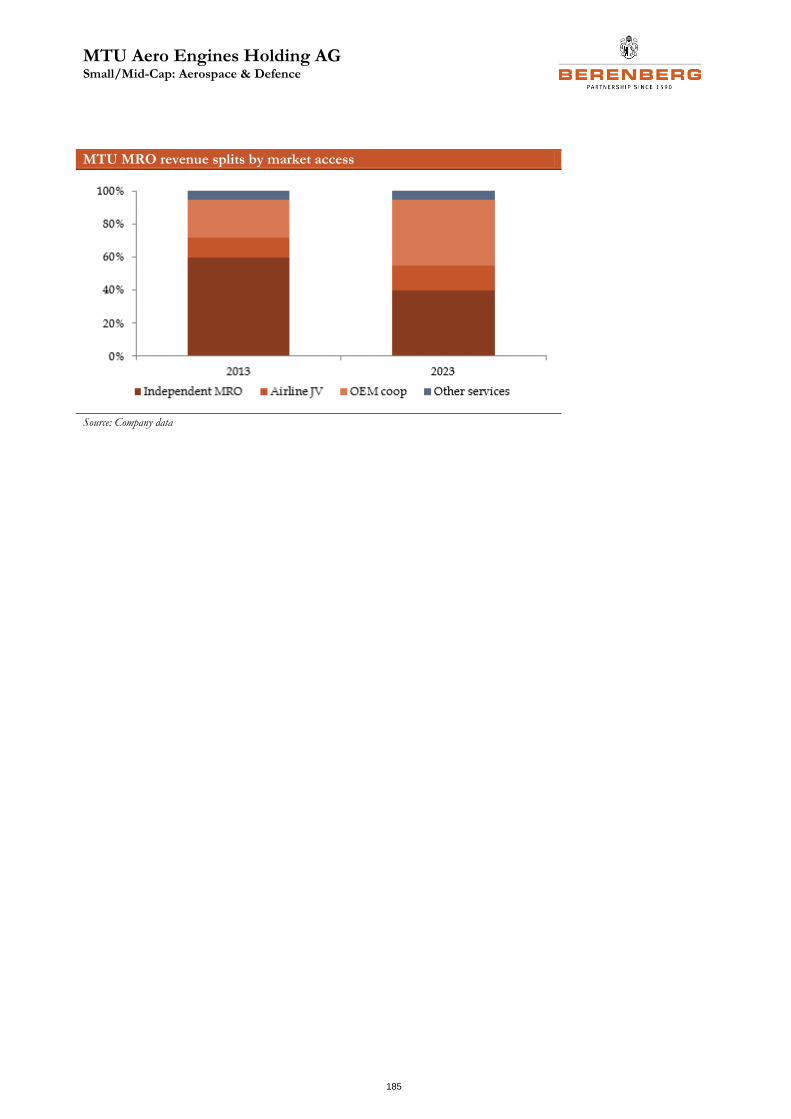
MTU Aero Engines Holding AG Small/Mid-Cap: Aerospace & Defence
185
MTU MRO revenue splits by market access
Source: Company data
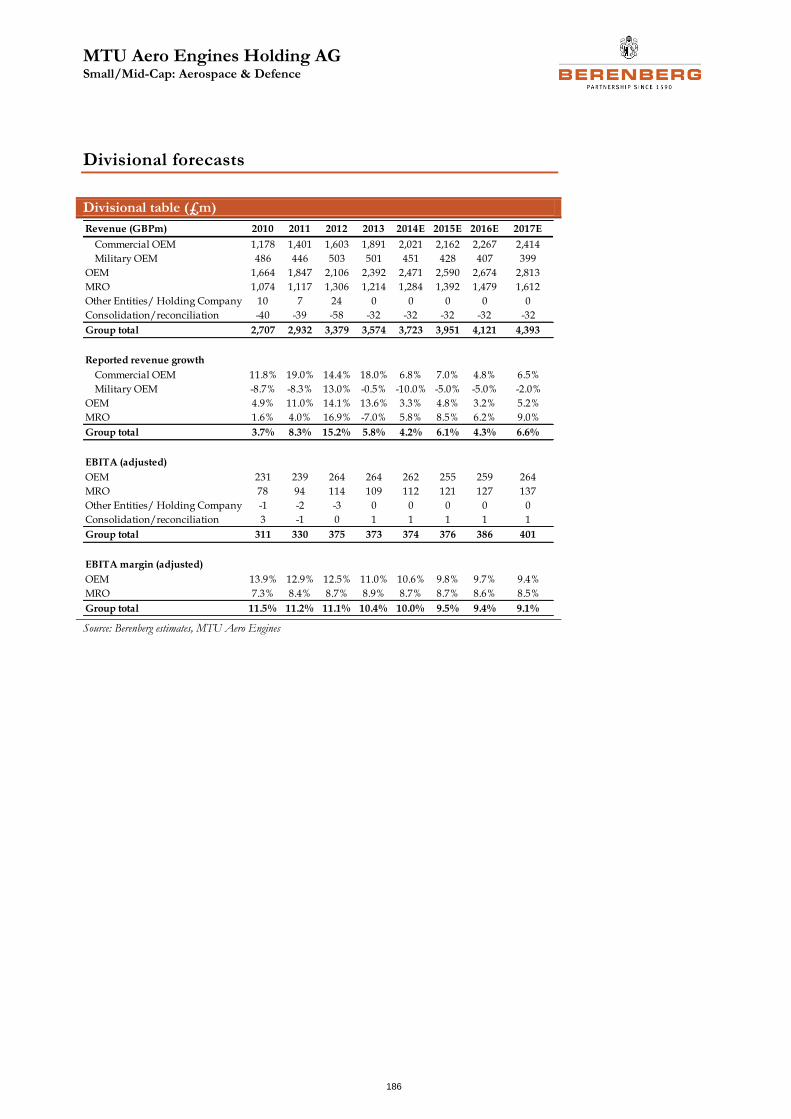
MTU Aero Engines Holding AG Small/Mid-Cap: Aerospace & Defence
186
Divisional forecasts
Divisional table (£m)
Source: Berenberg estimates, MTU Aero Engines
Revenue (GBPm) 2010 2011 2012 2013 2014E 2015E 2016E 2017E
Commercial OEM 1,178 1,401 1,603 1,891 2,021 2,162 2,267 2,414
Military OEM 486 446 503 501 451 428 407 399
OEM 1,664 1,847 2,106 2,392 2,471 2,590 2,674 2,813
MRO 1,074 1,117 1,306 1,214 1,284 1,392 1,479 1,612
Other Entities/ Holding Company 10 7 24 0 0 0 0 0
Consolidation/reconciliation -40 -39 -58 -32 -32 -32 -32 -32
Group total 2,707 2,932 3,379 3,574 3,723 3,951 4,121 4,393
Reported revenue growth
Commercial OEM 11.8% 19.0% 14.4% 18.0% 6.8% 7.0% 4.8% 6.5%
Military OEM -8.7% -8.3% 13.0% -0.5% -10.0% -5.0% -5.0% -2.0%
OEM 4.9% 11.0% 14.1% 13.6% 3.3% 4.8% 3.2% 5.2%
MRO 1.6% 4.0% 16.9% -7.0% 5.8% 8.5% 6.2% 9.0%
Group total 3.7% 8.3% 15.2% 5.8% 4.2% 6.1% 4.3% 6.6%
EBITA (adjusted)
OEM 231 239 264 264 262 255 259 264
MRO 78 94 114 109 112 121 127 137
Other Entities/ Holding Company -1 -2 -3 0 0 0 0 0
Consolidation/reconciliation 3 -1 0 1 1 1 1 1
Group total 311 330 375 373 374 376 386 401
EBITA margin (adjusted)
OEM 13.9% 12.9% 12.5% 11.0% 10.6% 9.8% 9.7% 9.4%
MRO 7.3% 8.4% 8.7% 8.9% 8.7% 8.7% 8.6% 8.5%
Group total 11.5% 11.2% 11.1% 10.4% 10.0% 9.5% 9.4% 9.1%
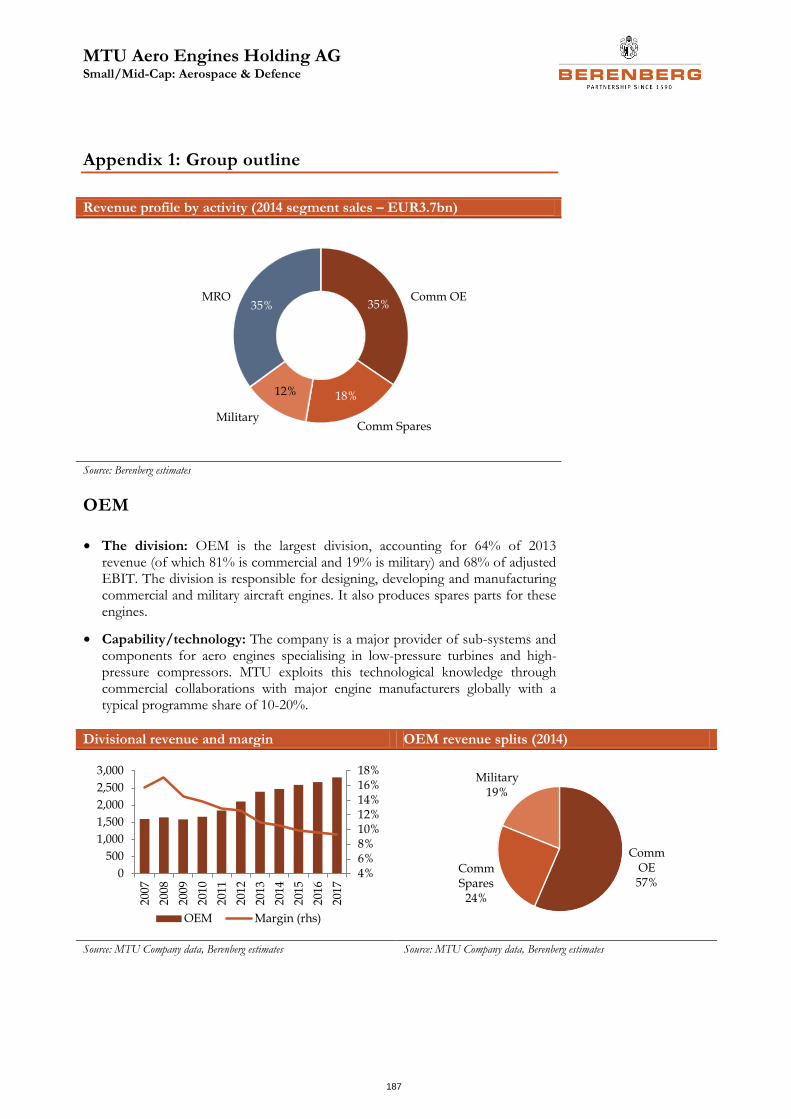
MTU Aero Engines Holding AG Small/Mid-Cap: Aerospace & Defence
187
Appendix 1: Group outline
Revenue profile by activity (2014 segment sales – EUR3.7bn)
Source: Berenberg estimates
OEM
• The division: OEM is the largest division, accounting for 64% of 2013 revenue (of which 81% is commercial and 19% is military) and 68% of adjusted EBIT. The division is responsible for designing, developing and manufacturing commercial and military aircraft engines. It also produces spares parts for these engines.
• Capability/technology: The company is a major provider of sub-systems and components for aero engines specialising in low-pressure turbines and high-pressure compressors. MTU exploits this technological knowledge through commercial collaborations with major engine manufacturers globally with a typical programme share of 10-20%.
Divisional revenue and margin OEM revenue splits (2014)
Source: MTU Company data, Berenberg estimates Source: MTU Company data, Berenberg estimates
35%
18%12%
35%Comm OE
Comm SparesMilitary
MRO
4%6%8%10%12%14%16%18%
0
500
1,000
1,500
2,000
2,500
3,000
200
7
200
8
200
9
201
0
201
1
201
2
201
3
201
4
201
5
201
6
201
7
OEM Margin (rhs)
Comm OE57%
Comm Spares
24%
Military19%
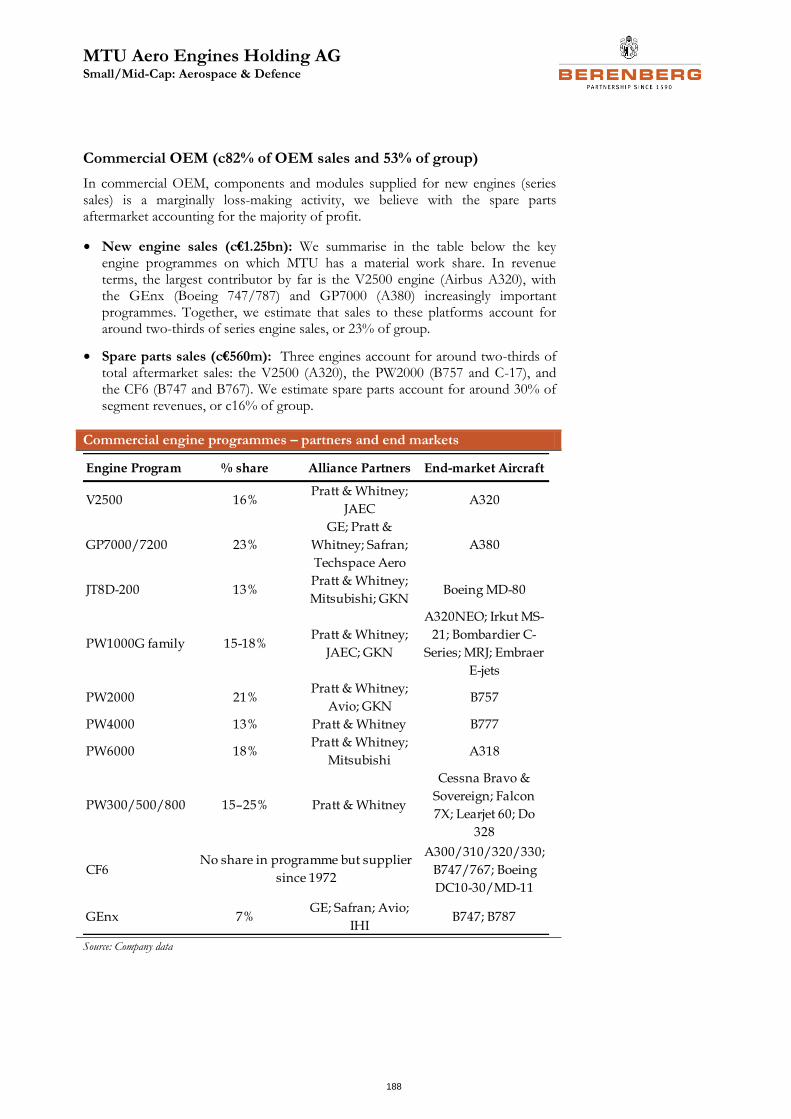
MTU Aero Engines Holding AG Small/Mid-Cap: Aerospace & Defence
188
Commercial OEM (c82% of OEM sales and 53% of group)
In commercial OEM, components and modules supplied for new engines (series sales) is a marginally loss-making activity, we believe with the spare parts aftermarket accounting for the majority of profit.
• New engine sales (c€1.25bn): We summarise in the table below the key engine programmes on which MTU has a material work share. In revenue terms, the largest contributor by far is the V2500 engine (Airbus A320), with the GEnx (Boeing 747/787) and GP7000 (A380) increasingly important programmes. Together, we estimate that sales to these platforms account for around two-thirds of series engine sales, or 23% of group.
• Spare parts sales (c€560m): Three engines account for around two-thirds of total aftermarket sales: the V2500 (A320), the PW2000 (B757 and C-17), and the CF6 (B747 and B767). We estimate spare parts account for around 30% of segment revenues, or c16% of group.
Commercial engine programmes – partners and end markets
Source: Company data
Engine Program % share Alliance Partners End-market Aircraft
V2500 16%Pratt & Whitney;
JAECA320
GP7000/7200 23%
GE; Pratt &
Whitney; Safran;
Techspace Aero
A380
JT8D-200 13%Pratt & Whitney;
Mitsubishi; GKNBoeing MD-80
PW1000G family 15-18%Pratt & Whitney;
JAEC; GKN
A320NEO; Irkut MS-
21; Bombardier C-
Series; MRJ; Embraer
E-jets
PW2000 21%Pratt & Whitney;
Avio; GKNB757
PW4000 13% Pratt & Whitney B777
PW6000 18%Pratt & Whitney;
MitsubishiA318
PW300/500/800 15–25% Pratt & Whitney
Cessna Bravo &
Sovereign; Falcon
7X; Learjet 60; Do
328
CF6
A300/310/320/330;
B747/767; Boeing
DC10-30/MD-11
GEnx 7%GE; Safran; Avio;
IHIB747; B787
No share in programme but supplier
since 1972
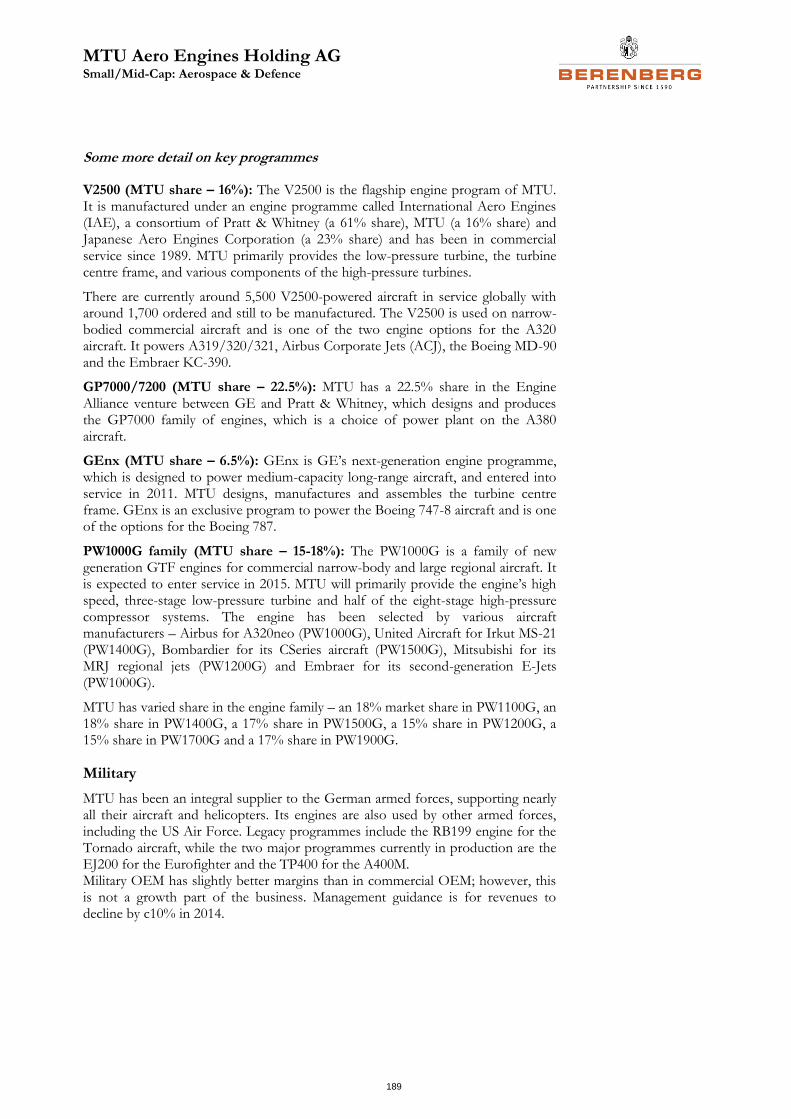
MTU Aero Engines Holding AG Small/Mid-Cap: Aerospace & Defence
189
Some more detail on key programmes
V2500 (MTU share – 16%): The V2500 is the flagship engine program of MTU. It is manufactured under an engine programme called International Aero Engines (IAE), a consortium of Pratt & Whitney (a 61% share), MTU (a 16% share) and Japanese Aero Engines Corporation (a 23% share) and has been in commercial service since 1989. MTU primarily provides the low-pressure turbine, the turbine centre frame, and various components of the high-pressure turbines.
There are currently around 5,500 V2500-powered aircraft in service globally with around 1,700 ordered and still to be manufactured. The V2500 is used on narrow-bodied commercial aircraft and is one of the two engine options for the A320 aircraft. It powers A319/320/321, Airbus Corporate Jets (ACJ), the Boeing MD-90 and the Embraer KC-390.
GP7000/7200 (MTU share – 22.5%): MTU has a 22.5% share in the Engine Alliance venture between GE and Pratt & Whitney, which designs and produces the GP7000 family of engines, which is a choice of power plant on the A380 aircraft.
GEnx (MTU share – 6.5%): GEnx is GE’s next-generation engine programme, which is designed to power medium-capacity long-range aircraft, and entered into service in 2011. MTU designs, manufactures and assembles the turbine centre frame. GEnx is an exclusive program to power the Boeing 747-8 aircraft and is one of the options for the Boeing 787.
PW1000G family (MTU share – 15-18%): The PW1000G is a family of new generation GTF engines for commercial narrow-body and large regional aircraft. It is expected to enter service in 2015. MTU will primarily provide the engine’s high speed, three-stage low-pressure turbine and half of the eight-stage high-pressure compressor systems. The engine has been selected by various aircraft manufacturers – Airbus for A320neo (PW1000G), United Aircraft for Irkut MS-21 (PW1400G), Bombardier for its CSeries aircraft (PW1500G), Mitsubishi for its MRJ regional jets (PW1200G) and Embraer for its second-generation E-Jets (PW1000G).
MTU has varied share in the engine family – an 18% market share in PW1100G, an 18% share in PW1400G, a 17% share in PW1500G, a 15% share in PW1200G, a 15% share in PW1700G and a 17% share in PW1900G.
Military
MTU has been an integral supplier to the German armed forces, supporting nearly all their aircraft and helicopters. Its engines are also used by other armed forces, including the US Air Force. Legacy programmes include the RB199 engine for the Tornado aircraft, while the two major programmes currently in production are the EJ200 for the Eurofighter and the TP400 for the A400M. Military OEM has slightly better margins than in commercial OEM; however, this is not a growth part of the business. Management guidance is for revenues to decline by c10% in 2014.
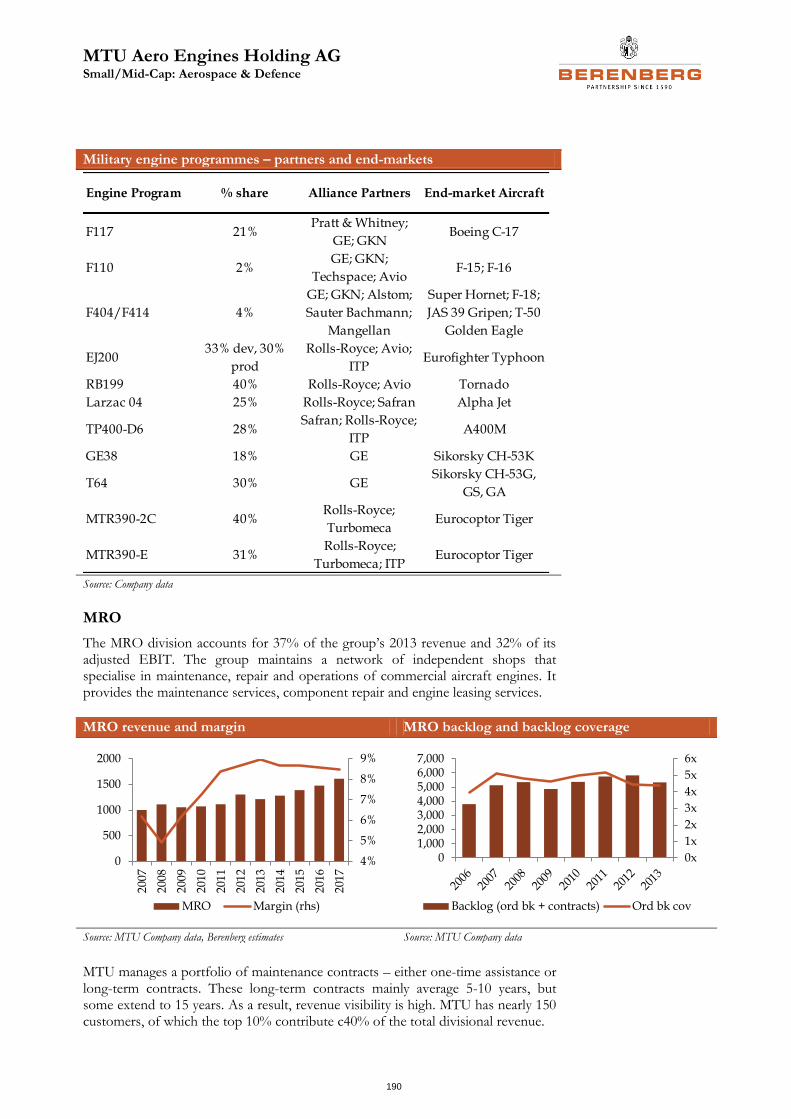
MTU Aero Engines Holding AG Small/Mid-Cap: Aerospace & Defence
190
Military engine programmes – partners and end-markets
Source: Company data
MRO
The MRO division accounts for 37% of the group’s 2013 revenue and 32% of its adjusted EBIT. The group maintains a network of independent shops that specialise in maintenance, repair and operations of commercial aircraft engines. It provides the maintenance services, component repair and engine leasing services.
MTU manages a portfolio of maintenance contracts – either one-time assistance or long-term contracts. These long-term contracts mainly average 5-10 years, but some extend to 15 years. As a result, revenue visibility is high. MTU has nearly 150 customers, of which the top 10% contribute c40% of the total divisional revenue.
Engine Program % share Alliance Partners End-market Aircraft
F117 21%Pratt & Whitney;
GE; GKNBoeing C-17
F110 2%GE; GKN;
Techspace; AvioF-15; F-16
F404/F414 4%
GE; GKN; Alstom;
Sauter Bachmann;
Mangellan
Super Hornet; F-18;
JAS 39 Gripen; T-50
Golden Eagle
EJ20033% dev, 30%
prod
Rolls-Royce; Avio;
ITPEurofighter Typhoon
RB199 40% Rolls-Royce; Avio Tornado
Larzac 04 25% Rolls-Royce; Safran Alpha Jet
TP400-D6 28%Safran; Rolls-Royce;
ITPA400M
GE38 18% GE Sikorsky CH-53K
T64 30% GESikorsky CH-53G,
GS, GA
MTR390-2C 40%Rolls-Royce;
TurbomecaEurocoptor Tiger
MTR390-E 31%Rolls-Royce;
Turbomeca; ITPEurocoptor Tiger
MRO revenue and margin MRO backlog and backlog coverage
Source: MTU Company data, Berenberg estimates Source: MTU Company data
4%
5%
6%
7%
8%
9%
0
500
1000
1500
2000
200
7
200
8
200
9
201
0
201
1
201
2
201
3
201
4
201
5
201
6
201
7
MRO Margin (rhs)
0x
1x
2x
3x
4x
5x
6x
01,0002,0003,0004,0005,0006,0007,000
Backlog (ord bk + contracts) Ord bk cov
MTU Aero Engines Holding AG Small/Mid-Cap: Aerospace & Defence
191
The MRO landscape is a fragmented and competitive one, with c30–40 independent service providers. A number of airlines, aircraft manufacturers and some alliance partners also provide maintenance services. MTU is able to maintain its market-leading position due to its long-term relationships with its clients and due to its OEM business (in general MRO’s share remains at least equal to the engine program share that the OEM has). This reflects the changing commercial aftermarket, where MRO services are increasingly being offered together with engine sales contracts, giving an opportunity for MTU to further cement long-term customer ties.
MTU’s guidance for 2014 is for MRO growth in the high single-digit range, predominantly due to rising demand for maintenance of the GE90 and V2500 engines.
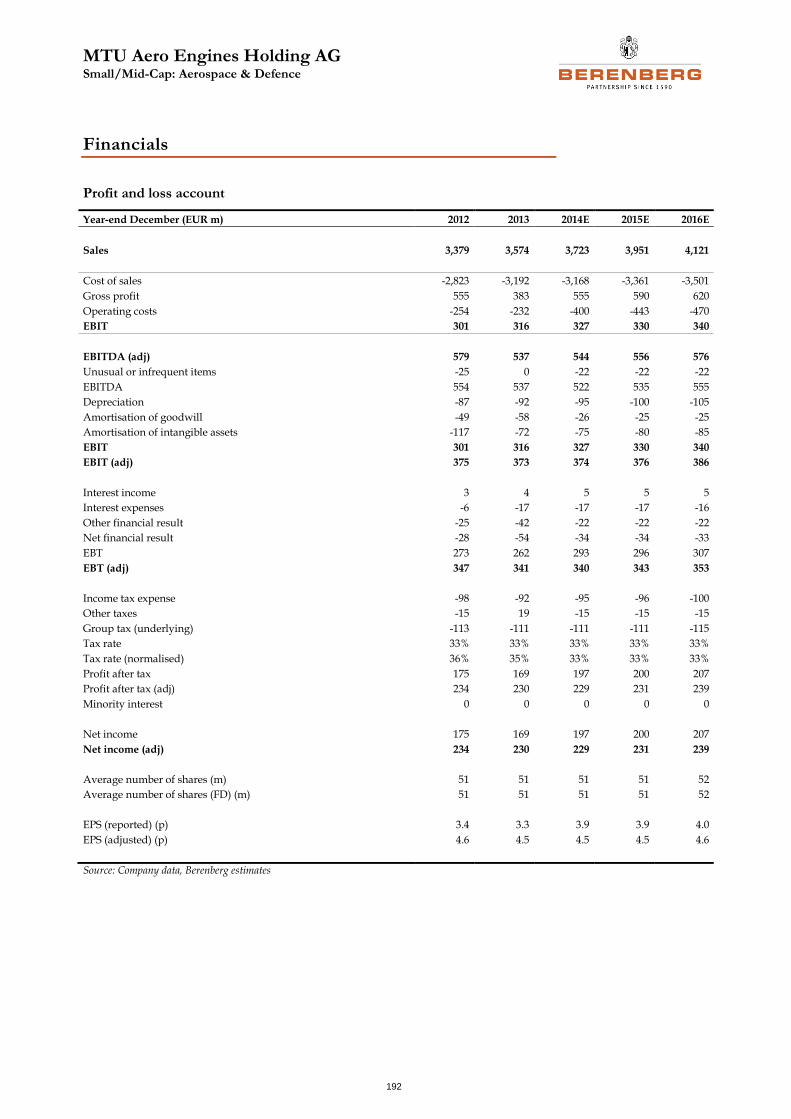
MTU Aero Engines Holding AG Small/Mid-Cap: Aerospace & Defence
192
Financials
Profit and loss account
Year-end December (EUR m) 2012 2013 2014E 2015E 2016E
Sales 3,379 3,574 3,723 3,951 4,121
Cost of sales -2,823 -3,192 -3,168 -3,361 -3,501
Gross profit 555 383 555 590 620
Operating costs -254 -232 -400 -443 -470
EBIT 301 316 327 330 340
EBITDA (adj) 579 537 544 556 576
Unusual or infrequent items -25 0 -22 -22 -22
EBITDA 554 537 522 535 555
Depreciation -87 -92 -95 -100 -105
Amortisation of goodwill -49 -58 -26 -25 -25
Amortisation of intangible assets -117 -72 -75 -80 -85
EBIT 301 316 327 330 340
EBIT (adj) 375 373 374 376 386
Interest income 3 4 5 5 5
Interest expenses -6 -17 -17 -17 -16
Other financial result -25 -42 -22 -22 -22
Net financial result -28 -54 -34 -34 -33
EBT 273 262 293 296 307
EBT (adj) 347 341 340 343 353
Income tax expense -98 -92 -95 -96 -100
Other taxes -15 19 -15 -15 -15
Group tax (underlying) -113 -111 -111 -111 -115
Tax rate 33% 33% 33% 33% 33%
Tax rate (normalised) 36% 35% 33% 33% 33%
Profit after tax 175 169 197 200 207
Profit after tax (adj) 234 230 229 231 239
Minority interest 0 0 0 0 0
Net income 175 169 197 200 207
Net income (adj) 234 230 229 231 239
Average number of shares (m) 51 51 51 51 52
Average number of shares (FD) (m) 51 51 51 51 52
EPS (reported) (p) 3.4 3.3 3.9 3.9 4.0
EPS (adjusted) (p) 4.6 4.5 4.5 4.5 4.6
Source: Company data, Berenberg estimates
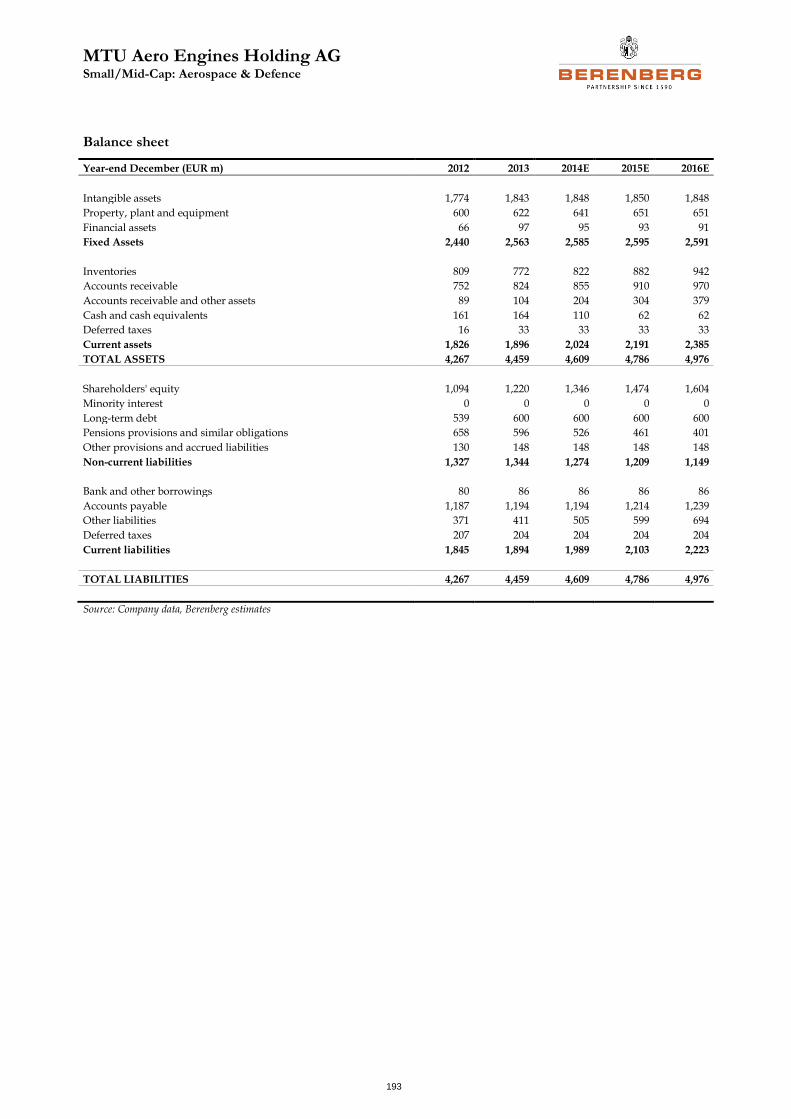
MTU Aero Engines Holding AG Small/Mid-Cap: Aerospace & Defence
193
Balance sheet
Year-end December (EUR m) 2012 2013 2014E 2015E 2016E
Intangible assets 1,774 1,843 1,848 1,850 1,848
Property, plant and equipment 600 622 641 651 651
Financial assets 66 97 95 93 91
Fixed Assets 2,440 2,563 2,585 2,595 2,591
Inventories 809 772 822 882 942
Accounts receivable 752 824 855 910 970
Accounts receivable and other assets 89 104 204 304 379
Cash and cash equivalents 161 164 110 62 62
Deferred taxes 16 33 33 33 33
Current assets 1,826 1,896 2,024 2,191 2,385
TOTAL ASSETS 4,267 4,459 4,609 4,786 4,976
Shareholders' equity 1,094 1,220 1,346 1,474 1,604
Minority interest 0 0 0 0 0
Long-term debt 539 600 600 600 600
Pensions provisions and similar obligations 658 596 526 461 401
Other provisions and accrued liabilities 130 148 148 148 148
Non-current liabilities 1,327 1,344 1,274 1,209 1,149
Bank and other borrowings 80 86 86 86 86
Accounts payable 1,187 1,194 1,194 1,214 1,239
Other liabilities 371 411 505 599 694
Deferred taxes 207 204 204 204 204
Current liabilities 1,845 1,894 1,989 2,103 2,223
TOTAL LIABILITIES 4,267 4,459 4,609 4,786 4,976
Source: Company data, Berenberg estimates
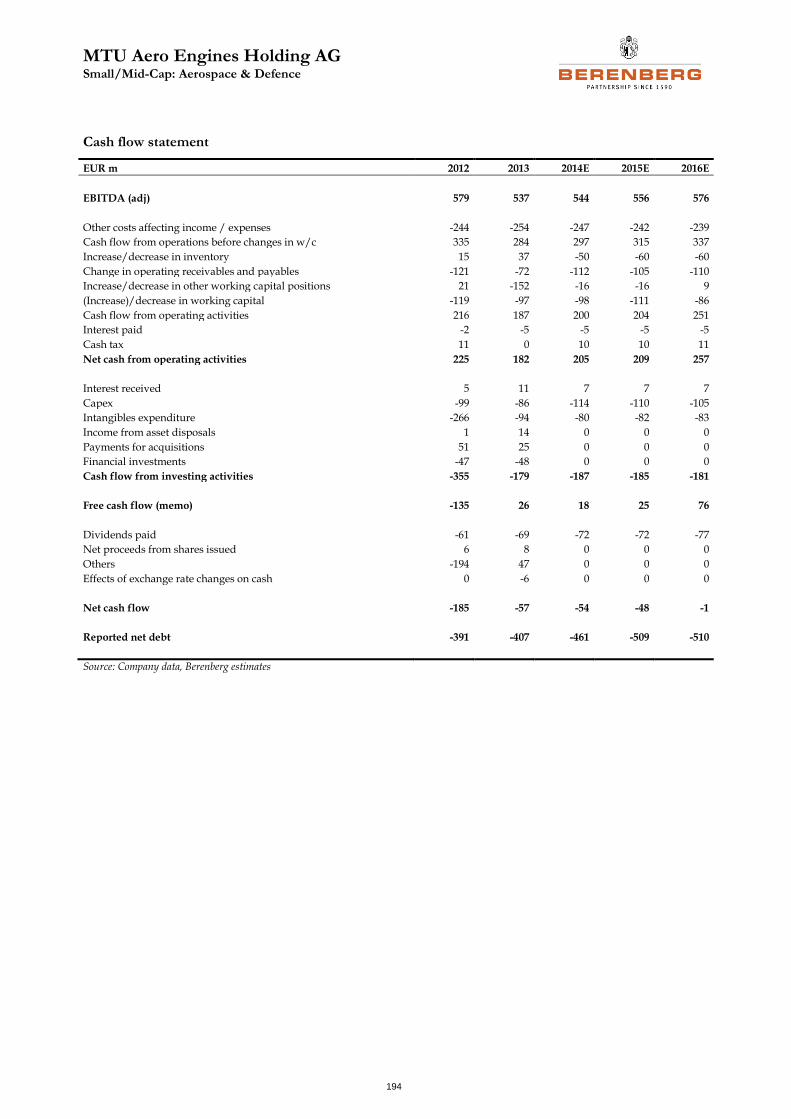
MTU Aero Engines Holding AG Small/Mid-Cap: Aerospace & Defence
194
Cash flow statement
EUR m 2012 2013 2014E 2015E 2016E
EBITDA (adj) 579 537 544 556 576
Other costs affecting income / expenses -244 -254 -247 -242 -239
Cash flow from operations before changes in w/c 335 284 297 315 337
Increase/decrease in inventory 15 37 -50 -60 -60
Change in operating receivables and payables -121 -72 -112 -105 -110
Increase/decrease in other working capital positions 21 -152 -16 -16 9
(Increase)/decrease in working capital -119 -97 -98 -111 -86
Cash flow from operating activities 216 187 200 204 251
Interest paid -2 -5 -5 -5 -5
Cash tax 11 0 10 10 11
Net cash from operating activities 225 182 205 209 257
Interest received 5 11 7 7 7
Capex -99 -86 -114 -110 -105
Intangibles expenditure -266 -94 -80 -82 -83
Income from asset disposals 1 14 0 0 0
Payments for acquisitions 51 25 0 0 0
Financial investments -47 -48 0 0 0
Cash flow from investing activities -355 -179 -187 -185 -181
Free cash flow (memo) -135 26 18 25 76
Dividends paid -61 -69 -72 -72 -77
Net proceeds from shares issued 6 8 0 0 0
Others -194 47 0 0 0
Effects of exchange rate changes on cash 0 -6 0 0 0
Net cash flow -185 -57 -54 -48 -1
Reported net debt -391 -407 -461 -509 -510
Source: Company data, Berenberg estimates
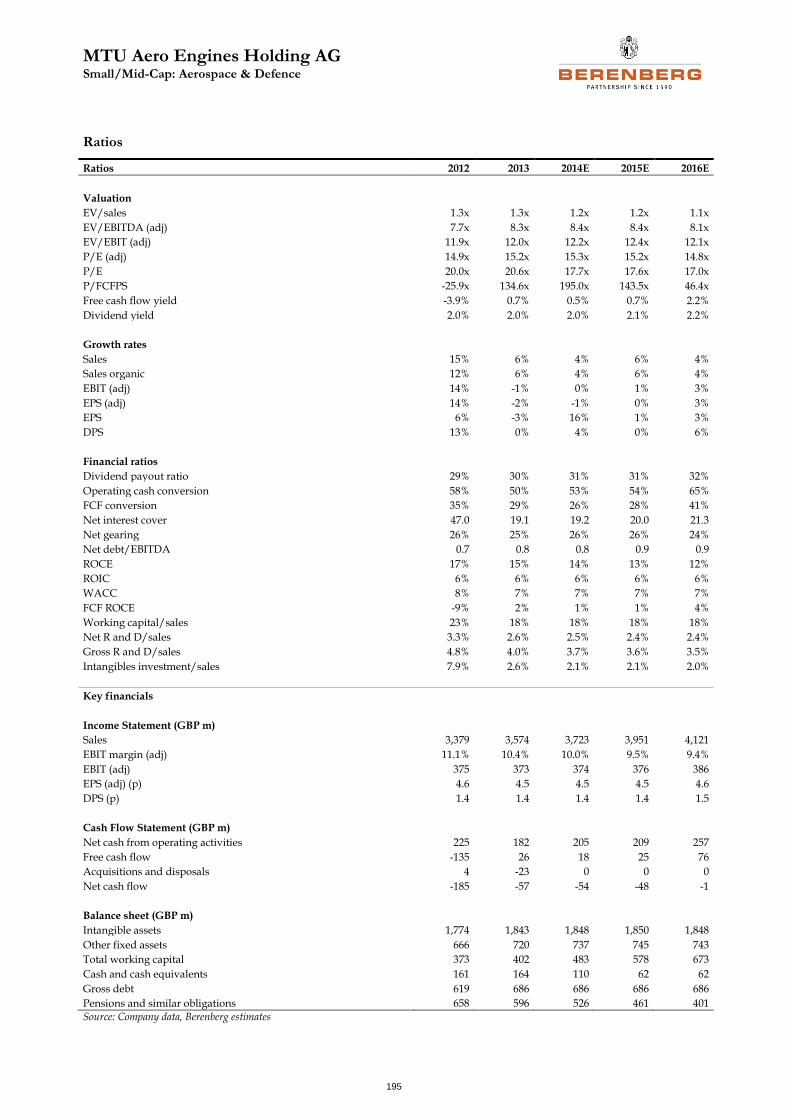
MTU Aero Engines Holding AG Small/Mid-Cap: Aerospace & Defence
195
Ratios
Ratios 2012 2013 2014E 2015E 2016E
Valuation
EV/sales 1.3x 1.3x 1.2x 1.2x 1.1x
EV/EBITDA (adj) 7.7x 8.3x 8.4x 8.4x 8.1x
EV/EBIT (adj) 11.9x 12.0x 12.2x 12.4x 12.1x
P/E (adj) 14.9x 15.2x 15.3x 15.2x 14.8x
P/E 20.0x 20.6x 17.7x 17.6x 17.0x
P/FCFPS -25.9x 134.6x 195.0x 143.5x 46.4x
Free cash flow yield -3.9% 0.7% 0.5% 0.7% 2.2%
Dividend yield 2.0% 2.0% 2.0% 2.1% 2.2%
Growth rates
Sales 15% 6% 4% 6% 4%
Sales organic 12% 6% 4% 6% 4%
EBIT (adj) 14% -1% 0% 1% 3%
EPS (adj) 14% -2% -1% 0% 3%
EPS 6% -3% 16% 1% 3%
DPS 13% 0% 4% 0% 6%
Financial ratios
Dividend payout ratio 29% 30% 31% 31% 32%
Operating cash conversion 58% 50% 53% 54% 65%
FCF conversion 35% 29% 26% 28% 41%
Net interest cover 47.0 19.1 19.2 20.0 21.3
Net gearing 26% 25% 26% 26% 24%
Net debt/EBITDA 0.7 0.8 0.8 0.9 0.9
ROCE 17% 15% 14% 13% 12%
ROIC 6% 6% 6% 6% 6%
WACC 8% 7% 7% 7% 7%
FCF ROCE -9% 2% 1% 1% 4%
Working capital/sales 23% 18% 18% 18% 18%
Net R and D/sales 3.3% 2.6% 2.5% 2.4% 2.4%
Gross R and D/sales 4.8% 4.0% 3.7% 3.6% 3.5%
Intangibles investment/sales 7.9% 2.6% 2.1% 2.1% 2.0%
Key financials
Income Statement (GBP m)
Sales 3,379 3,574 3,723 3,951 4,121
EBIT margin (adj) 11.1% 10.4% 10.0% 9.5% 9.4%
EBIT (adj) 375 373 374 376 386
EPS (adj) (p) 4.6 4.5 4.5 4.5 4.6
DPS (p) 1.4 1.4 1.4 1.4 1.5
Cash Flow Statement (GBP m)
Net cash from operating activities 225 182 205 209 257
Free cash flow -135 26 18 25 76
Acquisitions and disposals 4 -23 0 0 0
Net cash flow -185 -57 -54 -48 -1
Balance sheet (GBP m)
Intangible assets 1,774 1,843 1,848 1,850 1,848
Other fixed assets 666 720 737 745 743
Total working capital 373 402 483 578 673
Cash and cash equivalents 161 164 110 62 62
Gross debt 619 686 686 686 686
Pensions and similar obligations 658 596 526 461 401 Source: Company data, Berenberg estimates
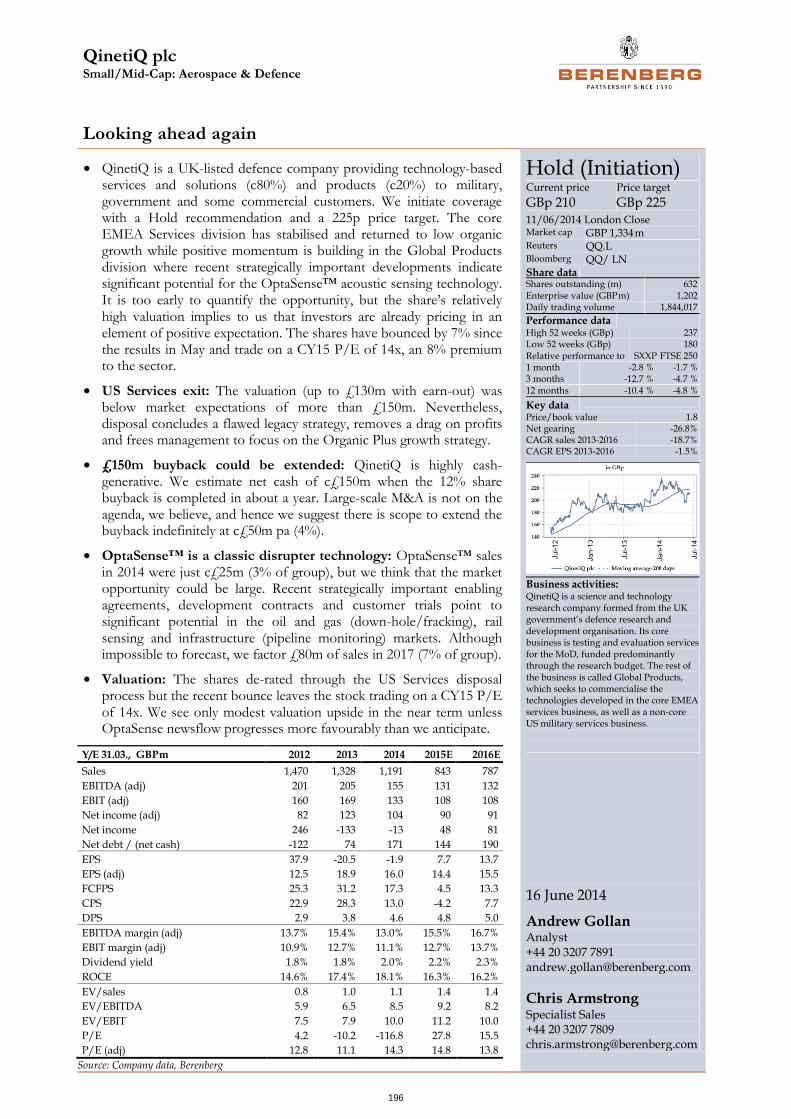
QinetiQ plc Small/Mid-Cap: Aerospace & Defence
196
Looking ahead again
• QinetiQ is a UK-listed defence company providing technology-based services and solutions (c80%) and products (c20%) to military, government and some commercial customers. We initiate coverage with a Hold recommendation and a 225p price target. The core EMEA Services division has stabilised and returned to low organic growth while positive momentum is building in the Global Products division where recent strategically important developments indicate significant potential for the OptaSense™ acoustic sensing technology. It is too early to quantify the opportunity, but the share’s relatively high valuation implies to us that investors are already pricing in an element of positive expectation. The shares have bounced by 7% since the results in May and trade on a CY15 P/E of 14x, an 8% premium to the sector.
• US Services exit: The valuation (up to £130m with earn-out) was below market expectations of more than £150m. Nevertheless, disposal concludes a flawed legacy strategy, removes a drag on profits and frees management to focus on the Organic Plus growth strategy.
• £150m buyback could be extended: QinetiQ is highly cash-generative. We estimate net cash of c£150m when the 12% share buyback is completed in about a year. Large-scale M&A is not on the agenda, we believe, and hence we suggest there is scope to extend the buyback indefinitely at c£50m pa (4%).
• OptaSense™ is a classic disrupter technology: OptaSense™ sales in 2014 were just c£25m (3% of group), but we think that the market opportunity could be large. Recent strategically important enabling agreements, development contracts and customer trials point to significant potential in the oil and gas (down-hole/fracking), rail sensing and infrastructure (pipeline monitoring) markets. Although impossible to forecast, we factor £80m of sales in 2017 (7% of group).
• Valuation: The shares de-rated through the US Services disposal process but the recent bounce leaves the stock trading on a CY15 P/E of 14x. We see only modest valuation upside in the near term unless OptaSense newsflow progresses more favourably than we anticipate.
Hold (Initiation) Current price
GBp 210 Price target
GBp 225 11/06/2014 London Close Market cap GBP 1,334 m Reuters QQ.L Bloomberg QQ/ LN Share data
Shares outstanding (m) 632 Enterprise value (GBP m) 1,202 Daily trading volume 1,844,017
Performance data
High 52 weeks (GBp) 237 Low 52 weeks (GBp) 180
Relative performance to SXXP FTSE 250 1 month -2.8 % -1.7 % 3 months -12.7 % -4.7 % 12 months -10.4 % -4.8 %
Key data
Price/book value 1.8 Net gearing -26.8% CAGR sales 2013-2016 -18.7% CAGR EPS 2013-2016 -1.5%
Business activities: QinetiQ is a science and technology research company formed from the UK government’s defence research and development organisation. Its core business is testing and evaluation services for the MoD, funded predominantly through the research budget. The rest of the business is called Global Products, which seeks to commercialise the technologies developed in the core EMEA services business, as well as a non-core US military services business.
16 June 2014
Andrew Gollan Analyst +44 20 3207 7891 [email protected]
Chris Armstrong
Specialist Sales +44 20 3207 7809 [email protected]
Y/E 31.03., GBP m 2012 2013 2014 2015E 2016E
Sales 1,470 1,328 1,191 843 787
EBITDA (adj) 201 205 155 131 132
EBIT (adj) 160 169 133 108 108
Net income (adj) 82 123 104 90 91
Net income 246 -133 -13 48 81
Net debt / (net cash) -122 74 171 144 190
EPS 37.9 -20.5 -1.9 7.7 13.7
EPS (adj) 12.5 18.9 16.0 14.4 15.5
FCFPS 25.3 31.2 17.3 4.5 13.3
CPS 22.9 28.3 13.0 -4.2 7.7
DPS 2.9 3.8 4.6 4.8 5.0
EBITDA margin (adj) 13.7% 15.4% 13.0% 15.5% 16.7%
EBIT margin (adj) 10.9% 12.7% 11.1% 12.7% 13.7%
Dividend yield 1.8% 1.8% 2.0% 2.2% 2.3%
ROCE 14.6% 17.4% 18.1% 16.3% 16.2%
EV/sales 0.8 1.0 1.1 1.4 1.4
EV/EBITDA 5.9 6.5 8.5 9.2 8.2
EV/EBIT 7.5 7.9 10.0 11.2 10.0
P/E 4.2 -10.2 -116.8 27.8 15.5
P/E (adj) 12.8 11.1 14.3 14.8 13.8
Source: Company data, Berenberg
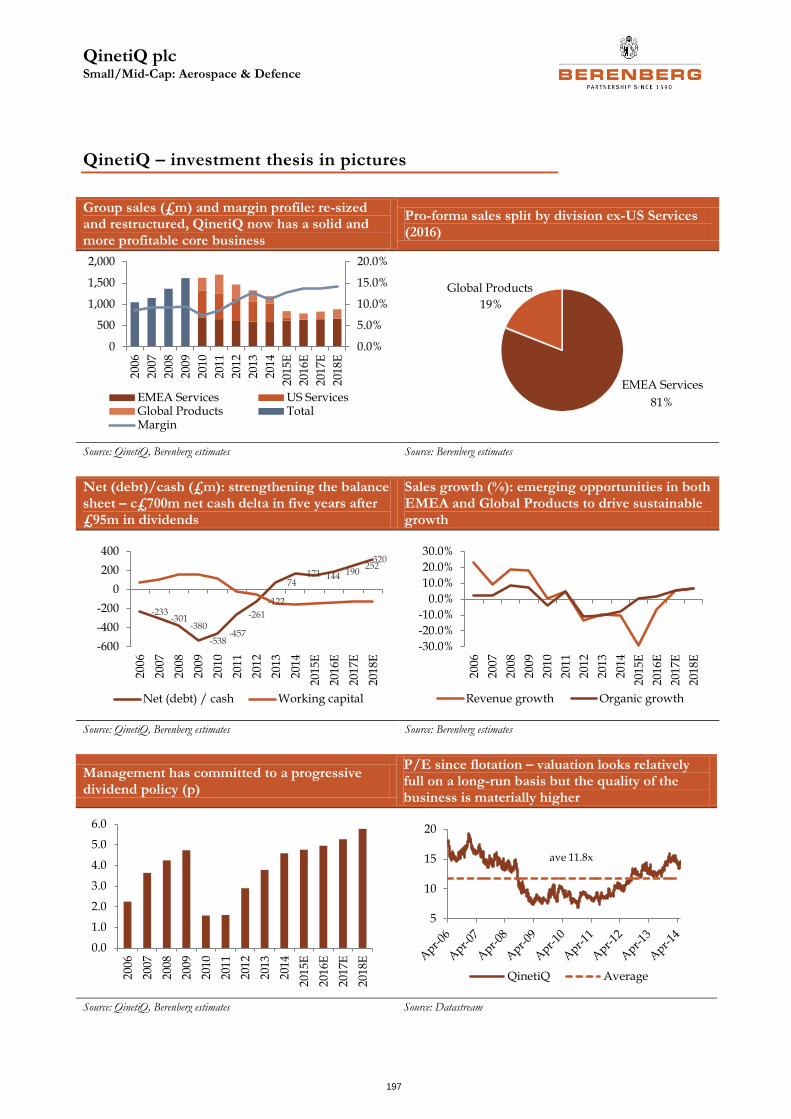
QinetiQ plc Small/Mid-Cap: Aerospace & Defence
197
QinetiQ – investment thesis in pictures
Group sales (£m) and margin profile: re-sized and restructured, QinetiQ now has a solid and more profitable core business
Pro-forma sales split by division ex-US Services (2016)
Source: QinetiQ, Berenberg estimates Source: Berenberg estimates
Net (debt)/cash (£m): strengthening the balance sheet – c£700m net cash delta in five years after £95m in dividends
Sales growth (%): emerging opportunities in both EMEA and Global Products to drive sustainable growth
Source: QinetiQ, Berenberg estimates Source: Berenberg estimates
Management has committed to a progressive dividend policy (p)
P/E since flotation – valuation looks relatively full on a long-run basis but the quality of the business is materially higher
Source: QinetiQ, Berenberg estimates Source: Datastream
0.0%
5.0%
10.0%
15.0%
20.0%
0
500
1,000
1,500
2,000
200
6
200
7
200
8
200
9
201
0
2011
201
2
201
3
201
4
201
5E
2016
E
201
7E
201
8E
EMEA Services US ServicesGlobal Products TotalMargin
81%
19%
EMEA Services
Global Products
-233-301
-380
-538-457
-261
-122
74171 144 190
252320
-600
-400
-200
0
200
400
200
6
200
7
200
8
200
9
201
0
201
1
201
2
201
3
201
4
201
5E
2016
E
201
7E
201
8E
Net (debt) / cash Working capital
-30.0%
-20.0%
-10.0%
0.0%
10.0%
20.0%
30.0%
200
6
200
7
200
8
200
9
201
0
201
1
201
2
201
3
201
4
2015
E
2016
E
2017
E
2018
ERevenue growth Organic growth
0.0
1.0
2.0
3.0
4.0
5.0
6.0
200
6
200
7
200
8
200
9
2010
201
1
201
2
201
3
201
4
201
5E
201
6E
201
7E
201
8E
5
10
15
20
QinetiQ Average
ave 11.8x
QinetiQ plc Small/Mid-Cap: Aerospace & Defence
198
QinetiQ – investment thesis
What’s new: We initiate coverage on QinetiQ with a Hold rating and a 225p price target, implying 7% upside.
Two-minute summary: QinetiQ is a UK-listed defence company providing technology-based services and solutions to military, government and some commercial customers. Under the stewardship of CEO Leo Quinn, the business has been transformed over the past four years from its institutional government heritage to a focused business in a position of financial strength. While QinetiQ is not a high-growth story, we are encouraged to see the core EMEA Services division stabilising and returning to low organic growth. In the Global Products division, a number of new products and technologies are emerging that should, in time, deliver management’s strategy to diversify the portfolio of products that is currently too small and overly reliant on shrinking defence budgets. In the case of OptaSense™, the division’s acoustic sensing technology, significant market opportunities are emerging in the oil and gas services and rail infrastructure markets, and we expect more positive contract developments over the next 12 months.
The shares underperformed through the US Services disposal process, albeit from all-time highs, reflecting a valuation below expectations. The recent bounce following the FY13 results in May leaves the shares down by 3% ytd, which is a 2.5% underperformance compared to the sector. The shares now trade on a CY2015 P/E of 14x, a c8% premium to the sector, which indicates to us that the market is pricing an element of upside from further OptaSense™ progress.
Key investment point one: longer-term upside from new products, particularly OptaSense™
Revenues in the Global Products division are still volatile due to the small portfolio of products that are overly reliant on defence markets and conflict-driven demand. Broadening the range to include more commercial-market-facing, revenue-sustaining products is a key focus for management. The award of a number of development and enabling contracts for OptaSense™ indicate it is a genuinely disruptive technology with significant potential in the oil and gas and infrastructure sectors. Predicting the timing and scale of commercialisation success is an inherently difficult exercise but we are increasingly convinced that OptaSense™ will become an important driver of shareholder value over the coming years.
Key investment point two: more cash returns in prospect
QinetiQ is a highly cash-generative business – we estimate average cash conversion after capex since flotation in 2006 of 120%. After an impressive £700m balance sheet cash improvement over the past five years, the company reported net cash of £170m in March 2014. A £150m (c12%) share buyback programme announced at the same time as the disposal of the US Services business has just commenced and is expected to complete within a year. Incorporating this and ongoing cash generation, we estimate group net cash of close to £150m by March 2015 and for it to continue to rise thereafter. We do not think large-scale M&A is on the agenda, so we suggest QinetiQ could sustain a additional payout of c£50m pa, either by way of share repurchase or special dividend.
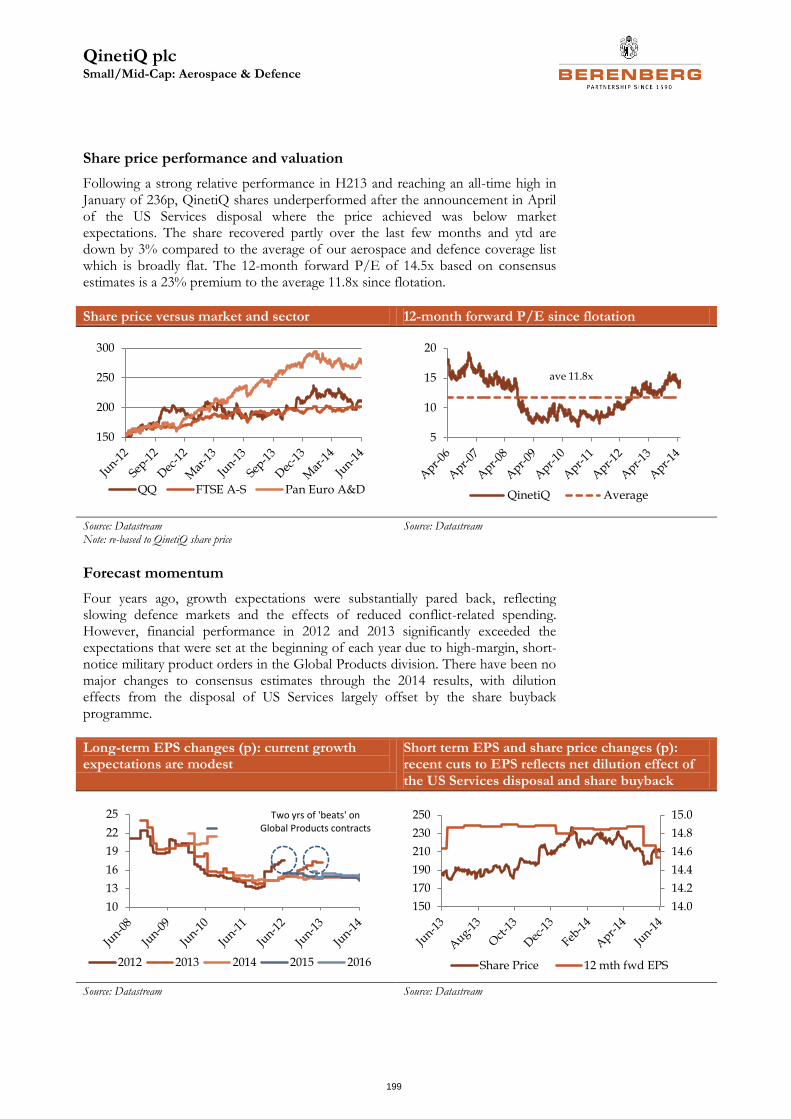
QinetiQ plc Small/Mid-Cap: Aerospace & Defence
199
Share price performance and valuation
Following a strong relative performance in H213 and reaching an all-time high in January of 236p, QinetiQ shares underperformed after the announcement in April of the US Services disposal where the price achieved was below market expectations. The share recovered partly over the last few months and ytd are down by 3% compared to the average of our aerospace and defence coverage list which is broadly flat. The 12-month forward P/E of 14.5x based on consensus estimates is a 23% premium to the average 11.8x since flotation.
Share price versus market and sector 12-month forward P/E since flotation
Source: Datastream Note: re-based to QinetiQ share price
Source: Datastream
Forecast momentum
Four years ago, growth expectations were substantially pared back, reflecting slowing defence markets and the effects of reduced conflict-related spending. However, financial performance in 2012 and 2013 significantly exceeded the expectations that were set at the beginning of each year due to high-margin, short-notice military product orders in the Global Products division. There have been no major changes to consensus estimates through the 2014 results, with dilution effects from the disposal of US Services largely offset by the share buyback programme.
Long-term EPS changes (p): current growth expectations are modest
Short term EPS and share price changes (p): recent cuts to EPS reflects net dilution effect of the US Services disposal and share buyback
Source: Datastream Source: Datastream
150
200
250
300
QQ FTSE A-S Pan Euro A&D
5
10
15
20
QinetiQ Average
ave 11.8x
10
13
16
19
22
25
2012 2013 2014 2015 2016
Two yrs of 'beats' on Global Products contracts
14.0
14.2
14.4
14.6
14.8
15.0
150
170
190
210
230
250
Share Price 12 mth fwd EPS
QinetiQ plc Small/Mid-Cap: Aerospace & Defence
200
Recent results, outlook and guidance
Results recap (to March 2014): sales were slightly light but EBIT was 6% ahead of consensus estimates.
• Revenue declined by 10.5% yoy to £1,191m, down as expected compared to 2013, due to a strong contract-led Global Products comparator, and also the anticipated effects of weakness in the US federal contracting environment and troop drawdown from Afghanistan.
• EBIT declined by 21.4% yoy to £132.7m (consensus: £125m) leading to a PBT of £119.4m (consensus: £112m) and EPS of 16.0p (consensus: 14.7p), which was helped by a lower tax rate (12.9% versus 19.2%).
• Strong cash: Net cash amounted to £170m (£74m in 2013) and compared to consensus of around £140m with another year of strong cash generation (cash conversion: 103%).
• DPS: The dividend increased by 21% to 4.6p.
• Outlook: Initial guidance for 2015 was vague and not quantified, as has become the custom for the QinetiQ management in recent years: “The board is maintaining expectation for the overall group performance”. Within this guidance, management has said it expects EMEA Services to remain steady, while Global Products will continue to be challenged by lower demand for conflict-related products. We interpret from this that underlying consensus estimates, adjusted for the US Services disposal and share buyback, were broadly unchanged.
Disposal of US Services – valuation was light but exit was the right strategic move
On 22 April, QinetiQ announced the disposal of its US Services division for an initial cash consideration of $165m (£98m) plus a potential earn-out of up to $50m (£30m) depending on its performance to March 2015. While the valuation fell short of market expectations of £150m-200m, we welcome the disposal as it concludes the previous management’s flawed strategy to aggressively expanding into the US, and removes the group’s exposure to the challenged US federal services market. To put this into historical context, we estimate that the previous management spent close to £800m on 14 US acquisitions between 2005 and 2010. Since then, their collective revenues have fallen by c30% and overall margins have halved to c4%. The individual businesses were proved, in an increasingly competitive market, to be sub-scale and with headwinds unlikely to moderate any time soon, we think disposal at the price achieved was appropriate for shareholders, in our view. For the record, we model pro-forma group margins post-exit from US services of 14% from c11% in 2014.
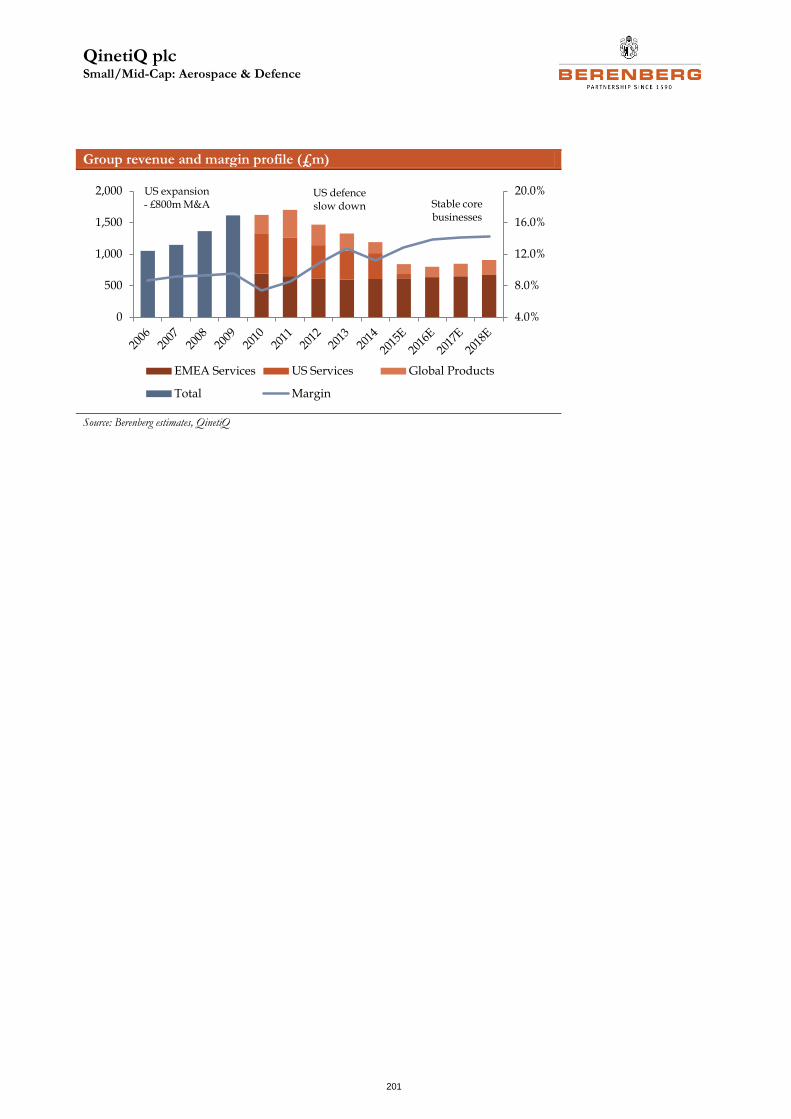
QinetiQ plc Small/Mid-Cap: Aerospace & Defence
201
Group revenue and margin profile (£m)
Source: Berenberg estimates, QinetiQ
4.0%
8.0%
12.0%
16.0%
20.0%
0
500
1,000
1,500
2,000
EMEA Services US Services Global Products
Total Margin
US expansion - £800m M&A
US defenceslow down Stable core
businesses
QinetiQ plc Small/Mid-Cap: Aerospace & Defence
202
Investment risks and concerns
• Slow progress transitioning the Global Products portfolio: It is three years since the company introduced the strategy and investment framework intended to diversify the group’s portfolio of core products. Progress has been slow. We estimate that just six products – LAST® Armor, TALON®, PADS® Q-Net®, SWATS™ (all-defence related products) – accounted for over half the division’s sales in 2014. OptaSense™ and Space Products are two areas showing promising potential but predicting the timing and monetary value of successful commercialisation is an inherently hazardous exercise. We believe the market is starting to consider upside potential from new products as being core to the investment case (as do we), so if progress is slower than hoped over the next 12 to 18 months, then valuation risk would shift to the downside.
• Leo Quinn steps down: CEO Leo Quinn is the architect of the group’s four-year turnaround and can be credited with overseeing major structural change internally and operationally, and ultimately creating significant shareholder value. The historical civil service culture has been substantially transformed to a more commercially focused business with a fundamentally more robust strategy to realise value from the deep pool of intellectual property within the QinetiQ portfolio. We are not aware that the company or Mr Quinn has made any public reference to his intended tenure, but as the business moves into its next strategic phase (following the disposal of US Services), we are cognisant of the achievements so far and we speculate that there is a possibility that Mr Quinn could move on within our investment horizon. If he were to step down, we expect the shares to de-rate.
• Defence budget pressures: Of the companies we follow, QinetiQ has the highest proportion of sales to defence and security customers (c90%), although direct exposure to the US is has fallen following the disposal of US Services. In the UK, top-line budget pressures will persist, although this is mitigated in QinetiQ’s case by the company’s unique position to support transformation of the UK Ministry of Defence’s (MoD) procurement and support organisation, Defence Equipment & Support (DE&S), in order to reduce costs. The near-term outlook in the US has improved with the recent two-year budget deal, indicating a more gradual path to lower defence spending. However, we anticipate continued downward pressure for the foreseeable future, particularly in the Global Products division which is highly exposed to the US Department of Defense’s Overseas Contingency Operations budget (OCO), the supplemental budget to fund the conflict in Afghanistan, which we expect to decline as troop drawdown from Afghanistan continues over the next few years.
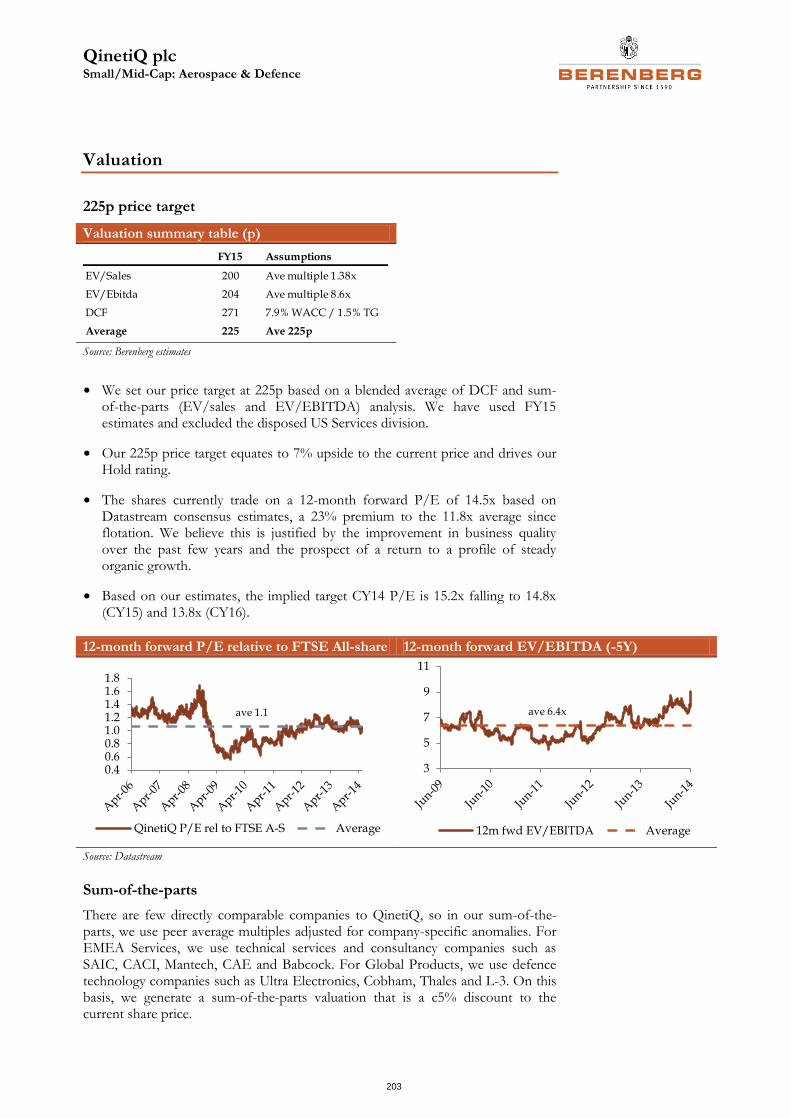
QinetiQ plc Small/Mid-Cap: Aerospace & Defence
203
Valuation
225p price target
Valuation summary table (p)
Source: Berenberg estimates
• We set our price target at 225p based on a blended average of DCF and sum-of-the-parts (EV/sales and EV/EBITDA) analysis. We have used FY15 estimates and excluded the disposed US Services division.
• Our 225p price target equates to 7% upside to the current price and drives our Hold rating.
• The shares currently trade on a 12-month forward P/E of 14.5x based on Datastream consensus estimates, a 23% premium to the 11.8x average since flotation. We believe this is justified by the improvement in business quality over the past few years and the prospect of a return to a profile of steady organic growth.
• Based on our estimates, the implied target CY14 P/E is 15.2x falling to 14.8x (CY15) and 13.8x (CY16).
12-month forward P/E relative to FTSE All-share 12-month forward EV/EBITDA (-5Y)
Source: Datastream
Sum-of-the-parts
There are few directly comparable companies to QinetiQ, so in our sum-of-the-parts, we use peer average multiples adjusted for company-specific anomalies. For EMEA Services, we use technical services and consultancy companies such as SAIC, CACI, Mantech, CAE and Babcock. For Global Products, we use defence technology companies such as Ultra Electronics, Cobham, Thales and L-3. On this basis, we generate a sum-of-the-parts valuation that is a c5% discount to the current share price.
FY15 Assumptions
EV/Sales 200 Ave multiple 1.38x
EV/Ebitda 204 Ave multiple 8.6x
DCF 271 7.9% WACC / 1.5% TG
Average 225 Ave 225p
0.40.60.81.01.21.41.61.8
QinetiQ P/E rel to FTSE A-S Average
ave 1.1
3
5
7
9
11
12m fwd EV/EBITDA Average
ave 6.4x
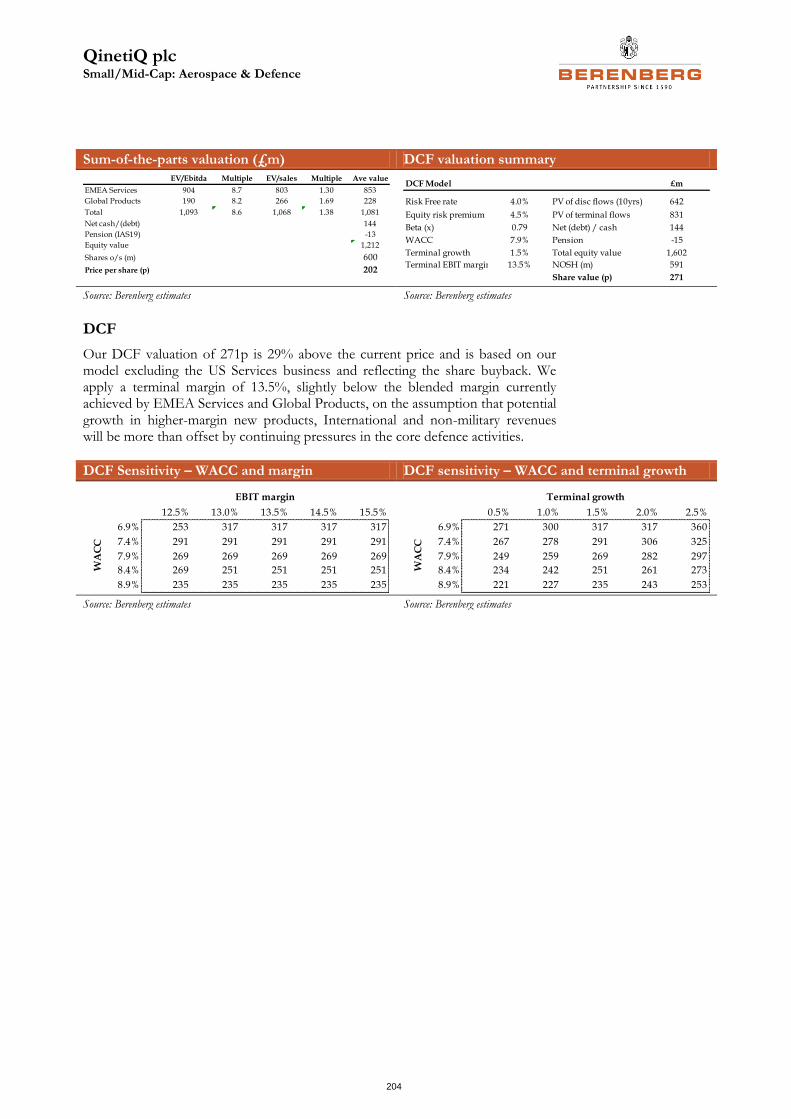
QinetiQ plc Small/Mid-Cap: Aerospace & Defence
204
Sum-of-the-parts valuation (£m) DCF valuation summary
Source: Berenberg estimates Source: Berenberg estimates
DCF
Our DCF valuation of 271p is 29% above the current price and is based on our model excluding the US Services business and reflecting the share buyback. We apply a terminal margin of 13.5%, slightly below the blended margin currently achieved by EMEA Services and Global Products, on the assumption that potential growth in higher-margin new products, International and non-military revenues will be more than offset by continuing pressures in the core defence activities.
DCF Sensitivity – WACC and margin DCF sensitivity – WACC and terminal growth
Source: Berenberg estimates Source: Berenberg estimates
EV/Ebitda Multiple EV/sales Multiple Ave value
EMEA Services 904 8.7 803 1.30 853
Global Products 190 8.2 266 1.69 228
Total 1,093 8.6 1,068 1.38 1,081
Net cash/(debt) 144
Pension (IAS19) -13
Equity value 1,212
Shares o/s (m) 600
Price per share (p) 202
DCF Model £m
Risk Free rate 4.0% PV of disc flows (10yrs) 642
Equity risk premium 4.5% PV of terminal flows 831
Beta (x) 0.79 Net (debt) / cash 144
WACC 7.9% Pension -15
Terminal growth 1.5% Total equity value 1,602
Terminal EBIT margin 13.5% NOSH (m) 591
Share value (p) 271
271 12.5% 13.0% 13.5% 14.5% 15.5%
6.9% 253 317 317 317 317
7.4% 291 291 291 291 291
7.9% 269 269 269 269 269
8.4% 269 251 251 251 251
8.9% 235 235 235 235 235
WA
CC
EBIT margin
271 0.5% 1.0% 1.5% 2.0% 2.5%
6.9% 271 300 317 317 360
7.4% 267 278 291 306 325
7.9% 249 259 269 282 297
8.4% 234 242 251 261 273
8.9% 221 227 235 243 253
Terminal growth
WA
CC
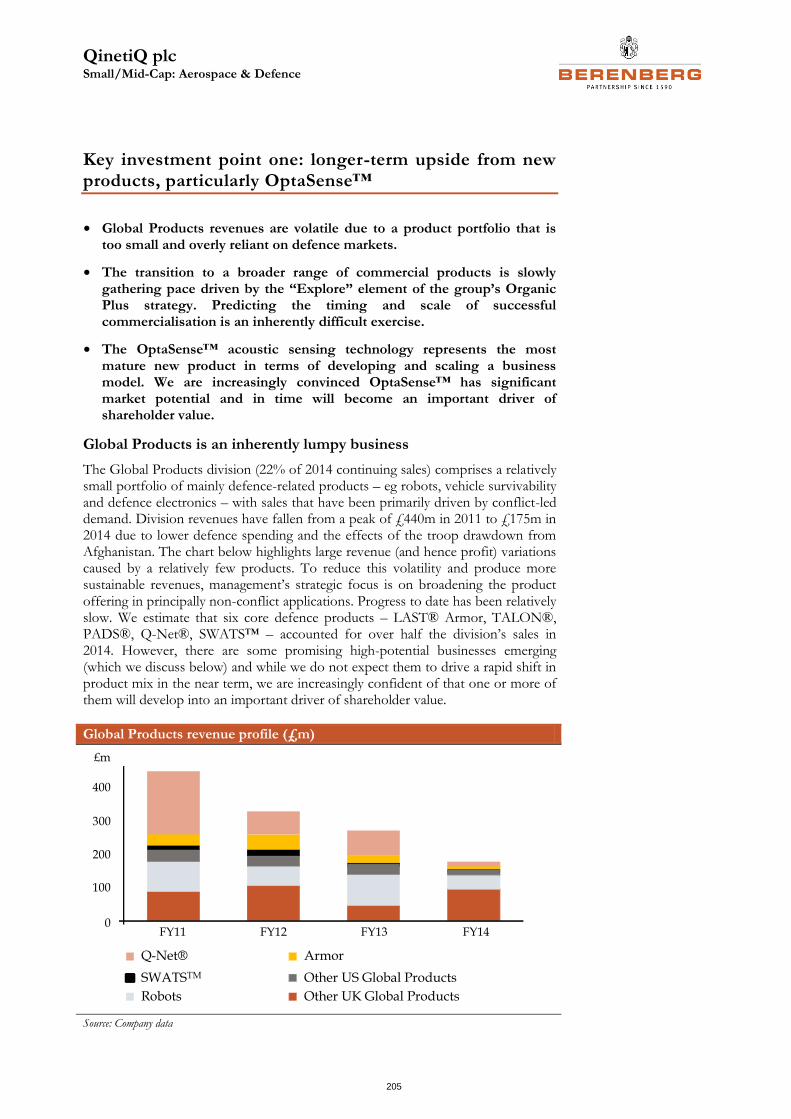
QinetiQ plc Small/Mid-Cap: Aerospace & Defence
205
Key investment point one: longer-term upside from new products, particularly OptaSense™
• Global Products revenues are volatile due to a product portfolio that is too small and overly reliant on defence markets.
• The transition to a broader range of commercial products is slowly gathering pace driven by the “Explore” element of the group’s Organic Plus strategy. Predicting the timing and scale of successful commercialisation is an inherently difficult exercise.
• The OptaSense™ acoustic sensing technology represents the most mature new product in terms of developing and scaling a business model. We are increasingly convinced OptaSense™ has significant market potential and in time will become an important driver of shareholder value.
Global Products is an inherently lumpy business
The Global Products division (22% of 2014 continuing sales) comprises a relatively small portfolio of mainly defence-related products – eg robots, vehicle survivability and defence electronics – with sales that have been primarily driven by conflict-led demand. Division revenues have fallen from a peak of £440m in 2011 to £175m in 2014 due to lower defence spending and the effects of the troop drawdown from Afghanistan. The chart below highlights large revenue (and hence profit) variations caused by a relatively few products. To reduce this volatility and produce more sustainable revenues, management’s strategic focus is on broadening the product offering in principally non-conflict applications. Progress to date has been relatively slow. We estimate that six core defence products – LAST® Armor, TALON®, PADS®, Q-Net®, SWATS™ – accounted for over half the division’s sales in 2014. However, there are some promising high-potential businesses emerging (which we discuss below) and while we do not expect them to drive a rapid shift in product mix in the near term, we are increasingly confident of that one or more of them will develop into an important driver of shareholder value.
Global Products revenue profile (£m)
Source: Company data
FY11 FY12 FY13 FY140
100
200
300
400
£m
Q-Net®
SWATSTM
Robots
Armor
Other US Global Products
Other UK Global Products
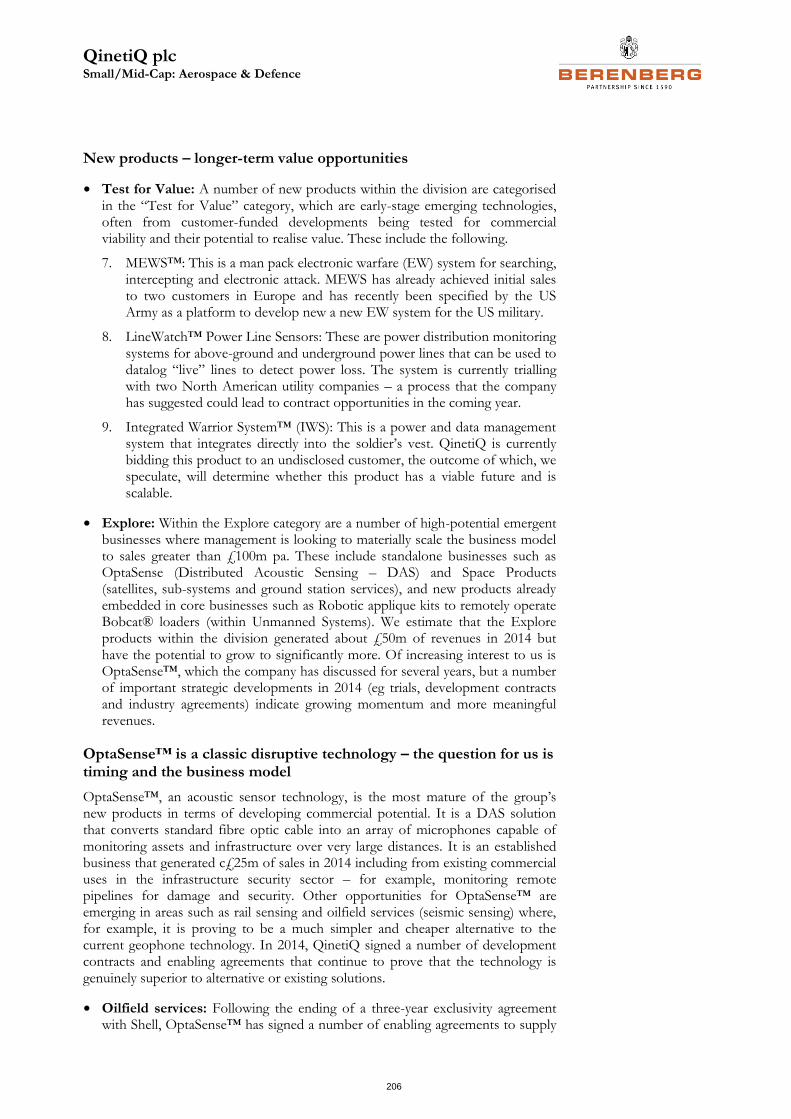
QinetiQ plc Small/Mid-Cap: Aerospace & Defence
206
New products – longer-term value opportunities
• Test for Value: A number of new products within the division are categorised in the “Test for Value” category, which are early-stage emerging technologies, often from customer-funded developments being tested for commercial viability and their potential to realise value. These include the following.
7. MEWS™: This is a man pack electronic warfare (EW) system for searching, intercepting and electronic attack. MEWS has already achieved initial sales to two customers in Europe and has recently been specified by the US Army as a platform to develop new a new EW system for the US military.
8. LineWatch™ Power Line Sensors: These are power distribution monitoring systems for above-ground and underground power lines that can be used to datalog “live” lines to detect power loss. The system is currently trialling with two North American utility companies – a process that the company has suggested could lead to contract opportunities in the coming year.
9. Integrated Warrior System™ (IWS): This is a power and data management system that integrates directly into the soldier’s vest. QinetiQ is currently bidding this product to an undisclosed customer, the outcome of which, we speculate, will determine whether this product has a viable future and is scalable.
• Explore: Within the Explore category are a number of high-potential emergent businesses where management is looking to materially scale the business model to sales greater than £100m pa. These include standalone businesses such as OptaSense (Distributed Acoustic Sensing – DAS) and Space Products (satellites, sub-systems and ground station services), and new products already embedded in core businesses such as Robotic applique kits to remotely operate Bobcat® loaders (within Unmanned Systems). We estimate that the Explore products within the division generated about £50m of revenues in 2014 but have the potential to grow to significantly more. Of increasing interest to us is OptaSense™, which the company has discussed for several years, but a number of important strategic developments in 2014 (eg trials, development contracts and industry agreements) indicate growing momentum and more meaningful revenues.
OptaSense™ is a classic disruptive technology – the question for us is timing and the business model
OptaSense™, an acoustic sensor technology, is the most mature of the group’s new products in terms of developing commercial potential. It is a DAS solution that converts standard fibre optic cable into an array of microphones capable of monitoring assets and infrastructure over very large distances. It is an established business that generated c£25m of sales in 2014 including from existing commercial uses in the infrastructure security sector – for example, monitoring remote pipelines for damage and security. Other opportunities for OptaSense™ are emerging in areas such as rail sensing and oilfield services (seismic sensing) where, for example, it is proving to be a much simpler and cheaper alternative to the current geophone technology. In 2014, QinetiQ signed a number of development contracts and enabling agreements that continue to prove that the technology is genuinely superior to alternative or existing solutions.
• Oilfield services: Following the ending of a three-year exclusivity agreement with Shell, OptaSense™ has signed a number of enabling agreements to supply
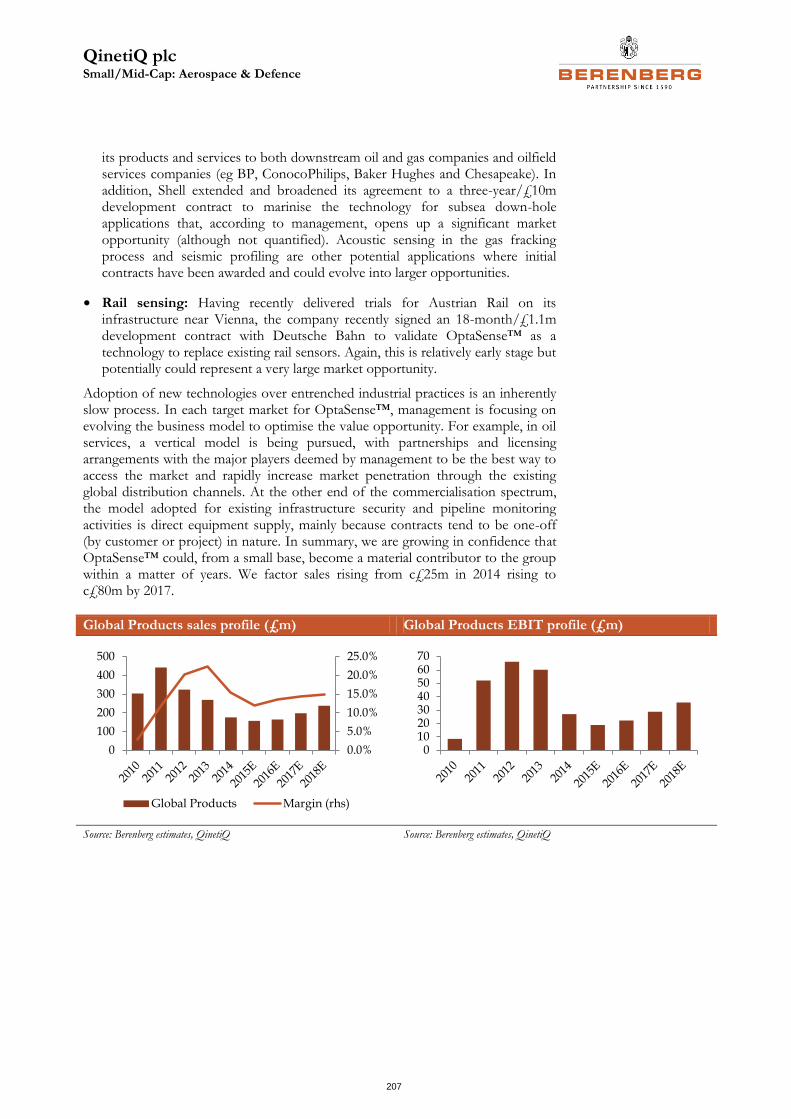
QinetiQ plc Small/Mid-Cap: Aerospace & Defence
207
its products and services to both downstream oil and gas companies and oilfield services companies (eg BP, ConocoPhilips, Baker Hughes and Chesapeake). In addition, Shell extended and broadened its agreement to a three-year/£10m development contract to marinise the technology for subsea down-hole applications that, according to management, opens up a significant market opportunity (although not quantified). Acoustic sensing in the gas fracking process and seismic profiling are other potential applications where initial contracts have been awarded and could evolve into larger opportunities.
• Rail sensing: Having recently delivered trials for Austrian Rail on its infrastructure near Vienna, the company recently signed an 18-month/£1.1m development contract with Deutsche Bahn to validate OptaSense™ as a technology to replace existing rail sensors. Again, this is relatively early stage but potentially could represent a very large market opportunity.
Adoption of new technologies over entrenched industrial practices is an inherently slow process. In each target market for OptaSense™, management is focusing on evolving the business model to optimise the value opportunity. For example, in oil services, a vertical model is being pursued, with partnerships and licensing arrangements with the major players deemed by management to be the best way to access the market and rapidly increase market penetration through the existing global distribution channels. At the other end of the commercialisation spectrum, the model adopted for existing infrastructure security and pipeline monitoring activities is direct equipment supply, mainly because contracts tend to be one-off (by customer or project) in nature. In summary, we are growing in confidence that OptaSense™ could, from a small base, become a material contributor to the group within a matter of years. We factor sales rising from c£25m in 2014 rising to c£80m by 2017.
Global Products sales profile (£m) Global Products EBIT profile (£m)
Source: Berenberg estimates, QinetiQ Source: Berenberg estimates, QinetiQ
0.0%
5.0%
10.0%
15.0%
20.0%
25.0%
0
100
200
300
400
500
Global Products Margin (rhs)
010203040506070
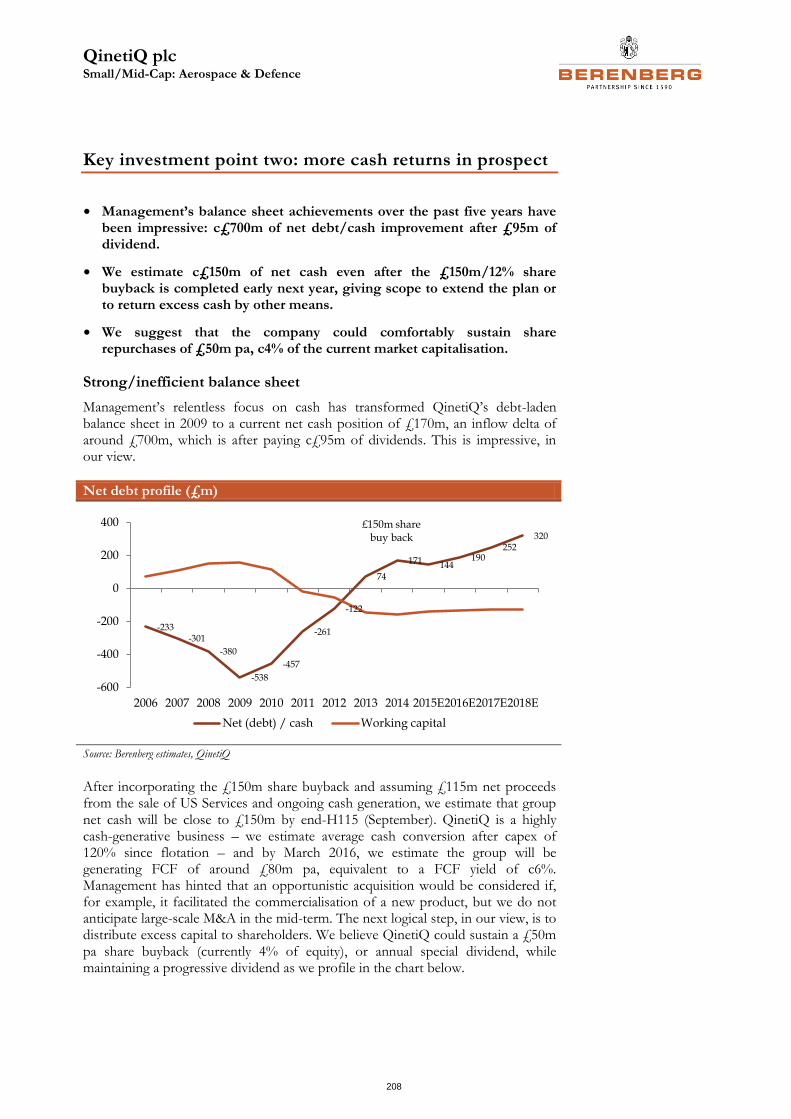
QinetiQ plc Small/Mid-Cap: Aerospace & Defence
208
Key investment point two: more cash returns in prospect
• Management’s balance sheet achievements over the past five years have been impressive: c£700m of net debt/cash improvement after £95m of dividend.
• We estimate c£150m of net cash even after the £150m/12% share buyback is completed early next year, giving scope to extend the plan or to return excess cash by other means.
• We suggest that the company could comfortably sustain share repurchases of £50m pa, c4% of the current market capitalisation.
Strong/inefficient balance sheet
Management’s relentless focus on cash has transformed QinetiQ’s debt-laden balance sheet in 2009 to a current net cash position of £170m, an inflow delta of around £700m, which is after paying c£95m of dividends. This is impressive, in our view.
Net debt profile (£m)
Source: Berenberg estimates, QinetiQ
After incorporating the £150m share buyback and assuming £115m net proceeds from the sale of US Services and ongoing cash generation, we estimate that group net cash will be close to £150m by end-H115 (September). QinetiQ is a highly cash-generative business – we estimate average cash conversion after capex of 120% since flotation – and by March 2016, we estimate the group will be generating FCF of around £80m pa, equivalent to a FCF yield of c6%. Management has hinted that an opportunistic acquisition would be considered if, for example, it facilitated the commercialisation of a new product, but we do not anticipate large-scale M&A in the mid-term. The next logical step, in our view, is to distribute excess capital to shareholders. We believe QinetiQ could sustain a £50m pa share buyback (currently 4% of equity), or annual special dividend, while maintaining a progressive dividend as we profile in the chart below.
-233-301
-380
-538
-457
-261
-122
74
171 144190
252320
-600
-400
-200
0
200
400
2006 2007 2008 2009 2010 2011 2012 2013 2014 2015E2016E2017E2018E
Net (debt) / cash Working capital
£150m share buy back
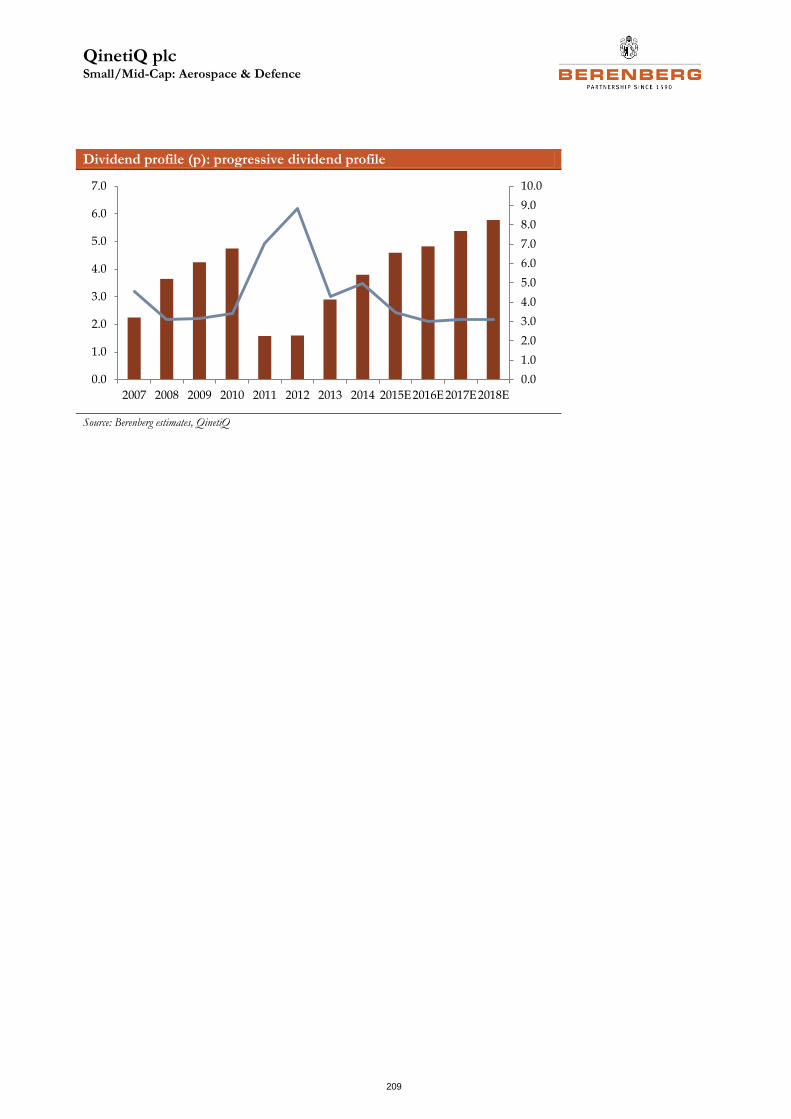
QinetiQ plc Small/Mid-Cap: Aerospace & Defence
209
Dividend profile (p): progressive dividend profile
Source: Berenberg estimates, QinetiQ
0.0
1.0
2.0
3.0
4.0
5.0
6.0
7.0
8.0
9.0
10.0
0.0
1.0
2.0
3.0
4.0
5.0
6.0
7.0
2007 2008 2009 2010 2011 2012 2013 2014 2015E2016E2017E2018E
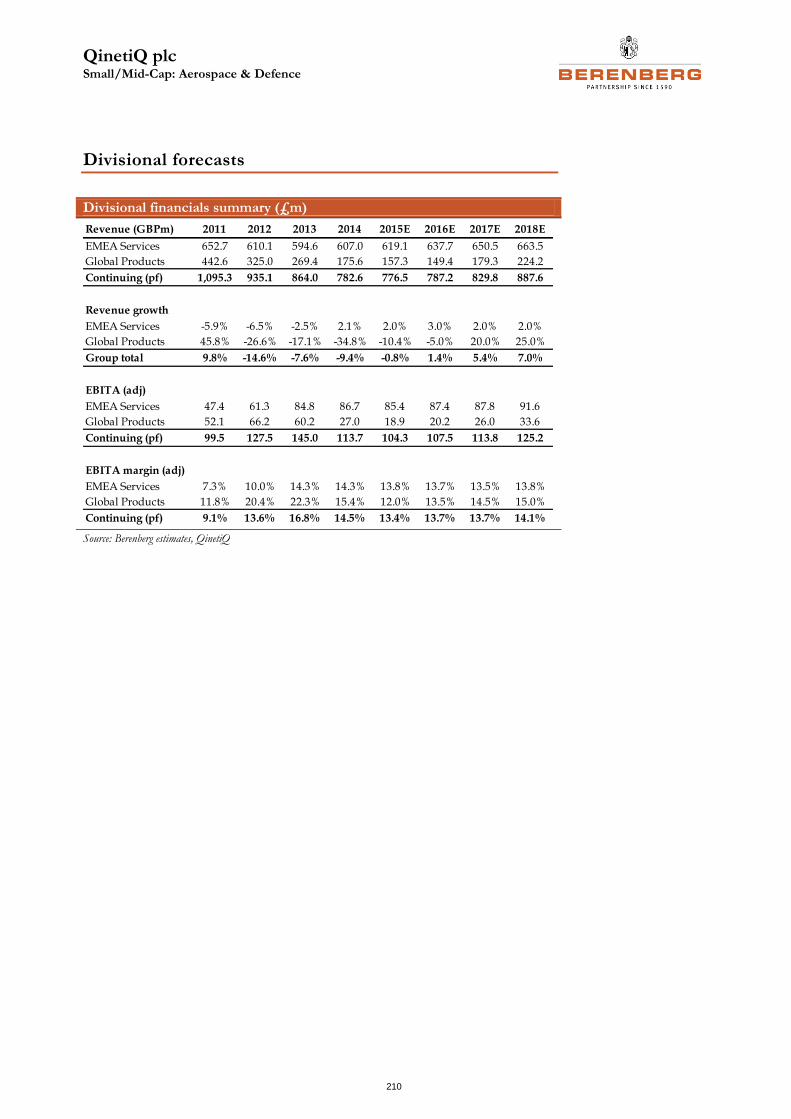
QinetiQ plc Small/Mid-Cap: Aerospace & Defence
210
Divisional forecasts
Divisional financials summary (£m)
Source: Berenberg estimates, QinetiQ
Revenue (GBPm) 2011 2012 2013 2014 2015E 2016E 2017E 2018E
EMEA Services 652.7 610.1 594.6 607.0 619.1 637.7 650.5 663.5
Global Products 442.6 325.0 269.4 175.6 157.3 149.4 179.3 224.2
Continuing (pf) 1,095.3 935.1 864.0 782.6 776.5 787.2 829.8 887.6
Revenue growth
EMEA Services -5.9% -6.5% -2.5% 2.1% 2.0% 3.0% 2.0% 2.0%
Global Products 45.8% -26.6% -17.1% -34.8% -10.4% -5.0% 20.0% 25.0%
Group total 9.8% -14.6% -7.6% -9.4% -0.8% 1.4% 5.4% 7.0%
EBITA (adj)
EMEA Services 47.4 61.3 84.8 86.7 85.4 87.4 87.8 91.6
Global Products 52.1 66.2 60.2 27.0 18.9 20.2 26.0 33.6
Continuing (pf) 99.5 127.5 145.0 113.7 104.3 107.5 113.8 125.2
EBITA margin (adj)
EMEA Services 7.3% 10.0% 14.3% 14.3% 13.8% 13.7% 13.5% 13.8%
Global Products 11.8% 20.4% 22.3% 15.4% 12.0% 13.5% 14.5% 15.0%
Continuing (pf) 9.1% 13.6% 16.8% 14.5% 13.4% 13.7% 13.7% 14.1%
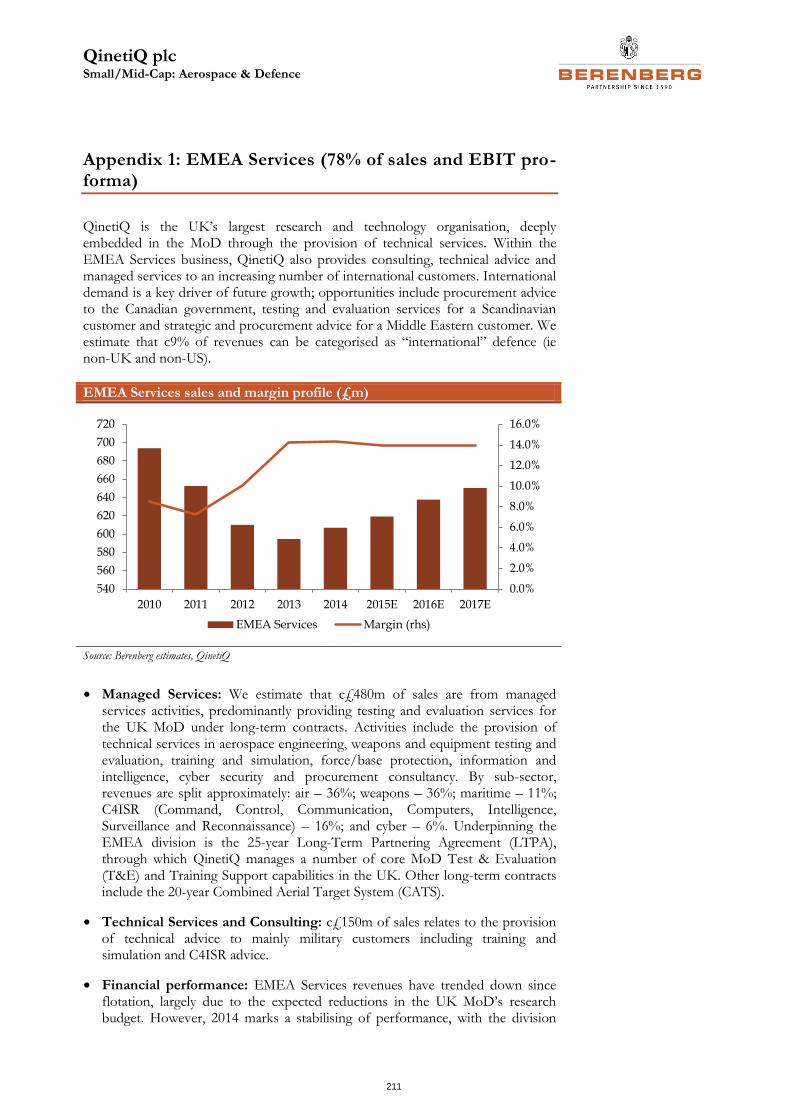
QinetiQ plc Small/Mid-Cap: Aerospace & Defence
211
Appendix 1: EMEA Services (78% of sales and EBIT pro-forma)
QinetiQ is the UK’s largest research and technology organisation, deeply embedded in the MoD through the provision of technical services. Within the EMEA Services business, QinetiQ also provides consulting, technical advice and managed services to an increasing number of international customers. International demand is a key driver of future growth; opportunities include procurement advice to the Canadian government, testing and evaluation services for a Scandinavian customer and strategic and procurement advice for a Middle Eastern customer. We estimate that c9% of revenues can be categorised as “international” defence (ie non-UK and non-US).
EMEA Services sales and margin profile (£m)
Source: Berenberg estimates, QinetiQ
• Managed Services: We estimate that c£480m of sales are from managed services activities, predominantly providing testing and evaluation services for the UK MoD under long-term contracts. Activities include the provision of technical services in aerospace engineering, weapons and equipment testing and evaluation, training and simulation, force/base protection, information and intelligence, cyber security and procurement consultancy. By sub-sector, revenues are split approximately: air – 36%; weapons – 36%; maritime – 11%; C4ISR (Command, Control, Communication, Computers, Intelligence, Surveillance and Reconnaissance) – 16%; and cyber – 6%. Underpinning the EMEA division is the 25-year Long-Term Partnering Agreement (LTPA), through which QinetiQ manages a number of core MoD Test & Evaluation (T&E) and Training Support capabilities in the UK. Other long-term contracts include the 20-year Combined Aerial Target System (CATS).
• Technical Services and Consulting: c£150m of sales relates to the provision of technical advice to mainly military customers including training and simulation and C4ISR advice.
• Financial performance: EMEA Services revenues have trended down since flotation, largely due to the expected reductions in the UK MoD’s research budget. However, 2014 marks a stabilising of performance, with the division
0.0%
2.0%
4.0%
6.0%
8.0%
10.0%
12.0%
14.0%
16.0%
540
560
580
600
620
640
660
680
700
720
2010 2011 2012 2013 2014 2015E 2016E 2017E
EMEA Services Margin (rhs)
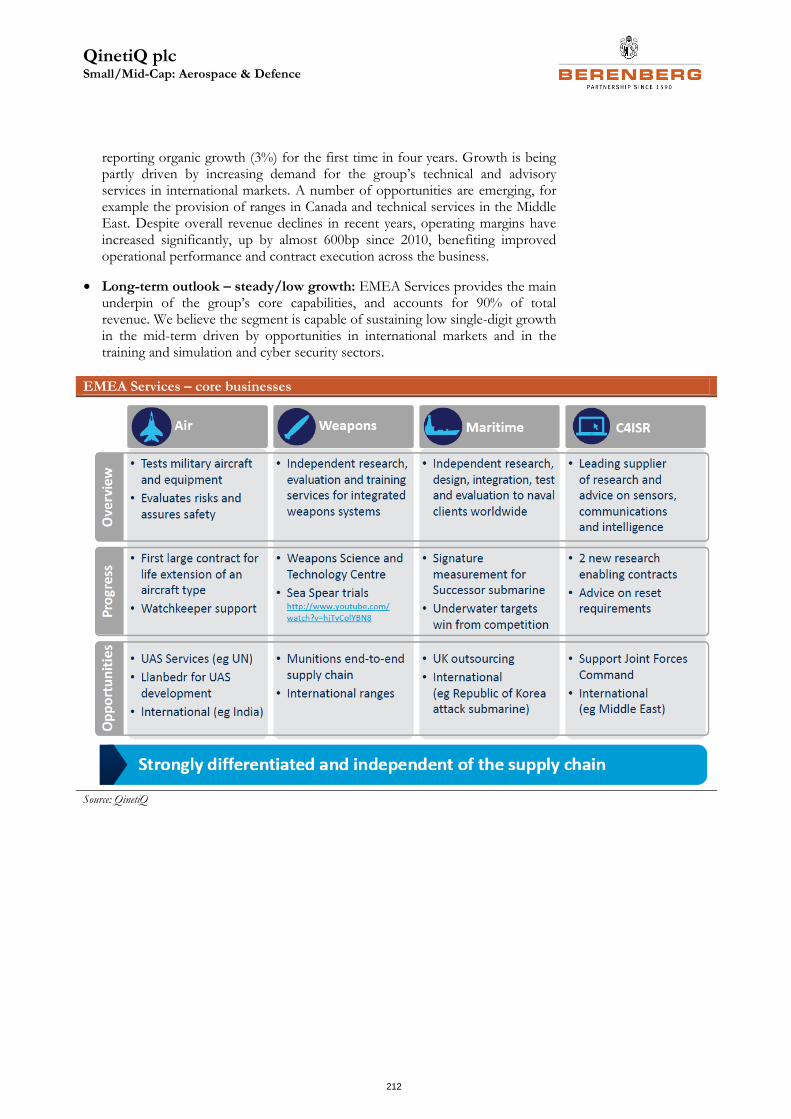
QinetiQ plc Small/Mid-Cap: Aerospace & Defence
212
reporting organic growth (3%) for the first time in four years. Growth is being partly driven by increasing demand for the group’s technical and advisory services in international markets. A number of opportunities are emerging, for example the provision of ranges in Canada and technical services in the Middle East. Despite overall revenue declines in recent years, operating margins have increased significantly, up by almost 600bp since 2010, benefiting improved operational performance and contract execution across the business.
• Long-term outlook – steady/low growth: EMEA Services provides the main underpin of the group’s core capabilities, and accounts for 90% of total revenue. We believe the segment is capable of sustaining low single-digit growth in the mid-term driven by opportunities in international markets and in the training and simulation and cyber security sectors.
EMEA Services – core businesses
Source: QinetiQ
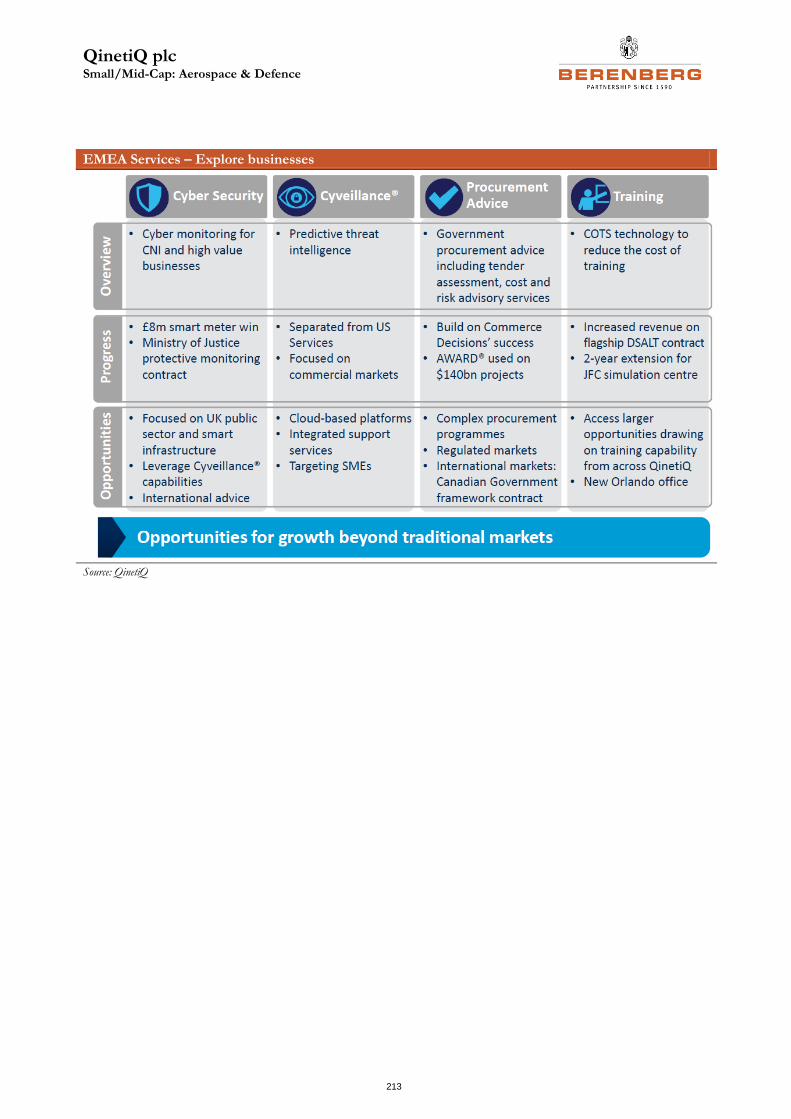
QinetiQ plc Small/Mid-Cap: Aerospace & Defence
213
EMEA Services – Explore businesses
Source: QinetiQ
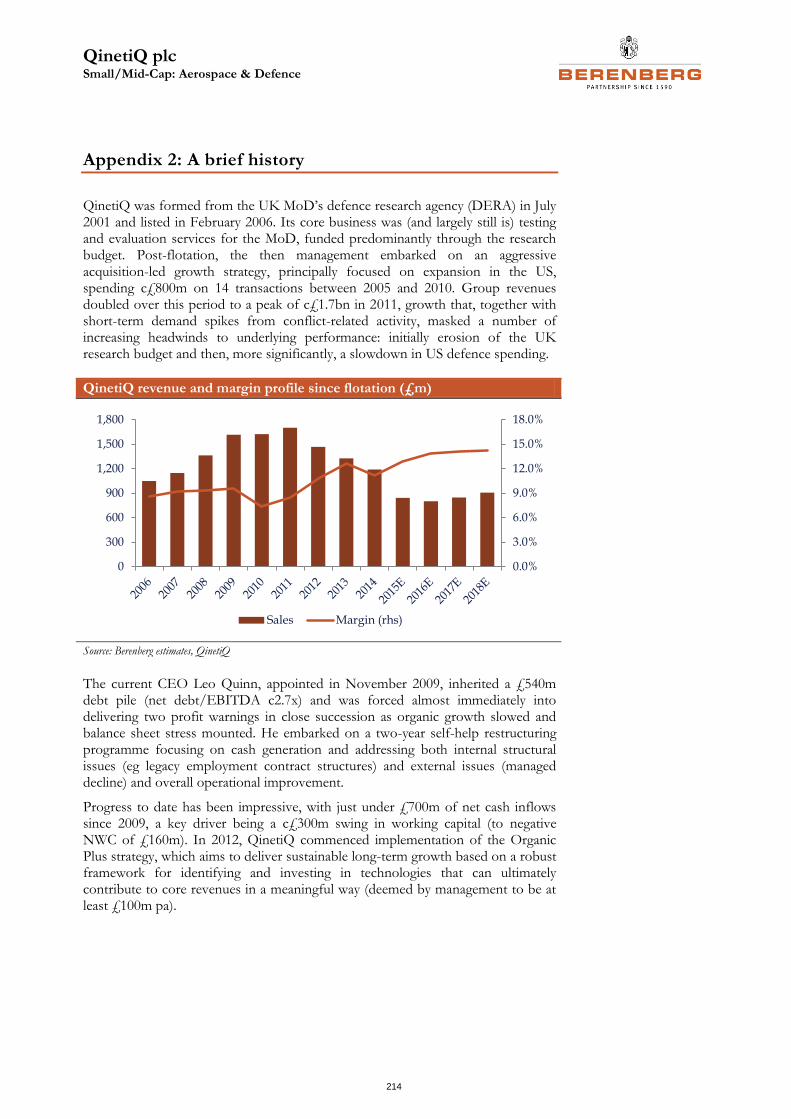
QinetiQ plc Small/Mid-Cap: Aerospace & Defence
214
Appendix 2: A brief history
QinetiQ was formed from the UK MoD’s defence research agency (DERA) in July 2001 and listed in February 2006. Its core business was (and largely still is) testing and evaluation services for the MoD, funded predominantly through the research budget. Post-flotation, the then management embarked on an aggressive acquisition-led growth strategy, principally focused on expansion in the US, spending c£800m on 14 transactions between 2005 and 2010. Group revenues doubled over this period to a peak of c£1.7bn in 2011, growth that, together with short-term demand spikes from conflict-related activity, masked a number of increasing headwinds to underlying performance: initially erosion of the UK research budget and then, more significantly, a slowdown in US defence spending.
QinetiQ revenue and margin profile since flotation (£m)
Source: Berenberg estimates, QinetiQ
The current CEO Leo Quinn, appointed in November 2009, inherited a £540m debt pile (net debt/EBITDA c2.7x) and was forced almost immediately into delivering two profit warnings in close succession as organic growth slowed and balance sheet stress mounted. He embarked on a two-year self-help restructuring programme focusing on cash generation and addressing both internal structural issues (eg legacy employment contract structures) and external issues (managed decline) and overall operational improvement.
Progress to date has been impressive, with just under £700m of net cash inflows since 2009, a key driver being a c£300m swing in working capital (to negative NWC of £160m). In 2012, QinetiQ commenced implementation of the Organic Plus strategy, which aims to deliver sustainable long-term growth based on a robust framework for identifying and investing in technologies that can ultimately contribute to core revenues in a meaningful way (deemed by management to be at least £100m pa).
0.0%
3.0%
6.0%
9.0%
12.0%
15.0%
18.0%
0
300
600
900
1,200
1,500
1,800
Sales Margin (rhs)
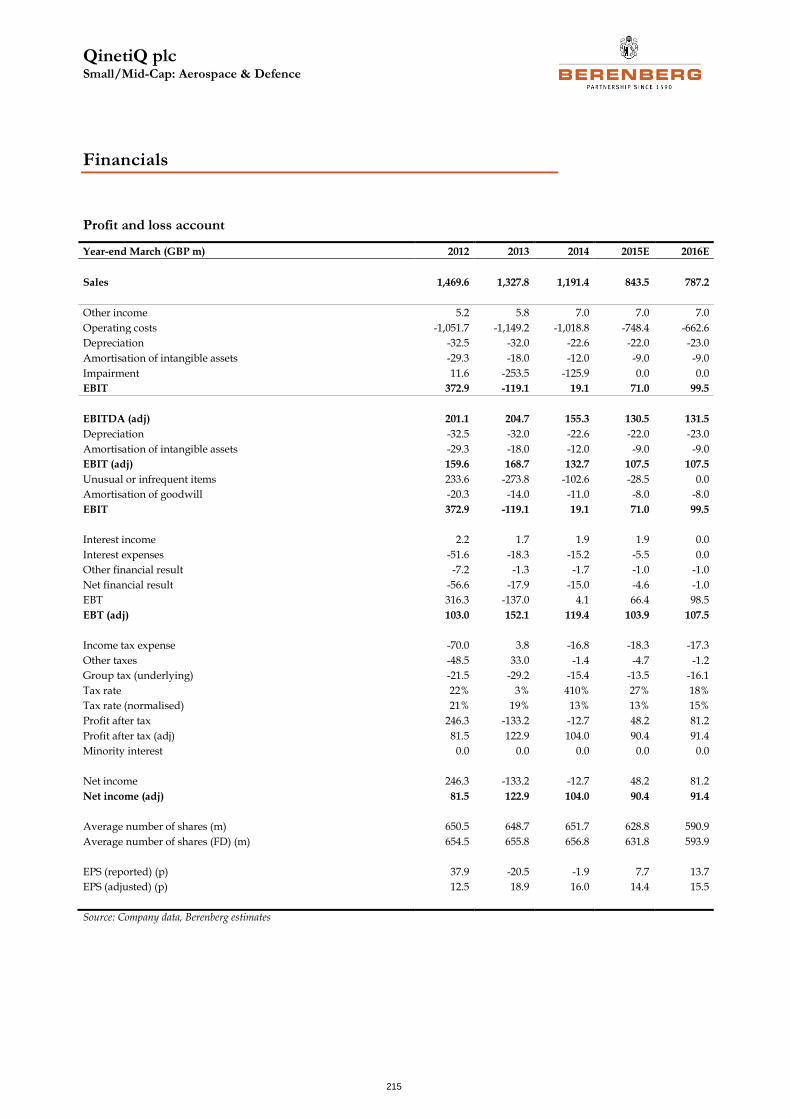
QinetiQ plc Small/Mid-Cap: Aerospace & Defence
215
Financials
Profit and loss account
Year-end March (GBP m) 2012 2013 2014 2015E 2016E
Sales 1,469.6 1,327.8 1,191.4 843.5 787.2
Other income 5.2 5.8 7.0 7.0 7.0
Operating costs -1,051.7 -1,149.2 -1,018.8 -748.4 -662.6
Depreciation -32.5 -32.0 -22.6 -22.0 -23.0
Amortisation of intangible assets -29.3 -18.0 -12.0 -9.0 -9.0
Impairment 11.6 -253.5 -125.9 0.0 0.0
EBIT 372.9 -119.1 19.1 71.0 99.5
EBITDA (adj) 201.1 204.7 155.3 130.5 131.5
Depreciation -32.5 -32.0 -22.6 -22.0 -23.0
Amortisation of intangible assets -29.3 -18.0 -12.0 -9.0 -9.0
EBIT (adj) 159.6 168.7 132.7 107.5 107.5
Unusual or infrequent items 233.6 -273.8 -102.6 -28.5 0.0
Amortisation of goodwill -20.3 -14.0 -11.0 -8.0 -8.0
EBIT 372.9 -119.1 19.1 71.0 99.5
Interest income 2.2 1.7 1.9 1.9 0.0
Interest expenses -51.6 -18.3 -15.2 -5.5 0.0
Other financial result -7.2 -1.3 -1.7 -1.0 -1.0
Net financial result -56.6 -17.9 -15.0 -4.6 -1.0
EBT 316.3 -137.0 4.1 66.4 98.5
EBT (adj) 103.0 152.1 119.4 103.9 107.5
Income tax expense -70.0 3.8 -16.8 -18.3 -17.3
Other taxes -48.5 33.0 -1.4 -4.7 -1.2
Group tax (underlying) -21.5 -29.2 -15.4 -13.5 -16.1
Tax rate 22% 3% 410% 27% 18%
Tax rate (normalised) 21% 19% 13% 13% 15%
Profit after tax 246.3 -133.2 -12.7 48.2 81.2
Profit after tax (adj) 81.5 122.9 104.0 90.4 91.4
Minority interest 0.0 0.0 0.0 0.0 0.0
Net income 246.3 -133.2 -12.7 48.2 81.2
Net income (adj) 81.5 122.9 104.0 90.4 91.4
Average number of shares (m) 650.5 648.7 651.7 628.8 590.9
Average number of shares (FD) (m) 654.5 655.8 656.8 631.8 593.9
EPS (reported) (p) 37.9 -20.5 -1.9 7.7 13.7
EPS (adjusted) (p) 12.5 18.9 16.0 14.4 15.5
Source: Company data, Berenberg estimates
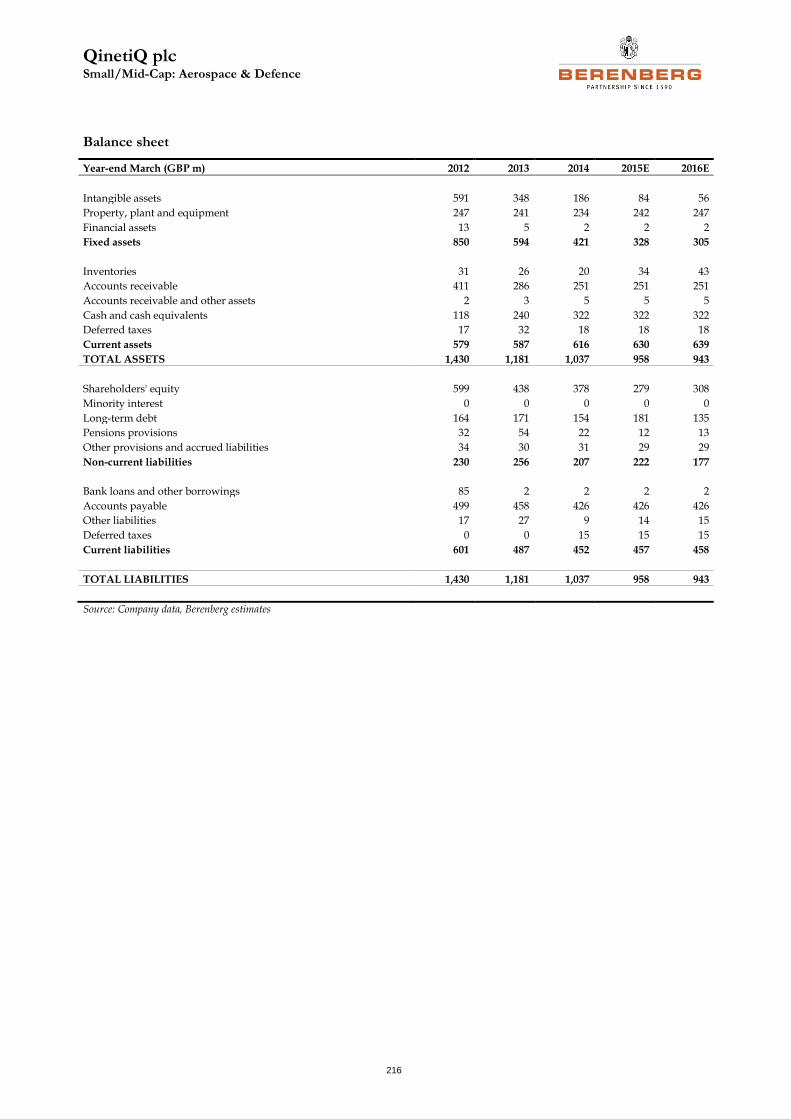
QinetiQ plc Small/Mid-Cap: Aerospace & Defence
216
Balance sheet
Year-end March (GBP m) 2012 2013 2014 2015E 2016E
Intangible assets 591 348 186 84 56
Property, plant and equipment 247 241 234 242 247
Financial assets 13 5 2 2 2
Fixed assets 850 594 421 328 305
Inventories 31 26 20 34 43
Accounts receivable 411 286 251 251 251
Accounts receivable and other assets 2 3 5 5 5
Cash and cash equivalents 118 240 322 322 322
Deferred taxes 17 32 18 18 18
Current assets 579 587 616 630 639
TOTAL ASSETS 1,430 1,181 1,037 958 943
Shareholders' equity 599 438 378 279 308
Minority interest 0 0 0 0 0
Long-term debt 164 171 154 181 135
Pensions provisions 32 54 22 12 13
Other provisions and accrued liabilities 34 30 31 29 29
Non-current liabilities 230 256 207 222 177
Bank loans and other borrowings 85 2 2 2 2
Accounts payable 499 458 426 426 426
Other liabilities 17 27 9 14 15
Deferred taxes 0 0 15 15 15
Current liabilities 601 487 452 457 458
TOTAL LIABILITIES 1,430 1,181 1,037 958 943
Source: Company data, Berenberg estimates
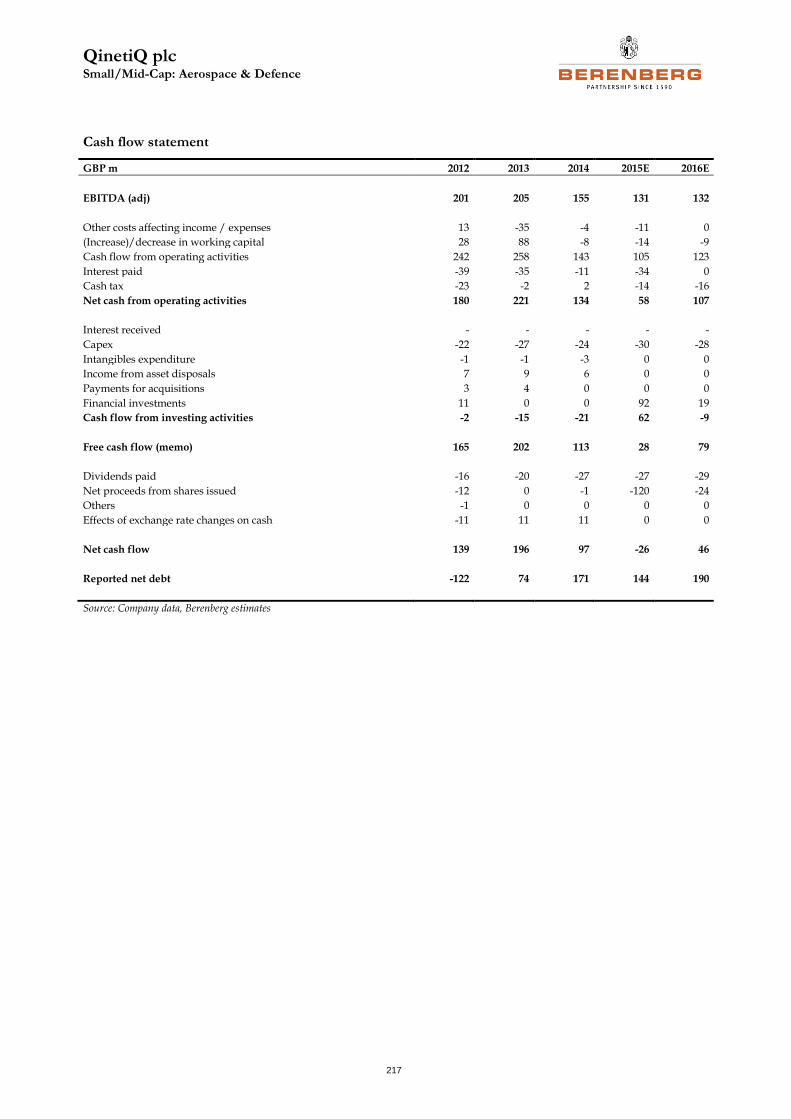
QinetiQ plc Small/Mid-Cap: Aerospace & Defence
217
Cash flow statement
GBP m 2012 2013 2014 2015E 2016E
EBITDA (adj) 201 205 155 131 132
Other costs affecting income / expenses 13 -35 -4 -11 0
(Increase)/decrease in working capital 28 88 -8 -14 -9
Cash flow from operating activities 242 258 143 105 123
Interest paid -39 -35 -11 -34 0
Cash tax -23 -2 2 -14 -16
Net cash from operating activities 180 221 134 58 107
Interest received - - - - -
Capex -22 -27 -24 -30 -28
Intangibles expenditure -1 -1 -3 0 0
Income from asset disposals 7 9 6 0 0
Payments for acquisitions 3 4 0 0 0
Financial investments 11 0 0 92 19
Cash flow from investing activities -2 -15 -21 62 -9
Free cash flow (memo) 165 202 113 28 79
Dividends paid -16 -20 -27 -27 -29
Net proceeds from shares issued -12 0 -1 -120 -24
Others -1 0 0 0 0
Effects of exchange rate changes on cash -11 11 11 0 0
Net cash flow 139 196 97 -26 46
Reported net debt -122 74 171 144 190
Source: Company data, Berenberg estimates
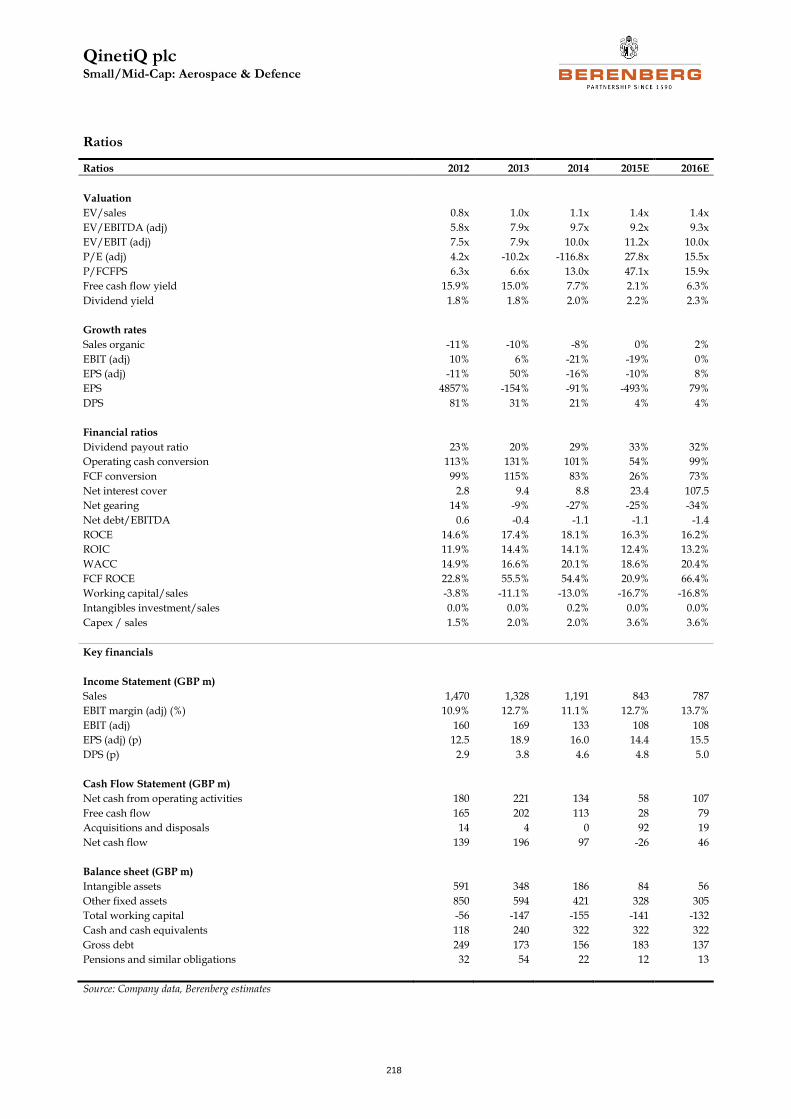
QinetiQ plc Small/Mid-Cap: Aerospace & Defence
218
Ratios
Ratios 2012 2013 2014 2015E 2016E
Valuation
EV/sales 0.8x 1.0x 1.1x 1.4x 1.4x
EV/EBITDA (adj) 5.8x 7.9x 9.7x 9.2x 9.3x
EV/EBIT (adj) 7.5x 7.9x 10.0x 11.2x 10.0x
P/E (adj) 4.2x -10.2x -116.8x 27.8x 15.5x
P/FCFPS 6.3x 6.6x 13.0x 47.1x 15.9x
Free cash flow yield 15.9% 15.0% 7.7% 2.1% 6.3%
Dividend yield 1.8% 1.8% 2.0% 2.2% 2.3%
Growth rates
Sales organic -11% -10% -8% 0% 2%
EBIT (adj) 10% 6% -21% -19% 0%
EPS (adj) -11% 50% -16% -10% 8%
EPS 4857% -154% -91% -493% 79%
DPS 81% 31% 21% 4% 4%
Financial ratios
Dividend payout ratio 23% 20% 29% 33% 32%
Operating cash conversion 113% 131% 101% 54% 99%
FCF conversion 99% 115% 83% 26% 73%
Net interest cover 2.8 9.4 8.8 23.4 107.5
Net gearing 14% -9% -27% -25% -34%
Net debt/EBITDA 0.6 -0.4 -1.1 -1.1 -1.4
ROCE 14.6% 17.4% 18.1% 16.3% 16.2%
ROIC 11.9% 14.4% 14.1% 12.4% 13.2%
WACC 14.9% 16.6% 20.1% 18.6% 20.4%
FCF ROCE 22.8% 55.5% 54.4% 20.9% 66.4%
Working capital/sales -3.8% -11.1% -13.0% -16.7% -16.8%
Intangibles investment/sales 0.0% 0.0% 0.2% 0.0% 0.0%
Capex / sales 1.5% 2.0% 2.0% 3.6% 3.6%
Key financials
Income Statement (GBP m)
Sales 1,470 1,328 1,191 843 787
EBIT margin (adj) (%) 10.9% 12.7% 11.1% 12.7% 13.7%
EBIT (adj) 160 169 133 108 108
EPS (adj) (p) 12.5 18.9 16.0 14.4 15.5
DPS (p) 2.9 3.8 4.6 4.8 5.0
Cash Flow Statement (GBP m)
Net cash from operating activities 180 221 134 58 107
Free cash flow 165 202 113 28 79
Acquisitions and disposals 14 4 0 92 19
Net cash flow 139 196 97 -26 46
Balance sheet (GBP m)
Intangible assets 591 348 186 84 56
Other fixed assets 850 594 421 328 305
Total working capital -56 -147 -155 -141 -132
Cash and cash equivalents 118 240 322 322 322
Gross debt 249 173 156 183 137
Pensions and similar obligations 32 54 22 12 13
Source: Company data, Berenberg estimates
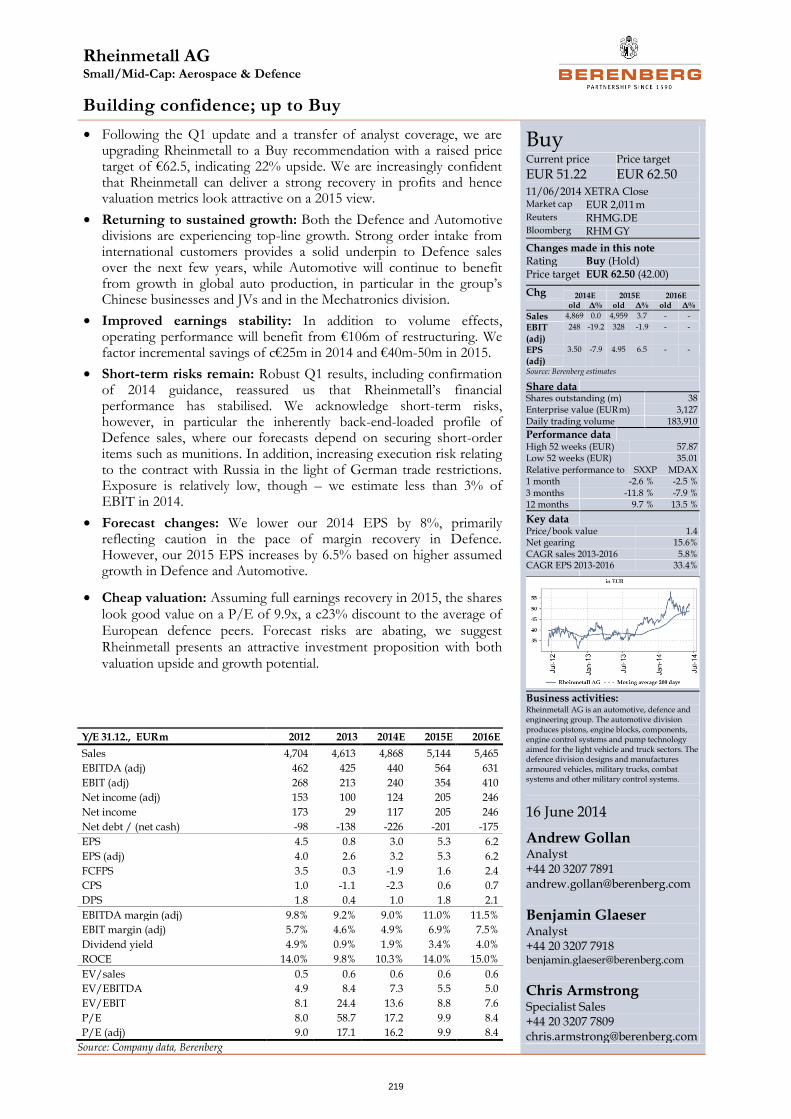
Rheinmetall AG Small/Mid-Cap: Aerospace & Defence
219
Building confidence; up to Buy
• Following the Q1 update and a transfer of analyst coverage, we are upgrading Rheinmetall to a Buy recommendation with a raised price target of €62.5, indicating 22% upside. We are increasingly confident that Rheinmetall can deliver a strong recovery in profits and hence valuation metrics look attractive on a 2015 view.
• Returning to sustained growth: Both the Defence and Automotive divisions are experiencing top-line growth. Strong order intake from international customers provides a solid underpin to Defence sales over the next few years, while Automotive will continue to benefit from growth in global auto production, in particular in the group’s Chinese businesses and JVs and in the Mechatronics division.
• Improved earnings stability: In addition to volume effects, operating performance will benefit from €106m of restructuring. We factor incremental savings of c€25m in 2014 and €40m-50m in 2015.
• Short-term risks remain: Robust Q1 results, including confirmation of 2014 guidance, reassured us that Rheinmetall’s financial performance has stabilised. We acknowledge short-term risks, however, in particular the inherently back-end-loaded profile of Defence sales, where our forecasts depend on securing short-order items such as munitions. In addition, increasing execution risk relating to the contract with Russia in the light of German trade restrictions. Exposure is relatively low, though – we estimate less than 3% of EBIT in 2014.
• Forecast changes: We lower our 2014 EPS by 8%, primarily reflecting caution in the pace of margin recovery in Defence. However, our 2015 EPS increases by 6.5% based on higher assumed growth in Defence and Automotive.
• Cheap valuation: Assuming full earnings recovery in 2015, the shares look good value on a P/E of 9.9x, a c23% discount to the average of European defence peers. Forecast risks are abating, we suggest Rheinmetall presents an attractive investment proposition with both valuation upside and growth potential.
Buy Current price
EUR 51.22 Price target
EUR 62.50 11/06/2014 XETRA Close Market cap EUR 2,011 m Reuters RHMG.DE Bloomberg RHM GY
Changes made in this note Rating Buy (Hold) Price target EUR 62.50 (42.00) Chg 2014E 2015E 2016E
old Δ% old Δ% old Δ%
Sales 4,869 0.0 4,959 3.7 - -
EBIT (adj)
248 -19.2 328 -1.9 - -
EPS (adj)
3.50 -7.9 4.95 6.5 - -
Source: Berenberg estimates
Share data
Shares outstanding (m) 38 Enterprise value (EUR m) 3,127 Daily trading volume 183,910
Performance data
High 52 weeks (EUR) 57.87 Low 52 weeks (EUR) 35.01 Relative performance to SXXP MDAX 1 month -2.6 % -2.5 % 3 months -11.8 % -7.9 % 12 months 9.7 % 13.5 %
Key data
Price/book value 1.4 Net gearing 15.6% CAGR sales 2013-2016 5.8% CAGR EPS 2013-2016 33.4%
Business activities: Rheinmetall AG is an automotive, defence and engineering group. The automotive division produces pistons, engine blocks, components, engine control systems and pump technology aimed for the light vehicle and truck sectors. The defence division designs and manufactures armoured vehicles, military trucks, combat systems and other military control systems.
16 June 2014
Andrew Gollan Analyst +44 20 3207 7891 [email protected]
Benjamin Glaeser
Analyst +44 20 3207 7918 [email protected]
Chris Armstrong
Specialist Sales +44 20 3207 7809 [email protected]
Y/E 31.12., EUR m 2012 2013 2014E 2015E 2016E
Sales 4,704 4,613 4,868 5,144 5,465
EBITDA (adj) 462 425 440 564 631
EBIT (adj) 268 213 240 354 410
Net income (adj) 153 100 124 205 246
Net income 173 29 117 205 246
Net debt / (net cash) -98 -138 -226 -201 -175
EPS 4.5 0.8 3.0 5.3 6.2
EPS (adj) 4.0 2.6 3.2 5.3 6.2
FCFPS 3.5 0.3 -1.9 1.6 2.4
CPS 1.0 -1.1 -2.3 0.6 0.7
DPS 1.8 0.4 1.0 1.8 2.1
EBITDA margin (adj) 9.8% 9.2% 9.0% 11.0% 11.5%
EBIT margin (adj) 5.7% 4.6% 4.9% 6.9% 7.5%
Dividend yield 4.9% 0.9% 1.9% 3.4% 4.0%
ROCE 14.0% 9.8% 10.3% 14.0% 15.0%
EV/sales 0.5 0.6 0.6 0.6 0.6
EV/EBITDA 4.9 8.4 7.3 5.5 5.0
EV/EBIT 8.1 24.4 13.6 8.8 7.6
P/E 8.0 58.7 17.2 9.9 8.4
P/E (adj) 9.0 17.1 16.2 9.9 8.4
Source: Company data, Berenberg
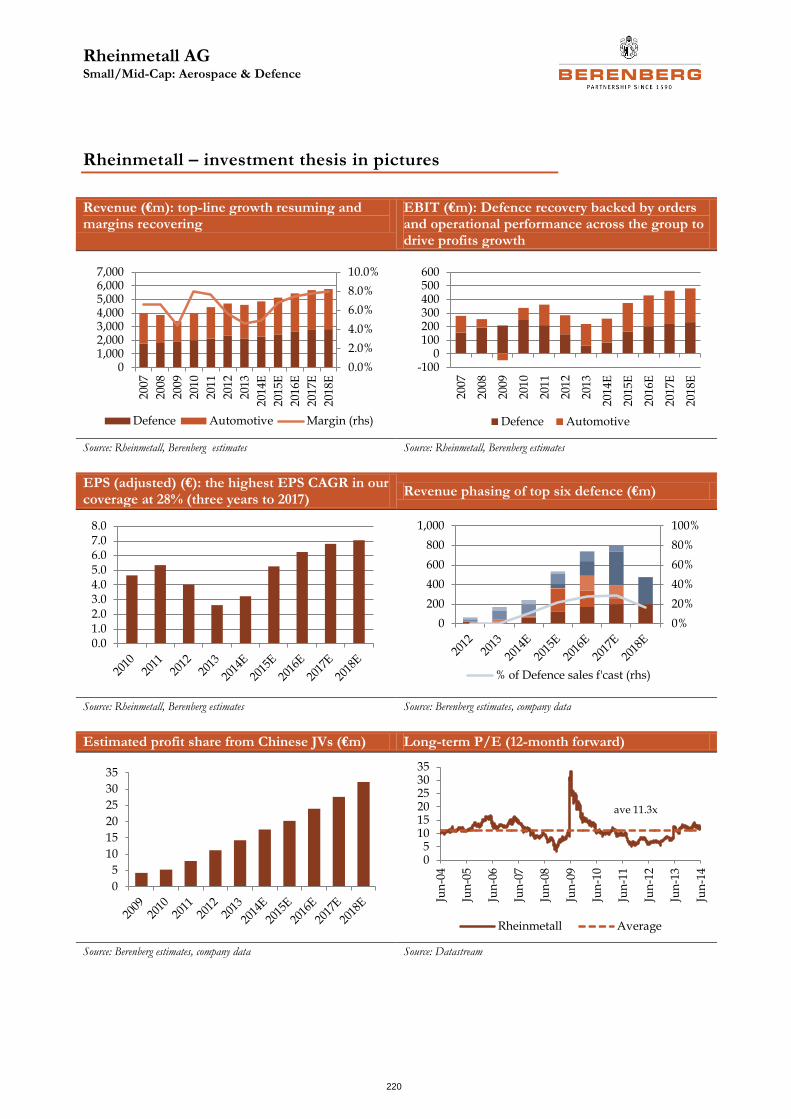
Rheinmetall AG Small/Mid-Cap: Aerospace & Defence
220
Rheinmetall – investment thesis in pictures
Revenue (€m): top-line growth resuming and margins recovering
EBIT (€m): Defence recovery backed by orders and operational performance across the group to drive profits growth
Source: Rheinmetall, Berenberg estimates Source: Rheinmetall, Berenberg estimates
EPS (adjusted) (€): the highest EPS CAGR in our coverage at 28% (three years to 2017)
Revenue phasing of top six defence (€m)
Source: Rheinmetall, Berenberg estimates Source: Berenberg estimates, company data
Estimated profit share from Chinese JVs (€m) Long-term P/E (12-month forward)
Source: Berenberg estimates, company data Source: Datastream
0.0%
2.0%
4.0%
6.0%
8.0%
10.0%
01,0002,0003,0004,0005,0006,0007,000
200
7
200
8
200
9
201
0
201
1
201
2
201
3
201
4E
201
5E
201
6E
201
7E
201
8E
Defence Automotive Margin (rhs)
-1000
100200300400500600
2007
2008
200
9
201
0
201
1
201
2
201
3
201
4E
201
5E
201
6E
201
7E
201
8E
Defence Automotive
0.01.02.03.04.05.06.07.08.0
0%
20%
40%
60%
80%
100%
0
200
400
600
800
1,000
% of Defence sales f'cast (rhs)
0
5
10
15
20
25
30
35
05
101520253035
Jun
-04
Jun
-05
Jun
-06
Jun
-07
Jun
-08
Jun
-09
Jun
-10
Jun
-11
Jun
-12
Jun
-13
Jun
-14
Rheinmetall Average
ave 11.3x
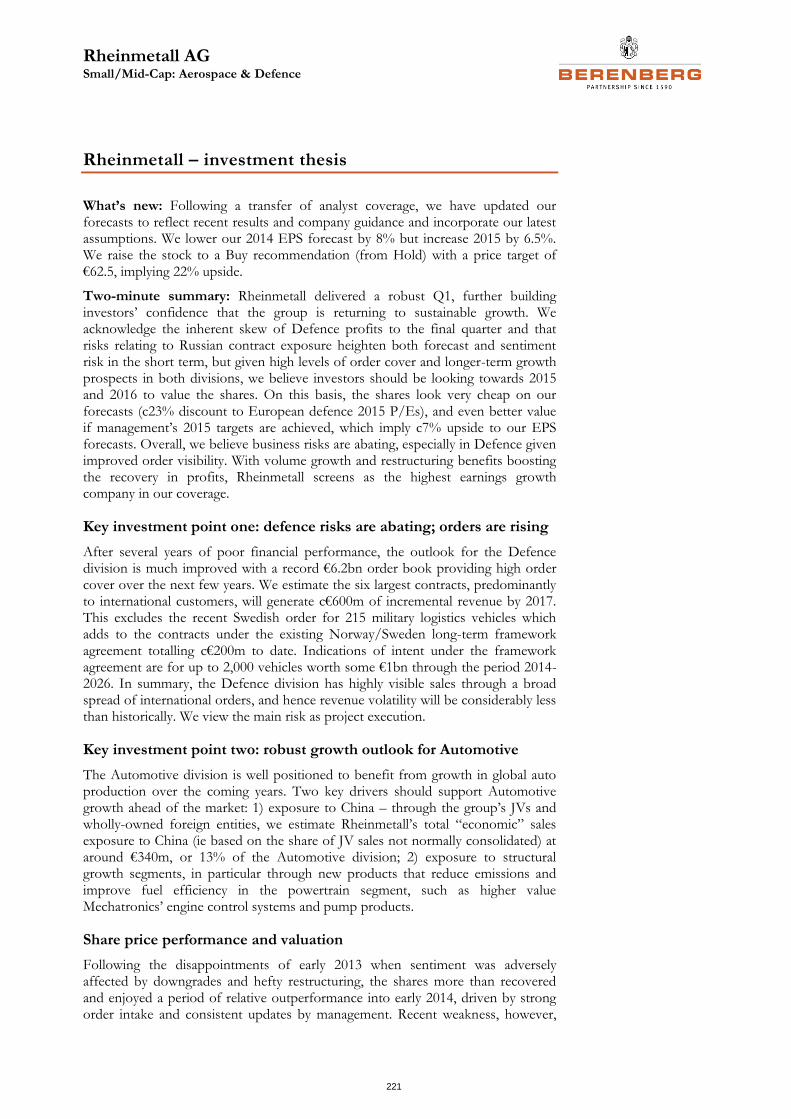
Rheinmetall AG Small/Mid-Cap: Aerospace & Defence
221
Rheinmetall – investment thesis
What’s new: Following a transfer of analyst coverage, we have updated our forecasts to reflect recent results and company guidance and incorporate our latest assumptions. We lower our 2014 EPS forecast by 8% but increase 2015 by 6.5%. We raise the stock to a Buy recommendation (from Hold) with a price target of €62.5, implying 22% upside.
Two-minute summary: Rheinmetall delivered a robust Q1, further building investors’ confidence that the group is returning to sustainable growth. We acknowledge the inherent skew of Defence profits to the final quarter and that risks relating to Russian contract exposure heighten both forecast and sentiment risk in the short term, but given high levels of order cover and longer-term growth prospects in both divisions, we believe investors should be looking towards 2015 and 2016 to value the shares. On this basis, the shares look very cheap on our forecasts (c23% discount to European defence 2015 P/Es), and even better value if management’s 2015 targets are achieved, which imply c7% upside to our EPS forecasts. Overall, we believe business risks are abating, especially in Defence given improved order visibility. With volume growth and restructuring benefits boosting the recovery in profits, Rheinmetall screens as the highest earnings growth company in our coverage.
Key investment point one: defence risks are abating; orders are rising
After several years of poor financial performance, the outlook for the Defence division is much improved with a record €6.2bn order book providing high order cover over the next few years. We estimate the six largest contracts, predominantly to international customers, will generate c€600m of incremental revenue by 2017. This excludes the recent Swedish order for 215 military logistics vehicles which adds to the contracts under the existing Norway/Sweden long-term framework agreement totalling c€200m to date. Indications of intent under the framework agreement are for up to 2,000 vehicles worth some €1bn through the period 2014-2026. In summary, the Defence division has highly visible sales through a broad spread of international orders, and hence revenue volatility will be considerably less than historically. We view the main risk as project execution.
Key investment point two: robust growth outlook for Automotive
The Automotive division is well positioned to benefit from growth in global auto production over the coming years. Two key drivers should support Automotive growth ahead of the market: 1) exposure to China – through the group’s JVs and wholly-owned foreign entities, we estimate Rheinmetall’s total “economic” sales exposure to China (ie based on the share of JV sales not normally consolidated) at around €340m, or 13% of the Automotive division; 2) exposure to structural growth segments, in particular through new products that reduce emissions and improve fuel efficiency in the powertrain segment, such as higher value Mechatronics’ engine control systems and pump products.
Share price performance and valuation
Following the disappointments of early 2013 when sentiment was adversely affected by downgrades and hefty restructuring, the shares more than recovered and enjoyed a period of relative outperformance into early 2014, driven by strong order intake and consistent updates by management. Recent weakness, however,
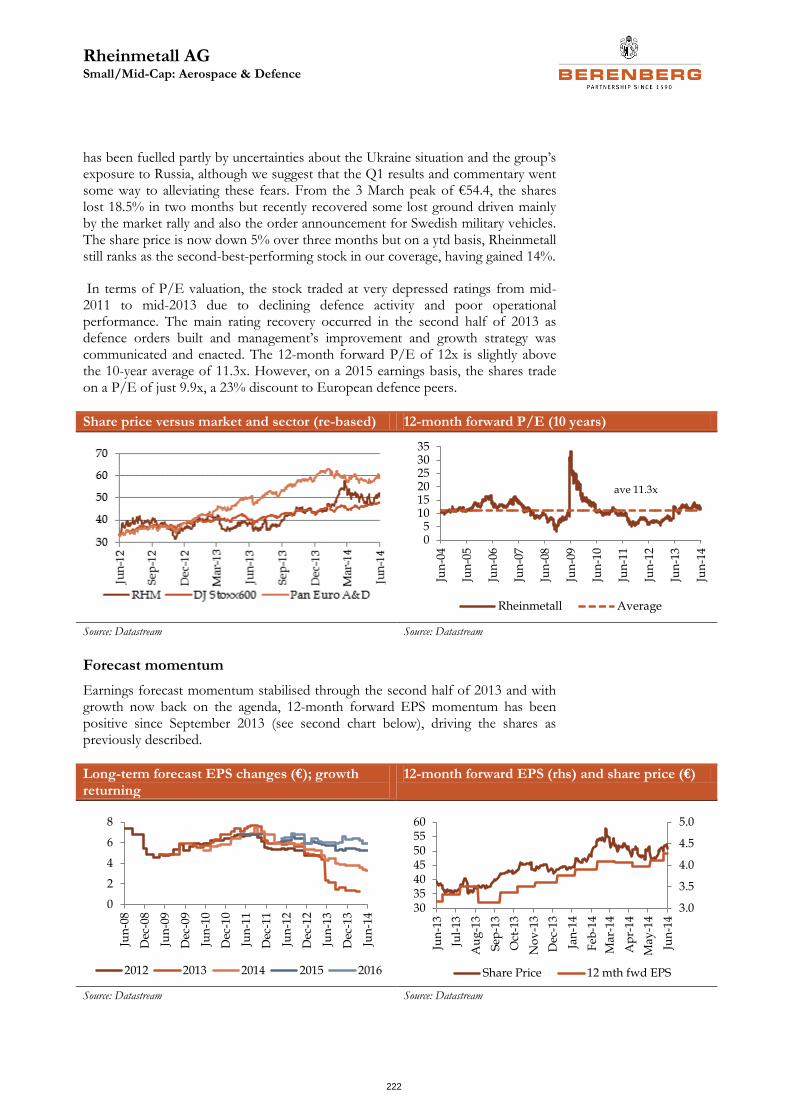
Rheinmetall AG Small/Mid-Cap: Aerospace & Defence
222
has been fuelled partly by uncertainties about the Ukraine situation and the group’s exposure to Russia, although we suggest that the Q1 results and commentary went some way to alleviating these fears. From the 3 March peak of €54.4, the shares lost 18.5% in two months but recently recovered some lost ground driven mainly by the market rally and also the order announcement for Swedish military vehicles. The share price is now down 5% over three months but on a ytd basis, Rheinmetall still ranks as the second-best-performing stock in our coverage, having gained 14%.
In terms of P/E valuation, the stock traded at very depressed ratings from mid-2011 to mid-2013 due to declining defence activity and poor operational performance. The main rating recovery occurred in the second half of 2013 as defence orders built and management’s improvement and growth strategy was communicated and enacted. The 12-month forward P/E of 12x is slightly above the 10-year average of 11.3x. However, on a 2015 earnings basis, the shares trade on a P/E of just 9.9x, a 23% discount to European defence peers.
Share price versus market and sector (re-based) 12-month forward P/E (10 years)
Source: Datastream Source: Datastream
Forecast momentum
Earnings forecast momentum stabilised through the second half of 2013 and with growth now back on the agenda, 12-month forward EPS momentum has been positive since September 2013 (see second chart below), driving the shares as previously described.
Long-term forecast EPS changes (€); growth returning
12-month forward EPS (rhs) and share price (€)
Source: Datastream Source: Datastream
05
101520253035
Jun
-04
Jun
-05
Jun
-06
Jun
-07
Jun
-08
Jun
-09
Jun
-10
Jun
-11
Jun
-12
Jun
-13
Jun
-14
Rheinmetall Average
ave 11.3x
0
2
4
6
8
Jun
-08
Dec
-08
Jun
-09
Dec
-09
Jun
-10
Dec
-10
Jun
-11
Dec
-11
Jun
-12
Dec
-12
Jun
-13
Dec
-13
Jun
-14
2012 2013 2014 2015 2016
3.0
3.5
4.0
4.5
5.0
30354045505560
Jun
-13
Jul-
13
Au
g-1
3
Sep
-13
Oct
-13
No
v-1
3
Dec
-13
Jan
-14
Feb
-14
Mar
-14
Ap
r-1
4
May
-14
Jun
-14
Share Price 12 mth fwd EPS
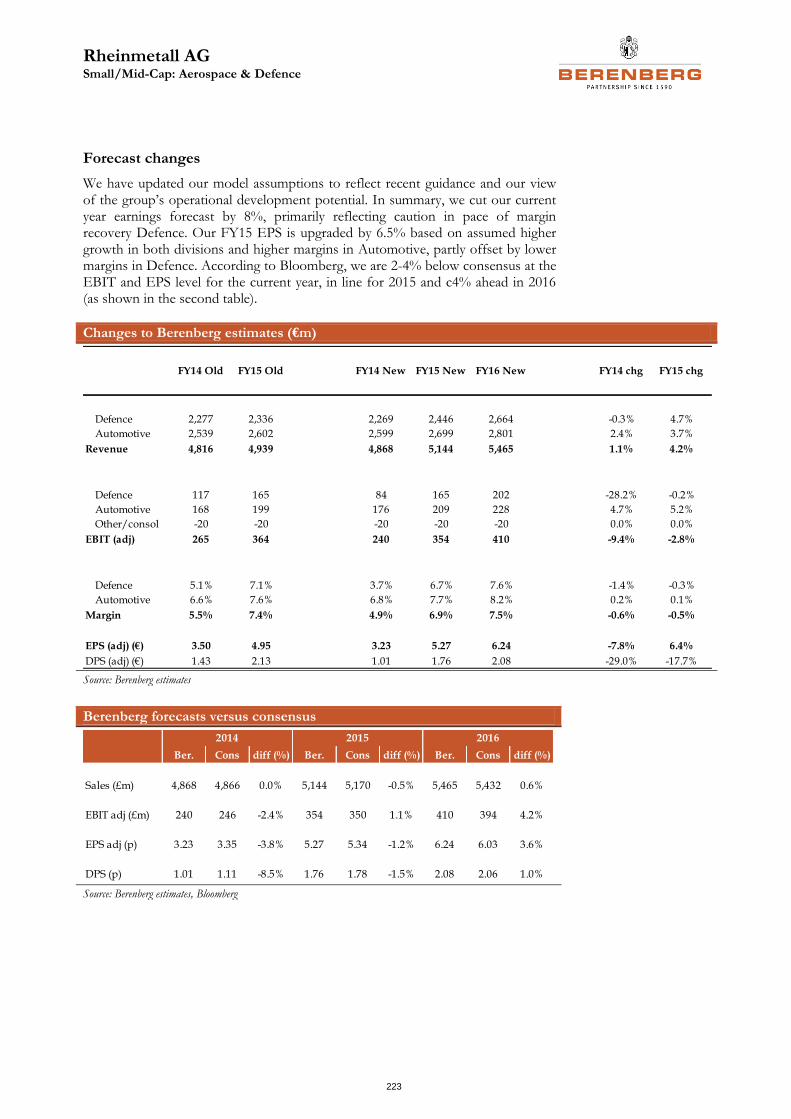
Rheinmetall AG Small/Mid-Cap: Aerospace & Defence
223
Forecast changes
We have updated our model assumptions to reflect recent guidance and our view of the group’s operational development potential. In summary, we cut our current year earnings forecast by 8%, primarily reflecting caution in pace of margin recovery Defence. Our FY15 EPS is upgraded by 6.5% based on assumed higher growth in both divisions and higher margins in Automotive, partly offset by lower margins in Defence. According to Bloomberg, we are 2-4% below consensus at the EBIT and EPS level for the current year, in line for 2015 and c4% ahead in 2016 (as shown in the second table).
Changes to Berenberg estimates (€m)
Source: Berenberg estimates
Berenberg forecasts versus consensus
Source: Berenberg estimates, Bloomberg
FY14 Old FY15 Old FY14 New FY15 New FY16 New FY14 chg FY15 chg
Defence 2,277 2,336 2,269 2,446 2,664 -0.3% 4.7%
Automotive 2,539 2,602 2,599 2,699 2,801 2.4% 3.7%
Revenue 4,816 4,939 4,868 5,144 5,465 1.1% 4.2%
Defence 117 165 84 165 202 -28.2% -0.2%
Automotive 168 199 176 209 228 4.7% 5.2%
Other/consol -20 -20 -20 -20 -20 0.0% 0.0%
EBIT (adj) 265 364 240 354 410 -9.4% -2.8%
Defence 5.1% 7.1% 3.7% 6.7% 7.6% -1.4% -0.3%
Automotive 6.6% 7.6% 6.8% 7.7% 8.2% 0.2% 0.1%
Margin 5.5% 7.4% 4.9% 6.9% 7.5% -0.6% -0.5%
EPS (adj) (€) 3.50 4.95 3.23 5.27 6.24 -7.8% 6.4%
DPS (adj) (€) 1.43 2.13 1.01 1.76 2.08 -29.0% -17.7%
Ber. Cons diff (%) Ber. Cons diff (%) Ber. Cons diff (%)
Sales (£m) 4,868 4,866 0.0% 5,144 5,170 -0.5% 5,465 5,432 0.6%
EBIT adj (£m) 240 246 -2.4% 354 350 1.1% 410 394 4.2%
EPS adj (p) 3.23 3.35 -3.8% 5.27 5.34 -1.2% 6.24 6.03 3.6%
DPS (p) 1.01 1.11 -8.5% 1.76 1.78 -1.5% 2.08 2.06 1.0%
2014 20162015
Rheinmetall AG Small/Mid-Cap: Aerospace & Defence
224
Recent results highlights – Q114 (May)
Order intake increased by 34% yoy driven by new defence contracts, resulting in a record backlog of £6.7bn.
Revenues increased by 12% yoy (Defence: +14%; Automotive: +11%).
Adjusted EBIT improved by £15m, to just above break-even.
High free cash outflow of €472m was predominantly due to the build-up of working capital ahead of new contract ramp-up.
The 2014 outlook was confirmed (sales: €4.8bn-4.9bn; EBIT: €230m-250m).
Rheinmetall AG Small/Mid-Cap: Aerospace & Defence
225
Investment risks and concerns
• Q1 performance leaves a lot to do, especially in Defence: Both the Defence and Automotive divisions delivered strong top-line growth in Q1, albeit against weak comparators, but the €15m yoy improvement in group profit (to break-even) was modest in comparison. Notwithstanding the traditional second-half weighting in defence, a strongly improving operating performance is required to meet guidance, especially in the Defence segment where a Q1 operational loss of €42m compares to full-year guidance of €85m-95m profit. We suggest risk is mitigated by higher-than-normal order cover in the traditionally short-order areas such as munitions, as well as the increasingly positive impact of restructuring on operational performance through the second half.
• Russian exposure: We comment on this in more detail in the Defence section, highlighting potential execution risks if the German government fully restricts defence trade and refuses to permit contract delivery. If the contract is cancelled with no compensation (the worst case), we estimate a 2.6% profit exposure in the current year which fades to a much lower level in 2015.
• Contract export licences: The German government is reportedly planning on taking a more restrictive stance on its approach to awarding defence export licences, particularly in the case of countries that it considers to be oppressive. Rheinmetall’s current orders in the backlog are unaffected because licences are already in place; however, a stricter licensing environment could disadvantage the group in its ability to compete/bid for future export contracts.
• High cash outflows: A €472m free cash outflow in H1 was materially below consensus expectations, caused mainly by higher-than-expected investment in working capital on large defence contracts. Rheinmetall does not give cash guidance, although we estimate a substantial reversal through the second half of the year, resulting in a full-year free cash outflow of c€70m.
• De-rating on profit miss: Given Rheinmetall’s historical record of earnings volatility, the valuation could be susceptible to a disproportionate de-rating if the company fails to achieve guidance/expectations. In mitigation, we think the valuation is far from fully pricing in forecast potential in the outer years which should therefore limit downside risks in this respect.
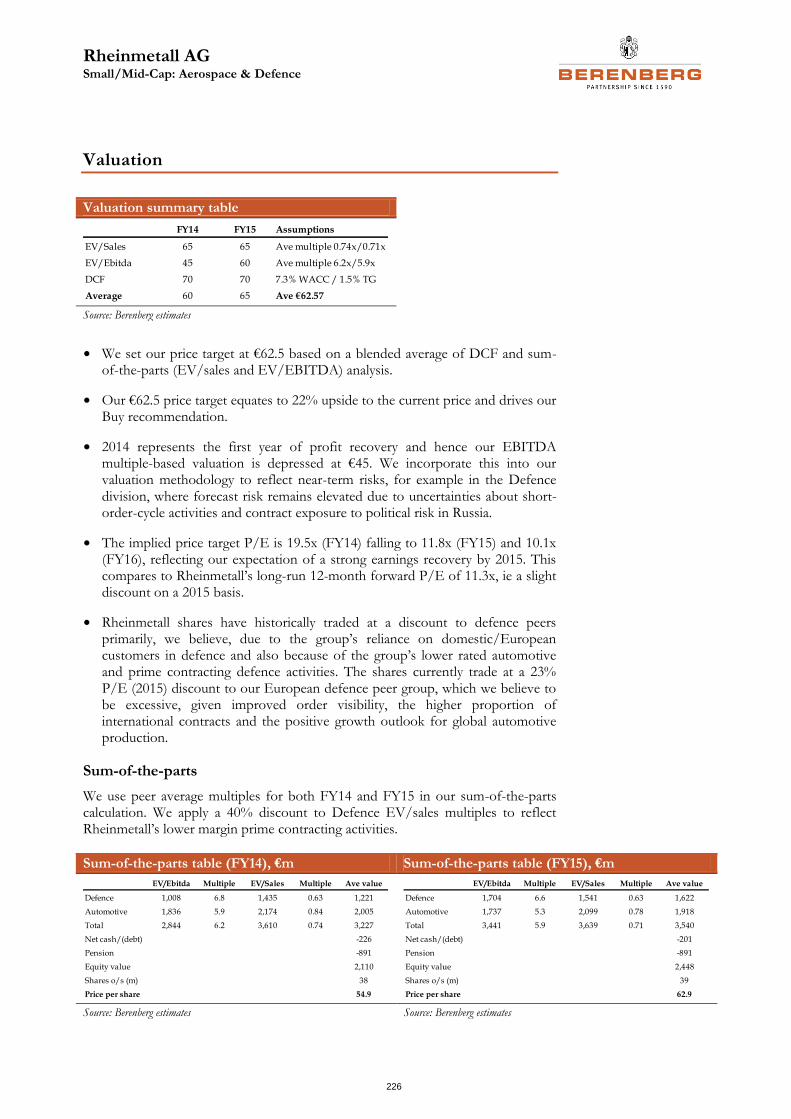
Rheinmetall AG Small/Mid-Cap: Aerospace & Defence
226
Valuation
Valuation summary table
Source: Berenberg estimates
• We set our price target at €62.5 based on a blended average of DCF and sum-of-the-parts (EV/sales and EV/EBITDA) analysis.
• Our €62.5 price target equates to 22% upside to the current price and drives our Buy recommendation.
• 2014 represents the first year of profit recovery and hence our EBITDA multiple-based valuation is depressed at €45. We incorporate this into our valuation methodology to reflect near-term risks, for example in the Defence division, where forecast risk remains elevated due to uncertainties about short-order-cycle activities and contract exposure to political risk in Russia.
• The implied price target P/E is 19.5x (FY14) falling to 11.8x (FY15) and 10.1x (FY16), reflecting our expectation of a strong earnings recovery by 2015. This compares to Rheinmetall’s long-run 12-month forward P/E of 11.3x, ie a slight discount on a 2015 basis.
• Rheinmetall shares have historically traded at a discount to defence peers primarily, we believe, due to the group’s reliance on domestic/European customers in defence and also because of the group’s lower rated automotive and prime contracting defence activities. The shares currently trade at a 23% P/E (2015) discount to our European defence peer group, which we believe to be excessive, given improved order visibility, the higher proportion of international contracts and the positive growth outlook for global automotive production.
Sum-of-the-parts
We use peer average multiples for both FY14 and FY15 in our sum-of-the-parts calculation. We apply a 40% discount to Defence EV/sales multiples to reflect Rheinmetall’s lower margin prime contracting activities.
Sum-of-the-parts table (FY14), €m Sum-of-the-parts table (FY15), €m
Source: Berenberg estimates Source: Berenberg estimates
FY14 FY15 Assumptions
EV/Sales 65 65 Ave multiple 0.74x/0.71x
EV/Ebitda 45 60 Ave multiple 6.2x/5.9x
DCF 70 70 7.3% WACC / 1.5% TG
Average 60 65 Ave €62.57
EV/Ebitda Multiple EV/Sales Multiple Ave value
Defence 1,008 6.8 1,435 0.63 1,221
Automotive 1,836 5.9 2,174 0.84 2,005
Total 2,844 6.2 3,610 0.74 3,227
Net cash/(debt) -226
Pension -891
Equity value 2,110
Shares o/s (m) 38
Price per share 54.9
EV/Ebitda Multiple EV/Sales Multiple Ave value
Defence 1,704 6.6 1,541 0.63 1,622
Automotive 1,737 5.3 2,099 0.78 1,918
Total 3,441 5.9 3,639 0.71 3,540
Net cash/(debt) -201
Pension -891
Equity value 2,448
Shares o/s (m) 39
Price per share 62.9
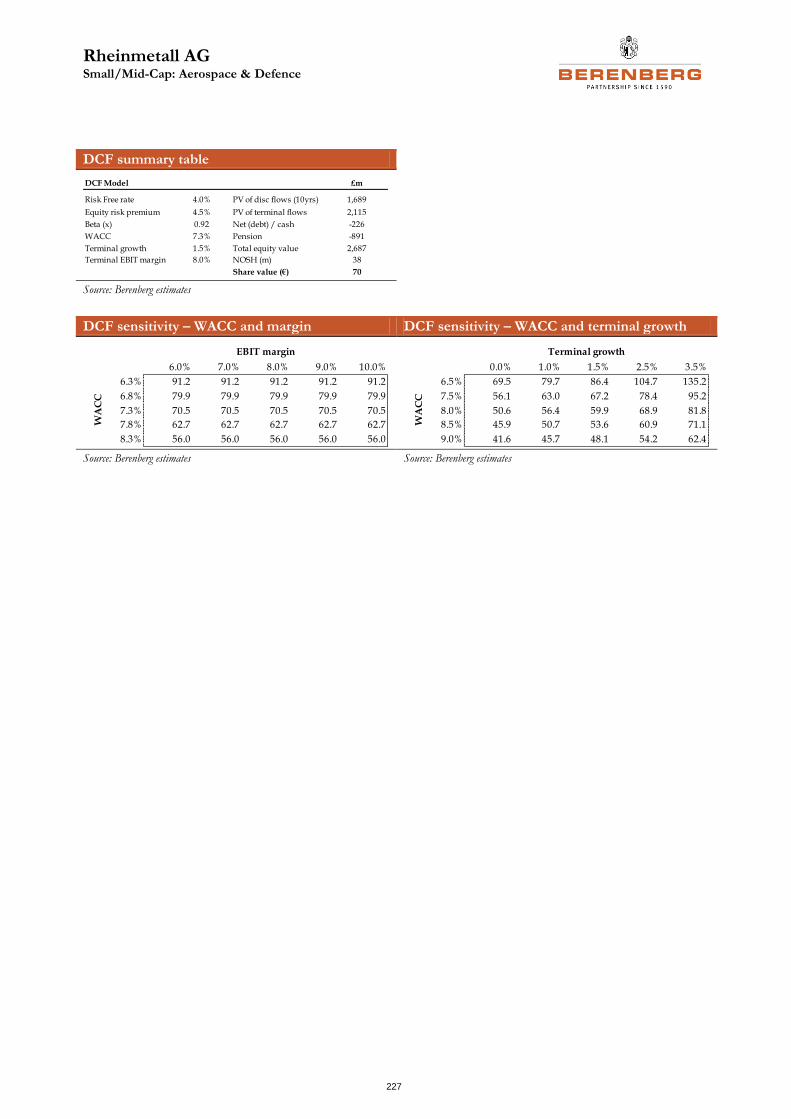
Rheinmetall AG Small/Mid-Cap: Aerospace & Defence
227
DCF summary table
Source: Berenberg estimates
DCF sensitivity – WACC and margin DCF sensitivity – WACC and terminal growth
Source: Berenberg estimates Source: Berenberg estimates
DCF Model £m
Risk Free rate 4.0% PV of disc flows (10yrs) 1,689
Equity risk premium 4.5% PV of terminal flows 2,115
Beta (x) 0.92 Net (debt) / cash -226
WACC 7.3% Pension -891
Terminal growth 1.5% Total equity value 2,687
Terminal EBIT margin 8.0% NOSH (m) 38
Share value (€) 70
70 6.0% 7.0% 8.0% 9.0% 10.0%
6.3% 91.2 91.2 91.2 91.2 91.2
6.8% 79.9 79.9 79.9 79.9 79.9
7.3% 70.5 70.5 70.5 70.5 70.5
7.8% 62.7 62.7 62.7 62.7 62.7
8.3% 56.0 56.0 56.0 56.0 56.0
EBIT margin
WA
CC
70 0.0% 1.0% 1.5% 2.5% 3.5%
6.5% 69.5 79.7 86.4 104.7 135.2
7.5% 56.1 63.0 67.2 78.4 95.2
8.0% 50.6 56.4 59.9 68.9 81.8
8.5% 45.9 50.7 53.6 60.9 71.1
9.0% 41.6 45.7 48.1 54.2 62.4
Terminal growth
WA
CC
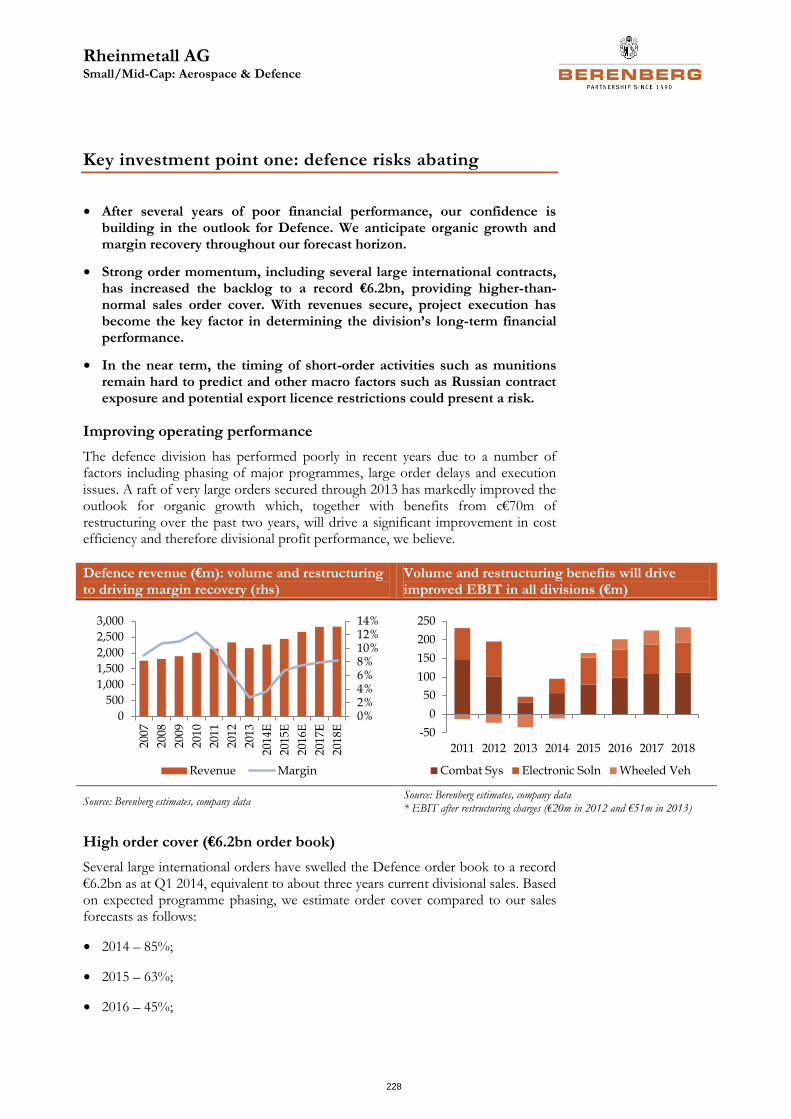
Rheinmetall AG Small/Mid-Cap: Aerospace & Defence
228
Key investment point one: defence risks abating
• After several years of poor financial performance, our confidence is building in the outlook for Defence. We anticipate organic growth and margin recovery throughout our forecast horizon.
• Strong order momentum, including several large international contracts, has increased the backlog to a record €6.2bn, providing higher-than-normal sales order cover. With revenues secure, project execution has become the key factor in determining the division’s long-term financial performance.
• In the near term, the timing of short-order activities such as munitions remain hard to predict and other macro factors such as Russian contract exposure and potential export licence restrictions could present a risk.
Improving operating performance
The defence division has performed poorly in recent years due to a number of factors including phasing of major programmes, large order delays and execution issues. A raft of very large orders secured through 2013 has markedly improved the outlook for organic growth which, together with benefits from c€70m of restructuring over the past two years, will drive a significant improvement in cost efficiency and therefore divisional profit performance, we believe.
Defence revenue (€m): volume and restructuring to driving margin recovery (rhs)
Volume and restructuring benefits will drive improved EBIT in all divisions (€m)
Source: Berenberg estimates, company data Source: Berenberg estimates, company data * EBIT after restructuring charges (€20m in 2012 and €51m in 2013)
High order cover (€6.2bn order book)
Several large international orders have swelled the Defence order book to a record €6.2bn as at Q1 2014, equivalent to about three years current divisional sales. Based on expected programme phasing, we estimate order cover compared to our sales forecasts as follows:
• 2014 – 85%;
• 2015 – 63%;
• 2016 – 45%;
0%2%4%6%8%10%12%14%
0
500
1,000
1,500
2,000
2,500
3,000
2007
200
8
200
9
201
0
201
1
201
2
201
3
201
4E
201
5E
201
6E
201
7E
201
8E
Revenue Margin
-50
0
50
100
150
200
250
2011 2012 2013 2014 2015 2016 2017 2018
Combat Sys Electronic Soln Wheeled Veh
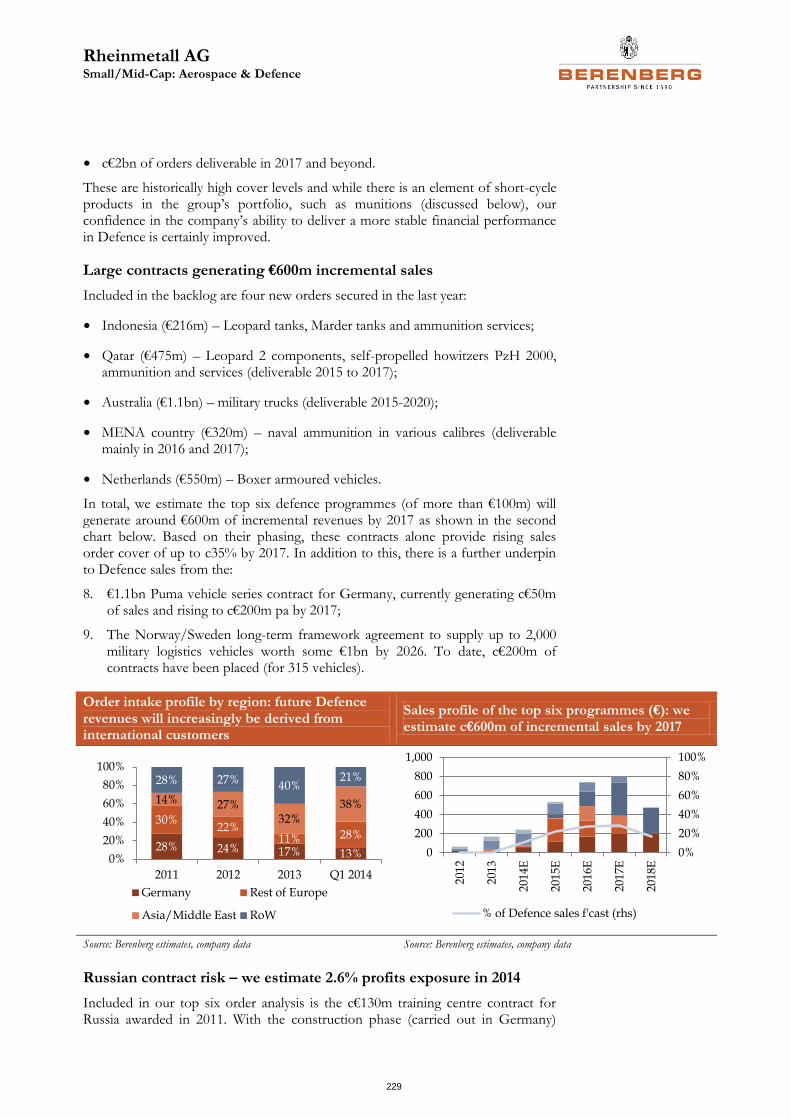
Rheinmetall AG Small/Mid-Cap: Aerospace & Defence
229
• c€2bn of orders deliverable in 2017 and beyond.
These are historically high cover levels and while there is an element of short-cycle products in the group’s portfolio, such as munitions (discussed below), our confidence in the company’s ability to deliver a more stable financial performance in Defence is certainly improved.
Large contracts generating €600m incremental sales
Included in the backlog are four new orders secured in the last year:
• Indonesia (€216m) – Leopard tanks, Marder tanks and ammunition services;
• Qatar (€475m) – Leopard 2 components, self-propelled howitzers PzH 2000, ammunition and services (deliverable 2015 to 2017);
• Australia (€1.1bn) – military trucks (deliverable 2015-2020);
• MENA country (€320m) – naval ammunition in various calibres (deliverable mainly in 2016 and 2017);
• Netherlands (€550m) – Boxer armoured vehicles.
In total, we estimate the top six defence programmes (of more than €100m) will generate around €600m of incremental revenues by 2017 as shown in the second chart below. Based on their phasing, these contracts alone provide rising sales order cover of up to c35% by 2017. In addition to this, there is a further underpin to Defence sales from the:
8. €1.1bn Puma vehicle series contract for Germany, currently generating c€50m of sales and rising to c€200m pa by 2017;
9. The Norway/Sweden long-term framework agreement to supply up to 2,000 military logistics vehicles worth some €1bn by 2026. To date, c€200m of contracts have been placed (for 315 vehicles).
Order intake profile by region: future Defence revenues will increasingly be derived from international customers
Sales profile of the top six programmes (€): we estimate c€600m of incremental sales by 2017
Source: Berenberg estimates, company data Source: Berenberg estimates, company data
Russian contract risk – we estimate 2.6% profits exposure in 2014
Included in our top six order analysis is the c€130m training centre contract for Russia awarded in 2011. With the construction phase (carried out in Germany)
28% 24% 17% 13%
30%22%
11% 28%
14% 27%32%
38%
28% 27% 40%21%
0%
20%
40%
60%
80%
100%
2011 2012 2013 Q1 2014
Germany Rest of Europe
Asia/Middle East RoW
0%
20%
40%
60%
80%
100%
0
200
400
600
800
1,000
201
2
201
3
201
4E
201
5E
201
6E
201
7E
201
8E
% of Defence sales f'cast (rhs)
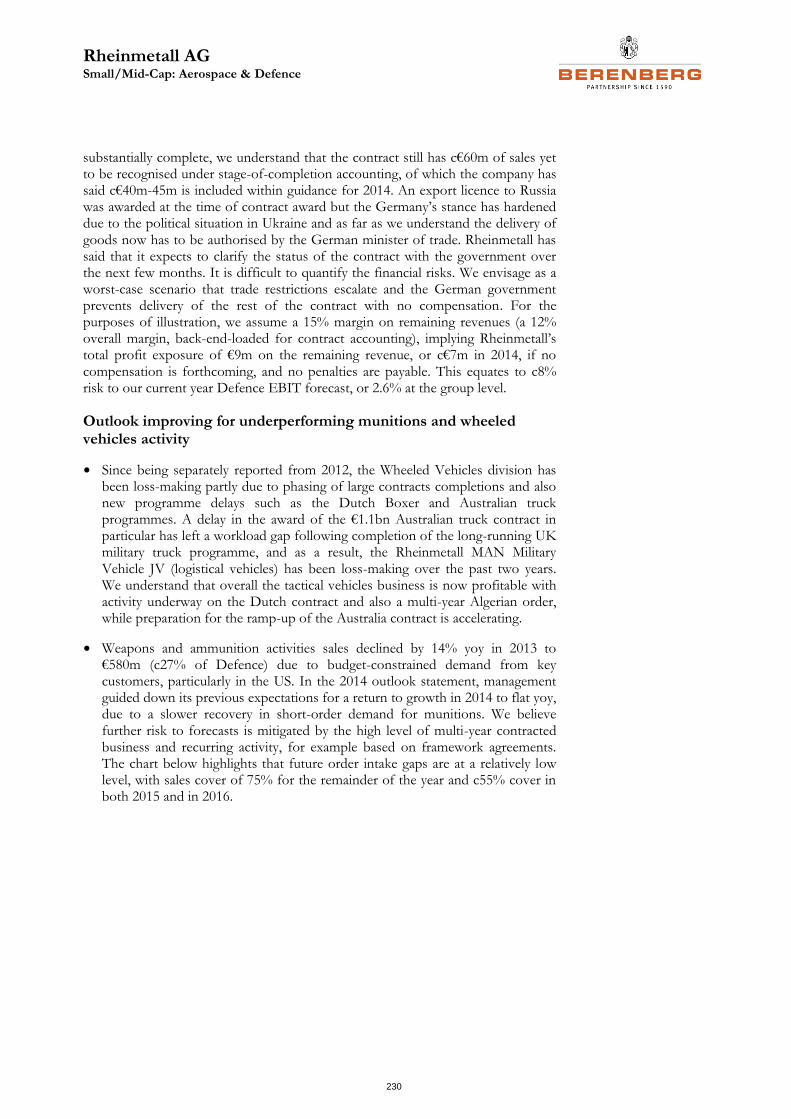
Rheinmetall AG Small/Mid-Cap: Aerospace & Defence
230
substantially complete, we understand that the contract still has c€60m of sales yet to be recognised under stage-of-completion accounting, of which the company has said c€40m-45m is included within guidance for 2014. An export licence to Russia was awarded at the time of contract award but the Germany’s stance has hardened due to the political situation in Ukraine and as far as we understand the delivery of goods now has to be authorised by the German minister of trade. Rheinmetall has said that it expects to clarify the status of the contract with the government over the next few months. It is difficult to quantify the financial risks. We envisage as a worst-case scenario that trade restrictions escalate and the German government prevents delivery of the rest of the contract with no compensation. For the purposes of illustration, we assume a 15% margin on remaining revenues (a 12% overall margin, back-end-loaded for contract accounting), implying Rheinmetall’s total profit exposure of €9m on the remaining revenue, or c€7m in 2014, if no compensation is forthcoming, and no penalties are payable. This equates to c8% risk to our current year Defence EBIT forecast, or 2.6% at the group level.
Outlook improving for underperforming munitions and wheeled vehicles activity
• Since being separately reported from 2012, the Wheeled Vehicles division has been loss-making partly due to phasing of large contracts completions and also new programme delays such as the Dutch Boxer and Australian truck programmes. A delay in the award of the €1.1bn Australian truck contract in particular has left a workload gap following completion of the long-running UK military truck programme, and as a result, the Rheinmetall MAN Military Vehicle JV (logistical vehicles) has been loss-making over the past two years. We understand that overall the tactical vehicles business is now profitable with activity underway on the Dutch contract and also a multi-year Algerian order, while preparation for the ramp-up of the Australia contract is accelerating.
• Weapons and ammunition activities sales declined by 14% yoy in 2013 to €580m (c27% of Defence) due to budget-constrained demand from key customers, particularly in the US. In the 2014 outlook statement, management guided down its previous expectations for a return to growth in 2014 to flat yoy, due to a slower recovery in short-order demand for munitions. We believe further risk to forecasts is mitigated by the high level of multi-year contracted business and recurring activity, for example based on framework agreements. The chart below highlights that future order intake gaps are at a relatively low level, with sales cover of 75% for the remainder of the year and c55% cover in both 2015 and in 2016.
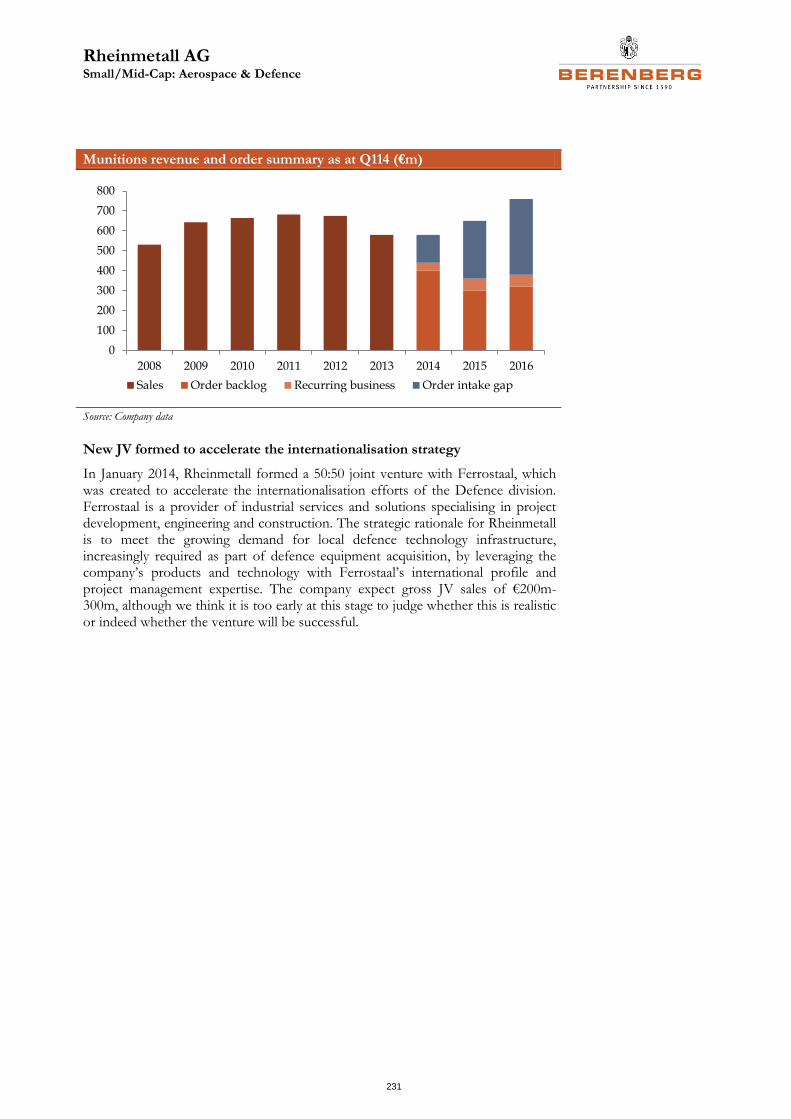
Rheinmetall AG Small/Mid-Cap: Aerospace & Defence
231
Munitions revenue and order summary as at Q114 (€m)
Source: Company data
New JV formed to accelerate the internationalisation strategy
In January 2014, Rheinmetall formed a 50:50 joint venture with Ferrostaal, which was created to accelerate the internationalisation efforts of the Defence division. Ferrostaal is a provider of industrial services and solutions specialising in project development, engineering and construction. The strategic rationale for Rheinmetall is to meet the growing demand for local defence technology infrastructure, increasingly required as part of defence equipment acquisition, by leveraging the company’s products and technology with Ferrostaal’s international profile and project management expertise. The company expect gross JV sales of €200m-300m, although we think it is too early at this stage to judge whether this is realistic or indeed whether the venture will be successful.
0
100
200
300
400
500
600
700
800
2008 2009 2010 2011 2012 2013 2014 2015 2016
Sales Order backlog Recurring business Order intake gap
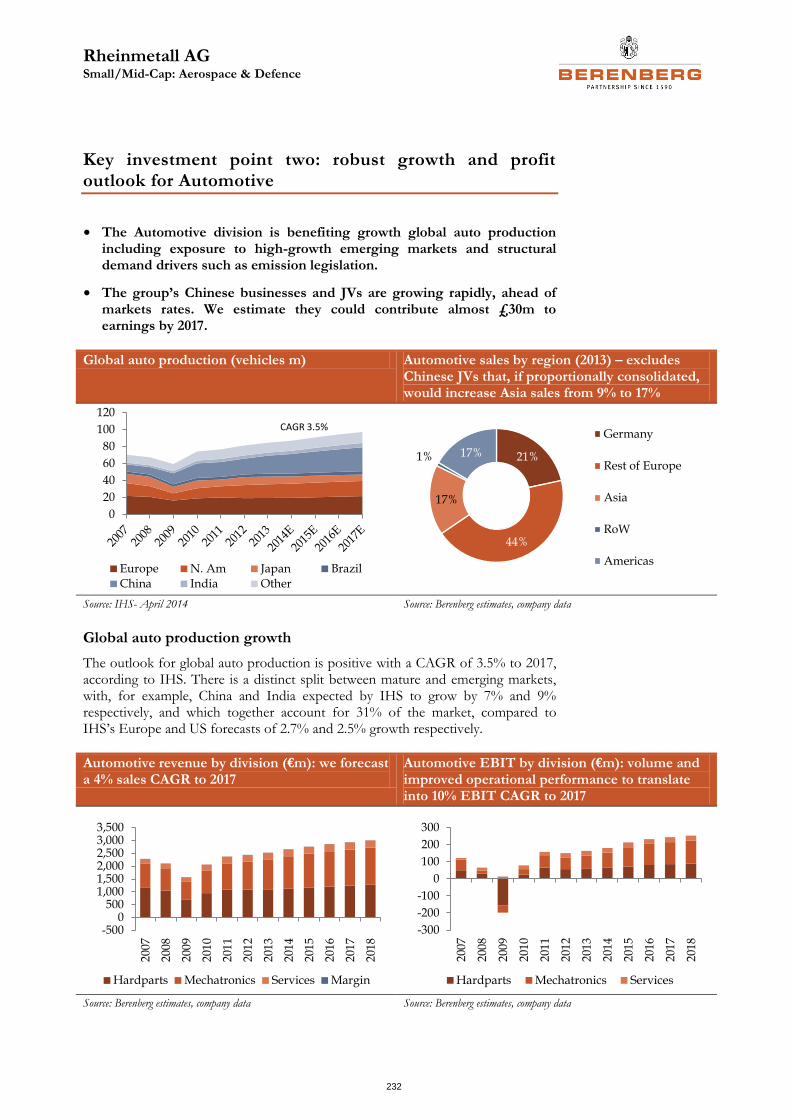
Rheinmetall AG Small/Mid-Cap: Aerospace & Defence
232
Key investment point two: robust growth and profit outlook for Automotive
• The Automotive division is benefiting growth global auto production including exposure to high-growth emerging markets and structural demand drivers such as emission legislation.
• The group’s Chinese businesses and JVs are growing rapidly, ahead of markets rates. We estimate they could contribute almost £30m to earnings by 2017.
Global auto production (vehicles m) Automotive sales by region (2013) – excludes Chinese JVs that, if proportionally consolidated, would increase Asia sales from 9% to 17%
Source: IHS- April 2014 Source: Berenberg estimates, company data
Global auto production growth
The outlook for global auto production is positive with a CAGR of 3.5% to 2017, according to IHS. There is a distinct split between mature and emerging markets, with, for example, China and India expected by IHS to grow by 7% and 9% respectively, and which together account for 31% of the market, compared to IHS’s Europe and US forecasts of 2.7% and 2.5% growth respectively.
Automotive revenue by division (€m): we forecast a 4% sales CAGR to 2017
Automotive EBIT by division (€m): volume and improved operational performance to translate into 10% EBIT CAGR to 2017
Source: Berenberg estimates, company data Source: Berenberg estimates, company data
0
20
40
60
80
100
120
Europe N. Am Japan BrazilChina India Other
CAGR 3.5%
21%
44%
17%
1% 17%
Germany
Rest of Europe
Asia
RoW
Americas
-5000
5001,0001,5002,0002,5003,0003,500
200
7
200
8
200
9
201
0
201
1
201
2
201
3
2014
2015
2016
201
7
201
8
Hardparts Mechatronics Services Margin
-300
-200
-100
0
100
200
300
200
7
200
8
200
9
201
0
201
1
201
2
201
3
201
4
201
5
201
6
201
7
2018
Hardparts Mechatronics Services
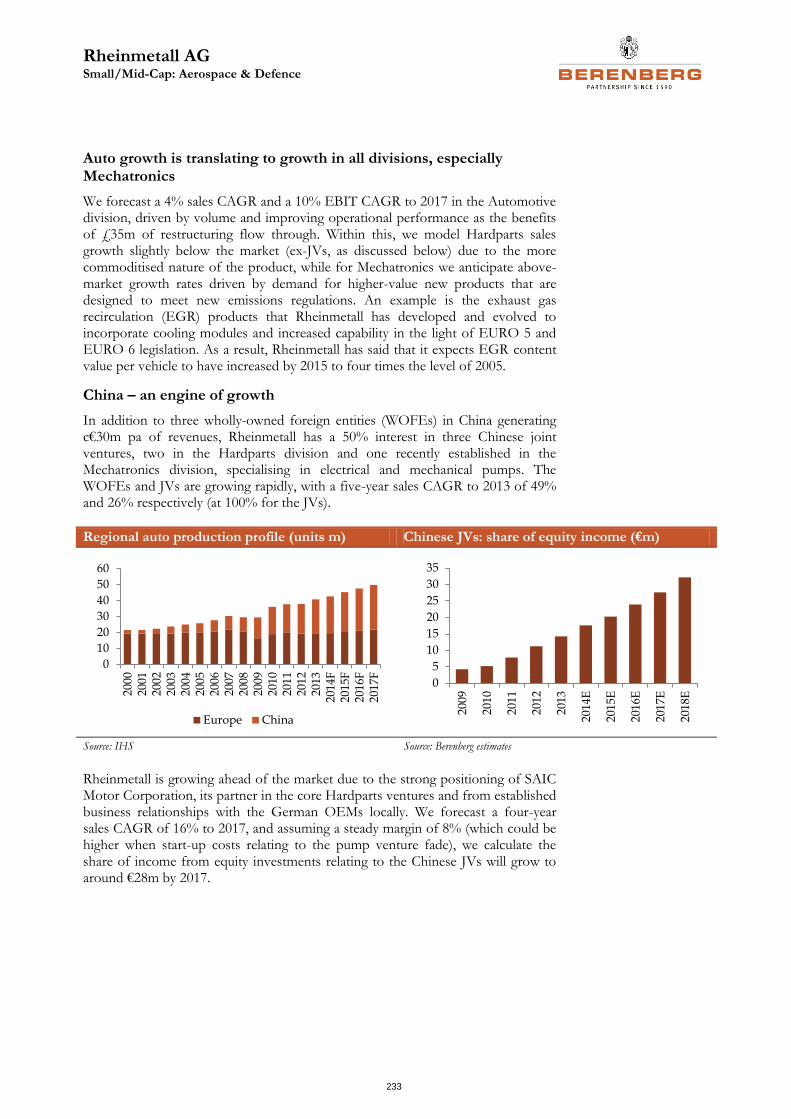
Rheinmetall AG Small/Mid-Cap: Aerospace & Defence
233
Auto growth is translating to growth in all divisions, especially Mechatronics
We forecast a 4% sales CAGR and a 10% EBIT CAGR to 2017 in the Automotive division, driven by volume and improving operational performance as the benefits of £35m of restructuring flow through. Within this, we model Hardparts sales growth slightly below the market (ex-JVs, as discussed below) due to the more commoditised nature of the product, while for Mechatronics we anticipate above-market growth rates driven by demand for higher-value new products that are designed to meet new emissions regulations. An example is the exhaust gas recirculation (EGR) products that Rheinmetall has developed and evolved to incorporate cooling modules and increased capability in the light of EURO 5 and EURO 6 legislation. As a result, Rheinmetall has said that it expects EGR content value per vehicle to have increased by 2015 to four times the level of 2005.
China – an engine of growth
In addition to three wholly-owned foreign entities (WOFEs) in China generating c€30m pa of revenues, Rheinmetall has a 50% interest in three Chinese joint ventures, two in the Hardparts division and one recently established in the Mechatronics division, specialising in electrical and mechanical pumps. The WOFEs and JVs are growing rapidly, with a five-year sales CAGR to 2013 of 49% and 26% respectively (at 100% for the JVs).
Regional auto production profile (units m) Chinese JVs: share of equity income (€m)
Source: IHS Source: Berenberg estimates
Rheinmetall is growing ahead of the market due to the strong positioning of SAIC Motor Corporation, its partner in the core Hardparts ventures and from established business relationships with the German OEMs locally. We forecast a four-year sales CAGR of 16% to 2017, and assuming a steady margin of 8% (which could be higher when start-up costs relating to the pump venture fade), we calculate the share of income from equity investments relating to the Chinese JVs will grow to around €28m by 2017.
0
10
20
30
40
50
60
2000
2001
2002
2003
2004
2005
2006
2007
2008
2009
2010
2011
2012
2013
201
4F2
015F
201
6F2
017F
Europe China
0
5
10
15
20
25
30
35
200
9
201
0
201
1
201
2
201
3
201
4E
201
5E
201
6E
201
7E
201
8E
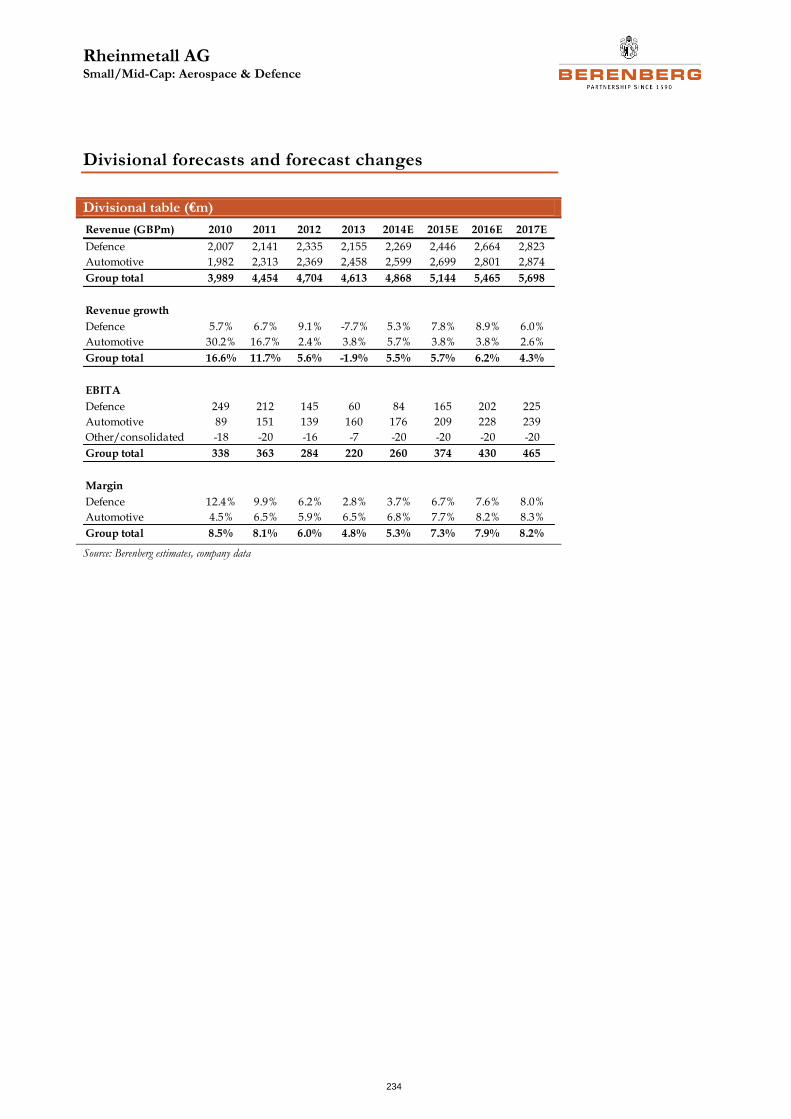
Rheinmetall AG Small/Mid-Cap: Aerospace & Defence
234
Divisional forecasts and forecast changes
Divisional table (€m)
Source: Berenberg estimates, company data
Revenue (GBPm) 2010 2011 2012 2013 2014E 2015E 2016E 2017E
Defence 2,007 2,141 2,335 2,155 2,269 2,446 2,664 2,823
Automotive 1,982 2,313 2,369 2,458 2,599 2,699 2,801 2,874
Group total 3,989 4,454 4,704 4,613 4,868 5,144 5,465 5,698
Revenue growth
Defence 5.7% 6.7% 9.1% -7.7% 5.3% 7.8% 8.9% 6.0%
Automotive 30.2% 16.7% 2.4% 3.8% 5.7% 3.8% 3.8% 2.6%
Group total 16.6% 11.7% 5.6% -1.9% 5.5% 5.7% 6.2% 4.3%
EBITA
Defence 249 212 145 60 84 165 202 225
Automotive 89 151 139 160 176 209 228 239
Other/consolidated -18 -20 -16 -7 -20 -20 -20 -20
Group total 338 363 284 220 260 374 430 465
Margin
Defence 12.4% 9.9% 6.2% 2.8% 3.7% 6.7% 7.6% 8.0%
Automotive 4.5% 6.5% 5.9% 6.5% 6.8% 7.7% 8.2% 8.3%
Group total 8.5% 8.1% 6.0% 4.8% 5.3% 7.3% 7.9% 8.2%
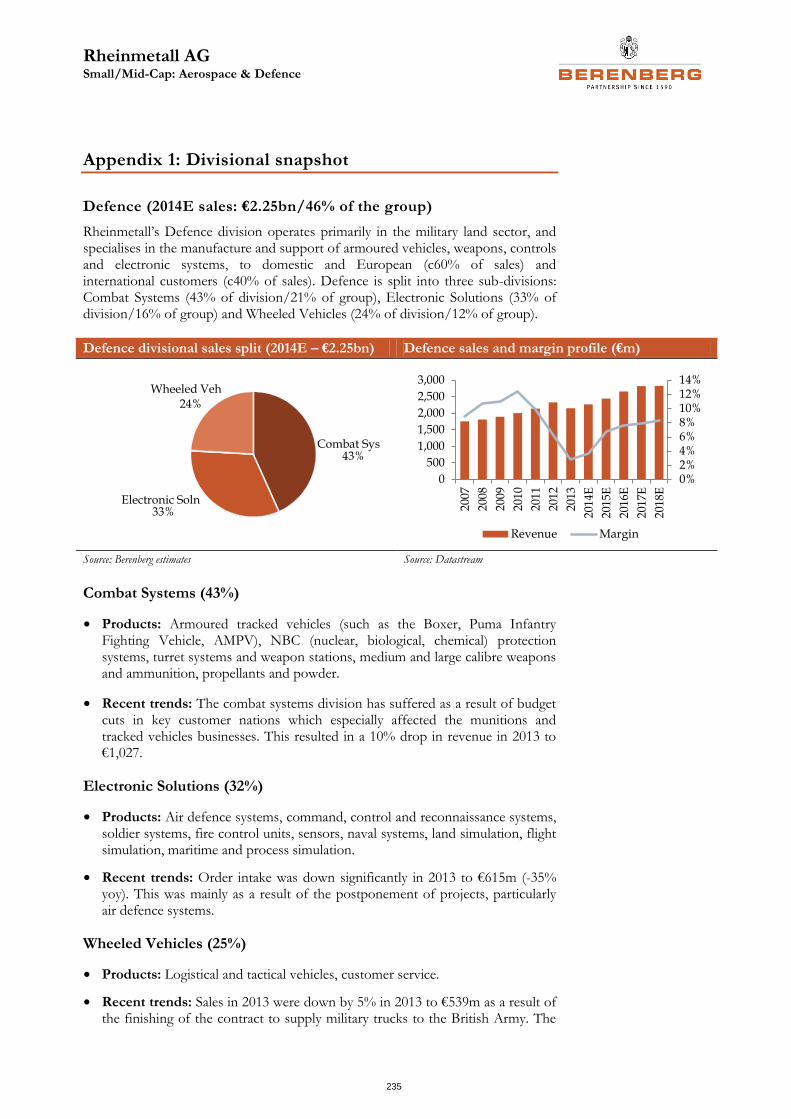
Rheinmetall AG Small/Mid-Cap: Aerospace & Defence
235
Appendix 1: Divisional snapshot
Defence (2014E sales: €2.25bn/46% of the group)
Rheinmetall’s Defence division operates primarily in the military land sector, and specialises in the manufacture and support of armoured vehicles, weapons, controls and electronic systems, to domestic and European (c60% of sales) and international customers (c40% of sales). Defence is split into three sub-divisions: Combat Systems (43% of division/21% of group), Electronic Solutions (33% of division/16% of group) and Wheeled Vehicles (24% of division/12% of group).
Defence divisional sales split (2014E – €2.25bn) Defence sales and margin profile (€m)
Source: Berenberg estimates Source: Datastream
Combat Systems (43%)
• Products: Armoured tracked vehicles (such as the Boxer, Puma Infantry Fighting Vehicle, AMPV), NBC (nuclear, biological, chemical) protection systems, turret systems and weapon stations, medium and large calibre weapons and ammunition, propellants and powder.
• Recent trends: The combat systems division has suffered as a result of budget cuts in key customer nations which especially affected the munitions and tracked vehicles businesses. This resulted in a 10% drop in revenue in 2013 to €1,027.
Electronic Solutions (32%)
• Products: Air defence systems, command, control and reconnaissance systems, soldier systems, fire control units, sensors, naval systems, land simulation, flight simulation, maritime and process simulation.
• Recent trends: Order intake was down significantly in 2013 to €615m (-35% yoy). This was mainly as a result of the postponement of projects, particularly air defence systems.
Wheeled Vehicles (25%)
• Products: Logistical and tactical vehicles, customer service.
• Recent trends: Sales in 2013 were down by 5% in 2013 to €539m as a result of the finishing of the contract to supply military trucks to the British Army. The
43%
33%
24%
Combat Sys
Electronic Soln
Wheeled Veh
0%2%4%6%8%10%12%14%
0
500
1,000
1,500
2,000
2,500
3,000
2007
2008
2009
2010
2011
2012
2013
2014
E
2015
E
2016
E
2017
E
2018
E
Revenue Margin
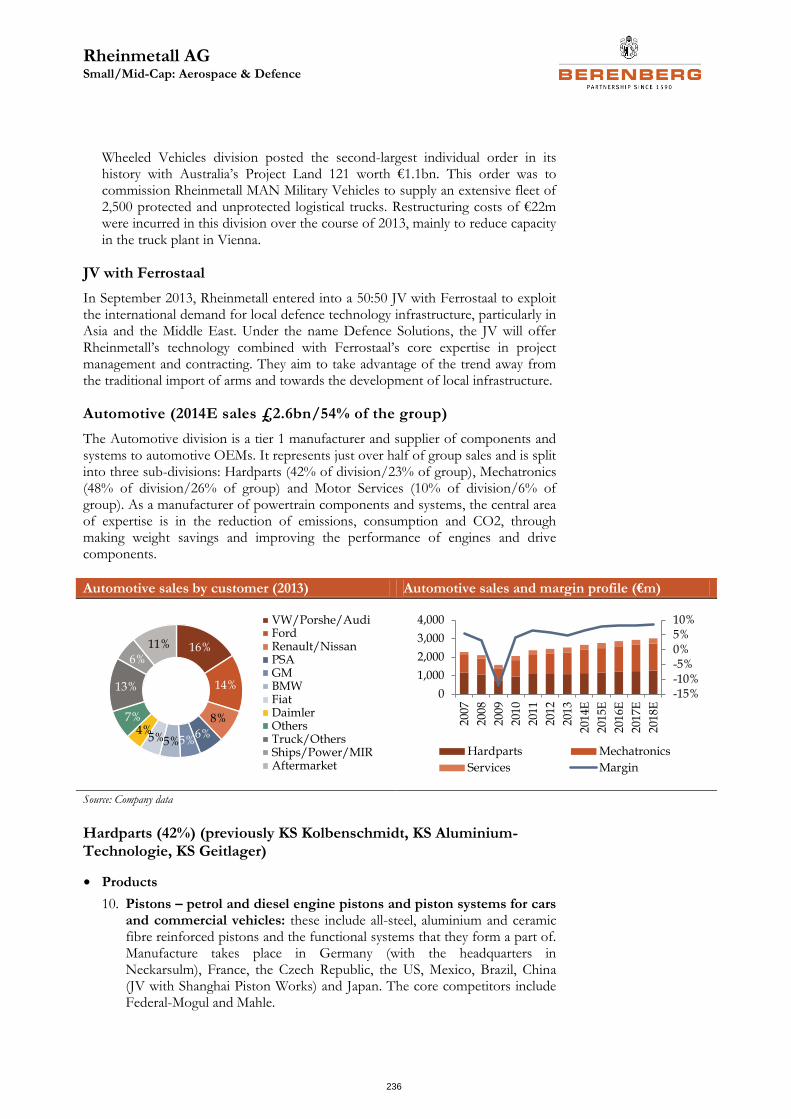
Rheinmetall AG Small/Mid-Cap: Aerospace & Defence
236
Wheeled Vehicles division posted the second-largest individual order in its history with Australia’s Project Land 121 worth €1.1bn. This order was to commission Rheinmetall MAN Military Vehicles to supply an extensive fleet of 2,500 protected and unprotected logistical trucks. Restructuring costs of €22m were incurred in this division over the course of 2013, mainly to reduce capacity in the truck plant in Vienna.
JV with Ferrostaal
In September 2013, Rheinmetall entered into a 50:50 JV with Ferrostaal to exploit the international demand for local defence technology infrastructure, particularly in Asia and the Middle East. Under the name Defence Solutions, the JV will offer Rheinmetall’s technology combined with Ferrostaal’s core expertise in project management and contracting. They aim to take advantage of the trend away from the traditional import of arms and towards the development of local infrastructure.
Automotive (2014E sales £2.6bn/54% of the group)
The Automotive division is a tier 1 manufacturer and supplier of components and systems to automotive OEMs. It represents just over half of group sales and is split into three sub-divisions: Hardparts (42% of division/23% of group), Mechatronics (48% of division/26% of group) and Motor Services (10% of division/6% of group). As a manufacturer of powertrain components and systems, the central area of expertise is in the reduction of emissions, consumption and CO2, through making weight savings and improving the performance of engines and drive components.
Automotive sales by customer (2013) Automotive sales and margin profile (€m)
Source: Company data
Hardparts (42%) (previously KS Kolbenschmidt, KS Aluminium-Technologie, KS Geitlager)
• Products
10. Pistons – petrol and diesel engine pistons and piston systems for cars and commercial vehicles: these include all-steel, aluminium and ceramic fibre reinforced pistons and the functional systems that they form a part of. Manufacture takes place in Germany (with the headquarters in Neckarsulm), France, the Czech Republic, the US, Mexico, Brazil, China (JV with Shanghai Piston Works) and Japan. The core competitors include Federal-Mogul and Mahle.
16%
14%
8%
6%5%5%5%
4%7%
13%
6%
11%
VW/Porshe/AudiFordRenault/NissanPSAGMBMWFiatDaimlerOthersTruck/OthersShips/Power/MIRAftermarket
-15%-10%-5%0%5%10%
0
1,000
2,000
3,000
4,000
200
7
200
8
2009
201
0
201
1
2012
201
3
201
4E
201
5E
201
6E
201
7E
201
8E
Hardparts Mechatronics
Services Margin
Rheinmetall AG Small/Mid-Cap: Aerospace & Defence
237
11. Large bore pistons: The product range includes large bore pistons (150-640mm) made of steel and aluminium supplied to virtually all manufacturers of large four-stroke engines worldwide. Products include monobloc aluminium pistons, spheroidal graphite monobloc and composite pistons and spheroidal graphite iron and steel pistons. Manufacture takes place in Germany and the US.
12. Aluminium engine blocks: Products include high- and low-pressure die-cast cylinder engine blocks, including finished machining. Manufacture takes place in Germany. The core competitors include Georg Fischer, Honsel and Nemak.
13. Engine components/bearings: The current product range of over 3,000 marketable items, includes rod and crankshaft bearing shells, bushings and thrust bushings, made of either solid metal or steel polymer composites. Manufacture takes place in Germany, the US, Mexico, Brazil and India. Its core competitors include Daido Metal, Federal-Mogul and Mahle.
• Recent trends: Hardparts achieved constant currency growth of 3% (flat yoy) in 2013. The group has been developing a number of new efficient and emission-compliant piston products such as the STEELTEKS®, LITEKS®, and NANOFRIKS®.
Mechatronics (48%)
• Products
14. Engine control systems: Products include actuators that control airflow, emission control systems (secondary air systems to assist the catalytic converter through temperature control and gas recirculation), and solenoid valves (that operate to control the recirculation of gas emissions and to vary turbine geometry in turbochargers) for both petrol and diesel engines. These technologies focus on reducing gas emissions and increasing fuel efficiency. Manufacture takes place in Germany, Spain, the Czech Republic, the US, China and India. Its core competitors include BorgeWarner, Bosch and Continental.
15. Pump technology: In this segment, Rheinmetall produces oil, vacuum, water circulation and coolant pumps. Rheinmetall has had a market-leading position with its electronically commutated water circulation pump (WCP), since 1996. Manufacture takes place in Germany, Italy, France, Mexico, Brazil and India. Core competitors include Bosch, Ixetic, Magna and SHW.
• Recent trends: Mechatronics achieved constant currency growth of 9% (7% yoy) in 2013 through a large number of product launches as well as through increases in production in its high growth product groups. Management expects the Mechatronics division to continue to benefit from the trend towards downsizing engines, and making up performance through exhaust gas turbochargers, through its dominant positions in the worldwide market for electrical divert-air valves. This same trajectory has been positive for sales of electrical water pumps and water circulation pumps, which are mainly used for turbocharger cooling.
• To ensure compliance with legal emission values in the commercial diesel vehicle sector, exhaust gas recirculation (EGR) systems are increasingly becoming necessary in addition to existing exhaust after-treatment systems.
Rheinmetall AG Small/Mid-Cap: Aerospace & Defence
238
Rheinmetall is positioned to benefit from this through its engine control systems offering, including its “SMART” EGR (exhaust gas recirculation) check valves. The estimated value-added of Rheinmetall Automotive per vehicle for EGR doubled from 2005 to 2010, as a result of the move from EURO 4 regulation to EURO 5. The company estimates there will be a similar doubling from 2012 to 2015 as a result of the move to EURO 6 from EURO 5.
Services (10%)
• Products: Motor Service is the sales organisation for the worldwide aftermarket activities of the Automotive division. It provides wholesalers, engine repairers and independent workshops in 130 countries with the product ranges and technical expertise of the Mechatronics and Hardparts sub-divisions.
• Recent trends: Motor Service achieved constant currency growth of 3% (2% yoy) in 2013. Over the longer term, the division has been a steady growth business with a 7% sales CAGR over the past six years.
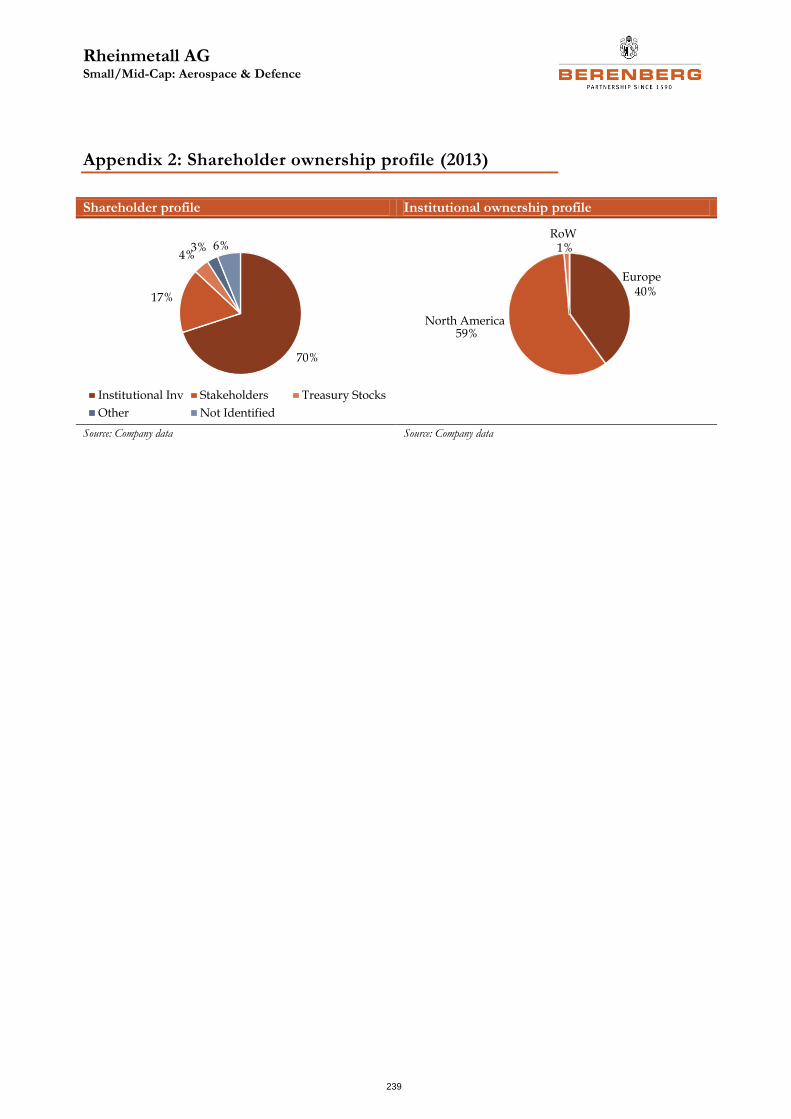
Rheinmetall AG Small/Mid-Cap: Aerospace & Defence
239
Appendix 2: Shareholder ownership profile (2013)
Shareholder profile Institutional ownership profile
Source: Company data Source: Company data
70%
17%
4%3% 6%
Institutional Inv Stakeholders Treasury Stocks
Other Not Identified
40%
59%
1%
Europe
North America
RoW
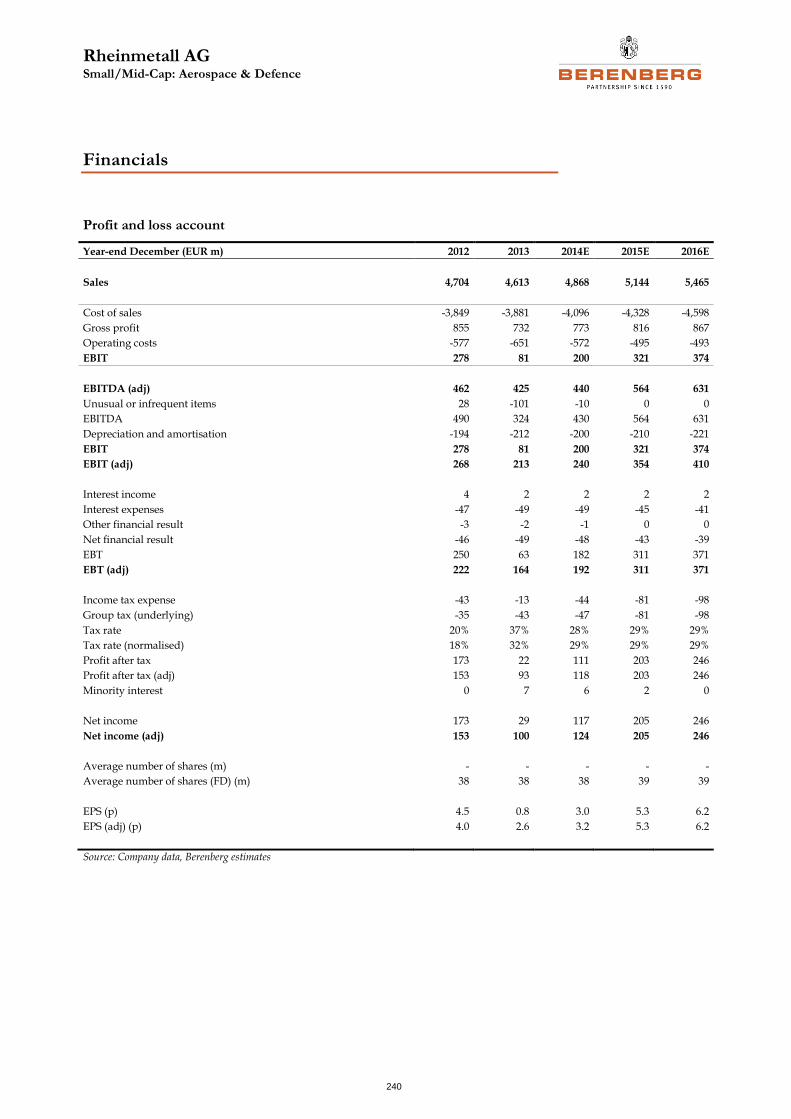
Rheinmetall AG Small/Mid-Cap: Aerospace & Defence
240
Financials
Profit and loss account
Year-end December (EUR m) 2012 2013 2014E 2015E 2016E
Sales 4,704 4,613 4,868 5,144 5,465
Cost of sales -3,849 -3,881 -4,096 -4,328 -4,598
Gross profit 855 732 773 816 867
Operating costs -577 -651 -572 -495 -493
EBIT 278 81 200 321 374
EBITDA (adj) 462 425 440 564 631
Unusual or infrequent items 28 -101 -10 0 0
EBITDA 490 324 430 564 631
Depreciation and amortisation -194 -212 -200 -210 -221
EBIT 278 81 200 321 374
EBIT (adj) 268 213 240 354 410
Interest income 4 2 2 2 2
Interest expenses -47 -49 -49 -45 -41
Other financial result -3 -2 -1 0 0
Net financial result -46 -49 -48 -43 -39
EBT 250 63 182 311 371
EBT (adj) 222 164 192 311 371
Income tax expense -43 -13 -44 -81 -98
Group tax (underlying) -35 -43 -47 -81 -98
Tax rate 20% 37% 28% 29% 29%
Tax rate (normalised) 18% 32% 29% 29% 29%
Profit after tax 173 22 111 203 246
Profit after tax (adj) 153 93 118 203 246
Minority interest 0 7 6 2 0
Net income 173 29 117 205 246
Net income (adj) 153 100 124 205 246
Average number of shares (m) - - - - -
Average number of shares (FD) (m) 38 38 38 39 39
EPS (p) 4.5 0.8 3.0 5.3 6.2
EPS (adj) (p) 4.0 2.6 3.2 5.3 6.2
Source: Company data, Berenberg estimates
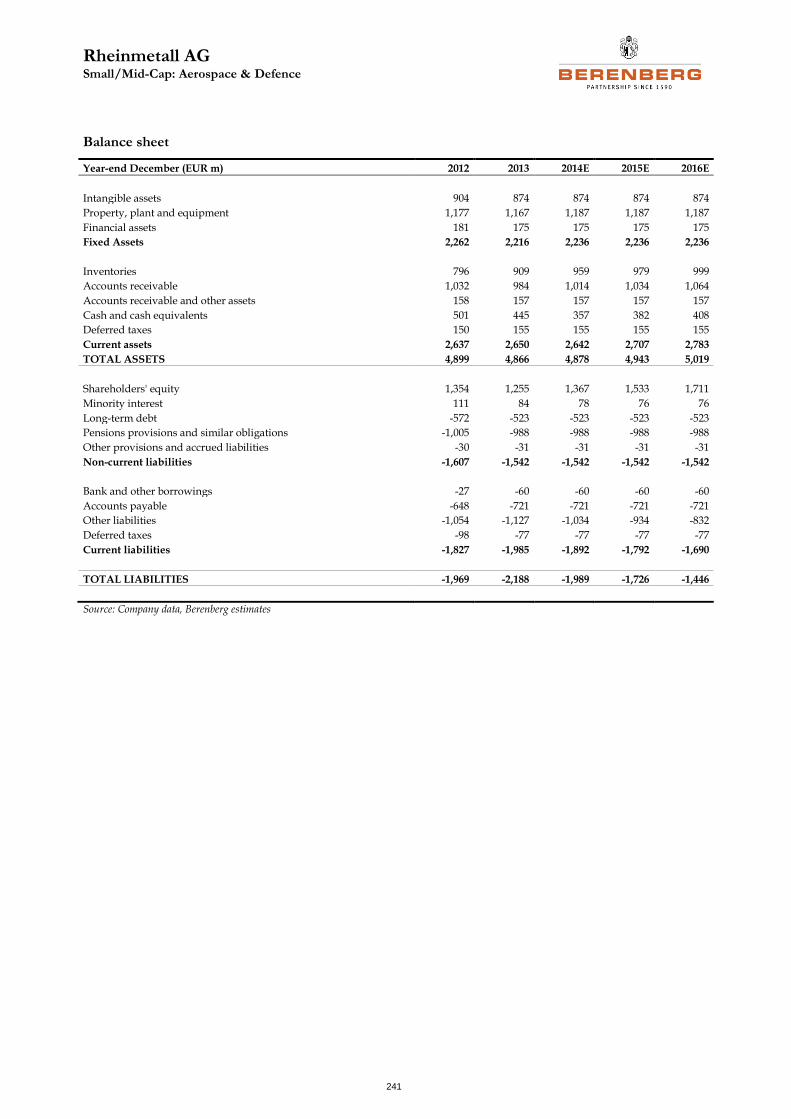
Rheinmetall AG Small/Mid-Cap: Aerospace & Defence
241
Balance sheet
Year-end December (EUR m) 2012 2013 2014E 2015E 2016E
Intangible assets 904 874 874 874 874
Property, plant and equipment 1,177 1,167 1,187 1,187 1,187
Financial assets 181 175 175 175 175
Fixed Assets 2,262 2,216 2,236 2,236 2,236
Inventories 796 909 959 979 999
Accounts receivable 1,032 984 1,014 1,034 1,064
Accounts receivable and other assets 158 157 157 157 157
Cash and cash equivalents 501 445 357 382 408
Deferred taxes 150 155 155 155 155
Current assets 2,637 2,650 2,642 2,707 2,783
TOTAL ASSETS 4,899 4,866 4,878 4,943 5,019
Shareholders' equity 1,354 1,255 1,367 1,533 1,711
Minority interest 111 84 78 76 76
Long-term debt -572 -523 -523 -523 -523
Pensions provisions and similar obligations -1,005 -988 -988 -988 -988
Other provisions and accrued liabilities -30 -31 -31 -31 -31
Non-current liabilities -1,607 -1,542 -1,542 -1,542 -1,542
Bank and other borrowings -27 -60 -60 -60 -60
Accounts payable -648 -721 -721 -721 -721
Other liabilities -1,054 -1,127 -1,034 -934 -832
Deferred taxes -98 -77 -77 -77 -77
Current liabilities -1,827 -1,985 -1,892 -1,792 -1,690
TOTAL LIABILITIES -1,969 -2,188 -1,989 -1,726 -1,446
Source: Company data, Berenberg estimates
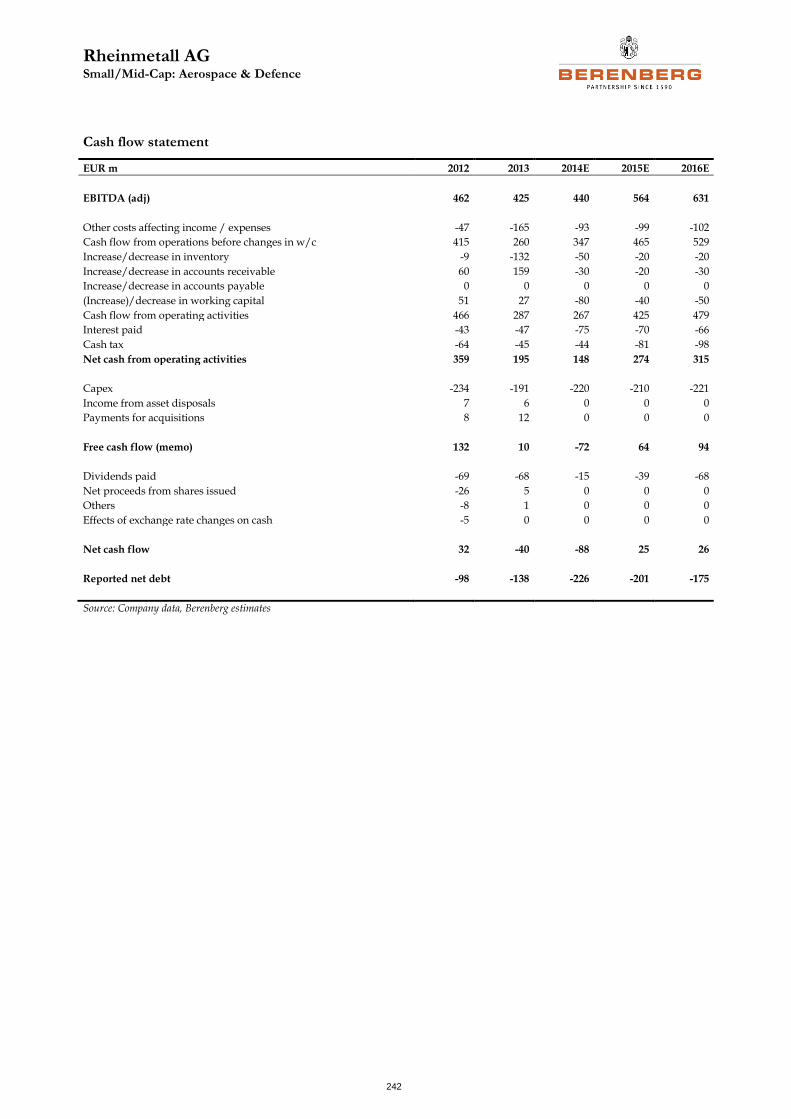
Rheinmetall AG Small/Mid-Cap: Aerospace & Defence
242
Cash flow statement
EUR m 2012 2013 2014E 2015E 2016E
EBITDA (adj) 462 425 440 564 631
Other costs affecting income / expenses -47 -165 -93 -99 -102
Cash flow from operations before changes in w/c 415 260 347 465 529
Increase/decrease in inventory -9 -132 -50 -20 -20
Increase/decrease in accounts receivable 60 159 -30 -20 -30
Increase/decrease in accounts payable 0 0 0 0 0
(Increase)/decrease in working capital 51 27 -80 -40 -50
Cash flow from operating activities 466 287 267 425 479
Interest paid -43 -47 -75 -70 -66
Cash tax -64 -45 -44 -81 -98
Net cash from operating activities 359 195 148 274 315
Capex -234 -191 -220 -210 -221
Income from asset disposals 7 6 0 0 0
Payments for acquisitions 8 12 0 0 0
Free cash flow (memo) 132 10 -72 64 94
Dividends paid -69 -68 -15 -39 -68
Net proceeds from shares issued -26 5 0 0 0
Others -8 1 0 0 0
Effects of exchange rate changes on cash -5 0 0 0 0
Net cash flow 32 -40 -88 25 26
Reported net debt -98 -138 -226 -201 -175
Source: Company data, Berenberg estimates
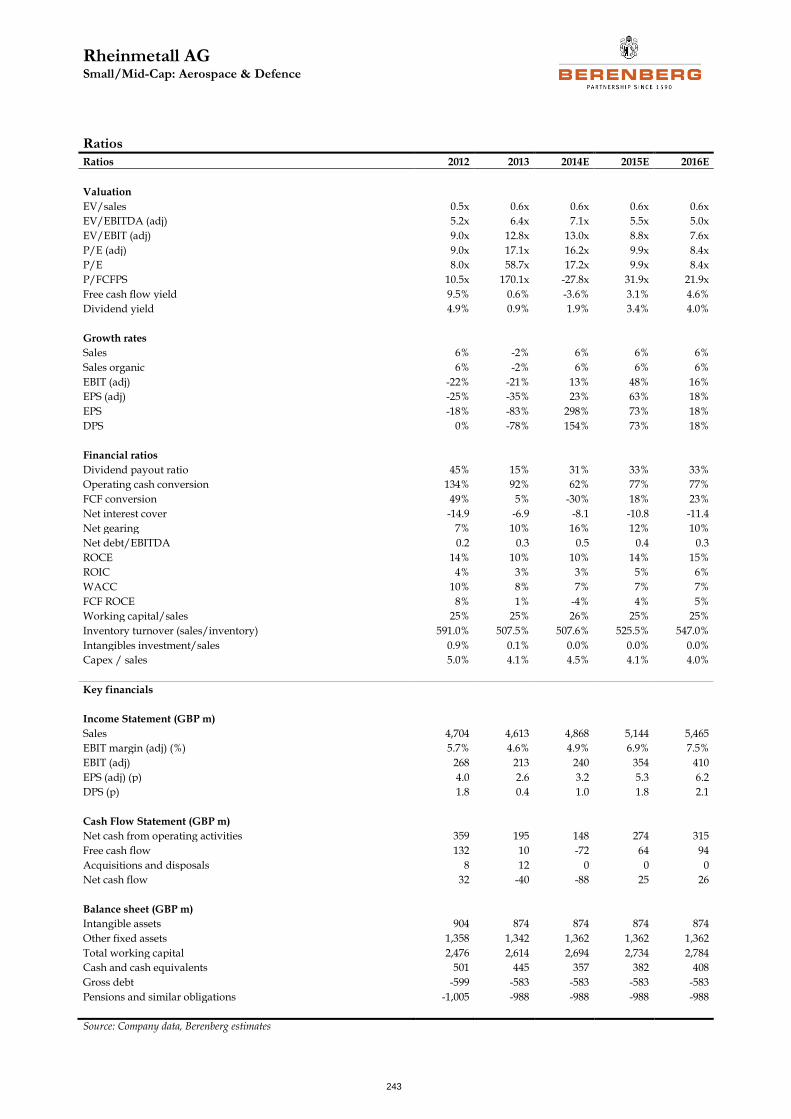
Rheinmetall AG Small/Mid-Cap: Aerospace & Defence
243
Ratios
Ratios 2012 2013 2014E 2015E 2016E
Valuation
EV/sales 0.5x 0.6x 0.6x 0.6x 0.6x
EV/EBITDA (adj) 5.2x 6.4x 7.1x 5.5x 5.0x
EV/EBIT (adj) 9.0x 12.8x 13.0x 8.8x 7.6x
P/E (adj) 9.0x 17.1x 16.2x 9.9x 8.4x
P/E 8.0x 58.7x 17.2x 9.9x 8.4x
P/FCFPS 10.5x 170.1x -27.8x 31.9x 21.9x
Free cash flow yield 9.5% 0.6% -3.6% 3.1% 4.6%
Dividend yield 4.9% 0.9% 1.9% 3.4% 4.0%
Growth rates
Sales 6% -2% 6% 6% 6%
Sales organic 6% -2% 6% 6% 6%
EBIT (adj) -22% -21% 13% 48% 16%
EPS (adj) -25% -35% 23% 63% 18%
EPS -18% -83% 298% 73% 18%
DPS 0% -78% 154% 73% 18%
Financial ratios
Dividend payout ratio 45% 15% 31% 33% 33%
Operating cash conversion 134% 92% 62% 77% 77%
FCF conversion 49% 5% -30% 18% 23%
Net interest cover -14.9 -6.9 -8.1 -10.8 -11.4
Net gearing 7% 10% 16% 12% 10%
Net debt/EBITDA 0.2 0.3 0.5 0.4 0.3
ROCE 14% 10% 10% 14% 15%
ROIC 4% 3% 3% 5% 6%
WACC 10% 8% 7% 7% 7%
FCF ROCE 8% 1% -4% 4% 5%
Working capital/sales 25% 25% 26% 25% 25%
Inventory turnover (sales/inventory) 591.0% 507.5% 507.6% 525.5% 547.0%
Intangibles investment/sales 0.9% 0.1% 0.0% 0.0% 0.0%
Capex / sales 5.0% 4.1% 4.5% 4.1% 4.0%
Key financials
Income Statement (GBP m)
Sales 4,704 4,613 4,868 5,144 5,465
EBIT margin (adj) (%) 5.7% 4.6% 4.9% 6.9% 7.5%
EBIT (adj) 268 213 240 354 410
EPS (adj) (p) 4.0 2.6 3.2 5.3 6.2
DPS (p) 1.8 0.4 1.0 1.8 2.1
Cash Flow Statement (GBP m)
Net cash from operating activities 359 195 148 274 315
Free cash flow 132 10 -72 64 94
Acquisitions and disposals 8 12 0 0 0
Net cash flow 32 -40 -88 25 26
Balance sheet (GBP m)
Intangible assets 904 874 874 874 874
Other fixed assets 1,358 1,342 1,362 1,362 1,362
Total working capital 2,476 2,614 2,694 2,734 2,784
Cash and cash equivalents 501 445 357 382 408
Gross debt -599 -583 -583 -583 -583
Pensions and similar obligations -1,005 -988 -988 -988 -988
Source: Company data, Berenberg estimates
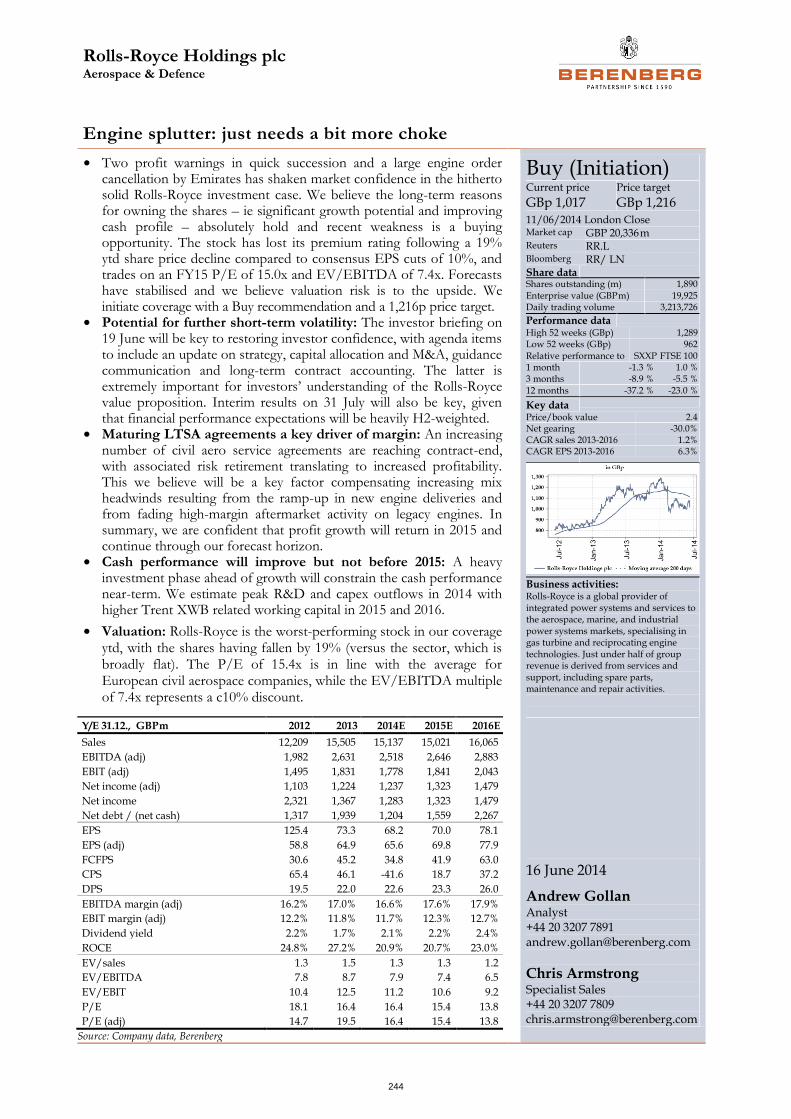
Rolls-Royce Holdings plc Aerospace & Defence
244
Engine splutter: just needs a bit more choke
• Two profit warnings in quick succession and a large engine order cancellation by Emirates has shaken market confidence in the hitherto solid Rolls-Royce investment case. We believe the long-term reasons for owning the shares – ie significant growth potential and improving cash profile – absolutely hold and recent weakness is a buying opportunity. The stock has lost its premium rating following a 19% ytd share price decline compared to consensus EPS cuts of 10%, and trades on an FY15 P/E of 15.0x and EV/EBITDA of 7.4x. Forecasts have stabilised and we believe valuation risk is to the upside. We initiate coverage with a Buy recommendation and a 1,216p price target.
• Potential for further short-term volatility: The investor briefing on 19 June will be key to restoring investor confidence, with agenda items to include an update on strategy, capital allocation and M&A, guidance communication and long-term contract accounting. The latter is extremely important for investors’ understanding of the Rolls-Royce value proposition. Interim results on 31 July will also be key, given that financial performance expectations will be heavily H2-weighted.
• Maturing LTSA agreements a key driver of margin: An increasing number of civil aero service agreements are reaching contract-end, with associated risk retirement translating to increased profitability. This we believe will be a key factor compensating increasing mix headwinds resulting from the ramp-up in new engine deliveries and from fading high-margin aftermarket activity on legacy engines. In summary, we are confident that profit growth will return in 2015 and continue through our forecast horizon.
• Cash performance will improve but not before 2015: A heavy investment phase ahead of growth will constrain the cash performance near-term. We estimate peak R&D and capex outflows in 2014 with higher Trent XWB related working capital in 2015 and 2016.
• Valuation: Rolls-Royce is the worst-performing stock in our coverage ytd, with the shares having fallen by 19% (versus the sector, which is broadly flat). The P/E of 15.4x is in line with the average for European civil aerospace companies, while the EV/EBITDA multiple of 7.4x represents a c10% discount.
Buy (Initiation) Current price
GBp 1,017 Price target
GBp 1,216 11/06/2014 London Close Market cap GBP 20,336 m Reuters RR.L Bloomberg RR/ LN Share data
Shares outstanding (m) 1,890 Enterprise value (GBP m) 19,925 Daily trading volume 3,213,726
Performance data
High 52 weeks (GBp) 1,289 Low 52 weeks (GBp) 962
Relative performance to SXXP FTSE 100 1 month -1.3 % 1.0 % 3 months -8.9 % -5.5 % 12 months -37.2 % -23.0 %
Key data
Price/book value 2.4 Net gearing -30.0% CAGR sales 2013-2016 1.2% CAGR EPS 2013-2016 6.3%
Business activities: Rolls-Royce is a global provider of integrated power systems and services to the aerospace, marine, and industrial power systems markets, specialising in gas turbine and reciprocating engine technologies. Just under half of group revenue is derived from services and support, including spare parts, maintenance and repair activities.
16 June 2014
Andrew Gollan Analyst +44 20 3207 7891 [email protected]
Chris Armstrong
Specialist Sales +44 20 3207 7809 [email protected]
Y/E 31.12., GBP m 2012 2013 2014E 2015E 2016E
Sales 12,209 15,505 15,137 15,021 16,065
EBITDA (adj) 1,982 2,631 2,518 2,646 2,883
EBIT (adj) 1,495 1,831 1,778 1,841 2,043
Net income (adj) 1,103 1,224 1,237 1,323 1,479
Net income 2,321 1,367 1,283 1,323 1,479
Net debt / (net cash) 1,317 1,939 1,204 1,559 2,267
EPS 125.4 73.3 68.2 70.0 78.1
EPS (adj) 58.8 64.9 65.6 69.8 77.9
FCFPS 30.6 45.2 34.8 41.9 63.0
CPS 65.4 46.1 -41.6 18.7 37.2
DPS 19.5 22.0 22.6 23.3 26.0
EBITDA margin (adj) 16.2% 17.0% 16.6% 17.6% 17.9%
EBIT margin (adj) 12.2% 11.8% 11.7% 12.3% 12.7%
Dividend yield 2.2% 1.7% 2.1% 2.2% 2.4%
ROCE 24.8% 27.2% 20.9% 20.7% 23.0%
EV/sales 1.3 1.5 1.3 1.3 1.2
EV/EBITDA 7.8 8.7 7.9 7.4 6.5
EV/EBIT 10.4 12.5 11.2 10.6 9.2
P/E 18.1 16.4 16.4 15.4 13.8
P/E (adj) 14.7 19.5 16.4 15.4 13.8
Source: Company data, Berenberg
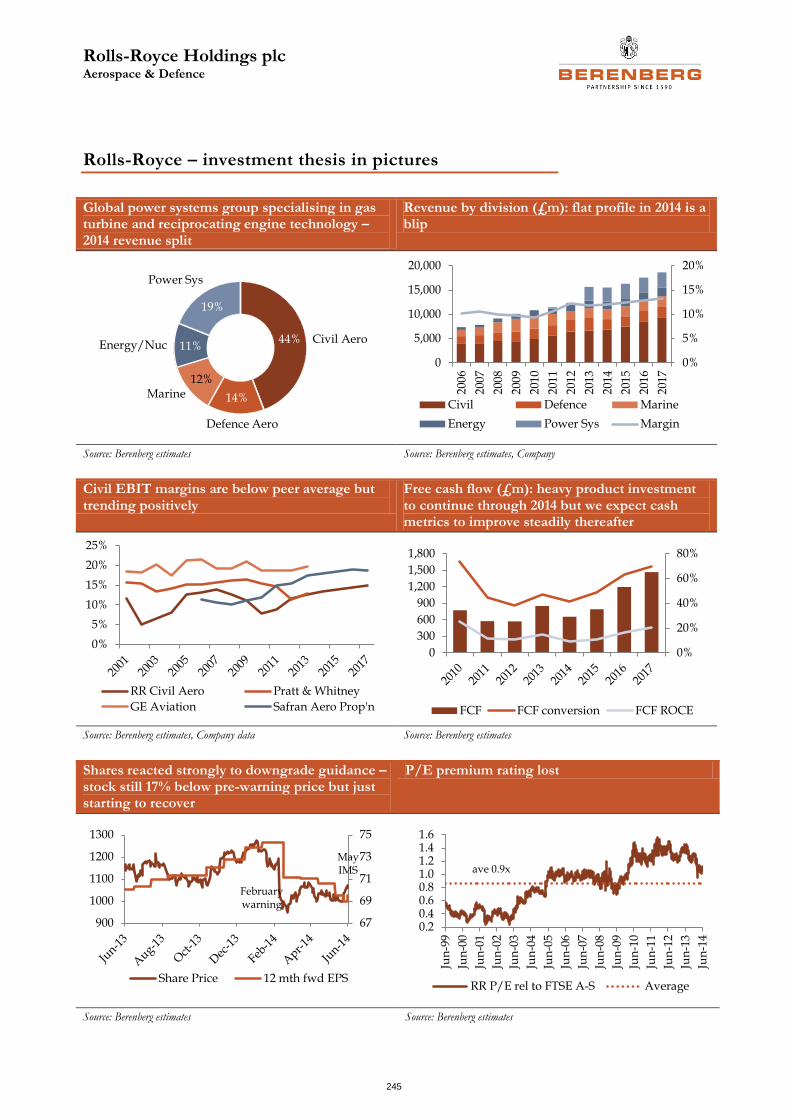
Rolls-Royce Holdings plc Aerospace & Defence
245
Rolls-Royce – investment thesis in pictures
Global power systems group specialising in gas turbine and reciprocating engine technology – 2014 revenue split
Revenue by division (£m): flat profile in 2014 is a blip
Source: Berenberg estimates Source: Berenberg estimates, Company
Civil EBIT margins are below peer average but trending positively
Free cash flow (£m): heavy product investment to continue through 2014 but we expect cash metrics to improve steadily thereafter
Source: Berenberg estimates, Company data Source: Berenberg estimates
Shares reacted strongly to downgrade guidance – stock still 17% below pre-warning price but just starting to recover
P/E premium rating lost
Source: Berenberg estimates Source: Berenberg estimates
44%
14%
12%
11%
19%
Civil Aero
Defence Aero
Marine
Energy/Nuc
Power Sys
0%
5%
10%
15%
20%
0
5,000
10,000
15,000
20,000
200
6
200
7
200
8
200
9
201
0
201
1
201
2
201
3
201
4
201
5
201
6
201
7
Civil Defence Marine
Energy Power Sys Margin
0%
5%
10%
15%
20%
25%
RR Civil Aero Pratt & Whitney
GE Aviation Safran Aero Prop'n
0%
20%
40%
60%
80%
0
300
600
900
1,200
1,500
1,800
FCF FCF conversion FCF ROCE
67
69
71
73
75
900
1000
1100
1200
1300
Share Price 12 mth fwd EPS
February warning
May IMS
0.20.40.60.81.01.21.41.6
Jun
-99
Jun
-00
Jun
-01
Jun
-02
Jun
-03
Jun
-04
Jun
-05
Jun
-06
Jun
-07
Jun
-08
Jun
-09
Jun
-10
Jun
-11
Jun
-12
Jun
-13
Jun
-14
RR P/E rel to FTSE A-S Average
ave 0.9x
Rolls-Royce Holdings plc Aerospace & Defence
246
Rolls-Royce – investment thesis
What’s new: We initiate coverage on Rolls-Royce with a Buy rating and a 1,216p price target, implying 19% upside.
Two-minute summary: Rolls-Royce has built a long record of growth, so two warnings on profit guidance have dented investor confidence, recently exacerbated by the loss of a large order for Trent XWB engines linked to Emirates’ decision to cancel its order for 70 Airbus A350XWB aircraft. Rolls-Royce is the worst-performing share in our coverage ytd, down by 19% compared to the sector which is down by 0.5%, and is currently trading 17% below the pre-February profit warning level. In our view, there are no systemic issues that fundamentally change the long-term investment case for sustained growth and improving free cash flow, and we are confident that profit growth will return in 2015. It is on these assumptions that we base our recommendation. However, this comes with the health warning that the shares could remain volatile in the near term. The following two upcoming events will be key to re-establishing investor confidence.
10. Investor briefing (19 June): This will be a crucial in educating the market about the profit power of the maturing long-term contract service model which is key to margin expansion, and is central to our Buy case. Strategy and capital allocation is also on the agenda, so management’s M&A intentions should become clearer, including the possibility of a resurrection of the Wärtsilä bid.
11. Interim results (31 July): FY14 guidance is for financial performance to be heavily 2H-weighted (two-thirds versus c54% historically), with significant cash outflows also expected in H1. We believe this can be explained by the phasing of programmes and restructuring and by the £30m one-off charge in Marine. Any weighting outturn better than guidance will be well received, we believe.
In summary, 2014 represents a lost year of growth for Rolls-Royce but the fundamental investment case holds, in our view. Provided management can communicate effectively over the next few months, we believe sentiment will at least partly recover and drive the rating higher. Valuation metrics are currently not reflecting this, we believe, with the shares now trading at an historically low mid-single-digit P/E premium to the sector, and a c10% EV/EBITDA discount to European civil aero peers.
A word on Emirates
As the sole engine provider on A350 XWB aircraft, Rolls-Royce’s loss of a c£2.6bn order linked to Emirates’ decision last week to cancel its purchase of 70 Airbus A350 XWB aircraft is clearly a disappointment, not only due to its size (equivalent to around 3.5% of the group order book and 4.0% of the Civil Aerospace division backlog) but also because it represents a lost opportunity for Rolls-Royce to significantly deepen its relationship with one of the most important global operators of wide-body aircraft, Rolls-Royce’s stronghold market.
As we explain in our accompanying sector overview, we do not believe this event indicates a general slowdown or inflection point in the civil order and production cycle. We understand market concerns that it appears that Emirates has judged it will not need as much capacity as it thought it did when it made the A350 XWB order as launch customer in 2007 (for delivery from 2019!). However, firstly, we note that Airbus is reporting a continuing healthy market for new aircraft and has
Rolls-Royce Holdings plc Aerospace & Defence
247
said it is confident of selling more A350 XWBs. Its management again confirmed guidance for growth in the order book in 2014. Secondly, the Airbus backlog stands at c5,500 aircraft (including 742 A350 XWBs). We simply cannot envisage material production cuts within our investment horizon. Lastly, market commentary suggests this is more about Emirates longer-term fleet decisions being built around just the A380 and Boeing’s 777X aircraft, the planned successor to the existing 777 (and Emirates’ preferred twin-engine wide-body aircraft), which was launched in 2013. In short, we suspect cancellation does not necessarily mean that Emirates is reducing its future capacity requirements and that Boeing will probably turn out to be the beneficiary of Airbus’s loss. Emirates has not confirmed this.
Growth has stalled but we are confident it will return in 2015
The lack of growth in 2014 and the development of nearer-term mix headwinds have focused the market debate on whether Rolls-Royce can return to profit growth next year. We believe it can. In 2015, we expect that the combination of relatively low mix headwinds relating to the Trent XWB engine, higher volumes and efficiencies on the Trent 1000 engine, increasingly profitable long-term service contracts (LTSAs) and restructuring benefits will more than offset the effects of the declining non-contracted time and materials (T&M) aftermarket and a muted outlook in the Defence and Marine divisions. Longer-term, we highlight two factors that are key to determining future growth in profit.
1. Increasing profitability of LTSAs: Maturing LTSAs will be a powerful driver of profitability as contract risk is retired, we believe, which in turn will translate to a structural increase in group margins.
2. Declining T&M aftermarket: Concerns in the market are overstated in our view, given the substantial declines that have already been absorbed. By 2015, we estimate the core RB211 engine will represent only 10% of Civil Aerospace services sales. Future expected declines will have a diminishing impact on the group.
Accounting vagaries – the net effect of capitalisation policies is diminishing
In our view, the recent adoption of the Financial Reporting Council’s (FRC) recommendations relating to recognition of third-party fees on new engine projects more appropriately matches engine development costs with revenues over the programme life-cycle, and at the same time removes an historical bugbear for some commentators on the stock. Capitalisation of losses on new engines that are linked to LTSAs (known as recoverable engine costs – RECs) will remain a contentious issue given that Rolls-Royce is the only European aero engine company to adopt this policy. However, in a group P&L context, capitalisation policies are becoming less material with the net P&L impact of capitalised R&D, RECs and engine certification costs now reducing to a low-single digit percentage due to programme phasing and higher amortisation.
Cash performance will improve but not before 2015
In common with many civil aerospace suppliers, Rolls-Royce’s cash performance is currently affected by heavy development expenditure and capital investments ahead of planned growth. We estimate that peak R&D and capex outflows in 2014 with cash demands relative to the group falling steadily through 2016/17. In free cash flow terms we expect a muted performance through 2015, and picking up thereafter.
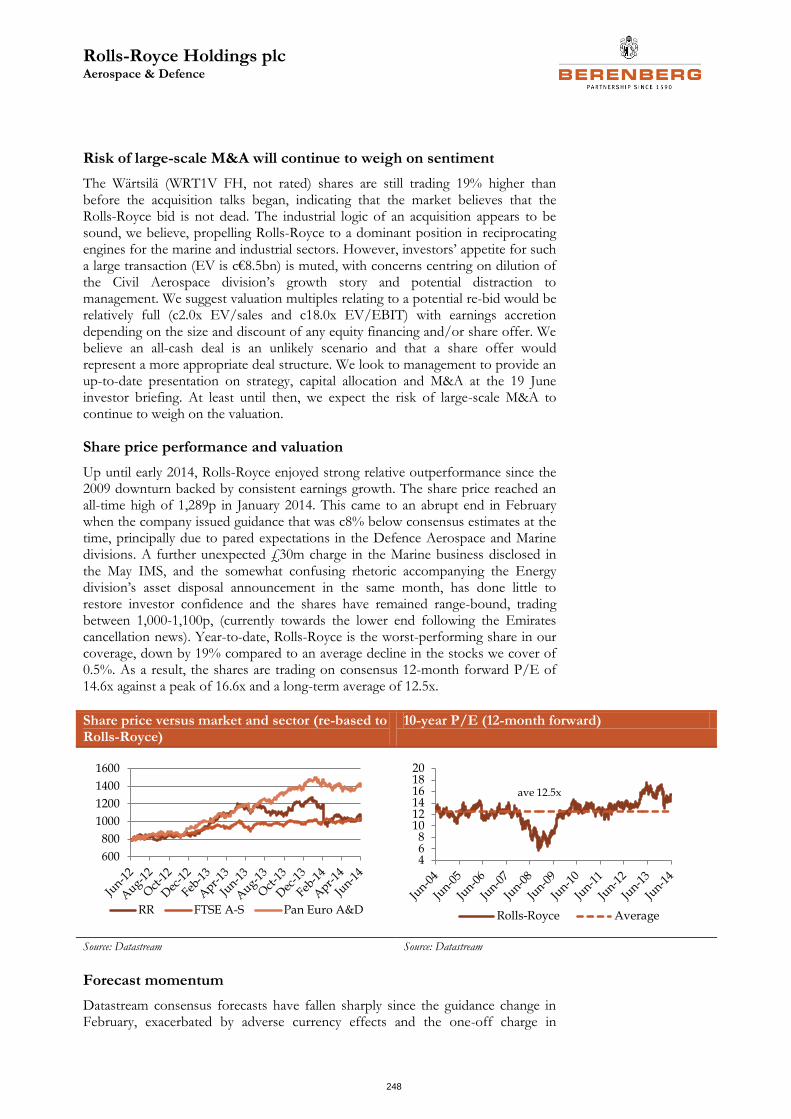
Rolls-Royce Holdings plc Aerospace & Defence
248
Risk of large-scale M&A will continue to weigh on sentiment
The Wärtsilä (WRT1V FH, not rated) shares are still trading 19% higher than before the acquisition talks began, indicating that the market believes that the Rolls-Royce bid is not dead. The industrial logic of an acquisition appears to be sound, we believe, propelling Rolls-Royce to a dominant position in reciprocating engines for the marine and industrial sectors. However, investors’ appetite for such a large transaction (EV is c€8.5bn) is muted, with concerns centring on dilution of the Civil Aerospace division’s growth story and potential distraction to management. We suggest valuation multiples relating to a potential re-bid would be relatively full (c2.0x EV/sales and c18.0x EV/EBIT) with earnings accretion depending on the size and discount of any equity financing and/or share offer. We believe an all-cash deal is an unlikely scenario and that a share offer would represent a more appropriate deal structure. We look to management to provide an up-to-date presentation on strategy, capital allocation and M&A at the 19 June investor briefing. At least until then, we expect the risk of large-scale M&A to continue to weigh on the valuation.
Share price performance and valuation
Up until early 2014, Rolls-Royce enjoyed strong relative outperformance since the 2009 downturn backed by consistent earnings growth. The share price reached an all-time high of 1,289p in January 2014. This came to an abrupt end in February when the company issued guidance that was c8% below consensus estimates at the time, principally due to pared expectations in the Defence Aerospace and Marine divisions. A further unexpected £30m charge in the Marine business disclosed in the May IMS, and the somewhat confusing rhetoric accompanying the Energy division’s asset disposal announcement in the same month, has done little to restore investor confidence and the shares have remained range-bound, trading between 1,000-1,100p, (currently towards the lower end following the Emirates cancellation news). Year-to-date, Rolls-Royce is the worst-performing share in our coverage, down by 19% compared to an average decline in the stocks we cover of 0.5%. As a result, the shares are trading on consensus 12-month forward P/E of 14.6x against a peak of 16.6x and a long-term average of 12.5x.
Share price versus market and sector (re-based to Rolls-Royce)
10-year P/E (12-month forward)
Source: Datastream Source: Datastream
Forecast momentum
Datastream consensus forecasts have fallen sharply since the guidance change in February, exacerbated by adverse currency effects and the one-off charge in
600
800
1000
1200
1400
1600
RR FTSE A-S Pan Euro A&D
468
101214161820
Rolls-Royce Average
ave 12.5x
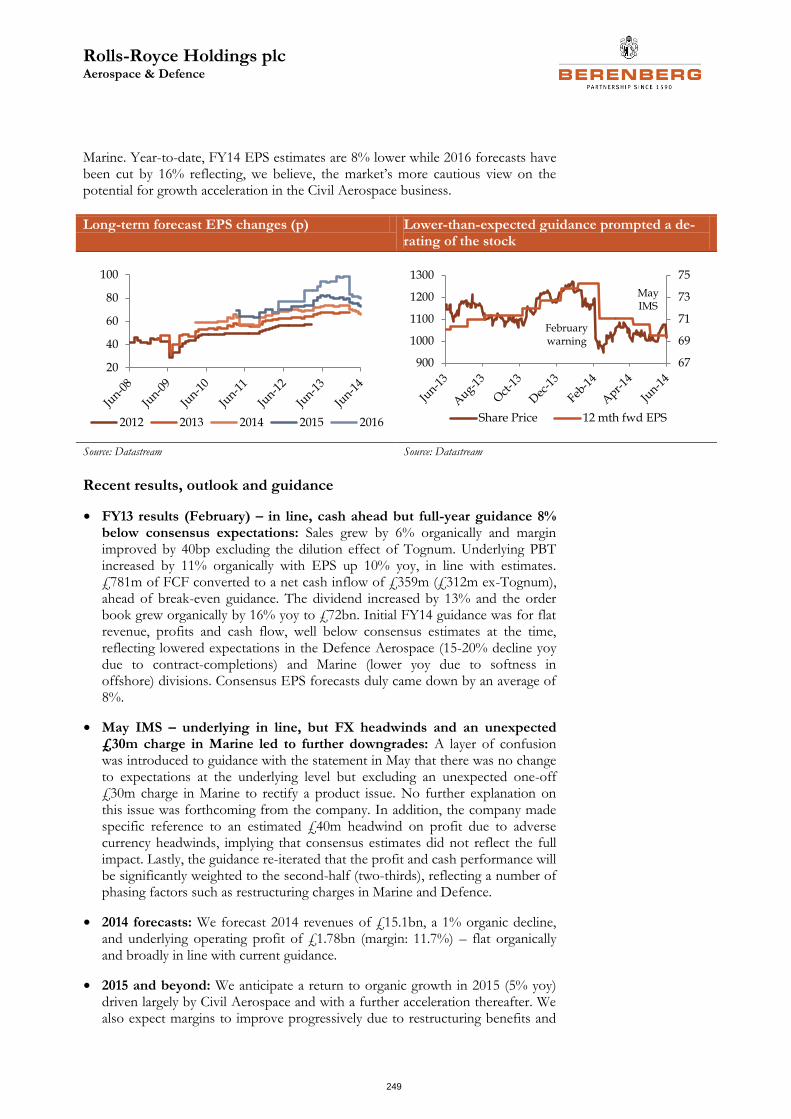
Rolls-Royce Holdings plc Aerospace & Defence
249
Marine. Year-to-date, FY14 EPS estimates are 8% lower while 2016 forecasts have been cut by 16% reflecting, we believe, the market’s more cautious view on the potential for growth acceleration in the Civil Aerospace business.
Long-term forecast EPS changes (p) Lower-than-expected guidance prompted a de-rating of the stock
Source: Datastream Source: Datastream
Recent results, outlook and guidance
• FY13 results (February) – in line, cash ahead but full-year guidance 8% below consensus expectations: Sales grew by 6% organically and margin improved by 40bp excluding the dilution effect of Tognum. Underlying PBT increased by 11% organically with EPS up 10% yoy, in line with estimates. £781m of FCF converted to a net cash inflow of £359m (£312m ex-Tognum), ahead of break-even guidance. The dividend increased by 13% and the order book grew organically by 16% yoy to £72bn. Initial FY14 guidance was for flat revenue, profits and cash flow, well below consensus estimates at the time, reflecting lowered expectations in the Defence Aerospace (15-20% decline yoy due to contract-completions) and Marine (lower yoy due to softness in offshore) divisions. Consensus EPS forecasts duly came down by an average of 8%.
• May IMS – underlying in line, but FX headwinds and an unexpected £30m charge in Marine led to further downgrades: A layer of confusion was introduced to guidance with the statement in May that there was no change to expectations at the underlying level but excluding an unexpected one-off £30m charge in Marine to rectify a product issue. No further explanation on this issue was forthcoming from the company. In addition, the company made specific reference to an estimated £40m headwind on profit due to adverse currency headwinds, implying that consensus estimates did not reflect the full impact. Lastly, the guidance re-iterated that the profit and cash performance will be significantly weighted to the second-half (two-thirds), reflecting a number of phasing factors such as restructuring charges in Marine and Defence.
• 2014 forecasts: We forecast 2014 revenues of £15.1bn, a 1% organic decline, and underlying operating profit of £1.78bn (margin: 11.7%) – flat organically and broadly in line with current guidance.
• 2015 and beyond: We anticipate a return to organic growth in 2015 (5% yoy) driven largely by Civil Aerospace and with a further acceleration thereafter. We also expect margins to improve progressively due to restructuring benefits and
20
40
60
80
100
2012 2013 2014 2015 2016
67
69
71
73
75
900
1000
1100
1200
1300
Share Price 12 mth fwd EPS
February warning
May IMS

Rolls-Royce Holdings plc Aerospace & Defence
250
operational efficiencies and higher contract profitability more than offsetting mix headwinds. Our forecasts assume that group EBIT margins will increase by 60bp in FY15 and by a further 40bp in FY16. Note that our FY15 and FY16 forecasts reflect the full-year effect of the energy businesses disposal – equivalent to about a 3.5% dilution at the EPS level, implying that our underlying estimates are c1.5% below consensus.
Rolls-Royce Holdings plc Aerospace & Defence
251
Investment risks and concerns
• There is a risk that the strategy update on 19 June will fail to quell concerns: As already mentioned, investor sentiment remains fragile, and so in our view an unconvincing message at the investor Briefing in June represents the most significant risk to valuation in the short term. Recent communications announcing changes to guidance have not helped to improve investors’ perceptions towards the company. This even applied to the disposal of the energy assets to Siemens announced in May, an event that should have been positive for sentiment, yet prompted more questions than answers.
• M&A risk: We consider later in this report management’s aborted approach to Wärtsilä (market cap: c€8bn) earlier this year. A transaction of this scale was not anticipated by the market and appears not to be attractive to investors. Management has not subsequently ruled out large-cap M&A, fuelling speculation that a bid could be resurrected. However, we suggest the probability of a potential re-bid is lower following the £2bn buyout of the Tognum JV stake from Daimler in April.
• There is a risk that operating improvements will be slow to materialise: Slower delivery of cost and cash improvements against expectations could pressure forecasts and further erode confidence. Implicit in our (and the market’s) forecast is an assumption that margins will progressively benefit cost reduction and efficiency improvement initiatives, particularly in the Civil Aerospace division. Despite a two-year focus on this, progress appears, at least outwardly, to have been limited. Steady operational improvement is an important element in our assumption that adverse mix impacts of higher new engine sales can be offset.
• The shares are vulnerable to a de-rating: Despite the share’s recent underperformance, investors’ confidence remains fragile and hence the stock could be vulnerable to valuation downside if financial performance falls short of guidance. The current P/E valuation of 14.6x (12-month forward) is more than a 15% premium to the long-term average (albeit is in line with civil aero peers), leaving scope for further share price volatility if, for example, the company lowers guidance again.
• Programme delays: The key development programmes relate to the Trent XWB for variants of the Airbus A350 aircraft (the -800 and the -1000). Major milestones are being met on both the engine and aircraft developments, and in Rolls-Royce’s case, engine maturity is reported by the company as being more advanced at this stage than any other previous development programme. Overall, we are relatively sanguine about programme risk in that we do not consider it to be elevated compared to history.
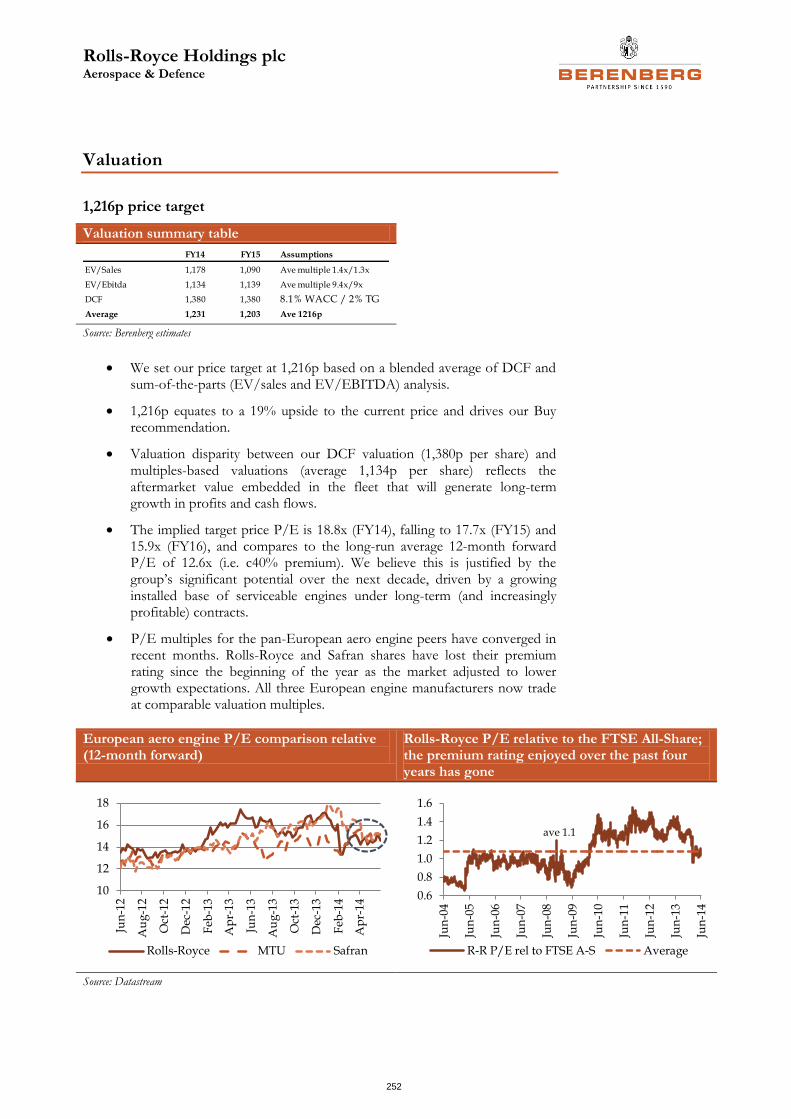
Rolls-Royce Holdings plc Aerospace & Defence
252
Valuation
1,216p price target
Valuation summary table
Source: Berenberg estimates
We set our price target at 1,216p based on a blended average of DCF and sum-of-the-parts (EV/sales and EV/EBITDA) analysis.
1,216p equates to a 19% upside to the current price and drives our Buy recommendation.
Valuation disparity between our DCF valuation (1,380p per share) and multiples-based valuations (average 1,134p per share) reflects the aftermarket value embedded in the fleet that will generate long-term growth in profits and cash flows.
The implied target price P/E is 18.8x (FY14), falling to 17.7x (FY15) and 15.9x (FY16), and compares to the long-run average 12-month forward P/E of 12.6x (i.e. c40% premium). We believe this is justified by the group’s significant potential over the next decade, driven by a growing installed base of serviceable engines under long-term (and increasingly profitable) contracts.
P/E multiples for the pan-European aero engine peers have converged in recent months. Rolls-Royce and Safran shares have lost their premium rating since the beginning of the year as the market adjusted to lower growth expectations. All three European engine manufacturers now trade at comparable valuation multiples.
European aero engine P/E comparison relative (12-month forward)
Rolls-Royce P/E relative to the FTSE All-Share; the premium rating enjoyed over the past four years has gone
Source: Datastream
FY14 FY15 Assumptions
EV/Sales 1,178 1,090 Ave multiple 1.4x/1.3x
EV/Ebitda 1,134 1,139 Ave multiple 9.4x/9x
DCF 1,380 1,380 8.1% WACC / 2% TG
Average 1,231 1,203 Ave 1216p
10
12
14
16
18
Jun
-12
Au
g-1
2
Oct
-12
Dec
-12
Feb
-13
Ap
r-1
3
Jun
-13
Au
g-1
3
Oct
-13
Dec
-13
Feb
-14
Ap
r-1
4
Rolls-Royce MTU Safran
0.6
0.8
1.0
1.2
1.4
1.6
Jun
-04
Jun
-05
Jun
-06
Jun
-07
Jun
-08
Jun
-09
Jun
-10
Jun
-11
Jun
-12
Jun
-13
Jun
-14
R-R P/E rel to FTSE A-S Average
ave 1.1
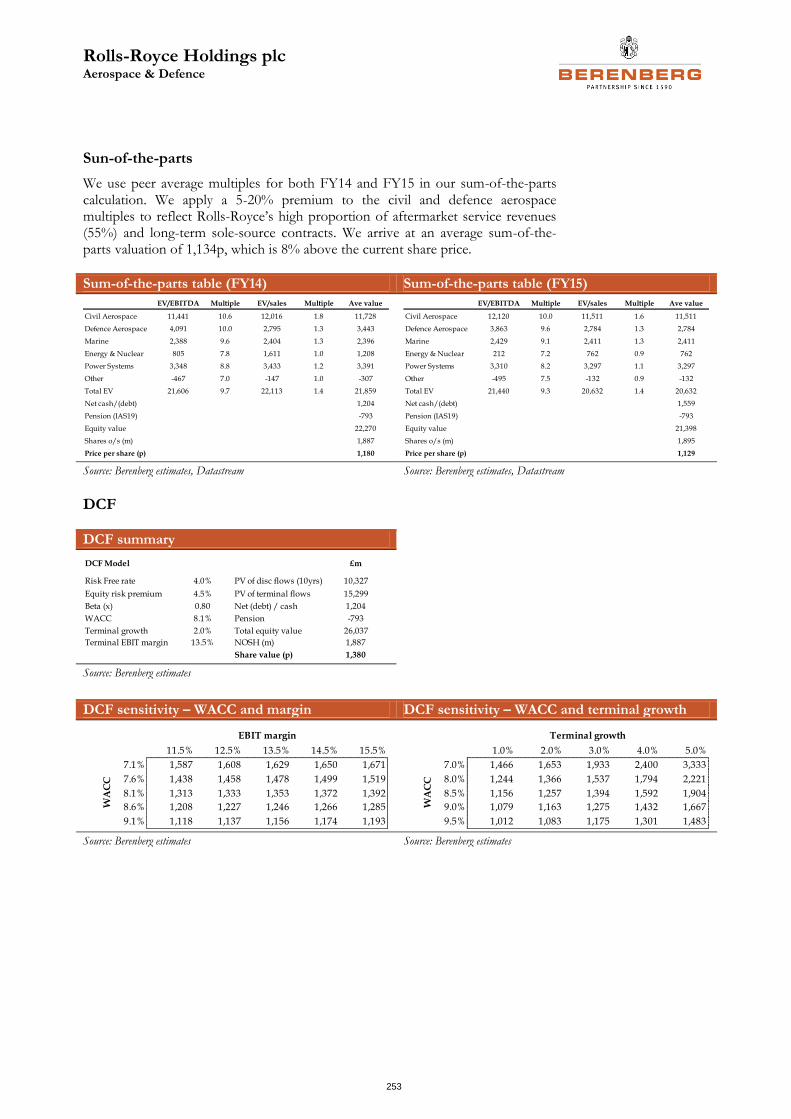
Rolls-Royce Holdings plc Aerospace & Defence
253
Sun-of-the-parts
We use peer average multiples for both FY14 and FY15 in our sum-of-the-parts calculation. We apply a 5-20% premium to the civil and defence aerospace multiples to reflect Rolls-Royce’s high proportion of aftermarket service revenues (55%) and long-term sole-source contracts. We arrive at an average sum-of-the-parts valuation of 1,134p, which is 8% above the current share price.
Sum-of-the-parts table (FY14) Sum-of-the-parts table (FY15)
Source: Berenberg estimates, Datastream Source: Berenberg estimates, Datastream
DCF
DCF summary
Source: Berenberg estimates
DCF sensitivity – WACC and margin DCF sensitivity – WACC and terminal growth
Source: Berenberg estimates Source: Berenberg estimates
EV/EBITDA Multiple EV/sales Multiple Ave value
Civil Aerospace 11,441 10.6 12,016 1.8 11,728
Defence Aerospace 4,091 10.0 2,795 1.3 3,443
Marine 2,388 9.6 2,404 1.3 2,396
Energy & Nuclear 805 7.8 1,611 1.0 1,208
Power Systems 3,348 8.8 3,433 1.2 3,391
Other -467 7.0 -147 1.0 -307
Total EV 21,606 9.7 22,113 1.4 21,859
Net cash/(debt) 1,204
Pension (IAS19) -793
Equity value 22,270
Shares o/s (m) 1,887
Price per share (p) 1,180
EV/EBITDA Multiple EV/sales Multiple Ave value
Civil Aerospace 12,120 10.0 11,511 1.6 11,511
Defence Aerospace 3,863 9.6 2,784 1.3 2,784
Marine 2,429 9.1 2,411 1.3 2,411
Energy & Nuclear 212 7.2 762 0.9 762
Power Systems 3,310 8.2 3,297 1.1 3,297
Other -495 7.5 -132 0.9 -132
Total EV 21,440 9.3 20,632 1.4 20,632
Net cash/(debt) 1,559
Pension (IAS19) -793
Equity value 21,398
Shares o/s (m) 1,895
Price per share (p) 1,129
DCF Model £m
Risk Free rate 4.0% PV of disc flows (10yrs) 10,327
Equity risk premium 4.5% PV of terminal flows 15,299
Beta (x) 0.80 Net (debt) / cash 1,204
WACC 8.1% Pension -793
Terminal growth 2.0% Total equity value 26,037
Terminal EBIT margin 13.5% NOSH (m) 1,887
Share value (p) 1,380
1336 11.5% 12.5% 13.5% 14.5% 15.5%
7.1% 1,587 1,608 1,629 1,650 1,671
7.6% 1,438 1,458 1,478 1,499 1,519
8.1% 1,313 1,333 1,353 1,372 1,392
8.6% 1,208 1,227 1,246 1,266 1,285
9.1% 1,118 1,137 1,156 1,174 1,193
EBIT margin
WA
CC
1336 1.0% 2.0% 3.0% 4.0% 5.0%
7.0% 1,466 1,653 1,933 2,400 3,333
8.0% 1,244 1,366 1,537 1,794 2,221
8.5% 1,156 1,257 1,394 1,592 1,904
9.0% 1,079 1,163 1,275 1,432 1,667
9.5% 1,012 1,083 1,175 1,301 1,483
Terminal growth
WA
CC
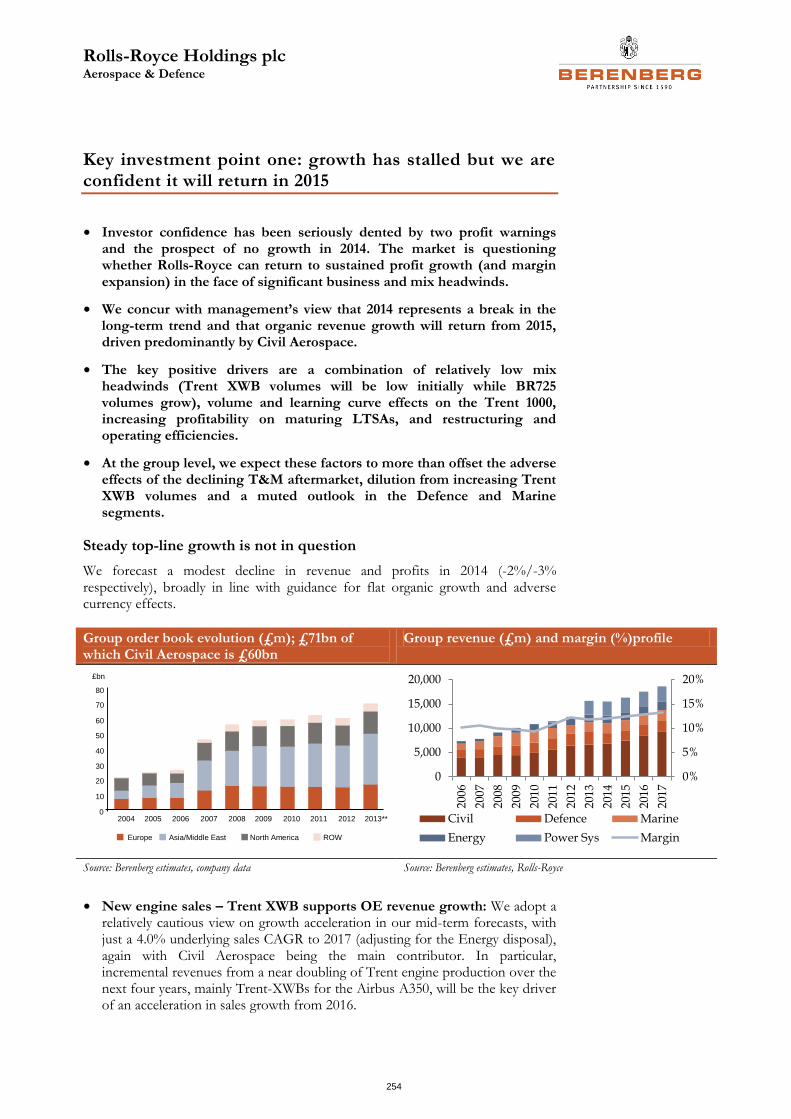
Rolls-Royce Holdings plc Aerospace & Defence
254
Key investment point one: growth has stalled but we are confident it will return in 2015
• Investor confidence has been seriously dented by two profit warnings and the prospect of no growth in 2014. The market is questioning whether Rolls-Royce can return to sustained profit growth (and margin expansion) in the face of significant business and mix headwinds.
• We concur with management’s view that 2014 represents a break in the long-term trend and that organic revenue growth will return from 2015, driven predominantly by Civil Aerospace.
• The key positive drivers are a combination of relatively low mix headwinds (Trent XWB volumes will be low initially while BR725 volumes grow), volume and learning curve effects on the Trent 1000, increasing profitability on maturing LTSAs, and restructuring and operating efficiencies.
• At the group level, we expect these factors to more than offset the adverse effects of the declining T&M aftermarket, dilution from increasing Trent XWB volumes and a muted outlook in the Defence and Marine segments.
Steady top-line growth is not in question
We forecast a modest decline in revenue and profits in 2014 (-2%/-3% respectively), broadly in line with guidance for flat organic growth and adverse currency effects.
Group order book evolution (£m); £71bn of which Civil Aerospace is £60bn
Group revenue (£m) and margin (%)profile
Source: Berenberg estimates, company data Source: Berenberg estimates, Rolls-Royce
• New engine sales – Trent XWB supports OE revenue growth: We adopt a relatively cautious view on growth acceleration in our mid-term forecasts, with just a 4.0% underlying sales CAGR to 2017 (adjusting for the Energy disposal), again with Civil Aerospace being the main contributor. In particular, incremental revenues from a near doubling of Trent engine production over the next four years, mainly Trent-XWBs for the Airbus A350, will be the key driver of an acceleration in sales growth from 2016.
Europe Asia/Middle East North America ROW
2004 2005 2006 2007 2008 2009 2010 2011 2012 2013**0
10
20
30
40
50
60
70
80
£bn
0%
5%
10%
15%
20%
0
5,000
10,000
15,000
20,000
200
6
200
7
200
8
200
9
201
0
201
1
201
2
201
3
201
4
201
5
201
6
201
7
Civil Defence Marine
Energy Power Sys Margin
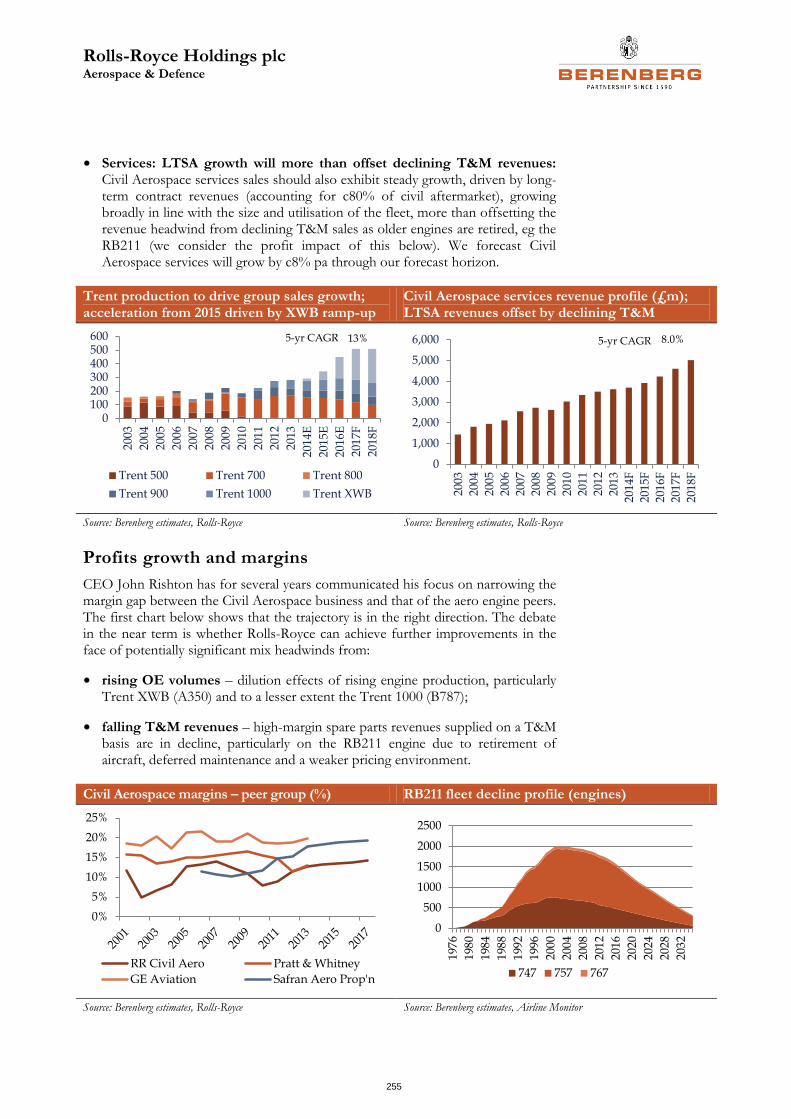
Rolls-Royce Holdings plc Aerospace & Defence
255
• Services: LTSA growth will more than offset declining T&M revenues: Civil Aerospace services sales should also exhibit steady growth, driven by long-term contract revenues (accounting for c80% of civil aftermarket), growing broadly in line with the size and utilisation of the fleet, more than offsetting the revenue headwind from declining T&M sales as older engines are retired, eg the RB211 (we consider the profit impact of this below). We forecast Civil Aerospace services will grow by c8% pa through our forecast horizon.
Trent production to drive group sales growth; acceleration from 2015 driven by XWB ramp-up
Civil Aerospace services revenue profile (£m); LTSA revenues offset by declining T&M
Source: Berenberg estimates, Rolls-Royce Source: Berenberg estimates, Rolls-Royce
Profits growth and margins
CEO John Rishton has for several years communicated his focus on narrowing the margin gap between the Civil Aerospace business and that of the aero engine peers. The first chart below shows that the trajectory is in the right direction. The debate in the near term is whether Rolls-Royce can achieve further improvements in the face of potentially significant mix headwinds from:
• rising OE volumes – dilution effects of rising engine production, particularly Trent XWB (A350) and to a lesser extent the Trent 1000 (B787);
• falling T&M revenues – high-margin spare parts revenues supplied on a T&M basis are in decline, particularly on the RB211 engine due to retirement of aircraft, deferred maintenance and a weaker pricing environment.
Civil Aerospace margins – peer group (%) RB211 fleet decline profile (engines)
Source: Berenberg estimates, Rolls-Royce Source: Berenberg estimates, Airline Monitor
0100200300400500600
2003
2004
200
5
200
6
200
7
200
8
200
9
201
0
201
1
201
2
201
3
201
4E
201
5E
201
6E
2017
F
201
8F
Trent 500 Trent 700 Trent 800
Trent 900 Trent 1000 Trent XWB
13%5-yr CAGR
0
1,000
2,000
3,000
4,000
5,000
6,000
200
3
200
4
2005
200
6
200
7
200
8
200
9
2010
201
1
201
2
201
3
201
4F
2015
F
201
6F
201
7F
201
8F
5-yr CAGR 8.0%
0%
5%
10%
15%
20%
25%
RR Civil Aero Pratt & Whitney
GE Aviation Safran Aero Prop'n
0
500
1000
1500
2000
2500
197
6
198
0
1984
198
8
199
2
1996
200
0
200
4
200
8
201
2
201
6
202
0
202
4
202
8
203
2
747 757 767
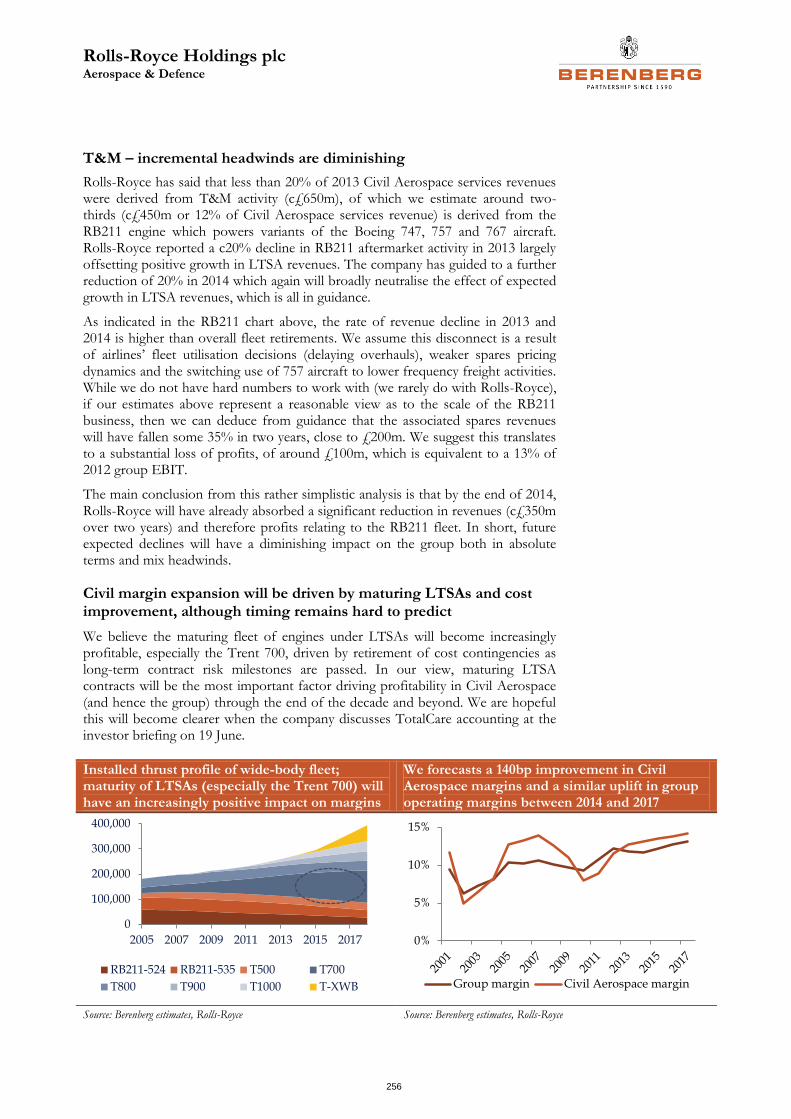
Rolls-Royce Holdings plc Aerospace & Defence
256
T&M – incremental headwinds are diminishing
Rolls-Royce has said that less than 20% of 2013 Civil Aerospace services revenues were derived from T&M activity (c£650m), of which we estimate around two-thirds (c£450m or 12% of Civil Aerospace services revenue) is derived from the RB211 engine which powers variants of the Boeing 747, 757 and 767 aircraft. Rolls-Royce reported a c20% decline in RB211 aftermarket activity in 2013 largely offsetting positive growth in LTSA revenues. The company has guided to a further reduction of 20% in 2014 which again will broadly neutralise the effect of expected growth in LTSA revenues, which is all in guidance.
As indicated in the RB211 chart above, the rate of revenue decline in 2013 and 2014 is higher than overall fleet retirements. We assume this disconnect is a result of airlines’ fleet utilisation decisions (delaying overhauls), weaker spares pricing dynamics and the switching use of 757 aircraft to lower frequency freight activities. While we do not have hard numbers to work with (we rarely do with Rolls-Royce), if our estimates above represent a reasonable view as to the scale of the RB211 business, then we can deduce from guidance that the associated spares revenues will have fallen some 35% in two years, close to £200m. We suggest this translates to a substantial loss of profits, of around £100m, which is equivalent to a 13% of 2012 group EBIT.
The main conclusion from this rather simplistic analysis is that by the end of 2014, Rolls-Royce will have already absorbed a significant reduction in revenues (c£350m over two years) and therefore profits relating to the RB211 fleet. In short, future expected declines will have a diminishing impact on the group both in absolute terms and mix headwinds.
Civil margin expansion will be driven by maturing LTSAs and cost improvement, although timing remains hard to predict
We believe the maturing fleet of engines under LTSAs will become increasingly profitable, especially the Trent 700, driven by retirement of cost contingencies as long-term contract risk milestones are passed. In our view, maturing LTSA contracts will be the most important factor driving profitability in Civil Aerospace (and hence the group) through the end of the decade and beyond. We are hopeful this will become clearer when the company discusses TotalCare accounting at the investor briefing on 19 June.
Installed thrust profile of wide-body fleet; maturity of LTSAs (especially the Trent 700) will have an increasingly positive impact on margins
We forecasts a 140bp improvement in Civil Aerospace margins and a similar uplift in group operating margins between 2014 and 2017
Source: Berenberg estimates, Rolls-Royce Source: Berenberg estimates, Rolls-Royce
0
100,000
200,000
300,000
400,000
2005 2007 2009 2011 2013 2015 2017
RB211-524 RB211-535 T500 T700
T800 T900 T1000 T-XWB
0%
5%
10%
15%
Group margin Civil Aerospace margin
Rolls-Royce Holdings plc Aerospace & Defence
257
Fleet installed thrust (installed base multiplied by engine thrust) serves as a proxy for service revenues on engines supported under LTSAs. The first chart above illustrates why we are confident that aftermarket revenues will continue to grow – we estimate the installed thrust of Rolls-Royce’s wide-body fleet will increase by around c8% pa over the next five years, a combination of 13% growth pa in the Trent installed thrust offset by c7% pa declines in the RB211 as engines are retired.
Trent 700 to drive a structural increase in the Civil Aerospace margin
An important observation is the increasing scale and maturity of the Trent 700 fleet which powers the A330 aircraft. We estimate the average age of the Trent 700 fleet is six years, just under half the duration of a typical LTSA (12-15 years), and as this, plus the smaller but equally ageing Trent 800 (B777) fleet matures, we expect retiring cost contingencies to increase contract profitability. Back-end-loaded profitability is typical for any long-term contracting model that is priced correctly with risks that are increasingly retired into maturity. Our conclusion from analysing the Rolls-Royce fleet is that Civil Aerospace services margins will structurally increase over the coming years driven by Trent-related LTSA activity more than offsetting the (steadily diminishing) impact of lower T&M sales. This is turn will be a significant factor driving group margins over the long term, we believe.
Rolls-Royce Holdings plc Aerospace & Defence
258
Key investment point two: accounting vagaries – further FRC-driven changes unlikely
• In our view, adoption of the FRC recommendations better reflects the long-term economic reality of engine development and programme lifecycle by aligning the accounting treatment of self-funded and customer-funded R&D. This puts to bed an accounting issue that has been long debated by the financial community.
• The risk of further accounting changes is negligible now that the company has confirmed there are no ongoing enquiries with the FRC.
• Capitalised intangibles, particularly recoverable engine costs (losses on new engine sales), will remain a contentious issue. However, we estimate that the net P&L impact has reduced to a low single-digit percentage of profits due to programme-phasing and increasing amortisation.
Rolls-Royce has long been criticised for adopting various accounting policies with the resultant mismatch of profits and cash. While we do not propose a forensic examination of accounting policies in this note we consider the recent changes recommended by the FRC and also, more broadly, the impacts of the capitalisation policies. Whether or not we agree with them, we think it is likely some of the financial community will continue to harbour concerns about Rolls-Royce’s capitalisation policies and argue they reduce the quality of profits.
FRC change to accounting for partner entry fees is a red herring
In the past, fees paid by third-party manufacturers for a share of development programmes, described as risk- and revenue-sharing partnership (RRSP) income, was recognised as profit (and cash) in the year of receipt. No attempt was made to capitalise and “match” against future payments to the risk sharing partner once the engine moved into commercial production.
In the FY13 results, Rolls-Royce revealed that an FRC review required the company to change its accounting policy to bring RRSP treatment into line with that of R&D (where there is capitalisation). We agree with the FRC’s recommendation, which has been partially adopted by Rolls-Royce, to defer “entry fee” receipts in proportion to R&D costs capitalised on new programme developments and recognise it against the amortisation of these costs in the production phase. The impact of the accounting change on pre-tax profits was a restatement of +£25m in 2012 and -£39m in 2013 (or 1.6% and 2.1% respectively of underlying profit).
In our view, the RRSP issue carried more weight historically when development activity was higher and hence third party entry fees were greater, both in absolute terms and relative to the size of the group. Once the TrentXWB engine programme enters into service in Q414, we expect entry fee receipts to return to a low level of several tens of millions of pounds (from £110m in 2013) followed by modest fluctuations in line with the development phasing of the remaining TrentXWB variants. In short, we conclude the P&L impact of entry fees accounting is becoming less material.
Following further discussions with the FRC regarding accounting for TotalCare© contracts (essentially the capitalisation of losses on the sale of new engines linked
Rolls-Royce Holdings plc Aerospace & Defence
259
to LTSAs), Rolls-Royce commented in its recent IMS that no further adjustments or restatements are required and that there are no other on-going enquiries with the FRC. We note that Rolls-Royce is the only aero engine manufacturer to currently adopting a policy of capitalising engine losses, which results in a pull-forward of accounting profit on contracts where the LTSA is linked to the engine sale. We consider this in more detail below.
Capitalised intangibles – standard accounting treatment apart from engine losses
In addition to more familiar intangible assets such as purchased goodwill and software, Rolls-Royce’s accounting policies around the capitalisation of R&D, engine certification costs and recoverable engine costs (RECs) have fuelled endless debate about the overstatement of profits. As at December 2013, these items were carried in the balance sheet with a net book value of £2bn (of which c£500m relates to Tognum), or around one-third of net assets. In P&L terms, we calculate that the net impact of capitalisation has fluctuated over the past few years from -3% to +25% of underlying profit, depending largely on the phasing of new programme developments.
• R&D: Where certain criteria are satisfied such as technical feasibility and commercial viability, costs incurred towards the final stages of engine development are capitalised and amortised up to a maximum of 15 years. Capitalisation of R&D is not uncommon among aero engine peers and other aftermarket companies where high development costs are incurred for long-cycle products and revenues are reasonably certain (both OE and spares parts).
• Certification costs: This relates to payments made to aircraft manufacturers to participate in new engine programmes, as well as the costs incurred in meeting regulatory certification requirements. Cost are capitalised if they are deemed to be recoverable out of future sales and are amortised over a maximum of 15 years. Again, capitalisation of these “participation costs” is not uncommon in the sector; Safran considers them as acquired intangibles and amortises over up to 20 years while Meggitt’s policy is to capitalise programme participation costs (PPCs) where it has principle supplier status and amortises them over a maximum of 15 years.
• Recoverable engine costs (RECs): As previously stated, the losses incurred on engines supplied below cost are expected to be recovered from future aftermarket sales. Capitalised RECs are amortised over the expected period of utilisation by the original customer, typically the duration of the LTSA. Rolls-Royce is the only engine manufacturer in our coverage to capitalise engine losses.
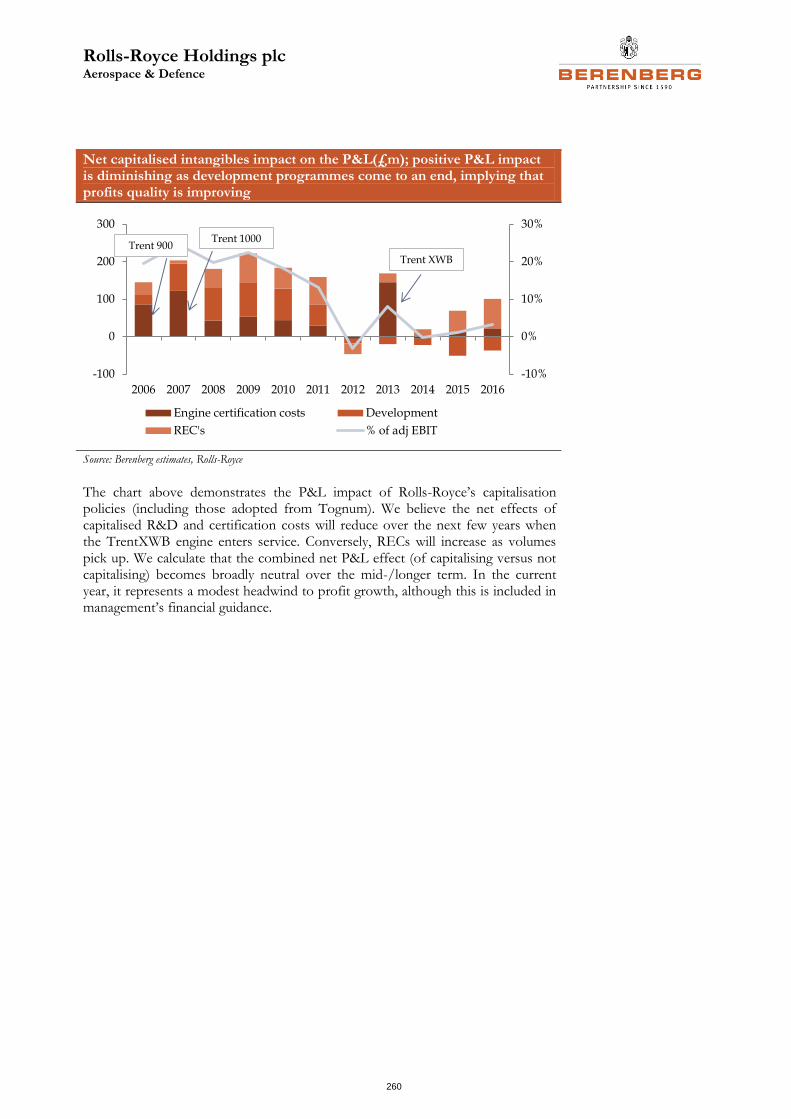
Rolls-Royce Holdings plc Aerospace & Defence
260
Net capitalised intangibles impact on the P&L(£m); positive P&L impact is diminishing as development programmes come to an end, implying that profits quality is improving
Source: Berenberg estimates, Rolls-Royce
The chart above demonstrates the P&L impact of Rolls-Royce’s capitalisation policies (including those adopted from Tognum). We believe the net effects of capitalised R&D and certification costs will reduce over the next few years when the TrentXWB engine enters service. Conversely, RECs will increase as volumes pick up. We calculate that the combined net P&L effect (of capitalising versus not capitalising) becomes broadly neutral over the mid-/longer term. In the current year, it represents a modest headwind to profit growth, although this is included in management’s financial guidance.
-10%
0%
10%
20%
30%
-100
0
100
200
300
2006 2007 2008 2009 2010 2011 2012 2013 2014 2015 2016
Engine certification costs Development
REC's % of adj EBIT
Trent 1000
Trent XWB
Trent 900
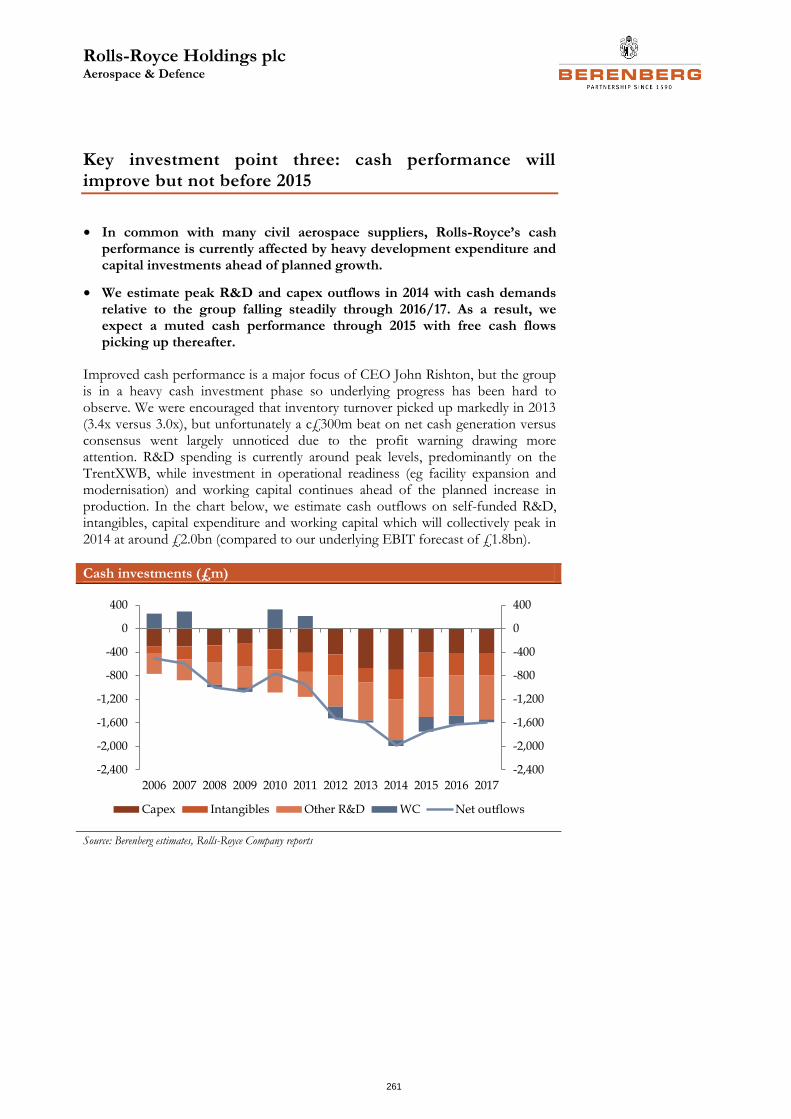
Rolls-Royce Holdings plc Aerospace & Defence
261
Key investment point three: cash performance will improve but not before 2015
• In common with many civil aerospace suppliers, Rolls-Royce’s cash performance is currently affected by heavy development expenditure and capital investments ahead of planned growth.
• We estimate peak R&D and capex outflows in 2014 with cash demands relative to the group falling steadily through 2016/17. As a result, we expect a muted cash performance through 2015 with free cash flows picking up thereafter.
Improved cash performance is a major focus of CEO John Rishton, but the group is in a heavy cash investment phase so underlying progress has been hard to observe. We were encouraged that inventory turnover picked up markedly in 2013 (3.4x versus 3.0x), but unfortunately a c£300m beat on net cash generation versus consensus went largely unnoticed due to the profit warning drawing more attention. R&D spending is currently around peak levels, predominantly on the TrentXWB, while investment in operational readiness (eg facility expansion and modernisation) and working capital continues ahead of the planned increase in production. In the chart below, we estimate cash outflows on self-funded R&D, intangibles, capital expenditure and working capital which will collectively peak in 2014 at around £2.0bn (compared to our underlying EBIT forecast of £1.8bn).
Cash investments (£m)
Source: Berenberg estimates, Rolls-Royce Company reports
-2,400
-2,000
-1,600
-1,200
-800
-400
0
400
-2,400
-2,000
-1,600
-1,200
-800
-400
0
400
2006 2007 2008 2009 2010 2011 2012 2013 2014 2015 2016 2017
Capex Intangibles Other R&D WC Net outflows
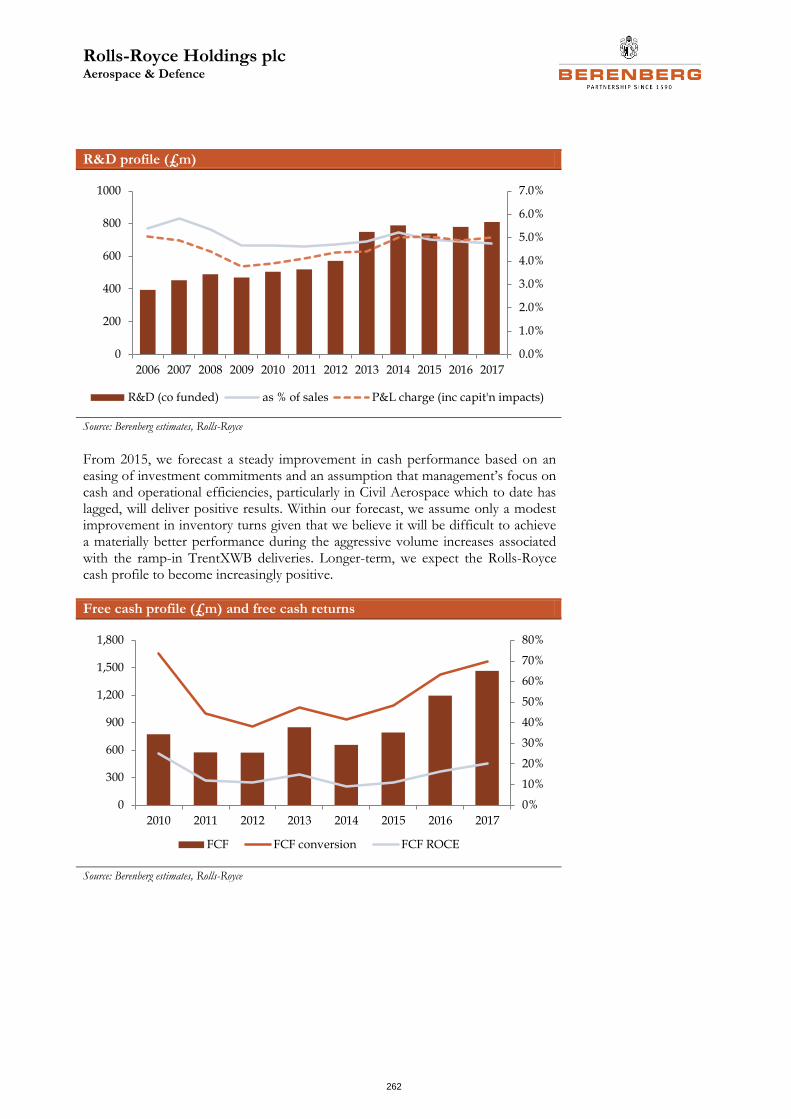
Rolls-Royce Holdings plc Aerospace & Defence
262
R&D profile (£m)
Source: Berenberg estimates, Rolls-Royce
From 2015, we forecast a steady improvement in cash performance based on an easing of investment commitments and an assumption that management’s focus on cash and operational efficiencies, particularly in Civil Aerospace which to date has lagged, will deliver positive results. Within our forecast, we assume only a modest improvement in inventory turns given that we believe it will be difficult to achieve a materially better performance during the aggressive volume increases associated with the ramp-in TrentXWB deliveries. Longer-term, we expect the Rolls-Royce cash profile to become increasingly positive.
Free cash profile (£m) and free cash returns
Source: Berenberg estimates, Rolls-Royce
0.0%
1.0%
2.0%
3.0%
4.0%
5.0%
6.0%
7.0%
0
200
400
600
800
1000
2006 2007 2008 2009 2010 2011 2012 2013 2014 2015 2016 2017
R&D (co funded) as % of sales P&L charge (inc capit'n impacts)
0%
10%
20%
30%
40%
50%
60%
70%
80%
0
300
600
900
1,200
1,500
1,800
2010 2011 2012 2013 2014 2015 2016 2017
FCF FCF conversion FCF ROCE
Rolls-Royce Holdings plc Aerospace & Defence
263
Investment point four: risk of large-scale M&A will continue to weigh on sentiment
• The market is pricing a high probability that Rolls-Royce’s aborted approach to Wärtsilä earlier this year will be resurrected. Wärtsilä’s shares are c20% higher than the pre-talks level.
• The industrial logic of the acquisition is sound: Rolls-Royce would become dominant in marine and industrial reciprocating engines. However, investors’ appetite for a deal of this scale is muted (EV c€8.5bn). It dilutes the civil growth story and could distract management.
• We suggest valuation multiples would be full; we estimate 2.0x EV/sales and 18.0x EV/EBIT. Earnings accretion (or dilution) would depend on the size and discount of any equity financing and/or share offer.
• Maintaining an investment grade rating remains a high priority for management, which suggests to us that a multi-billion pound, all cash deal is an unlikely scenario and that a (combined) share offer would represent a more probable deal structure.
• In summary, we think there are too many variables to assess accurately the potential financial impact of a deal of this magnitude. Management’s M&A intentions should become clearer at the investor briefing on 19 June, when the topic of capital allocation is on the agenda. Until then, the risk of large-scale M&A will continue to constrain valuation upside, we believe.
For the record – why is Wärtsilä of interest?
Wärtsilä is a market leader in medium-speed diesel engines (52% market share) in the marine and industrial sectors. By segment, revenues are split Ship Power 29%, Power Plants 31% and Services 40%. This would complement Rolls-Royce’s strong position in high-speed engines (Tognum) and the group’s sub-scale position in low-/medium-speed engines (Bergen). In terms of relative scale, Wärtsilä’s Marine business is larger than Rolls-Royce’s at c£2.5bn of sales versus £1.8bn (assuming Wärtsilä’s services activities are broadly evenly split by sector). A combination would create a c£4.5bn Marine business accounting for c24% of the enlarged Rolls-Royce group compared to 12% currently (ex-Submarines).
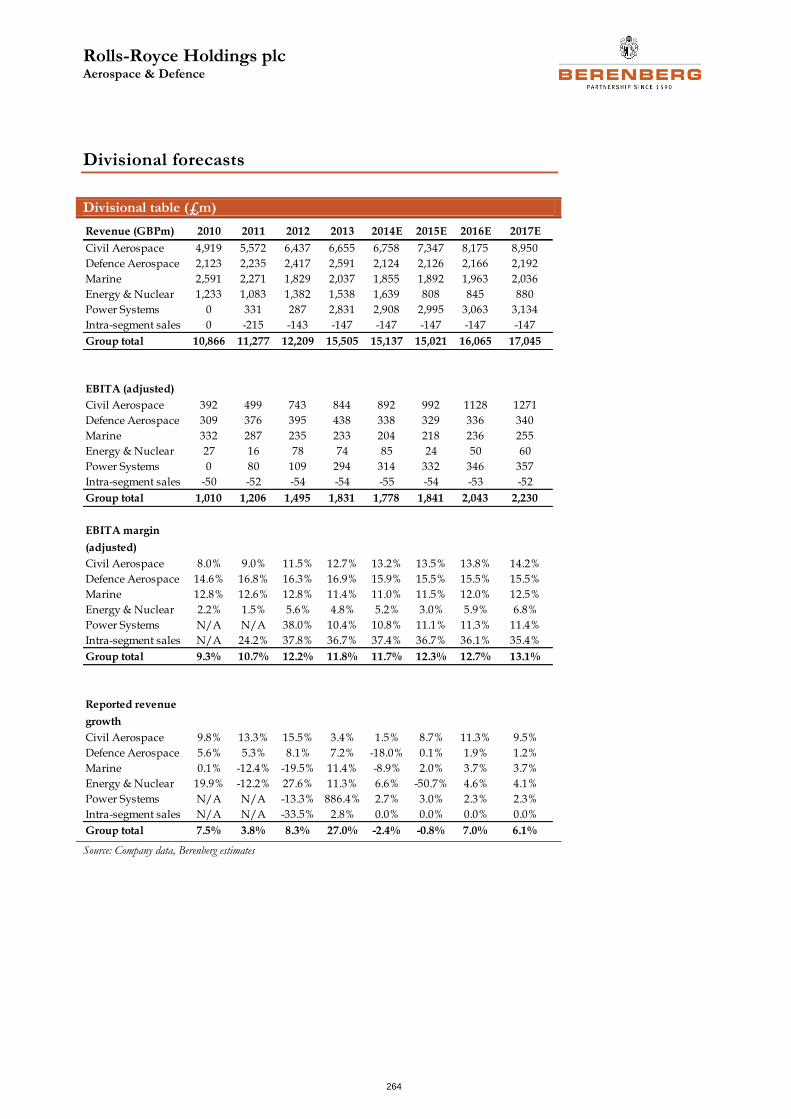
Rolls-Royce Holdings plc Aerospace & Defence
264
Divisional forecasts
Divisional table (£m)
Source: Company data, Berenberg estimates
Revenue (GBPm) 2010 2011 2012 2013 2014E 2015E 2016E 2017E
Civil Aerospace 4,919 5,572 6,437 6,655 6,758 7,347 8,175 8,950
Defence Aerospace 2,123 2,235 2,417 2,591 2,124 2,126 2,166 2,192
Marine 2,591 2,271 1,829 2,037 1,855 1,892 1,963 2,036
Energy & Nuclear 1,233 1,083 1,382 1,538 1,639 808 845 880
Power Systems 0 331 287 2,831 2,908 2,995 3,063 3,134
Intra-segment sales 0 -215 -143 -147 -147 -147 -147 -147
Group total 10,866 11,277 12,209 15,505 15,137 15,021 16,065 17,045
EBITA (adjusted)
Civil Aerospace 392 499 743 844 892 992 1128 1271
Defence Aerospace 309 376 395 438 338 329 336 340
Marine 332 287 235 233 204 218 236 255
Energy & Nuclear 27 16 78 74 85 24 50 60
Power Systems 0 80 109 294 314 332 346 357
Intra-segment sales -50 -52 -54 -54 -55 -54 -53 -52
Group total 1,010 1,206 1,495 1,831 1,778 1,841 2,043 2,230
EBITA margin
(adjusted)
Civil Aerospace 8.0% 9.0% 11.5% 12.7% 13.2% 13.5% 13.8% 14.2%
Defence Aerospace 14.6% 16.8% 16.3% 16.9% 15.9% 15.5% 15.5% 15.5%
Marine 12.8% 12.6% 12.8% 11.4% 11.0% 11.5% 12.0% 12.5%
Energy & Nuclear 2.2% 1.5% 5.6% 4.8% 5.2% 3.0% 5.9% 6.8%
Power Systems N/A N/A 38.0% 10.4% 10.8% 11.1% 11.3% 11.4%
Intra-segment sales N/A 24.2% 37.8% 36.7% 37.4% 36.7% 36.1% 35.4%
Group total 9.3% 10.7% 12.2% 11.8% 11.7% 12.3% 12.7% 13.1%
Reported revenue
growth
Civil Aerospace 9.8% 13.3% 15.5% 3.4% 1.5% 8.7% 11.3% 9.5%
Defence Aerospace 5.6% 5.3% 8.1% 7.2% -18.0% 0.1% 1.9% 1.2%
Marine 0.1% -12.4% -19.5% 11.4% -8.9% 2.0% 3.7% 3.7%
Energy & Nuclear 19.9% -12.2% 27.6% 11.3% 6.6% -50.7% 4.6% 4.1%
Power Systems N/A N/A -13.3% 886.4% 2.7% 3.0% 2.3% 2.3%
Intra-segment sales N/A N/A -33.5% 2.8% 0.0% 0.0% 0.0% 0.0%
Group total 7.5% 3.8% 8.3% 27.0% -2.4% -0.8% 7.0% 6.1%
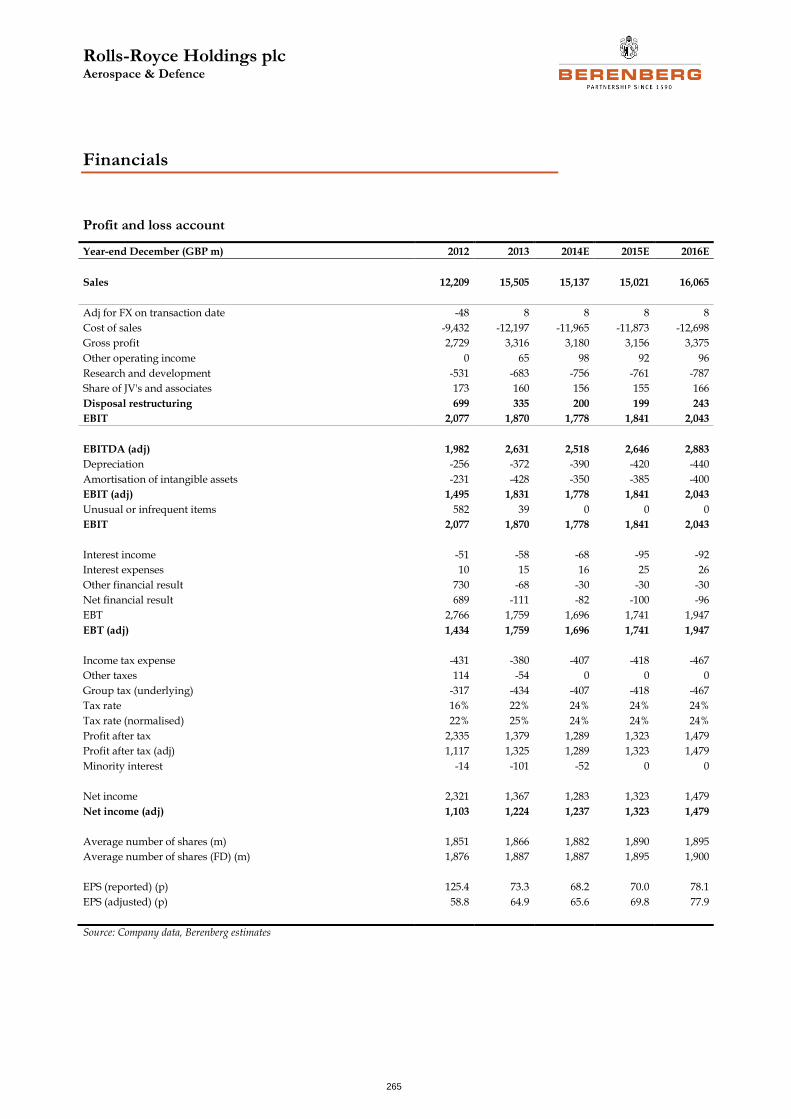
Rolls-Royce Holdings plc Aerospace & Defence
265
Financials
Profit and loss account
Year-end December (GBP m) 2012 2013 2014E 2015E 2016E
Sales 12,209 15,505 15,137 15,021 16,065
Adj for FX on transaction date -48 8 8 8 8
Cost of sales -9,432 -12,197 -11,965 -11,873 -12,698
Gross profit 2,729 3,316 3,180 3,156 3,375
Other operating income 0 65 98 92 96
Research and development -531 -683 -756 -761 -787
Share of JV's and associates 173 160 156 155 166
Disposal restructuring 699 335 200 199 243
EBIT 2,077 1,870 1,778 1,841 2,043
EBITDA (adj) 1,982 2,631 2,518 2,646 2,883
Depreciation -256 -372 -390 -420 -440
Amortisation of intangible assets -231 -428 -350 -385 -400
EBIT (adj) 1,495 1,831 1,778 1,841 2,043
Unusual or infrequent items 582 39 0 0 0
EBIT 2,077 1,870 1,778 1,841 2,043
Interest income -51 -58 -68 -95 -92
Interest expenses 10 15 16 25 26
Other financial result 730 -68 -30 -30 -30
Net financial result 689 -111 -82 -100 -96
EBT 2,766 1,759 1,696 1,741 1,947
EBT (adj) 1,434 1,759 1,696 1,741 1,947
Income tax expense -431 -380 -407 -418 -467
Other taxes 114 -54 0 0 0
Group tax (underlying) -317 -434 -407 -418 -467
Tax rate 16% 22% 24% 24% 24%
Tax rate (normalised) 22% 25% 24% 24% 24%
Profit after tax 2,335 1,379 1,289 1,323 1,479
Profit after tax (adj) 1,117 1,325 1,289 1,323 1,479
Minority interest -14 -101 -52 0 0
Net income 2,321 1,367 1,283 1,323 1,479
Net income (adj) 1,103 1,224 1,237 1,323 1,479
Average number of shares (m) 1,851 1,866 1,882 1,890 1,895
Average number of shares (FD) (m) 1,876 1,887 1,887 1,895 1,900
EPS (reported) (p) 125.4 73.3 68.2 70.0 78.1
EPS (adjusted) (p) 58.8 64.9 65.6 69.8 77.9
Source: Company data, Berenberg estimates
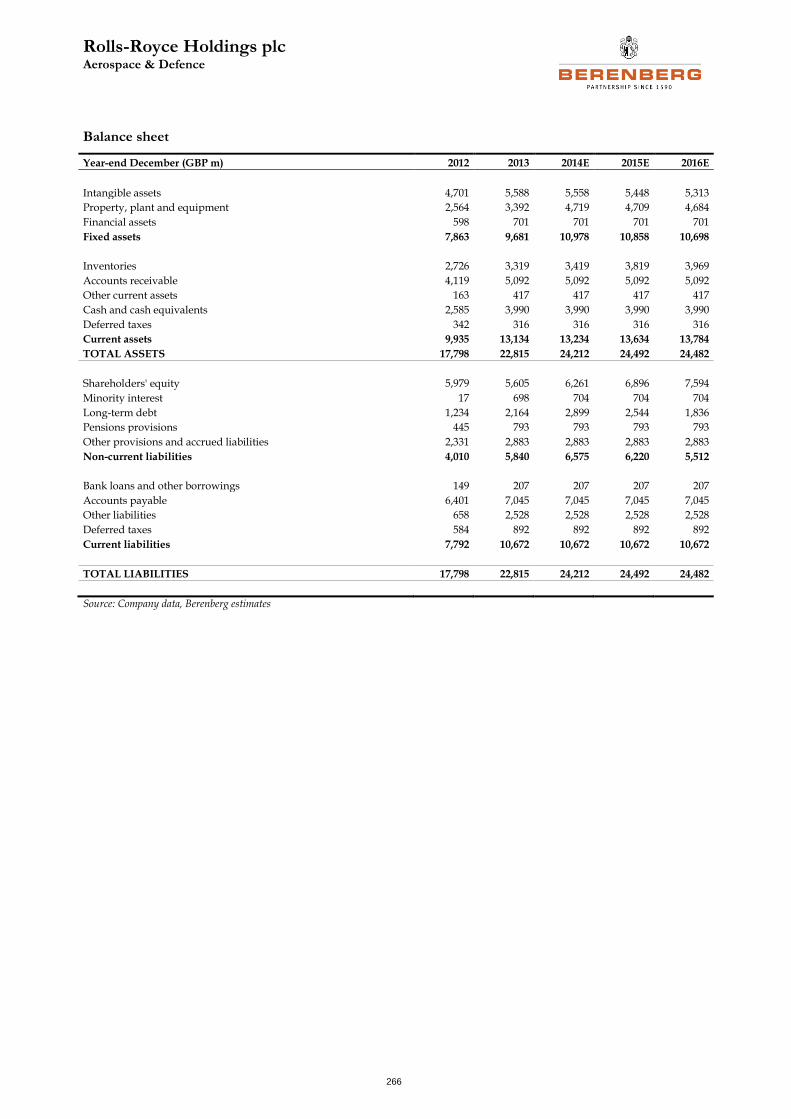
Rolls-Royce Holdings plc Aerospace & Defence
266
Balance sheet
Year-end December (GBP m) 2012 2013 2014E 2015E 2016E
Intangible assets 4,701 5,588 5,558 5,448 5,313
Property, plant and equipment 2,564 3,392 4,719 4,709 4,684
Financial assets 598 701 701 701 701
Fixed assets 7,863 9,681 10,978 10,858 10,698
Inventories 2,726 3,319 3,419 3,819 3,969
Accounts receivable 4,119 5,092 5,092 5,092 5,092
Other current assets 163 417 417 417 417
Cash and cash equivalents 2,585 3,990 3,990 3,990 3,990
Deferred taxes 342 316 316 316 316
Current assets 9,935 13,134 13,234 13,634 13,784
TOTAL ASSETS 17,798 22,815 24,212 24,492 24,482
Shareholders' equity 5,979 5,605 6,261 6,896 7,594
Minority interest 17 698 704 704 704
Long-term debt 1,234 2,164 2,899 2,544 1,836
Pensions provisions 445 793 793 793 793
Other provisions and accrued liabilities 2,331 2,883 2,883 2,883 2,883
Non-current liabilities 4,010 5,840 6,575 6,220 5,512
Bank loans and other borrowings 149 207 207 207 207
Accounts payable 6,401 7,045 7,045 7,045 7,045
Other liabilities 658 2,528 2,528 2,528 2,528
Deferred taxes 584 892 892 892 892
Current liabilities 7,792 10,672 10,672 10,672 10,672
TOTAL LIABILITIES 17,798 22,815 24,212 24,492 24,482
Source: Company data, Berenberg estimates
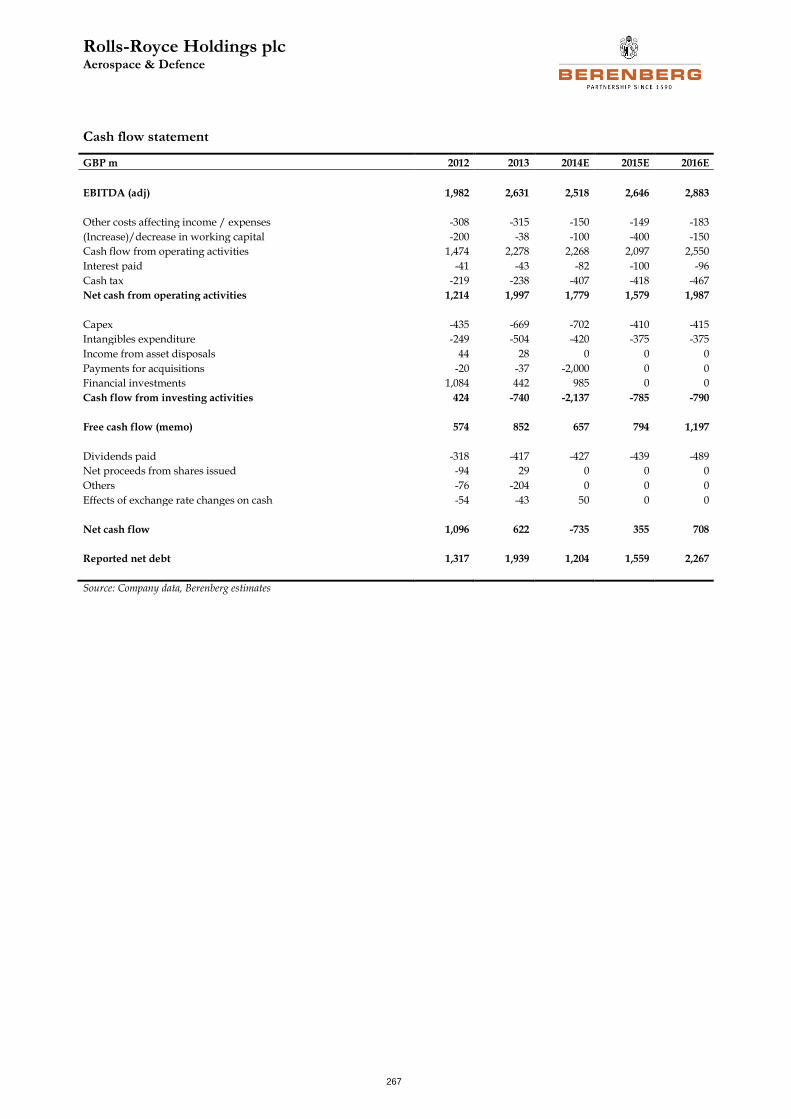
Rolls-Royce Holdings plc Aerospace & Defence
267
Cash flow statement
GBP m 2012 2013 2014E 2015E 2016E
EBITDA (adj) 1,982 2,631 2,518 2,646 2,883
Other costs affecting income / expenses -308 -315 -150 -149 -183
(Increase)/decrease in working capital -200 -38 -100 -400 -150
Cash flow from operating activities 1,474 2,278 2,268 2,097 2,550
Interest paid -41 -43 -82 -100 -96
Cash tax -219 -238 -407 -418 -467
Net cash from operating activities 1,214 1,997 1,779 1,579 1,987
Capex -435 -669 -702 -410 -415
Intangibles expenditure -249 -504 -420 -375 -375
Income from asset disposals 44 28 0 0 0
Payments for acquisitions -20 -37 -2,000 0 0
Financial investments 1,084 442 985 0 0
Cash flow from investing activities 424 -740 -2,137 -785 -790
Free cash flow (memo) 574 852 657 794 1,197
Dividends paid -318 -417 -427 -439 -489
Net proceeds from shares issued -94 29 0 0 0
Others -76 -204 0 0 0
Effects of exchange rate changes on cash -54 -43 50 0 0
Net cash flow 1,096 622 -735 355 708
Reported net debt 1,317 1,939 1,204 1,559 2,267
Source: Company data, Berenberg estimates
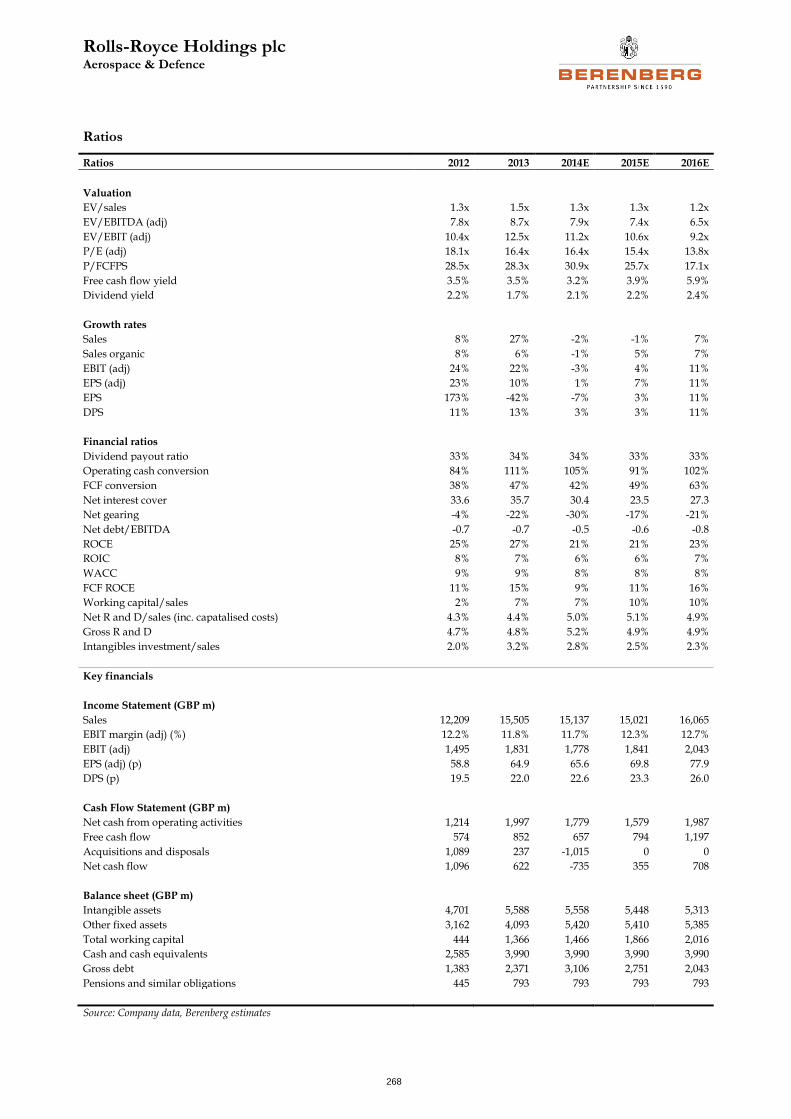
Rolls-Royce Holdings plc Aerospace & Defence
268
Ratios
Ratios 2012 2013 2014E 2015E 2016E
Valuation
EV/sales 1.3x 1.5x 1.3x 1.3x 1.2x
EV/EBITDA (adj) 7.8x 8.7x 7.9x 7.4x 6.5x
EV/EBIT (adj) 10.4x 12.5x 11.2x 10.6x 9.2x
P/E (adj) 18.1x 16.4x 16.4x 15.4x 13.8x
P/FCFPS 28.5x 28.3x 30.9x 25.7x 17.1x
Free cash flow yield 3.5% 3.5% 3.2% 3.9% 5.9%
Dividend yield 2.2% 1.7% 2.1% 2.2% 2.4%
Growth rates
Sales 8% 27% -2% -1% 7%
Sales organic 8% 6% -1% 5% 7%
EBIT (adj) 24% 22% -3% 4% 11%
EPS (adj) 23% 10% 1% 7% 11%
EPS 173% -42% -7% 3% 11%
DPS 11% 13% 3% 3% 11%
Financial ratios
Dividend payout ratio 33% 34% 34% 33% 33%
Operating cash conversion 84% 111% 105% 91% 102%
FCF conversion 38% 47% 42% 49% 63%
Net interest cover 33.6 35.7 30.4 23.5 27.3
Net gearing -4% -22% -30% -17% -21%
Net debt/EBITDA -0.7 -0.7 -0.5 -0.6 -0.8
ROCE 25% 27% 21% 21% 23%
ROIC 8% 7% 6% 6% 7%
WACC 9% 9% 8% 8% 8%
FCF ROCE 11% 15% 9% 11% 16%
Working capital/sales 2% 7% 7% 10% 10%
Net R and D/sales (inc. capatalised costs) 4.3% 4.4% 5.0% 5.1% 4.9%
Gross R and D 4.7% 4.8% 5.2% 4.9% 4.9%
Intangibles investment/sales 2.0% 3.2% 2.8% 2.5% 2.3%
Key financials
Income Statement (GBP m)
Sales 12,209 15,505 15,137 15,021 16,065
EBIT margin (adj) (%) 12.2% 11.8% 11.7% 12.3% 12.7%
EBIT (adj) 1,495 1,831 1,778 1,841 2,043
EPS (adj) (p) 58.8 64.9 65.6 69.8 77.9
DPS (p) 19.5 22.0 22.6 23.3 26.0
Cash Flow Statement (GBP m)
Net cash from operating activities 1,214 1,997 1,779 1,579 1,987
Free cash flow 574 852 657 794 1,197
Acquisitions and disposals 1,089 237 -1,015 0 0
Net cash flow 1,096 622 -735 355 708
Balance sheet (GBP m)
Intangible assets 4,701 5,588 5,558 5,448 5,313
Other fixed assets 3,162 4,093 5,420 5,410 5,385
Total working capital 444 1,366 1,466 1,866 2,016
Cash and cash equivalents 2,585 3,990 3,990 3,990 3,990
Gross debt 1,383 2,371 3,106 2,751 2,043
Pensions and similar obligations 445 793 793 793 793
Source: Company data, Berenberg estimates
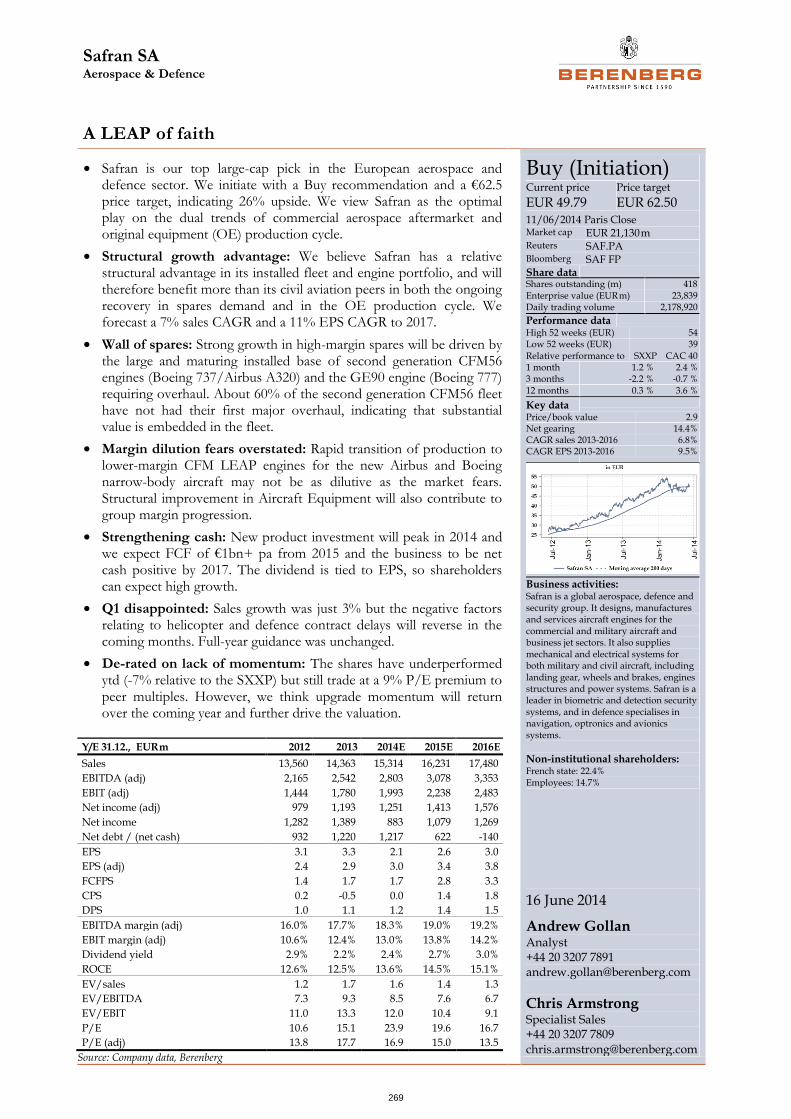
Safran SA Aerospace & Defence
269
A LEAP of faith
• Safran is our top large-cap pick in the European aerospace and defence sector. We initiate with a Buy recommendation and a €62.5 price target, indicating 26% upside. We view Safran as the optimal play on the dual trends of commercial aerospace aftermarket and original equipment (OE) production cycle.
• Structural growth advantage: We believe Safran has a relative structural advantage in its installed fleet and engine portfolio, and will therefore benefit more than its civil aviation peers in both the ongoing recovery in spares demand and in the OE production cycle. We forecast a 7% sales CAGR and a 11% EPS CAGR to 2017.
• Wall of spares: Strong growth in high-margin spares will be driven by the large and maturing installed base of second generation CFM56 engines (Boeing 737/Airbus A320) and the GE90 engine (Boeing 777) requiring overhaul. About 60% of the second generation CFM56 fleet have not had their first major overhaul, indicating that substantial value is embedded in the fleet.
• Margin dilution fears overstated: Rapid transition of production to lower-margin CFM LEAP engines for the new Airbus and Boeing narrow-body aircraft may not be as dilutive as the market fears. Structural improvement in Aircraft Equipment will also contribute to group margin progression.
• Strengthening cash: New product investment will peak in 2014 and we expect FCF of €1bn+ pa from 2015 and the business to be net cash positive by 2017. The dividend is tied to EPS, so shareholders can expect high growth.
• Q1 disappointed: Sales growth was just 3% but the negative factors relating to helicopter and defence contract delays will reverse in the coming months. Full-year guidance was unchanged.
• De-rated on lack of momentum: The shares have underperformed ytd (-7% relative to the SXXP) but still trade at a 9% P/E premium to peer multiples. However, we think upgrade momentum will return over the coming year and further drive the valuation.
Buy (Initiation) Current price
EUR 49.79 Price target
EUR 62.50 11/06/2014 Paris Close Market cap EUR 21,130 m Reuters SAF.PA Bloomberg SAF FP Share data
Shares outstanding (m) 418 Enterprise value (EUR m) 23,839 Daily trading volume 2,178,920
Performance data
High 52 weeks (EUR) 54 Low 52 weeks (EUR) 39
Relative performance to SXXP CAC 40 1 month 1.2 % 2.4 % 3 months -2.2 % -0.7 % 12 months 0.3 % 3.6 %
Key data
Price/book value 2.9 Net gearing 14.4% CAGR sales 2013-2016 6.8% CAGR EPS 2013-2016 9.5%
Business activities: Safran is a global aerospace, defence and security group. It designs, manufactures and services aircraft engines for the commercial and military aircraft and business jet sectors. It also supplies mechanical and electrical systems for both military and civil aircraft, including landing gear, wheels and brakes, engines structures and power systems. Safran is a leader in biometric and detection security systems, and in defence specialises in navigation, optronics and avionics systems.
Non-institutional shareholders: French state: 22.4% Employees: 14.7%
16 June 2014
Andrew Gollan Analyst +44 20 3207 7891 [email protected]
Chris Armstrong
Specialist Sales +44 20 3207 7809 [email protected]
Y/E 31.12., EUR m 2012 2013 2014E 2015E 2016E
Sales 13,560 14,363 15,314 16,231 17,480
EBITDA (adj) 2,165 2,542 2,803 3,078 3,353
EBIT (adj) 1,444 1,780 1,993 2,238 2,483
Net income (adj) 979 1,193 1,251 1,413 1,576
Net income 1,282 1,389 883 1,079 1,269
Net debt / (net cash) 932 1,220 1,217 622 -140
EPS 3.1 3.3 2.1 2.6 3.0
EPS (adj) 2.4 2.9 3.0 3.4 3.8
FCFPS 1.4 1.7 1.7 2.8 3.3
CPS 0.2 -0.5 0.0 1.4 1.8
DPS 1.0 1.1 1.2 1.4 1.5
EBITDA margin (adj) 16.0% 17.7% 18.3% 19.0% 19.2%
EBIT margin (adj) 10.6% 12.4% 13.0% 13.8% 14.2%
Dividend yield 2.9% 2.2% 2.4% 2.7% 3.0%
ROCE 12.6% 12.5% 13.6% 14.5% 15.1%
EV/sales 1.2 1.7 1.6 1.4 1.3
EV/EBITDA 7.3 9.3 8.5 7.6 6.7
EV/EBIT 11.0 13.3 12.0 10.4 9.1
P/E 10.6 15.1 23.9 19.6 16.7
P/E (adj) 13.8 17.7 16.9 15.0 13.5
Source: Company data, Berenberg
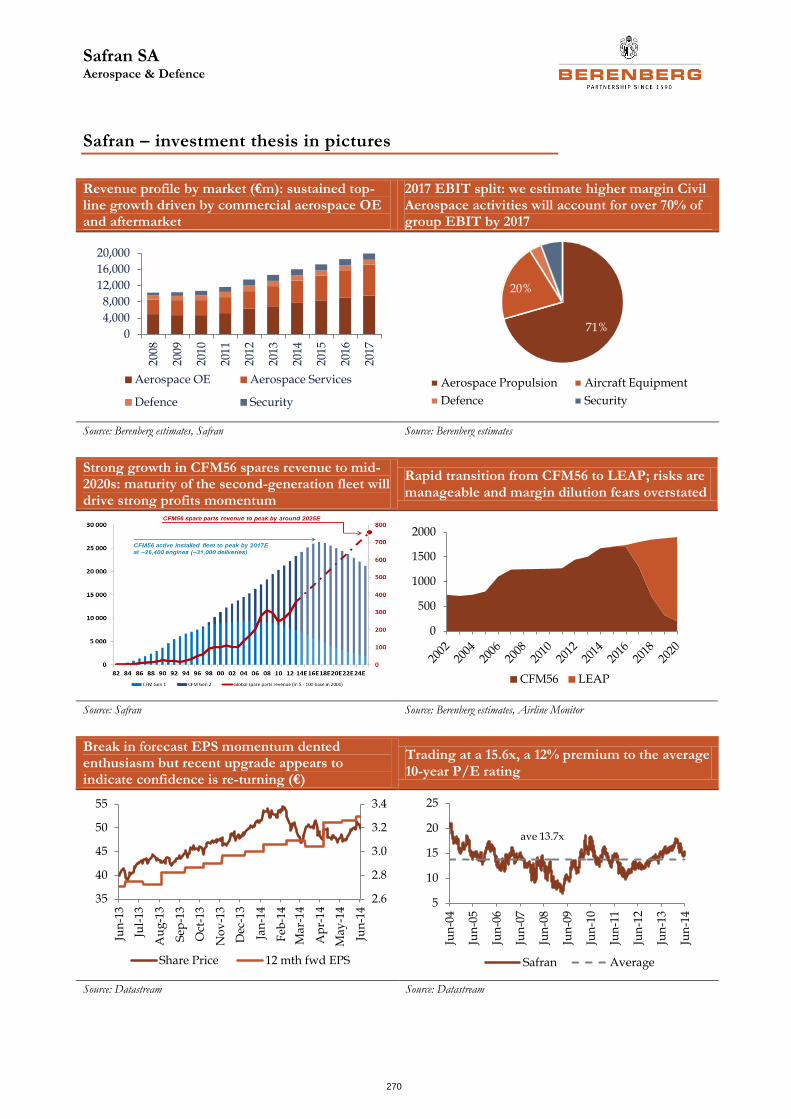
Safran SA Aerospace & Defence
270
Safran – investment thesis in pictures
Revenue profile by market (€m): sustained top-line growth driven by commercial aerospace OE and aftermarket
2017 EBIT split: we estimate higher margin Civil Aerospace activities will account for over 70% of group EBIT by 2017
Source: Berenberg estimates, Safran Source: Berenberg estimates
Strong growth in CFM56 spares revenue to mid-2020s: maturity of the second-generation fleet will drive strong profits momentum
Rapid transition from CFM56 to LEAP; risks are manageable and margin dilution fears overstated
Source: Safran Source: Berenberg estimates, Airline Monitor
Break in forecast EPS momentum dented enthusiasm but recent upgrade appears to indicate confidence is re-turning (€)
Trading at a 15.6x, a 12% premium to the average 10-year P/E rating
Source: Datastream Source: Datastream
0
4,000
8,000
12,000
16,000
20,000
2008
2009
2010
2011
2012
2013
2014
2015
2016
2017
Aerospace OE Aerospace Services
Defence Security
71%
20%
Aerospace Propulsion Aircraft Equipment
Defence Security
0
500
1000
1500
2000
CFM56 LEAP
2.6
2.8
3.0
3.2
3.4
35
40
45
50
55
Jun
-13
Jul-
13
Au
g-1
3
Sep
-13
Oct
-13
No
v-1
3
Dec
-13
Jan
-14
Feb
-14
Mar
-14
Ap
r-1
4
May
-14
Jun
-14
Share Price 12 mth fwd EPS
5
10
15
20
25
Jun
-04
Jun
-05
Jun
-06
Jun
-07
Jun
-08
Jun
-09
Jun
-10
Jun
-11
Jun
-12
Jun
-13
Jun
-14
Safran Average
ave 13.7x
Safran SA Aerospace & Defence
271
Safran – investment thesis
What’s new: Safran is our top large-cap pick in the European Aerospace and Defence sector. We initiate coverage with a Buy recommendation and a €62.5 price target, indicating 26% upside.
Two-minute summary: We view Safran as the optimal way for investors to play dual positive trends in the commercial aerospace aftermarket and original equipment (OE) sectors, which together account for c70% of group profit. Investor sentiment towards the shares faltered in early 2014 as earnings momentum slowed (consensus EPS up 2.6% ytd). We look beyond this to the fundamental strength of the aero engine and aircraft equipment businesses and, in particular, the group’s relative structural advantage of its maturing engine aftermarket model. We believe Safran is capable of delivering sustained and sector-leading earnings growth (an 11% EPS CAGR to 2017).
Key investment point one: Safran is the most attractive civil aftermarket play in our coverage universe
Safran is in the sweet spot of the aftermarket cycle, benefiting from an acceleration in the number of overhauls of its installed base of c26,000 CFM56 engines, particularly second generation engines which account for over 60% of the fleet. This will be a powerful driver of group profit growth, reflecting value embedded in the fleet and payback for decades of investment.
• Structural growth in high-margin engine servicing: The CFM56 powers almost 80% of the world’s narrow-body commercial aircraft fleet, principally Boeing 737s and Airbus A320s. The number of second generation CFM56 engines approaching their first major overhaul is accelerating, driving demand for high-margin spares. This, we believe, will far outweigh the effect of reducing volumes from an ageing and declining fleet of first generation CFM56 engines. To illustrate, in Q1, Safran reported commercial aftermarket sales growth of 12% reflecting a 30% increase in second generation activity, comfortably offsetting a 40% decline in first generation spares activity. Momentum in the fleet is strong and we anticipate a near 50% increase in CFM56 spare parts revenue by 2020, with growth continuing at a similar rate to at least the middle of the next decade. In the context of the group, we estimate CFM56 represents c40-45% of Safran’s civil aftermarket sales (c€1.7bn) and c40% of group EBIT (c€0.8bn). Safran’s second most important engine programme, the GE90, which powers the B777, is also increasingly contributing to spares momentum as the fleet grows and matures.
• Air traffic growth supporting near-term demand for overhauls: Air traffic growth and aircraft utilisation trends are positive with global passenger growth predicted by IATA to increase by 5.2% in 2013 (5.8% in 2012), above the long-term rate of c4.5%. Coupled with airlines’ increasing profitability, the macro backdrop is positive for recovery in spares demand following the cyclical slow down in 2011/12. All civil aero aftermarket peers (GE, Pratt & Whitney, Honeywell, Rolls-Royce and Meggitt) have reported further positive growth trends ytd. Safran has guided civil aftermarket to increase by low to mid-teens in 2014 (Q1 was +12%).
Key investment point two: positive civil OE outlook – programme risk is lower than perception
Safran’s dominance in the narrow-body aircraft sector through the CFM 50:50 joint venture with GE will continue for the foreseeable future with the introduction of the LEAP engine in 2016, which is sole source on Boeing’s new 737MAX and
Safran SA Aerospace & Defence
272
Comac’s C919 aircraft, as well as an engine choice on Airbus’ A320NEO. Nearer-term, continued strong demand for existing narrow-body aircraft (737NG and A320CEO) ensures extended production of the mature and profitable CFM56 engine which in turn will smooth transition to the LEAP.
• Smooth transition is key: A record CFM backlog of 11,300 engines, comprising 43% CFM56 and 57% LEAP, secures a profile of rising production through the rest of the decade, in line with the aircraft manufacturers. Phasing from CFM56 to LEAP production will be rapid but risk is mitigated by elements of commonality in the technology and the supply chain, and Safran’s experience of bringing new engines into production.
• Dilution/mix concerns are overstated: Through the transition, early-stage losses on the LEAP will dilute margin, although we think this is manageable given 1) the extending production outlook for CFM56 (which is profitable), 2) a fast learning curve (reducing costs) due to development maturity and the rapid production ramp-up, and 3) the significantly positive impact of momentum in the existing spares business referred above.
Key investment point three: profit upside and return to strong cash generation
Alongside revenue and profit growth, capital investment and R&D commitments should begin to moderate from 2014 and as a result we expect group cash generation to improve steadily through our forecast horizon. We forecast a 7% sales CAGR and an 11% recurring EBIT CAGR to 2017 (margin: 14.6%) and that the group will generate FCF in excess of €1bn pa from 2015. Management has previously stated an operating margin target of 15% by 2015, implying 9% upside to our estimates.
• 130bp margin upside: Management initially outlined a margin target of “heading towards the mid-teens” by 2015 over two years ago, which we believe remains the target. Group operating margin was 12.4% in 2013 and we forecast it will increase to 13.7% in 2015. Achieving target on our revenue estimates implies 8% upside to operating profit.
• Strengthening cash generation after high investment: Investment expenditure has been high in recent years largely related to development and capex on LEAP and development of the Silvercrest engine for large cabin business jets. This should moderate from 2015 and we estimate FCF well in excess of €1bn pa in the outer years of our forecasts and for the group to be in a net cash position by 2016.
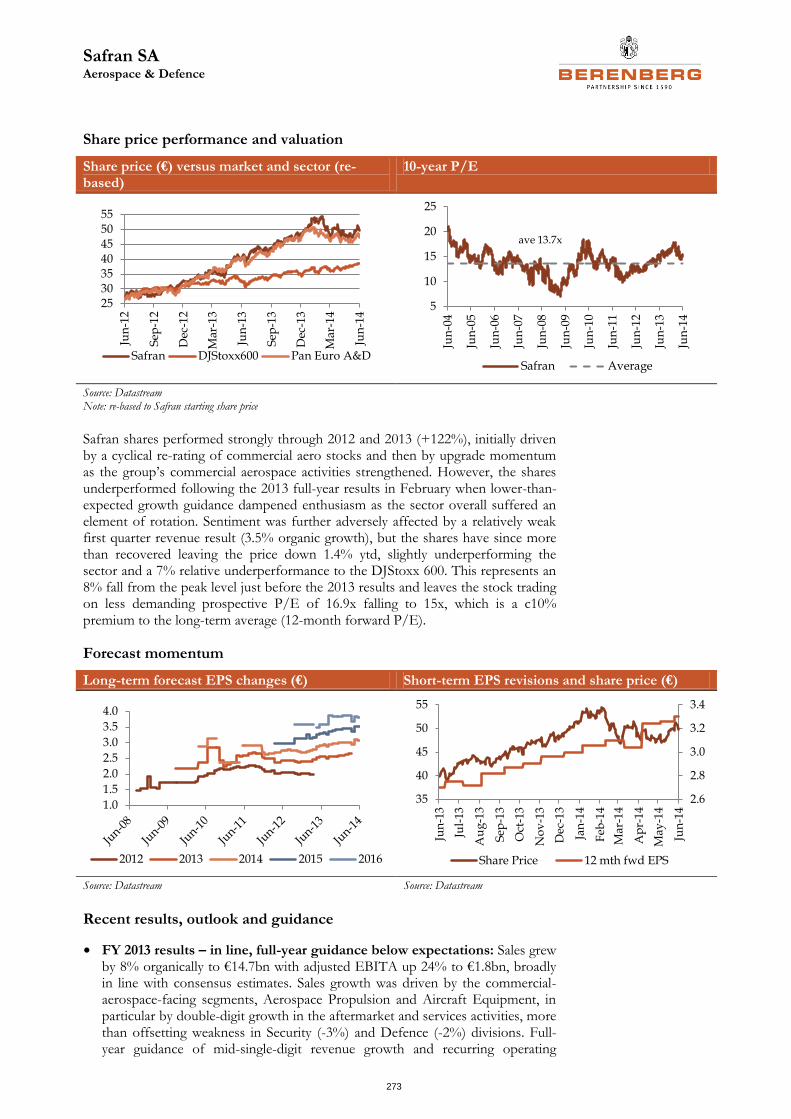
Safran SA Aerospace & Defence
273
Share price performance and valuation
Share price (€) versus market and sector (re-based)
10-year P/E
Source: Datastream Note: re-based to Safran starting share price
Safran shares performed strongly through 2012 and 2013 (+122%), initially driven by a cyclical re-rating of commercial aero stocks and then by upgrade momentum as the group’s commercial aerospace activities strengthened. However, the shares underperformed following the 2013 full-year results in February when lower-than-expected growth guidance dampened enthusiasm as the sector overall suffered an element of rotation. Sentiment was further adversely affected by a relatively weak first quarter revenue result (3.5% organic growth), but the shares have since more than recovered leaving the price down 1.4% ytd, slightly underperforming the sector and a 7% relative underperformance to the DJStoxx 600. This represents an 8% fall from the peak level just before the 2013 results and leaves the stock trading on less demanding prospective P/E of 16.9x falling to 15x, which is a c10% premium to the long-term average (12-month forward P/E).
Forecast momentum
Long-term forecast EPS changes (€) Short-term EPS revisions and share price (€)
Source: Datastream Source: Datastream
Recent results, outlook and guidance
• FY 2013 results – in line, full-year guidance below expectations: Sales grew by 8% organically to €14.7bn with adjusted EBITA up 24% to €1.8bn, broadly in line with consensus estimates. Sales growth was driven by the commercial-aerospace-facing segments, Aerospace Propulsion and Aircraft Equipment, in particular by double-digit growth in the aftermarket and services activities, more than offsetting weakness in Security (-3%) and Defence (-2%) divisions. Full-year guidance of mid-single-digit revenue growth and recurring operating
25303540455055
Jun
-12
Sep
-12
Dec
-12
Mar
-13
Jun
-13
Sep
-13
Dec
-13
Mar
-14
Jun
-14
Safran DJStoxx600 Pan Euro A&D
5
10
15
20
25
Jun
-04
Jun
-05
Jun
-06
Jun
-07
Jun
-08
Jun
-09
Jun
-10
Jun
-11
Jun
-12
Jun
-13
Jun
-14
Safran Average
ave 13.7x
1.0
1.5
2.0
2.5
3.0
3.5
4.0
2012 2013 2014 2015 2016
2.6
2.8
3.0
3.2
3.4
35
40
45
50
55
Jun
-13
Jul-
13
Au
g-1
3
Sep
-13
Oct
-13
No
v-1
3
Dec
-13
Jan
-14
Feb
-14
Mar
-14
Ap
r-1
4
May
-14
Jun
-14
Share Price 12 mth fwd EPS
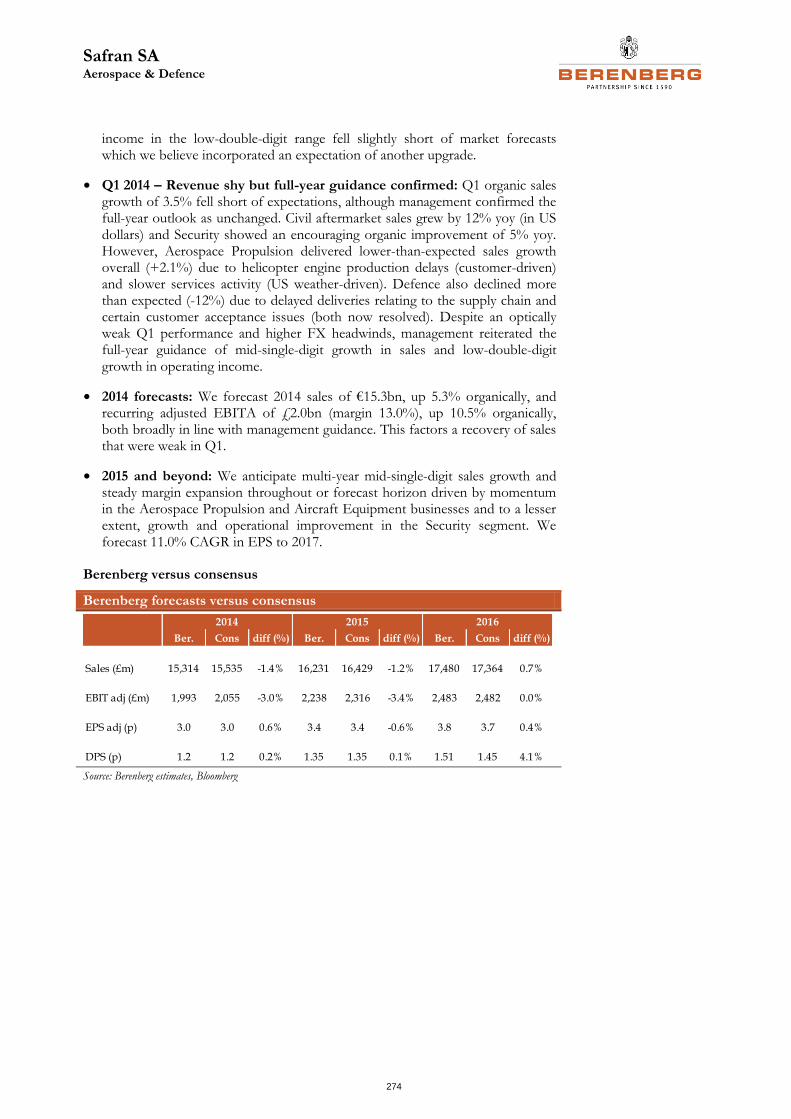
Safran SA Aerospace & Defence
274
income in the low-double-digit range fell slightly short of market forecasts which we believe incorporated an expectation of another upgrade.
• Q1 2014 – Revenue shy but full-year guidance confirmed: Q1 organic sales growth of 3.5% fell short of expectations, although management confirmed the full-year outlook as unchanged. Civil aftermarket sales grew by 12% yoy (in US dollars) and Security showed an encouraging organic improvement of 5% yoy. However, Aerospace Propulsion delivered lower-than-expected sales growth overall (+2.1%) due to helicopter engine production delays (customer-driven) and slower services activity (US weather-driven). Defence also declined more than expected (-12%) due to delayed deliveries relating to the supply chain and certain customer acceptance issues (both now resolved). Despite an optically weak Q1 performance and higher FX headwinds, management reiterated the full-year guidance of mid-single-digit growth in sales and low-double-digit growth in operating income.
• 2014 forecasts: We forecast 2014 sales of €15.3bn, up 5.3% organically, and recurring adjusted EBITA of £2.0bn (margin 13.0%), up 10.5% organically, both broadly in line with management guidance. This factors a recovery of sales that were weak in Q1.
• 2015 and beyond: We anticipate multi-year mid-single-digit sales growth and steady margin expansion throughout or forecast horizon driven by momentum in the Aerospace Propulsion and Aircraft Equipment businesses and to a lesser extent, growth and operational improvement in the Security segment. We forecast 11.0% CAGR in EPS to 2017.
Berenberg versus consensus
Berenberg forecasts versus consensus
Source: Berenberg estimates, Bloomberg
Ber. Cons diff (%) Ber. Cons diff (%) Ber. Cons diff (%)
Sales (£m) 15,314 15,535 -1.4% 16,231 16,429 -1.2% 17,480 17,364 0.7%
EBIT adj (£m) 1,993 2,055 -3.0% 2,238 2,316 -3.4% 2,483 2,482 0.0%
EPS adj (p) 3.0 3.0 0.6% 3.4 3.4 -0.6% 3.8 3.7 0.4%
DPS (p) 1.2 1.2 0.2% 1.35 1.35 0.1% 1.51 1.45 4.1%
2014 20162015
Safran SA Aerospace & Defence
275
Investment risks and concerns
• Valuation – the shares are susceptible to de-rating if growth is slower than expected: Following a period of steady earnings upgrades, recent momentum has stalled against expectations causing the stock to de-rate (the shares are down 1.4% ytd while consensus EPS revisions are up 2.6%). We think positive forecast momentum will return, possibly in H2 or early 2015 but if it does not, or other negative risk factors outlined below have an adverse impact, the shares may lose their current premium rating.
• Programme risk/delays: New developments programmes represent a substantial business risk for all aircraft and engine OEMs through, for example, technological issues leading to delays and cost escalation, either in-house directly or through the supply chain. Safran’s main exposure is through the LEAP engine for the 737MAX, A320NEO and C-919 narrow-body aircraft and the Silvercrest engine for the Cessna Citation and Dassault Falcon 5X large cabin business jets. Management recently stated that both programmes remain firmly on track. An indication of programme maturity is the guidance that R&D will to start fall after 2014. It is also worth noting that Boeing and Airbus remain publically confident that the MAX and NEO programmes will launch on time, to the extent that both manufacturers are already planning to raise production through the ramp-up phase.
• Capitalised R&D: The practice of capitalising R&D is common in aerospace and defence companies where large, self-funded development commitments are attached to defined programmes with future identifiable sales. Capitalisation weighs on investor sentiment based on an argument of lower profits quality (we estimate the net impact on Safran’s P&L in 2013 was +c35%). We are relatively sanguine given, for example, the group’s near 100% capture of available CFM56 spare parts revenues and the lagged payback dynamic that is now turning increasingly positive for the group. In addition, capitalisation levels are set to fall as the LEAP and Silvercrest development programmes move in to early production.
• FX: Currency risk is minimal over the near term given the group’s high level of hedging cover. The principle risk is transactional relating to the excess US dollar sales over costs, currently c$6bn pa. Safran’s $18bn hedge book has an average dollar/euro rate of $1.25 fully covering 2014 exposures and with diminishing (but still high) cover to 2017 around the average hedge rate, including knock-out option strategies. The achieved rate was $1.28 in 2013 and falls by about 1c a year to 2016, giving a c€40m pa tailwind to EBIT over the next three years (equivalent to 2% of our 2014 EBIT forecast). On this basis, Safran has the most advantageous hedge book profile of the companies we cover.
• Use of capital: Safran has been highly acquisitive over the past five years spending over €3bn, initially on a build-out strategy in the Security sector (detection/ID) and latterly to expand capabilities in aircraft equipment (power management/electrical systems). Management has indicated that large acquisitions are not currently a focus, which we view as a positive given the prohibitively high valuations of aerospace assets currently, and given our view that the group’s defence niches largely have critical mass. We forecast improving cash generation and a net cash position by 2016 so we suggest the debate around capital allocation and/or potential cash distribution will intensify over the next 18 months or so.
• French government disposal of shareholding: The French government retains a 22% holding after disposing of 8% of its stake in 2013. This may be considered an overhang but we believe institutional interest would be strong should the French state decide to divest more of its stake (assuming it is around the current price).
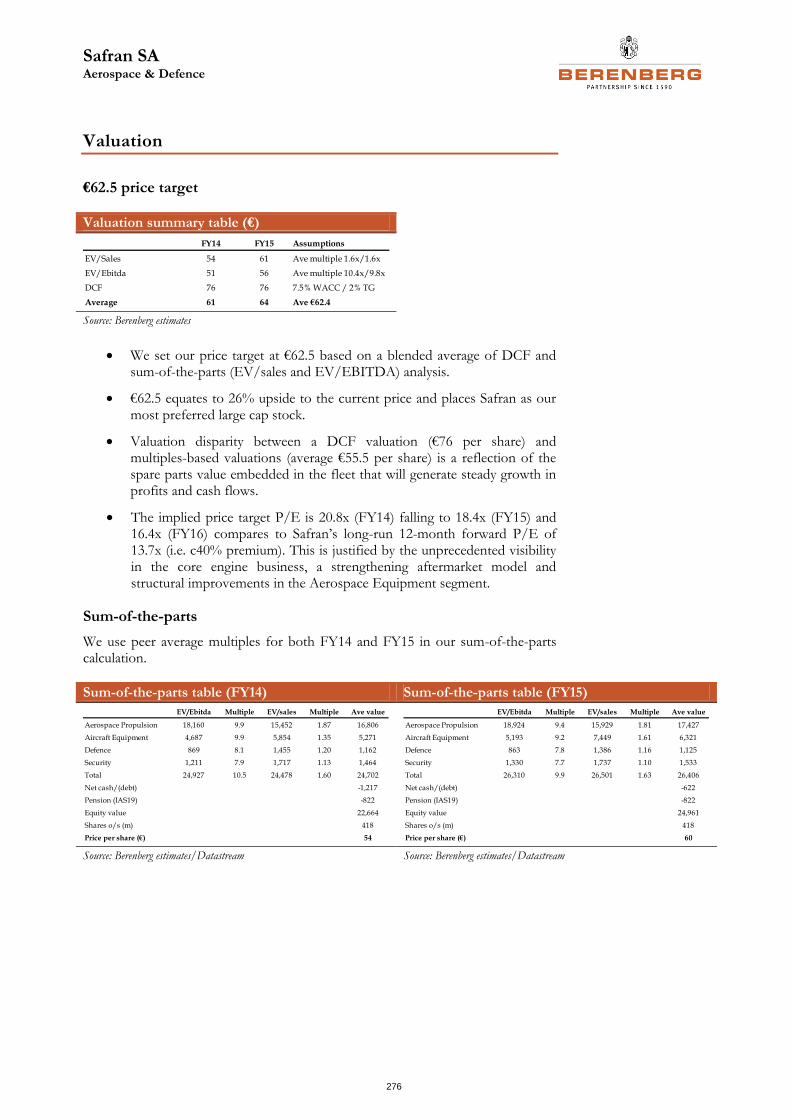
Safran SA Aerospace & Defence
276
Valuation
€62.5 price target
Valuation summary table (€)
Source: Berenberg estimates
We set our price target at €62.5 based on a blended average of DCF and sum-of-the-parts (EV/sales and EV/EBITDA) analysis.
€62.5 equates to 26% upside to the current price and places Safran as our most preferred large cap stock.
Valuation disparity between a DCF valuation (€76 per share) and multiples-based valuations (average €55.5 per share) is a reflection of the spare parts value embedded in the fleet that will generate steady growth in profits and cash flows.
The implied price target P/E is 20.8x (FY14) falling to 18.4x (FY15) and 16.4x (FY16) compares to Safran’s long-run 12-month forward P/E of 13.7x (i.e. c40% premium). This is justified by the unprecedented visibility in the core engine business, a strengthening aftermarket model and structural improvements in the Aerospace Equipment segment.
Sum-of-the-parts
We use peer average multiples for both FY14 and FY15 in our sum-of-the-parts calculation.
Sum-of-the-parts table (FY14) Sum-of-the-parts table (FY15)
Source: Berenberg estimates/Datastream Source: Berenberg estimates/Datastream
FY14 FY15 Assumptions
EV/Sales 54 61 Ave multiple 1.6x/1.6x
EV/Ebitda 51 56 Ave multiple 10.4x/9.8x
DCF 76 76 7.5% WACC / 2% TG
Average 61 64 Ave €62.4
EV/Ebitda Multiple EV/sales Multiple Ave value
Aerospace Propulsion 18,160 9.9 15,452 1.87 16,806
Aircraft Equipment 4,687 9.9 5,854 1.35 5,271
Defence 869 8.1 1,455 1.20 1,162
Security 1,211 7.9 1,717 1.13 1,464
Total 24,927 10.5 24,478 1.60 24,702
Net cash/(debt) -1,217
Pension (IAS19) -822
Equity value 22,664
Shares o/s (m) 418
Price per share (€) 54
EV/Ebitda Multiple EV/sales Multiple Ave value
Aerospace Propulsion 18,924 9.4 15,929 1.81 17,427
Aircraft Equipment 5,193 9.2 7,449 1.61 6,321
Defence 863 7.8 1,386 1.16 1,125
Security 1,330 7.7 1,737 1.10 1,533
Total 26,310 9.9 26,501 1.63 26,406
Net cash/(debt) -622
Pension (IAS19) -822
Equity value 24,961
Shares o/s (m) 418
Price per share (€) 60
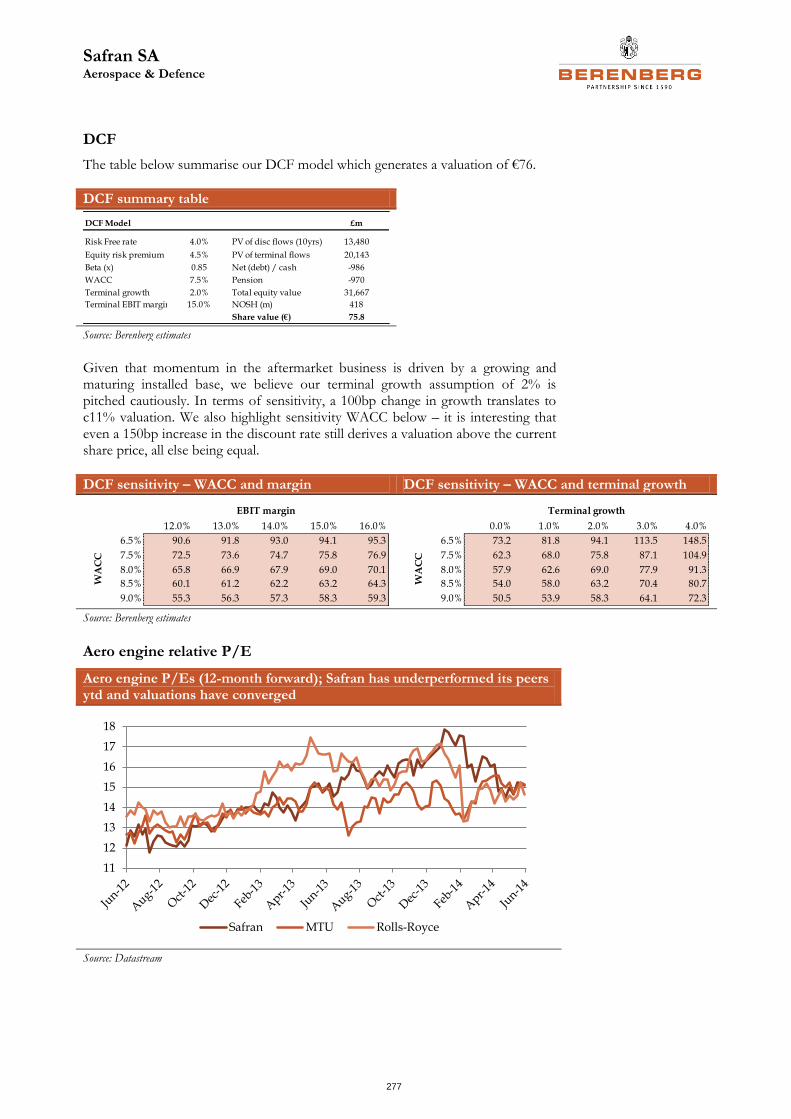
Safran SA Aerospace & Defence
277
DCF
The table below summarise our DCF model which generates a valuation of €76.
DCF summary table
Source: Berenberg estimates
Given that momentum in the aftermarket business is driven by a growing and maturing installed base, we believe our terminal growth assumption of 2% is pitched cautiously. In terms of sensitivity, a 100bp change in growth translates to c11% valuation. We also highlight sensitivity WACC below – it is interesting that even a 150bp increase in the discount rate still derives a valuation above the current share price, all else being equal.
DCF sensitivity – WACC and margin DCF sensitivity – WACC and terminal growth
Source: Berenberg estimates
Aero engine relative P/E
Aero engine P/Es (12-month forward); Safran has underperformed its peers ytd and valuations have converged
Source: Datastream
DCF Model £m
Risk Free rate 4.0% PV of disc flows (10yrs) 13,480
Equity risk premium 4.5% PV of terminal flows 20,143
Beta (x) 0.85 Net (debt) / cash -986
WACC 7.5% Pension -970
Terminal growth 2.0% Total equity value 31,667
Terminal EBIT margin 15.0% NOSH (m) 418
Share value (€) 75.8
76 12.0% 13.0% 14.0% 15.0% 16.0%
6.5% 90.6 91.8 93.0 94.1 95.3
7.5% 72.5 73.6 74.7 75.8 76.9
8.0% 65.8 66.9 67.9 69.0 70.1
8.5% 60.1 61.2 62.2 63.2 64.3
9.0% 55.3 56.3 57.3 58.3 59.3
EBIT margin
WA
CC
76 0.0% 1.0% 2.0% 3.0% 4.0%
6.5% 73.2 81.8 94.1 113.5 148.5
7.5% 62.3 68.0 75.8 87.1 104.9
8.0% 57.9 62.6 69.0 77.9 91.3
8.5% 54.0 58.0 63.2 70.4 80.7
9.0% 50.5 53.9 58.3 64.1 72.3
Terminal growth
WA
CC
11
12
13
14
15
16
17
18
Safran MTU Rolls-Royce
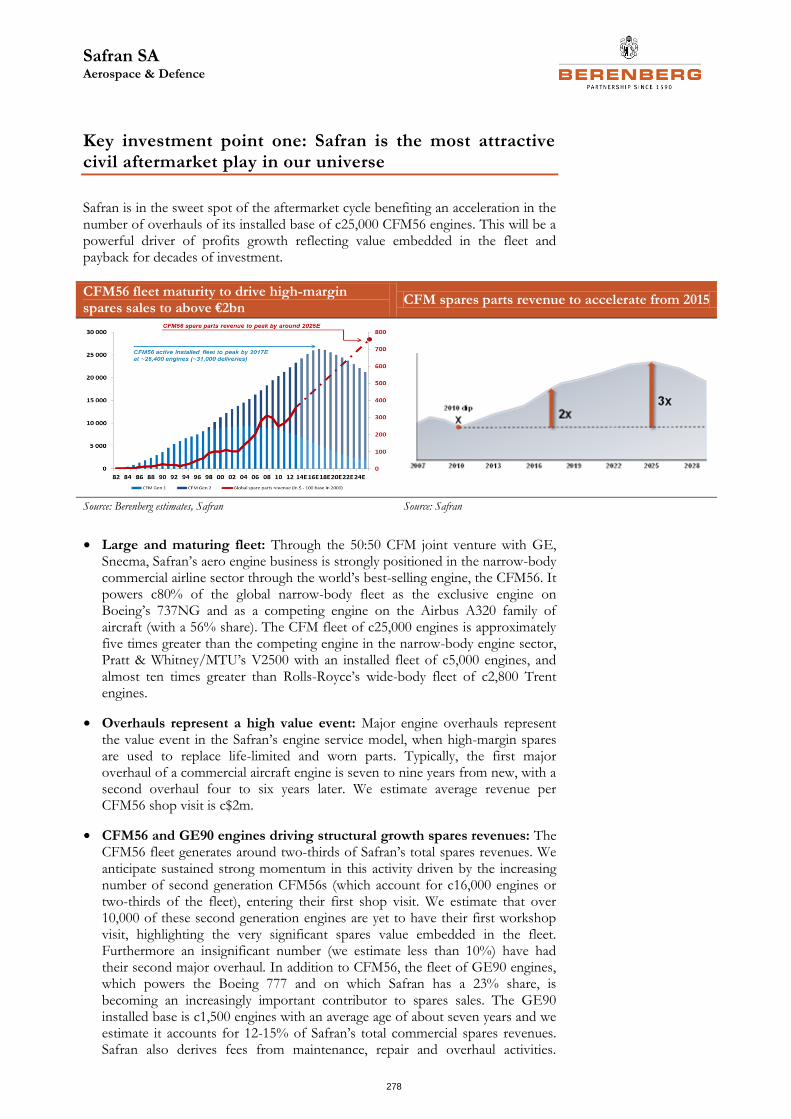
Safran SA Aerospace & Defence
278
Key investment point one: Safran is the most attractive civil aftermarket play in our universe
Safran is in the sweet spot of the aftermarket cycle benefiting an acceleration in the number of overhauls of its installed base of c25,000 CFM56 engines. This will be a powerful driver of profits growth reflecting value embedded in the fleet and payback for decades of investment.
CFM56 fleet maturity to drive high-margin spares sales to above €2bn
CFM spares parts revenue to accelerate from 2015
Source: Berenberg estimates, Safran Source: Safran
• Large and maturing fleet: Through the 50:50 CFM joint venture with GE, Snecma, Safran’s aero engine business is strongly positioned in the narrow-body commercial airline sector through the world’s best-selling engine, the CFM56. It powers c80% of the global narrow-body fleet as the exclusive engine on Boeing’s 737NG and as a competing engine on the Airbus A320 family of aircraft (with a 56% share). The CFM fleet of c25,000 engines is approximately five times greater than the competing engine in the narrow-body engine sector, Pratt & Whitney/MTU’s V2500 with an installed fleet of c5,000 engines, and almost ten times greater than Rolls-Royce’s wide-body fleet of c2,800 Trent engines.
• Overhauls represent a high value event: Major engine overhauls represent the value event in the Safran’s engine service model, when high-margin spares are used to replace life-limited and worn parts. Typically, the first major overhaul of a commercial aircraft engine is seven to nine years from new, with a second overhaul four to six years later. We estimate average revenue per CFM56 shop visit is c$2m.
• CFM56 and GE90 engines driving structural growth spares revenues: The CFM56 fleet generates around two-thirds of Safran’s total spares revenues. We anticipate sustained strong momentum in this activity driven by the increasing number of second generation CFM56s (which account for c16,000 engines or two-thirds of the fleet), entering their first shop visit. We estimate that over 10,000 of these second generation engines are yet to have their first workshop visit, highlighting the very significant spares value embedded in the fleet. Furthermore an insignificant number (we estimate less than 10%) have had their second major overhaul. In addition to CFM56, the fleet of GE90 engines, which powers the Boeing 777 and on which Safran has a 23% share, is becoming an increasingly important contributor to spares sales. The GE90 installed base is c1,500 engines with an average age of about seven years and we estimate it accounts for 12-15% of Safran’s total commercial spares revenues. Safran also derives fees from maintenance, repair and overhaul activities.
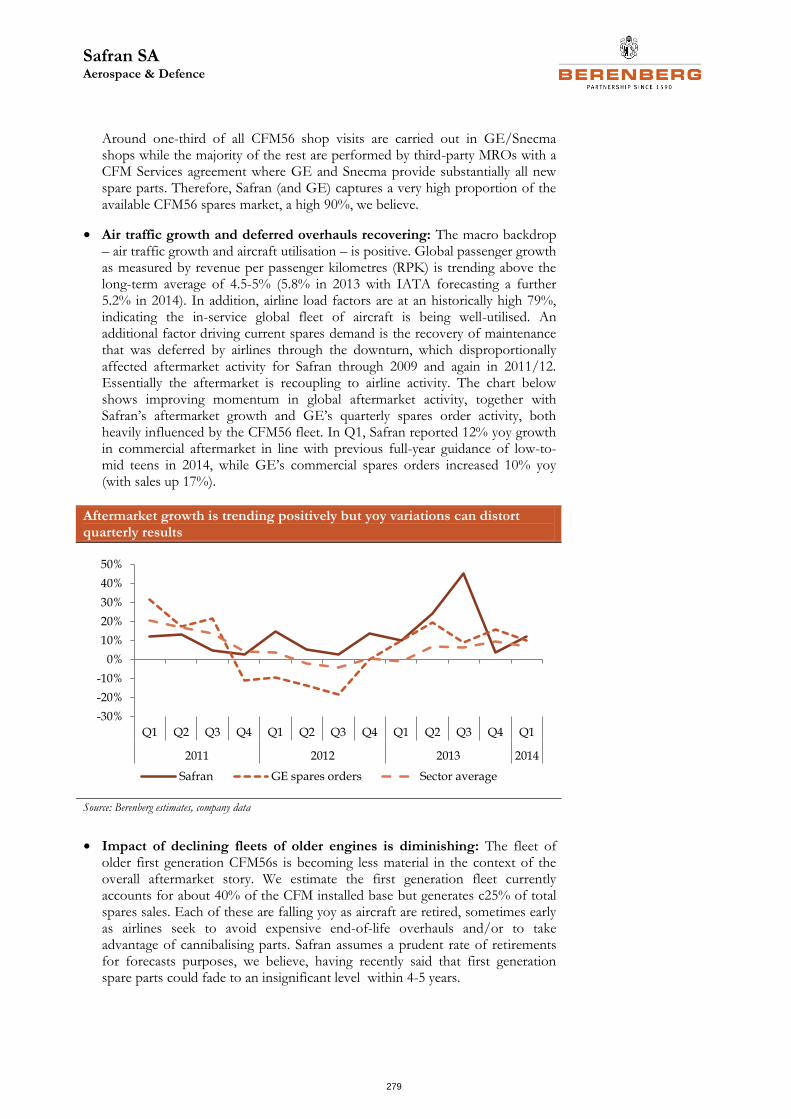
Safran SA Aerospace & Defence
279
Around one-third of all CFM56 shop visits are carried out in GE/Snecma shops while the majority of the rest are performed by third-party MROs with a CFM Services agreement where GE and Snecma provide substantially all new spare parts. Therefore, Safran (and GE) captures a very high proportion of the available CFM56 spares market, a high 90%, we believe.
• Air traffic growth and deferred overhauls recovering: The macro backdrop – air traffic growth and aircraft utilisation – is positive. Global passenger growth as measured by revenue per passenger kilometres (RPK) is trending above the long-term average of 4.5-5% (5.8% in 2013 with IATA forecasting a further 5.2% in 2014). In addition, airline load factors are at an historically high 79%, indicating the in-service global fleet of aircraft is being well-utilised. An additional factor driving current spares demand is the recovery of maintenance that was deferred by airlines through the downturn, which disproportionally affected aftermarket activity for Safran through 2009 and again in 2011/12. Essentially the aftermarket is recoupling to airline activity. The chart below shows improving momentum in global aftermarket activity, together with Safran’s aftermarket growth and GE’s quarterly spares order activity, both heavily influenced by the CFM56 fleet. In Q1, Safran reported 12% yoy growth in commercial aftermarket in line with previous full-year guidance of low-to-mid teens in 2014, while GE’s commercial spares orders increased 10% yoy (with sales up 17%).
Aftermarket growth is trending positively but yoy variations can distort quarterly results
Source: Berenberg estimates, company data
• Impact of declining fleets of older engines is diminishing: The fleet of older first generation CFM56s is becoming less material in the context of the overall aftermarket story. We estimate the first generation fleet currently accounts for about 40% of the CFM installed base but generates c25% of total spares sales. Each of these are falling yoy as aircraft are retired, sometimes early as airlines seek to avoid expensive end-of-life overhauls and/or to take advantage of cannibalising parts. Safran assumes a prudent rate of retirements for forecasts purposes, we believe, having recently said that first generation spare parts could fade to an insignificant level within 4-5 years.
-30%
-20%
-10%
0%
10%
20%
30%
40%
50%
Q1 Q2 Q3 Q4 Q1 Q2 Q3 Q4 Q1 Q2 Q3 Q4 Q1
2011 2012 2013 2014
Safran GE spares orders Sector average
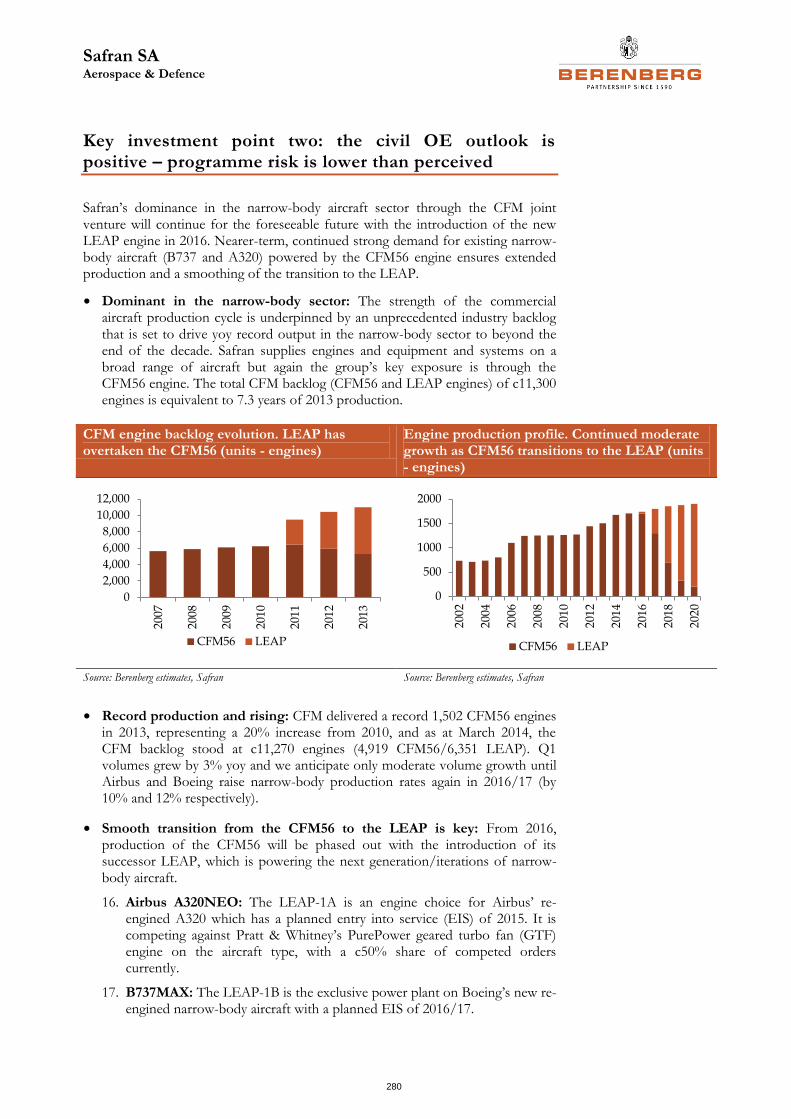
Safran SA Aerospace & Defence
280
Key investment point two: the civil OE outlook is positive – programme risk is lower than perceived
Safran’s dominance in the narrow-body aircraft sector through the CFM joint venture will continue for the foreseeable future with the introduction of the new LEAP engine in 2016. Nearer-term, continued strong demand for existing narrow-body aircraft (B737 and A320) powered by the CFM56 engine ensures extended production and a smoothing of the transition to the LEAP.
• Dominant in the narrow-body sector: The strength of the commercial aircraft production cycle is underpinned by an unprecedented industry backlog that is set to drive yoy record output in the narrow-body sector to beyond the end of the decade. Safran supplies engines and equipment and systems on a broad range of aircraft but again the group’s key exposure is through the CFM56 engine. The total CFM backlog (CFM56 and LEAP engines) of c11,300 engines is equivalent to 7.3 years of 2013 production.
CFM engine backlog evolution. LEAP has overtaken the CFM56 (units - engines)
Engine production profile. Continued moderate growth as CFM56 transitions to the LEAP (units - engines)
Source: Berenberg estimates, Safran Source: Berenberg estimates, Safran
• Record production and rising: CFM delivered a record 1,502 CFM56 engines in 2013, representing a 20% increase from 2010, and as at March 2014, the CFM backlog stood at c11,270 engines (4,919 CFM56/6,351 LEAP). Q1 volumes grew by 3% yoy and we anticipate only moderate volume growth until Airbus and Boeing raise narrow-body production rates again in 2016/17 (by 10% and 12% respectively).
• Smooth transition from the CFM56 to the LEAP is key: From 2016, production of the CFM56 will be phased out with the introduction of its successor LEAP, which is powering the next generation/iterations of narrow-body aircraft.
16. Airbus A320NEO: The LEAP-1A is an engine choice for Airbus’ re-engined A320 which has a planned entry into service (EIS) of 2015. It is competing against Pratt & Whitney’s PurePower geared turbo fan (GTF) engine on the aircraft type, with a c50% share of competed orders currently.
17. B737MAX: The LEAP-1B is the exclusive power plant on Boeing’s new re-engined narrow-body aircraft with a planned EIS of 2016/17.
0
2,000
4,000
6,000
8,000
10,000
12,000
200
7
2008
200
9
201
0
201
1
201
2
2013
CFM56 LEAP
0
500
1000
1500
2000
200
2
200
4
200
6
200
8
201
0
201
2
201
4
201
6
201
8
202
0
CFM56 LEAP
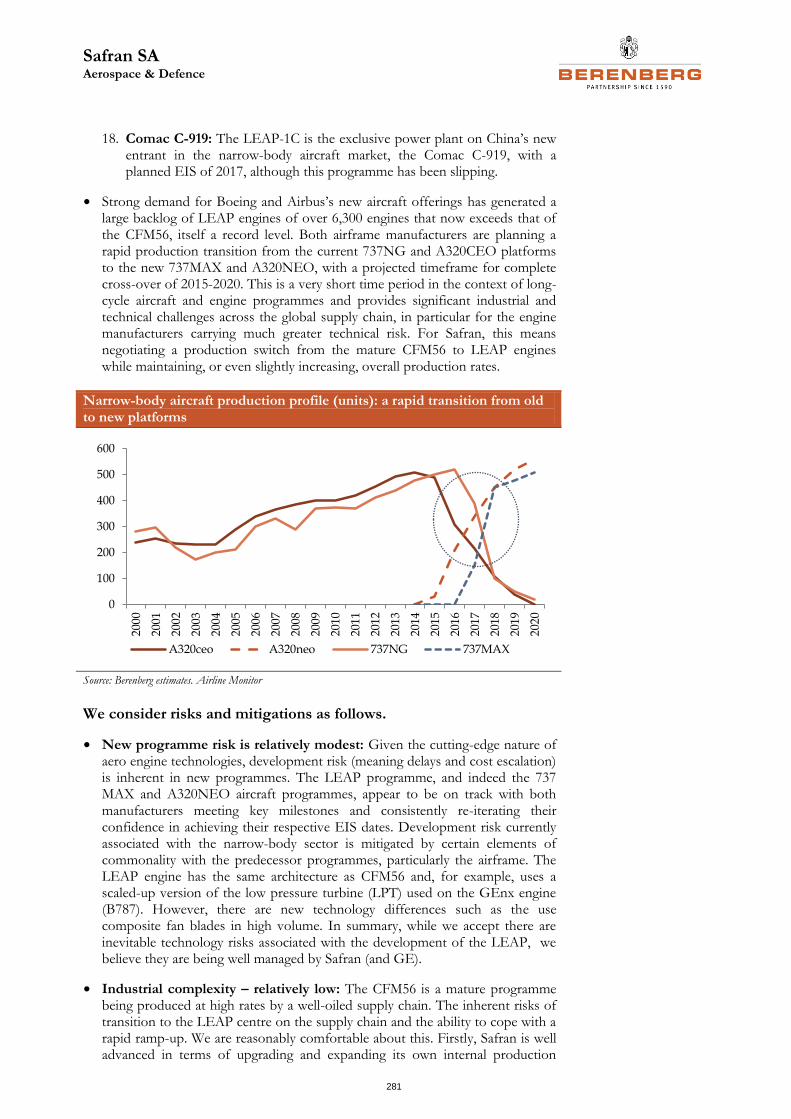
Safran SA Aerospace & Defence
281
18. Comac C-919: The LEAP-1C is the exclusive power plant on China’s new entrant in the narrow-body aircraft market, the Comac C-919, with a planned EIS of 2017, although this programme has been slipping.
• Strong demand for Boeing and Airbus’s new aircraft offerings has generated a large backlog of LEAP engines of over 6,300 engines that now exceeds that of the CFM56, itself a record level. Both airframe manufacturers are planning a rapid production transition from the current 737NG and A320CEO platforms to the new 737MAX and A320NEO, with a projected timeframe for complete cross-over of 2015-2020. This is a very short time period in the context of long-cycle aircraft and engine programmes and provides significant industrial and technical challenges across the global supply chain, in particular for the engine manufacturers carrying much greater technical risk. For Safran, this means negotiating a production switch from the mature CFM56 to LEAP engines while maintaining, or even slightly increasing, overall production rates.
Narrow-body aircraft production profile (units): a rapid transition from old to new platforms
Source: Berenberg estimates. Airline Monitor
We consider risks and mitigations as follows.
• New programme risk is relatively modest: Given the cutting-edge nature of aero engine technologies, development risk (meaning delays and cost escalation) is inherent in new programmes. The LEAP programme, and indeed the 737 MAX and A320NEO aircraft programmes, appear to be on track with both manufacturers meeting key milestones and consistently re-iterating their confidence in achieving their respective EIS dates. Development risk currently associated with the narrow-body sector is mitigated by certain elements of commonality with the predecessor programmes, particularly the airframe. The LEAP engine has the same architecture as CFM56 and, for example, uses a scaled-up version of the low pressure turbine (LPT) used on the GEnx engine (B787). However, there are new technology differences such as the use composite fan blades in high volume. In summary, while we accept there are inevitable technology risks associated with the development of the LEAP, we believe they are being well managed by Safran (and GE).
• Industrial complexity – relatively low: The CFM56 is a mature programme being produced at high rates by a well-oiled supply chain. The inherent risks of transition to the LEAP centre on the supply chain and the ability to cope with a rapid ramp-up. We are reasonably comfortable about this. Firstly, Safran is well advanced in terms of upgrading and expanding its own internal production
0
100
200
300
400
500
600
200
0
200
1
200
2
200
3
200
4
200
5
200
6
200
7
200
8
200
9
201
0
201
1
201
2
201
3
201
4
201
5
201
6
201
7
201
8
201
9
202
0
A320ceo A320neo 737NG 737MAX

Safran SA Aerospace & Defence
282
capacity. For example, two new fan blade facilities are coming onstream in 2014 and 2015 with projects completed or underway in a number of other areas such as assembly (France, the US) and rotating parts (China, Mexico, France, the US). Secondly, for bought-in components, management has demonstrated a high level of focus on supply chain readiness. Lastly, CFM is experienced in managing high-volume programmes and with elements of overlap with the existing CFM56 supply chain, risk is mitigated.
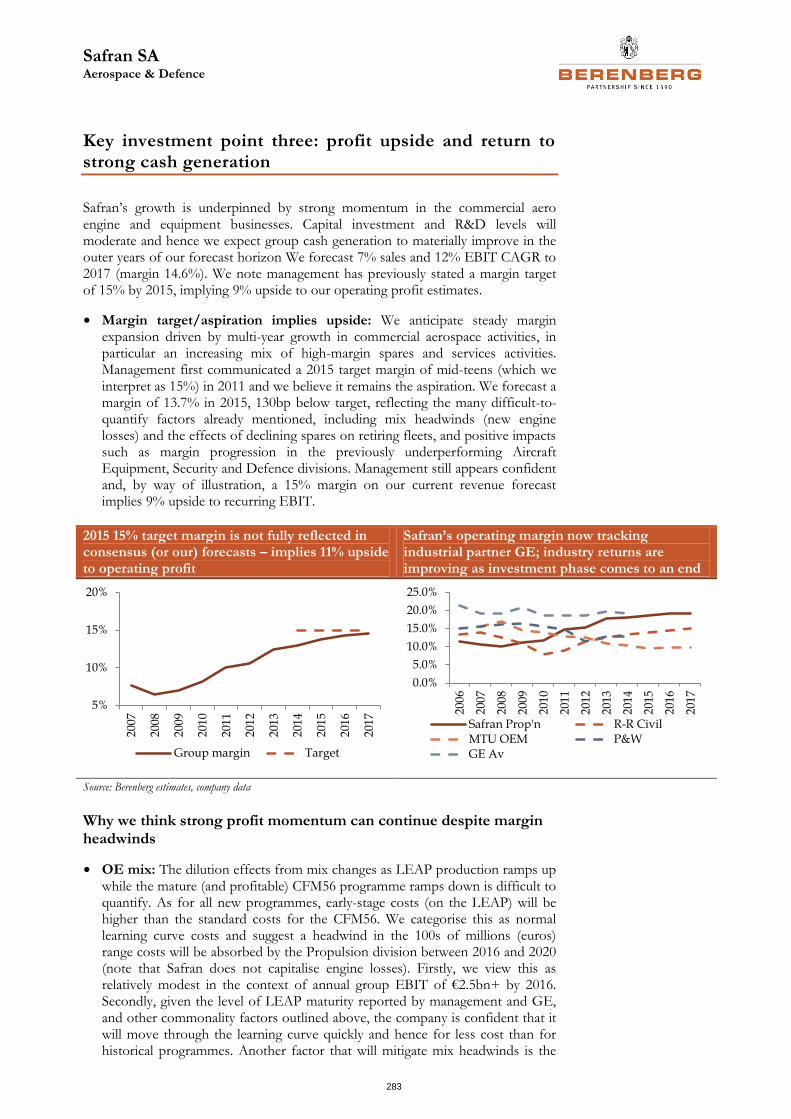
Safran SA Aerospace & Defence
283
Key investment point three: profit upside and return to strong cash generation
Safran’s growth is underpinned by strong momentum in the commercial aero engine and equipment businesses. Capital investment and R&D levels will moderate and hence we expect group cash generation to materially improve in the outer years of our forecast horizon We forecast 7% sales and 12% EBIT CAGR to 2017 (margin 14.6%). We note management has previously stated a margin target of 15% by 2015, implying 9% upside to our operating profit estimates.
• Margin target/aspiration implies upside: We anticipate steady margin expansion driven by multi-year growth in commercial aerospace activities, in particular an increasing mix of high-margin spares and services activities. Management first communicated a 2015 target margin of mid-teens (which we interpret as 15%) in 2011 and we believe it remains the aspiration. We forecast a margin of 13.7% in 2015, 130bp below target, reflecting the many difficult-to-quantify factors already mentioned, including mix headwinds (new engine losses) and the effects of declining spares on retiring fleets, and positive impacts such as margin progression in the previously underperforming Aircraft Equipment, Security and Defence divisions. Management still appears confident and, by way of illustration, a 15% margin on our current revenue forecast implies 9% upside to recurring EBIT.
2015 15% target margin is not fully reflected in consensus (or our) forecasts – implies 11% upside to operating profit
Safran’s operating margin now tracking industrial partner GE; industry returns are improving as investment phase comes to an end
Source: Berenberg estimates, company data
Why we think strong profit momentum can continue despite margin headwinds
• OE mix: The dilution effects from mix changes as LEAP production ramps up while the mature (and profitable) CFM56 programme ramps down is difficult to quantify. As for all new programmes, early-stage costs (on the LEAP) will be higher than the standard costs for the CFM56. We categorise this as normal learning curve costs and suggest a headwind in the 100s of millions (euros) range costs will be absorbed by the Propulsion division between 2016 and 2020 (note that Safran does not capitalise engine losses). Firstly, we view this as relatively modest in the context of annual group EBIT of €2.5bn+ by 2016. Secondly, given the level of LEAP maturity reported by management and GE, and other commonality factors outlined above, the company is confident that it will move through the learning curve quickly and hence for less cost than for historical programmes. Another factor that will mitigate mix headwinds is the
5%
10%
15%
20%
200
7
200
8
200
9
201
0
201
1
201
2
201
3
201
4
201
5
2016
201
7
Group margin Target
0.0%
5.0%
10.0%
15.0%
20.0%
25.0%
200
6
200
7
2008
2009
201
0
201
1
201
2
201
3
201
4
201
5
201
6
2017
Safran Prop'n R-R CivilMTU OEM P&WGE Av
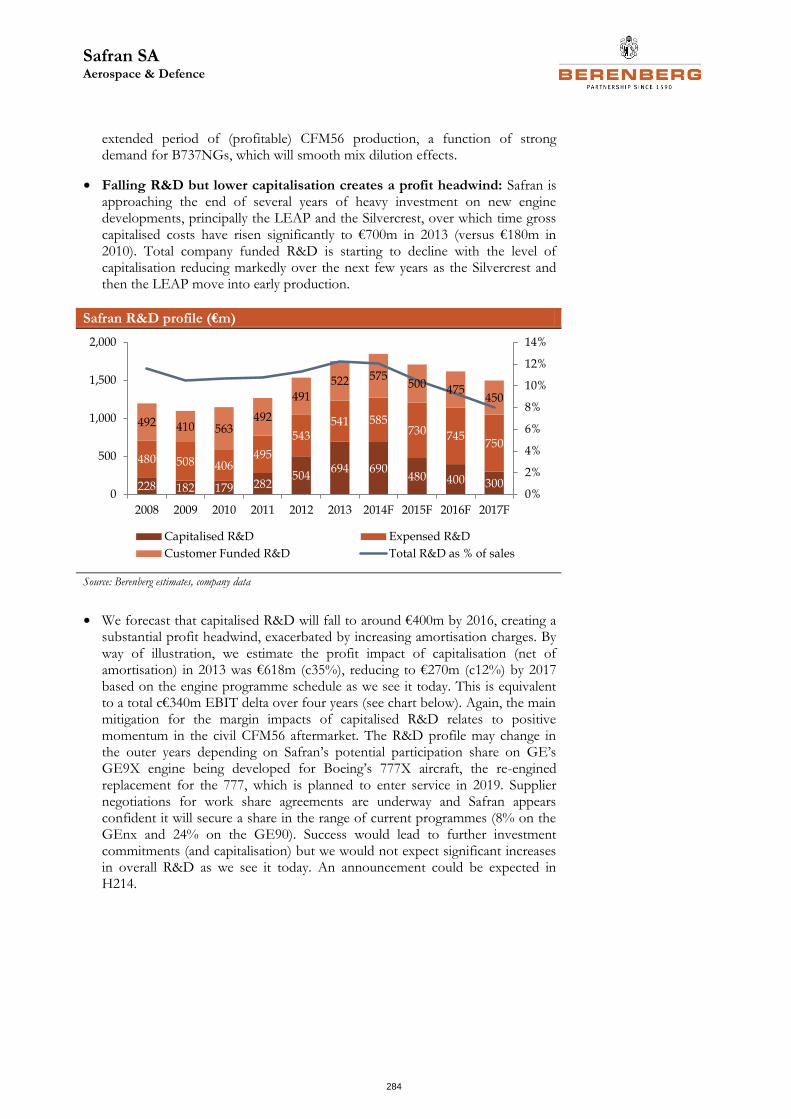
Safran SA Aerospace & Defence
284
extended period of (profitable) CFM56 production, a function of strong demand for B737NGs, which will smooth mix dilution effects.
• Falling R&D but lower capitalisation creates a profit headwind: Safran is approaching the end of several years of heavy investment on new engine developments, principally the LEAP and the Silvercrest, over which time gross capitalised costs have risen significantly to €700m in 2013 (versus €180m in 2010). Total company funded R&D is starting to decline with the level of capitalisation reducing markedly over the next few years as the Silvercrest and then the LEAP move into early production.
Safran R&D profile (€m)
Source: Berenberg estimates, company data
• We forecast that capitalised R&D will fall to around €400m by 2016, creating a substantial profit headwind, exacerbated by increasing amortisation charges. By way of illustration, we estimate the profit impact of capitalisation (net of amortisation) in 2013 was €618m (c35%), reducing to €270m (c12%) by 2017 based on the engine programme schedule as we see it today. This is equivalent to a total c€340m EBIT delta over four years (see chart below). Again, the main mitigation for the margin impacts of capitalised R&D relates to positive momentum in the civil CFM56 aftermarket. The R&D profile may change in the outer years depending on Safran’s potential participation share on GE’s GE9X engine being developed for Boeing’s 777X aircraft, the re-engined replacement for the 777, which is planned to enter service in 2019. Supplier negotiations for work share agreements are underway and Safran appears confident it will secure a share in the range of current programmes (8% on the GEnx and 24% on the GE90). Success would lead to further investment commitments (and capitalisation) but we would not expect significant increases in overall R&D as we see it today. An announcement could be expected in H214.
228 182 179 282504
694 690480 400 300
480 508 406495
543541 585
730 745750
492 410 563492
491
522 575500 475
450
0%
2%
4%
6%
8%
10%
12%
14%
0
500
1,000
1,500
2,000
2008 2009 2010 2011 2012 2013 2014F 2015F 2016F 2017F
Capitalised R&D Expensed R&D
Customer Funded R&D Total R&D as % of sales
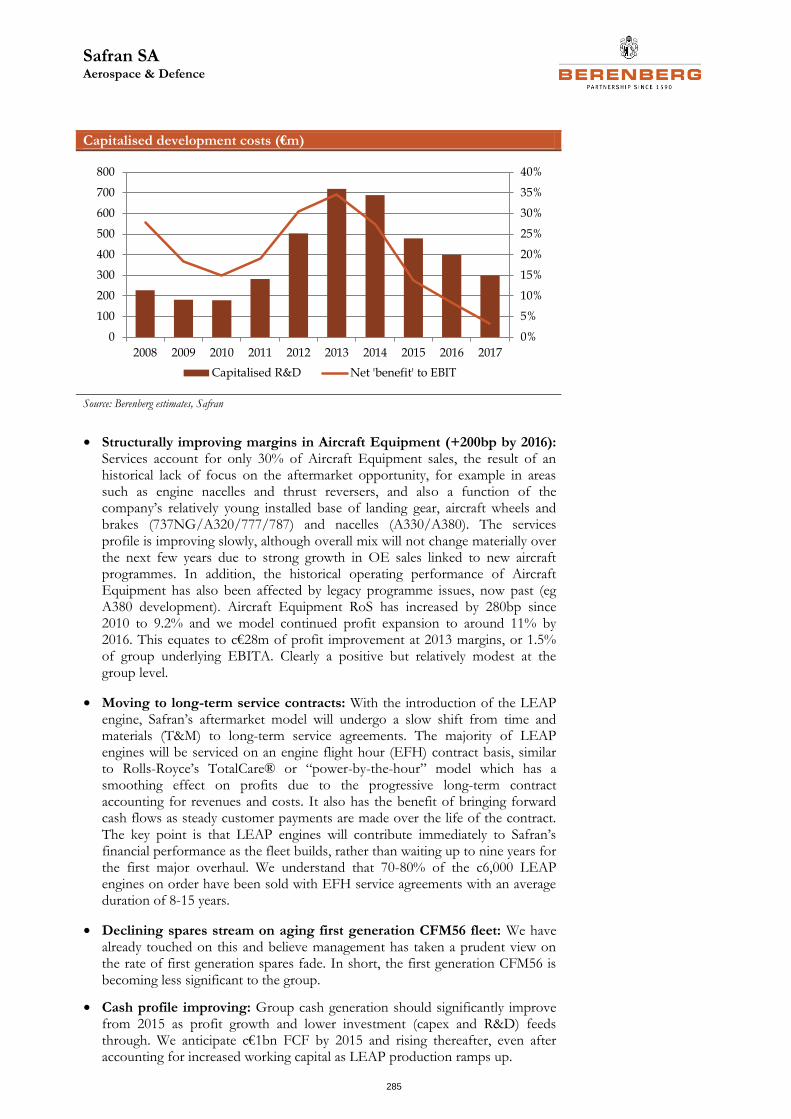
Safran SA Aerospace & Defence
285
Capitalised development costs (€m)
Source: Berenberg estimates, Safran
• Structurally improving margins in Aircraft Equipment (+200bp by 2016): Services account for only 30% of Aircraft Equipment sales, the result of an historical lack of focus on the aftermarket opportunity, for example in areas such as engine nacelles and thrust reversers, and also a function of the company’s relatively young installed base of landing gear, aircraft wheels and brakes (737NG/A320/777/787) and nacelles (A330/A380). The services profile is improving slowly, although overall mix will not change materially over the next few years due to strong growth in OE sales linked to new aircraft programmes. In addition, the historical operating performance of Aircraft Equipment has also been affected by legacy programme issues, now past (eg A380 development). Aircraft Equipment RoS has increased by 280bp since 2010 to 9.2% and we model continued profit expansion to around 11% by 2016. This equates to c€28m of profit improvement at 2013 margins, or 1.5% of group underlying EBITA. Clearly a positive but relatively modest at the group level.
• Moving to long-term service contracts: With the introduction of the LEAP engine, Safran’s aftermarket model will undergo a slow shift from time and materials (T&M) to long-term service agreements. The majority of LEAP engines will be serviced on an engine flight hour (EFH) contract basis, similar to Rolls-Royce’s TotalCare® or “power-by-the-hour” model which has a smoothing effect on profits due to the progressive long-term contract accounting for revenues and costs. It also has the benefit of bringing forward cash flows as steady customer payments are made over the life of the contract. The key point is that LEAP engines will contribute immediately to Safran’s financial performance as the fleet builds, rather than waiting up to nine years for the first major overhaul. We understand that 70-80% of the c6,000 LEAP engines on order have been sold with EFH service agreements with an average duration of 8-15 years.
• Declining spares stream on aging first generation CFM56 fleet: We have already touched on this and believe management has taken a prudent view on the rate of first generation spares fade. In short, the first generation CFM56 is becoming less significant to the group.
• Cash profile improving: Group cash generation should significantly improve from 2015 as profit growth and lower investment (capex and R&D) feeds through. We anticipate c€1bn FCF by 2015 and rising thereafter, even after accounting for increased working capital as LEAP production ramps up.
0%
5%
10%
15%
20%
25%
30%
35%
40%
0
100
200
300
400
500
600
700
800
2008 2009 2010 2011 2012 2013 2014 2015 2016 2017
Capitalised R&D Net 'benefit' to EBIT
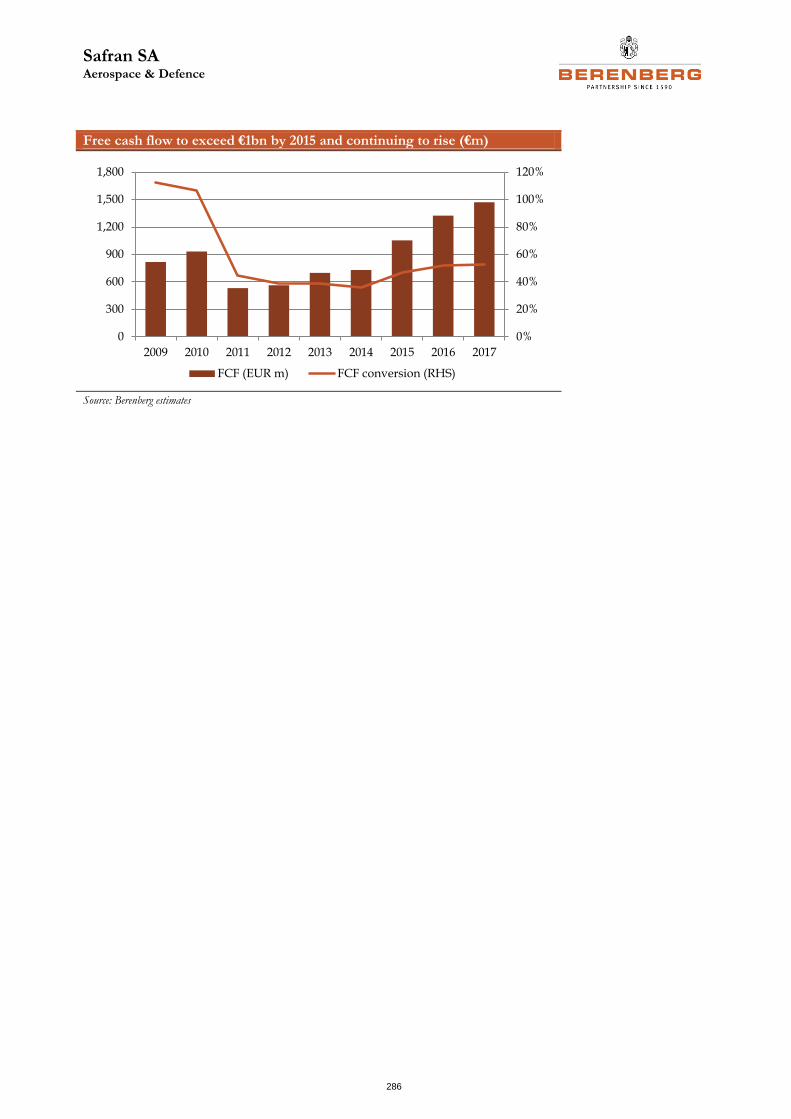
Safran SA Aerospace & Defence
286
Free cash flow to exceed €1bn by 2015 and continuing to rise (€m)
Source: Berenberg estimates
0%
20%
40%
60%
80%
100%
120%
0
300
600
900
1,200
1,500
1,800
2009 2010 2011 2012 2013 2014 2015 2016 2017
FCF (EUR m) FCF conversion (RHS)
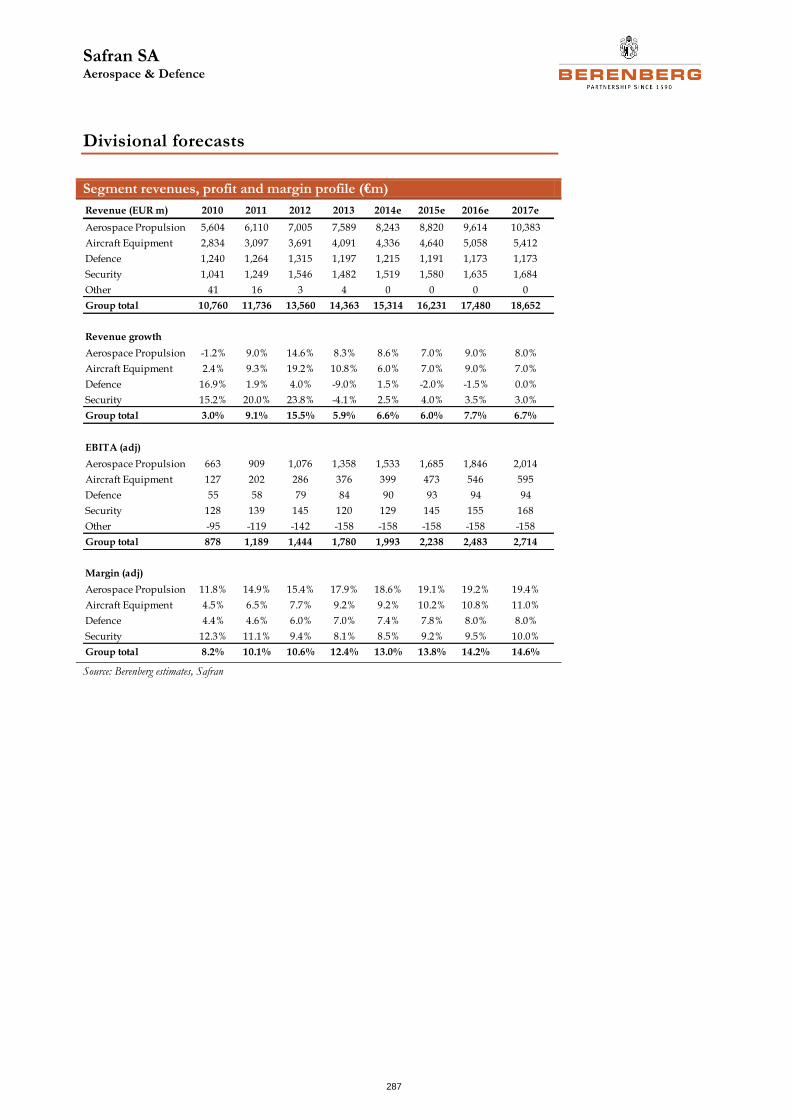
Safran SA Aerospace & Defence
287
Divisional forecasts
Segment revenues, profit and margin profile (€m)
Source: Berenberg estimates, Safran
Revenue (EUR m) 2010 2011 2012 2013 2014e 2015e 2016e 2017e
Aerospace Propulsion 5,604 6,110 7,005 7,589 8,243 8,820 9,614 10,383
Aircraft Equipment 2,834 3,097 3,691 4,091 4,336 4,640 5,058 5,412
Defence 1,240 1,264 1,315 1,197 1,215 1,191 1,173 1,173
Security 1,041 1,249 1,546 1,482 1,519 1,580 1,635 1,684
Other 41 16 3 4 0 0 0 0
Group total 10,760 11,736 13,560 14,363 15,314 16,231 17,480 18,652
Revenue growth
Aerospace Propulsion -1.2% 9.0% 14.6% 8.3% 8.6% 7.0% 9.0% 8.0%
Aircraft Equipment 2.4% 9.3% 19.2% 10.8% 6.0% 7.0% 9.0% 7.0%
Defence 16.9% 1.9% 4.0% -9.0% 1.5% -2.0% -1.5% 0.0%
Security 15.2% 20.0% 23.8% -4.1% 2.5% 4.0% 3.5% 3.0%
Group total 3.0% 9.1% 15.5% 5.9% 6.6% 6.0% 7.7% 6.7%
EBITA (adj)
Aerospace Propulsion 663 909 1,076 1,358 1,533 1,685 1,846 2,014
Aircraft Equipment 127 202 286 376 399 473 546 595
Defence 55 58 79 84 90 93 94 94
Security 128 139 145 120 129 145 155 168
Other -95 -119 -142 -158 -158 -158 -158 -158
Group total 878 1,189 1,444 1,780 1,993 2,238 2,483 2,714
Margin (adj)
Aerospace Propulsion 11.8% 14.9% 15.4% 17.9% 18.6% 19.1% 19.2% 19.4%
Aircraft Equipment 4.5% 6.5% 7.7% 9.2% 9.2% 10.2% 10.8% 11.0%
Defence 4.4% 4.6% 6.0% 7.0% 7.4% 7.8% 8.0% 8.0%
Security 12.3% 11.1% 9.4% 8.1% 8.5% 9.2% 9.5% 10.0%
Group total 8.2% 10.1% 10.6% 12.4% 13.0% 13.8% 14.2% 14.6%
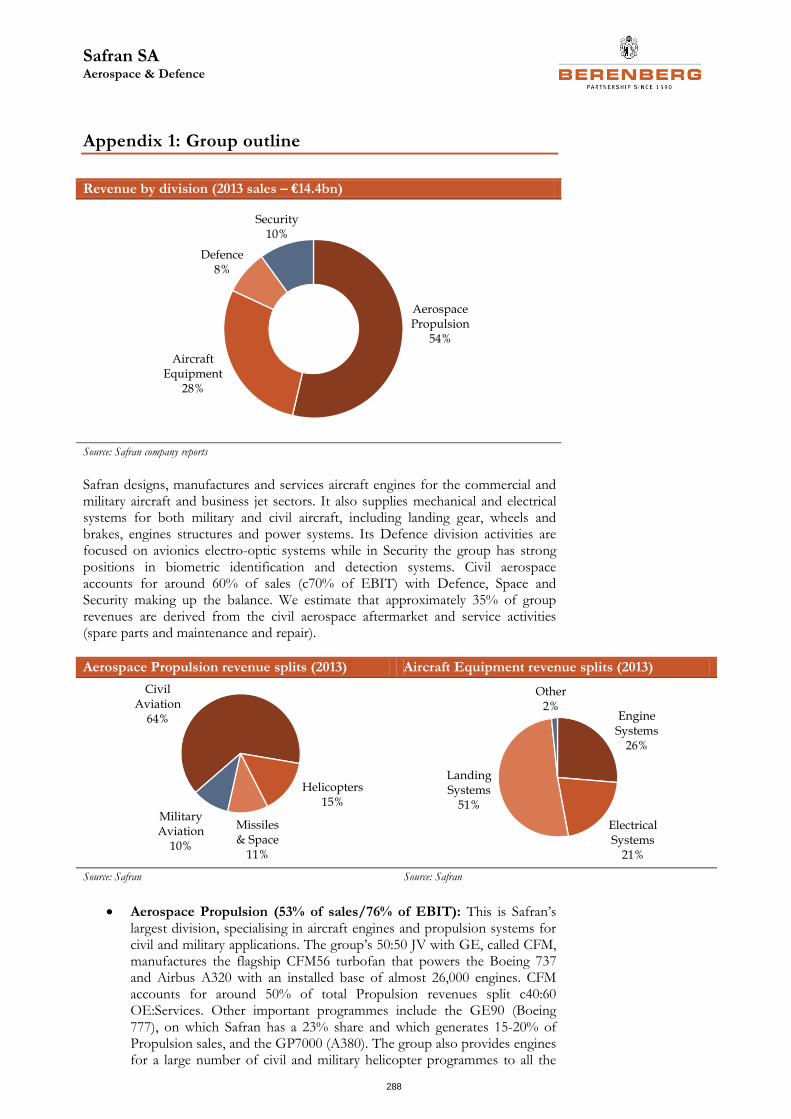
Safran SA Aerospace & Defence
288
Appendix 1: Group outline
Revenue by division (2013 sales – €14.4bn)
Source: Safran company reports
Safran designs, manufactures and services aircraft engines for the commercial and military aircraft and business jet sectors. It also supplies mechanical and electrical systems for both military and civil aircraft, including landing gear, wheels and brakes, engines structures and power systems. Its Defence division activities are focused on avionics electro-optic systems while in Security the group has strong positions in biometric identification and detection systems. Civil aerospace accounts for around 60% of sales (c70% of EBIT) with Defence, Space and Security making up the balance. We estimate that approximately 35% of group revenues are derived from the civil aerospace aftermarket and service activities (spare parts and maintenance and repair).
Aerospace Propulsion revenue splits (2013) Aircraft Equipment revenue splits (2013)
Source: Safran Source: Safran
Aerospace Propulsion (53% of sales/76% of EBIT): This is Safran’s largest division, specialising in aircraft engines and propulsion systems for civil and military applications. The group’s 50:50 JV with GE, called CFM, manufactures the flagship CFM56 turbofan that powers the Boeing 737 and Airbus A320 with an installed base of almost 26,000 engines. CFM accounts for around 50% of total Propulsion revenues split c40:60 OE:Services. Other important programmes include the GE90 (Boeing 777), on which Safran has a 23% share and which generates 15-20% of Propulsion sales, and the GP7000 (A380). The group also provides engines for a large number of civil and military helicopter programmes to all the
Aerospace Propulsion
54%
Aircraft Equipment
28%
Defence8%
Security10%
Civil Aviation
64%
Missiles & Space
11%
Military Aviation
10%
Helicopters15%
Engine Systems
26%
Electrical Systems
21%
Landing Systems
51%
Other2%
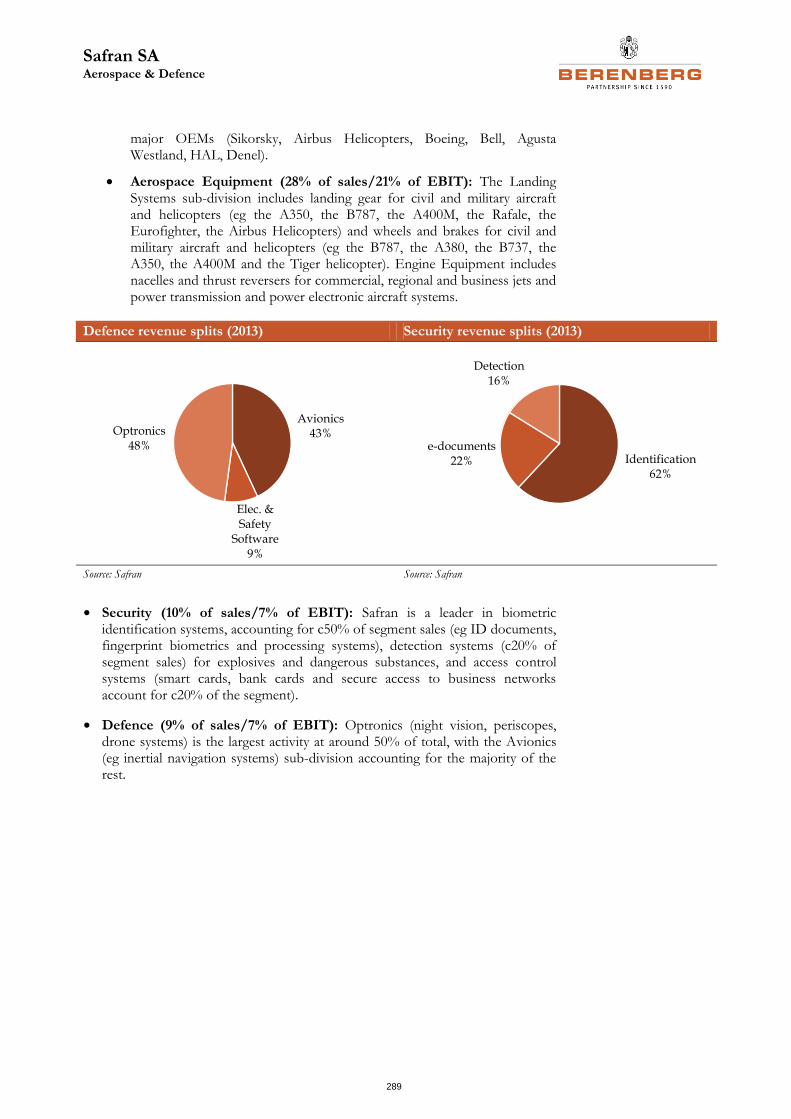
Safran SA Aerospace & Defence
289
major OEMs (Sikorsky, Airbus Helicopters, Boeing, Bell, Agusta Westland, HAL, Denel).
Aerospace Equipment (28% of sales/21% of EBIT): The Landing Systems sub-division includes landing gear for civil and military aircraft and helicopters (eg the A350, the B787, the A400M, the Rafale, the Eurofighter, the Airbus Helicopters) and wheels and brakes for civil and military aircraft and helicopters (eg the B787, the A380, the B737, the A350, the A400M and the Tiger helicopter). Engine Equipment includes nacelles and thrust reversers for commercial, regional and business jets and power transmission and power electronic aircraft systems.
Defence revenue splits (2013) Security revenue splits (2013)
Source: Safran Source: Safran
• Security (10% of sales/7% of EBIT): Safran is a leader in biometric identification systems, accounting for c50% of segment sales (eg ID documents, fingerprint biometrics and processing systems), detection systems (c20% of segment sales) for explosives and dangerous substances, and access control systems (smart cards, bank cards and secure access to business networks account for c20% of the segment).
• Defence (9% of sales/7% of EBIT): Optronics (night vision, periscopes, drone systems) is the largest activity at around 50% of total, with the Avionics (eg inertial navigation systems) sub-division accounting for the majority of the rest.
Avionics43%
Elec. & Safety
Software9%
Optronics48%
Detection16%
e-documents22% Identification
62%
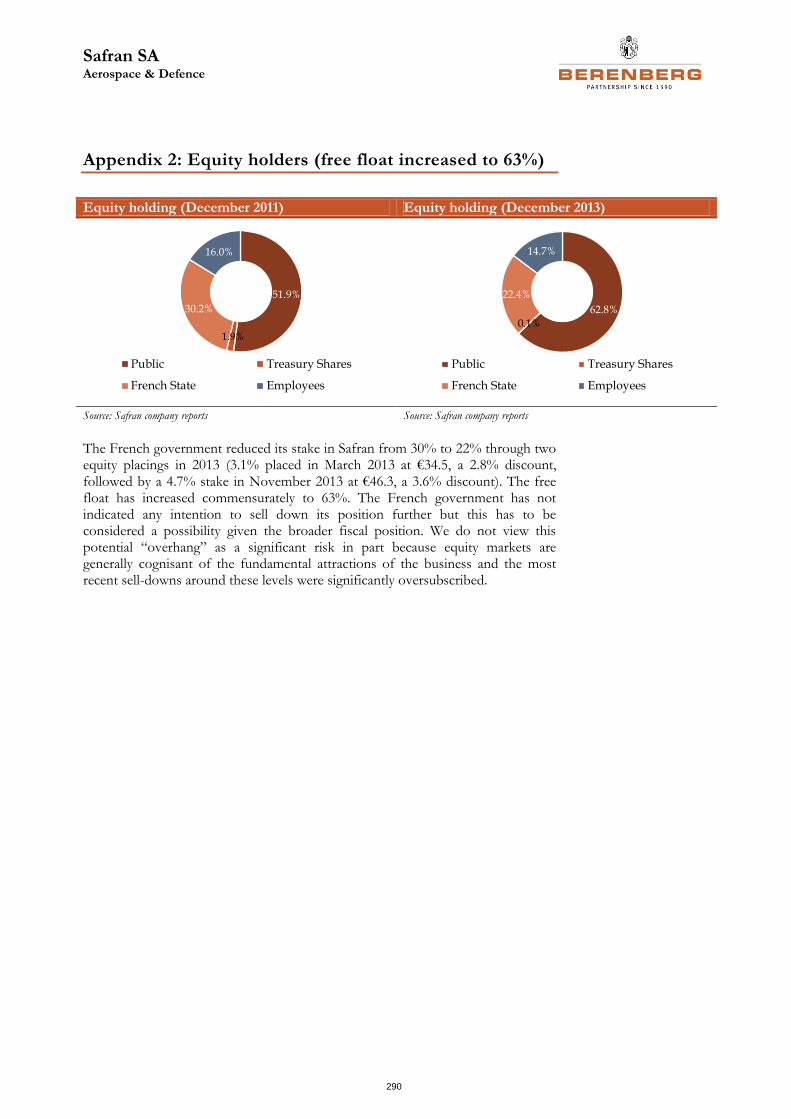
Safran SA Aerospace & Defence
290
Appendix 2: Equity holders (free float increased to 63%)
Equity holding (December 2011) Equity holding (December 2013)
Source: Safran company reports Source: Safran company reports
The French government reduced its stake in Safran from 30% to 22% through two equity placings in 2013 (3.1% placed in March 2013 at €34.5, a 2.8% discount, followed by a 4.7% stake in November 2013 at €46.3, a 3.6% discount). The free float has increased commensurately to 63%. The French government has not indicated any intention to sell down its position further but this has to be considered a possibility given the broader fiscal position. We do not view this potential “overhang” as a significant risk in part because equity markets are generally cognisant of the fundamental attractions of the business and the most recent sell-downs around these levels were significantly oversubscribed.
51.9%
1.9%
30.2%
16.0%
Public Treasury Shares
French State Employees
62.8%
0.1%
22.4%
14.7%
Public Treasury Shares
French State Employees
Safran SA Aerospace & Defence
291
Appendix 3: Engine service agreement structures
• T&M: Revenues are earned at the time of the actual shop visit based on material, parts and labour costs. Income, expenses and cash coincide. Around one-third of the fleet is serviced in this way.
• Material Service Agreements: Guaranteed commercial conditions of parts supply to airline or MRO providers (accounting for about 60% of total CFM shop visits). Income, expenses and cash coincide.
• Rate per flight hour (RPFH): These are long-term contracts generating revenues on a fixed sum per flight hour, based on the estimated cost to perform engine maintenance with performance/availability guarantees incorporated. Revenue is booked and cash received progressively, resulting in a decoupling from cash out. Around 20% of the CFM56 fleet is serviced under RPFH agreements. This will shift rapidly with the introduction of the LEAP engine, the majority of which are pre-sold with long-term RPFH contracts.
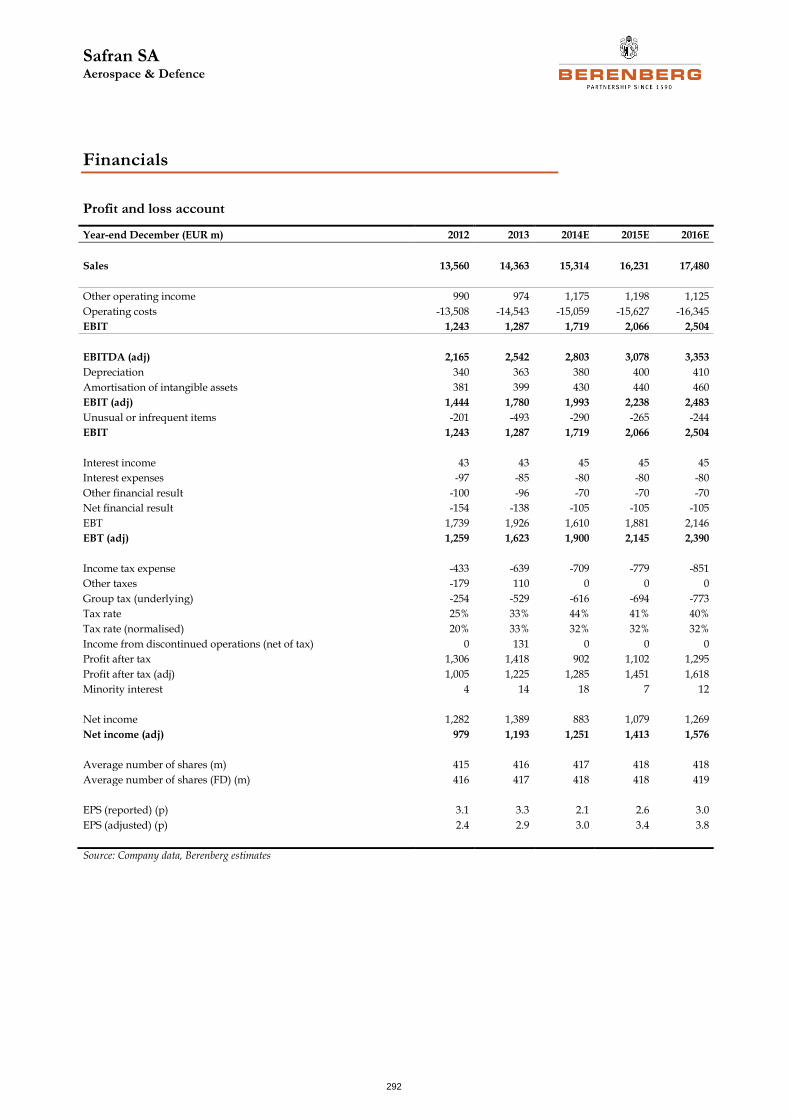
Safran SA Aerospace & Defence
292
Financials
Profit and loss account
Year-end December (EUR m) 2012 2013 2014E 2015E 2016E
Sales 13,560 14,363 15,314 16,231 17,480
Other operating income 990 974 1,175 1,198 1,125
Operating costs -13,508 -14,543 -15,059 -15,627 -16,345
EBIT 1,243 1,287 1,719 2,066 2,504
EBITDA (adj) 2,165 2,542 2,803 3,078 3,353
Depreciation 340 363 380 400 410
Amortisation of intangible assets 381 399 430 440 460
EBIT (adj) 1,444 1,780 1,993 2,238 2,483
Unusual or infrequent items -201 -493 -290 -265 -244
EBIT 1,243 1,287 1,719 2,066 2,504
Interest income 43 43 45 45 45
Interest expenses -97 -85 -80 -80 -80
Other financial result -100 -96 -70 -70 -70
Net financial result -154 -138 -105 -105 -105
EBT 1,739 1,926 1,610 1,881 2,146
EBT (adj) 1,259 1,623 1,900 2,145 2,390
Income tax expense -433 -639 -709 -779 -851
Other taxes -179 110 0 0 0
Group tax (underlying) -254 -529 -616 -694 -773
Tax rate 25% 33% 44% 41% 40%
Tax rate (normalised) 20% 33% 32% 32% 32%
Income from discontinued operations (net of tax) 0 131 0 0 0
Profit after tax 1,306 1,418 902 1,102 1,295
Profit after tax (adj) 1,005 1,225 1,285 1,451 1,618
Minority interest 4 14 18 7 12
Net income 1,282 1,389 883 1,079 1,269
Net income (adj) 979 1,193 1,251 1,413 1,576
Average number of shares (m) 415 416 417 418 418
Average number of shares (FD) (m) 416 417 418 418 419
EPS (reported) (p) 3.1 3.3 2.1 2.6 3.0
EPS (adjusted) (p) 2.4 2.9 3.0 3.4 3.8
Source: Company data, Berenberg estimates
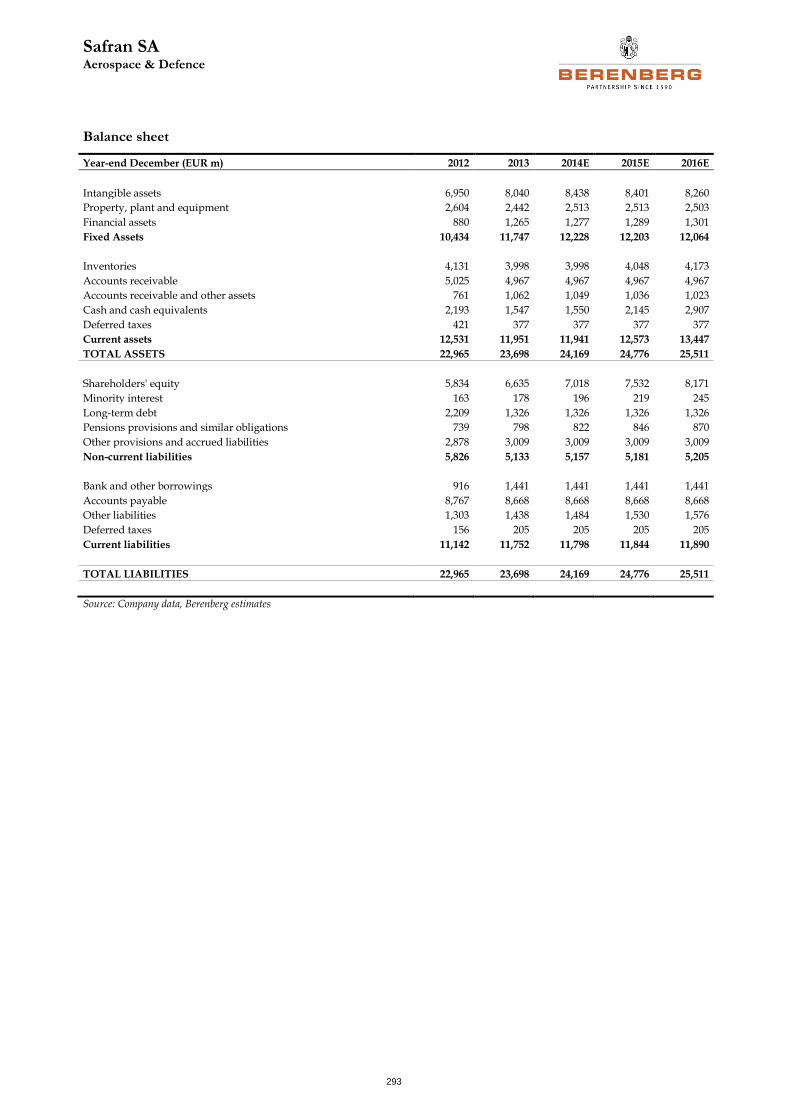
Safran SA Aerospace & Defence
293
Balance sheet
Year-end December (EUR m) 2012 2013 2014E 2015E 2016E
Intangible assets 6,950 8,040 8,438 8,401 8,260
Property, plant and equipment 2,604 2,442 2,513 2,513 2,503
Financial assets 880 1,265 1,277 1,289 1,301
Fixed Assets 10,434 11,747 12,228 12,203 12,064
Inventories 4,131 3,998 3,998 4,048 4,173
Accounts receivable 5,025 4,967 4,967 4,967 4,967
Accounts receivable and other assets 761 1,062 1,049 1,036 1,023
Cash and cash equivalents 2,193 1,547 1,550 2,145 2,907
Deferred taxes 421 377 377 377 377
Current assets 12,531 11,951 11,941 12,573 13,447
TOTAL ASSETS 22,965 23,698 24,169 24,776 25,511
Shareholders' equity 5,834 6,635 7,018 7,532 8,171
Minority interest 163 178 196 219 245
Long-term debt 2,209 1,326 1,326 1,326 1,326
Pensions provisions and similar obligations 739 798 822 846 870
Other provisions and accrued liabilities 2,878 3,009 3,009 3,009 3,009
Non-current liabilities 5,826 5,133 5,157 5,181 5,205
Bank and other borrowings 916 1,441 1,441 1,441 1,441
Accounts payable 8,767 8,668 8,668 8,668 8,668
Other liabilities 1,303 1,438 1,484 1,530 1,576
Deferred taxes 156 205 205 205 205
Current liabilities 11,142 11,752 11,798 11,844 11,890
TOTAL LIABILITIES 22,965 23,698 24,169 24,776 25,511
Source: Company data, Berenberg estimates
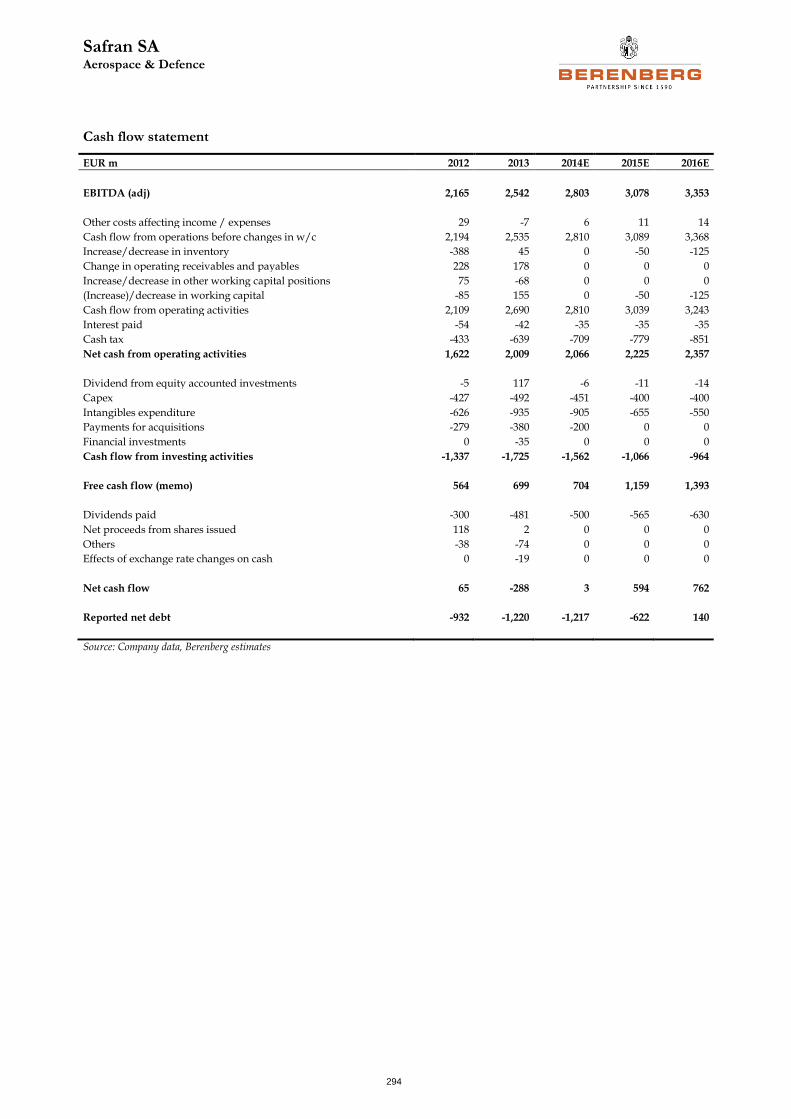
Safran SA Aerospace & Defence
294
Cash flow statement
EUR m 2012 2013 2014E 2015E 2016E
EBITDA (adj) 2,165 2,542 2,803 3,078 3,353
Other costs affecting income / expenses 29 -7 6 11 14
Cash flow from operations before changes in w/c 2,194 2,535 2,810 3,089 3,368
Increase/decrease in inventory -388 45 0 -50 -125
Change in operating receivables and payables 228 178 0 0 0
Increase/decrease in other working capital positions 75 -68 0 0 0
(Increase)/decrease in working capital -85 155 0 -50 -125
Cash flow from operating activities 2,109 2,690 2,810 3,039 3,243
Interest paid -54 -42 -35 -35 -35
Cash tax -433 -639 -709 -779 -851
Net cash from operating activities 1,622 2,009 2,066 2,225 2,357
Dividend from equity accounted investments -5 117 -6 -11 -14
Capex -427 -492 -451 -400 -400
Intangibles expenditure -626 -935 -905 -655 -550
Payments for acquisitions -279 -380 -200 0 0
Financial investments 0 -35 0 0 0
Cash flow from investing activities -1,337 -1,725 -1,562 -1,066 -964
Free cash flow (memo) 564 699 704 1,159 1,393
Dividends paid -300 -481 -500 -565 -630
Net proceeds from shares issued 118 2 0 0 0
Others -38 -74 0 0 0
Effects of exchange rate changes on cash 0 -19 0 0 0
Net cash flow 65 -288 3 594 762
Reported net debt -932 -1,220 -1,217 -622 140
Source: Company data, Berenberg estimates
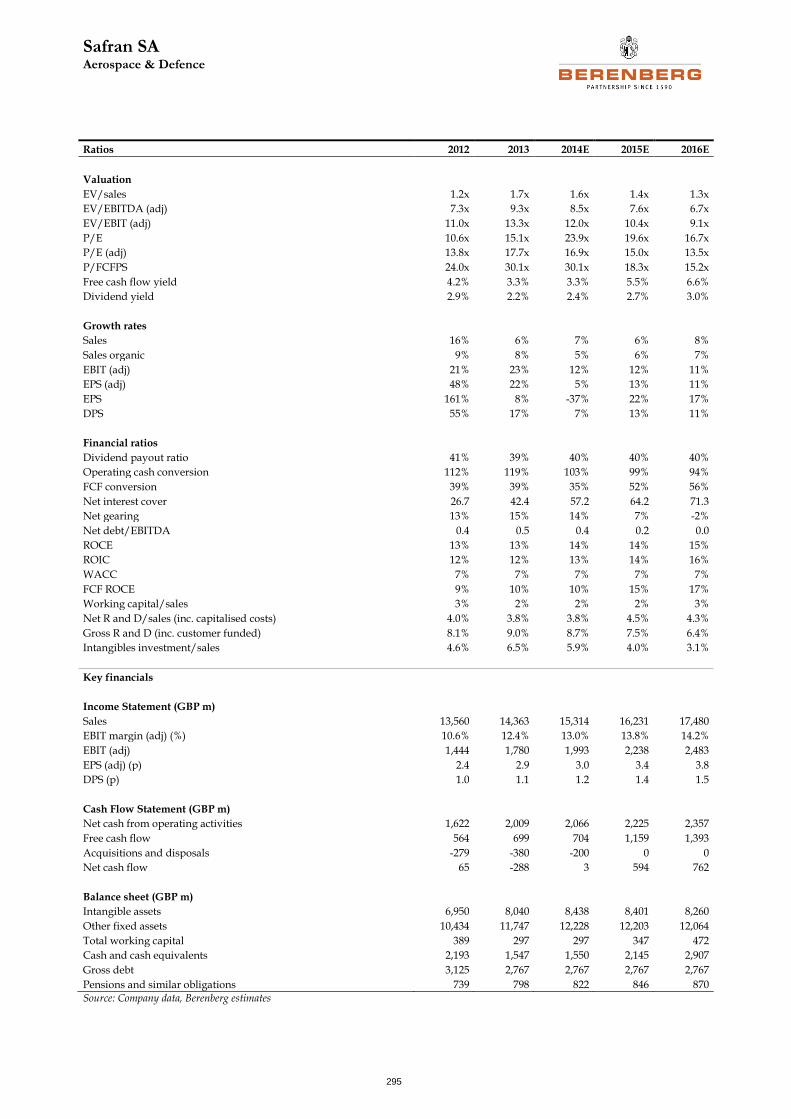
Safran SA Aerospace & Defence
295
Ratios 2012 2013 2014E 2015E 2016E
Valuation
EV/sales 1.2x 1.7x 1.6x 1.4x 1.3x
EV/EBITDA (adj) 7.3x 9.3x 8.5x 7.6x 6.7x
EV/EBIT (adj) 11.0x 13.3x 12.0x 10.4x 9.1x
P/E 10.6x 15.1x 23.9x 19.6x 16.7x
P/E (adj) 13.8x 17.7x 16.9x 15.0x 13.5x
P/FCFPS 24.0x 30.1x 30.1x 18.3x 15.2x
Free cash flow yield 4.2% 3.3% 3.3% 5.5% 6.6%
Dividend yield 2.9% 2.2% 2.4% 2.7% 3.0%
Growth rates
Sales 16% 6% 7% 6% 8%
Sales organic 9% 8% 5% 6% 7%
EBIT (adj) 21% 23% 12% 12% 11%
EPS (adj) 48% 22% 5% 13% 11%
EPS 161% 8% -37% 22% 17%
DPS 55% 17% 7% 13% 11%
Financial ratios
Dividend payout ratio 41% 39% 40% 40% 40%
Operating cash conversion 112% 119% 103% 99% 94%
FCF conversion 39% 39% 35% 52% 56%
Net interest cover 26.7 42.4 57.2 64.2 71.3
Net gearing 13% 15% 14% 7% -2%
Net debt/EBITDA 0.4 0.5 0.4 0.2 0.0
ROCE 13% 13% 14% 14% 15%
ROIC 12% 12% 13% 14% 16%
WACC 7% 7% 7% 7% 7%
FCF ROCE 9% 10% 10% 15% 17%
Working capital/sales 3% 2% 2% 2% 3%
Net R and D/sales (inc. capitalised costs) 4.0% 3.8% 3.8% 4.5% 4.3%
Gross R and D (inc. customer funded) 8.1% 9.0% 8.7% 7.5% 6.4%
Intangibles investment/sales 4.6% 6.5% 5.9% 4.0% 3.1%
Key financials
Income Statement (GBP m)
Sales 13,560 14,363 15,314 16,231 17,480
EBIT margin (adj) (%) 10.6% 12.4% 13.0% 13.8% 14.2%
EBIT (adj) 1,444 1,780 1,993 2,238 2,483
EPS (adj) (p) 2.4 2.9 3.0 3.4 3.8
DPS (p) 1.0 1.1 1.2 1.4 1.5
Cash Flow Statement (GBP m)
Net cash from operating activities 1,622 2,009 2,066 2,225 2,357
Free cash flow 564 699 704 1,159 1,393
Acquisitions and disposals -279 -380 -200 0 0
Net cash flow 65 -288 3 594 762
Balance sheet (GBP m)
Intangible assets 6,950 8,040 8,438 8,401 8,260
Other fixed assets 10,434 11,747 12,228 12,203 12,064
Total working capital 389 297 297 347 472
Cash and cash equivalents 2,193 1,547 1,550 2,145 2,907
Gross debt 3,125 2,767 2,767 2,767 2,767
Pensions and similar obligations 739 798 822 846 870 Source: Company data, Berenberg estimates
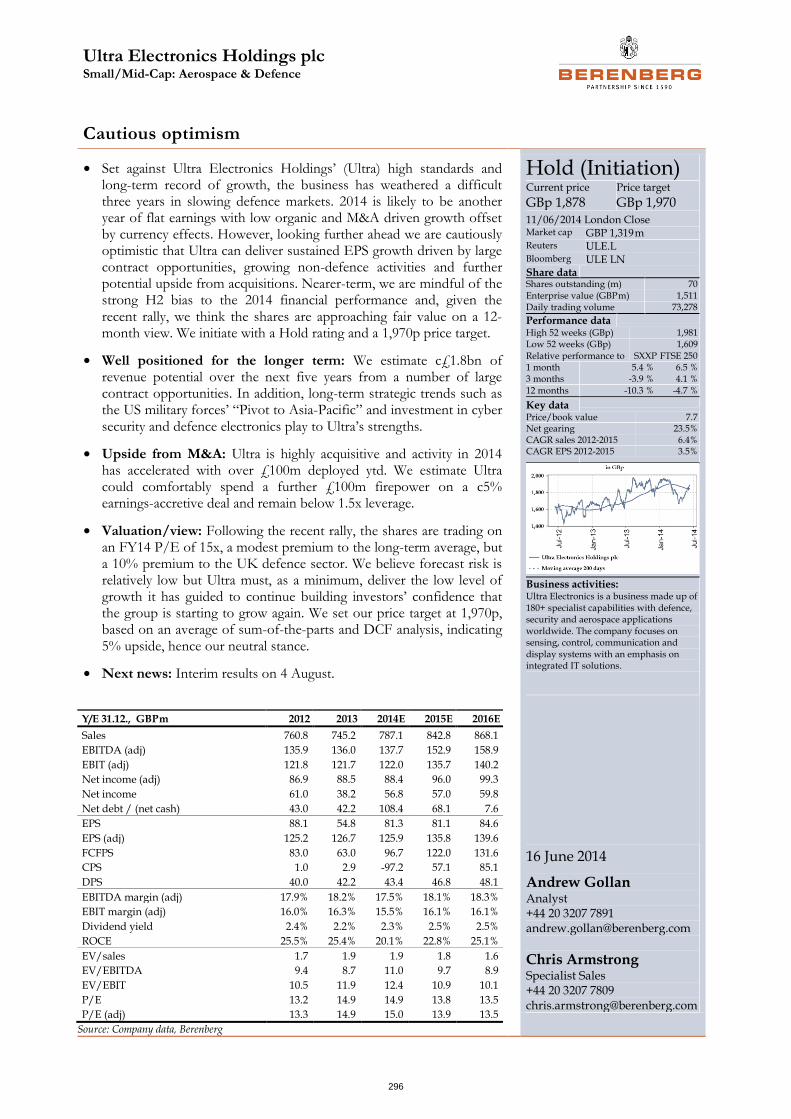
Ultra Electronics Holdings plc Small/Mid-Cap: Aerospace & Defence
296
Cautious optimism
• Set against Ultra Electronics Holdings’ (Ultra) high standards and long-term record of growth, the business has weathered a difficult three years in slowing defence markets. 2014 is likely to be another year of flat earnings with low organic and M&A driven growth offset by currency effects. However, looking further ahead we are cautiously optimistic that Ultra can deliver sustained EPS growth driven by large contract opportunities, growing non-defence activities and further potential upside from acquisitions. Nearer-term, we are mindful of the strong H2 bias to the 2014 financial performance and, given the recent rally, we think the shares are approaching fair value on a 12-month view. We initiate with a Hold rating and a 1,970p price target.
• Well positioned for the longer term: We estimate c£1.8bn of revenue potential over the next five years from a number of large contract opportunities. In addition, long-term strategic trends such as the US military forces’ “Pivot to Asia-Pacific” and investment in cyber security and defence electronics play to Ultra’s strengths.
• Upside from M&A: Ultra is highly acquisitive and activity in 2014 has accelerated with over £100m deployed ytd. We estimate Ultra could comfortably spend a further £100m firepower on a c5% earnings-accretive deal and remain below 1.5x leverage.
• Valuation/view: Following the recent rally, the shares are trading on an FY14 P/E of 15x, a modest premium to the long-term average, but a 10% premium to the UK defence sector. We believe forecast risk is relatively low but Ultra must, as a minimum, deliver the low level of growth it has guided to continue building investors’ confidence that the group is starting to grow again. We set our price target at 1,970p, based on an average of sum-of-the-parts and DCF analysis, indicating 5% upside, hence our neutral stance.
• Next news: Interim results on 4 August.
Hold (Initiation) Current price
GBp 1,878 Price target
GBp 1,970 11/06/2014 London Close Market cap GBP 1,319 m Reuters ULE.L Bloomberg ULE LN Share data
Shares outstanding (m) 70 Enterprise value (GBP m) 1,511 Daily trading volume 73,278
Performance data
High 52 weeks (GBp) 1,981 Low 52 weeks (GBp) 1,609
Relative performance to SXXP FTSE 250 1 month 5.4 % 6.5 % 3 months -3.9 % 4.1 % 12 months -10.3 % -4.7 %
Key data
Price/book value 7.7 Net gearing 23.5% CAGR sales 2012-2015 6.4% CAGR EPS 2012-2015 3.5%
Business activities: Ultra Electronics is a business made up of 180+ specialist capabilities with defence, security and aerospace applications worldwide. The company focuses on sensing, control, communication and display systems with an emphasis on integrated IT solutions.
16 June 2014
Andrew Gollan Analyst +44 20 3207 7891 [email protected]
Chris Armstrong
Specialist Sales +44 20 3207 7809 [email protected]
Y/E 31.12., GBP m 2012 2013 2014E 2015E 2016E
Sales 760.8 745.2 787.1 842.8 868.1
EBITDA (adj) 135.9 136.0 137.7 152.9 158.9
EBIT (adj) 121.8 121.7 122.0 135.7 140.2
Net income (adj) 86.9 88.5 88.4 96.0 99.3
Net income 61.0 38.2 56.8 57.0 59.8
Net debt / (net cash) 43.0 42.2 108.4 68.1 7.6
EPS 88.1 54.8 81.3 81.1 84.6
EPS (adj) 125.2 126.7 125.9 135.8 139.6
FCFPS 83.0 63.0 96.7 122.0 131.6
CPS 1.0 2.9 -97.2 57.1 85.1
DPS 40.0 42.2 43.4 46.8 48.1
EBITDA margin (adj) 17.9% 18.2% 17.5% 18.1% 18.3%
EBIT margin (adj) 16.0% 16.3% 15.5% 16.1% 16.1%
Dividend yield 2.4% 2.2% 2.3% 2.5% 2.5%
ROCE 25.5% 25.4% 20.1% 22.8% 25.1%
EV/sales 1.7 1.9 1.9 1.8 1.6
EV/EBITDA 9.4 8.7 11.0 9.7 8.9
EV/EBIT 10.5 11.9 12.4 10.9 10.1
P/E 13.2 14.9 14.9 13.8 13.5
P/E (adj) 13.3 14.9 15.0 13.9 13.5
Source: Company data, Berenberg
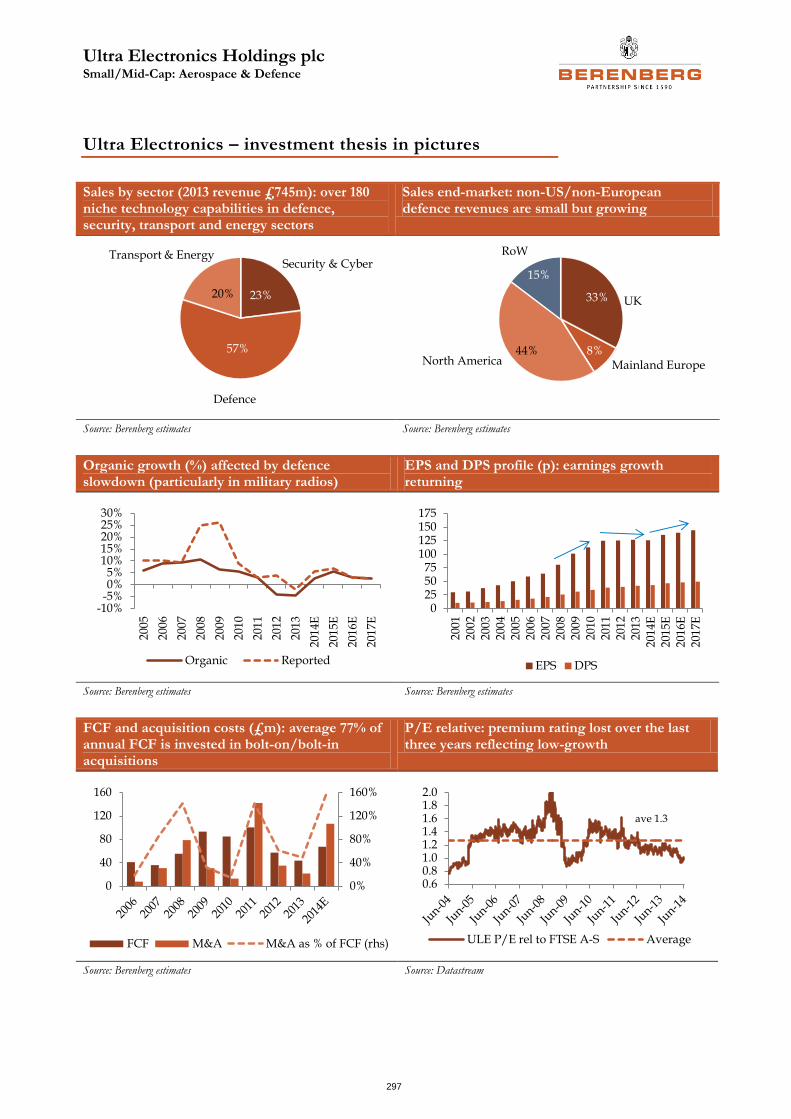
Ultra Electronics Holdings plc Small/Mid-Cap: Aerospace & Defence
297
Ultra Electronics – investment thesis in pictures
Sales by sector (2013 revenue £745m): over 180 niche technology capabilities in defence, security, transport and energy sectors
Sales end-market: non-US/non-European defence revenues are small but growing
Source: Berenberg estimates Source: Berenberg estimates
Organic growth (%) affected by defence slowdown (particularly in military radios)
EPS and DPS profile (p): earnings growth returning
Source: Berenberg estimates Source: Berenberg estimates
FCF and acquisition costs (£m): average 77% of annual FCF is invested in bolt-on/bolt-in acquisitions
P/E relative: premium rating lost over the last three years reflecting low-growth
Source: Berenberg estimates Source: Datastream
23%
57%
20%
Security & Cyber
Defence
Transport & Energy
33%
8%44%
15%
UK
Mainland EuropeNorth America
RoW
-10%-5%0%5%
10%15%20%25%30%
2005
200
6
200
7
200
8
200
9
2010
201
1
201
2
201
3
2014
E
201
5E
201
6E
201
7E
Organic Reported
0255075
100125150175
200
12
002
200
320
0420
0520
0620
072
008
200
92
010
201
12
012
201
32
014E
201
5E2
016E
201
7E
EPS DPS
0%
40%
80%
120%
160%
0
40
80
120
160
FCF M&A M&A as % of FCF (rhs)
0.60.81.01.21.41.61.82.0
ULE P/E rel to FTSE A-S Average
ave 1.3
Ultra Electronics Holdings plc Small/Mid-Cap: Aerospace & Defence
298
Ultra Electronics – investment thesis
High-quality small/mid-cap defence electronics company
Ultra is a specialist electronics business with a broad range of capabilities in the defence, security, transport and energy sectors. Within defence, Ultra’s businesses are well exposed to government’s priority areas of military spending such as cyber and security (23%), and anti-submarine warfare (20%), which should mitigate against enduring budgetary pressures. A diversified and specialised portfolio equates to a relatively low earnings risk profile compared to European defence peers.
Return to organic growth in 2014 but neutralised out by FX
In recent years, Ultra has not lived up to its historical status as a growth company due to headwinds in defence, in particular in the US market, where disruption in the procurement process has exacerbated the situation. A return to organic growth in 2014 is therefore directionally significant for Ultra (albeit it is modest growth – we estimate 1%), with underlying gains in non-defence activities (43% of sales) offset by a c3% FX headwind. At the EPS level, we anticipate another broadly flat year (the fourth consecutive flat year). For 2015, we factor organic growth of 3% which, together with the impact of acquisitions (discussed below), we estimate translates to EPS growth of 8%.
Acquisition growth
M&A is a central to Ultra’s growth strategy, with over 75% of free cash flow invested in acquisitions over the last 10 years. After a relatively quiet 2012 and 2013, Ultra has stepped up M&A activity in 2014 spending c$175m/c£110m ytd on three transactions: 3 Phoenix Inc (3PI, $70m plus up to $17m), Forensic Technology ($94m plus up to $6m), ICE Corp ($8.6m). With Ultra, there is always the possibility of further bolt-on acquisitions, but following these latest transactions it is probably reasonable to expect the prospect of larger sized deals is diminished in the short term. However, Ultra is highly cash-generative and balance sheet leverage remains low – we forecast December 2014 net debt/EBITDA of 0.7x falling to 0.4x in 2015. Our M&A model suggests the group could deploy a further £100m, on an “Ultra-style” acquisition (ie similar margin and valuation multiple profile) and remain comfortably under 1.5x leveraged, for c4% earnings accretion.
Increasing number of large contract opportunities
As the group has grown, so has the scale of potential contract opportunities. Management has identified a number of large multi-year contract opportunities that could bring substantial revenues over the mid-/longer term. We estimate blue-sky annual revenues of £1.85bn, albeit not all incremental.
Share price performance and valuation
Over a two-year period, the Ultra share price has significantly underperformed the sector, reflecting lower organic growth expectations. 2014 has been especially volatile, with a c15% sell-off from the early January high of 1,970p to 1,670p, driven by a combination of sector rotation and increasing currency headwinds. The shares have since recovered to c1,900p buoyed by a series of enhancing acquisitions and positive contract announcements. The shares currently trade on a 12-month forward P/E of 14.3x according to Datastream consensus, a 3% discount to the long-term average of 14.7x.
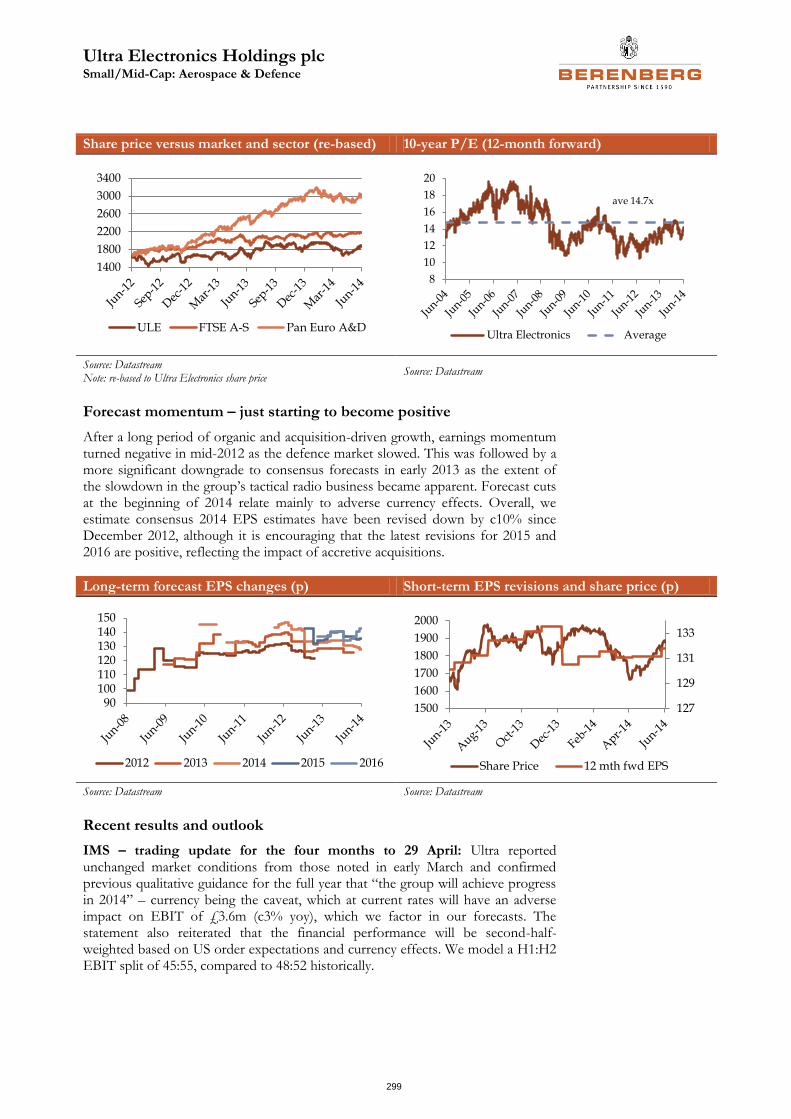
Ultra Electronics Holdings plc Small/Mid-Cap: Aerospace & Defence
299
Share price versus market and sector (re-based) 10-year P/E (12-month forward)
Source: Datastream Note: re-based to Ultra Electronics share price
Source: Datastream
Forecast momentum – just starting to become positive
After a long period of organic and acquisition-driven growth, earnings momentum turned negative in mid-2012 as the defence market slowed. This was followed by a more significant downgrade to consensus forecasts in early 2013 as the extent of the slowdown in the group’s tactical radio business became apparent. Forecast cuts at the beginning of 2014 relate mainly to adverse currency effects. Overall, we estimate consensus 2014 EPS estimates have been revised down by c10% since December 2012, although it is encouraging that the latest revisions for 2015 and 2016 are positive, reflecting the impact of accretive acquisitions.
Long-term forecast EPS changes (p) Short-term EPS revisions and share price (p)
Source: Datastream Source: Datastream
Recent results and outlook
IMS – trading update for the four months to 29 April: Ultra reported unchanged market conditions from those noted in early March and confirmed previous qualitative guidance for the full year that “the group will achieve progress in 2014” – currency being the caveat, which at current rates will have an adverse impact on EBIT of £3.6m (c3% yoy), which we factor in our forecasts. The statement also reiterated that the financial performance will be second-half-weighted based on US order expectations and currency effects. We model a H1:H2 EBIT split of 45:55, compared to 48:52 historically.
1400
1800
2200
2600
3000
3400
ULE FTSE A-S Pan Euro A&D
8
10
12
14
16
18
20
Ultra Electronics Average
ave 14.7x
90100110120130140150
2012 2013 2014 2015 2016
127
129
131
133
1500
1600
1700
1800
1900
2000
Share Price 12 mth fwd EPS
Ultra Electronics Holdings plc Small/Mid-Cap: Aerospace & Defence
300
Investment risks and concerns
• Anaemic growth persists: Any shortfall or deferral of organic growth against expectations will damage investors’ confidence that the group will return to a sustained growth profile. This could have a long-term impact on the group’s relative valuation which has historically traded at premium multiples. Continued downwards pressure on defence spending, particularly in the US, represents the greatest risk in this respect.
• Contract execution risk: Ultra is bidding for and delivering an increasing number of large and complex contracts. Poor execution and/or programme management could materially affect group financial performance.
• Acquisition risk: We estimate Ultra’s acquisition growth model funded by organically generated cash has, on average, delivered mid-single-digit revenue growth annually. The scale of acquisitions will need to increase (number/size) to have the same impact on the enlarged group. Ultra has a good track record of M&A integration and value creation but the £44m write-down of goodwill on Prologic in 2013 serves as a reminder of the risks inherent in a portfolio build-out strategy.
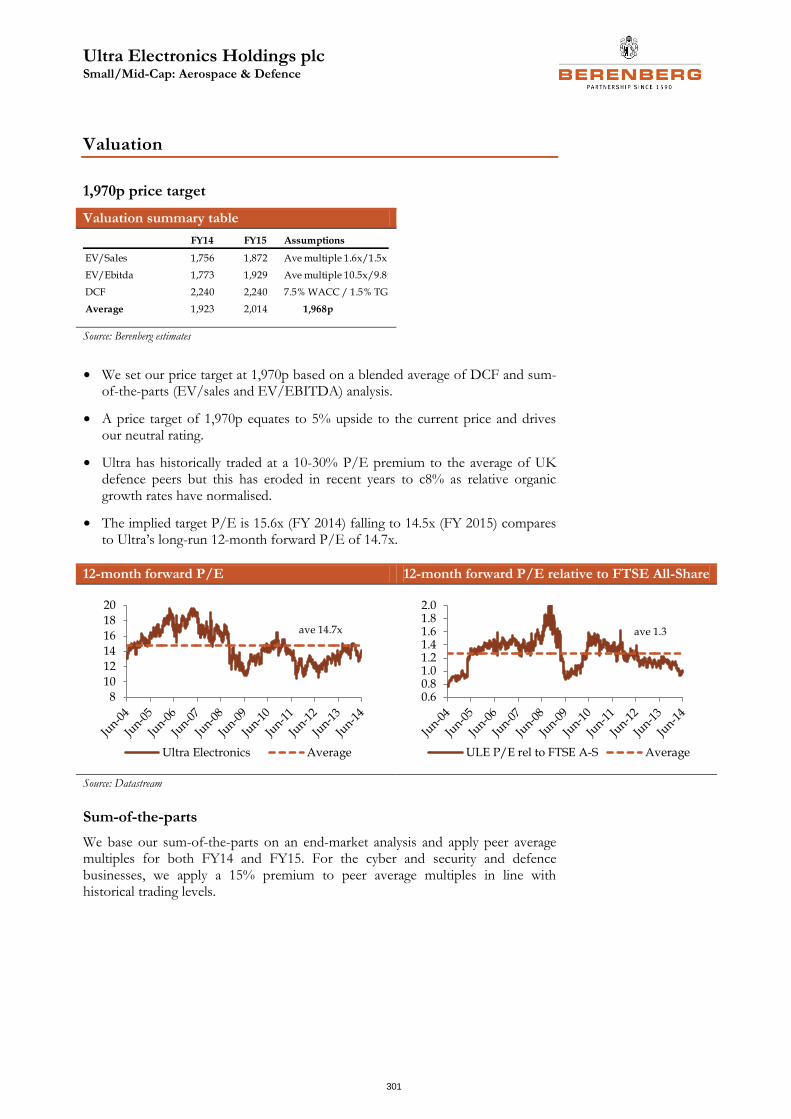
Ultra Electronics Holdings plc Small/Mid-Cap: Aerospace & Defence
301
Valuation
1,970p price target
Valuation summary table
Source: Berenberg estimates
• We set our price target at 1,970p based on a blended average of DCF and sum-of-the-parts (EV/sales and EV/EBITDA) analysis.
• A price target of 1,970p equates to 5% upside to the current price and drives our neutral rating.
• Ultra has historically traded at a 10-30% P/E premium to the average of UK defence peers but this has eroded in recent years to c8% as relative organic growth rates have normalised.
• The implied target P/E is 15.6x (FY 2014) falling to 14.5x (FY 2015) compares to Ultra’s long-run 12-month forward P/E of 14.7x.
12-month forward P/E 12-month forward P/E relative to FTSE All-Share
Source: Datastream
Sum-of-the-parts
We base our sum-of-the-parts on an end-market analysis and apply peer average multiples for both FY14 and FY15. For the cyber and security and defence businesses, we apply a 15% premium to peer average multiples in line with historical trading levels.
FY14 FY15 Assumptions
EV/Sales 1,756 1,872 Ave multiple 1.6x/1.5x
EV/Ebitda 1,773 1,929 Ave multiple 10.5x/9.8x
DCF 2,240 2,240 7.5% WACC / 1.5% TG
Average 1,923 2,014 1,968p
8
10
12
14
16
18
20
Ultra Electronics Average
ave 14.7x
0.60.81.01.21.41.61.82.0
ULE P/E rel to FTSE A-S Average
ave 1.3
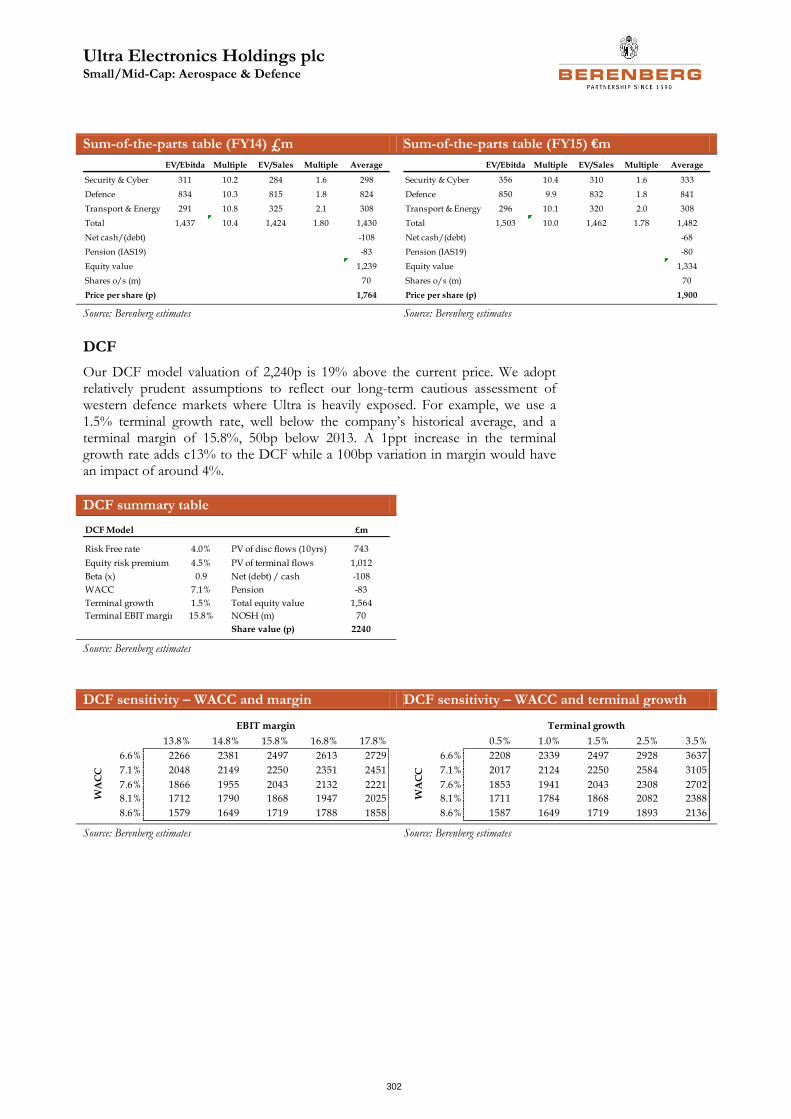
Ultra Electronics Holdings plc Small/Mid-Cap: Aerospace & Defence
302
Sum-of-the-parts table (FY14) £m Sum-of-the-parts table (FY15) €m
Source: Berenberg estimates Source: Berenberg estimates
DCF
Our DCF model valuation of 2,240p is 19% above the current price. We adopt relatively prudent assumptions to reflect our long-term cautious assessment of western defence markets where Ultra is heavily exposed. For example, we use a 1.5% terminal growth rate, well below the company’s historical average, and a terminal margin of 15.8%, 50bp below 2013. A 1ppt increase in the terminal growth rate adds c13% to the DCF while a 100bp variation in margin would have an impact of around 4%.
DCF summary table
Source: Berenberg estimates
DCF sensitivity – WACC and margin DCF sensitivity – WACC and terminal growth
Source: Berenberg estimates Source: Berenberg estimates
EV/Ebitda Multiple EV/Sales Multiple Average
Security & Cyber 311 10.2 284 1.6 298
Defence 834 10.3 815 1.8 824
Transport & Energy 291 10.8 325 2.1 308
Total 1,437 10.4 1,424 1.80 1,430
Net cash/(debt) -108
Pension (IAS19) -83
Equity value 1,239
Shares o/s (m) 70
Price per share (p) 1,764
EV/Ebitda Multiple EV/Sales Multiple Average
Security & Cyber 356 10.4 310 1.6 333
Defence 850 9.9 832 1.8 841
Transport & Energy 296 10.1 320 2.0 308
Total 1,503 10.0 1,462 1.78 1,482
Net cash/(debt) -68
Pension (IAS19) -80
Equity value 1,334
Shares o/s (m) 70
Price per share (p) 1,900
DCF Model £m
Risk Free rate 4.0% PV of disc flows (10yrs) 743
Equity risk premium 4.5% PV of terminal flows 1,012
Beta (x) 0.9 Net (debt) / cash -108
WACC 7.1% Pension -83
Terminal growth 1.5% Total equity value 1,564
Terminal EBIT margin 15.8% NOSH (m) 70
Share value (p) 2240
2240 13.8% 14.8% 15.8% 16.8% 17.8%
6.6% 2266 2381 2497 2613 2729
7.1% 2048 2149 2250 2351 2451
7.6% 1866 1955 2043 2132 2221
8.1% 1712 1790 1868 1947 2025
8.6% 1579 1649 1719 1788 1858
EBIT margin
WA
CC
2240 0.5% 1.0% 1.5% 2.5% 3.5%
6.6% 2208 2339 2497 2928 3637
7.1% 2017 2124 2250 2584 3105
7.6% 1853 1941 2043 2308 2702
8.1% 1711 1784 1868 2082 2388
8.6% 1587 1649 1719 1893 2136
Terminal growth
WA
CC
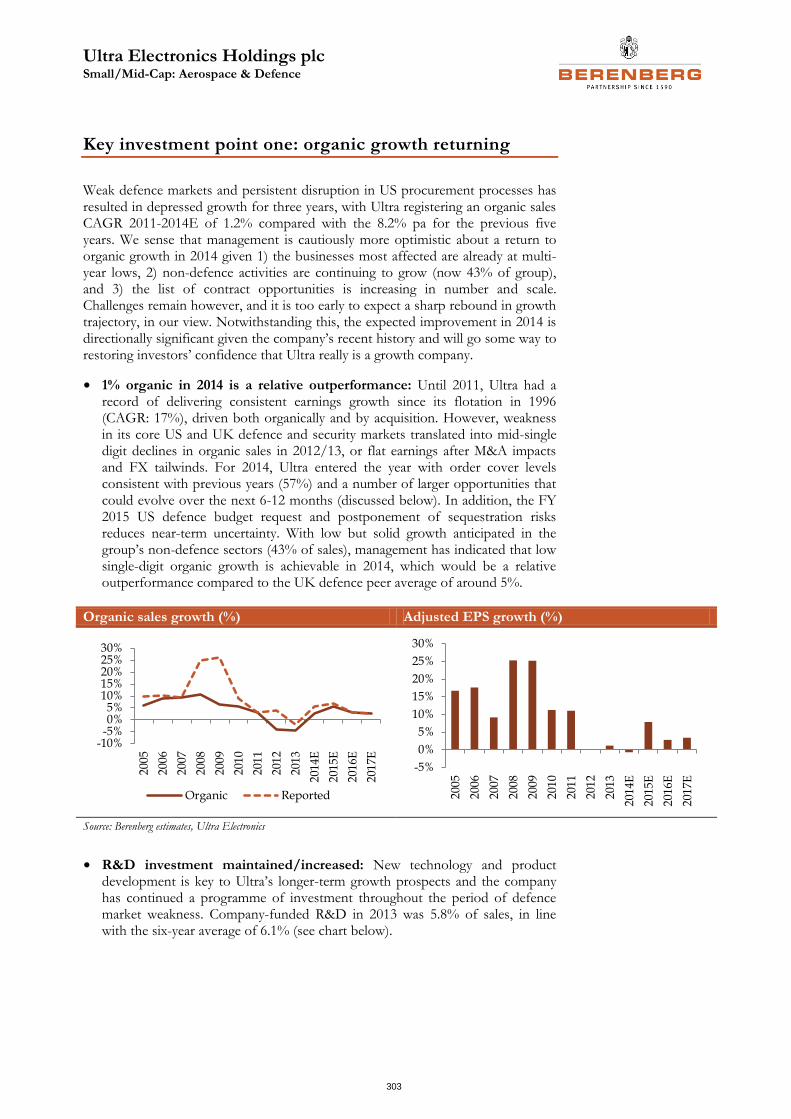
Ultra Electronics Holdings plc Small/Mid-Cap: Aerospace & Defence
303
Key investment point one: organic growth returning
Weak defence markets and persistent disruption in US procurement processes has resulted in depressed growth for three years, with Ultra registering an organic sales CAGR 2011-2014E of 1.2% compared with the 8.2% pa for the previous five years. We sense that management is cautiously more optimistic about a return to organic growth in 2014 given 1) the businesses most affected are already at multi-year lows, 2) non-defence activities are continuing to grow (now 43% of group), and 3) the list of contract opportunities is increasing in number and scale. Challenges remain however, and it is too early to expect a sharp rebound in growth trajectory, in our view. Notwithstanding this, the expected improvement in 2014 is directionally significant given the company’s recent history and will go some way to restoring investors’ confidence that Ultra really is a growth company.
• 1% organic in 2014 is a relative outperformance: Until 2011, Ultra had a record of delivering consistent earnings growth since its flotation in 1996 (CAGR: 17%), driven both organically and by acquisition. However, weakness in its core US and UK defence and security markets translated into mid-single digit declines in organic sales in 2012/13, or flat earnings after M&A impacts and FX tailwinds. For 2014, Ultra entered the year with order cover levels consistent with previous years (57%) and a number of larger opportunities that could evolve over the next 6-12 months (discussed below). In addition, the FY 2015 US defence budget request and postponement of sequestration risks reduces near-term uncertainty. With low but solid growth anticipated in the group’s non-defence sectors (43% of sales), management has indicated that low single-digit organic growth is achievable in 2014, which would be a relative outperformance compared to the UK defence peer average of around 5%.
Organic sales growth (%) Adjusted EPS growth (%)
Source: Berenberg estimates, Ultra Electronics
• R&D investment maintained/increased: New technology and product development is key to Ultra’s longer-term growth prospects and the company has continued a programme of investment throughout the period of defence market weakness. Company-funded R&D in 2013 was 5.8% of sales, in line with the six-year average of 6.1% (see chart below).
-10%-5%0%5%
10%15%20%25%30%
2005
200
6
200
7
200
8
200
9
2010
201
1
201
2
201
3
2014
E
201
5E
201
6E
201
7E
Organic Reported
-5%
0%
5%
10%
15%
20%
25%
30%
2005
2006
2007
2008
2009
2010
2011
2012
2013
2014
E
2015
E
2016
E
2017
E
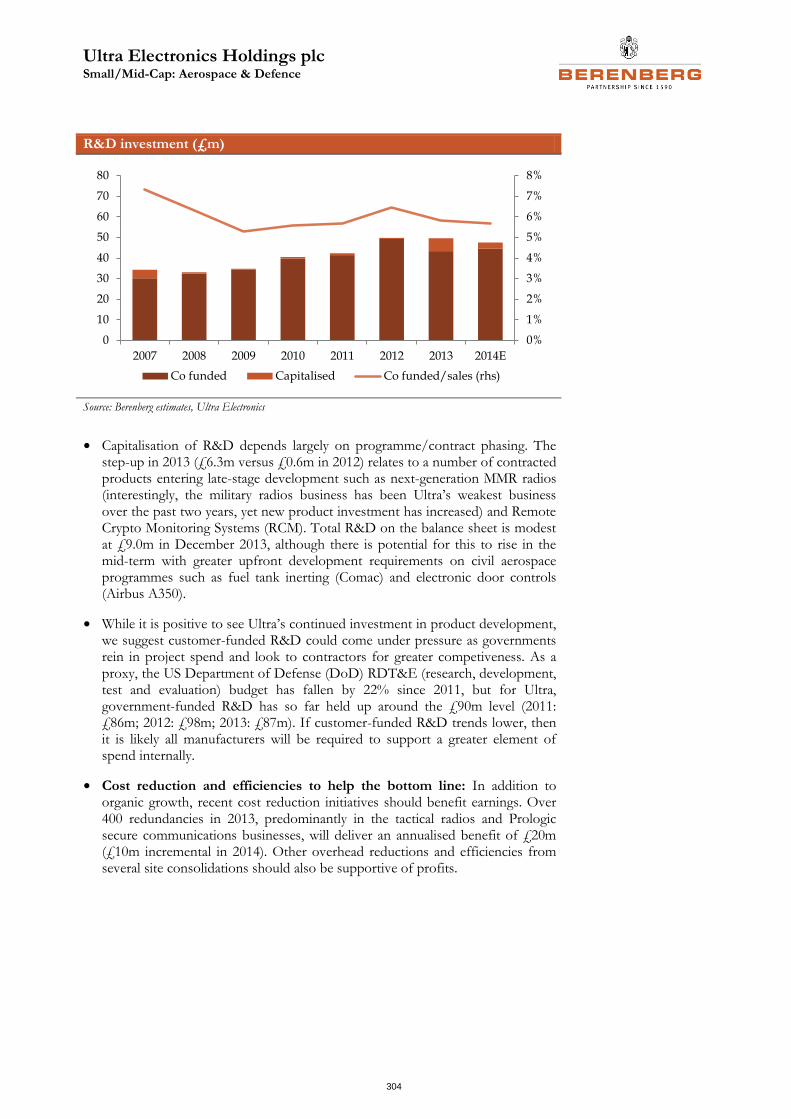
Ultra Electronics Holdings plc Small/Mid-Cap: Aerospace & Defence
304
R&D investment (£m)
Source: Berenberg estimates, Ultra Electronics
• Capitalisation of R&D depends largely on programme/contract phasing. The step-up in 2013 (£6.3m versus £0.6m in 2012) relates to a number of contracted products entering late-stage development such as next-generation MMR radios (interestingly, the military radios business has been Ultra’s weakest business over the past two years, yet new product investment has increased) and Remote Crypto Monitoring Systems (RCM). Total R&D on the balance sheet is modest at £9.0m in December 2013, although there is potential for this to rise in the mid-term with greater upfront development requirements on civil aerospace programmes such as fuel tank inerting (Comac) and electronic door controls (Airbus A350).
• While it is positive to see Ultra’s continued investment in product development, we suggest customer-funded R&D could come under pressure as governments rein in project spend and look to contractors for greater competiveness. As a proxy, the US Department of Defense (DoD) RDT&E (research, development, test and evaluation) budget has fallen by 22% since 2011, but for Ultra, government-funded R&D has so far held up around the £90m level (2011: £86m; 2012: £98m; 2013: £87m). If customer-funded R&D trends lower, then it is likely all manufacturers will be required to support a greater element of spend internally.
• Cost reduction and efficiencies to help the bottom line: In addition to organic growth, recent cost reduction initiatives should benefit earnings. Over 400 redundancies in 2013, predominantly in the tactical radios and Prologic secure communications businesses, will deliver an annualised benefit of £20m (£10m incremental in 2014). Other overhead reductions and efficiencies from several site consolidations should also be supportive of profits.
0%
1%
2%
3%
4%
5%
6%
7%
8%
0
10
20
30
40
50
60
70
80
2007 2008 2009 2010 2011 2012 2013 2014E
Co funded Capitalised Co funded/sales (rhs)
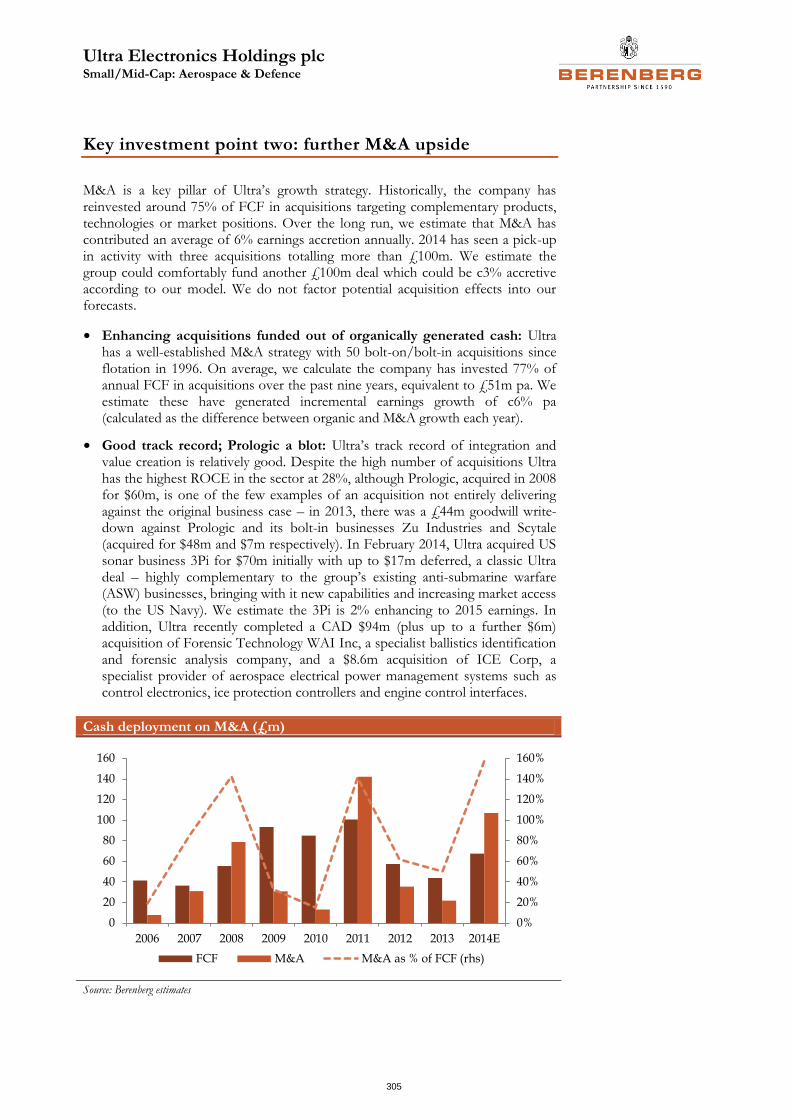
Ultra Electronics Holdings plc Small/Mid-Cap: Aerospace & Defence
305
Key investment point two: further M&A upside
M&A is a key pillar of Ultra’s growth strategy. Historically, the company has reinvested around 75% of FCF in acquisitions targeting complementary products, technologies or market positions. Over the long run, we estimate that M&A has contributed an average of 6% earnings accretion annually. 2014 has seen a pick-up in activity with three acquisitions totalling more than £100m. We estimate the group could comfortably fund another £100m deal which could be c3% accretive according to our model. We do not factor potential acquisition effects into our forecasts.
• Enhancing acquisitions funded out of organically generated cash: Ultra has a well-established M&A strategy with 50 bolt-on/bolt-in acquisitions since flotation in 1996. On average, we calculate the company has invested 77% of annual FCF in acquisitions over the past nine years, equivalent to £51m pa. We estimate these have generated incremental earnings growth of c6% pa (calculated as the difference between organic and M&A growth each year).
• Good track record; Prologic a blot: Ultra’s track record of integration and value creation is relatively good. Despite the high number of acquisitions Ultra has the highest ROCE in the sector at 28%, although Prologic, acquired in 2008 for $60m, is one of the few examples of an acquisition not entirely delivering against the original business case – in 2013, there was a £44m goodwill write-down against Prologic and its bolt-in businesses Zu Industries and Scytale (acquired for $48m and $7m respectively). In February 2014, Ultra acquired US sonar business 3Pi for $70m initially with up to $17m deferred, a classic Ultra deal – highly complementary to the group’s existing anti-submarine warfare (ASW) businesses, bringing with it new capabilities and increasing market access (to the US Navy). We estimate the 3Pi is 2% enhancing to 2015 earnings. In addition, Ultra recently completed a CAD $94m (plus up to a further $6m) acquisition of Forensic Technology WAI Inc, a specialist ballistics identification and forensic analysis company, and a $8.6m acquisition of ICE Corp, a specialist provider of aerospace electrical power management systems such as control electronics, ice protection controllers and engine control interfaces.
Cash deployment on M&A (£m)
Source: Berenberg estimates
0%
20%
40%
60%
80%
100%
120%
140%
160%
0
20
40
60
80
100
120
140
160
2006 2007 2008 2009 2010 2011 2012 2013 2014E
FCF M&A M&A as % of FCF (rhs)
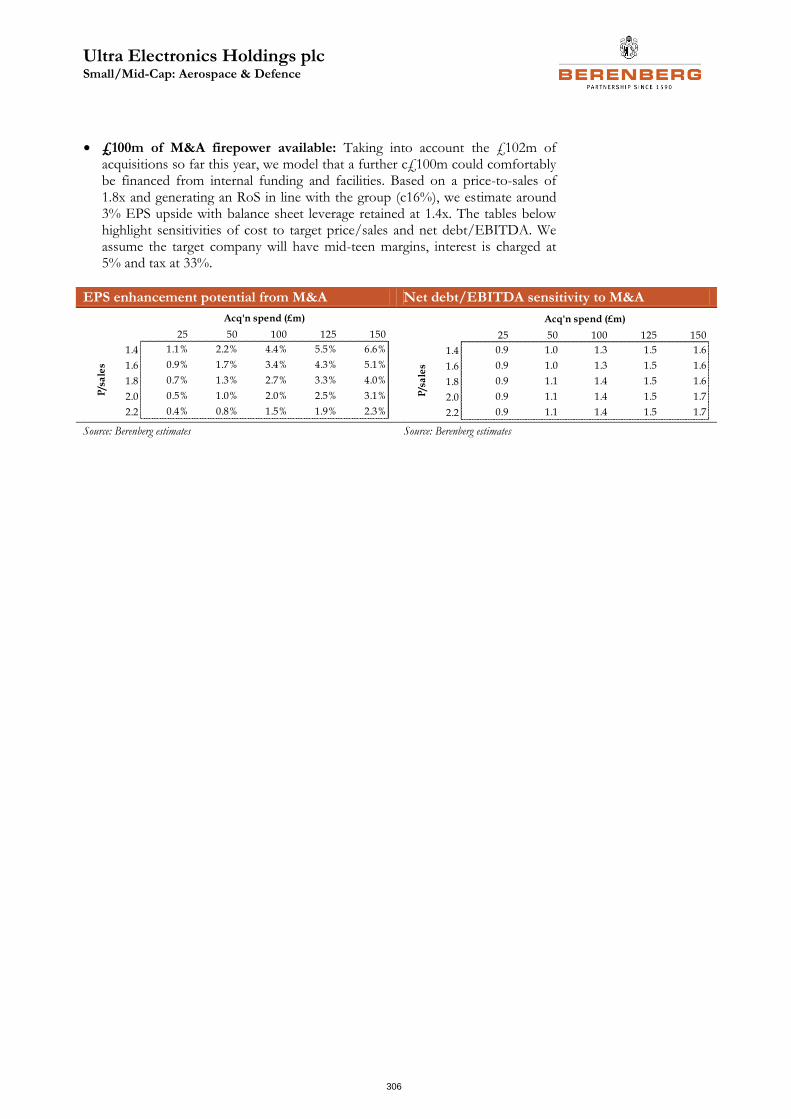
Ultra Electronics Holdings plc Small/Mid-Cap: Aerospace & Defence
306
• £100m of M&A firepower available: Taking into account the £102m of acquisitions so far this year, we model that a further c£100m could comfortably be financed from internal funding and facilities. Based on a price-to-sales of 1.8x and generating an RoS in line with the group (c16%), we estimate around 3% EPS upside with balance sheet leverage retained at 1.4x. The tables below highlight sensitivities of cost to target price/sales and net debt/EBITDA. We assume the target company will have mid-teen margins, interest is charged at 5% and tax at 33%.
EPS enhancement potential from M&A Net debt/EBITDA sensitivity to M&A
Source: Berenberg estimates Source: Berenberg estimates
3% 25 50 100 125 150
1.4 1.1% 2.2% 4.4% 5.5% 6.6%
1.6 0.9% 1.7% 3.4% 4.3% 5.1%
1.8 0.7% 1.3% 2.7% 3.3% 4.0%
2.0 0.5% 1.0% 2.0% 2.5% 3.1%
2.2 0.4% 0.8% 1.5% 1.9% 2.3%
Acq'n spend (£m)
P/s
ale
s
135% 25 50 100 125 150
1.4 0.9 1.0 1.3 1.5 1.6
1.6 0.9 1.0 1.3 1.5 1.6
1.8 0.9 1.1 1.4 1.5 1.6
2.0 0.9 1.1 1.4 1.5 1.7
2.2 0.9 1.1 1.4 1.5 1.7
Acq'n spend (£m)
P/s
ale
s
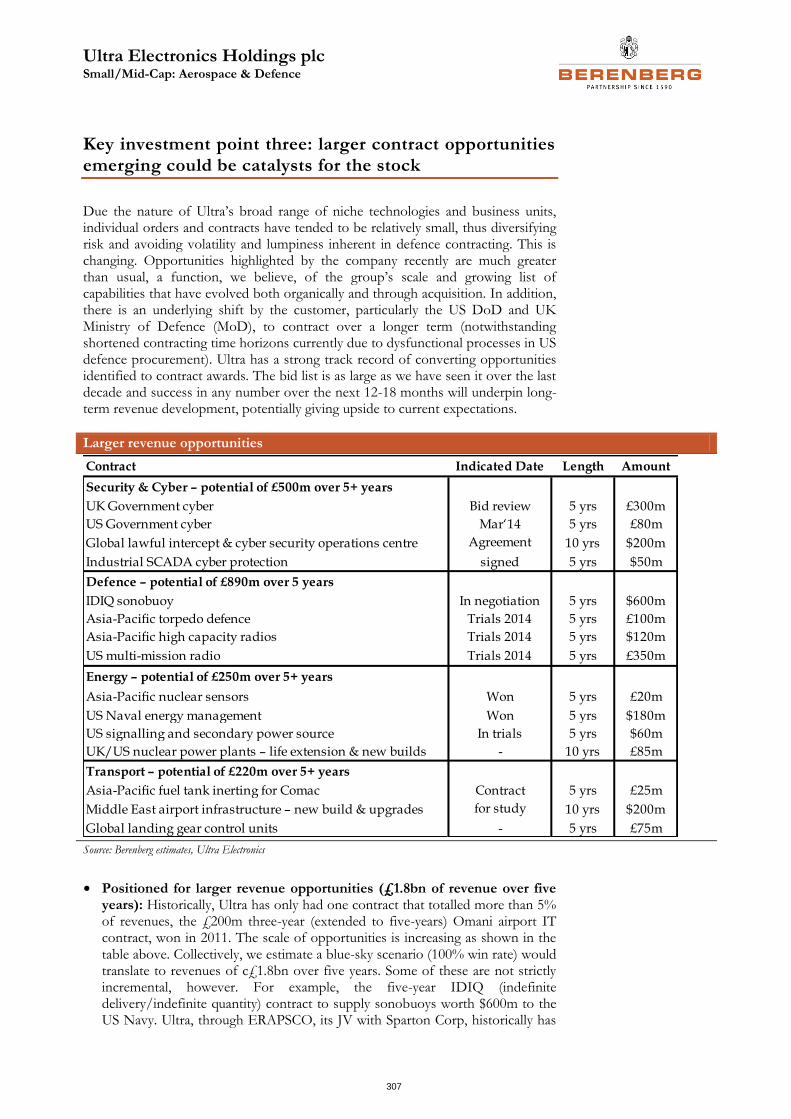
Ultra Electronics Holdings plc Small/Mid-Cap: Aerospace & Defence
307
Key investment point three: larger contract opportunities emerging could be catalysts for the stock
Due the nature of Ultra’s broad range of niche technologies and business units, individual orders and contracts have tended to be relatively small, thus diversifying risk and avoiding volatility and lumpiness inherent in defence contracting. This is changing. Opportunities highlighted by the company recently are much greater than usual, a function, we believe, of the group’s scale and growing list of capabilities that have evolved both organically and through acquisition. In addition, there is an underlying shift by the customer, particularly the US DoD and UK Ministry of Defence (MoD), to contract over a longer term (notwithstanding shortened contracting time horizons currently due to dysfunctional processes in US defence procurement). Ultra has a strong track record of converting opportunities identified to contract awards. The bid list is as large as we have seen it over the last decade and success in any number over the next 12-18 months will underpin long-term revenue development, potentially giving upside to current expectations.
Larger revenue opportunities
Source: Berenberg estimates, Ultra Electronics
• Positioned for larger revenue opportunities (£1.8bn of revenue over five years): Historically, Ultra has only had one contract that totalled more than 5% of revenues, the £200m three-year (extended to five-years) Omani airport IT contract, won in 2011. The scale of opportunities is increasing as shown in the table above. Collectively, we estimate a blue-sky scenario (100% win rate) would translate to revenues of c£1.8bn over five years. Some of these are not strictly incremental, however. For example, the five-year IDIQ (indefinite delivery/indefinite quantity) contract to supply sonobuoys worth $600m to the US Navy. Ultra, through ERAPSCO, its JV with Sparton Corp, historically has
Contract Indicated Date Length Amount
Security & Cyber – potential of £500m over 5+ years
UK Government cyber Bid review 5 yrs £300m
US Government cyber Mar‘14 5 yrs £80m
Global lawful intercept & cyber security operations centre Agreement 10 yrs $200m
Industrial SCADA cyber protection signed 5 yrs $50m
Defence – potential of £890m over 5 years
IDIQ sonobuoy In negotiation 5 yrs $600m
Asia-Pacific torpedo defence Trials 2014 5 yrs £100m
Asia-Pacific high capacity radios Trials 2014 5 yrs $120m
US multi-mission radio Trials 2014 5 yrs £350m
Energy – potential of £250m over 5+ years
Asia-Pacific nuclear sensors Won 5 yrs £20m
US Naval energy management Won 5 yrs $180m
US signalling and secondary power source In trials 5 yrs $60m
UK/US nuclear power plants – life extension & new builds - 10 yrs £85m
Transport – potential of £220m over 5+ years
Asia-Pacific fuel tank inerting for Comac Contract 5 yrs £25m
Middle East airport infrastructure – new build & upgrades for study 10 yrs $200m
Global landing gear control units - 5 yrs £75m
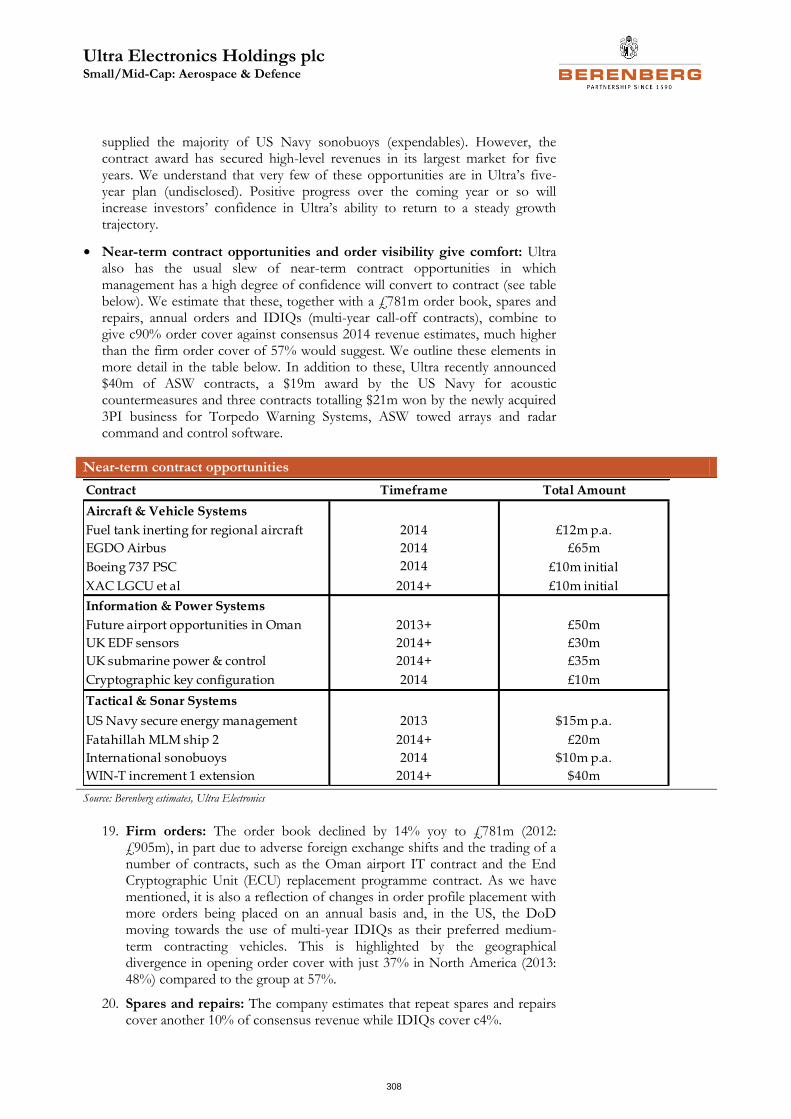
Ultra Electronics Holdings plc Small/Mid-Cap: Aerospace & Defence
308
supplied the majority of US Navy sonobuoys (expendables). However, the contract award has secured high-level revenues in its largest market for five years. We understand that very few of these opportunities are in Ultra’s five-year plan (undisclosed). Positive progress over the coming year or so will increase investors’ confidence in Ultra’s ability to return to a steady growth trajectory.
• Near-term contract opportunities and order visibility give comfort: Ultra also has the usual slew of near-term contract opportunities in which management has a high degree of confidence will convert to contract (see table below). We estimate that these, together with a £781m order book, spares and repairs, annual orders and IDIQs (multi-year call-off contracts), combine to give c90% order cover against consensus 2014 revenue estimates, much higher than the firm order cover of 57% would suggest. We outline these elements in more detail in the table below. In addition to these, Ultra recently announced $40m of ASW contracts, a $19m award by the US Navy for acoustic countermeasures and three contracts totalling $21m won by the newly acquired 3PI business for Torpedo Warning Systems, ASW towed arrays and radar command and control software.
Near-term contract opportunities
Source: Berenberg estimates, Ultra Electronics
19. Firm orders: The order book declined by 14% yoy to £781m (2012: £905m), in part due to adverse foreign exchange shifts and the trading of a number of contracts, such as the Oman airport IT contract and the End Cryptographic Unit (ECU) replacement programme contract. As we have mentioned, it is also a reflection of changes in order profile placement with more orders being placed on an annual basis and, in the US, the DoD moving towards the use of multi-year IDIQs as their preferred medium-term contracting vehicles. This is highlighted by the geographical divergence in opening order cover with just 37% in North America (2013: 48%) compared to the group at 57%.
20. Spares and repairs: The company estimates that repeat spares and repairs cover another 10% of consensus revenue while IDIQs cover c4%.
Contract Timeframe Total Amount
Aircraft & Vehicle Systems
Fuel tank inerting for regional aircraft 2014 £12m p.a.
EGDO Airbus 2014 £65m
Boeing 737 PSC 2014 £10m initial
XAC LGCU et al 2014+ £10m initial
Information & Power Systems
Future airport opportunities in Oman 2013+ £50m
UK EDF sensors 2014+ £30m
UK submarine power & control 2014+ £35m
Cryptographic key configuration 2014 £10m
Tactical & Sonar Systems
US Navy secure energy management 2013 $15m p.a.
Fatahillah MLM ship 2 2014+ £20m
International sonobuoys 2014 $10m p.a.
WIN-T increment 1 extension 2014+ $40m

Ultra Electronics Holdings plc Small/Mid-Cap: Aerospace & Defence
309
21. Annual orders: A number of important programmes are placed on an annual basis which the company estimates covers more than 20% of 2014 consensus revenue. Examples are cargo handling systems and noise cancellation systems for the A400M, airborne targeting pods for the Eurofighter Typhoon, and ice protection for F-35 JSF engine intake and B787 wings.
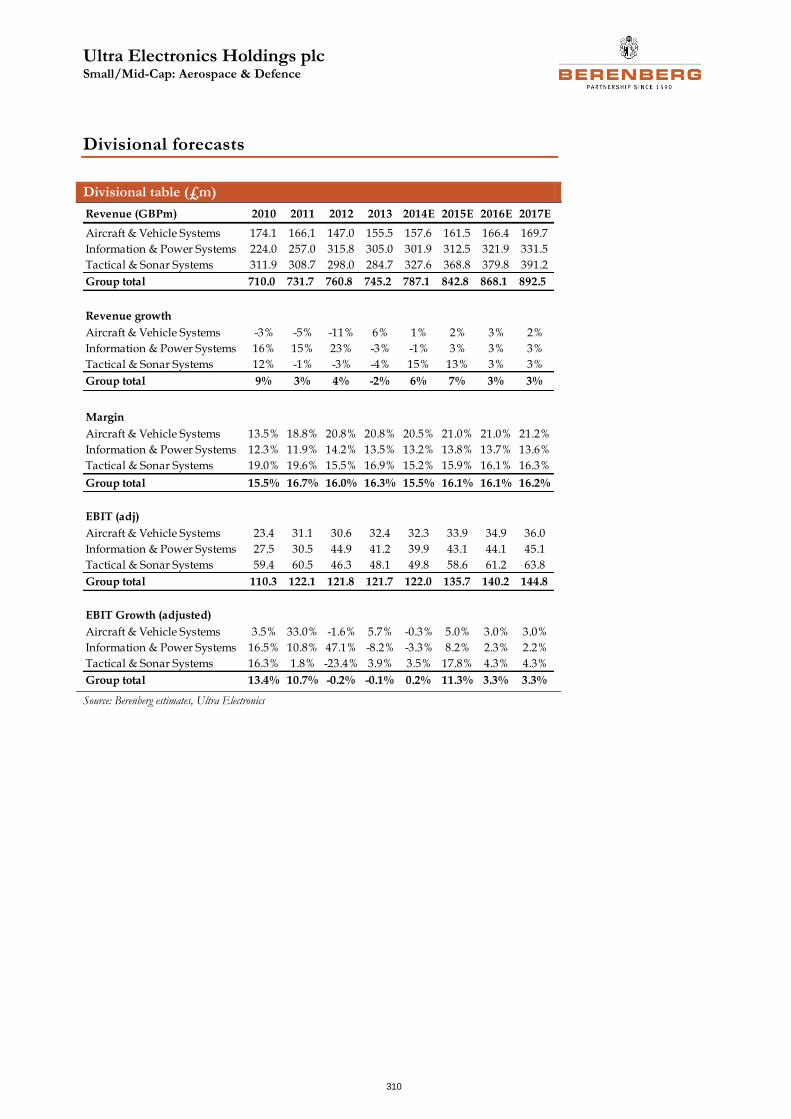
Ultra Electronics Holdings plc Small/Mid-Cap: Aerospace & Defence
310
Divisional forecasts
Divisional table (£m)
Source: Berenberg estimates, Ultra Electronics
Revenue (GBPm) 2010 2011 2012 2013 2014E 2015E 2016E 2017E
Aircraft & Vehicle Systems 174.1 166.1 147.0 155.5 157.6 161.5 166.4 169.7
Information & Power Systems 224.0 257.0 315.8 305.0 301.9 312.5 321.9 331.5
Tactical & Sonar Systems 311.9 308.7 298.0 284.7 327.6 368.8 379.8 391.2
Group total 710.0 731.7 760.8 745.2 787.1 842.8 868.1 892.5
Revenue growth
Aircraft & Vehicle Systems -3% -5% -11% 6% 1% 2% 3% 2%
Information & Power Systems 16% 15% 23% -3% -1% 3% 3% 3%
Tactical & Sonar Systems 12% -1% -3% -4% 15% 13% 3% 3%
Group total 9% 3% 4% -2% 6% 7% 3% 3%
Margin
Aircraft & Vehicle Systems 13.5% 18.8% 20.8% 20.8% 20.5% 21.0% 21.0% 21.2%
Information & Power Systems 12.3% 11.9% 14.2% 13.5% 13.2% 13.8% 13.7% 13.6%
Tactical & Sonar Systems 19.0% 19.6% 15.5% 16.9% 15.2% 15.9% 16.1% 16.3%
Group total 15.5% 16.7% 16.0% 16.3% 15.5% 16.1% 16.1% 16.2%
EBIT (adj)
Aircraft & Vehicle Systems 23.4 31.1 30.6 32.4 32.3 33.9 34.9 36.0
Information & Power Systems 27.5 30.5 44.9 41.2 39.9 43.1 44.1 45.1
Tactical & Sonar Systems 59.4 60.5 46.3 48.1 49.8 58.6 61.2 63.8
Group total 110.3 122.1 121.8 121.7 122.0 135.7 140.2 144.8
EBIT Growth (adjusted)
Aircraft & Vehicle Systems 3.5% 33.0% -1.6% 5.7% -0.3% 5.0% 3.0% 3.0%
Information & Power Systems 16.5% 10.8% 47.1% -8.2% -3.3% 8.2% 2.3% 2.2%
Tactical & Sonar Systems 16.3% 1.8% -23.4% 3.9% 3.5% 17.8% 4.3% 4.3%
Group total 13.4% 10.7% -0.2% -0.1% 0.2% 11.3% 3.3% 3.3%
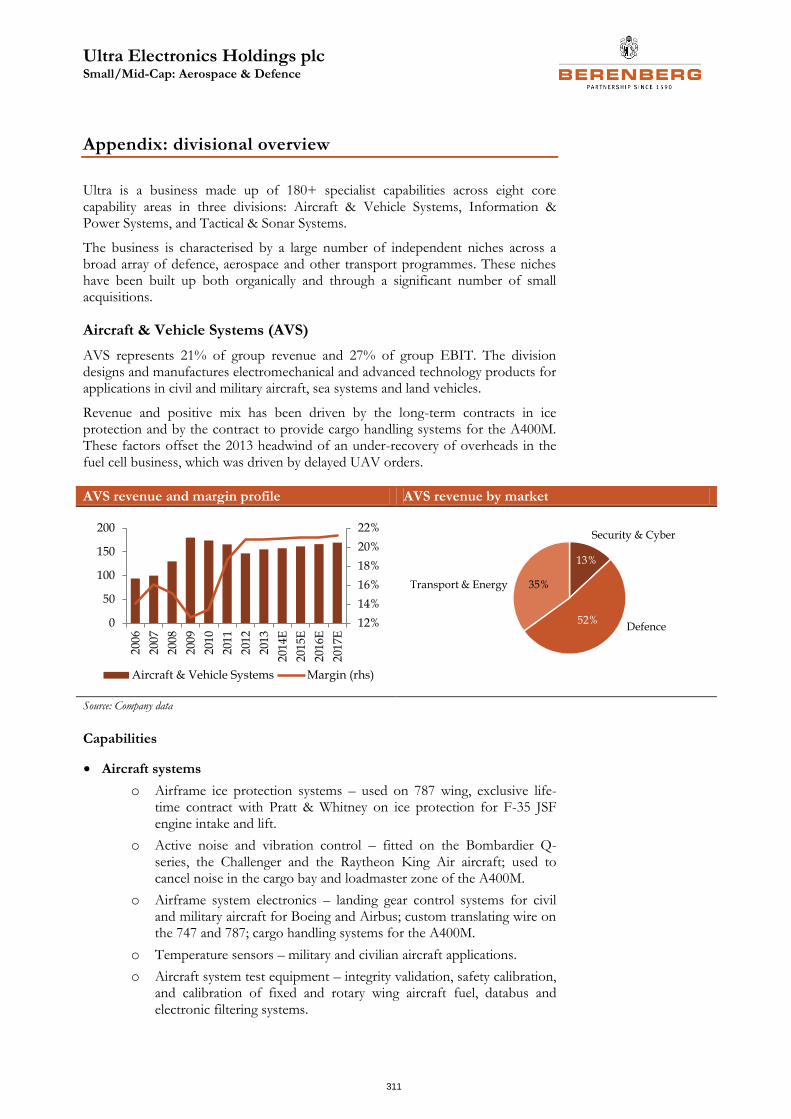
Ultra Electronics Holdings plc Small/Mid-Cap: Aerospace & Defence
311
Appendix: divisional overview
Ultra is a business made up of 180+ specialist capabilities across eight core capability areas in three divisions: Aircraft & Vehicle Systems, Information & Power Systems, and Tactical & Sonar Systems.
The business is characterised by a large number of independent niches across a broad array of defence, aerospace and other transport programmes. These niches have been built up both organically and through a significant number of small acquisitions.
Aircraft & Vehicle Systems (AVS)
AVS represents 21% of group revenue and 27% of group EBIT. The division designs and manufactures electromechanical and advanced technology products for applications in civil and military aircraft, sea systems and land vehicles.
Revenue and positive mix has been driven by the long-term contracts in ice protection and by the contract to provide cargo handling systems for the A400M. These factors offset the 2013 headwind of an under-recovery of overheads in the fuel cell business, which was driven by delayed UAV orders.
AVS revenue and margin profile AVS revenue by market
Source: Company data
Capabilities
• Aircraft systems
o Airframe ice protection systems – used on 787 wing, exclusive life-time contract with Pratt & Whitney on ice protection for F-35 JSF engine intake and lift.
o Active noise and vibration control – fitted on the Bombardier Q-series, the Challenger and the Raytheon King Air aircraft; used to cancel noise in the cargo bay and loadmaster zone of the A400M.
o Airframe system electronics – landing gear control systems for civil and military aircraft for Boeing and Airbus; custom translating wire on the 747 and 787; cargo handling systems for the A400M.
o Temperature sensors – military and civilian aircraft applications.
o Aircraft system test equipment – integrity validation, safety calibration, and calibration of fixed and rotary wing aircraft fuel, databus and electronic filtering systems.
12%
14%
16%
18%
20%
22%
0
50
100
150
200
200
6
200
7
200
8
200
9
201
0
201
1
201
2
201
3
201
4E
201
5E
201
6E
201
7E
Aircraft & Vehicle Systems Margin (rhs)
13%
52%
35%
Security & Cyber
Defence
Transport & Energy
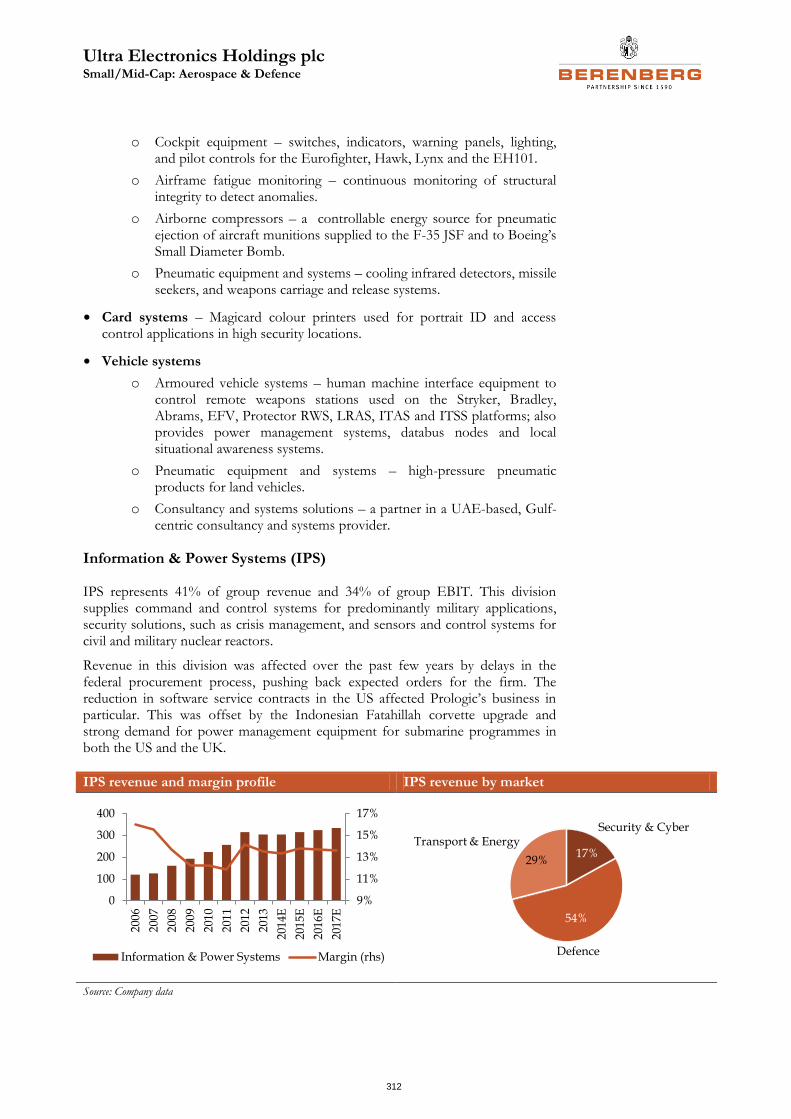
Ultra Electronics Holdings plc Small/Mid-Cap: Aerospace & Defence
312
o Cockpit equipment – switches, indicators, warning panels, lighting, and pilot controls for the Eurofighter, Hawk, Lynx and the EH101.
o Airframe fatigue monitoring – continuous monitoring of structural integrity to detect anomalies.
o Airborne compressors – a controllable energy source for pneumatic ejection of aircraft munitions supplied to the F-35 JSF and to Boeing’s Small Diameter Bomb.
o Pneumatic equipment and systems – cooling infrared detectors, missile seekers, and weapons carriage and release systems.
• Card systems – Magicard colour printers used for portrait ID and access control applications in high security locations.
• Vehicle systems
o Armoured vehicle systems – human machine interface equipment to control remote weapons stations used on the Stryker, Bradley, Abrams, EFV, Protector RWS, LRAS, ITAS and ITSS platforms; also provides power management systems, databus nodes and local situational awareness systems.
o Pneumatic equipment and systems – high-pressure pneumatic products for land vehicles.
o Consultancy and systems solutions – a partner in a UAE-based, Gulf-centric consultancy and systems provider.
Information & Power Systems (IPS)
IPS represents 41% of group revenue and 34% of group EBIT. This division supplies command and control systems for predominantly military applications, security solutions, such as crisis management, and sensors and control systems for civil and military nuclear reactors.
Revenue in this division was affected over the past few years by delays in the federal procurement process, pushing back expected orders for the firm. The reduction in software service contracts in the US affected Prologic’s business in particular. This was offset by the Indonesian Fatahillah corvette upgrade and strong demand for power management equipment for submarine programmes in both the US and the UK.
IPS revenue and margin profile IPS revenue by market
Source: Company data
9%
11%
13%
15%
17%
0
100
200
300
400
200
6
200
7
200
8
2009
201
0
201
1
201
2
201
3
2014
E
201
5E
201
6E
201
7E
Information & Power Systems Margin (rhs)
17%
54%
29%
Security & Cyber
Defence
Transport & Energy
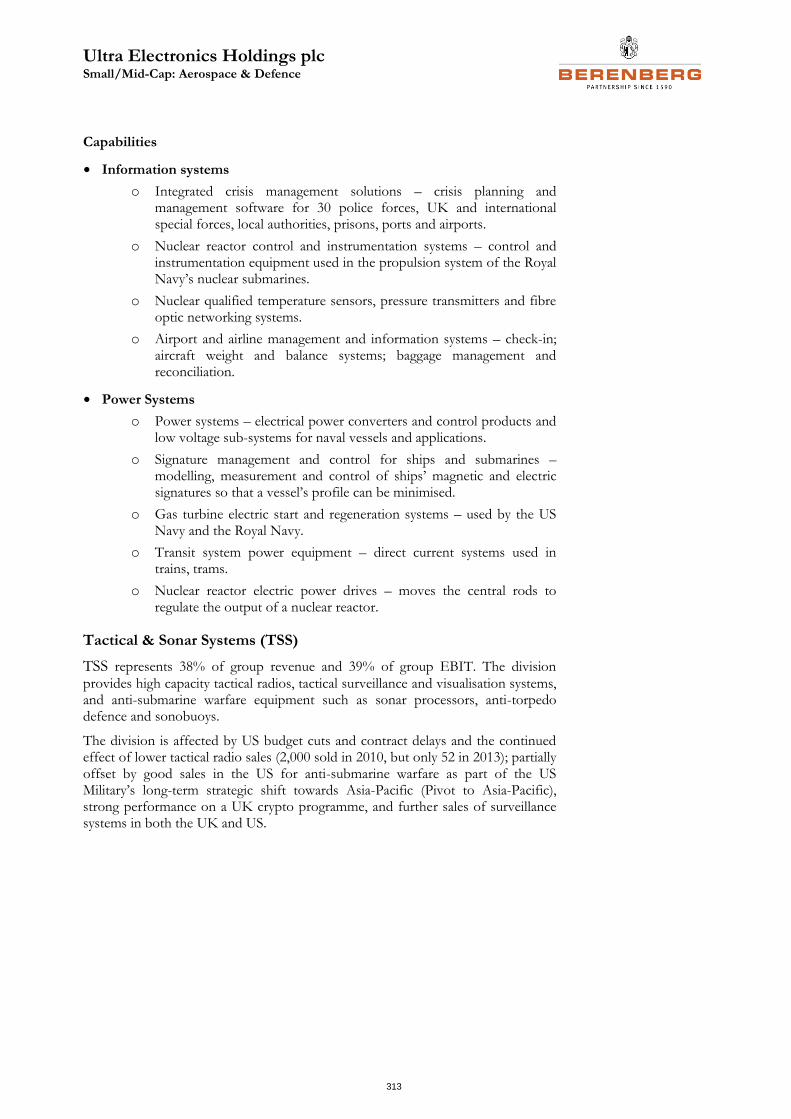
Ultra Electronics Holdings plc Small/Mid-Cap: Aerospace & Defence
313
Capabilities
• Information systems
o Integrated crisis management solutions – crisis planning and management software for 30 police forces, UK and international special forces, local authorities, prisons, ports and airports.
o Nuclear reactor control and instrumentation systems – control and instrumentation equipment used in the propulsion system of the Royal Navy’s nuclear submarines.
o Nuclear qualified temperature sensors, pressure transmitters and fibre optic networking systems.
o Airport and airline management and information systems – check-in; aircraft weight and balance systems; baggage management and reconciliation.
• Power Systems
o Power systems – electrical power converters and control products and low voltage sub-systems for naval vessels and applications.
o Signature management and control for ships and submarines – modelling, measurement and control of ships’ magnetic and electric signatures so that a vessel’s profile can be minimised.
o Gas turbine electric start and regeneration systems – used by the US Navy and the Royal Navy.
o Transit system power equipment – direct current systems used in trains, trams.
o Nuclear reactor electric power drives – moves the central rods to regulate the output of a nuclear reactor.
Tactical & Sonar Systems (TSS)
TSS represents 38% of group revenue and 39% of group EBIT. The division
provides high capacity tactical radios, tactical surveillance and visualisation systems, and anti-submarine warfare equipment such as sonar processors, anti-torpedo defence and sonobuoys.
The division is affected by US budget cuts and contract delays and the continued effect of lower tactical radio sales (2,000 sold in 2010, but only 52 in 2013); partially offset by good sales in the US for anti-submarine warfare as part of the US Military’s long-term strategic shift towards Asia-Pacific (Pivot to Asia-Pacific), strong performance on a UK crypto programme, and further sales of surveillance systems in both the UK and US.
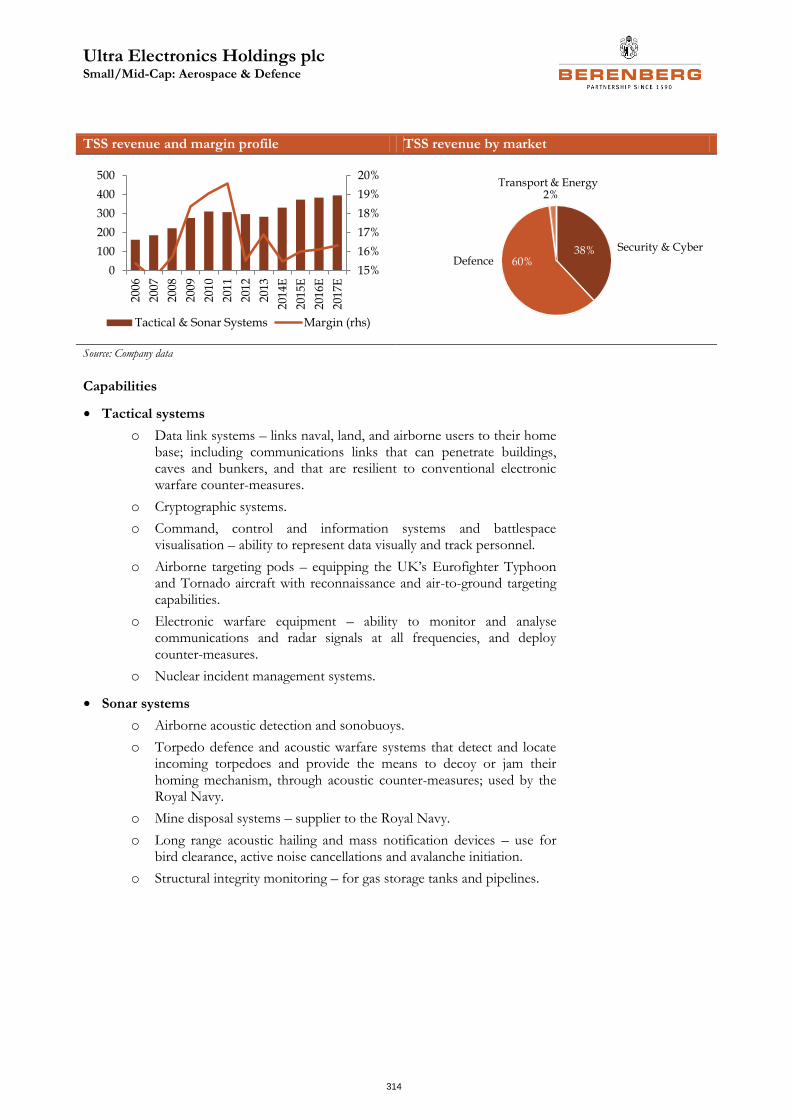
Ultra Electronics Holdings plc Small/Mid-Cap: Aerospace & Defence
314
TSS revenue and margin profile TSS revenue by market
Source: Company data
Capabilities
• Tactical systems
o Data link systems – links naval, land, and airborne users to their home base; including communications links that can penetrate buildings, caves and bunkers, and that are resilient to conventional electronic warfare counter-measures.
o Cryptographic systems.
o Command, control and information systems and battlespace visualisation – ability to represent data visually and track personnel.
o Airborne targeting pods – equipping the UK’s Eurofighter Typhoon and Tornado aircraft with reconnaissance and air-to-ground targeting capabilities.
o Electronic warfare equipment – ability to monitor and analyse communications and radar signals at all frequencies, and deploy counter-measures.
o Nuclear incident management systems.
• Sonar systems
o Airborne acoustic detection and sonobuoys.
o Torpedo defence and acoustic warfare systems that detect and locate incoming torpedoes and provide the means to decoy or jam their homing mechanism, through acoustic counter-measures; used by the Royal Navy.
o Mine disposal systems – supplier to the Royal Navy.
o Long range acoustic hailing and mass notification devices – use for bird clearance, active noise cancellations and avalanche initiation.
o Structural integrity monitoring – for gas storage tanks and pipelines.
15%
16%
17%
18%
19%
20%
0
100
200
300
400
500
2006
2007
2008
2009
201
0
201
1
201
2
201
3
201
4E
201
5E
201
6E
201
7ETactical & Sonar Systems Margin (rhs)
38%60%
2%
Security & CyberDefence
Transport & Energy
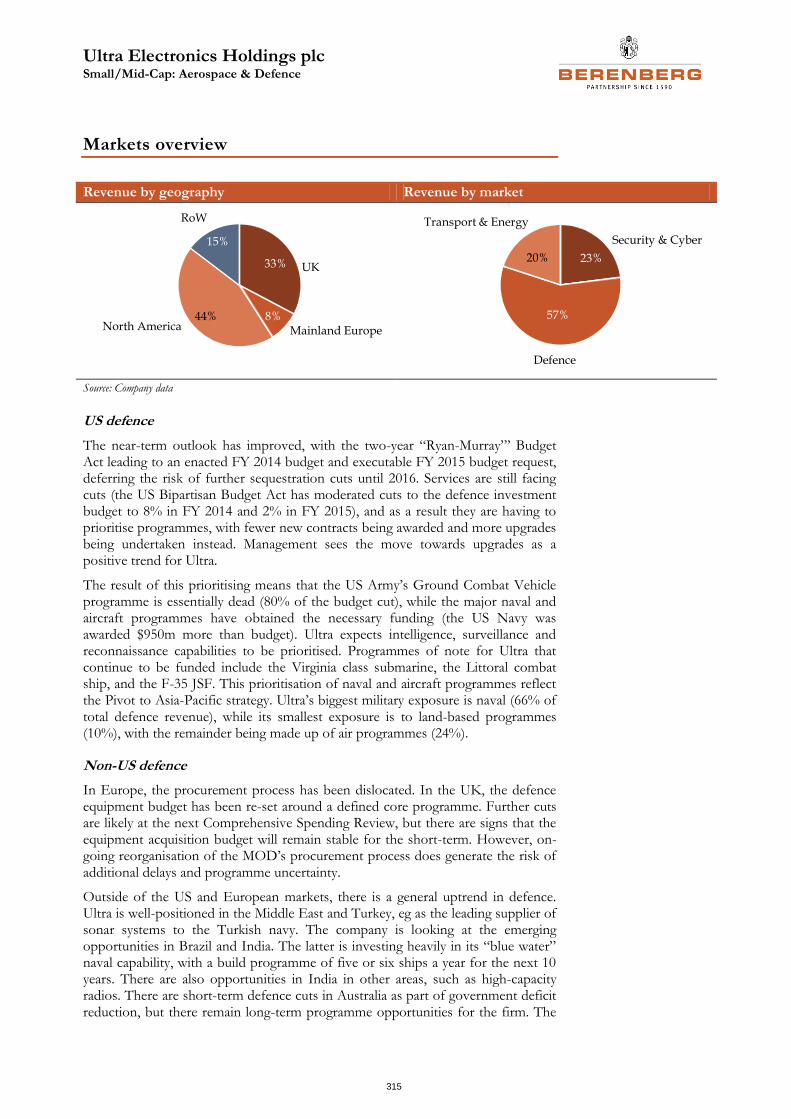
Ultra Electronics Holdings plc Small/Mid-Cap: Aerospace & Defence
315
Markets overview
Revenue by geography Revenue by market
Source: Company data
US defence
The near-term outlook has improved, with the two-year “Ryan-Murray”’ Budget Act leading to an enacted FY 2014 budget and executable FY 2015 budget request, deferring the risk of further sequestration cuts until 2016. Services are still facing cuts (the US Bipartisan Budget Act has moderated cuts to the defence investment budget to 8% in FY 2014 and 2% in FY 2015), and as a result they are having to prioritise programmes, with fewer new contracts being awarded and more upgrades being undertaken instead. Management sees the move towards upgrades as a positive trend for Ultra.
The result of this prioritising means that the US Army’s Ground Combat Vehicle programme is essentially dead (80% of the budget cut), while the major naval and aircraft programmes have obtained the necessary funding (the US Navy was awarded $950m more than budget). Ultra expects intelligence, surveillance and reconnaissance capabilities to be prioritised. Programmes of note for Ultra that continue to be funded include the Virginia class submarine, the Littoral combat ship, and the F-35 JSF. This prioritisation of naval and aircraft programmes reflect the Pivot to Asia-Pacific strategy. Ultra’s biggest military exposure is naval (66% of total defence revenue), while its smallest exposure is to land-based programmes (10%), with the remainder being made up of air programmes (24%).
Non-US defence
In Europe, the procurement process has been dislocated. In the UK, the defence equipment budget has been re-set around a defined core programme. Further cuts are likely at the next Comprehensive Spending Review, but there are signs that the equipment acquisition budget will remain stable for the short-term. However, on-going reorganisation of the MOD’s procurement process does generate the risk of additional delays and programme uncertainty.
Outside of the US and European markets, there is a general uptrend in defence. Ultra is well-positioned in the Middle East and Turkey, eg as the leading supplier of sonar systems to the Turkish navy. The company is looking at the emerging opportunities in Brazil and India. The latter is investing heavily in its “blue water” naval capability, with a build programme of five or six ships a year for the next 10 years. There are also opportunities in India in other areas, such as high-capacity radios. There are short-term defence cuts in Australia as part of government deficit reduction, but there remain long-term programme opportunities for the firm. The
33%
8%44%
15%
UK
Mainland EuropeNorth America
RoW
23%
57%
20%
Security & Cyber
Defence
Transport & Energy
Ultra Electronics Holdings plc Small/Mid-Cap: Aerospace & Defence
316
government has committed to return defence spending back to 2% of GDP within a decade.
Transport
Ultra is positioned to take advantage of secular trends in civil aviation, through long-term positions in OEM, spares and overhaul that will last 20-25 years. Infrastructure spending in passenger transport systems in both the developed and developing world is strong. Ultra should benefit from these opportunities, with the group’s role as master systems integrator for the Muscat and Salalah airports in Oman establishing its capabilities in the airport infrastructure market, although this contract has been delayed, resulting in revenue deferred until 2016.
Rail infrastructure spending is another growth area, driven by Crossrail and the possibility of HS2 in the UK as well as a strong export market. Ultra is positioned to take advantage through its established specialist trackside power capability. As a result, the £40m revenue derived from transport will double in five years, even if no new orders are secured.
Energy
In the US, the government has approved four new-build Westinghouse reactors, which will all use Ultra’s specialist sensors. The group has continuing involvement in China’s civil nuclear reactor build programme. Elsewhere, there is an emphasis on nuclear plant life extension programmes, which management claims is positive for the group’s safety systems and sensors capabilities.
Security and cyber
Security budgets are growing in the face of terrorism, organised crime, drug trafficking and other cyber threats. However, the legal intercept market has been affected by the Snowden Affair; as a result, Ultra is repositioning itself towards anti-narcotics, especially in Latin America.
There is also a worldwide concern about the security of energy, particularly from cyber attack. Energy firms have recently been refused insurance cover against cyber attacks because their defences are too weak. Ultra claims to have ready-made technology that resolves these problems.
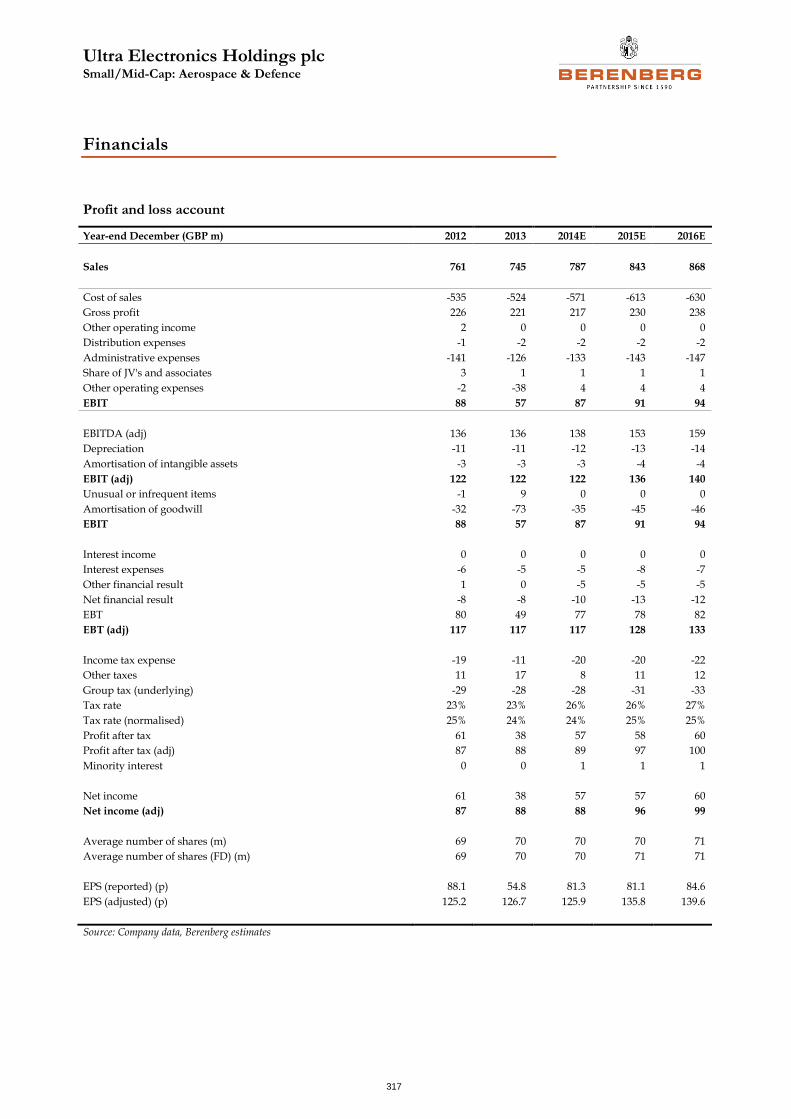
Ultra Electronics Holdings plc Small/Mid-Cap: Aerospace & Defence
317
Financials
Profit and loss account
Year-end December (GBP m) 2012 2013 2014E 2015E 2016E
Sales 761 745 787 843 868
Cost of sales -535 -524 -571 -613 -630
Gross profit 226 221 217 230 238
Other operating income 2 0 0 0 0
Distribution expenses -1 -2 -2 -2 -2
Administrative expenses -141 -126 -133 -143 -147
Share of JV's and associates 3 1 1 1 1
Other operating expenses -2 -38 4 4 4
EBIT 88 57 87 91 94
EBITDA (adj) 136 136 138 153 159
Depreciation -11 -11 -12 -13 -14
Amortisation of intangible assets -3 -3 -3 -4 -4
EBIT (adj) 122 122 122 136 140
Unusual or infrequent items -1 9 0 0 0
Amortisation of goodwill -32 -73 -35 -45 -46
EBIT 88 57 87 91 94
Interest income 0 0 0 0 0
Interest expenses -6 -5 -5 -8 -7
Other financial result 1 0 -5 -5 -5
Net financial result -8 -8 -10 -13 -12
EBT 80 49 77 78 82
EBT (adj) 117 117 117 128 133
Income tax expense -19 -11 -20 -20 -22
Other taxes 11 17 8 11 12
Group tax (underlying) -29 -28 -28 -31 -33
Tax rate 23% 23% 26% 26% 27%
Tax rate (normalised) 25% 24% 24% 25% 25%
Profit after tax 61 38 57 58 60
Profit after tax (adj) 87 88 89 97 100
Minority interest 0 0 1 1 1
Net income 61 38 57 57 60
Net income (adj) 87 88 88 96 99
Average number of shares (m) 69 70 70 70 71
Average number of shares (FD) (m) 69 70 70 71 71
EPS (reported) (p) 88.1 54.8 81.3 81.1 84.6
EPS (adjusted) (p) 125.2 126.7 125.9 135.8 139.6
Source: Company data, Berenberg estimates
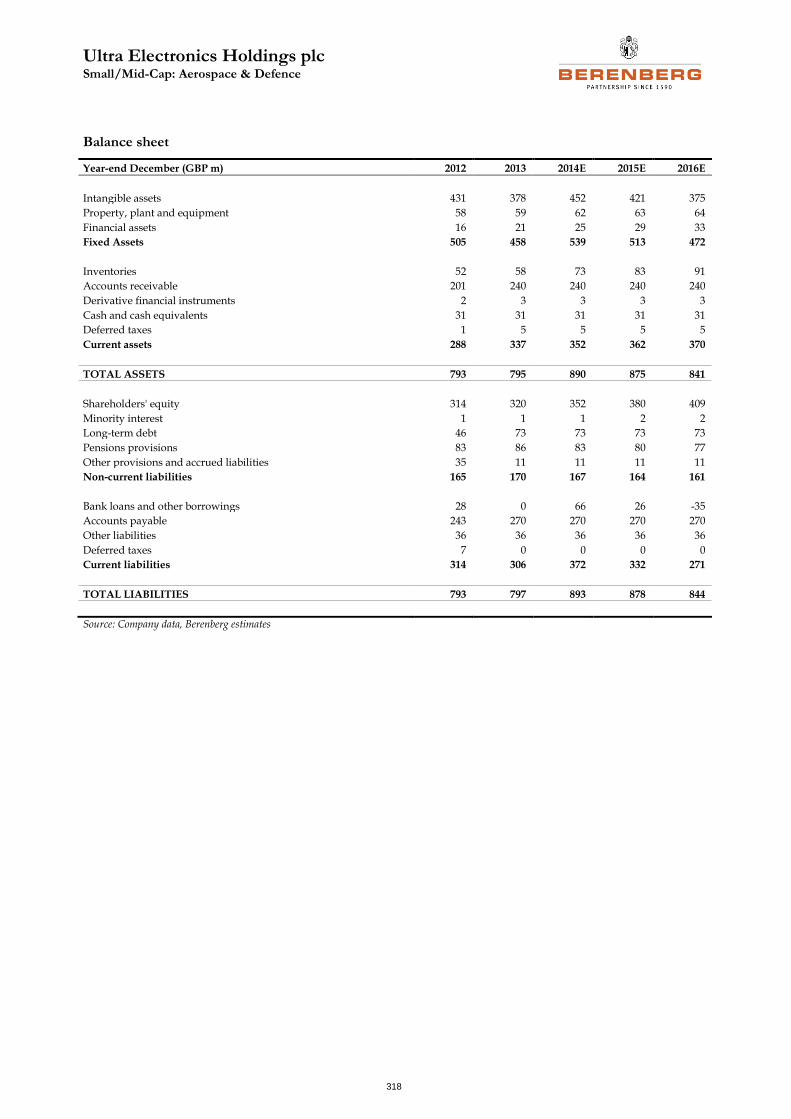
Ultra Electronics Holdings plc Small/Mid-Cap: Aerospace & Defence
318
Balance sheet
Year-end December (GBP m) 2012 2013 2014E 2015E 2016E
Intangible assets 431 378 452 421 375
Property, plant and equipment 58 59 62 63 64
Financial assets 16 21 25 29 33
Fixed Assets 505 458 539 513 472
Inventories 52 58 73 83 91
Accounts receivable 201 240 240 240 240
Derivative financial instruments 2 3 3 3 3
Cash and cash equivalents 31 31 31 31 31
Deferred taxes 1 5 5 5 5
Current assets 288 337 352 362 370
TOTAL ASSETS 793 795 890 875 841
Shareholders' equity 314 320 352 380 409
Minority interest 1 1 1 2 2
Long-term debt 46 73 73 73 73
Pensions provisions 83 86 83 80 77
Other provisions and accrued liabilities 35 11 11 11 11
Non-current liabilities 165 170 167 164 161
Bank loans and other borrowings 28 0 66 26 -35
Accounts payable 243 270 270 270 270
Other liabilities 36 36 36 36 36
Deferred taxes 7 0 0 0 0
Current liabilities 314 306 372 332 271
TOTAL LIABILITIES 793 797 893 878 844
Source: Company data, Berenberg estimates
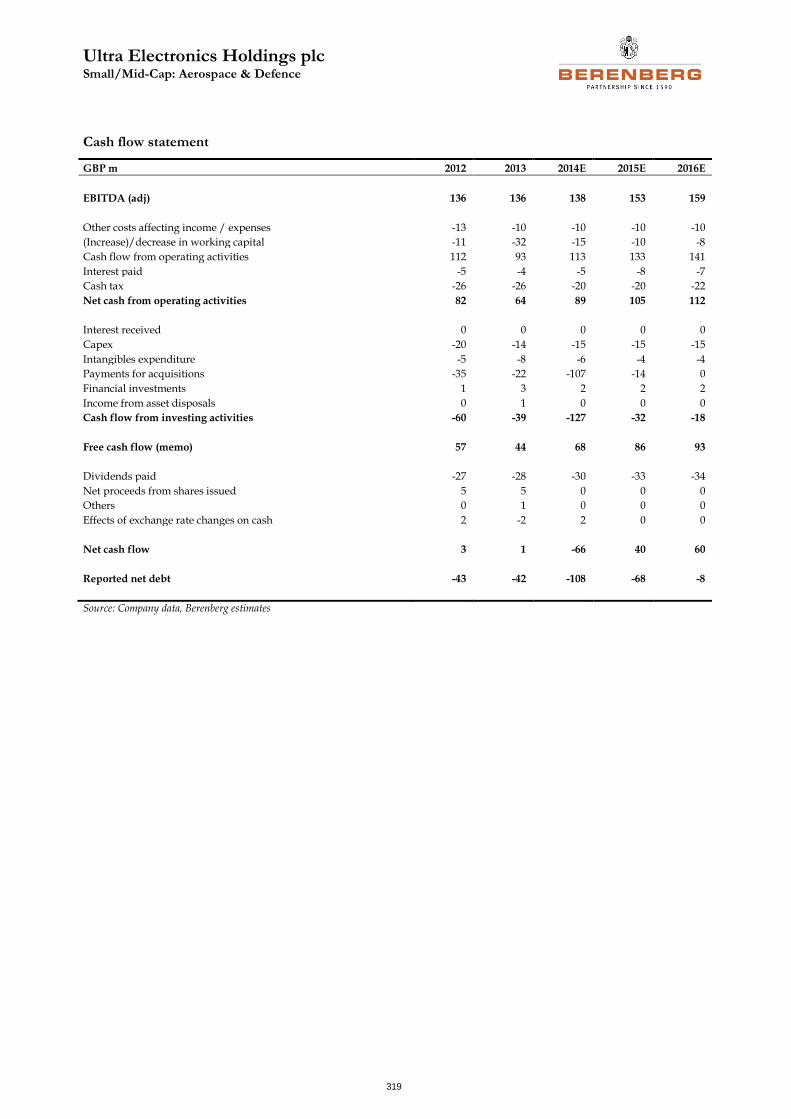
Ultra Electronics Holdings plc Small/Mid-Cap: Aerospace & Defence
319
Cash flow statement
GBP m 2012 2013 2014E 2015E 2016E
EBITDA (adj) 136 136 138 153 159
Other costs affecting income / expenses -13 -10 -10 -10 -10
(Increase)/decrease in working capital -11 -32 -15 -10 -8
Cash flow from operating activities 112 93 113 133 141
Interest paid -5 -4 -5 -8 -7
Cash tax -26 -26 -20 -20 -22
Net cash from operating activities 82 64 89 105 112
Interest received 0 0 0 0 0
Capex -20 -14 -15 -15 -15
Intangibles expenditure -5 -8 -6 -4 -4
Payments for acquisitions -35 -22 -107 -14 0
Financial investments 1 3 2 2 2
Income from asset disposals 0 1 0 0 0
Cash flow from investing activities -60 -39 -127 -32 -18
Free cash flow (memo) 57 44 68 86 93
Dividends paid -27 -28 -30 -33 -34
Net proceeds from shares issued 5 5 0 0 0
Others 0 1 0 0 0
Effects of exchange rate changes on cash 2 -2 2 0 0
Net cash flow 3 1 -66 40 60
Reported net debt -43 -42 -108 -68 -8
Source: Company data, Berenberg estimates
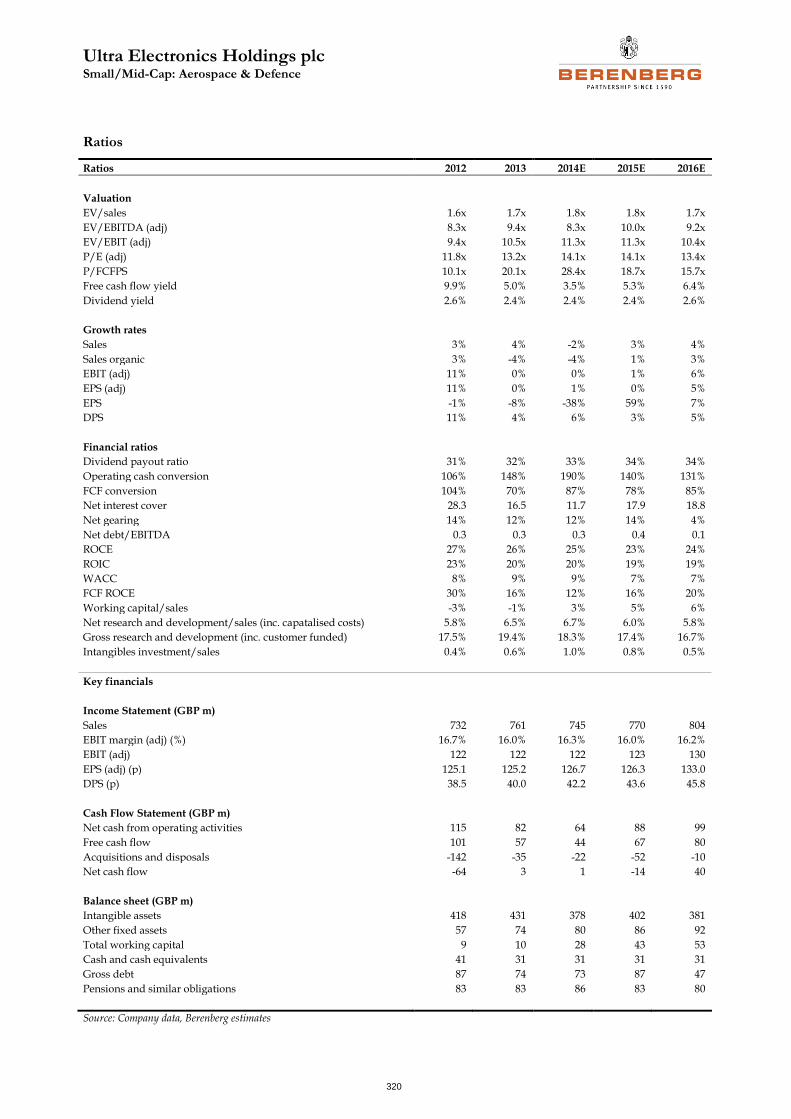
Ultra Electronics Holdings plc Small/Mid-Cap: Aerospace & Defence
320
Ratios
Ratios 2012 2013 2014E 2015E 2016E
Valuation
EV/sales 1.6x 1.7x 1.8x 1.8x 1.7x
EV/EBITDA (adj) 8.3x 9.4x 8.3x 10.0x 9.2x
EV/EBIT (adj) 9.4x 10.5x 11.3x 11.3x 10.4x
P/E (adj) 11.8x 13.2x 14.1x 14.1x 13.4x
P/FCFPS 10.1x 20.1x 28.4x 18.7x 15.7x
Free cash flow yield 9.9% 5.0% 3.5% 5.3% 6.4%
Dividend yield 2.6% 2.4% 2.4% 2.4% 2.6%
Growth rates
Sales 3% 4% -2% 3% 4%
Sales organic 3% -4% -4% 1% 3%
EBIT (adj) 11% 0% 0% 1% 6%
EPS (adj) 11% 0% 1% 0% 5%
EPS -1% -8% -38% 59% 7%
DPS 11% 4% 6% 3% 5%
Financial ratios
Dividend payout ratio 31% 32% 33% 34% 34%
Operating cash conversion 106% 148% 190% 140% 131%
FCF conversion 104% 70% 87% 78% 85%
Net interest cover 28.3 16.5 11.7 17.9 18.8
Net gearing 14% 12% 12% 14% 4%
Net debt/EBITDA 0.3 0.3 0.3 0.4 0.1
ROCE 27% 26% 25% 23% 24%
ROIC 23% 20% 20% 19% 19%
WACC 8% 9% 9% 7% 7%
FCF ROCE 30% 16% 12% 16% 20%
Working capital/sales -3% -1% 3% 5% 6%
Net research and development/sales (inc. capatalised costs) 5.8% 6.5% 6.7% 6.0% 5.8%
Gross research and development (inc. customer funded) 17.5% 19.4% 18.3% 17.4% 16.7%
Intangibles investment/sales 0.4% 0.6% 1.0% 0.8% 0.5%
Key financials
Income Statement (GBP m)
Sales 732 761 745 770 804
EBIT margin (adj) (%) 16.7% 16.0% 16.3% 16.0% 16.2%
EBIT (adj) 122 122 122 123 130
EPS (adj) (p) 125.1 125.2 126.7 126.3 133.0
DPS (p) 38.5 40.0 42.2 43.6 45.8
Cash Flow Statement (GBP m)
Net cash from operating activities 115 82 64 88 99
Free cash flow 101 57 44 67 80
Acquisitions and disposals -142 -35 -22 -52 -10
Net cash flow -64 3 1 -14 40
Balance sheet (GBP m)
Intangible assets 418 431 378 402 381
Other fixed assets 57 74 80 86 92
Total working capital 9 10 28 43 53
Cash and cash equivalents 41 31 31 31 31
Gross debt 87 74 73 87 47
Pensions and similar obligations 83 83 86 83 80
Source: Company data, Berenberg estimates
Aerospace & Defence
321
Contacts: Investment Banking
EQUITY RESEARCH E-mail: [email protected]; Internet www.berenberg.com
AEROSPACE & DEFENCE FOOD MANUFACTURING MID CAP GENERAL
Andrew Gollan +44 20 3207 7891 Fintan Ryan +44 20 3465 2748 Robert Chantry +44 20 3207 7861
James Targett +44 20 3207 7873 Gunnar Cohrs +44 20 3207 7894
AUTOMOTIVES Sam England +44 20 3465 2687
Henning Cosman +44 20 3465 2635 FOOD RETAIL Benjamin May +44 20 3465 2667
Adam Hull +44 20 3465 2749 Andrew Steele +44 20 3207 7926 Virginia Nordback +44 20 3465 2693
Paul Kratz +44 20 3465 2678 Anna Patrice +44 20 3207 7863
GENERAL RETAIL & LUXURY GOODS Simona Sarli +44 20 3207 7834
BANKS Bassel Choughari +44 20 3465 2675 Stanislaus von Thurn und Taxis +44 20 3465 2631
Nick Anderson +44 20 3207 7838 John Guy +44 20 3465 2674
James Chappell +44 20 3207 7844 Bethany Hocking +44 20 3207 7925 OIL & GAS
Andrew Lowe +44 20 3465 2743 Zuzanna Pusz +44 20 3207 7812 Asad Farid +44 20 3207 7932
Eoin Mullany +44 20 3207 7854 Jaideep Pandya +44 20 3207 7890
Eleni Papoula +44 20 3465 2741 HEALTHCARE
Michelle Wilson +44 20 3465 2663 Scott Bardo +44 20 3207 7869 REAL ESTATE
Ana Caludi Muldoon +44 20 3207 7841 Kai Klose +44 20 3207 7888
BUSINESS SERVICES, LEISURE & TRANSPORT Alistair Campbell +44 20 3207 7876 Estelle Weingrod +44 20 3207 7931
Najet El Kassir +44 20 3207 7836 Charles Cooper +44 20 3465 2637
Stuart Gordon +44 20 3207 7858 Graham Doyle +44 20 3465 2634 TECHNOLOGY
Simon Mezzanotte +44 20 3207 7917 Tom Jones +44 20 3207 7877 Adnaan Ahmad +44 20 3207 7851
Matthew O'Keeffe +44 20 3207 7895 Louise Pearson +44 20 3465 2747 Daud Khan +44 20 3465 2638
Josh Puddle +44 20 3207 7881 Ali Farid Khwaja +44 20 3207 7852
Arash Roshan Zamir +44 20 3465 2636 HOUSEHOLD & PERSONAL CARE Gal Munda +44 20 3465 2746
Bassel Choughari +44 20 3465 2675 Tammy Qiu +44 20 3465 2673
CAPITAL GOODS James Targett +44 20 3207 7873
Benjamin Glaeser +44 20 3207 7918 TELECOMMUNICATIONS
Margaret Paxton +44 20 3207 7934 INSURANCE Wassil El Hebil +44 20 3207 7862
Alexander Virgo +44 20 3207 7856 Tom Carstairs +44 20 3207 7823 Usman Ghazi +44 20 3207 7824
Felix Wienen +44 20 3207 7915 Peter Eliot +44 20 3207 7880 Siyi He +44 20 3465 2697
Kai Mueller +44 20 3465 2681 Laura Janssens +44 20 3465 2639
CHEMICALS Matthew Preston +44 20 3207 7913 Paul Marsch +44 20 3207 7857
John Klein +44 20 3207 7930 Sami Taipalus +44 20 3207 7866 Barry Zeitoune +44 20 3207 7859
Evgenia Molotova +44 20 3465 2664
Jaideep Pandya +44 20 3207 7890 MEDIA TOBACCO
Robert Berg +44 20 3465 2680 Erik Bloomquist +44 20 3207 7870
CONSTRUCTION Emma Coulby +44 20 3207 7821 Kate Kalashnikova +44 20 3465 2665
Chris Moore +44 20 3465 2737 Laura Janssens +44 20 3465 2639
Robert Muir +44 20 3207 7860 Sarah Simon +44 20 3207 7830 UTILITIES
Michael Watts +44 20 3207 7928 Andrew Fisher +44 20 3207 7937
METALS Mehul Mahatma +44 20 3465 2698
DIVERSIFIED FINANCIALS Bjoern Lippe +44 20 3207 7845 Oliver Salvesen +44 20 3207 7818
Pras Jeyanandhan +44 20 3207 7899 Lawson Steele +44 20 3207 7887
Martin Price +44 20 3207 7892
Ben Slingsby +44 20 3465 2626
ECONOMICS
Holger Schmieding +44 20 3207 7889 Christian Schulz +44 20 3207 7878 Robert Wood +44 20 3207 7822
EQUITY SALES E-mail: [email protected]; Internet www.berenberg.com
SPECIALIST SALES SALES SALES
BANKS & DIVERSIFIED FINANCIALS LONDON ZURICH
Iro Papadopoulou +44 20 3207 7924 John von Berenberg-Consbruch +44 20 3207 7805 Andrea Ferrari +41 44 283 2020
Toby Flaux +44 20 3465 2745 Stephan Hofer +41 44 283 2029
CONSUMER Karl Hancock +44 20 3207 7803 Carsten Kinder +41 44 283 2024
Rupert Trotter +44 20 3207 7815 Sean Heath +44 20 3465 2742 Gianni Lavigna +41 44 283 2038
James Hipkiss +44 20 3465 2620 James Nettleton +41 44 283 2026
HEALTHCARE David Hogg +44 20 3465 2628 Benjamin Stillfried +41 44 283 2033
Frazer Hall +44 20 3207 7875 Zubin Hubner +44 20 3207 7885
Ben Hutton +44 20 3207 7804 SALES TRADING
INDUSTRIALS James Matthews +44 20 3207 7807 HAMBURG
Chris Armstrong +44 20 3207 7809 David Mortlock +44 20 3207 7850 Paul Dontenwill +49 40 350 60 563
Jina Zachrisson +44 20 3207 7879 Peter Nichols +44 20 3207 7810 Sebastian Grünberg +49 40 350 60 763
Richard Payman +44 20 3207 7825 Alexander Heinz +49 40 350 60 359
INSURANCE George Smibert +44 20 3207 7911 Marc Hosthausen +49 40 350 60 761
Trevor Moss +44 20 3207 7893 Anita Surana +44 20 3207 7855 Gregor Labahn +49 40 350 60 571
Paul Walker +44 20 3465 2632 Chris McKeand +49 40 350 60 798
MEDIA & TELECOMMUNICATIONS Alexander Woodgate +44 20 3465 2625 Patrick Schepelmann +49 40 350 60 559
Julia Thannheiser +44 20 3465 2676 Lars Schwartau +49 40 350 60 450
BENELUX Marvin Schweden +49 40 350 60 576
TECHNOLOGY Miel Bakker +44 20 3207 7808 Tim Storm +49 40 350 60 415
Jean Beaubois +44 20 3207 7835 Susette Mantzel +49 40 350 60 694 Philipp Wiechmann +49 40 350 60 346
Alexander Wace +44 20 3465 2670
UTILITIES LONDON
Benita Barretto +44 20 3207 7829 FRANKFURT Mike Berry +44 20 3465 2755
Michael Brauburger +49 69 91 30 90 741 Stewart Cook +44 20 3465 2752
CRM Nina Buechs +49 69 91 30 90 735 Simon Messman +44 20 3465 2754
Laura Cooper +44 20 3207 7806 André Grosskurth +49 69 91 30 90 734 Paul Somers +44 20 3465 2753
Edwina Lucas +44 20 3207 7908 Joerg Wenzel +49 69 91 30 90 743
Greg Swallow +44 20 3207 7833 PARIS
PARIS Sylvain Granjoux +33 1 5844 9509
INVESTOR ACCESS Dalila Farigoule +33 1 5844 9510
Matthew Chawner +44 20 3207 7847 Clémence La Clavière-Peyraud +33 1 5844 9521 ELECTRONIC TRADING
Jennie Jiricny +44 20 3207 7886 Bertrand Tissier +33 1 5844 9507 Matthias Führer +49 40 350 60 597
Julian Winter +49 40 350 60 463
EVENTS SCANDINAVIA
Charlotte Kilby +44 20 3207 7832 Ronald Bernette +44 20 3207 7828 SOVEREIGN WEALTH FUNDS
Natalie Meech +44 20 3207 7831 Marco Weiss +49 40 350 60 719 Max von Doetinchem +44 20 3207 7826
Charlotte Reeves +44 20 3465 2671
Sarah Weyman +44 20 3207 7801
Hannah Whitehead +44 20 3207 7922
US SALES E-mail: [email protected]; Internet www.berenberg.com
BERENBERG CAPITAL MARKETS LLC Member FINRA & SIPC
Colin Andrade +1 617 292 8230 Shawna Giust +1 646 445 7216 Kieran O'Sullivan +1 617 292 8292
Burr Clark +1 617 292 8282 Andrew Holder +1 617 292 8222 Jonathan Saxon +1 646 445 7202
Julie Doherty +1 617 292 8228 Olivia Lee +1 646 445 7212
Kelleigh Faldi +1 617 292 8288 Emily Mouret +1 646 445 7204
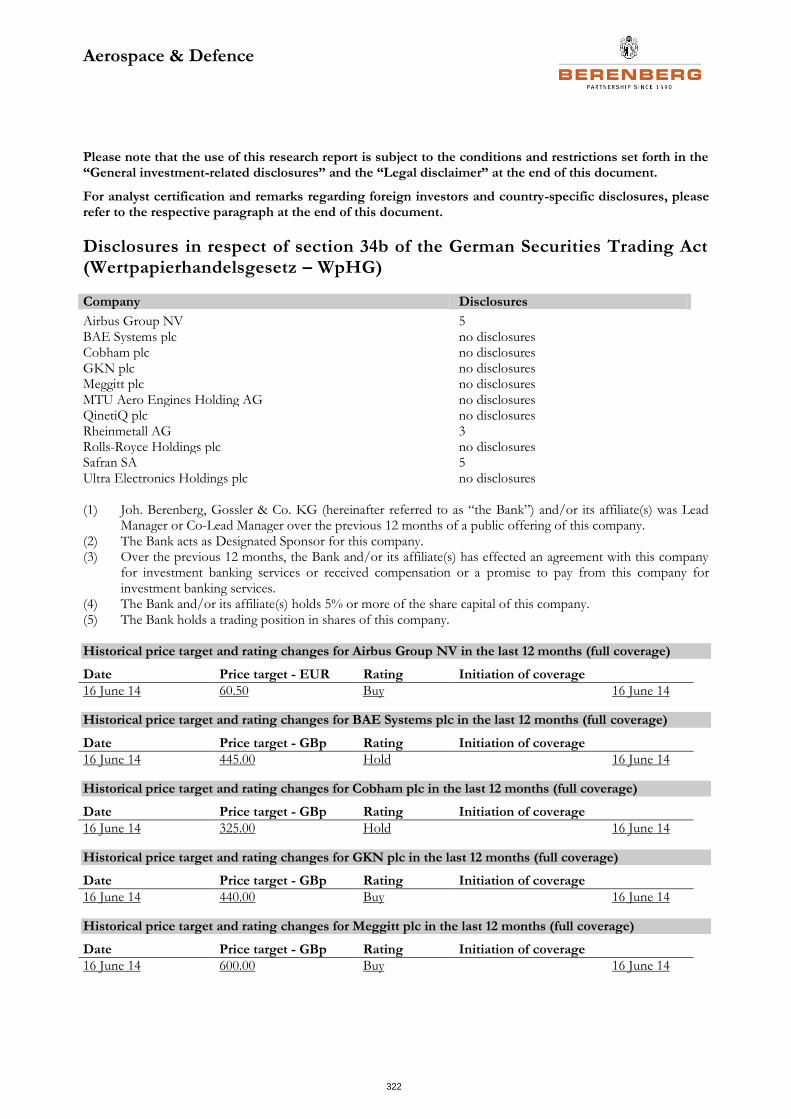
Aerospace & Defence
322
Please note that the use of this research report is subject to the conditions and restrictions set forth in the “General investment-related disclosures” and the “Legal disclaimer” at the end of this document.
For analyst certification and remarks regarding foreign investors and country-specific disclosures, please refer to the respective paragraph at the end of this document.
Disclosures in respect of section 34b of the German Securities Trading Act (Wertpapierhandelsgesetz – WpHG)
Company Disclosures Airbus Group NV 5 BAE Systems plc no disclosures Cobham plc no disclosures GKN plc no disclosures Meggitt plc no disclosures MTU Aero Engines Holding AG no disclosures QinetiQ plc no disclosures Rheinmetall AG 3 Rolls-Royce Holdings plc no disclosures Safran SA 5 Ultra Electronics Holdings plc no disclosures (1) Joh. Berenberg, Gossler & Co. KG (hereinafter referred to as “the Bank”) and/or its affiliate(s) was Lead
Manager or Co-Lead Manager over the previous 12 months of a public offering of this company. (2) The Bank acts as Designated Sponsor for this company. (3) Over the previous 12 months, the Bank and/or its affiliate(s) has effected an agreement with this company
for investment banking services or received compensation or a promise to pay from this company for investment banking services.
(4) The Bank and/or its affiliate(s) holds 5% or more of the share capital of this company. (5) The Bank holds a trading position in shares of this company. Historical price target and rating changes for Airbus Group NV in the last 12 months (full coverage)
Date Price target - EUR Rating Initiation of coverage
16 June 14 60.50 Buy 16 June 14
Historical price target and rating changes for BAE Systems plc in the last 12 months (full coverage)
Date Price target - GBp Rating Initiation of coverage
16 June 14 445.00 Hold 16 June 14
Historical price target and rating changes for Cobham plc in the last 12 months (full coverage)
Date Price target - GBp Rating Initiation of coverage
16 June 14 325.00 Hold 16 June 14
Historical price target and rating changes for GKN plc in the last 12 months (full coverage)
Date Price target - GBp Rating Initiation of coverage
16 June 14 440.00 Buy 16 June 14
Historical price target and rating changes for Meggitt plc in the last 12 months (full coverage)
Date Price target - GBp Rating Initiation of coverage
16 June 14 600.00 Buy 16 June 14
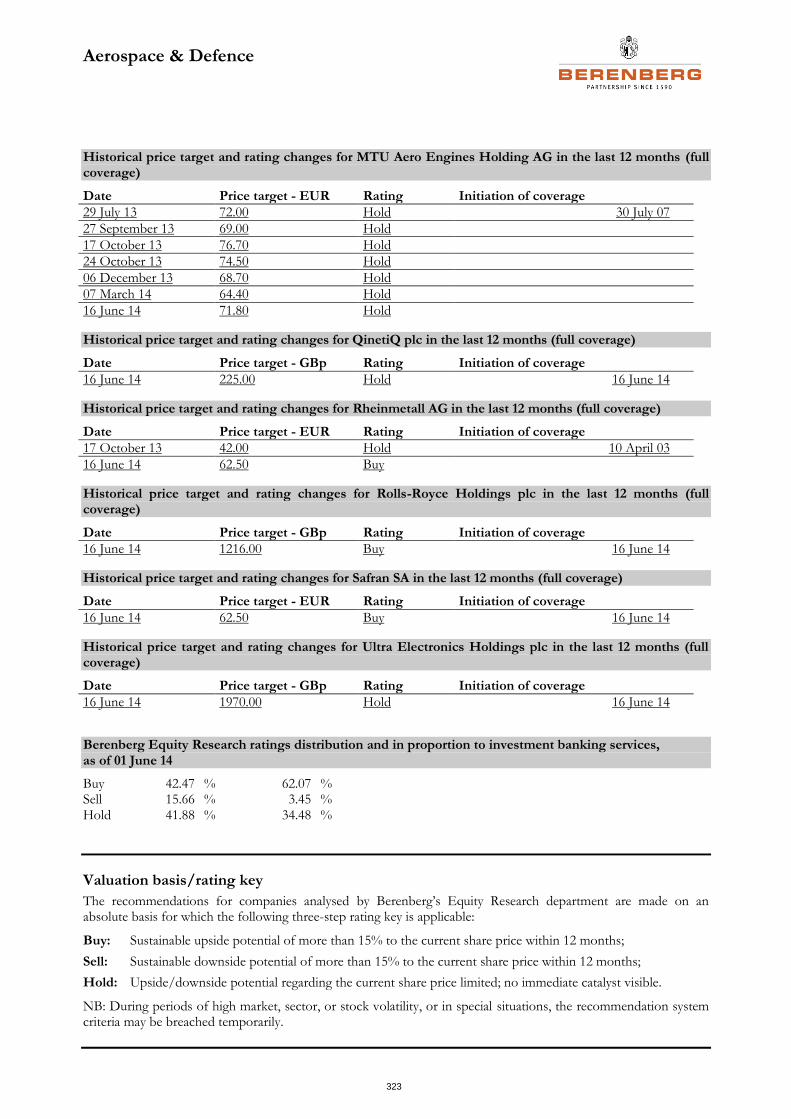
Aerospace & Defence
323
Historical price target and rating changes for MTU Aero Engines Holding AG in the last 12 months (full coverage)
Date Price target - EUR Rating Initiation of coverage
29 July 13 72.00 Hold 30 July 07
27 September 13 69.00 Hold
17 October 13 76.70 Hold
24 October 13 74.50 Hold
06 December 13 68.70 Hold
07 March 14 64.40 Hold
16 June 14 71.80 Hold
Historical price target and rating changes for QinetiQ plc in the last 12 months (full coverage)
Date Price target - GBp Rating Initiation of coverage
16 June 14 225.00 Hold 16 June 14
Historical price target and rating changes for Rheinmetall AG in the last 12 months (full coverage)
Date Price target - EUR Rating Initiation of coverage
17 October 13 42.00 Hold 10 April 03
16 June 14 62.50 Buy
Historical price target and rating changes for Rolls-Royce Holdings plc in the last 12 months (full coverage)
Date Price target - GBp Rating Initiation of coverage
16 June 14 1216.00 Buy 16 June 14
Historical price target and rating changes for Safran SA in the last 12 months (full coverage)
Date Price target - EUR Rating Initiation of coverage
16 June 14 62.50 Buy 16 June 14
Historical price target and rating changes for Ultra Electronics Holdings plc in the last 12 months (full coverage)
Date Price target - GBp Rating Initiation of coverage
16 June 14 1970.00 Hold 16 June 14
Berenberg Equity Research ratings distribution and in proportion to investment banking services, as of 01 June 14
Buy 42.47 % 62.07 % Sell 15.66 % 3.45 % Hold 41.88 % 34.48 %
Valuation basis/rating key
The recommendations for companies analysed by Berenberg’s Equity Research department are made on an absolute basis for which the following three-step rating key is applicable:
Buy: Sustainable upside potential of more than 15% to the current share price within 12 months;
Sell: Sustainable downside potential of more than 15% to the current share price within 12 months;
Hold: Upside/downside potential regarding the current share price limited; no immediate catalyst visible.
NB: During periods of high market, sector, or stock volatility, or in special situations, the recommendation system criteria may be breached temporarily.
Aerospace & Defence
324
Competent supervisory authority
Bundesanstalt für Finanzdienstleistungsaufsicht -BaFin- (Federal Financial Supervisory Authority), Graurheindorfer Straße 108, 53117 Bonn and Marie-Curie-Str. 24-28, 60439 Frankfurt am Main, Germany.
General investment-related disclosures Joh. Berenberg, Gossler & Co. KG (hereinafter referred to as „the Bank“) has made every effort to carefully research all information contained in this financial analysis. The information on which the financial analysis is based has been obtained from sources which we believe to be reliable such as, for example, Thomson Reuters, Bloomberg and the relevant specialised press as well as the company which is the subject of this financial analysis. Only that part of the research note is made available to the issuer (who is the subject of this analysis) which is necessary to properly reconcile with the facts. Should this result in considerable changes a reference is made in the research note.
Opinions expressed in this financial analysis are our current opinions as of the issuing date indicated on this document. The companies analysed by the Bank are divided into two groups: those under “full coverage” (regular updates provided); and those under “screening coverage” (updates provided as and when required at irregular intervals).
The functional job title of the person/s responsible for the recommendations contained in this report is “Equity Research Analyst” unless otherwise stated on the cover.
The following internet link provides further remarks on our financial analyses: http://www.berenberg.de/research.html?&L=1&no_cache=1
Legal disclaimer This document has been prepared by Joh. Berenberg, Gossler & Co. KG (hereinafter referred to as „the Bank“). This document does not claim completeness regarding all the information on the stocks, stock markets or developments referred to in it. On no account should the document be regarded as a substitute for the recipient procuring information for himself/herself or exercising his/her own judgements. The document has been produced for information purposes for institutional clients or market professionals. Private customers, into whose possession this document comes, should discuss possible investment decisions with their customer service officer as differing views and opinions may exist with regard to the stocks referred to in this document.
This document is not a solicitation or an offer to buy or sell the mentioned stock.
The document may include certain descriptions, statements, estimates, and conclusions underlining potential market and company development. These reflect assumptions, which may turn out to be incorrect. The Bank and/or its employees accept no liability whatsoever for any direct or consequential loss or damages of any kind arising out of the use of this document or any part of its content.
The Bank and/or its employees may hold, buy or sell positions in any securities mentioned in this document, derivatives thereon or related financial products. The Bank and/or its employees may underwrite issues for any securities mentioned in this document, derivatives thereon or related financial products or seek to perform capital market or underwriting services.
Analyst certification I, Andrew Gollan, hereby certify that all of the views expressed in this report accurately reflect my personal views about any and all of the subject securities or issuers discussed herein.
In addition, I hereby certify that no part of my compensation was, is, or will be, directly or indirectly related to the specific recommendations or views expressed in this research report, nor is it tied to any specific investment banking transaction performed by the Bank or its affiliates.
Aerospace & Defence
325
Remarks regarding foreign investors The preparation of this document is subject to regulation by German law. The distribution of this document in other jurisdictions may be restricted by law, and persons into whose possession this document comes should inform themselves about, and observe, any such restrictions.
United Kingdom This document is meant exclusively for institutional investors and market professionals, but not for private customers. It is not for distribution to or the use of private investors or private customers.
United States of America This document has been prepared exclusively by the Bank. Although Berenberg Capital Markets LLC, an affiliate of the Bank and registered US broker-dealer, distributes this document to certain customers, Berenberg Capital Markets LLC does not provide input into its contents, nor does this document constitute research of Berenberg Capital Markets LLC. In addition, this document is meant exclusively for institutional investors and market professionals, but not for private customers. It is not for distribution to or the use of private investors or private customers.
This document is classified as objective for the purposes of FINRA rules. Please contact Berenberg Capital Markets LLC (+1 617.292.8200), if you require additional information.
Third-party research disclosures
Company Disclosures Airbus Group NV no disclosures BAE Systems plc no disclosures Cobham plc no disclosures GKN plc no disclosures Meggitt plc no disclosures MTU Aero Engines Holding AG no disclosures QinetiQ plc no disclosures Rheinmetall AG no disclosures Rolls-Royce Holdings plc no disclosures Safran SA no disclosures Ultra Electronics Holdings plc no disclosures (1) Berenberg Capital Markets LLC owned 1% or more of the outstanding shares of any class of the subject
company by the end of the prior month.* (2) Over the previous 12 months, Berenberg Capital Markets LLC has managed or co-managed any public
offering for the subject company.* (3) Berenberg Capital Markets LLC is making a market in the subject securities at the time of the report. (4) Berenberg Capital Markets LLC received compensation for investment banking services in the past 12 months,
or expects to receive such compensation in the next 3 months.* (5) There is another potential conflict of interest of the analyst or Berenberg Capital Markets LLC, of which the
analyst knows or has reason to know at the time of publication of this research report.
* For disclosures regarding affiliates of Berenberg Capital Markets LLC please refer to the ‘Disclosures in respect of section 34b of the German Securities Trading Act (Wertpapierhandelsgesetz – WpHG)’ section above.
Copyright The Bank reserves all the rights in this document. No part of the document or its content may be rewritten, copied, photocopied or duplicated in any form by any means or redistributed without the Bank’s prior written consent.
© May 2013 Joh. Berenberg, Gossler & Co. KG