Benzene in Consumer Beverages and Other Products At … · Analytical Chemistry and Applied...
10
Application Note 27970207 Keywords Benzene Beverages Carcinogen EPA FDA P&T Purge-and-Trap Table-Ready Foods VOC Presented at the 2007 Pittsburgh Conference on Analytical Chemistry and Applied Spectroscopy, Chicago, IL February 25–March 1, 2007 Benzene in Consumer Beverages and Other Products At Single-Digit Parts-per-Billion (ppb) Levels by Purge-and-Trap (P&T) Introduction In November 2005, the United States Food and Drug Administration (FDA) received reports that benzene, a human carcinogen, was present at low concentrations in some consumer beverages that contained both benzoate salts and ascorbic acid. A resulting FDA survey of approximately 100 products found that most of the beverages sampled contained either no detectable (ND) benzene or benzene levels that were well below the U.S. Environmental Protection Agency (EPA) water quality standard of 5 ppb. However, several of the beverages tested in the FDA survey contained benzene at levels above 5 ppb. It should be noted that there is no quality standard for benzene in consumer beverages, only in drinking water. Beverage manufacturers are currently reformulating products containing greater than 5 ppb benzene, but the low-level detection of this human carcinogen in consumer beverages emphasizes the need for a robust procedure for the routine testing of these and other consumer products. This application note describes a reliable, automated method for the analysis of benzene and other volatile organic compounds (VOCs) in consumer products at single digit and sub-ppb concentrations using a closed-system P&T technique. For this project, benzene was measured in carbonated and non-carbonated beverages, a variety of common table- ready foods, and other consumer products using the method presented. Naturally occurring VOCs, as well as volatile contaminant residues from various sources such as processing and packaging, flavor additives, and breakdown products, can be determined by this method. Experimental The equipment used for this project included the OI Analytical Eclipse 4660 Purge-and-Trap (P&T) Sample Concentrator (see Figure 1) and the Model 4552 Water/Soil Autosampler (see Figure 2). VOC extraction, concentration, and introduction to the GC/MS were performed using the autosampler “Soil” mode, which is more sensitive than static or dynamic headspace methods, minimizes the potential for foaming and carryover often associated with carbonated beverages and other consumer products, and does not require cryogenic focusing. Compound speciation was by gas chromatography; mass spectrometry was used for detection, identification, and quantitation by Internal Standard (IS).
Transcript of Benzene in Consumer Beverages and Other Products At … · Analytical Chemistry and Applied...

Application Note 27970207
KeywordsBenzeneBeveragesCarcinogenEPAFDAP&TPurge-and-TrapTable-Ready FoodsVOC
Presented at the 2007 Pittsburgh Conference on
Analytical Chemistry and Applied Spectroscopy, Chicago, IL
February 25–March 1, 2007
Benzene in Consumer Beverages and Other Products At Single-Digit Parts-per-Billion (ppb)
Levels by Purge-and-Trap (P&T)
IntroductionIn November 2005, the United States Food and Drug Administration (FDA) received reports that benzene, a human carcinogen, was present at low concentrations in some consumer beverages that contained both benzoate salts and ascorbic acid. A resulting FDA survey of approximately 100 products found that most of the beverages sampled contained either no detectable (ND) benzene or benzene levels that were well below the U.S. Environmental Protection Agency (EPA) water quality standard of 5 ppb. However, several of the beverages tested in the FDA survey contained benzene at levels above 5 ppb. It should be noted that there is no quality standard for benzene in consumer beverages, only in drinking water.
Beverage manufacturers are currently reformulating products containing greater than 5 ppb benzene, but the low-level detection of this human carcinogen in consumer beverages emphasizes the need for a robust procedure for the routine testing of these and other consumer products.
This application note describes a reliable, automated method for the analysis of benzene and other volatile organic compounds (VOCs) in consumer products at single digit and sub-ppb concentrations using a closed-system P&T technique. For this project, benzene was measured in carbonated and non-carbonated beverages, a variety of common table-ready foods, and other consumer products using the method presented. Naturally occurring VOCs, as well as volatile contaminant residues from various sources such as processing and packaging, flavor additives, and breakdown products, can be determined by this method.
ExperimentalThe equipment used for this project included the OI Analytical Eclipse 4660 Purge-and-Trap (P&T) Sample Concentrator (see Figure 1) and the Model 4552 Water/Soil Autosampler (see Figure 2). VOC extraction, concentration, and introduction to the GC/MS were performed using the autosampler “Soil” mode, which is more sensitive than static or dynamic headspace methods, minimizes the potential for foaming and carryover often associated with carbonated beverages and other consumer products, and does not require cryogenic focusing. Compound speciation was by gas chromatography; mass spectrometry was used for detection, identification, and quantitation by Internal Standard (IS).

Closed System Purge-and-TrapSamples were purged in a sample vial using the “Soil” mode on the Model 4552 Autosampler. Using this technique, an appropriate aliquot of the test sample is placed in a 40-mL VOA vial that contains a magnetic stir bar. The vial is sealed with a cap and a Teflon®-lined, low-bleed silicon septum and placed into the autosampler tray; the “Soil” mode is selected using the autosampler keypad. The inside of the autosampler and the “Soil” mode sampling station are shown in Figure 3.
Figure 3. Model 4552 Water/Soil Autosampler Interior
The “Soil” mode sampling station is visible within the autosampler.
The vial is raised onto the soil probe where organic-free reagent water and internal standards are added automatically. The sample is heated to 40 °C and stirred inside the sealed VOA vial using the magnetic stir bar to maximize purge efficiency. The volatized compounds are purged from the sample, swept through the top of the double sleeve needle to an inert, heated transfer line, and carried onto the cool analytical trap in the P&T sample concentrator. The trap is then rapidly heated, and the analytes are desorbed under reversed flow of carrier gas onto the GC column. Sample purging in the “Soil” mode is illustrated in Figure 4.
Figure 1. OI Analytical Eclipse 4660 P&T Sample Concentrator
Figure 2. OI Analytical Model 4552 Water/Soil Autosampler
Soil Probe
“Soil” Mode Sampling Station
“Water” Mode Sampling Station
Standard Vessels
Equilibrium Block
Sample Tray (Cooling Optional)
2

Figure 4. Vial Purging Technique
This illustration represents the purging technique inside the 40-mL VOA vial using the “Soil” mode of the autosampler.
Sample PreparationBeverages were cooled to 4 °C prior to sampling. A 5-mL gas-tight syringe (refer to Figure 5) was flushed with the sample and then used to transfer 5 mL of beverage from the original container to the 40-mL VOA vial. Care was taken with the carbonated beverages to minimize foaming or dead volume inside the syringe; however, in some cases it was impossible to remove all gas bubbles from the syringe prior to transfer. The non-carbonated beverages did not have any residual air bubbles or dead volume during transfer.
Figure 5. 5-mL Gas-Tight Syringe
The syringe was used to transfer an aliquot of carbonated beverage from its original container to the 40-mL VOA vial. The same syringe was used for non-
carbonated beverages, but there was no dead volume or air bubbles.
The table-ready food products were frozen and either chopped or blended, depending on the matrix, then re-frozen. Approximately 5 grams of the frozen sample were weighed into the 40-mL VOA vial. All VOA vials for foods and beverages contained a magnetic stir bar to facilitate agitation of the sample during the purge step. Reagent-free water was used to transfer the IS to the food and beverage samples. Figure 6 shows some of the table-ready foods in VOA vials after purging.
Purge Gas IN
4. VOCs Carried to Trap
3. VOCs Collected at Top of the Double Sleeve Needle
2. Purge Gas Extracts VOCs from the Matrix
1. Sample Stirred and Heated to Improve Purge Efficiency
3

Figure 6. Table-Ready Foods following Analysis
Table-ready foods shown in 40-mL VOA vials after analysis for VOCs by closed-system P&T.
A similar technique was used to determine VOC content in non-food consumer products such as toothpaste and shampoo. A representative aliquot of each sample was placed inside a disposable needle-sparge tube, which was connected to the sparge mount on the front of the P&T concentrator. The samples were heated to 40 °C and sparged through a needle without stirring or the addition of reagent-free water (which can cause foaming). For these matrices, the analytes of interest included primarily flavor and fragrance compounds.
Instrument Operating ConditionsAll instrument operating parameters for the beverages are shown in Table 1. The table-ready foods and consumer products were analyzed using the P&T conditions shown in Table 1 using a slightly different column and GC oven program. All samples were analyzed on the mass spectrometer in scan mode.
Table 1. Instrument Operating Parameters for the Beverages
* Any standard VOC column can be used for this method. If another type of column is chosen, the column manufacturer’s recommended operating conditions should be substituted for the conditions in Table 1.
Parameter SettingP&T EclipseAutosampler 4552, soil modeTrap #10 (Tenax®, silica gel, carbon molecular sieve)Sample Temperature 40 °CPurge Time/Temperature 11 min, trap at 20 °CDesorb Preheat ON, 180 °CDesorb Time/Temperature 0.5 min, trap at 190 °CBake Time/Temperature 6 min, trap at 210 °CWater Management Settings 110 °C during Purge
0 °C during Desorb240 °C during Bake
Parameter SettingGC Agilent 6890NInlet 220 °C, split 35:1Column*
Oven* 45 °C (hold 4.3 min)12 °C/min to 100 °C (no hold)25 °C/min to 250 °C (hold 5.3 min)
MS Agilent 5975Mode Scan: 35 to 260 amu
4

Results
BeveragesAll eight of the tested carbonated and non-carbonated beverages contained benzene at concentrations well below 1 ppb. The benzene concentration was quantified using fluorobenzene as an internal standard and a quantitation ion of m/z 78. Compound identity was confirmed by comparison to a reference spectrum in the NIST library. Figure 7 shows the total ion chromatogram (TIC) for root beer with an expanded view of the benzene peak at 7.26 minutes, Figure 8 shows the Extracted Ion Current Profiles (EICP) for benzene and fluorobenzene, and Figure 9 shows the results of the NIST library search.
Four of the beverages that contained sodium benzoate and either ascorbic acid or citric acid (pineapple soda, citrus-flavored iced tea, root beer, and a colorless carbonated beverage) had concentrations that were slightly elevated when compared to the other 4 beverages, with root beer having the highest concentration at 0.7 ppb. This was similar to findings in the FDA study which showed that these additives were instrumental in the formation of benzene in the final product. None of the beverages contained benzene at concentrations above the USEPA 5-ppb limit for drinking water. Table 2 shows the benzene concentrations and types of additives in the eight beverages tested.
Figure 7. Chromatogram of the Root Beer Sample
The expanded view of the chromatogram shows the benzene peak at RT 7.26 min.
Figure 8. EICP of Benzene and Fluorobenzene (IS)
Figure 9. NIST Library Search Results on Peak at RT 7.26 min
BenzeneRT=7.26 min
0.7 ppb Benzene(m/z 78, 77, & 51)
Fluorobenzene(IS)
5

Table 2. Benzene Concentrations and Additives in the Beverages
Table-Ready FoodsBenzene was found in most of the table-ready foods at concentrations slightly higher than was found in the beverages and ranged from ND in the butter to 2.8 ppb in the strawberries. As shown in the chromatograms in Figure 10, most of the food samples also contained many additional volatile compounds that are quantifiable by this method. Some of the VOCs in the chromatogram are those found in USEPA VOC methods 524.2 or 8260; however, the majority of volatile compounds that were detected are flavors, fragrances, and other types of volatiles present in the matrix.
Ben
zene
Con
c. (p
pb)
Asc
orbi
c A
cid
Sodi
um B
enzo
ate
Phos
phat
e B
enzo
ate
Pota
ssiu
m B
enzo
ate
Citr
it A
cid
Phos
phor
ic A
cid
Cola 0.1 XDiet Cola 0.1 X XOrange Soda 0.1 X X XPineapple Soda 0.2 X XPink Lemonade 0.1 X XCitrus-Flavored Iced Tea 0.2 X X XRoot Beer 0.7 X X XColorless Carbonated Beverage
0.2 X X
6

Figure 10. Chromatograms of VOCs in selected table-ready foods
The table-ready foods were analyzed using the Eclipse P&T Sample Concentrator. Benzene concentrations ranged from ND in the butter to 2.8 ppb in
the strawberries.
ButterBenzene (15.0 min)Not Detected
Pepperoni PizzaBenzene (15.0 min)1.5 ppb
Fast-Food HamburgerBenzene (15.0 min)1.7 ppb
Hot DogsBenzene (15.0 min)0.8 ppb
Potato ChipsBenzene (15.0 min)1.6 ppb
StrawberriesBenzene (15.0 min)2.8 ppb
Benz
ene
7

Toothpaste and ShampooAs expected, the VOCs detected in the non-food consumer products were primarily flavor and fragrance compounds. Identification of the individual peaks in the toothpaste and shampoo samples was performed by comparison to NIST library spectra (see Figures 11 and 12). No standards were available for quantitation of the flavor and fragrance compounds, but they generally fell within the normal range of detection for VOCs by P&T using MS scan mode: roughly between 0.1 and 200 ppb.
Figure 11. TIC of Volatile Compounds in Toothpaste
Selected flavor/fragrance peaks are identified, and the NIST library search results serve as a comparison.
40 60 80 100 120 140 160 180 200 220 240 2600
1000
2000
3000
4000
5000
6000
7000
8000
9000
m/z-->
Abundance
Average of 31.367 to 31.409 min.: TTHPST02.D9581
71
123
41 55138
109
207155 191170 253181
40 60 80 100 120 140 160 180 200 220 240 2600
1000
2000
3000
4000
5000
6000
7000
8000
9000
m/z-->
Abundance
#114614: Cyclohexanol, 5-methyl-2-(1-methylethyl)-, [1S-(1.a71
8141
9555
123138109
20 40 60 80 100 120 140 160 180 200 220 240 2600
1000
2000
3000
4000
5000
6000
7000
8000
9000
m/z-->
Abundance
Average of 32.176 to 32.260 min.: TTHPST02.D120
92
152
65
3953
81 137109 207191177 253163 219 239
20 40 60 80 100 120 140 160 180 200 220 240 2600
1000
2000
3000
4000
5000
6000
7000
8000
9000
m/z-->
Abundance
#120911: Methyl Salicylate120
92
15239
65
532976 137
20 30 40 50 60 70 80 90 1001101201301401501601701801902002100
1000
2000
3000
4000
5000
6000
7000
8000
9000
m/z-->
Abundance
Scan 4773 (29.168 min): SHMP001.D71 93
43 55
80121
136107
154 207
20 30 40 50 60 70 80 90 1001101201301401501601701801902002100
1000
2000
3000
4000
5000
6000
7000
8000
9000
m/z-->
Abundance
#114489: 1,6-Octadien-3-ol, 3,7-dimethyl-71
41
93
55
80
28121
105 136154
5.00 10.00 15.00 20.00 25.00 30.00 35.00 40.000
1000000
2000000
3000000
4000000
5000000
6000000
7000000
8000000
9000000
1e+07
1.1e+07
1.2e+07
1.3e+07
1.4e+07
1.5e+07
1.6e+07
1.7e+07
1.8e+07
1.9e+07
2e+07
2.1e+07
2.2e+07
2.3e+07
Time-->
Abundance
TIC: TTHPST02.D
TIC of Volatile Compounds in Toothpaste
Menthol
Linalool Anethole
Carvone
Methyl Salicylate
Linalool Menthol Methyl Salicylate
8
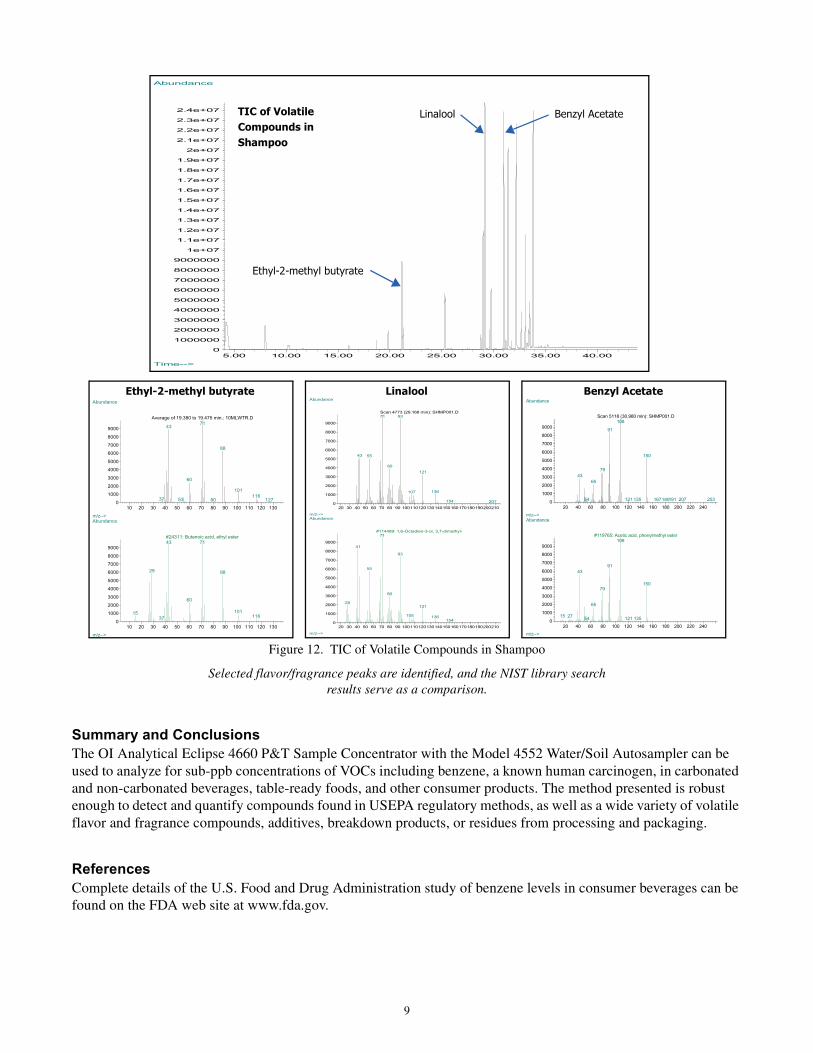
Figure 12. TIC of Volatile Compounds in Shampoo
Selected flavor/fragrance peaks are identified, and the NIST library search results serve as a comparison.
Summary and ConclusionsThe OI Analytical Eclipse 4660 P&T Sample Concentrator with the Model 4552 Water/Soil Autosampler can be used to analyze for sub-ppb concentrations of VOCs including benzene, a known human carcinogen, in carbonated and non-carbonated beverages, table-ready foods, and other consumer products. The method presented is robust enough to detect and quantify compounds found in USEPA regulatory methods, as well as a wide variety of volatile flavor and fragrance compounds, additives, breakdown products, or residues from processing and packaging.
ReferencesComplete details of the U.S. Food and Drug Administration study of benzene levels in consumer beverages can be found on the FDA web site at www.fda.gov.
20 40 60 80 100 120 140 160 180 200 220 2400
1000
2000
3000
4000
5000
6000
7000
8000
9000
m/z-->
Abundance
Scan 5118 (30.980 min): SHMP001.D108
91
150
7943
65
20754 135121 167 191 253180
20 40 60 80 100 120 140 160 180 200 220 2400
1000
2000
3000
4000
5000
6000
7000
8000
9000
m/z-->
Abundance
#119765: Acetic acid, phenylmethyl ester108
9143
15079
65
15 27 54 135121
10 20 30 40 50 60 70 80 90 100 110 120 1300
1000
2000
3000
4000
5000
6000
7000
8000
9000
m/z-->
Abundance
Average of 19.380 to 19.475 min.: 10MLWTR.D71
43
88
60
10111637 53 80 127
10 20 30 40 50 60 70 80 90 100 110 120 1300
1000
2000
3000
4000
5000
6000
7000
8000
9000
m/z-->
Abundance
#24311: Butanoic acid, ethyl ester7143
29 88
60
10115 11637
20 30 40 50 60 70 80 90 1001101201301401501601701801902002100
1000
2000
3000
4000
5000
6000
7000
8000
9000
m/z-->
Abundance
Scan 4773 (29.168 min): SHMP001.D71 93
43 55
80121
136107
154 207
20 30 40 50 60 70 80 90 1001101201301401501601701801902002100
1000
2000
3000
4000
5000
6000
7000
8000
9000
m/z-->
Abundance
#114489: 1,6-Octadien-3-ol, 3,7-dimethyl-71
41
93
55
80
28121
105 136154
5.00 10.00 15.00 20.00 25.00 30.00 35.00 40.000
1000000
2000000
3000000
4000000
5000000
6000000
7000000
8000000
9000000
1e+07
1.1e+07
1.2e+07
1.3e+07
1.4e+07
1.5e+07
1.6e+07
1.7e+07
1.8e+07
1.9e+07
2e+07
2.1e+07
2.2e+07
2.3e+07
2.4e+07
Time-->
Abundance
TIC: SHMP001.D
TIC of Volatile Compounds in Shampoo
Ethyl-2-methyl butyrate Linalool Benzyl Acetate
Linalool
Ethyl-2-methyl butyrate
Benzyl Acetate
9

Teflon is a registered trademark of E.I. DuPont de Nemours, Inc.Tenax is a registered trademark of Enka Research Institute Arnhem.
Publication 27970207