
Benefits of investing in cycling in New Zealand ... · 4 | People want cycling infrastructure. Many...
16
Benefits of investing in cycling in New Zealand communities CycleLife
-
Upload
hoangxuyen -
Category
Documents
-
view
214 -
download
0
Transcript of Benefits of investing in cycling in New Zealand ... · 4 | People want cycling infrastructure. Many...
Benefits of investing in cycling in New Zealand communities
CycleLife

2 |
The benefits include:• more liveable towns and cities
• improved conditions for travelling within towns and cities
• stronger local economies
• reduced costs for councils
• less impact on the environment, and
• healthier and more productive people.
We also know that providing cycling infrastructure responds to what a significant percentage of people say they want.
More information about the benefits of investing in cycling will be added over time to build this as a shared information base.
These pages provide information about the key benefits of investing in cycling, for councils, communities and individuals.

| 3

4 |
People want cycling infrastructure. Many people say they’d like to cycle more, especially if separated cycling infrastructure was provided. 1
• Seventy-six percent of people in Wellington over 18 years say they would consider cycling for recreation, errands or commuting if safe, separated infrastructure was provided2
• Sixty percent of Aucklanders say they would cycle if separated cycle facilities were installed (and almost one in four own a bike already)3
• A 2014 study found that Generation Y New Zealanders (aged 15 to 35) wanted to increase their travel by cycling more than by any other mode4
• The number of people cycling to work across New Zealand on census day 2013 increased by 16 percent (6,093 people) from 2006. In Wellington and Auckland, the number of people cycling during peak hours grew by approximately 40 percent and 22 percent, respectively, between 2007 and 20125
1 Sport New Zealand 2015 Sport and Active Recreation in the Lives of New Zealand Adults. 2013/2014 Active New Zealand Survey Results.
2 Pettit, T. and Dodge, N. 2014 Cycling Demand Analysis: http://sustainablecities.org.nz/wp-content/uploads/Pettit-Dodge-WCC-cycling-demand-analysis-report.pdf
3 Auckland Transport 2015 Auckland Cycling Programme, retrieved from https://at.govt.nz/media/1070164/Item-111-Auckland-Cycling-Programme-incl-attachmentsfinal.pdf
4 Rive et al, Public Transport and the Next Generation, NZ Transport Agency, 2014.
5 Statistics NZ 2013 The New Zealand Census of Population and Dwellings
• After it built a cycling network, New Plymouth saw a 35 per cent increase in cycling between 2006 and 2013, and increases in the numbers of people commuting by bike on shared pathways were reported in excess of 50 percent.6 A 2012 study of students across 24 schools found a 62.5 percent increase in active travel to and from school since 2011.7
Overseas, an increased number of people cycling has also been seen after cycling infrastructure was built. In Melbourne, in March 2015 people biking made up almost 17 percent of all vehicle movements into the city in the morning peak. Six years earlier it was only 8 percent.8
6 New Zealand Transport Agency, The Walking and Cycling Model Community Story with New Plymouth & Hastings, 2013, https://www.nzta.govt.nz/assets/Walking-Cycling-and-Public-Transport/docs/model-community-story-single.pdf
7 Ibid.
8 City of Melbourne Bicycle Data, Retrieved from http://www.melbourne.vic.gov.au/ParkingTransportandRoads/cycling/Pages/Bicycledata.aspx
Investing in cycling is giving people what they wantAcross New Zealand, cycling is the third most popular recreational activity, with 24.8 percent of adults participating in it.1

| 5

6 |
Good cycling infrastructure can make travelling around towns and cities a deeply pleasurable activity. Something that really makes a town or city liveable is when being in its environment is a pleasure itself, and commuting or travelling within it is an enjoyable experience rather than something to be endured. Ask anyone who cycles on a separated path along a river, or through a park, or along a coastline how they feel about the liveability of that particular area and they’re likely to give a very positive response.
As Stefansdottir found, “…cycle commuters positively value aesthetic experience with greenery, contact with the natural environment and distance from motorised traffic being most important”.9
Cycling makes towns and cities more accessible. With the option of being able to cycle safely and enjoyably, people can get around their town or
9 Stfansdottir, H, 2014, ‘Urban routes and commuting bicyclist’s aesthetic experience’, cited in Aldred, R. Benefits of Investing in Cycling, British Cycling, p10.
city more easily when public transport is not available, parking is tight, or personal budgets are limited.
Cycling reduces noise in towns and cities by reducing the number of trips made by private car, making them much more pleasant places to live. It also makes moving around towns and cities more pleasant, with fewer cars impeding pedestrians from crossing streets as the cars hurtle along at speed
Having the option of being able to cycle may be particularly good for young people, the elderly, people who are economically disadvantaged, people with disabilities and people who do not drive.
For young people, being able to cycle safely can mean gaining independence to attend sporting activities, clubs and other social and recreational pursuits when parents are not available to take them and public transport is not available.
Cycling makes towns and cities really liveableCycling improves quality of life in towns and cities. ‘Quality of life’ rankings consistently show bike-friendly cities at the top.

| 7
For older people, being able to cycle safely can also mean more freedom being able to attend social and recreational events, and access services, when other transport options are not available to them. In countries with high-quality cycling infrastructure such as Germany and Denmark, over 10 percent of all trips by Danish and German over-65s are by bike, and in the Netherlands, 24 percent of all trips by over-65s are made by bike. Even with Dutch people aged 80-84, over 20 percent prefer their bike to other transport modes.10
For people who are economically disadvantaged or do not drive, being able to cycle safely can mean being more able to search for work, access services and retain social connections. In Denmark, people in households with the lowest incomes make 26 percent of their daily trips by bike.11
With adaptations to bicycles and riding technique, people with disabilities can also realise the benefits of improved and more readily available cycling infrastructure. For people with disabilities, cycling can be a great opportunity for exercise, mobility and the health benefits of being active that they cannot get as easily elsewhere.12
10 Aldred R2 2014 Benefits of Investing in Cycling, British Cycling http://www.britishcycling.org.uk/zuvvi/media/bc_files/campaigning/BENEFITS_OF_INVESTING_IN_CYCLING_DIGI_FINAL.pdf
11 Green Lane Project, 2014 in Aldred, R. 2014 Benefits of Investing in Cycling, British Cycling
12 Somerset County Council Cycling with Disabilities Health Problems, retrieved from http://movingsomersetforward.co.uk/cycling/cycling-all/cycling-disabilities
More people cycling also leads to cleaner air in towns and cities. Motor vehicles produce exhaust gases and fine particles that can affect human health by irritating eyes, throat and lungs, contributing to chronic disease and aggravating respiratory conditions such as asthma and bronchitis.13 The smell of exhaust fumes in town and city centres isn’t pleasant either. Commuting by bike is a clean mode of transport, with no air pollutants produced.
Cycling improves social connection in towns and cities. With some people more likely to be able to access recreational opportunities, and streets having a more pleasant ambience for spending time in, people are more likely to meet each other. Streets with lower levels of traffic are popular with people on bikes and on foot, and facilitate people being more likely to make friends with their neighbours and spend more time on their streets.14 Social isolation is therefore likely to be reduced.
13 Weichenthal et al., 2011 Traffic-related air pollution and acute changes in heart rate variability and respiratory function in urban cyclists, Environmental Health Perspectives, 119(10): 1373-1378
14 Hart, J. and Parkhurst, G. 2011 Driven to excess: Impacts of motor vehicles on the quality of life of residents of three streets in Bristol, UK, World Transport Policy and Practice, 17(2): 12-30
http://www.britishcycling.org.uk/zuvvi/media/bc_files/campaigning/BENEFITS_OF_INVESTING_IN_CYCLING_D
http://www.britishcycling.org.uk/zuvvi/media/bc_files/campaigning/BENEFITS_OF_INVESTING_IN_CYCLING_D

8 |
Getting just a few people onto bikes can15 make a difference to traffic flows. On the congested 5km Petone to Ngauranga section of State Highway 2, for example, research suggests that only 10-30 vehicles out of the 250-280 vehicles occupying the space at congested times are causing the congestion.16 Evaluation of Hastings’ iWay cycling network indicates there was a 3.6 percent reduction in traffic volumes soon after it was built.17
Additionally, cycling can be faster than driving.
15 From Australian Bicycle Council, National Cycling Strategy 2011-2016: Gearing up for active and sustainable communities, Austroads, p.8.
16 Money, C., The Importance of Making Best Use of Existing Networks in Promoting Productivity, Hyder Consulting (NZ) Ltd, 2009.
17 New Zealand Transport Agency, The Walking and Cycling Model Community Story with New Plymouth & Hastings, 2013, https://www.nzta.govt.nz/assets/Walking-Cycling-and-Public-Transport/docs/model-community-story-single.pdf
Many people tend to overestimate travel times by bicycle, and when travel time is measured door to door, it can often be quicker on a bicycle than by motor vehicle (including distances up to 5km where roads are congested).18 Fifty-six percent of Copenhagen bike riders surveyed say that cycling is the fastest mode of transport for their purposes.19
Where there is good cycling infrastructure, people who drive will feel more comfortable driving near people who cycle. A 2013 study in San Francisco found that whether or not they rode bikes themselves, over 80 percent of drivers felt moderately or very comfortable
18 From Australian Bicycle Council, National Cycling Strategy 2011-2016: Gearing up for active and sustainable communities, Austroads, p.8.
19 Copenhagen City of Cyclists, Bicycle Account 2012, www.kk.dk/cityofcyclists
Cycling makes travelling around urban areas better for everyoneMore people cycling potentially improves traffic flow so travel times are shorter, more predictable and reliable, and the transport network performs better. Bicycles are considered to impose 95 percent less impact on travel flow than an average car.

| 9
when driving near bikes with a protected bike lane.20 Only half of the drivers in the study said they felt comfortable on roads without cycling infrastructure.
More people cycling may also make roads a lot safer. There is evidence that more people cycling may reduce the rate of risk of serious injury and fatality per bike rider from accidents involving motor vehicles. This is called the ‘safety in numbers’ phenomenon21 and is due to factors like:
• greater expectation amongst drivers that bike riders will be present
• greater awareness of bike riders who are present
• more drivers knowing what it is like to be on a bicycle and behaving more safely around them, and
• drivers’ attitudes improving towards people who ride bikes.
20 Sanders and Cooper 2013 Do all roadway users want the same things? Transportation Research Record 2393, 155-63—163: http://docs.trb.org/prp/13-4475.pdf
21 European Cyclists Federation Factsheet – Safety in Numbers: http://www.ecf.com/wp-content/uploads/ECF_FACTSHEET4_V3_cterree_SafetyNumb.pdf
In countries such as Denmark, Germany, and the Netherlands, where cycle networks are well established, more people cycle and there is a significantly lower fatality risk for bike riders. In New Zealand, a Canterbury University study found that the installation of simple painted cycle lanes along monitored streets resulted in an average 23 percent reduction in cycle crash rates.22
A reduction in serious injuries and fatalities to car occupants and pedestrians could also be expected with reduced car use due to fewer cars being on the road.
• Hastings demonstrates the value of good cycling infrastructure. Cycle crash rates there fell to about one-third of what they were in only two years, despite an approximately 20 percent increase in cycling after a network of cycleways was built.23
22 Parsons, James and Glen Koorey, ‘The Effect of Cycle Lanes on Cycle Numbers and Safety’, Conference paper for IPENZ Transportation Conference, Dunedin, 2013.
23 New Zealand Transport Agency, The Walking and Cycling Model Community Story with New Plymouth & Hastings, 2013, https://www.nzta.govt.nz/assets/Walking-Cycling-and-Public-Transport/docs/model-community-story-single.pdf

10 |
• For a 2.2km trip from the Mt Cook suburb of Wellington into the CBD, a person can save $472.24 per year when cycling instead of making the trip by car, based on three trips back and forth per week.24. This excludes parking costs, which could add very significantly to this figure.
Cycling potentially also boosts retail spend. Various studies have shown that cycling infrastructure can lead to an increase in retail sales.25 People who cycle have been found to be more likely to stop and visit shops more often, and to spend more money at those shops over time, than people who drive.26 Cycleways that run past shop doors can be a very good thing for retailers.
• Four and a half years after the implementation of bike lanes in a retail area of San Francisco, 66 percent of merchants believed that the bike lanes had had a generally positive impact on their business and/or sales.27
• Similarly, when Salt Lake City removed a third of car parks from nine blocks of a main shopping street and improved footpaths and
24 Based on AA’s cost of running a medium sized car in 2013 at 78.8 cents/km and cycling costs of 10 cents/km in 2015: http://www.aa.co.nz/assets/site-information/running-costs/2013-Petrol-Running-Costs.pdf and http://www.journeyplanner.org.nz/
25 Citylab – the complete business case for converting street parking into bike lanes: http://www.citylab.com/cityfixer/2015/03/the-complete-business-case-for-converting-street-parking-into-bike-lanes/387595/
26 Clifton, K.J., Muhs, C.D., Morrissey, S., Morrisey, T. and Currans, K.M. 2013 Examining Consumer Behaviour and Travel Choices, Civil and Environmental Engineering Faculty Publications and Presentations, Paper 145, http://pdxscholar.library.pdx.edu/cengin_fac/145
27 Drennen, E. 2003 Economic effects of traffic calming on urban small businesses, Department of Public Administration, San Francisco State University, San Francisco.
added bike lanes, retail sales increased by 8.8 percent in the first six months.28
• Retailers often overestimate the number of people who have driven to their stores. A study from Wellington, New Zealand showed that only 6 percent of shoppers on Tory Street were using the car parks along that street.29 Retailers also overestimate the contribution of car parks to their business. An Australian study found that switching one car park to six bike parking spaces could create an increase in retail spend related to that space, from $27 per hour to $97.20 per hour.30
Good cycling infrastructure also attracts people to visit. Reports from Hastings indicate that visitors are being attracted to the area because of its cycling opportunities and many local businesses are reporting significant growth. More bike-friendly towns and cities would also encourage visitors from the New Zealand Cycle Trail, who spend money in local communities.
28 Salt Lake City Division of Transportation 2015 300 South Progress Report: https://drive.google.com/file/d/0B8tOk7_upXv5djhCajg1Z0I3bmhTVTIxWldwRzA0YjJWNW9R/view
29 Beetham, J. 2014 Re-Cycling the Streets: Exploring the Allocation of Public Space for Transport, Masters Thesis
30 Lee, J. 2008 What is the economic contribution of cyclists compared to car drivers in inner suburban Melbourne’s shopping strips? Masters Thesis
Cycling is great for the local economyCycling saves people money to spend in their local communities. With no fuel, registration, warrant of fitness and parking costs, and much lower purchasing, maintenance and insurance costs compared to operating a car, people who cycle have more money to spend on other things.

| 11
12 |
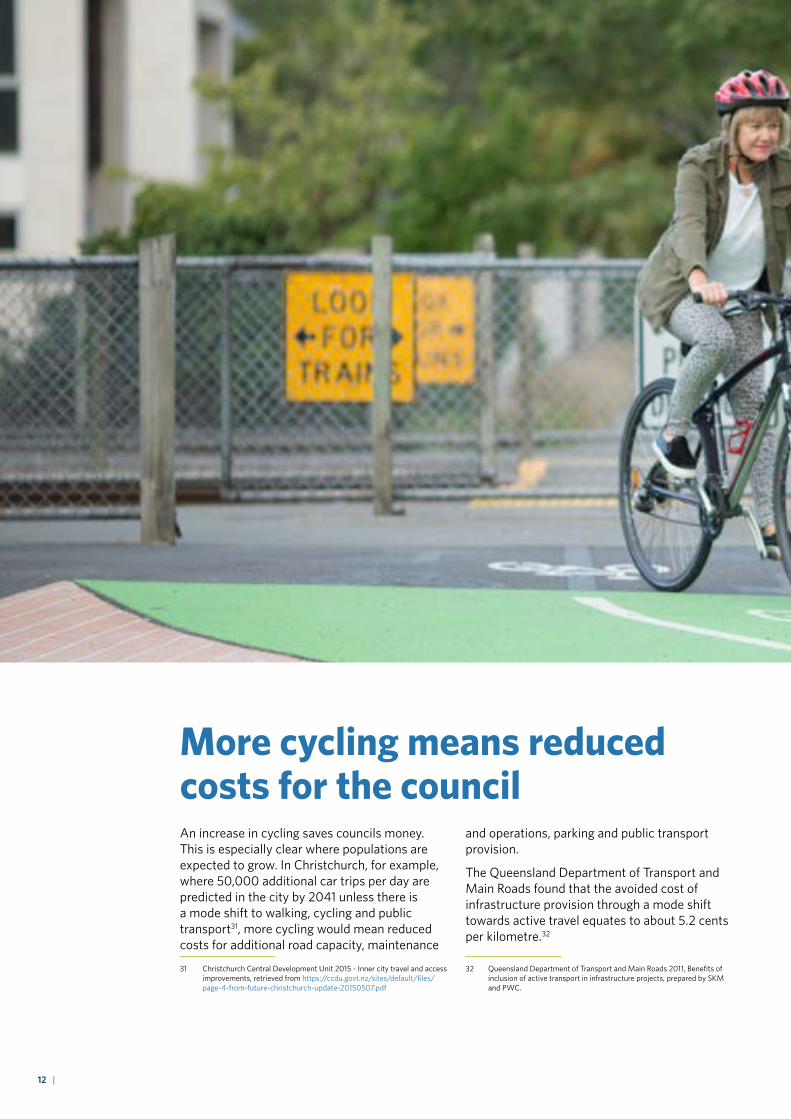
More cycling means reduced costs for the councilAn increase in cycling saves councils money. This is especially clear where populations are expected to grow. In Christchurch, for example, where 50,000 additional car trips per day are predicted in the city by 2041 unless there is a mode shift to walking, cycling and public transport31, more cycling would mean reduced costs for additional road capacity, maintenance
31 Christchurch Central Development Unit 2015 - Inner city travel and access improvements, retrieved from https://ccdu.govt.nz/sites/default/files/page-4-from-future-christchurch-update-20150507.pdf
and operations, parking and public transport provision.
The Queensland Department of Transport and Main Roads found that the avoided cost of infrastructure provision through a mode shift towards active travel equates to about 5.2 cents per kilometre.32
32 Queensland Department of Transport and Main Roads 2011, Benefits of inclusion of active transport in infrastructure projects, prepared by SKM and PWC.

| 13
Cycling is great for the environment overallA small reduction in short vehicle trips potentially generates significant reduction in carbon emissions. Shifting 5 percent of car trips to bicycle could reduce emission impacts by up to 8 percent.33 Similarly, reducing trips by car can reduce the amount of other air pollutants.
33 Australian Bicycle Council, National Cycling Strategy 2011-2016: Gearing up for active and sustainable communities, Austroads, p.9.
The Queensland Department of Transport and Main Roads found that: “The combined environmental benefits of reducing noise and greenhouse gas emissions, and improving air quality, equates to around 5.9 cents per kilometre walked or cycled”.34
34 Queensland Department of Transport and Main Roads 2011, Benefits of inclusion of active transport in infrastructure projects, prepared by SKM and PWC, Table EX.1: Benefits summary.

14 |
Cycling makes people healthier and more productiveCycling reduces the incidence of a range of serious illnesses.Regular aerobic exercise is known to cut the risk of heart disease, type-two diabetes, all types of cancer, high blood pressure and obesity35, and evidence shows that New Zealand communities with higher numbers of people cycling and walking, especially for transport purposes, have better health profiles than those in less active neighbourhoods36.
In New Zealand, physical inactivity contributes to around 8 percent of all deaths37, and one in three adults and one in five children are overweight38. The Ministry of Health reports
35 World Health Organisation 2002 A Physically Active Life through Everyday Transport, Copenhagen, Demark.
36 Genter, J.A., Donovan, S. and Petrenas, B. 2008 Valuing the health benefits of active transport modes, NZTA Research Report 35
37 National Health Committee 2002 New Zealand Evidence for Health Impacts of Transport http://nhc.health.govt.nz/system/files/documents/publications/health-impact-transport-phac.pdf
38 Ministry of Health Obesity data and stats: http://www.health.govt.nz/nz-health-statistics/health-statistics-and-data-sets/obesity-data-and-stat
that only 50.5 percent of New Zealand adults are regarded as sufficiently active for health benefits39 and physical inactivity is the second leading risk factor of disability adjusted life years.
Studies by the British Heart Foundation say cycling just 32 km per week reduces the risk of heart disease to less than half, compared to people who don’t exercise. A study for British Cycling found that if people in urban England and Wales cycled and walked as much as people do in Copenhagen, the National Health Service could save around £17 billion within 20 years.40
39 Ministry of Health. 2008. A portrait of health: Key results of the 2006/07 Health Survey. Wellington: Ministry of Health. Cited in Genter J.A., Donovan, S., Petrenas, B., and Badland, H. 2008. Valuing the health benefits of active transport modes, NZ Transport Agency Research Report 359.
40 Aldred R, ‘Benefits of Investing in Cycling’, British Cycling, http://www.britishcycling.org.uk/zuvvi/media/bc_files/campaigning/BENEFITS_OF_INVESTING_IN_CYCLING_DIGI_FINAL.pdf
http://www.health.govt.nz/nz-health-statistics/health-statistics-and-data-sets/obesity-data-and-stat
http://www.health.govt.nz/nz-health-statistics/health-statistics-and-data-sets/obesity-data-and-stat
http://www.britishcycling.org.uk/zuvvi/media/bc_files/campaigning/BENEFITS_OF_INVESTING_IN_CYCLING_D

| 15
Two large Copenhagen studies cited by the World Health Organisation found that people who regularly commuted by bicycle for three hours per week had 28 percent less chance of dying of any cause compared to people who didn’t commute by bicycle.41
Cycling helps children concentrate at school. A Danish study found that children who bike or walk to school have greater concentration than those who are driven.42
Cycling also helps people have fewer sick days. A University of North Carolina study found that people who cycle for 30 minutes, five times per week, took less sick days than their peers.43
41 World Health Organization, Health economic assessment tools (HEAT) for walking and cycling: Methods and user guide, 2014 update, Economic Assessment of Transport Infrastructure and Policies, WHO, 2014.
42 Science Nordic 2012 Children who walk to school concentrate better, retrieved from http://sciencenordic.com/children-who-walk-school-concentrate-better
43 Nieman, D.C., Henson, D.A., Austin, M.D. and Sha, W. 2011 Upper respiratory tract infection is reduced in physically fit and active adults, British journal of sports medicine, 45(12): 987-992.

CycleLife15-314 March 16


![[What is Acceptable Risk in Cycling Infrastructure?]conf.tac-atc.ca/english/resourcecentre/readingroom/... · 2018-02-13 · [What is Acceptable Risk in Cycling Infrastructure?] Forbes](https://static.fdocuments.net/doc/165x107/5ed4fc95f7d20c4b401f6c4e/what-is-acceptable-risk-in-cycling-infrastructureconftac-atccaenglishresourcecentrereadingroom.jpg)

