Benefit-Cost Analysis of Integrating Trailers into Heavy ...
35
www.theicct.org JULY 2014 WHITE PAPER [email protected] BEIJING | BERLIN | BRUSSELS | SAN FRANCISCO | WASHINGTON BENEFIT-COST ANALYSIS OF INTEGRATING TRAILERS INTO HEAVY-DUTY VEHICLE EFFICIENCY REGULATION BEN SHARPE, OSCAR DELGADO, AND NIC LUTSEY
Transcript of Benefit-Cost Analysis of Integrating Trailers into Heavy ...

www.theicct.org
JULY 2014WHITE PAPER
BEIJING | BERLIN | BRUSSELS | SAN FRANCISCO | WASHINGTON
BENEFIT-COST ANALYSIS OF INTEGRATING TRAILERS INTO HEAVY-DUTY VEHICLE EFFICIENCY REGULATION BEN SHARPE, OSCAR DELGADO, AND NIC LUTSEY

ACKNOWLEDGEMENTSThis work is funded by the ClimateWorks Foundation. The author is grateful for the careful review of Wabash National Corporation, SmartTruck Systems, the U.S. Environ-mental Protection Agency, the California Air Resources Board, the Union of Concerned Scientists, the American Council for an Energy Efficient Economy, and the Environmen-tal Defense Fund. Previous and ongoing collaborations with the North American Council for Freight Efficiency and Pollution Probe are acknowledged as well. In addition, the contributions of Rachel Muncrief, Fanta Kamakaté, and Drew Kodjak of the ICCT were incredibly valuable.
© 2014 International Council on Clean Transportation
1225 I Street NW, Suite 900, Washington DC 20005
www.theicct.org | [email protected]

i
TABLE OF CONTENTS
Executive Summary ................................................................................................................... ii
1 Introduction .............................................................................................................................1
2 Methods .................................................................................................................................. 2
2.1 Trailer classification and population growth .......................................................................... 2
2.1 Model description, data, and key inputs ..................................................................................4
2.1 Aerodynamic binning approach for box trailers ................................................................. 8
2.1 Tire rolling resistance binning approach ..................................................................................11
3 Analysis ..................................................................................................................................13
3.1 Analysis of tractor-trailer efficiency increases .....................................................................13
3.1 Fleet scenario descriptions ..........................................................................................................15
4 Results ...................................................................................................................................21
4.1 Fuel consumption and CO2 emissions .....................................................................................21
4.1 Costs and benefits .........................................................................................................................22
4.1 Summary of scenario results ......................................................................................................25
5 Conclusions and future work .............................................................................................27
References ................................................................................................................................29

ii
ICCT WHITE PAPER
EXECUTIVE SUMMARY
The regulatory agencies of the United States are deliberating on a second phase of regulations to increase the efficiency of heavy-duty vehicles. Among the most substantial policy questions in the rulemaking regards whether trailers of Class 7 and 8 combination tractor-trailers will be regulated and, if so, how. That decision hinges on the technology availability, the associated costs, and the associated benefits of regulating trailers. This assessment seeks to inform on these questions.
This work synthesizes data from multiple sources to provide a novel analysis of the benefits and costs of integrating trailers with the U.S. Phase 2 regulatory standards for heavy-duty vehicles in the time frame of 2020 and beyond. This paper builds on recent ICCT research on the integration of commercial trailers into the regulations of heavy-duty vehicle fuel consumption and greenhouse gas (GHG) emissions. In particular, the analysis utilizes data from a survey of technology suppliers and tractor-trailer fleets, data on the segmentation of the trailer market, and projections for the deployment of aerodynamic side skirts and low-rolling-resistance (LRR) tires. The analysis develops a trailer stock turnover model by equipment type (e.g., dry van, refrigerated, etc.) to analyze the incremental costs, fuel-saving benefits, and GHG benefits from increased deployment of trailer technologies.
The findings indicate that the Phase 2 regulation presents an opportunity to capture substantial and highly cost-effective efficiency gains offered by trailer technology improvements. In our analysis, we considered three options for increased technology penetration in new trailers beyond reference adoption of aerodynamic device and tire technology adoption. Table ES-1 summarizes the results from the work. The “advanced technology” scenario, which represents the highest penetration of advanced trailer efficiency packages examined here, indicates that there is the potential for GHG emis-sion savings of up to 19 million metric tons of CO2 and oil savings of 149 million barrels per year in 2040. This penetration of advanced trailer technologies results in an 11-to-1 benefit-to-cost ratio (assuming a 3% discount rate) and an average payback period of roughly two years for end users.

iii
INTEGRATING TRAILERS INTO HDV REGULATION: BENEFIT-COST ANALYSIS
Table ES-1. Summary findings on scenarios for increased trailer efficiency technology
Scenario
Penetration of advanced trailer technology packages in 2030
Average percent fuel savings in new MY
2030 tractor-trailers
Average payback period#
Benefit-cost
ratio#
Energy savings in
2040 (million bbl/year oil equivalent^)
GHG benefit in 2040
(million tons CO2/year)
53-foot box
trailers*
24- to 52-foot box trailers*
Non-box trailers**
All trailers
53-foot box
trailersAll
trailersAll
trailers All trailers All trailers
Reference 10% 5% 10% - - - - - -
Low technology 30% 10% 85% 4% 4% 2-3 years 10.8:1 72 9
Moderate technology 55% 10% 90% 5% 6% ~2 years 11.3:1 107 13
Advanced technology 85% 45% 95% 8% 10% ~2 years 11.3:1 161 20
* For box trailers, these percentages represent new trailers with Bin IV and V aerodynamic technology packages, Bin I or II low rolling resistance (LRR) tires, and automatic tire inflation systems (AIS).
** For non-box trailers, these are the percentages of new trailers with Bin I or II LRR tires and AIS. # Assumes U.S. EIA 2014 Annual Energy Outlook reference case fuel prices, 3% discount rate.^ The million barrels per year of oil equivalent unit is calculated by using the average yield for U.S. refineries: on average, 1 barrel of crude oil
produces 12.4 gallons of diesel, among other fuels (U.S. Energy Information Administration, 2014).
These paper’s findings point toward a Phase 2 heavy-duty vehicle regulatory program for the United States and Canada that more comprehensively promotes these known cost-effective trailer technologies. The ICCT recommends integration of trailers into the Phase 2 U.S. heavy-duty vehicle regulatory program, with emphasis on box trailers but inclusion of other types as well. To date, we have seen the success of the U.S. Environmental Protection Agency (EPA) SmartWay program, as well as California’s tractor-trailer GHG regulation, in driving trailer technology development, technology cost reductions, and increasing adoption of trailer technology. The regulatory approach recommended offers a natural extension of the same policy principles but would deliver much wider fleet fuel savings and reduction of carbon emissions.

1
ICCT WHITE PAPER
1 INTRODUCTION
The regulatory agencies of the United States are deliberating on a second phase of regulations to increase the efficiency of heavy-duty vehicles. Among the most substan-tial policy questions in the rulemaking is in regard to whether and how trailers of Class 7 and 8 combination tractor-trailers will be regulated. That decision hinges on the technol-ogy availability, the associated costs, and the associated benefits of regulating trailers. This assessment seeks to inform on these questions.
This paper builds on recent ICCT research on the integration of commercial trailers into Phase 2 of the U.S. heavy-duty vehicle fuel efficiency and GHG regulation. In the final Phase 1 regulation for heavy-duty vehicles, the U.S. EPA and the National Highway Traffic Safety Administration (NHTSA) acknowledged that there are substantial, cost-effective fuel savings and GHG emission reductions to be achieved by regulating trailers. However, a rigorous quantification of the costs and benefits of regulating trailers has not been conducted, and trailers were omitted from the initial Phase 1 heavy-duty vehicle regulation.
This paper quantifies the cost and benefit impacts of integrating trailers into the Phase 2 fuel efficiency and GHG regulations for heavy-duty vehicles. The paper therefore builds upon the analysis of a previous assessment that considered various options for bringing trailers into the regulatory program (see (Sharpe 2014). That report proposed a framework for classifying trailers into three main categories: dry vans, refrigerated trailers, and all other trailer types. In addition, it presented a strategy for trailer aerody-namic certification that closely mirrors the approach taken for tractors and leverages the experiences of the Phase 1 regulatory development process.
The scope of this study is intentionally confined to assessing the costs and benefits to trucking fleets, as well as society as a whole, of different regulatory options for increas-ing trailer efficiency. For a broader analysis of trailer technologies, market conditions, and policy considerations, interested readers can reference this paper’s companion ICCT reports (Sharpe, Clark et al. 2013; Committee on Assessment of Technologies and Approaches for Reducing the Fuel Consumption of Medium- and Heavy-Duty Vehicles - Phase Two 2014; Sharpe 2014; Sharpe and Roeth 2014).
This analysis explores the costs and benefits of various regulatory scenarios for the trailer fleet in the United States based on the synthesis of numerous data sources and the development of a trailer stock turnover model that incorporates changing technology over time. The paper begins by providing a detailed description of the data, assumptions, and methodology employed in the analytical model that was developed to investigate regulatory scenarios for trailers. The subsequent section presents fuel sav-ings, GHG reduction, and net monetary benefit summaries for each of the scenarios and discusses implications for the integration of trailers into the Phase 2 regulation. The final conclusion section summarizes the results of this analysis and points to future work that the agencies and other stakeholders should prioritize over the next one to two years to fill research gaps in this area and help establish a regulatory program that best promotes cost-effective fuel-saving technologies across all trailer categories.

2
INTEGRATING TRAILERS INTO HDV REGULATION: BENEFIT-COST ANALYSIS
2 METHODS
Based on the synthesis of numerous data sources on trailer segmentation, trailer aero-dynamic and tire technologies, and trailer vehicle lifetime characteristics, a trailer fleet “stock turnover” model was developed. The model, which incorporates and quantifies the effects of changing trailer technology over time, forms the foundation of this study. The following section provides information about the data, assumptions, and methods used in the model.
2.1 TRAILER CLASSIFICATION AND POPULATION GROWTH
For this work, the trailer fleet is segmented into three main regulatory categories: dry vans, refrigerated trailers, and a catch-all category for all non-box trailer types. The rationale behind this classification structure is to promote aerodynamic and lightweight-ing improvements in box trailers (both dry and refrigerated). In contrast to non-box trailers, it is much more straightforward to determine baseline aerodynamic and curb weight characteristics for box trailers, given the wealth of testing data readily available in the literature and through the SmartWay program. For tire-based improvements, there do not seem to be any strong technical barriers to creating standards for all trailer types that stimulate accelerated adoption of technologies such as LRR tires and automatic tire inflation systems.
An additional parameter we utilize to further subdivide trailers is length. Categorization by length allows further refinement in setting applicable technology targets, since the fuel consumption reduction potential and expectations for aerodynamic technology uptake are not necessarily uniform across the various trailer lengths. In this analysis, dry and refrigerated box trailers are divided into two length subcategories: 24 to 52 feet and 53 feet or longer. This division is somewhat arbitrary, and a more complete analysis to determine the most appropriate approach for categorizing trailer length is an important area in which more in-depth research should be done, so that regulation can more effectively promote fuel-saving trailer technologies. For non-box trailers, because improvements in tire performance are not directly dependent on the length of the trailer, categorization by length would not likely yield much marginal benefit.
As a final way of segmenting the trailer fleet, this analysis estimates trailer sales by “large” or “small” manufacturers. As defined by the U.S. Small Business Administration, a trailer manufacturer is a “small business” if the company employs fewer than 500 people (U.S. Small Business Administration 2014). According to the U.S. Census Bureau, there are roughly 400 companies engaged in “truck trailer manufacturing,” and of these, only five companies employ more than 500 people and thus are not considered small busi-nesses (U.S. Census Bureau 2012). Because a regulation affecting trailer manufacturers would affect a large number of small businesses, the Small Business Regulatory Enforce-ment Fairness Act (SBREFA) stipulates that the EPA must convene a formal Small Business Advocacy Review panel to review regulatory options, flexibility mechanisms, and impacts to small trailer manufacturers prior to publishing the proposed regulation. In order to assess what effect the unique regulatory provisions for small businesses might have on the overall environmental and economic impacts of the rule, this analysis breaks out trailer sales in each year by large or small manufacturers.
Altogether, as Figure 1 shows, the trailer fleet in the analytical model is broken down according to trailer type, length (for dry and refrigerated box trailers only), and manu-

3
ICCT WHITE PAPER
facturer size. This leads to 10 total categories for which unique regulatory provisions can be created in the model. Data from IHS (formerly R.L. Polk & Co.), which segments trailer sales by type, length, and manufacturer, was paired with data from the Trailer Body Builders Web site (trailer-bodybuilders.com) to create a trailer stock turnover model according to the 10 categories (R.L Polk & Co. 2012; Trailer-bodybuilders.com 2014). As shown, large manufactures make up nearly two-thirds of overall sales, with small manu-facturers accounting for the remaining one-third. Dry vans and refrigerated (“reefer”) trailers from large and small manufacturers combine to account for just over two-thirds of the market. For non-box trailers, small manufacturers are responsible for the majority of sales, at roughly 80% of that segment.
All trailers
SmallOEMs34%
Box trailers6%
Dry vans6%
24-52 ft.3%
≥ 53 ft.3%
Reefers0.2%
24-52 ft.0.1%
≥ 53 ft.0.1%
Non-boxtrailers
28%
LargeOEMs66%
Box trailers61%
Dry vans58%
24-52 ft.24%
≥ 53 ft.33%
Reefers3%
24-52 ft.1%
≥ 53 ft.2%
Non-boxtrailers
5%
Figure 1. Estimated breakdown by trailer type, length, and large or small manufacturer for the entire study period
Total trailer sales in 2013 were estimated using data from Trailer Body Builders, which has annual production figures going back to 1997. In addition, IHS/Polk data for total annual registration data from 1986 to 2011 were used. If we take annual production/reg-istration as a proxy for annual sales, these two sources provide a reasonable approxima-tion of the market for nearly three decades. Looking at Figure 2, the two data sets show reasonable congruence for the 15 years for which data was available from both sources. Total sales for 2014, the starting year in the study, are assumed to be identical to 2013 production, which is based on expert projections that 2014 sales will be similar to those in 2013 (Trailer-bodybuilders.com 2014). The breakdown of sales into the 10 categories (by type, length, and large/small manufacturer) is based on 2011 data and is shown in the boxes with white striping shown in Figure 1. This trailer breakdown by category is held constant over the entire study period from 2014 to 2050.

4
INTEGRATING TRAILERS INTO HDV REGULATION: BENEFIT-COST ANALYSIS
0
50,000
100,000
150,000
200,000
250,000
300,000
350,000
1997 1999 2001 2003 2005 2007 2009 2011
Ann
ual t
raile
r p
rod
ucti
on
Trailer Body Builder data IHS/Polk data
Figure 2. Total trailer annual production (Trailer Body Builders) and registration (IHS/Polk) data in the U.S.: 1997 – 2011
2.1 MODEL DESCRIPTION, DATA, AND KEY INPUTS
The model is a spreadsheet tool that uses user inputs to control parameters such as trailer population growth over time, annual vehicles miles traveled (VMT), and the rate of technology adoption. All of the key data and inputs used in this study are given in Table 1. Total trailer sales in 2014 are estimated to be approximately 245,000 based on 2013 data (Trailer-bodybuilders.com 2014), and the average annual increase in sales of 1.9% is taken as identical to the average annual growth rate between 2014 and 2050 that was estimated for tractors in the Phase 1 regulation (see Table 7-9 in (U.S. Environmental Protection Agency 2011). This assumption is based on historical data from 1986 to 2011 (see Figure 3), which shows that total sales of tractors and commercial trailers track each other fairly closely (R.L Polk & Co. 2012).

5
ICCT WHITE PAPER
0
50,000
100,000
150,000
200,000
250,000
300,000
350,000
1986 1991 1996 2001 2006 2011
Ann
ual r
egis
trat
ions
Class 8 tractors Commercial trailers
Figure 3. Total annual registrations of Class 8 tractors and 24-65-foot commercial trailers in the U.S.: 1986–2011
The percent survival rate by age for all trailer types is estimated based on information from interviews with trucking fleets indicating that, on average, trailers tend to have longer useful lives than tractor trucks (Sharpe and Roeth 2014). The Motor Vehicle Emissions Simulator (MOVES) is the official on-road mobile source inventory model of the U.S. EPA that was used by the agency to estimate the fuel consumption and emis-sions associated with the Phase 1 regulation (U.S. Environmental Protection Agency, 2011c). The survival rate for tractors from MOVES and the estimated trailer values are shown in Figure 4. Due to the lack of available data, the survival rate values for trailers are assumed to be identical to those for tractors. Based on expert review, this assump-tion is reasonable, though it is clear that trailer survival rates are an important area for future research.

6
INTEGRATING TRAILERS INTO HDV REGULATION: BENEFIT-COST ANALYSIS
0%
10%
20%
30%
40%
50%
60%
70%
80%
90%
100%
1 3 5 7 9 11 13 15 17 19 21 23 25 27 29
Per
cent
of
year
1 v
alue
Tractor VMT Tractor survival (MOVES) Trailer survival
Figure 4. Survival rates and VMT decline by age for tractors and trailers
In the MOVES model, VMT declines as a vehicle ages. For tractors, this decline is fairly drastic, which is meant to represent the real-world in which tractors tend to put the majority of their lifetime miles in the first four to seven years (Boriboonsomsin, Sheckler et al. 2012). The lifetime miles for a combination tractor are given in Table 2-28 in the Regulatory Impact Analysis (RIA) for the Phase 1 GHG regulation (U.S. Environmental Protection Agency 2011) and are shown in percentage terms in Figure 4. For trailers, there are currently knowledge gaps regarding initial annual VMT, how VMT differs between trailer types, and how VMT may decline over time. From the Vehicle Inventory and Use Survey, or VIUS (U.S. Census Bureau 2004), which has data for 2002, average annual VMT is estimated to be 26,652 miles for dry van trailers, 29,740 miles for refriger-ated trailers, and 31,636 miles for non-box trailers (see Table 3a in the 2002 VIUS study for the United States). VMT for each tractor-trailer category in 2002 is calculated by dividing total tractor miles by total tractor population. To calculate the average annual VMT for each type of trailer (17 trailer types are included in the “Truck-tractors” section), we assumed a trailer-to-tractor ratio of 3 for dry and refrigerated trailers and 1.5 for non-box trailers based on IHS/Polk data and interviews with trucking fleets (R.L Polk & Co. 2012; Sharpe and Roeth 2014). For each of the three primary trailer categories, we estimate Year 1 VMT and a rate of activity decline such that VMT in year 30 is 20% of the value in Year 1. Assuming Year 1 VMT of 42,000 miles for dry van, 46,000 miles for refrigerated, and 50,000 miles for non-box trailers, the assumed rate of VMT decline results in average annual VMT of 26,895, 29,457, and 32,018 miles. These resulting aver-age annual VMT values are reasonably close to the VMT derived from the VIUS report.
The end user costs estimated in the model are fuel costs and the incremental cost of fuel-saving trailer technologies. Fuel retail prices (i.e., the price at the pump for trucking companies) are taken from the Energy Information Administration (EIA) 2014 Energy Outlook (U.S. Energy Information Administration 2014). The EIA’s latest projections out to 2040 show an average annual increase in real prices of diesel fuel of 1% per year. This analysis assumes a 1% annual increase in fuel prices for the entire study period.

7
ICCT WHITE PAPER
Current cost for trailer aerodynamic and tire technologies are based on interviews with trucking fleets, trailer original equipment manufacturers (OEMs), and component suppliers (Committee on Assessment of Technologies and Approaches for Reducing the Fuel Consumption of Medium- and Heavy-Duty Vehicles - Phase Two 2014; Sharpe and Roeth 2014). These costs are discussed further in the following section. To estimate how technology costs will decrease over time due to economies of scale and learning effects, this analysis follows the methodology employed by the agencies in their assessment of costs for the Phase 1 HDV regulation. In the Phase 1 RIA, the agencies describe that the initial years following the introduction of a technology are characterized by “steep,” rapid cost reductions, followed by a subsequent “flat” period where costs decrease more gently over time (U.S. Environmental Protection Agency 2011). Based on responses from industry, all technologies in this analysis are assumed to be at the beginning of the flat part of the cost reduction curve.
Table 1. Key data, assumptions, and sources
Parameter Value Sources and notes
2014 total trailer sales 244,864 Based on 2013 production values in Trailer Body Builders, 2014
Annual sales growth for all trailer categories 1.9% Assumed to be equal to the sales growth assumed
for tractors in the Phase 1 rule
Percent of surviving trailers by equipment age
Estimated using tractor truck survival rates in the U.S. EPA’s MOVES model (U.S. Environmental Protection Agency (U.S. EPA) 2011)
Year 1 VMT
Dry vans: 42,000 milesRefrigerated vans: 46,000 milesNon-box trailers: 50,000 milesSource: interviews with fleets and author’s judgment
VMT decline over time Estimated based on the VMT decline for tractors in the MOVES model and our best judgment
Model year 2017 fuel economy for all tractor-trailer types
7.3 mpg See Section 3.1
Annual reduction in fuel consumption of tractors
MY 2014-2017: 5.9%
MY 2018+: 0%
Based on sales-weighting of efficiency targets for tractors in the Phase 1 rule for each of the nine regulatory subcategories (U.S. Environmental Protection Agency, 2011)
Diesel prices over time (2013 dollars)
$3.58(2014 price; ~1% annual increase)
Reference case in 2014 EIA Annual Energy Outlook (U.S. Energy Information Administration, 2014). As a simplification, all tractors in the model are diesel-powered
Technology costs in 2014 Based on interviews with trucking fleets, ICCT, and NACFE analysis (Sharpe and Roeth, 2014)
Annual technology cost reductions over time
2014–2020: 3% per year2021–2025: 2% per year2026 and later: 1% per yearAssumes all technologies are in “flat” portion of learning curve. See chapter 9 in (U.S. Environmental Protection Agency 2011).
Real discount rate 3% See Table 9-25 in U.S. Environmental Protection Agency, 2011

8
INTEGRATING TRAILERS INTO HDV REGULATION: BENEFIT-COST ANALYSIS
2.1 AERODYNAMIC BINNING APPROACH FOR BOX TRAILERS
This analysis is based on the binning of trailers in a manner that is similar to EPA’s Phase 1 tractor bins. To mitigate the inherent uncertainty in using absolute values of the coeffi-cient of aerodynamic drag (CD) from track testing results, the EPA and NHTSA devised a binning methodology for the aerodynamic certification of tractors in the Phase 1 regula-tion. After determining a CD result from testing, a tractor model is assigned a bin number from one of five bins, and the corresponding default CD value for that bin is input into the Greenhouse Gas Emission Model (GEM), the official simulation tool used for vehicle certification for tractors and vocational vehicles. To determine the fuel consumption and GHG standards for each tractor regulatory subcategory, the agencies set target adop-tion percentages for each of the five aerodynamic bins, as well as for other technology areas such as tire rolling resistance and weight reduction.
For this analysis, we have employed a five-bin approach for categorizing levels of trailer technology adoption. An example for box-type trailers is shown in Figure 5. Bin I represents a baseline or standard configuration for a box-type trailer in which there are no additional aerodynamic features. Bin II represents a modest incremental improvement over the baseline and in this example is represented by the addition of a gap reduction device. The SmartWay program has certified certain gap reduction products to provide fuel savings of 1% or greater. Bin III represents the current SmartWay-certified trailer, which can include a side skirt, underbody technology, or rear fairing that yields roughly 4–6% in reduced fuel consumption. Bin IV trailers corresponds approximately to the use of side skirts, underbody technology, and rear fairing to achieve 7–10% in fuel savings. Bin V represents advanced aerodynamic concepts that can achieve reductions in fuel use of greater than 10%. We note that the exact granularity of the binning will require additional testing and careful consideration and will refer back to actual tractor-trailer CD tests.
Next generation rear fairing
Next generation side skirtor underbody device
Standard configuration
Bin I
Side skirt fairingor underbody device
Bin III: 4-6% fuel savings
Bin V: great than10% fuel savings
Bin II: 1-3% fuel savings
Rear fairing
Side skirt fairingor underbody device
Bin IV: 7-10% fuel savings
Gap reduction device
Figure 5. Example aerodynamic binning framework for box-type trailers based on the five-bin approach used for tractors in the Phase 1 rule. The technologies shown for each bin are merely illustrative.

9
ICCT WHITE PAPER
This five-bin approach is utilized to characterize technology penetration over time. For each model year (MY) of new sales, all box trailers are segmented into bins correspond-ing to their level of aerodynamic technology. For the period until 2020, natural market forces, as well as the impact of the California tractor-trailer GHG regulation and the U.S. EPA’s SmartWay program, are assumed to continue to drive increased adoption. These market forces and California’s regulation are incorporated as the baseline for this analy-sis. Beyond 2020, the model estimates the impact of increased technology penetration to, in essence, simulate the effect of a regulation to accelerate the adoption of trailers into the more aerodynamic bins. This is discussed in more detail in the following section.
Our analysis is based on fuel consumption reductions that correspond to improvements in tractor-trailer efficiency over time as a result of deployment of increased trailer aerodynamic and tire technologies. Both the tractor and the trailer are important inter-related factors in rigorously accounting for additional fuel consumption saving relative to trailers. As a result, we build in a tractor aerodynamic improvement that is consistent with the Phase I rulemaking. For this analysis we incorporate a 12% aerodynamic im-provement from a nominal MY 2010 tractor-trailer with a CD value of 0.73 to a CD of 0.64 for our reference MY 2017 tractor-trailer, which represents an average tractor complying with the Phase 1 standards (see Table 5 in Section 3.1). For both the MY 2010 and MY 2017 tractors, a sales-weighted CD is calculated using the CD values given for each of the nine tractor regulatory subcategories in the Phase 1 rule as well as sales estimates for the tractor market (R.L Polk & Co. 2009; U.S. Environmental Protection Agency 2011).
All trailer-related aerodynamic and tire rolling resistance improvements are incremental from a reference tractor-trailer, which is defined as a Phase 1-compliant tractor coupled with a Bin I trailer. The CD improvements from the reference MY 2017 tractor are shown in Table 2. As shown, the reference 2017 tractor with a Bin I trailer has an approximate CD of 0.64. For the most advanced trailer, Bin V at a CD of 0.48, the reduction in CD compared with Bin I is approximately 26%.
Table 2. Estimated coefficient of drag for various trailer bins
Trailer Bin I Trailer Bin II Trailer Bin III Trailer Bin IV Trailer Bin V
Reference MY 2010 tractor 0.73 0.70 0.66 0.60 0.55
Reference MY 2017 tractor 0.64 0.61 0.58 0.53 0.48
These CD values, in turn, connect to per-mile fuel consumption and CO2 reductions. Based on ICCT simulation analysis in Autonomie (UChicago Argonne LLC 2013) for a baseline tractor-trailer (i.e., a Phase 1-compliant tractor plus a Bin I trailer) traveling over the HHDDT65 drive cycle1, we find that the elasticity relationship between the CD and fuel consumption is approximately 0.47. The impact of improved aerodynamics (i.e., reduced CD value) is dependent on the assumed baseline aerodynamic performance of the tractor-trailer. In general, as the baseline CD value decreases, the marginal benefit of aerodynamic technologies diminishes. The relationship between reduced CD and reduced fuel consumption is called the return factor, and the impact of the choice of
1 The Heavy Heavy-Duty Diesel Truck (HHDDT) five-cycle driving schedule was developed by the California Air Resources Board and consists of five segments: 1) idle, 2) creep, 3) transient, 4) cruise, and 5) high-speed. The high-speed portion of the five-cycle driving schedule simulates higher speed driving and acceleration, with speeds up to 65 mph and is often referred to as the “HHDDT65” cycle.

10
INTEGRATING TRAILERS INTO HDV REGULATION: BENEFIT-COST ANALYSIS
baseline CD is shown in Figure 6. The baseline MY tractor-trailer for this analysis is 0.64, and the corresponding return factor is 0.47. Therefore, the 26% CD reduction cor-responds to the 12% fuel consumption reduction for Bin V trailer technology. For each aerodynamic bin, the assumed fuel savings are shown in Table 3. These percentages are compared to a Bin I (i.e., baseline) trailer. For Bins II through IV, the percentages in Table 3 are midpoint values from the ranges in Figure 5, and Bin V is assigned a 12% reduction in fuel use and CO2 emissions. We use these percent fuel use and CO2 reductions, but we note that these are fundamentally tied to the testing-based coefficient of drag improve-ments from a reference tractor.
0.30
0.35
0.40
0.45
0.50
0.55
0.30 0.35 0.40 0.45 0.50 0.55 0.60 0.65 0.70 0.75
Ret
urn
fact
or
(% f
uel c
ons
ump
tio
n re
duc
tio
n /%
aer
od
ynam
ic d
rag
red
ucti
on)
Figure 6. The relationship between the baseline coefficient of aerodynamic drag (CD) and the return factor for a tractor-trailer traveling over the HHDDT65 drive cycle (derived from the Autonomie model)
The incremental cost of Bin II technologies is based on the use of a gap reducer. A side skirt or underbody device typical of a current generation SmartWay technology that yields 4–5% fuel savings during verification testing defines Bin III in this analysis. Reach-ing Bin IV corresponds to the combination of a side skirt or underbody device and a rear-end technology such as a boat tail. Similar to the Phase 1 approach for tractors, Bin V is a stretch target, in the sense that the combination of next-generation aerodynamic technologies will be required to achieve this bin designation (Salari 2014). For Bins II through IV, the cost estimates in Table 3 come from interviews with various entities in the trucking industry (Sharpe and Roeth 2014), and the Bin V technology package is assumed to be 50% more costly than Bin IV based on interviews with aerodynamic technology suppliers.

11
ICCT WHITE PAPER
Table 3. Assumed reduction in fuel consumption and incremental costs (2013 dollars) for each aerodynamic bin
Bin I Bin II Bin III Bin IV Bin V
Fuel consumption reduction 0% 2% 5% 8.5% 12%
Incremental cost $0 $850 $900 $2,200 $3,300
2.1 TIRE ROLLING RESISTANCE BINNING APPROACH
To model the deployment of tire technologies, we employ a similar binning strategy as was done with aerodynamics. Again, the approach taken in this analysis mirrors the strategy employed by the EPA and NHTSA as part of the stringency setting process for the Phase 1 regulation.2
As part of the development of the Phase 1 regulation, the agencies developed bins to represent three tiers of rolling resistance values found from testing steer and drive tractor tires according to the International Standards Organization (ISO) 28580:2009 laboratory test procedure. For certification under the Phase 1 rule, tractor manufacturers are required to input the CRR values derived from this laboratory testing directly into the GEM simulation. The agencies developed target application rates for each of the three rolling resistance bins in order to inform the stringency for each of the nine tractor categories. We take an identical approach for trailer tires in our analysis.
In a testing campaign to support the Phase 1 rulemaking, the agencies included trailer tires in their test program and found that the average CRR value was 6.0 kg/metric ton. We use this value as our baseline in the analysis. For trailer tire Bins I and II, reductions in CRR of 15% and 30%, respectively, are used to roughly match the CRR reductions for Bin I and II tractor tires in the Phase 1 regulation. As with aerodynamics, we performed a parametric analysis in Autonomie over the HHDDT65 drive cycle to determine the return factor—that is, the corresponding reduced fuel consumption for every percentage reduction in CRR. As shown in Figure 7, for a baseline CRR value of 6 kg/metric ton, the resulting return factor is roughly 0.3, which means each percent reduction in CRR yields a 0.3% fuel savings.
2 However, there is an important distinction between how aerodynamics and tire rolling resistance are evaluated in the Phase 1 regulation. While in the case of aerodynamics, each tractor model is assigned a default CD value based on its based designation, for tire rolling resistance, manufacturers are responsible for inputting into the GEM simulations the exact coefficient of rolling resistance (CRR) value that is derived from laboratory testing.

12
INTEGRATING TRAILERS INTO HDV REGULATION: BENEFIT-COST ANALYSIS
0.285
0.290
0.295
0.300
0.305
0.310
0.315
0.320
0.325
5.4 5.6 5.8 6.0 6.2 6.4 6.6
Ret
urn
fact
or
(% f
uel c
ons
ump
tio
n re
duc
tio
n /%
ro
lling
res
ista
nce
red
ucti
on)
Baseline rolling resistance coefficient
Figure 7. The relationship between the baseline coefficient of rolling resistance (CRR) and the return factor for a tractor-trailer traveling over the HHDDT65 drive cycle (derived from the Autonomie model). These points represent axle-weighted CRR values for the tractor-trailer. In Autonomie, the weight distribution amongst the three axles is split as follows: steer axle = 18%; drive axle = 30%; trailer axle = 52%.
The incremental fuel savings and costs for each of the two non-baseline bins are set to be identical to the values in Table 4. These costs were estimated by taking the agencies’ average per-tire costs (see Table 2-35 in the Phase 1 RIA) and back-calculating the costs for each bin based on the application rates in Table 2-32 of that analysis.
Table 4. Trailer rolling resistance bins and values and the corresponding reduction in the coefficient of rolling resistance (CRR) and fuel consumption
Rolling resistance bin
CRR(kg/metric ton)
Percentreduction in CRR
Percentreduction in fuel
consumption
Estimated incremental cost per tire
Baseline 6.0 - - -
Bin I 5.1 15% 2.3% $31
Bin II 4.2 30% 4.7% $43
In addition to LRR tires, we apply automatic inflation systems (AIS) as part of the tire technology package. Proper tire inflation is critical to maintaining proper stress distribution in the tire, which reduces heat loss and rolling resistance. Tires with inflation pressure lower than the recommended level exhibit more sidewall flexing and tread shearing, and therefore have greater rolling resistance than a tire operating at its optimal inflation pressure.
According to a survey of trucking fleets and technology suppliers, costs of tire AIS generally range from $700 to $1,000 and yield fuel consumption reductions of ap-proximately 1% (Sharpe and Roeth 2014). In this analysis we use the mid-point cost estimate from that study of $850.

13
ICCT WHITE PAPER
3 ANALYSIS
Based on the data sources and methods described above, the new tractor-trailer fleet was analyzed over the 2014–2050 time frame. This section summarizes the analysis first in terms of the per-tractor-trailer efficiency increases.
3.1 ANALYSIS OF TRACTOR-TRAILER EFFICIENCY INCREASES
In order to estimate the fuel savings benefits of trailer technologies, it is necessary to assign per-vehicle fuel consumption values for tractors. For tractors pulling dry or refrigerated trailers 53 feet long or longer, the baseline fuel economy for MY 2017 and beyond is 7.3 miles per gallon (mpg) based on a sales-weighted average of the target values for the nine subcategories of tractors in the Phase 1 regulation (R.L Polk & Co. 2009; U.S. Environmental Protection Agency 2011). These regulatory targets (in gallons per 1,000 ton-miles) for the nine tractor categories in Phase 1 are summarized in Table 5, as are the estimated percentage of sales for each tractor segment. In this analysis, all trailer types are paired with a generic tractor that complies with the Phase 1 rule, which will be fully phased in by MY 2017. To derive the fuel consumption for the generic Phase 1 compliant tractor, the target values in Table 5 are multiplied by the corresponding market percentage in the adjacent column to result in a sales-weighted average payload-based fuel consumption. In the Phase 1 certification process, all Class 7 tractors are simulated in the GEM software tool using a 12.5-ton payload (25,000 pounds); for Class 8 tractors, a 19-ton payload (38,000 pounds) is used. Using these default payload values, we calculate a sales-weighted payload value and then fuel consumption in gallons per mile and, finally, miles per gallon.
Table 5. Tractor efficiency values for MY 2017 and beyond tractors based on the targets set in the Phase 1 heavy-duty vehicle regulation
Tractor subcategory in the Phase 1 heavy-duty vehicle regulation
Standard (gallons/1,000
ton-miles) Standard (mpg)*Percentage of
sales
Class 7 day cab low roof 10.2 5.2 0.5%
Class 7 day cab mid roof 11.3 4.7 0.5%
Class 7 day cab high roof 11.8 4.5 1%
Class 8 day cab low roof 7.8 6.7 2%
Class 8 day cab mid roof 8.4 6.3 2%
Class 8 day cab high roof 8.7 6.0 3%
Class 8 sleeper cab low roof 6.5 8.1 5%
Class 8 sleeper cab mid roof 7.2 7.3 14%
Class 8 sleeper cab high roof 7.1 7.4 74%
WEIGHTED AVERAGE 7.2 7.3
* For certification in the Phase 1 regulation, the default payload values for Class 7 and 8 tractors is 12.5 tons and 19 tons
In the model, per-tractor fuel consumption is identical across each scenario. We expect that the Phase 2 regulation and demand for increased efficiency will continue to drive improvements in tractor efficiency beyond the full phase-in of the Phase 1 regulation for tractors in MY 2017. However, because the purpose of the analysis is solely to assess the costs and benefits of regulatory options for trailers, holding the baseline

14
INTEGRATING TRAILERS INTO HDV REGULATION: BENEFIT-COST ANALYSIS
efficiency of tractors constant for tractors MY 2017 and later does not have any impact on the relative percentage differences of the scenario results.
In Figure 8, a Phase 1-compliant tractor is paired with a Bin I box trailer to yield the baseline tractor-trailer configuration for years 2017 and beyond. Each subsequent aerodynamic bin provides incremental fuel savings according to the percentages shown in the figure. These fuel savings percentages are assumed to apply to any length of box trailer. While there is much in the literature regarding the impact of aerodynamic technologies on 53-foot box trailers, much less research is available for shorter trailers (often called “pup” trailers). Determining the fuel savings of aerody-namic technologies on pup trailers and how these benefits compare with those for full-size trailers is an important area of future research. As with Figure 5, the technologies shown in Figure 8 are merely illustrative. Manufacturers are at liberty to achieve each bin certification with whatever aerodynamic technologies or combinations thereof can provide the requisite reduction in CD.
In addition to aerodynamic improvements, tire technologies contribute to tractor-trailer efficiency improvements. As summarized in Table 4, Bin I and II tires provide 3% and 5% fuel savings, respectively. Moreover, we estimate that tire AIS provide an additional 1 percentage point of fuel savings. Therefore, the addition of AIS to LRR technology results in fuel savings of 4% for Bin I tires and 6% for Bin II tires.
While shorter length box trailers have a decreased capacity for payload, often these pup trailers are paired together in tandem configuration. There is currently a lack of data for the U.S. trucking fleet to estimate the rate at which pup trailers are paired to-gether versus operated individually. Consequently, there is not sufficient data available to estimate how the average fuel consumption of tractors paired with shorter trailers (or combinations of shorter trailers) compares with that of tractors that pull 53-foot or longer box trailers. A similar data gap exists for the average fuel consumption of tractors pulling non-box trailers, which have a wide variety of shapes and configura-tions. Given the lack of data on how tractor fuel consumption differs by trailer type and length, we assign 7.3 mpg as the MY 2017 and beyond baseline fuel economy for each of the five tractor-trailer variants in the analysis.

15
ICCT WHITE PAPER
7.3 mpg (13.8 gallons/100 miles)
2% fuel savings
7.4 mpg (13.5 gallons/100 miles)
7.6 mpg (13.1 gallons/100 miles) 7.9 mpg (12.6 gallons/100 miles)
8.3 mpg (12.1 gallons/100 miles)
5% fuel savings 8.5% fuel savings
12% fuel savings
Baseline tractor-trailer
Bin IIBin I
Bin III Bin IV
Bin V
Figure 8. Fuel efficiency values and percent fuel savings for each tractor-trailer by trailer bin designation (does not include the efficiency improvements due to tire technologies). The technologies shown for each bin are merely illustrative.
3.1 FLEET SCENARIO DESCRIPTIONS
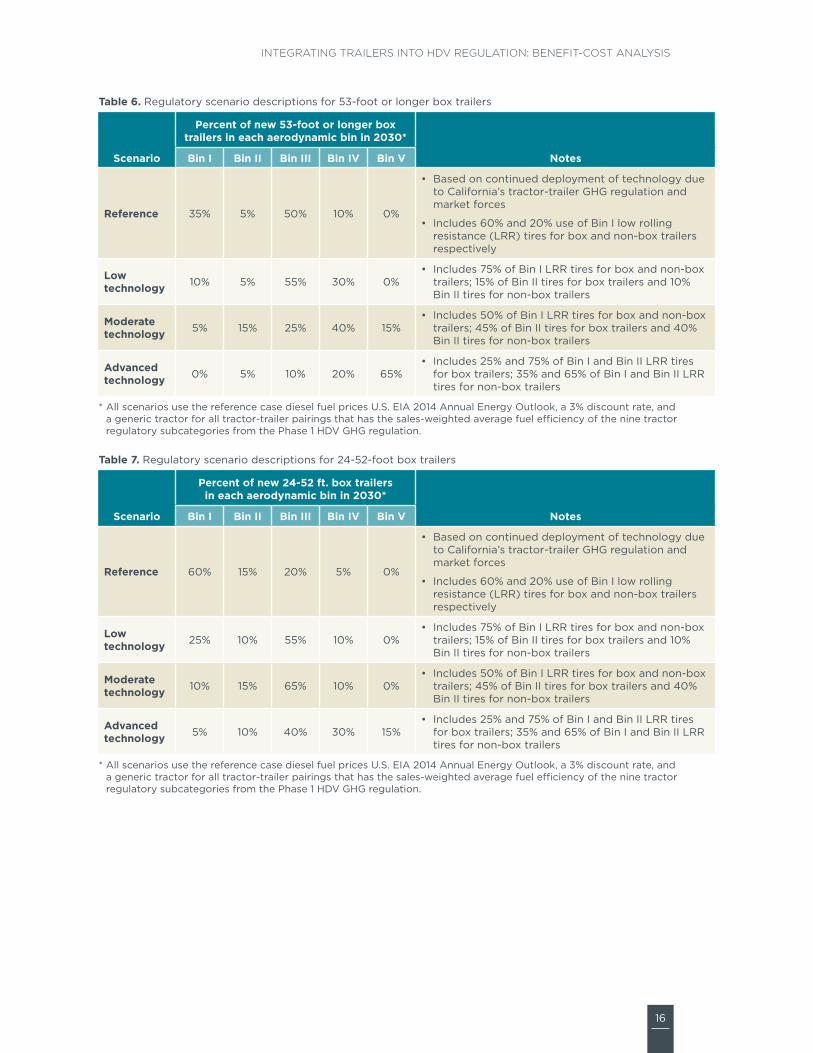
The four technology penetration scenarios developed for this study are summarized in Tables 6, 7, and 8. The application rates of fuel-saving aerodynamic and tire technologies distinguish the four scenarios. In addition, all of the scenarios assume a two-year compli-ance allowance for small trailer manufacturers; i.e., the duration of the regulation for these small businesses (defined by the SBA to have less than 500 employees) is delayed two years compared with the requirements for large OEMs. This two-year allowance for small manufacturers is meant to acknowledge that the rule may need to provide ad-ditional flexibility for small businesses that are affected by the regulation. The choice to model two additional years for compliance does not imply that this is the only flexibility mechanism that the agencies might pursue.
16
INTEGRATING TRAILERS INTO HDV REGULATION: BENEFIT-COST ANALYSIS
Table 6. Regulatory scenario descriptions for 53-foot or longer box trailers
Scenario
Percent of new 53-foot or longer box trailers in each aerodynamic bin in 2030*
NotesBin I Bin II Bin III Bin IV Bin V
Reference 35% 5% 50% 10% 0%
• Based on continued deployment of technology due to California’s tractor-trailer GHG regulation and market forces
• Includes 60% and 20% use of Bin I low rolling resistance (LRR) tires for box and non-box trailers respectively
Low technology 10% 5% 55% 30% 0%
• Includes 75% of Bin I LRR tires for box and non-box trailers; 15% of Bin II tires for box trailers and 10% Bin II tires for non-box trailers
Moderate technology 5% 15% 25% 40% 15%
• Includes 50% of Bin I LRR tires for box and non-box trailers; 45% of Bin II tires for box trailers and 40% Bin II tires for non-box trailers
Advanced technology 0% 5% 10% 20% 65%
• Includes 25% and 75% of Bin I and Bin II LRR tires for box trailers; 35% and 65% of Bin I and Bin II LRR tires for non-box trailers
* All scenarios use the reference case diesel fuel prices U.S. EIA 2014 Annual Energy Outlook, a 3% discount rate, and a generic tractor for all tractor-trailer pairings that has the sales-weighted average fuel efficiency of the nine tractor regulatory subcategories from the Phase 1 HDV GHG regulation.
Table 7. Regulatory scenario descriptions for 24-52-foot box trailers
Scenario
Percent of new 24-52 ft. box trailers in each aerodynamic bin in 2030*
NotesBin I Bin II Bin III Bin IV Bin V
Reference 60% 15% 20% 5% 0%
• Based on continued deployment of technology due to California’s tractor-trailer GHG regulation and market forces
• Includes 60% and 20% use of Bin I low rolling resistance (LRR) tires for box and non-box trailers respectively
Low technology 25% 10% 55% 10% 0%
• Includes 75% of Bin I LRR tires for box and non-box trailers; 15% of Bin II tires for box trailers and 10% Bin II tires for non-box trailers
Moderate technology 10% 15% 65% 10% 0%
• Includes 50% of Bin I LRR tires for box and non-box trailers; 45% of Bin II tires for box trailers and 40% Bin II tires for non-box trailers
Advanced technology 5% 10% 40% 30% 15%
• Includes 25% and 75% of Bin I and Bin II LRR tires for box trailers; 35% and 65% of Bin I and Bin II LRR tires for non-box trailers
* All scenarios use the reference case diesel fuel prices U.S. EIA 2014 Annual Energy Outlook, a 3% discount rate, and a generic tractor for all tractor-trailer pairings that has the sales-weighted average fuel efficiency of the nine tractor regulatory subcategories from the Phase 1 HDV GHG regulation.

17
ICCT WHITE PAPER
Table 8. Regulatory scenario descriptions for non-box trailers
Scenario
Baseline Bin I Bin II
Box Non-box Box Non-box Box Non-box
Reference 40% 80% 60% 20% 0% 0%
Low technology 10% 15% 75% 75% 15% 10%
Moderate technology 5% 10% 50% 50% 45% 40%
Advanced technology 5% 5% 20% 30% 75% 65%
* All scenarios use the reference case diesel fuel prices U.S. EIA 2014 Annual Energy Outlook, a 3% discount rate, and a generic tractor for all tractor-trailer pairings that has the sales-weighted average fuel efficiency of the nine tractor regulatory subcategories from the Phase 1 HDV GHG regulation.
Figures 9 and 10 illustrate the aerodynamic technology penetration levels in the “reference” and “advanced technology” scenarios, respectively, for 53-foot or longer dry van trailers. The time period from 2014 to 2020 represents baseline adoption. The effect of the regulation is evidenced in the figures between 2020 and 2025 as adoption accelerates into Bins III and IV (and Bin V in the advanced technology scenario). In each scenario, the distribution of aerodynamic bins for new trailer sales is assumed to be constant following the end of the regulation. In other words, the analysis assumes that the sales mix of aerodynamic bins remains unchanged after 2025 (or in the case of small OEMs, 2027).
0%
10%
20%
30%
40%
50%
60%
70%
80%
90%
100%
2014 2019 2024 2029
Per
cent
of
new
tra
ilers
sal
es
Bin I Bin II Bin III Bin IV
Figure 9. Distribution of aerodynamic bins for new 53-foot or longer box trailer sales in the reference scenario

18
INTEGRATING TRAILERS INTO HDV REGULATION: BENEFIT-COST ANALYSIS
0%
10%
20%
30%
40%
50%
60%
70%
80%
90%
100%
2014 2019 2024 2029
Per
cent
of
new
tra
iler
sale
s
Bin I Bin II Bin III Bin IV Bin V
Figure 10. Distribution of aerodynamic bins for new 53-foot or longer box trailer sales in the advanced technology scenario
As discussed in Section 2.4, we mirrored the approach taken for tractors in the Phase 1 regulation to model the deployment of improved efficiency tires. We use three tire rolling resistance bins and developed target application rates for each of the five trailer types/lengths. The tire bin distributions for new box trailers (i.e., dry and refrigerated trailers of all lengths) in the reference and advanced technology scenarios are shown in Figure 11 and 12 respectively.
While in the reference scenario, adoption is limited to Bin I tires, in the advanced technology scenario Bin II tires represent 75% of sales by 2025, with Bin I and baseline tires accounting for the remaining 20% and 5%, respectively. Baseline adoption of lower rolling resistance tires between 2014 and 2020 is identical in all four scenarios. The uptake of Bin I and II tires in the two other scenarios and for both box and non-box trailers is summarized in the right-hand column of Table 6.

19
ICCT WHITE PAPER
0%
10%
20%
30%
40%
50%
60%
70%
80%
90%
100%
2014 2019 2024 2029
Per
cent
of
new
tra
iler
sale
s
Baseline Bin I
Figure 11. Distribution of tire bins for new box trailer sales in the reference scenario
0%
10%
20%
30%
40%
50%
60%
70%
80%
90%
100%
2014 2019 2024 2029
Per
cent
of
new
tra
iler
sale
s
Baseline Bin I Bin II
Figure 12. Distribution of tire bins for new box trailer sales in the advanced technology scenario
While the regulation in each scenario is modeled by migrating trailer sales into higher aerodynamic and tire bin levels, in actuality it is envisioned that the regulation would be structured with a sales-weighted corporate average using a grams per ton-mile metric,

20
INTEGRATING TRAILERS INTO HDV REGULATION: BENEFIT-COST ANALYSIS
just as with tractor trucks in the Phase 1 rule. For example, a trailer OEM would be required to achieve an average value of “X” grams per ton-mile by 2025. In other words, OEMs would not be required to sell a specific percentage of trailers within each bin. The OEM would have the freedom to sell whatever mix of trailers that would allow them to achieve the standard for each of the five regulatory subcategories below:
» 53-foot or longer dry vans
» 53-foot or longer refrigerated trailers
» 24-52-foot dry vans
» 24-52-foot refrigerated vans
» Non-box trailers (all lengths)
Each trailer model would generate a grams/ton-mile result after the aerodynamic and tire bin data (and, potentially, any information about weight reduction, which is not analyzed in this study) are input into the GEM. Just as in the Phase 1 regulation for tractors, a default payload can be determined for each trailer category. Moreover, as with the Phase 1 averaging, banking, and trading (ABT) program, trailer models certified lower than the standard would generate credits, and models higher the standard would generate debits. Based on end-of-model-year sales weighting of each trailer model, the OEM would have a credit or debit, which can be carried into future years for a defined amount of time.

21
ICCT WHITE PAPER
4 RESULTS
For each of the four scenarios, the fuel consumption/CO2 emissions and the monetary costs and benefits results are summarized in the following two sections.
4.1 FUEL CONSUMPTION AND CO2 EMISSIONS
Figure 13 shows the annual fuel savings for each non-reference scenario between 2020 and 2050. As an increasing number of new trailers are subject to the regulation over time, the fuel savings steadily increase over the study period. Out to 2050, fuel savings of the “moderate technology” scenario are nearly 50% larger than savings of the “low technology” scenario. As the most aggressive technology uptake scenario, the advanced technology scenario yields fuel savings by 2050 that are more than twice those of the low technology scenario. For each of the non-reference scenarios in 2030 and beyond, the fuel savings and GHG emissions impact of providing two additional years for compli-ance for small manufacturers is negligible—less than 1% in all three cases.
0
50
100
150
200
250
2020 2025 2030 2035 2040 2045 2050
Mill
ion
bar
rels
of
oil
equi
vale
nt
Low technology Moderate technology Advanced technology
Figure 13. Fuel savings for each of the three non-reference scenarios
The annual fuel savings and CO2 results in 2040 are shown in Table 9. These values on the left-hand side of the table represent the savings for all trailers between MY 2020 and 2040. The right half of the table shows cumulative fuel savings and CO2 results between calendar years 2020 and 2050 solely for MY 2020–2025 trailers (MY 2022–2027 trailers in the case of small manufacturers).

22
INTEGRATING TRAILERS INTO HDV REGULATION: BENEFIT-COST ANALYSIS
Table 9. Summary findings on scenarios for increased trailer efficiency technology
Scenario
Energy savings in 2040 for MY 2020–2040
(million barrels per year oil equivalent*)
GHG benefit in 2040 for MY 2020–2040 (million metric
tons CO2/year)
Cumulative lifetime energy savings from new MY 2020–
2025** trailers (billion barrels oil equivalent)
Cumulative lifetime GHG benefit from new MY 2020–
2025* trailers (million metric tons CO2)
Low technology 72 9 169 21
Moderate technology 107 13 238 30
Advanced technology 161 20 328 41
* The million barrels per year of oil equivalent unit is calculated by using the average yield for U.S. refineries: on average, 1 barrel of crude oil produces 12.4 gallons of diesel fuel, amongst other fuels (U.S. Energy Information Administration 2014).
** Totals savings from all new trailers affected by regulation, which is MY 2020–2025 trailers for large manufacturers and MY 2022–2027 for small manufacturers.
4.1 COSTS AND BENEFITS
The economic impacts of each scenario are summarized in this section. In addition to assessing the incremental technology costs and fuel savings that directly affect end users, the model estimates the externality impacts using the same assumptions and calculations that were used to monetize externalities in the Phase 1 RIA.
Figure 14 shows the net savings for all end users for the three non-reference scenarios. The net savings values in these figures equals fuel cost savings minus incremental tech-nology costs. As with the fuel and CO2 results, net savings for the advanced technology scenario grow to be more than twice as large as the low technology results over time. In the advanced technology scenario, net benefits grow at a fairly constant rate to more than $12 billion per year in annual savings by 2050. For the low technology scenario, net savings grow at a slower rate and reach nearly $6 billion per year in 2050.
-2,000
0
2,000
4,000
6,000
8,000
10,000
12,000
14,000
2020 2025 2030 2035 2040 2045 2050
Mill
ion
USD
(20
13 $
)
Low technology Moderate technology Advanced technology
Figure 14. Net cost savings for end users for each of the three non-reference scenarios

23
ICCT WHITE PAPER
Payback time—that is, the time that it takes for an efficiency technology to equal its initial incremental purchase cost in terms of fuel savings—is an important metric that is used to assess the cost-effectiveness of technologies. There is no standard expectation for how long technologies should take to produce a return on investment, but, in general, conventional wisdom and interviews with industry suggests that most trucking companies are comfortable with payback times of two years or less for fuel-savings technologies on tractors (Roeth, Friesner et al. 2013; Roeth, Kircher et al. 2013). The Roeth et al. study found that most trucking companies typically keep their long-haul tractors between four and six years and generally keep their trailers for twice that long (Roeth, Kircher et al. 2013). In general, most trucking fleets want a technology to pay back within half of the ownership cycle so that the second half of ownership can yield a return on investment.
Table 10 below shows the payback times in the number of months after the initial purchase of the aerodynamic and tire technologies for a MY 2020 dry van trailer, using the cost estimates from Tables 3 and 4. For all of the aerodynamic and tire technology combinations, payback times are between one and two years, but the majority of payback times are less than a year and a half.
Table 10. Payback time (in months) when initial costs of aerodynamic and tire technology are offset by fuel savings for 53-foot or longer dry van trailers
Bin I
Aerodynamic bin
Bin II Bin III Bin IV Bin V
Tire bin*
Baseline - 24 10 15 16
Bin I 19 21 14 16 17
Bin II 12 15 11 14 15
* Includes tire automatic inflation systems
Figure 15 shows the net benefits in 2030, 2040, and 2050 to end users (i.e., fuel savings minus incremental technology costs) for each of the four trailer regulatory scenarios as well as the results from the entire Phase 1 HDV regulation for reference. Overall, the benefits to end users of the trailer scenarios are roughly 10–30% of the total benefits to fleets achieved in the Phase 1 regulation. This suggests that trailers have a significant role to play in providing benefits to fleets and society as a whole as part of the Phase 2 regulation.

24
INTEGRATING TRAILERS INTO HDV REGULATION: BENEFIT-COST ANALYSIS
0
5,000
10,000
15,000
20,000
25,000
30,000
35,000
40,000
2030 2040 2050
Net
ben
efits
(m
illio
n U
SD, 2
013
$)
Annual savings in each year
Figure 15. Net benefits in 2030, 2040, and 2050, excluding externalities, for each of the three non-reference trailer regulatory scenarios and the combination tractor segment in the Phase 1 heavy-duty vehicle regulation
Figure 16 shows the net present value (NPV) of both private (i.e., end user) and societal (i.e., externality) cost savings for the three non-reference scenarios. The real discount rate is set at 3% to match the analysis from the Phase 1 rule. The advanced technology scenario has a NPV of approximately $140 billion (in 2013 dollars), while the NPV of the low technology scenario is roughly 45% of this value at $63 billion. At $93 billion, the NPV of the moderate technology scenario is 47% higher than the low technology scenario and 34% lower than the advanced technology scenario. The approach for calcu-lating externality cost savings is based on the Phase 1 RIA and includes the monetized benefits of energy security; accidents, noise, and congestion; refueling time savings; and non-GHG impacts. The benefits from externality cost reductions are approximately 5% of the total NPV for each of the three scenarios.

25
ICCT WHITE PAPER
0
20
40
60
80
100
120
140
160
Low technology Moderate technology Advanced technology
Net
pre
sent
val
ue (
bill
ion
USD
, 20
13$
)
Fuel and technology costs Externalities
Figure 16. Net present value for each of the three non-reference scenarios (3% real discount rate)
4.1 SUMMARY OF SCENARIO RESULTS
Table 11 summarizes the central technology deployment assumptions and the key find-ings of each scenario. Each of the non-reference scenarios yields substantial fuel con-sumption and GHG reductions, all the while providing reasonable return on investment for trucking fleets and society as a whole. The results provide evidence that technology packages, including trailer aerodynamic devices and improved tires, can provide a return on investment within one to two years, and provide direct fuel savings to tractor-trailer fleets that exceed initial technology costs by a ratio of at least 9 to 1. The technology paths identified could yield annual reductions of up to 161 million barrels of oil up to 20 million metric tons of CO2 emissions by 2040. We emphasize that these are the benefits from trailer technology alone—without consideration of engine, transmission, and tractor technologies. Moreover, weight reduction technologies for trailers may be able to provide additional cost-effective benefits. These lightweighting technologies were not included in this analysis and present an important area for future research.

26
INTEGRATING TRAILERS INTO HDV REGULATION: BENEFIT-COST ANALYSIS
Table 11. Summary findings on scenarios for increased trailer aerodynamic and tire efficiency technology
Scenario
Penetration of advanced trailer technology packages in 2030
Average percent fuel savings in new MY
2030 tractor-trailers
Average payback period#
Benefit-cost
ratio#
Energy savings in 2040 (million
bbl/year oil equivalent^)
GHG benefit in 2040 (million tons CO2/year)
53-foot box
trailers*
24- to 52-foot box trailers*
Non-box trailers**
All trailers
53-foot box
trailersAll
trailersAll
trailers All trailers All trailers
Reference 10% 5% 10% - - - - - -
Low technology 30% 10% 85% 4% 4% 2-3 years 10.8:1 72 9
Moderate technology 55% 10% 90% 5% 6% ~2 years 11.3:1 107 13
Advanced technology 85% 45% 95% 8% 10% ~2 years 11.3:1 161 20
* For box trailers, these percentages represent new trailers with Bin IV and V aerodynamic technology packages, Bin I or II low rolling resistance (LRR) tires, and automatic tire inflation systems (AIS).
** For non-box trailers, these are the percentages of new trailers with Bin I or II LRR tires and AIS. # Assumes U.S. EIA 2014 Annual Energy Outlook reference case fuel prices, 3% discount rate^ The million barrels per year of oil equivalent unit is calculated by using the average yield for U.S. refineries: on average, 1 barrel of crude
oil produces 12.4 gallons of diesel fuel, among other fuels (U.S. Energy Information Administration 2014).

27
ICCT WHITE PAPER
5 CONCLUSIONS AND FUTURE WORK
This assessment of trailer technology—and its potential for diffusion across the U.S. fleet, its associated costs, and its fuel savings and carbon reduction benefits—indicates that trailers represent a significant opportunity for cost-effective fuel savings and GHG reductions in the Phase 2 rulemaking for heavy-duty vehicles. In each of the four scenarios, the benefits to end users and society as a whole greater outpace the incremental technology costs that would be imposed by regulation. The results provide evidence that technology packages, including trailer aerodynamic devices and improved tires, can provide a return on investment within one to two years, and provide direct fuel savings to tractor-trailer fleets that that exceed initial technology costs by at least 9-to-1 (assuming a 7% discount rate). The technology paths identified, as mentioned, could yield annual reductions of up to 161 million barrels of oil and up to 20 million metric tons of CO2 by 2040. We emphasize that these are the benefits from trailer technology alone—without consideration of engine, transmission, and tractor technologies.
Including trailers in the overall heavy-duty vehicle program will promote an entire group of available drag-reduction technologies to increase tractor-trailer efficiency. The devel-opment and deployment of these technologies otherwise would remain uncertain and more limited if based on the present market and regulatory environment. The report lays out three technology paths that could serve to help inform the relative stringency of the trailer technology regulation—ranging from lower to moderate to advanced technology adoption. The analysis reveals that even the most technologically advanced pathway analyzed here was still highly cost-effective. We also analyzed potential provisions for delayed regulatory requirements for smaller businesses that could be affected by trailer regulations. We find that such provisions to accommodate smaller trailer manufacturers result in less than a 1% loss in potential trailer regulatory program benefits.
Beyond these results from the analysis, there are three outstanding data and research areas that we identify to help better understand the full benefits of a regulatory program and best promote cost-effective fuel-saving technologies across all trailer categories. We recommend that the EPA, NHTSA, and other stakeholders investigate these areas as they deliberate on a potential rulemaking for trailers.
Activity rates and trailer-to-tractor ratios. Robust estimates for average annual mileage for each category of trailers are an important data input for payback and cost-effectiveness calculations. One regulatory approach that we recommend is for the agencies to establish three primary regulatory categories for trailers: dry van, refriger-ated, and non-box. The ratio of the number of these trailers to the number of tractors has a significant impact on the economics of trailer fuel-saving technologies.
Current levels of technology adoption and technology potential for pup trailers and non-box trailers. There are not yet detailed specifics for the levels of uptake for “pup” box trailers less than 53 feet long, nor for non-box trailers. Developing baseline technol-ogy adoption estimates for these categories is an important task for the agencies and other stakeholders to maximize the benefits of including these categories of trailers in the Phase 2 regulation. Moreover, there is anecdotal evidence to suggest that in recent years, many fleet owners have been purchasing low-cost container chassis trailers in place of dry van trailers. These container chassis are much less aerodynamic due to their corrugated sides and are also typically 2,000–3,000 pounds heavier than dry vans, which negatively impacts overall freight efficiency (Scarcelli 2014). Any regulatory ac-

28
INTEGRATING TRAILERS INTO HDV REGULATION: BENEFIT-COST ANALYSIS
tion that would potentially increase the delta in purchase price between dry van trailers and container chassis should be weighed carefully to limit the unintended consequence of causing increasing numbers of fleets to adopt container chassis as replacements for dry van trailers. In addition, an important area for research is investigating the potential for aerodynamic technologies for container chassis. Given durability concerns and the multi-modal nature of container chassis (i.e., travel on trucks, ships, and rail), identifying aerodynamic fuel-saving solutions for this segment is an interesting challenge.
Complementary measures and incentivizing early compliance. Another way to best maximize the efficacy of regulation is to explore what complementary policies might be effective for driving fuel-saving technologies and practices into the trailer market. In addition to the SmartWay program, which provides valuable technology and market data to fleets and the industry, measures such as tax incentives can complement a trailer regulation and help to push technologies into segments that may be difficult to affect through regulation. Moreover, the agencies should analyze how a crediting scheme might be designed to promote early adoption and compliance with the rule, while taking into consideration of the impact of the California tractor-trailer GHG regulation.

29
ICCT WHITE PAPER
REFERENCES
Boriboonsomsin, K., R. Sheckler, et al. (2012). “Generating Heavy-Duty Truck Activity Data Inputs for MOVES Based on Large-Scale Truck Telematics Data.” Transportation Research Record: Journal of the Transportation Research Board 2270(1): 49-58.
Committee on Assessment of Technologies and Approaches for Reducing the Fuel Consumption of Medium- and Heavy-Duty Vehicles - Phase Two (2014). Reducing the Fuel Consumption and Greenhouse Gas Emissions of Medium- and Heavy-Duty Vehicles, Phase Two - First Report. Washington, DC, National Research Council of the National Academies.
R.L Polk & Co. (2009). New Heavy Duty Truck Registrations (U.S.), Jan . 2003 – Dec. 2007, by Type and Use. R.L Polk & Co. Southfield, MI.
R.L Polk & Co. (2012). New Commercial Class 8 Tractor and Trailer (24-foot to 65-foot) Registrations between 1986 and 2011. R.L Polk & Co. Southfield, MI.
R.L Polk & Co. (2012). New Commercial Trailer Registrations from January 2003 through December 2011 for trailers longer than 24 feet. R.L. Polk & Co. Southfield, MI.
Roeth, M., J. Friesner, et al. (2013). 2013 Fleet Fuel Efficiency Benchmark Study. Fort Wayne, IN, North American Council on Freight Efficiency.
Roeth, M., D. Kircher, et al. (2013). Barriers to the Increased Adoption of Fuel Efficiency Technologies in the North American On-Road Freight Sector. Fort Wayne, IN, North American Council for Freight Efficiency.
Salari, K. (2014). DOE’s Effort to Improve Heavy Vehicle Fuel Efficiency through Im-proved Aerodynamics. U.S. Department of Energy Annual Merit Review. Washington, DC, Lawrence Livermore National Laboratory.
Scarcelli, J. (2014). Personal communication: review of draft paper, ‘Benefit-cost analysis of integrating trailers into the Phase 2 heavy-duty vehicle efficiency regulation’. B. Sharpe. San Francisco, CA.
Sharpe, B. (2014). Recommendations for regulatory design, testing, and certification for integrating trailers into the phase 2 U.S. heavy-duty vehicle fuel efficiency and greenhouse gas regulation (in publication). Washington, DC, The International Council on Clean Transportation.
Sharpe, B., N. Clark, et al. (2013). Trailer technologies for increased heavy-duty vehicle efficiency: Technical, market, and policy considerations. Washington, DC, The Interna-tional Council on Clean Transportation.
Sharpe, B. and M. Roeth (2014). Costs and Adoption Rates of Fuel-Saving Technologies for Trailers in the North American On-Road Freight Sector. Washington, DC, The International Council on Clean Transportation.
Trailer-bodybuilders.com. (2014, February 1). “2013 Trailer Production Figures Table.” Retrieved February 20, 2014, from http://trailer-bodybuilders.com/trailer-output/2013-trailer-production-figures-table.
Trailer-bodybuilders.com. (2014, February 1). “Total industry shipments remain steady for 29 largest trailer builders.” Retrieved February 20, 2014, from http://trailer-bodybuilders.com/trailer-output/total-industry-shipments-remain-steady-29-largest-trailer-builders.
30
INTEGRATING TRAILERS INTO HDV REGULATION: BENEFIT-COST ANALYSIS
U.S. Census Bureau (2004). 2002 Economic Census: Vehicle Inventory and Use Survey. Washington, DC, U.S. Census Bureau.
U.S. Census Bureau (2012). 2010 County Business Patterns: Geography Area Series: County Business Patterns, NAICS Code 336212, Truck Trailer Manufacturing. U.S. Census Bureau. Washington, DC.
U.S. Energy Information Administration (2014). Annual Energy Outlook 2014: Data table A3 – Energy Prices by Sector and Source. Washington, DC, U.S. Energy Information Administration.
U.S. Environmental Protection Agency (2011). Final Rulemaking to Establish Greenhouse Gas Emissions Standards and Fuel Efficiency Standards for Medium- and Heavy-Duty Engines and Vehicles: Regulatory Impact Analysis. Washington, DC.
U.S. Environmental Protection Agency (2011). Greenhouse Gas Emissions Standards and Fuel Efficiency Standards for Medium- and Heavy-Duty Engines and Vehicles. Federal Register, Vol. 76, Number 179. U.S. Government Printing Office.
U.S. Small Business Administration (2014). Table of Small Business Size Standards Matched to North American Industry Classification System Codes. Washington, DC, U.S. Small Business Administration.
UChicago Argonne LLC (2013). Autonomie vRev13. Chicago, IL, UChicago Argonne LLC.