
Benchmarks versus Behaviors: A Picture of Health Behavior Trends Over 15 years in Slippery Rock...
123
A Picture of Health Behavior Trends Over 15 years in Slippery Rock University Students Undergraduate presenters Kaycee Hammer and Sarah Pelton , Public Health majors Faculty Dr. Wendy Stuhldreher, Department of Public Health and Social Work Dr. Beth Larouere, Department of Exercise & Rehabilitative Science
-
Upload
herbert-shepherd -
Category
Documents
-
view
216 -
download
1
Transcript of Benchmarks versus Behaviors: A Picture of Health Behavior Trends Over 15 years in Slippery Rock...

Benchmarks versus Behaviors: A Picture of Health Behavior Trends Over 15 years in Slippery Rock University Students
Undergraduate presentersKaycee Hammer and Sarah Pelton , Public Health majorsFacultyDr. Wendy Stuhldreher, Department of Public Health and Social WorkDr. Beth Larouere, Department of Exercise & Rehabilitative Science

What are Benchmarks?
•Increase campus community awareness and understanding of determinants of health…
•Provide measurable objectives and goals that can be used at institutions of higher educationSource: http://www.acha.org/healthycampus/

Background•Origin of Slippery Rock University the
Student Health Assessment Project (SHAP) - 1996
•The data are from 3 waves of surveys given to ~1,000 students▫Phase 1 - 1996-98▫Phase 2 - 2000-2001▫Phase 3 - 2009-2012

SRU SHAP Methods
•Cross-sectional Study•Survey Instrument
▫Self-administered, previously validated, reliable questions
▫The National Health Behavior Survey (Centers for Disease Control & Prevention, 1995)
▫The Health Interests and Practices Questionnaire (University of Northern Iowa Health Promotion Division, 1993)
▫IRB approval 0101-027-41 and 2001-027-41-B
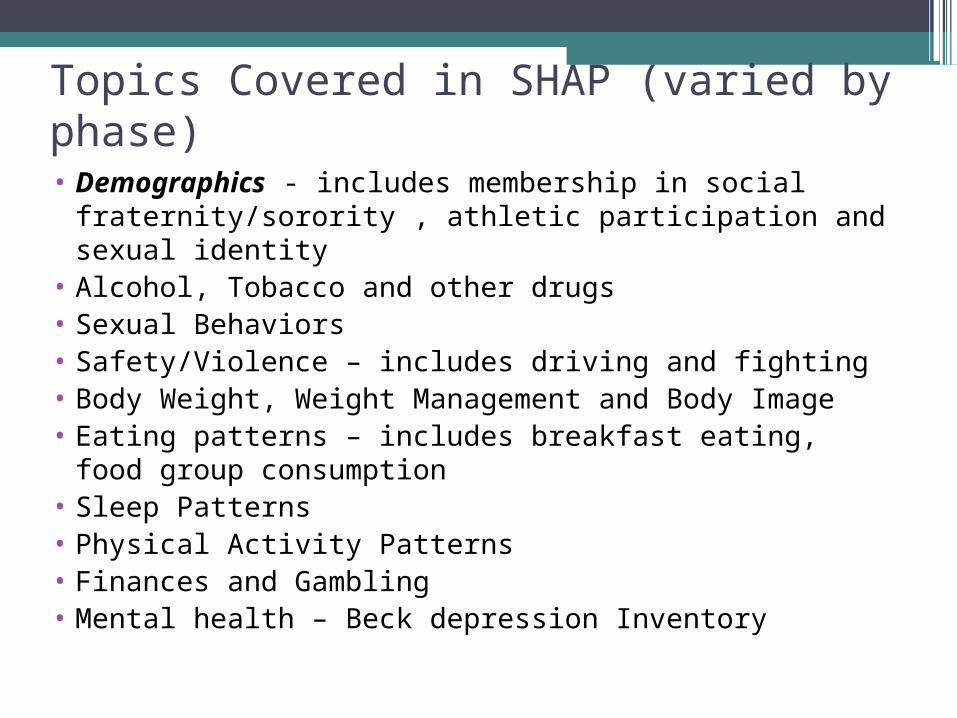
Topics Covered in SHAP (varied by phase)• Demographics - includes membership in social
fraternity/sorority , athletic participation and sexual identity
• Alcohol, Tobacco and other drugs• Sexual Behaviors• Safety/Violence – includes driving and fighting• Body Weight, Weight Management and Body Image• Eating patterns – includes breakfast eating, food
group consumption• Sleep Patterns• Physical Activity Patterns• Finances and Gambling• Mental health – Beck depression Inventory

SRU SHAP Methods
•Sample for Phase 1 and 2▫Personal Fitness course required for all students
•Sample for Phase 3▫Surveyed Introduction to Psychology course
▫High enrollment liberal studies class

Description of the SHAP Sample•SRU Student Health Assessment Project
(SHAP)•The survey was given during 3 time
periodsYears of Data
CollectionSample Size (traditional students)
% of Student Body
Phase 11996-98
N = 1,449 25%
Phase 2 2000-2001
N = 1,079 16%
Phase 32009-2013
N = 1,029 12%

DemographicsSex
Years of Data Collection
Male (%) Female(%)
Phase 11996-98
41% 59%
Phase 22000-02
42% 58%
Phase32009-13
34% 66%

Demographics Class Rank
Years of Data
Collection
Freshman (%)
Sophomore(%)
Junior (%)
Senior (%)
Phase 11996-98
55% 23% 11% 6%
Phase 22000-02
36% 33% 20% 11%
Phase 32009-13
60% ~22% 10% ~9%

DemographicsRace
Years of Data Collection
White (%) Non-White (%)
Phase 11996-98
93% 7%
Phase 22000-2002
91% 9%
Phase 32009-2013
91% 9%

Who was in the final sample?Inclusion Criteria
•Between 18-24 years of age•Undergraduate full time students•Single (never been married)•Had to have answered the majority of
questions

Priority Areas: NCHA
• Tobacco Use• Alcohol & Other Drug
Use• Sexual Assault &
Relationship Violence• Violence• Injury and Safety• Suicide
• Pregnancy • AIDS/HIV• Sexually Transmitted
Disease (Infections)• Dietary Behaviors &
Nutrition• Physical Activity &
Fitness
Karen Moses, MS, RD, CHES Jim Grizzell, MBA, MA, CHES Victor Leino, PhDand the Task Force on National Health Objectives

What are the benchmarks for Alcohol?• Healthy Campus 2010• 26-11b Reduce the
proportion of college students engaging in high risk drinking of alcoholic beverages.
• Target – no more than 20%
• Healthy Campus 2020• SA-14 Reduce the
proportion of students who report engaging in high-risk drinking of alcoholic beverages within the last two weeks.
• High risk drinking ▫ 5 or more drinks in a
sitting
• Target – 10% improvement▫ ACHA baseline 31.6%▫ CORE 39.5%
Source: http://www.acha.org/healthycampus/

What has been the drinking history on our campus?
•SRU Student Health Assessment Project (SHAP)

Prevalence (%) of Drinking
Prevalence Alcohol Consumption
Males (%) Females (%)
Ever/never Drinking Phase 3 (2009-13)
78% 75%
Ever/never Drinking Phase 2 (2000-01)
78% 74%
Ever/never Drinking Phase 1 (1996-98)
86% 87%
Perception of Drinking 98.5% 98%
Question: In the past 30 days, on how many days did you have at least one drink of alcohol?
Sex differences not significant

Prevalence (%) of High-Risk Drinking
Prevalence High-Risk Drinking
Males (%) Females (%)
High-Risk Drinking Phase 3(2009-13)
68% 57%***
High-Risk Drinking Phase 2 (2000-01)
63% 50%***
High-Risk Drinking Phase 1 (1996-98)
64% 50%***
Perception of High Risk Drinking 97% 98%Healthy Campus Benchmarks
Healthy Campus 2010 (Binge) No more than 20%
Healthy Campus 2020 (High Risk)
10% improvement over baseline
39.5% (CORE)
Question: In the past 30 days, on how many days did you have
> 5 drinks (males) or > 4 drinks (females) in a row (couple of hours)?
Difference between males and females p<.001

Prevalence (%) of High-Risk DrinkingQuestion: In the past 30 days, on how many days did you have > 5 drinks (males) or > 4 drinks (females) in a row (couple of hours)?
64%*** 63%***68%***
50% 50%57%
0
10
20
30
40
50
60
70
80
Phase 1 (1996-98) Phase 2 (2000-01) Phase 3 (2009-2013)
Males Females
Healthy Campus 2010 Target
Healthy Campus 2020 Target
*** Sex difference p < .001
Prevalence %

Phase 3: Correlates of Alcohol with Other Behaviors Sex Under the Influence
86%
18%*
83%
13%
0102030405060708090
100
Sex under Influence Sex under Influence & Regret
MalesFemales
Prev
alen
ce (%
)
* p <.05

Phase 3: Correlates of Alcohol with Other Behaviors Did having Sex under the Influence
differ by age?
4.5%
18%*14.6%
19.2%
0
5
10
15
20
25
Sex UI Females by age Sex UI Males by age
Prev
alen
ce (%
)
* p <.05
>21
<21 yrs
<21 yrs
> 21
FemalesMales

Did drinking patterns differ by membership in
various campus groups?
•Athletes•Social sorority or fraternities•Race

Phase 3: Significant Associations with Alcohol
Analyses limited to drinkers only Males (N=273) Females (N=577)
• More likely to report “high-risk” drinking if▫ Race
White 70% Not white 50% p =.030
• More likely to have sex under the influence (only sexually active)▫ Race
Not white 100% White 85% p =.037
• More likely to have sex under the influence and regret it▫ Race
Not white 40% White 16% p=.003
•
• More likely to “high risk drinking” if member of sorority
Yes 74% No 56% p=.019

Phase 3 Frequency (%) of Reporting Academic Consequences of Drinking
Question: In the past 30 days, how often did you …? Analyses limited to drinkers only
Males (N=273) Females (N=577)
Consequence %
Missed class because of drinking
10%
Did poorly on a test because of drinking
5%
Consequence %
Missed class because of drinking
9%
Did poorly on a test because of drinking
5%

Phase 3 Frequency (%) of Reporting Using Good Strategies to When
DrinkingQuestion: In the past 30 days, how often did you …?
Analyses limited to drinkers onlyMales (N=273) Females (N=577)
Strategy %
Stay with group of friends
86%
Eat before drinking 85%
Don’t drink at a party 76%
Stick with 1 type of alcohol
65%
Keep track of # drinks 63%
Avoid drinking games 49%
Don’t exceed set # drinks
48%
Pace yourself 44%
Alternate alcohol/non-alc
41%
Have friend tell you enough
32%
Strategy %
Stay with group of friends
88%
Eat before drinking 84%
Don’t drink at a party 82%
Stick with 1 type of alcohol
78%
Keep track of # drinks 70%
Pace yourself 62%
Don’t exceed set # drinks
60%
Avoid drinking games 58%
Have friend tell you enough
54%
Alternate alcohol/non-alc
48%

Photo from: http://mbeckerlaw.com/wp-content/uploads/2011/02/DUI.jpg

Phase 3: Correlates of Drinking and Safety
10
39***
34 33
18*1719
13
0
5
10
15
20
25
30
35
40
45
Phase 1 Phase 2 Phase 3
UnderageOf AgeMaleFemalePr
eval
ence
(%
)
Healthy Campus 2020 Target – 16.1%
Driving Under the Influence of Alcohol
* p <.05; *** p <.001

Phase 3: Correlates of Drinking and Safety
19
107
46***
39***
12*
2318
14***
24
13
5
05
101520253035404550
Riding in a car with someone under the
influence
Driving under the influence
Fighting under the influence
UnderageOf AgeMaleFemalePr
eval
ence
(%
)
Healthy Campus 2020 Target – 16.1%
High Risk Behaviors Under the Influence * p <.05; *** p <.001

Photo source: http://www.projectknow.com/wp-content/uploads/marijuana-addiction.jpg

Prevalence (%) of Marijuana UsePhase 1 Question: In your life time, how many times did you use
marijuana?Phase 2-3 Question: In the past 6 months, how many times did you use
marijuana?Recoded as Ever or Never used
55%***
30%**
38%**
46%
24%29%
0
10
20
30
40
50
60
Phase 1 (1996-98) Phase 2 (2000-01) Phase 3 (2009-2013)
Males Females
Healthy Campus 2010 Target 7.8%
Healthy Campus 2020 Target16.3% CORE
Sex difference** p < .01; *** p<.001


Prevalence (%) of Smoking Question: Which of the following best describes your current smoking status? [If current smoker or smoke socially selected, status SMOKER.]
Sex difference NS

Phase 3: Why do students smoke?
Females Males
Reason % reporting
Curiosity 24
Peer pressure 9
Manage stress 8
To rebel 7
Bored 4
Control Wt 2
Family Member 1
17% began smoking in high school
Reason % reporting
Curiosity 26
Peer pressure 7
Manage stress 5
Bored 5
To rebel 4
Family Member 1
Control Wt <1
16% began smoking in high school
Question: What were the reason(s) you tried smoking?

Phase 3: Why do students continue to smoke?
Females Males
Reason % reporting
Manage stress 7
Enjoy it 5
To Fit In 2
Addicted 2
Control Wt 1
76% of smokers have not tried to quit!
If they did – cold turkey
9% (N=60)
Reason % reporting
Enjoy it 8
Manage stress 3
To Fit In 1
Addicted 1
Control Wt 0
76% of smokers have not tried to quit!
If they did – cold turkey
9% (N=32)
Question: What were the reason(s) you continue smoking?

Prevalence (%) of Spit Tobacco
24%24%
23%
3% 3%1%
0
5
10
15
20
25
30
Phase 1 (1996-98) Phase 2 (2000-01) Phase 3 (2009-2013)
Males Females
Sex difference p<.001

Healthy Campus NWS 14/15• Increase the proportion of students who
report eating five or more servings of fruits & vegetables per day
•Fruits and vegetables are 2 different food groups with unique nutritional contributions to the diet
•SHAP survey queried▫Fruit Whole Grains▫Dark green vegetables Legumes▫Orange vegetables Dairy

Phase 3: Frequency Distribution Met Dietary Guidelines
Females (N=684) Males (N=345)
Dietary Pattern %
> 2 servings of fruit a day
28%
> 3 daily whole grain servings in past week
24%
> 3 daily servings of dairy
20%
> 3 cups dark green veggies per week
25%
> 2 cups orange veggies per week
12%
> 3 cups legumes per week
4%
Reason %
> 2 servings of fruit a day
28%
> 3 daily whole grain servings in past week
36%
> 3 daily servings of dairy
34%
> 3 cups dark green veggies per week
30%
> 2 cups orange veggies per week
15%
> 3 cups legumes per week
6%

Phase 3: Where Dietary Patterns better if students lived on campus?
Females (N=684) Males (N=345)
• More likely to eat more legumes if live off campus v on campus!▫ 7% v 2% (p<.01)
• More likely to eat breakfast if lived off campus v on campus!▫ 48% v 30% (p <.001)

Myth Buster!
•No significant differences between dietary patterns of obese students versus normal weight students
•Too few students were underweight to have a valid statistical comparison of dietary patterns.


Phase 3: Frequency Distribution Sexual Orientation
Females (N=684) Males (N=345)
Description % reporting
Heterosexual 95%
Gay or lesbian 1.3%
Bisexual 2%
Exploring 1.2%
Description % reporting
Heterosexual 95%
Gay or lesbian 0.9%
Bisexual 0.9%
Exploring 0.6%
Caveat – do not have sufficient numbers in groups to have valid statistical analysis of sexual practices by groups – for example condom use by sexual orientation

Frequency Distribution had first sexual intercourse <18 (before
college)(oral, anal, vaginal)
Females Males
Study % < 18 years
Phase 1 70%
Phase 2 56%
Phase 3 (N=684) 75%
Study % < 18 years
Phase 1 74%
Phase 2 56%
Phase 3 (N=345) 82%
Most students are coming to college already sexually active.
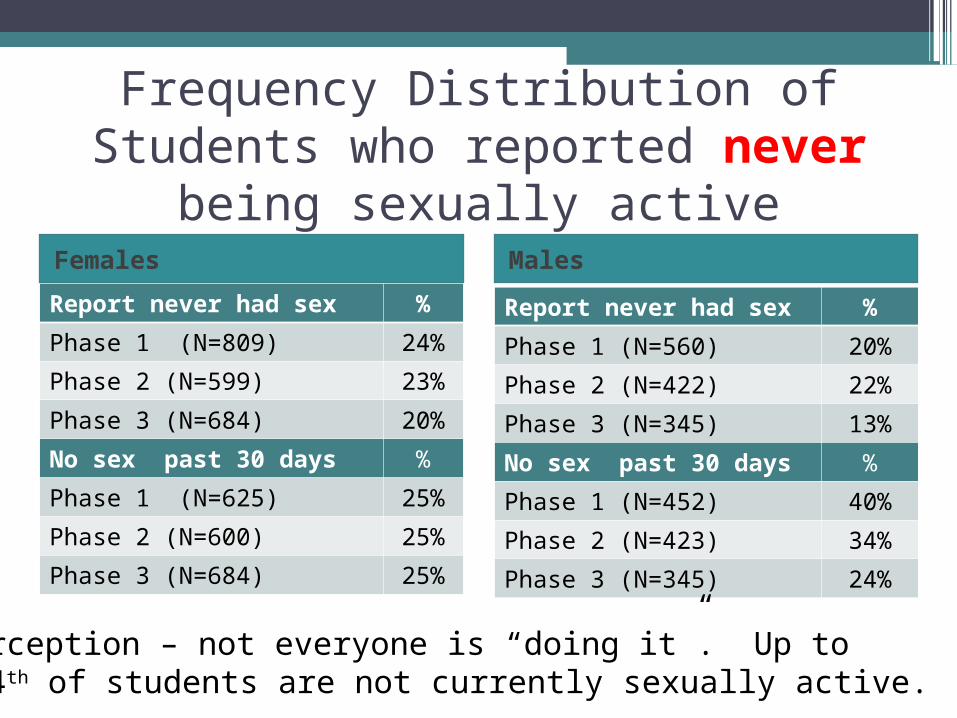
Frequency Distribution of Students who reported never being sexually
activeFemales Males
Report never had sex %
Phase 1 (N=809) 24%
Phase 2 (N=599) 23%
Phase 3 (N=684) 20%
No sex past 30 days %
Phase 1 (N=625) 25%
Phase 2 (N=600) 25%
Phase 3 (N=684) 25%
Report never had sex %
Phase 1 (N=560) 20%
Phase 2 (N=422) 22%
Phase 3 (N=345) 13%
No sex past 30 days %
Phase 1 (N=452) 40%
Phase 2 (N=423) 34%
Phase 3 (N=345) 24%
Perception – not everyone is “doing it”. Up to 1/4th of students are not currently sexually active.

Phase 1: Number of Sexual Partners in Lifetime
Percent of Sexually Active Students (N= 1058)
Number of Partners
Per
cen t
(am
ong
thos
e se
xual
ly a
ctiv
e

Phase 2: Number of Opposite Sex Partners in Lifetime
Percent of Sexually Active Students (N=790)
23
18 17
12
1917
13
22
0
5
10
15
20
25
30
35
1 2 3~5 6+
FemaleMale
Number of Opposite Sex Partners in Lifetime
Per
cent
(am
ong
thos
e se
xual
ly a
ctiv
e

Phase 3: Number of Opposite Sex Partners in Lifetime Percent of Sexually Active Students (N= 809)
23
19
1415
24 24
16
24
0
5
10
15
20
25
30
35
1 2 3~5 6+
FemaleMale
Number of Opposite Sex Partners in Lifetime
Per
cent
(am
ong
thos
e se
xual
ly a
ctiv
e

Phase 2: Number of Same Sex Partners in Lifetime
Percent of Sexually Active Students (N= 790)
Number of Same Sex Partners in Lifetime
Per
cent
(am
ong
thos
e se
xual
ly a
ctiv
e

Phase 3: Number of Same Sex Partners in Lifetime
Percent of Sexually Active Students (N= 809)
0
2
4
6
8
10
12
14
16
18
20
1 2 3~5 6+
3%
1.5% 1.2% 1.8%2%
0.3%1.4%
0.6%
Female
Male
Number of Same Sex Partners in Lifetime
Per
cent
(am
ong
thos
e se
xual
ly a
ctiv
e

Phase 1: Methods of Contraception at Last Sex Act
Percent of Sexually Active Students (N=1058)
15
8
45 43
24
33
11 10
1 3 2 2
0
10
20
30
40
50
60
Per
cen
t
Nothing Condom Pill Withdrawal Depo Other
Males Females

Phase 2: Methods of Contraception at Last Sex Act
Percent of Sexually Active Students (N= 790)
3634 37
26
13 141 3 2 3
0
10
20
30
40
50
60
Condom Pill Withdrawl Depo Other
Female Male
Percent

Phase 3: Methods of Contraception in Lifetime
Percent of Sexually Active Students (N= 809)
60 60
53
59
26
18
2 13.5
6.715
10
0
10
20
30
40
50
60
Condom Pill Withdrawl Depo Implant/ring Emergency
Female Male
Percent

Healthy Campus Benchmarks for Sexually Activity
Healthy Campus 2010 Healthy Campus 2020
• 15-27 Increase the proportion of females at risk of unintended pregnancy (and their partners) who use contraception.▫ Target 100%
• HIV-17A Increase the proportion of sexually active students who report using condoms, most of the time or always, for vaginal intercourse in the last 30 days. ▫ Target 56.1%
• HIV-17B … for anal intercourse▫ Target 31%
• Increase the proportion of students or their partner who report using contraception during the last vaginal sexual intercourse. ▫ Target 62%

Prevalence (%) of Barrier/Condom Use Most Times and Always
Question: In the past 30 days, how often did you or your partner use barrier method for anal or vaginal intercourse?
23 25
49
2629
41
0
10
20
30
40
50
60
Phase 1 (1996-98) Phase 2 (2000-01) Phase 3 (2009-2013)
Males FemalesHealthy Campus 2010 Target 100% Healthy Campus 2020 Target
31% (anal) & 56% (vaginal)

Phase 3: Frequency of using barrier most or always for intercourse (both anal and vaginal)
Percent of Sexually Active Students (N= 809)
%
Healthy Campus 2020 HIV 17a – 56%(vaginal)
Healthy Campus 2020 HIV 17b – 31%(anal)

Phase 3: Frequency Distribution of Reasons Why Used Barrier Method
Oral intercourse
Females (N=590)15 % report using barrier most or always
Males (N=311)19% report using barrier most or always
Reason %
Prevent pregnancy 23%
Prevent STD/STI 5%
Partner insisted <1%
Reason %
Prevent pregnancy 27%
Prevent STD/STI 6%
Partner insisted <1%

Phase 3: Frequency Distribution of Reasons Why Used Barrier MethodVaginal or anal intercourse
Females (N=590) Males (N=311)
Reason %
Prevent pregnancy 40%
Prevent STD/STI 16%
Hygiene 8%
Partner insisted 4%
Reason %
Prevent pregnancy 50%
Prevent STD/STI 21%
Hygiene 9%
Partner insisted 6%

Healthy Campus 2020 Objectives related to healthy relationships
• IVP-39.3 Target 4.2% Baseline 4.0-4.7%▫ Reduce the proportion of students who report being in
an intimate relationship that was emotionally abusive within the last 12 months
• IVP-39.1 Target 2.3% Baseline 2.5%▫ Reduce the proportion of students who report being in a
intimate relationship that was physically abusive within the last 12 months.
• IVP-39.2 Target 1.4% Baseline 1.6%▫ Reduce the proportion of students who report being in a
intimate relationship that was sexually abusive within the last 12 months.

Phase 3: Frequency Relationship Abuse Physical, Sexual or Verbal
Females (N=684) Males (N=345)
Reported abuse %
Reported doing this to partner
Slap, hit, push partner 6%
Pinch or pull partner hair 3%
Called partner names 9%
Pressured partner to have sex
7%
Reported partner did to you
Slap, hit, push partner 2.8%
Pinch or pull partner hair 3.2%
Called partner names 14%
Reported abuse %
Reported doing this to partner
Slap, hit, push partner 1.7%
Pinch or pull partner hair 3%
Called partner names 7%
Pressured partner to have sex
1.7%
Reported partner did to you
Slap, hit, push partner 3.5%
Pinch or pull partner hair 3.5%
Called partner names 8.7%
HC 2020 Targets – emotional 4.2%, physical 2.3%, emotional 1.4%

Phase 3: Frequency Rape Details about Rapist
Females (N=684) Males (N=345)
Reported abuse %
Rape (N=83) 12%
Who raped you?
Boyfriend/girlfriend 5.7%
Friend 2.8%
Date 1.9%
Casual acquaintance 1.2%
Parent or relative .9%
Stranger <1%
Reported abuse %
Raped (N=5) 1.8%
Who raped you?
Boyfriend/girlfriend .6%
Friend .6%
Casual acquaintance .6%
Parent or relative (N=1) .3%


What are the benchmarks for Weight?•Healthy Campus
2010
• 19.3. Reduce the proportion of adolescents and college students who are overweight and obese.
• Target – 16%
•Healthy Campus 2020
• NWS-9. Reduce the proportion of students who are obese.• Target – 10.4%• ACHA-NCHA baseline 11.6%
• NWS-8. Increase the proportion of students who are at a healthy weight.• Target: 67.8%• ACHA-NCHA baseline 61.6%
Source: http://www.acha.org/healthycampus/

Prevalence (%) of ObesityBMI > 30 (kg/m2)
14%
18%
13%14%
02468
101214161820
Phase 2 (2000-01) Phase 3 (2009-2013)
Males Females
Healthy Campus 2010 Target 16%a
Healthy Campus 2020 Target 10.4%
Sex difference NSa HC 2010 – obese and overwt

Prevalence (%) of Overweight and Obesity
Weight Category based on BMI Cutpoint
Males (%) Females (%)
ObesePhase 3(2009-13)
18% 14%
OverweightPhase3 (2000-01)
37% 22%***
ObesePhase 2 (2009-13)
14% 13%
OverweightPhase2 (2000-01)
30% 24%*
Healthy Campus Benchmarks
Healthy Campus 2010 16%
Healthy Campus 2020 10.4%
***Difference between males and females p<.001

Prevalence (%) of Normal Weight
52%
43%
60% 62%
0
10
20
30
40
50
60
70
Phase 2 (2000-01) Phase 3(2009-13)
Male
Female
Healthy Campus 2020 target 67.8%

Prevalence (%) of OverweightSex Difference by athletic status
15%***
21%***
8%
14%
0
5
10
15
20
25
Athlete Non-Athlete
Male
Female% O
verw
eigh
t
***Difference between males and females p <.001

Weight loss techniques
Phase 1 Phase 2 Phase 3
Females
Males Females
Males Females
Males
Exercise 77% 50%***
79%*** 54%***
96% 92%
Diet 41% 17%***
41%*** 25*** 72% 50%*
Diet Pills 6% 3%** 10% 6%* 12% 8%
Weight loss techniques among students

Weight loss techniquesPhase 3
Wt loss technique
Male Female
Exercise 92% 96%
Dieting 50% 72%
Skipping Meals 45% 58%
Wt loss program 6.7% 16%

Copyright 2005 Wadsworth Group, a division of Thomson LearningCopyright 2005 Wadsworth Group, a division of Thomson Learning

Survey Questions - Body ImagePhase 1 and Phase 2
1. Which of these figures looks most like you? FIGYOU
2. Which of these figures do you want to look like?
FIGWANT3. Which figure (same gender as you) does
the other gender find most attractive? FIGSAME
4. Which other gender figure do you find most attractive? FIGOTHER

Which of these figures looks most like you?
Phase 1
3.44
Phase 1
3.86
Phase 23.63
Phase 2
3.84

Which of these figures do you want to look like?
Stunkard et al. Figures
Phase 1
3.88
Phase 12.59
Phase 22.75
Phase 23.71

Which figure (same gender as you) does the other gender find most attractive?
Phase 12.56
Phase 1
3.7
Phase 22.62
Phase 23.54

Which other gender figure do you find most attractive?
Phase 13.52
Phase 13.16
Phase 23.39
Phase 23.19

Body Image Dissatisfaction• At any given time, 44% of adult women and 29%
of adult men in the United States describe themselves as trying to lose weight.
• Source: Serdula, MK. et al. Prevalence of attempting weight loss and strategies for controlling weight. JAMA. 1999;282:1353-1358.
• Dissatisfaction is described as discrepancy between identification of one’s own figure and the figure they chose as desirable
• Forrest, K., & Stuhldreher, W. (2007). Patterns and correlates of body image. American Journal of Health Studies, 22(1), 21-25.
• Studies show females are consistently more dissatisfied with their body image than males
• Forrest, K., & Stuhldreher, W. (2007). Patterns and correlates of body image. American Journal of Health Studies, 22(1), 21-25.

Frequency (%) of Body Image Dissatisfaction
Reference: Forrest, Stuhldreher American Journal of Health Studies: 22(1) 2007; 18-25.
Body Image Dissatisfaction Variable (%)
Phase 1 Phase 2
Females Males Females
Males
Not satisfied with actual figure
67% 30% 68% 35%
Believe own body is unattractive to opposite sex
66% 39% 70% 44%
Wants to be thinner than what the opposite sex finds attractive
15% 11% 14% 12%

Changes in Body Image Figures-Female
1 2 3 4 5 6 7 8
1
2
3
4
Amy Ruby- Professional Illustrator

Changes in Body Image Figures-Male
Amy Ruby- Professional Illustrator
Fatness Score1 2 3 4 5
Mus
cula
rity
Sco
re
1
2
3
4
5

Body Image Development
•Developed to assess 2 dimension body images
•Validated by Skin-Fold comparison, height and weight, and waist hip circumference
•Research presented at American College of Sports Medicine
William, R., Sanftner, J., & Pierce, P. (2004). Development of a new visual rating tool for assessing body image in women. ACSM.

Differences between actual and ideal body images.
FIGwant11.0
FIGsame10.00
FIGother11.0
FIGyou11.0

What figure is desired?
Phase 3FIGwant
16.00
Phase 3FIGsame
16.00
Phase 3FIGother
11.00
Phase 3FIGyou
8.00

Beck, A.T., Ward, C. H., Mendelson, M., Mock, J., & Erbaugh, J. (1961) An inventory for measuring depression. Archives of General Psychiatry, 4, 561-571.
Photo source: http://t2.gstatic.com/images?q=tbn:ANd9GcRbPrll7uZQ8Pi8qDy4GoDjwDAKqVPH6P80OZ3KExIXeNF-x2HlfA

Phase 2: Prevalence of Depression Among SRU Students by Sex
Mild Depression
(N=128)
Moderate Depression
(N=60
Marked Depression
(N=48)
Total Depression
(N=236)
Levels of Depression (from Beck Score)
Per
cent
0
5
10
15
20
25
10
5 7
22
16
74
27
Men Women Men Women Men Women Men Women

Phase 3: Prevalence of Depression Among SRU Students by Sex
Mild Depression
(N=192)
Moderate Depression
(N=20)
Marked Depression
(N=25)
Total Depression
(N=237)
Levels of Depression (from Beck Score)
Per
cent
0
5
10
15
20
25
13
1 1
15
22
3 3
28
Men Women
Men
WomenMen
Women
Men Women

Depression in Men and Women
•More women then men are likely to be diagnosed with depression in any give year.
•Efforts to explain this difference are ongoing, as researchers explore certain factors (biological, social, etc.) that are unique to women.
• Source: http://www.nimh.nih.gov/statistics/1mdd_adult.shtml
•Many people experience the first symptoms of depression during their college years.
• Source: http://www.nimh.nih.gov/health/publications/depression-and-college -students/index.shtml

Phase 3: Prevalence of Medical Diagnosis of a Mental Disorder
Question: Have you ever been diagnosed with a mental disorder by a mental health professional?
•Of the 188 females whose Beck score indicated “depressed” ▫32 (17%) reported being diagnosed with a
mental disorder
•Of the 49 males whose Beck score indicated “depressed” ▫3 (6%) reported being diagnosed with a
mental disorder

Phase 2 & 3: Prevalence (%) Depression (yes/no)
Depression assessed by Beck Inventory
Males (%) Females (%)
Phase 3(2009-13) 15% 28%
Phase 2 (2000-01) 19% 23%
Healthy Campus 2020 MHMD-6a Increase the proportion of students reporting a
diagnosis of depression and receiving treatment within the
last 12 months.
Healthy Campus Benchmarks Target: 91.9%
Baseline: 83.5%

Depression in College Men and Women•Studies suggest that college students who
have depression are more likely to▫Smoke▫Drink to get drunk and experience
problems related to alcohol abuse ▫Use other substances
•Major risk factor for suicide
• Source: http://www.nimh.nih.gov/statistics/1mdd_adult.shtml

Phase 2: Prevalence of Gambling Difficulties
Depressed vs. Not Depressed
0
1
2
3
4
5
6
7
8
9
10
Needed Help for Gambling Sought Help for Gambling
8
10
1.3 1
Depressed (N=61)
Not Depressed (N=224)P
erce
nt
Too few subjects reported gambling in Phase 3 for valid statistical comparisons.

Phase 2: Significant Correlates Relationship Difficulties:
Depressed vs. Not Depressed
81
6259
74
68
47
56
65
4438
58
32
26
33
0
10
20
30
40
50
60
70
80
90DepressedN=232Not DepressedN=715
Dating Family Finances Personal Health
Roommate Work Time Mgt
Relationships
Per
cent
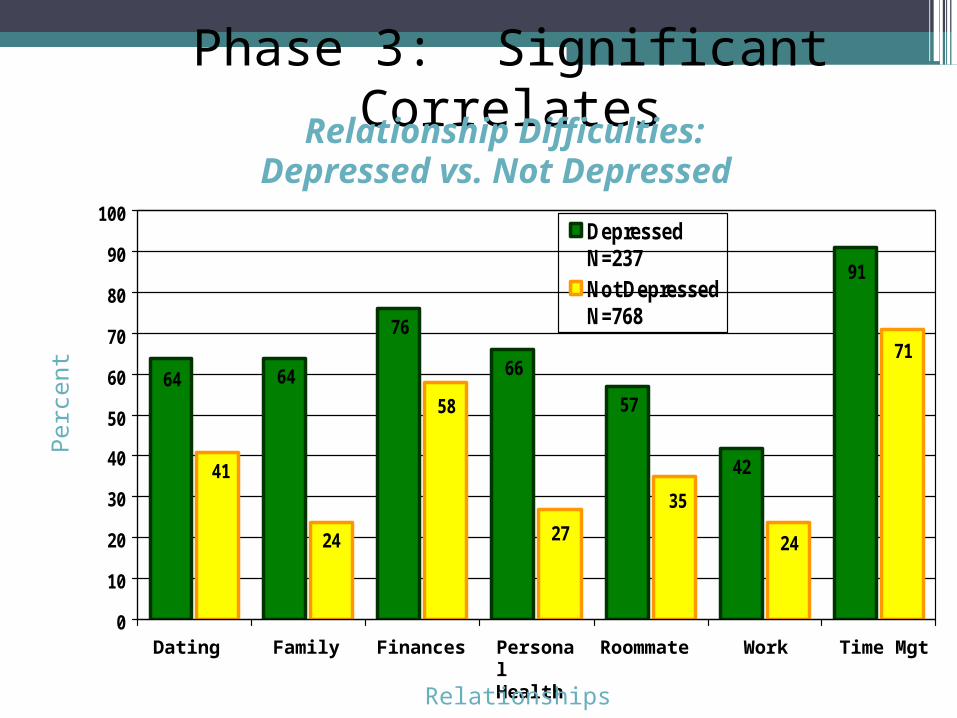
Phase 3: Significant Correlates Relationship Difficulties:
Depressed vs. Not Depressed
91
64 64
76
66
57
42
71
41
24
58
35
27 24
0
10
20
30
40
50
60
70
80
90
100DepressedN=237Not DepressedN=768
Dating Family Finances Personal Health
Roommate Work Time Mgt
Relationships
Per
cent

Phase 3: Female Differences in Behaviors
Depressed vs. Not Depressed
42
9
82
61
24
3
73
56
0
10
20
30
40
50
60
70
80
90
Current Smoker Fight UI Drinks Alcohol High Risk Drinking
Depressed (N=188) Not Depressed (N=483)
Per
cent
p <.001 p <.05p <.01 Not significant

Phase 3: Male No Differences in Behaviors
Depressed vs. Not Depressed
35
16
8277
28
13
79
68
0
10
20
30
40
50
60
70
80
90
Current Smoker Fight UI Drinks Alcohol High Risk Drinking
Depressed (N=49) Not Depressed (N=287)
Per
cent

Prevalence (%) of Attempted Suicide
3.6%
7%
1.5%1.9%
5%
0.9%
0123456789
10
Phase 1 (1996-98) Phase 2 (2000-01) Phase 3 (2009-2013)
Males Females
Healthy Campus 2020 Target 1.2%
Sex difference NS
%


Healthy Campus 2020 Objectives related to physical activity
• PA-2.1 Target 53.5% Baseline 48.7%▫ Increase the proportion of students who report meeting
current federal guidelines for aerobic physical activity
• PA-2.2 Target 41.4% Baseline 37.6%▫ Increase the proportion of students who report meeting
current federal guidelines for muscle strengthening activity

2008 Physical Activity Guidelines for Americans
• Moderate Intensity Aerobic Physical Activity▫ At least 150 minutes/week
• Vigorous Intensity Aerobic Physical Activity▫ At least 75 minutes/week
• Muscle Strengthening Moderate or Vigorous Activities▫At least 2 or more days/week involving all major
muscle groups
• Sedentary Time▫All adults should avoid inactivity

Physical Activity Questions Phase 3
Activity Questions Sedentary Questions• On how many days &
how many minutes do you perform the following activities:▫Light intensity PA▫Moderate intensity PA▫Vigorous intensity PA▫Stretching▫Strengthening
exercise
• In your spare time how many hours during the day do you spend:▫Napping▫Lying down (not
sleeping)▫Sitting▫Standing

Prevalence (%) of those who met Aerobic Physical Activity
Guidelines
% M
eetin
g G
uide
lines
Sex difference *p <.05

Prevalence (%) of those who met Physical Activity Guidelines
% M
eetin
g G
uide
lines
Sex difference *p <.05; ***p<.001
Healthy Campus 2020 Target 41.4%

Did physical activity patterns differ?
•Athletes•BMI (Obese vs. Not Obese)

Prevalence (%) of those who met Physical Activity Guidelines by
Athletic Status
% M
eetin
g G
uide
lines
Athletic Status difference ***p<.001

Prevalence (%) of those who met Physical Activity Guidelines by BMI-
Obese
% M
eetin
g G
uide
lines
BMI difference **p<0.01

Should we focus on inactivity?Inactivity physiology
◦ significant time spent in sedentary behaviors presents additional cardiovascular and metabolic risk
◦above not being physically active ◦ (Hamilton, Healy, Dunstan, et al., 2008)
•College students participate in many hours of sedentary behavior due to their studies and chosen leisure pursuits

Sedentary Time (Mean 9.41 + 4 hours/day)
Significantly less sedentary time No significant difference
▫ Met Mod/Vig Aerobic PA recommendations (p=.001)
▫ Athletes (p=.001)
• Overweight BMI status (p=.970)
• Sex (p=.972)

Photo source: http://img.webmd.com/dtmcms/live/webmd/consumer_assets/site_images/articles/health_tools/sleep_disorders_slideshow/photolibrary_rm_photo_of_woman_waking_during_rem_sleep.jpg

Sleep loss…a health concern?
•National Health Interview Survey▫Increase of 5-6% of adults who report <6
hrs/night between 1985 and 2004
•Significant assoc found between short sleep duration <6 hrs/night ▫Increased prevalence of obesity or higher
BMI▫Increased prevalence of diabetes▫Increased prevalence of hypertension
Best Pract Res Clin Endocrinol Metab. 2010 October ; 24(5): 731–743

Prevalence %
Prevalence (%) of Sleep (hrs/night)
Question: How many hours do you typically sleep at night?

Prevalence %
Prevalence (%) of difficulty falling asleep Question: In a typical week, how many times do you have difficulty falling asleep when you go to bed?

Frequency (%) of Sleep Aids
Sleep Strategies %
Females Males
Watch TV, read, or other diversion
44% 40%
Take naps the next day 43% 34%
No action taken 27% 36%
Eat something 10% 12%

Frequency (%) of Sleep Aids
Sleep Aids - Medicinal %
Females Males
OTC Sleep Aids (Tylenol or Advil PM)
10% 7%
Benadryl or Antihistamine 7% 4%
Melatonin (Herbal Sleep Aid) 4% 7%
Prescription Sleeping Medications
2% 2%

Prevalence of difficulty falling asleep among students responding yes/no to having difficulty
with…
Females Males
Correlate Yes vs. No %
Depression 89% v 81%p=.012
Time management 85% v 77%p=.029
Correlate Yes vs. No %
Depression 92% v 80%p=.01
Dating Relationships
87% v 76%p=.010
Personal Health 90% v 78%p=.025
Roommate(s) 88% v 78%P=.033


Why is debt a health concern?University of Minnesota Health
Assessment Survey Results•Credit card debt was significantly higher
among tobacco users than non users•Credit card debt was significantly higher
among alcohol users than non users
Reference: http://www.bhs.umn.edu/healthdata/Summary%20Report-1998%20SHS.pdf.

Why is debt a health concern?
•Lavrakas and Drentea▫Credit card debt was related to stress and poor
physical health
▫ Reference: Social Science & Medicine. 2000; 50(4): 517-530
•Pinto, Parente and Palmer ▫Found more anxiety about credit card use among
high versus low academic performance
▫ Reference: Psychological Reports 2000; 86: 643-652
•Mansfield, Pinto and Parente▫Credit card debt was related to impulsivity and
less self-control
▫ Reference: Psychological Reports. 2003; 92: 1067-1078

Frequency (%) of Credit Card Use
Credit Card Variable (%)
Phase 2 Phase 3
Females (N=560)
Males(N=386)
Females(N=679)
Males(N=337)
Percent had Credit Card 54% 48% 29% 34%
Females(N=302)
Males(N=185)
Females(N=194)
Males(N=116)
Percent with Credit Card DebtOf those with credit cards
51% 47% 24% 29%
Reference: Forrest, Stuhldreher American Journal of Health Studies: 22(1) 2007; 18-25.

Phase 3: Significant Associations with Credit Card Debt
More likely to have Credit Card Debt if…
Females (N=194) Males (N=116)
Correlate %
Non-athlete v athlete 29% v 15%
p=.026
Non-white than white
50% v 21%
p=.010
Drive under the influence than not do that
35% v 13%
p=.001
Correlate %
Non-white than white
88% v 25%
p=.001
Gamblers than non-gamblers
45% v 23%
p=.018
“ Depressed” versus “non-depressed” (BECK score)
22% v 9%p.056
Ride with someone under influence than those who do not
46% v 21%
p=.007

Frequency of Admitting to Gambling Problems by Sex
Phase 2 Phase 3
• 5% of females and 9% of males reported that they wanted to stop gambling but could not (gender difference p< .01)
• 3% of females and 9% of males reported having been told that they need help with their gambling problem (gender difference p< .001)
• 3% of females and 6% of males reported seeking help for gambling (NS)
• .6% of females and 2.6% of males reported that they wanted to stop gambling but could not (gender difference p< .01)
• 0.4% of females and 0.3% of males reported having been told that they need help with their gambling problem (NS)
• 0.3% of females & 0.3% of males reported seeking help for gambling (NS)

Health Impediments to Academic Performance
HC 2020 A1-1.1 Reduce the proportion of student who report that their academic performance was adversely affected by work past 12 mos.
HC 2020 A1-1.1 Reduce the proportion of student who report that their academic performance was adversely affected by stress/anxiety past 12 mos.
• Females reporting difficulty with work more likely to have academic problems than those not having work problems.
• (84% v 67% p=.000)
• Females scoring depressed (BECK) more likely to have academic problems than those not scored as depressed.
• (90% v 66% p=.000)• Males scoring depressed
(BECK) more likely to have academic problems than those not scored as depressed.
• (83% v 62% p=.005)

Summary•Tobacco
▫25-30% students smoke▫25% have tried to quit
•Alcohol▫> 75% drink▫High risk drinking has been stable 50-60%▫Of concern is having sex under the
influence▫Good news – many students are practicing
strategies to prevent intoxication!

Summary•Sexual behavior
▫25% of students are not sexually active▫Condom (barrier) use is up 40%-30%-60%▫Moving toward the HC 2020 objective for
barrier use•Violence & Safety
▫Few report relationship problems▫Highest prevalence is for verbal abuse – 14-
19%▫DUI remains about 20%▫Riding with someone under the influence – 25%

Summary•Nutrition and Weight
▫Only 20-25% of females and 30-36% of males are meeting Dietary Guidelines
▫14-18% of students are obese
•Physical Activity▫Both males and females exceed the current
aerobic and resistance training recommendations
▫Time spent in sedentary behavior should be monitored

Conclusion•Typical problems presented by NCHA in the past
prevail▫Tobacco, alcohol, sexual behaviors, safety
•More current challenges▫Move toward wellness particularly for nutrition and
physical inactivity▫Role of mental health identification and referral for
students at risk•Emerging health concerns
▫New examination of body image▫Role of student debt on health▫Impact of physical inactivity (sedentary) on wellness

contact: [email protected]
Assistant to the Dean, College of Health, Environment and Science
Thank you!