
Dreamforce Digital Transformation - From Vision to Value Realization
Upload
sap-nederlandCategory
view
867download
0
SAP Procurement & Logistics Day 2012
30 augustus

Benchmarks and Value Management
for a value chain transformation

© 2012 SAP AG. All rights reserved. 3
The Business Case for Value Management
percentage of
benefit realization
achieved through
high best practice
adoption
2009 Value Management (VM) Survey Results
300+ Global Companies Surveyed
2.4x
HIGHER
return on investment
for companies with
high best practice
adoption
4x
MORE
companies with high
best practice
adoption attain value
“on” or “ahead” of
time
2.4x
MORE
companies with high
best practice
adoption deliver
projects “on” or
“below” budget
57%
L
M
H
39%
65%
119%
L
M
H
72%
173%
27%
L
M
H
11%
43%
48%
L
M
H
29%
71%
1.6x
HIGHER
SAP/AMR Value Management Survey Results 2009

© 2012 SAP AG. All rights reserved. 4
SECURE
SUCCESS
SAP Value Engineering: SAP investment to help the
customers to deliver on time, on budget and on value!
Assess and prioritize opportunities with benchmarking
Build the decision case and set success KPIs
Define the target architecture & roadmap
Value Partnership Services
Establish Value Management Office
Build value based architecture and roadmap
Define and agree optimized business processes
Optimize TCO
Assess delivered benefits
Optimize value for the business

© 2012 SAP AG. All rights reserved. 5
SAP Value Proposition
How to uncover the full potential of a business transformation?
What do we
improve?
How do we
make the
change?
What is the
business
value?
Performance Benchmarking
Value Discovery Workshop
Business Case / Roadmap
1
2
3

© 2012 SAP AG. All rights reserved. 6
SAP Benchmarking +25 business process and +10.000 surveys
Corporate Services
Human Resources
Operations Support
Finance and Analytics
Planning Operations Distribution Sales & Marketing R&D Service
Financial & Compliance Business Intelligence/ Analytics
Human Capital Management Talent Management
SRM/ Procurement
Manufacturing
Total Cost of Ownership (TCO) Mobility
Supply Chain Management
Transportation Mgmt
Warehouse Mgmt
NPDI
Enterprise Asset Management EH&S Compliance
Customer Contact Centers
Sales Effectiveness
Trade Promotion Management
Customer Service & Support
Order to Cash
Enterprise Health Check
Marketing
High Perf. Analytics
Db Geographic Coverage
Main Industries
Automotive
Oil & Gas
CP & High Tech
Industrial & Mill Products
NA
EMEA
APJ
Other
© 2012 SAP AG. All rights reserved. 7
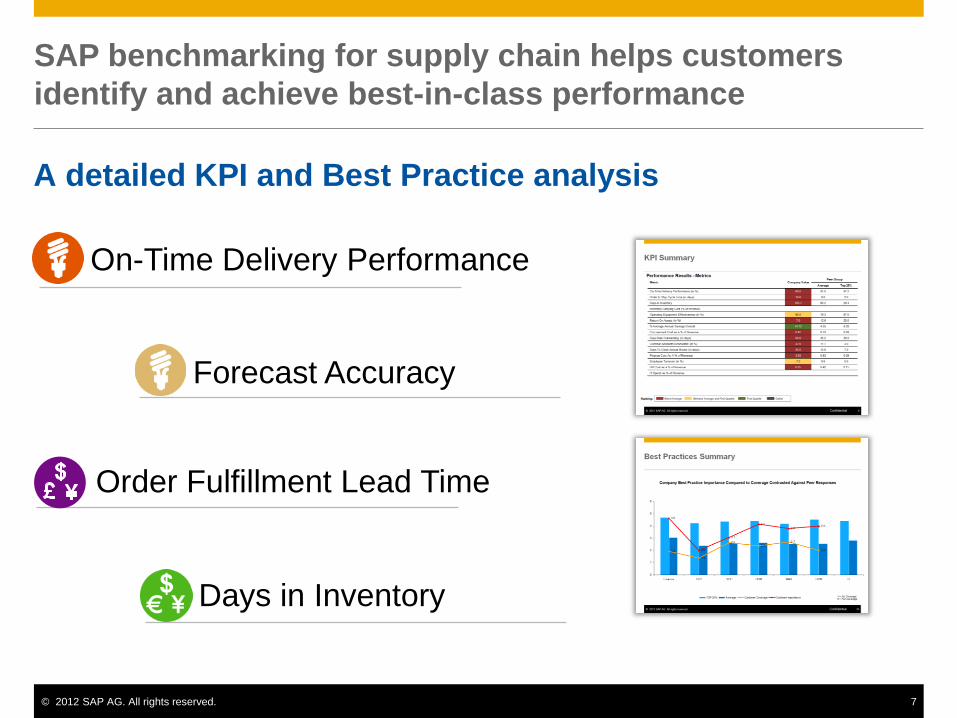
SAP benchmarking for supply chain helps customers
identify and achieve best-in-class performance
On-Time Delivery Performance
Forecast Accuracy
Days in Inventory
A detailed KPI and Best Practice analysis
Order Fulfillment Lead Time

© 2012 SAP AG. All rights reserved. 8
Personalized report is available for you: KPIs, improvement areas, best practices and suggested SAP solutions
Value/
Performance
What defines
“Value”?
What are the
most critical
performance
indicators?
High-Impact
Strategies
What are
proven
improvement
strategies?
What are
actionable sub
strategies?
Enabling Best
Practices
What best
practices
should be put
in place to
support a
given
strategy?
Enabling
Solutions
How do SAP
solutions
enable high-
impact
strategies and
ultimately
value?

© 2012 SAP AG. All rights reserved. 9
Align Supply to
Demand
Strategy Report Example Inventory Reduction
Inventory Days
of Supply
Value/KPI
High-Impact
Strategies
Reduce Variability
in Execution
Implement a
Collaborative
Demand Planning
Process
• Customer data captured directly
from external feed e.g. EDI
• Dynamic and frequently updated
forecasts
• Forecasting at SKUs / inventory
location granularity level
Actionable Sub Strategies Enabling Best Practices
Enabling Solutions
Integrate Supplier
Network
66 88 - 25%
Forecast Granularity /
Inventory Days of Supply*
Low High
• Gain visibility into customer
demand and actual sales
• Build forecast collaboration
capabilities with sales & finance
• Incorporate new product
introductions, promotions and
sales force judgment into
forecast
• Manage inventory and
replenishments for key
customers
Note: *Consumer Products, North America and EMEA

© 2012 SAP AG. All rights reserved. 10
SAP proposes an Innovation Discovery Workshop
Propose one or two days “innovative
workshop” with your stakeholders facilitated
by SAP
The aim of the workshop is to help client
identify opportunities for innovation
and growth
Participants from customer side are
stakeholders from business & IT
This approach is based on design
thinking, graphically facilitated by SAP
Value Engineering team
Big Deal 2.0
Oct 2011 Industry
Trends
Innovation
Real
Time
Mobility
On-Demand
Game
ChangersTechnology
Speed
Flexibility
Vision !
Value !
Business Case and / or Value Roadmap

© 2012 SAP AG. All rights reserved. 11
What is Leading Performance?
Impact of Best Practice Adoption on Procurement KPIs
Source: SAP Benchmarking database “This information is provided by SAP on an "as-is" basis without warranty of any kind, and subject to the "General Disclaimer" and other terms of use stated at http://www.sap.com/company/legal/copyright/. Any results or comparisons shown are for general information purposes only and any particular data or analysis should not be interpreted as demonstrating a cause and effect relationship. Comparable performance on one given key performance indicator does not guaranty comparable performance on another key performance indicator.”
Organizations Today Improvement Potential Examples
Less than 50% operate a single,
integrated procurement system …
… but those who do achieve
on average over 40% higher
annual savings
Purchase requisition to order -98%
reduced PO pricing errors -20%
Employee productivity +20%
Reduced expenses -19%
Headcount -31%
Time to create purchase orders - 80%
Purchasing dept productivity +30%
More than 50% have no system
controls in place to mandate
contract compliance …
… but those who do have on
average 40% lower maverick
spending
Less than 40% have full visibility
into global supplier spend data …
… but those who do have on
average 35% higher annual
savings
Less than 45% allow their
suppliers to maintain their own
data and invoices for approval …
… but those who do have on
average 20% lower
procurement process costs

© 2012 SAP AG. All rights reserved. 12
Call to Action: Benchmark@ SAP Value Management: https://valuemanagement.sap.com/#
End-to-end benchmarking support: from Enrollment to Insight
Performance Benchmarking
Value Discovery Workshop
Business Case / Roadmap
1st Step:

Thank you!


