Benchmarking/Performance Measuring
48
NREL is a national laboratory of the U.S. Department of Energy Office of Energy Efficiency and Renewable Energy operated by the Alliance for Sustainable Energy, LLC ASHRAE Region VI CRC Paul A. Torcellini, Ph.D., PE May 8, 2009 www.highperformancebuildings.gov Tech Session 4: Benchmarking/ Performance Measuring
-
Upload
ashrae-region-vi -
Category
Design
-
view
1.051 -
download
0
Transcript of Benchmarking/Performance Measuring

NREL is a national laboratory of the U.S. Department of Energy Office of Energy Efficiency and Renewable Energy operated by the Alliance for Sustainable Energy, LLC
ASHRAE Region VI CRC
Paul A. Torcellini, Ph.D., PE
May 8, 2009
www.highperformancebuildings.gov
Tech Session 4: Benchmarking/ Performance Measuring

National Renewable Energy Laboratory Innovation for Our Energy Future
Case Study Buildings– Oberlin College Lewis Center
• Oberlin, Ohio • goal: zero net site energy use (79%)
– Zion Visitor Center• Springdale, UT • goal: 70% energy cost savings (65%)
– Cambria Office Building• Ebensburg, PA • goal: 66% energy cost savings (43%)
– Chesapeake Bay Foundation (CBF)• Annapolis, MD • goal: LEED 1.0 Platinum Rating (25%)
– Thermal Test Facility (TTF)• Golden, CO • goal: 70% energy savings (51%)
– BigHorn Home Improvement• Silverthorne, CO • goal: 60% energy cost savings (53%)
– Science House, Science Museum of Minnesota• St. Paul, Minnesota• goal: zero net site energy use (139%)

Different Metrics-Different Results
0%
10%
20%
30%
40%
50%
60%
70%
80%
90%
100%
Oberlin BigHorn TTF Cambria Zion CBF
Per
cent
Sav
ings
Percent Net Source Energy Savings
Percent Net Site Energy Savings
Percent Site Energy Savings
Percent Energy Cost Savings
measured data vs. simulated basecasesimulated as-built vs. simulated basecase

BigHorn Home Improvement Center
18,400 sqft retail store and 24,000 sqftwarehouse
DaylightingNatural ventilation (no mechanical cooling)Radiant floorsTranspired solar collectorPV

Ventilation PreheatVentilation PreheatOver 70% efficientOver 70% efficientActs as a building skinActs as a building skin11¢¢/kWh heat production/kWh heat production
Transpired Solar CollectorTranspired Solar Collector

Electric Lighting and DaylightingElectric Lighting and Daylighting

Daylighting System PerformanceDaylighting System Performancesavings: daylighting = 65%; overall = 79%
0
1000
2000
3000
4000
5000
6000
7000
8000
9000
10000
JAN FEB MAR APR MAY JUN JUL AUG SEP OCT NOV DECMonth
Ener
gy C
onsu
mpt
ion
(kW
h)
0
10
20
30
40
50
60
70
80
90
100
Perc
ent R
educ
tion
from
D
aylig
htin
g
No Daylighting
Daylighting
% savings

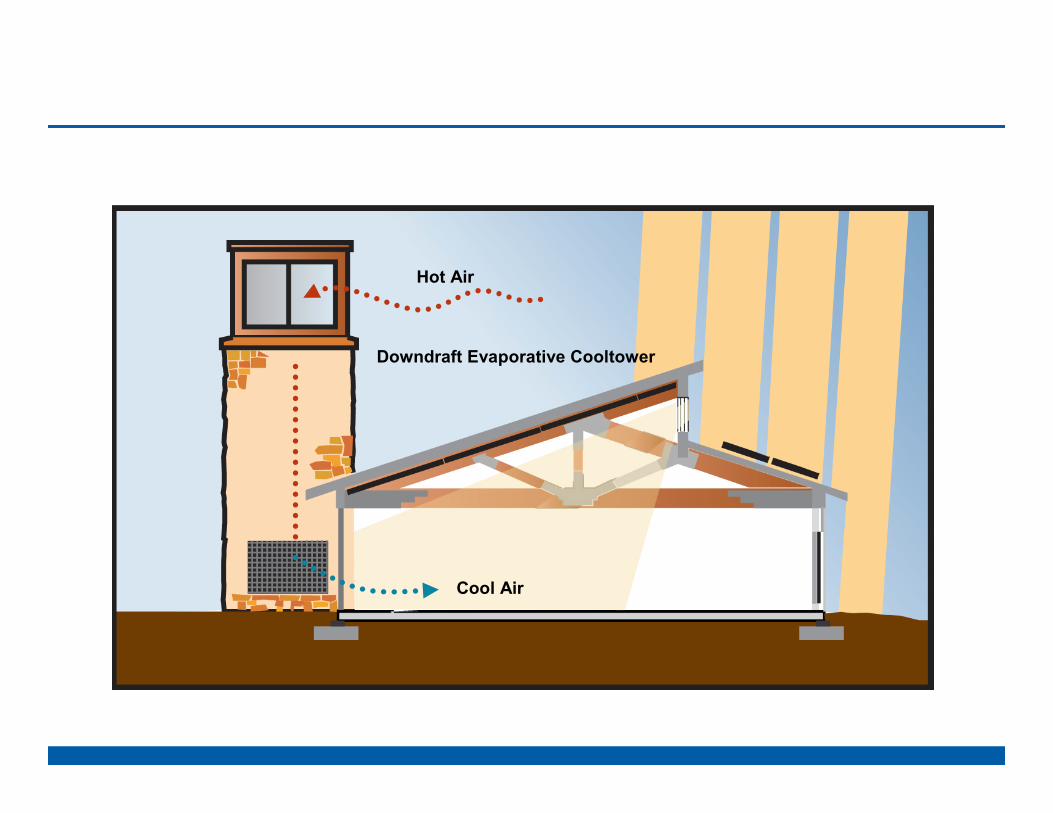
Zion Visitor Center
7.2 kW PV system (UPS)7.2 kW PV system (UPS)Passive evaporative coolingPassive evaporative coolingExcellent thermal envelopeExcellent thermal envelopeTrombeTrombe wallswallsOverhangsOverhangsDaylightingDaylighting

Zion Visitor Center
Daylighting
Operable Windows
Overhangs
Downdraft Evaporative Cooltower
Cool Air
Hot Air

Trombe Wall
Heating
Radiant Ceiling Panels

Cooltowers

HVAC System
Envelope is integral to the heating and cooling system– Cooltowers and Trombe wall– Natural ventilation
Ceiling fansBathroom/office exhaust fansNo ductworkElectric radiant heat (propane expensive)Demand responsive EMSNo fuel storage or mechanical rooms

PV System
7.2 kW (24 300-W modules)2 single phase
inverters (one with UPS)
PV can meet loads of phone, security, POS, and cooltowers (UPS battery backup)
Grid power out 40 times during monitoring year.
PV provides about 8% of annual total.

Other Features
Extensive daylightingGood thermal envelopeTrombe wall heatingOverhangsPV can meet loads of
phone, security, POS, and cooltowers (UPS battery backup)
Grid power out 40 times during monitoring year.PV provides about 8% of annual total.70% energy savings (measured)

Peak Demand
Plot of 15-minute data showing demand responsive controls
-5
0
5
10
15
20
25
30
35
40
0:00
1:00
2:00
3:00
4:00
5:00
6:00
7:00
8:00
9:00
10:0
0
11:0
0
12:0
0
13:0
0
14:0
0
15:0
0
16:0
0
17:0
0
18:0
0
19:0
0
20:0
0
21:0
0
22:0
0
23:0
0
End
Use
, Pur
chas
ed, a
nd P
V P
rodu
ctio
n (k
W)
Net UsedTotal PVTotal HVACTotal EquipmentTotal LightingHot Water Heaters
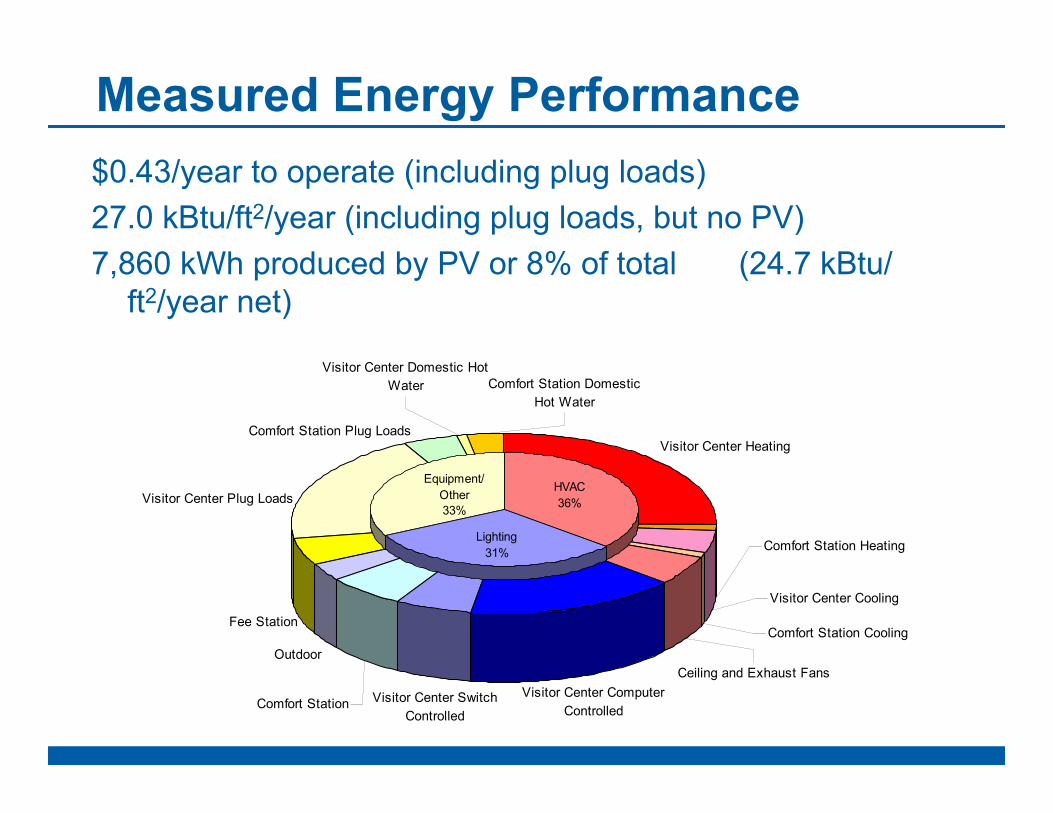
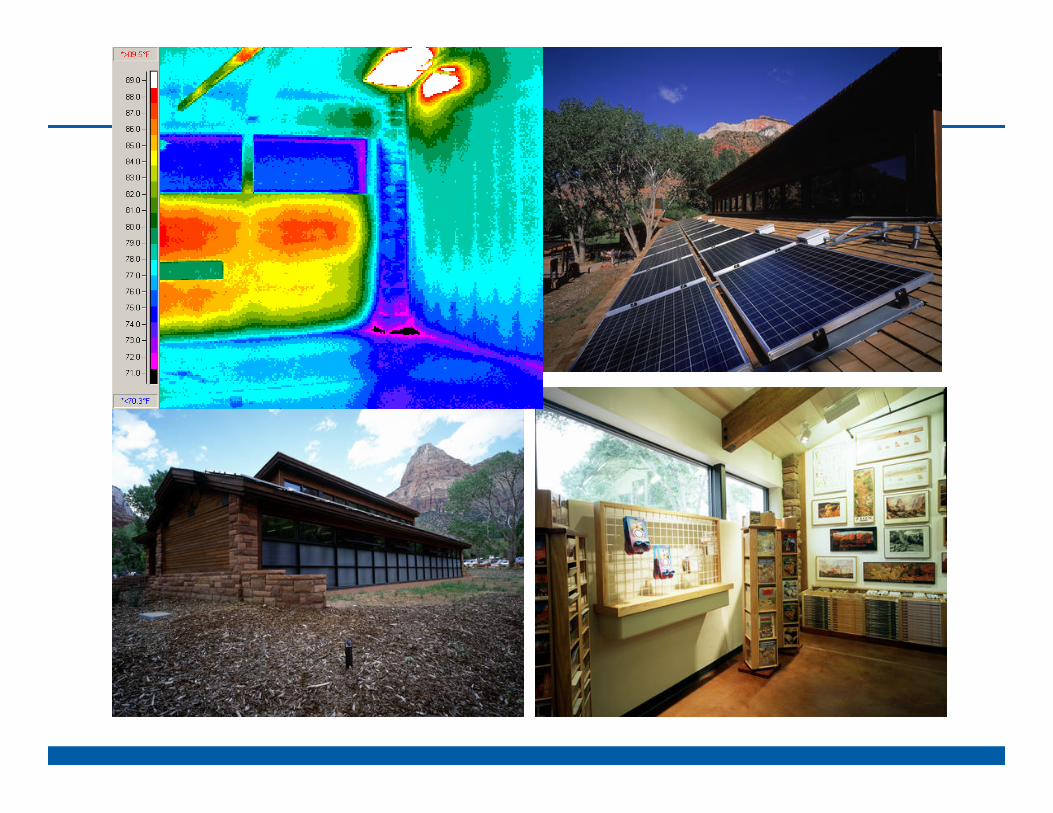
Measured Energy Performance$0.43/year to operate (including plug loads)27.0 kBtu/ft2/year (including plug loads, but no PV) 7,860 kWh produced by PV or 8% of total (24.7 kBtu/
ft2/year net)
Visitor Center Heating
Fee Station
Ceiling and Exhaust Fans
Comfort Station Cooling
Comfort Station Plug Loads
Visitor Center Domestic Hot Water Comfort Station Domestic
Hot Water
Visitor Center Plug Loads
Outdoor
Comfort Station Visitor Center Switch Controlled
Visitor Center Computer Controlled
Visitor Center Cooling
Comfort Station Heating
Equipment/Other33%
HVAC36%
Lighting31%
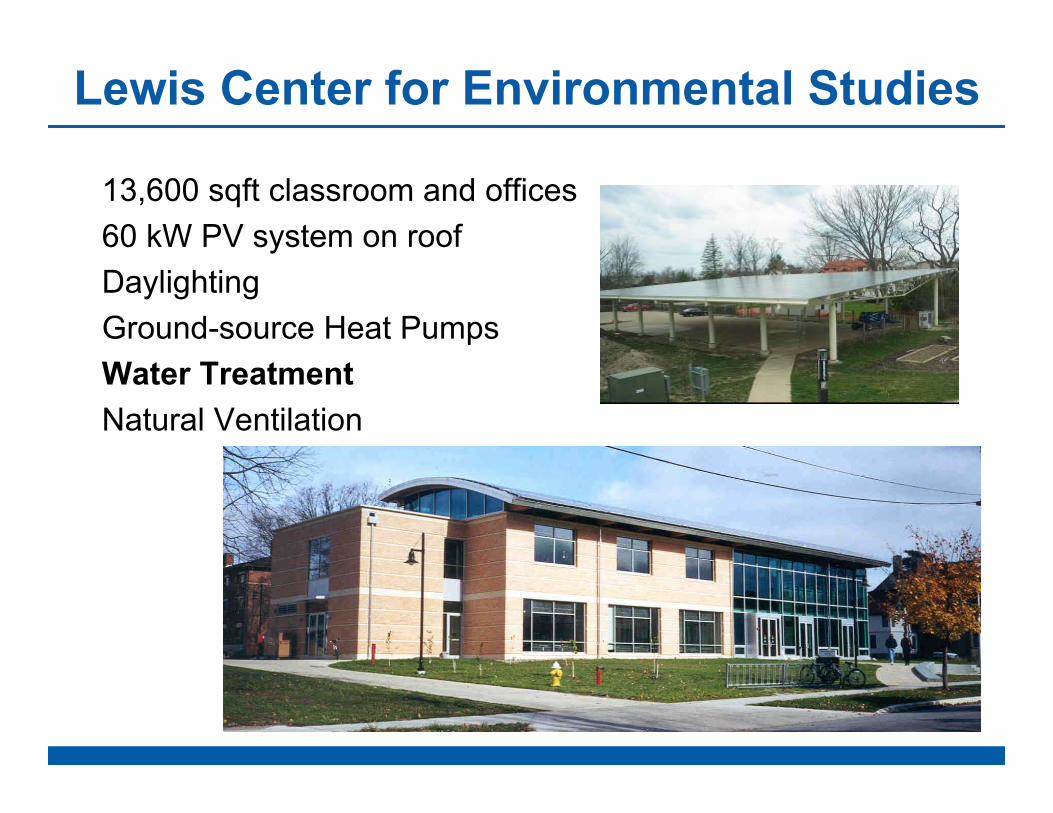
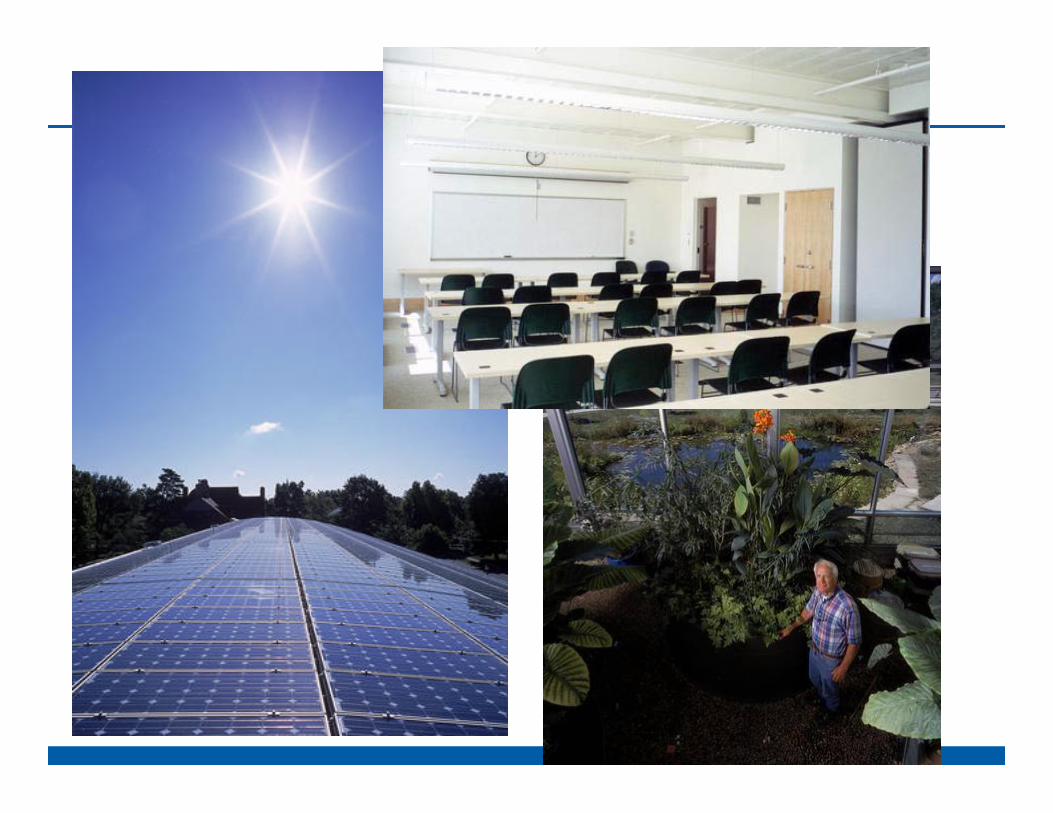
Lewis Center for Environmental Studies
13,600 sqft classroom and offices60 kW PV system on roofDaylightingGround-source Heat PumpsWater TreatmentNatural Ventilation

National Renewable Energy Laboratory Innovation for Our Energy Future
Oberlin Lewis Center Monthly Energy Performance January 2000 - December 2002
0
200
400
600
800
1000
1200
1400
1600
Jan-
00Fe
b-00
Mar
-00
Apr
-00
May
-00
Jun-
00Ju
l-00
Aug
-00
Sep
-00
Oct
-00
Nov
-00
Dec
-00
Jan-
01Fe
b-01
Mar
-01
Apr
-01
May
-01
Jun-
01Ju
l-01
Aug
-01
Sep
-01
Oct
-01
Nov
-01
Dec
-01
Jan-
02Fe
b-02
Mar
-02
Apr
-02
May
-02
Jun-
02Ju
l-02
Aug
-02
Sep
-02
Oct
-02
Nov
-02
Dec
-02
Dai
ly A
vera
ge M
onth
ly C
onsu
mpt
ion
and
Prod
uctio
n(k
Wh/
day)
Utility BillsEquipmentTotal LightsTotal CoolingTotal HeatingPV Production
The Value of Monitoring

Receptacles
Emergency receptacles
PV system consumption
DHW
Auditorium lights
Indoor room lights
Hydronic circulation pumps 3-6
VSD Hydronic circulation pumps 1-2
Room Heat Pumps
Classroom energy recovery unit
Auditorium energy recovery unit
Emergency lights
Sidewalk lights
Parking lot lights
Classroom ventilation heat pump
Auditorium heat pump
Hydronic system electric boiler
Wastewater treatment
Elevator
Total Equipment
28%
Total Lights13%
Total HVAC59%
End Loads
National Renewable Energy Laboratory Innovation for Our Energy Future
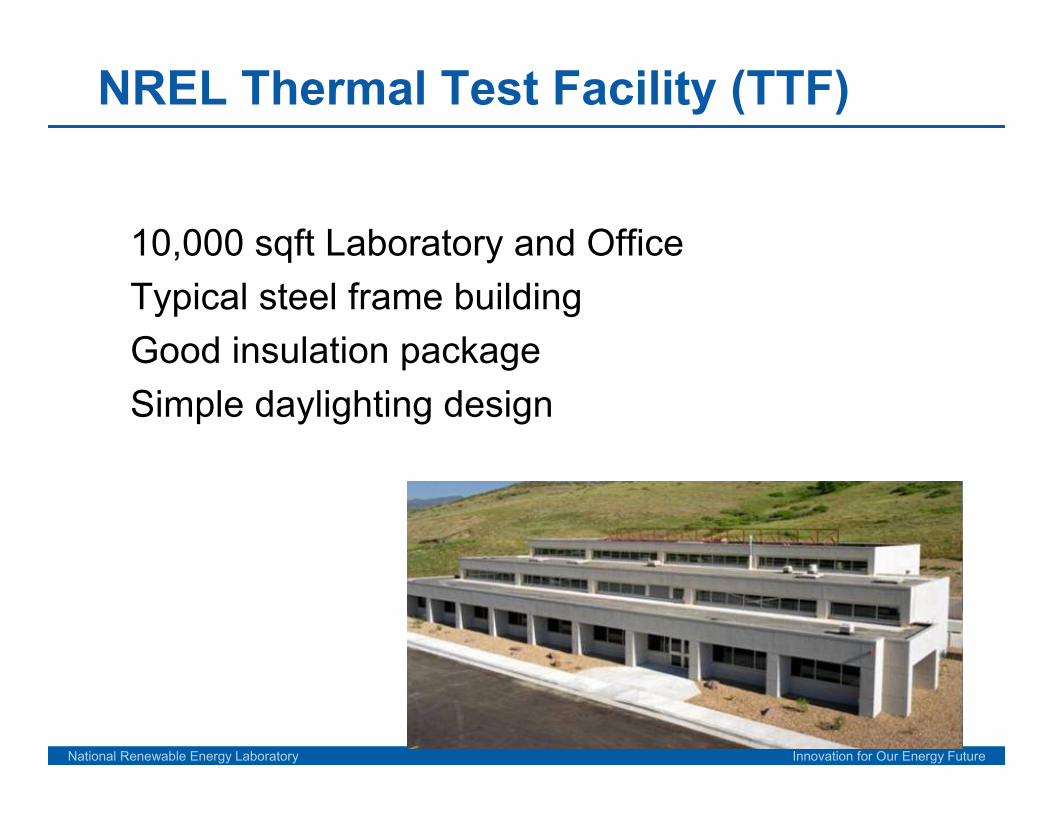
NREL Thermal Test Facility (TTF)
10,000 sqft Laboratory and OfficeTypical steel frame buildingGood insulation packageSimple daylighting design

National Renewable Energy Laboratory Innovation for Our Energy Future
Plug Loads22.0%
Exterior Lights4.2%
Hot Water1.1%
Heating4.0%
Cooling1.6%
Fans/Pumps1.8%
Lighting12.1%
Savings52.9%
Plug Loads22.0%
Exterior Lights4.2%
Hot Water1.1%
Heating2.7%
Cooling8.3%
Fans/Pumps4.6%
Lighting57.0%
Loads Example
Code Building
Final Design
72% savings excluding plug loads and exterior lights

Available Roof Layouts

More Daylighting…

Education and Marketing
Image…

High Performance Building’s Database
• Shared, on-line repository of in-depth descriptions and data on high-performance and green buildings
• Commercial, residential, campus• Single database, multiple portals• Examples of low-energy buildings to motivate
industry• Mechanism for others to report on building
performance and lessons learned
http://www.eere.energy.gov/buildings/database/

Case Study Database Objectives
• Lack of comprehensive energy-based case studies
• Provides feedback to both DOE and industry– Industry needs proof that low-energy is possible– DOE needs feedback to understand successes and failures
in real world examples
• Create a standardized reporting format for building energy performance

Pages for – Overview, Process, Finance, Land Use,
Site/Water, Energy, Materials, Indoor Environment, Images, Ratings, Lessons Learned, and Learn More

Features
Pages for – Overview, Process, Finance, Land Use,
Site/Water, Energy, Materials, Indoor Environment, Images, Ratings, Lessons Learned, and Learn More
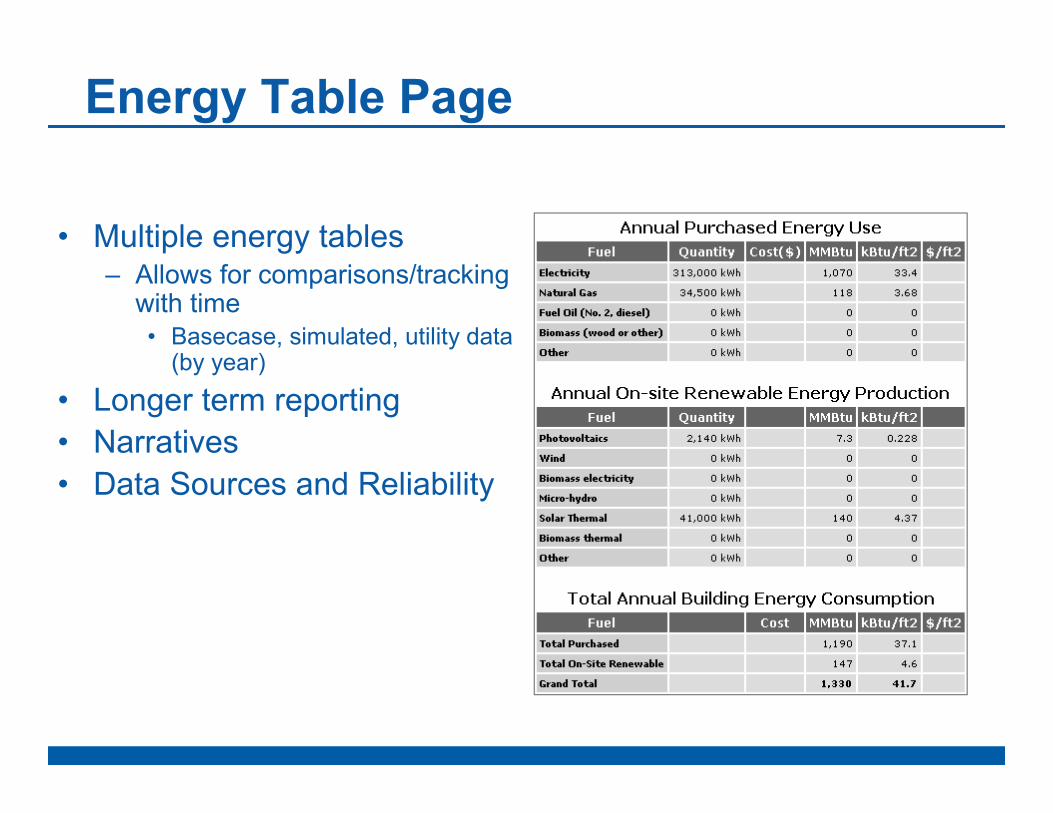
Energy Table Page
• Multiple energy tables– Allows for comparisons/tracking
with time• Basecase, simulated, utility data
(by year)
• Longer term reporting• Narratives• Data Sources and Reliability

Portals– DOE High-Performance Buildings Database (101 projects)– BuildingGreen, Inc. (230 projects)– American Institute of Architects (92 projects)
• Top Ten Winners– U.S. Green Building Council (108 projects)
• LEED Case Studies– Federal Energy Management Program (44 projects)
• New Federal buildings must be entered by EPACT2005– Efficiency Vermont (4 projects)– Cascadia Chapter USGBC (35 projects)– DOE Net Zero Energy Buildings (4 projects)
• Buildings that have measured performance of ZERO– ASHRAE (5 projects)
• AEDG Case Studies– DASH (New project)
• Focus on financial/real estate/productivity metrics– International Energy Agency – Solar Heating and Cooling Programme Task 40
• International case studies for Zero and near Zero Commercial and Residential Project (new as of 11/15/08)
– Massachusetts Technology Collaborative (20 projects)– There are others…
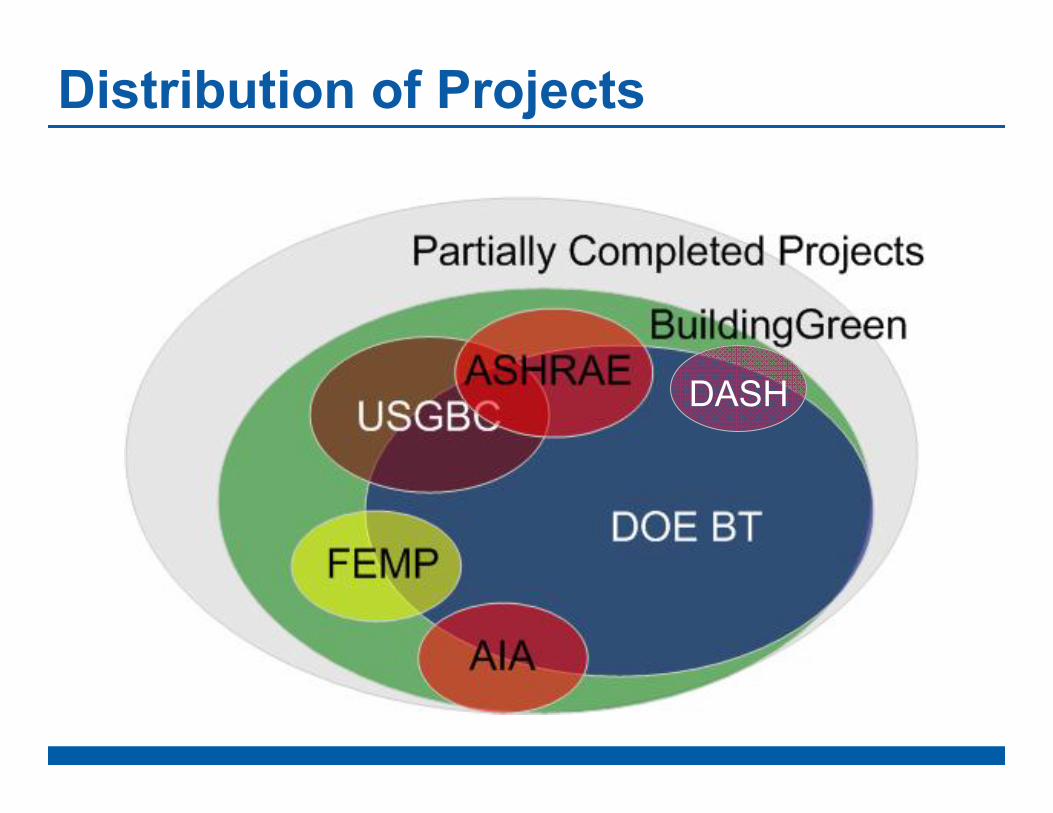
Distribution of Projects
DASH

National Renewable Energy Laboratory Innovation for Our Energy Future
High-Performance Buildings Database
Share successes and lessons learned about projects
Public databaseActual Energy InformationFEMP, USGBC, AIA, DOE all have “front
ends”A special section for ZEB’s.www.highperformancebuildings.gov

You can enter projects…
• Go to www.highperformancebuildings.gov– enter the database– Create a login and submit a project
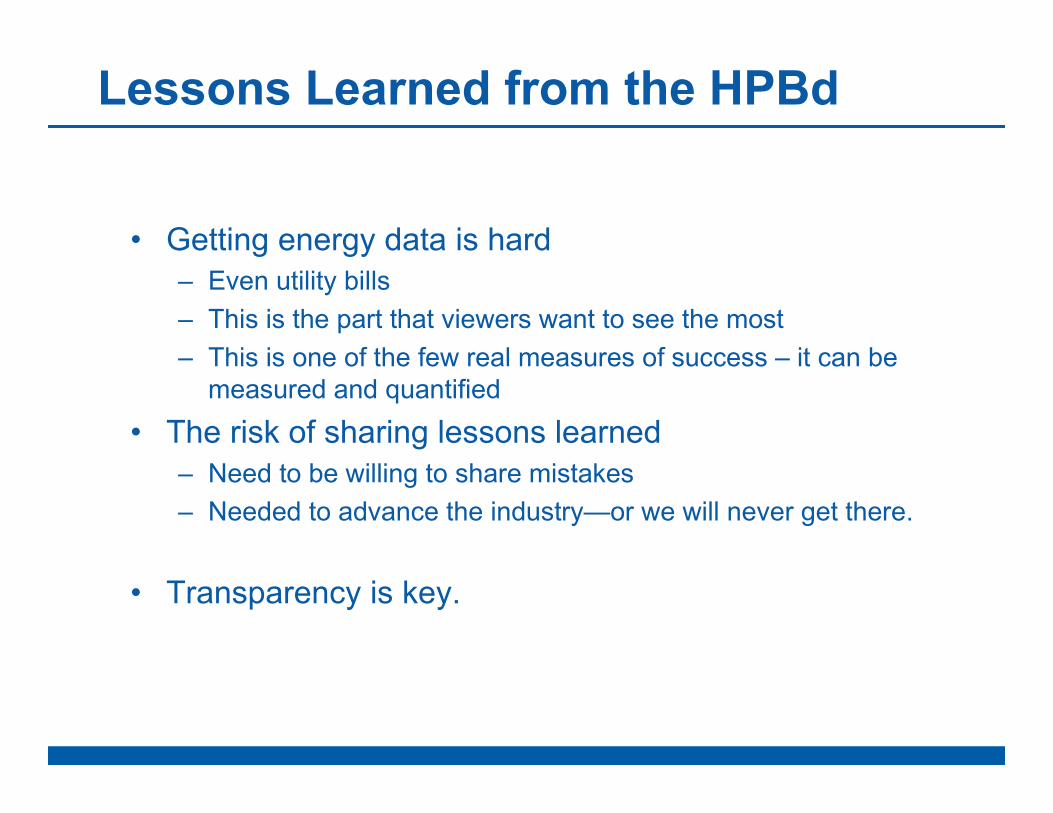
Lessons Learned from the HPBd
• Getting energy data is hard– Even utility bills– This is the part that viewers want to see the most– This is one of the few real measures of success – it can be
measured and quantified
• The risk of sharing lessons learned– Need to be willing to share mistakes– Needed to advance the industry—or we will never get there.
• Transparency is key.

National Renewable Energy Laboratory Innovation for Our Energy Future

National Renewable Energy Laboratory Innovation for Our Energy Future
What are [Net] Zero Energy Buildings?
Conceptually, a building that has no adverse energy [or environmental] impact [because of its operation]
ZERO is not easy to define!– Disconnect all utility interfaces?– Net energy transfer across boundary?– Where is the boundary?

National Renewable Energy Laboratory Innovation for Our Energy Future
Definitions of NZEB’s
Net Zero Site EnergyNet Zero Source EnergyNet Zero Emissions Net Zero Energy Cost
Boundaries and metrics

National Renewable Energy Laboratory Innovation for Our Energy Future
Net Zero Site Energy
Measured at the interface of the building to the utility (point of sale)
Easy to measure/verify (vested interest in having the right number)
Can favor electricity over on-site combustionEncourages energy efficient designs at the
building levelWhat is the “site?” Building footprint or property

National Renewable Energy Laboratory Innovation for Our Energy Future
Net Zero Source Energy
With current information, really just site with multipliers for different fuels
Has a grid (more global) impactDepends on dispatch of power
generation– Fuel source– Incremental dispatch
Daily and seasonal dependencies Regional (non climatic) dependenciesNot a strong focus on building efficiency

National Renewable Energy Laboratory Innovation for Our Energy Future
Net Zero Energy Cost
What the owner really sees(Also) based on site measurementsEasy to verifyDemand componentHigh regional variationsHighly dependent on rate structures
(demand and fixed charges cannot be negated)
Cost volatility Market driven comparisonsCannot do this on a large scale (Who would pay
the utility?)

National Renewable Energy Laboratory Innovation for Our Energy Future
Net Zero EmissionsAlso based on site numbers, typically with
national or regional multipliers based on generation location
Same issues as source
If a building has zero source energy and therefore zero emissions, is it really a zero emissions building?

National Renewable Energy Laboratory Innovation for Our Energy Future
Renewable Hierarchy
• Energy efficiency• Renewable in/on building• Renewable in/on property• Import renewables
(wood chip, other biofuels)• Purchase renewable credits

National Renewable Energy Laboratory Innovation for Our Energy Future
Ending Thoughts…
Zero takes a coordinated effort with the architect and the engineering
The little things make the difference in getting to zero (as you get to zero, little is significant)
The owner needs to set measurable goals and communicate these goals to the design team
The solution is not bigger supplies
National Renewable Energy Laboratory Innovation for Our Energy Future
Questions?
www.highperformancebuildings.gov