Benchmarking the accuracy of reverse engineering tools for ...
32
National University of Ireland, Maynooth Maynooth, Co. Kildare, Ireland. Department of Computer Science Benchmarking the accuracy of reverse engineering tools for Java programs: a study of eleven UML tools. Steven Kearney and James F. Power Technical Report: NUIM-CS-TR-2007-01 Date: June 6, 2007. Key words: Reverse engineering, UML class diagrams, object-oriented software metrics, benchmarking.
Transcript of Benchmarking the accuracy of reverse engineering tools for ...

National University of Ireland, MaynoothMaynooth, Co. Kildare, Ireland.
Department of Computer Science
Benchmarking the accuracy of reverse engineering tools
for Java programs: a study of eleven UML tools.
Steven Kearney and James F. Power
Technical Report: NUIM-CS-TR-2007-01
Date: June 6, 2007.
Key words: Reverse engineering, UML class diagrams, object-oriented software metrics, benchmarking.
Benchmarking the accuracy of reverse engineering tools for Java
programs: a study of eleven UML tools
Steven Kearney and James F. PowerDept. of Computer Science,
National University of Ireland, Maynooth
June 5, 2007
Abstract
Software evolves and changes over time. Too often this metamorphosis in the software is not capturedas feature creep, changes in client requirements and an initially complex design can all lead to the loss ofdesign documentation. Many organisations are starting to spend serious time and money at looking intoreverse engineering tools to recapture design documentation.
Reverse engineering is becoming increasingly important in the software development world today as manyorganizations are battling to understand and maintain old legacy systems. Today’s software engineers haveinherited these legacy systems which they may know little about yet have to maintain, extend and improve.The question addressed in this report is: How do Organisations decide which UML CASE tool to use?
This report discusses the need for reverse engineering and studies the related work in the area on reverseengineering, XMI and Software Metrics. We present the REM4j tool, an automated tool, for benchmarkingUML CASE tools, we then use REM4j to carry out one such evaluation with eleven UML CASE tools. Thisframework allows us to reach a conclusion as to which is the most accurate and reliable UML CASE tool.
Acknowledgements
We would like to thank some of the people who helped secure academic licenses for the commercial tools,these include Jurgen Wust the creator of the powerful SDMetrics tool, which is an essential component of theREM4j framework. Tadas Kaselis of MagicDraw was exceptionally helpful and continually supported this workby expressing a keen interest in its progress. Also thanks to Hannu Haven from Metamill for providing anunlimited academic license.
Some of the results in this report were summarised in a paper presented at the Nineteenth International Con-ference on Software Engineering and Knowledge Engineering (SEKE 2007), Boston, USA, July 9-11, 2007.
2

Benchmarking the accuracy of reverse engineering tools for Java programs: astudy of eleven UML tools
Steven Kearney and James F. PowerDept. of Computer Science,
National University of Ireland, Maynooth
Contents
1 Introduction 4
2 Background and Related Work 42.1 Reverse Engineering . . . . . . . . . . . . . . . . . . . . . . . . . . . . . . . . . . . . . . . . . . . 42.2 The Unified Modelling Language (UML) . . . . . . . . . . . . . . . . . . . . . . . . . . . . . . . . 52.3 Software Metrics . . . . . . . . . . . . . . . . . . . . . . . . . . . . . . . . . . . . . . . . . . . . . 52.4 Towards a framework . . . . . . . . . . . . . . . . . . . . . . . . . . . . . . . . . . . . . . . . . . . 6
3 Experimental Setup 63.1 Initial Research . . . . . . . . . . . . . . . . . . . . . . . . . . . . . . . . . . . . . . . . . . . . . . 73.2 The building of REM4j . . . . . . . . . . . . . . . . . . . . . . . . . . . . . . . . . . . . . . . . . 7
4 Exploratory Analysis, finding an Oracle 114.1 Size Metrics . . . . . . . . . . . . . . . . . . . . . . . . . . . . . . . . . . . . . . . . . . . . . . . . 114.2 Inheritance Metrics . . . . . . . . . . . . . . . . . . . . . . . . . . . . . . . . . . . . . . . . . . . . 134.3 Coupling Metrics . . . . . . . . . . . . . . . . . . . . . . . . . . . . . . . . . . . . . . . . . . . . . 15
5 Determining Tool Accuracy 165.1 Why metrics? . . . . . . . . . . . . . . . . . . . . . . . . . . . . . . . . . . . . . . . . . . . . . . . 165.2 Control Charts . . . . . . . . . . . . . . . . . . . . . . . . . . . . . . . . . . . . . . . . . . . . . . 165.3 Mean Deviation . . . . . . . . . . . . . . . . . . . . . . . . . . . . . . . . . . . . . . . . . . . . . . 185.4 Mode . . . . . . . . . . . . . . . . . . . . . . . . . . . . . . . . . . . . . . . . . . . . . . . . . . . 19
6 Analysis of Real World Programs 196.1 Java Application Selection . . . . . . . . . . . . . . . . . . . . . . . . . . . . . . . . . . . . . . . . 196.2 Metric Capture . . . . . . . . . . . . . . . . . . . . . . . . . . . . . . . . . . . . . . . . . . . . . . 206.3 Results Per Tool . . . . . . . . . . . . . . . . . . . . . . . . . . . . . . . . . . . . . . . . . . . . . 21
7 Conclusions and Future Work 257.1 Conclusion . . . . . . . . . . . . . . . . . . . . . . . . . . . . . . . . . . . . . . . . . . . . . . . . 257.2 Future Work . . . . . . . . . . . . . . . . . . . . . . . . . . . . . . . . . . . . . . . . . . . . . . . 267.3 Summary . . . . . . . . . . . . . . . . . . . . . . . . . . . . . . . . . . . . . . . . . . . . . . . . . 27
A Metric Results by Application 29A.1 Results for pmd . . . . . . . . . . . . . . . . . . . . . . . . . . . . . . . . . . . . . . . . . . . . . . 29A.2 Results for pcj . . . . . . . . . . . . . . . . . . . . . . . . . . . . . . . . . . . . . . . . . . . . . . 29A.3 Results for java2d . . . . . . . . . . . . . . . . . . . . . . . . . . . . . . . . . . . . . . . . . . . . . 30A.4 Results for jolden . . . . . . . . . . . . . . . . . . . . . . . . . . . . . . . . . . . . . . . . . . . . . 30A.5 Results for xalan . . . . . . . . . . . . . . . . . . . . . . . . . . . . . . . . . . . . . . . . . . . . . 30A.6 Results for junit . . . . . . . . . . . . . . . . . . . . . . . . . . . . . . . . . . . . . . . . . . . . . 31A.7 Results for fop . . . . . . . . . . . . . . . . . . . . . . . . . . . . . . . . . . . . . . . . . . . . . . 31A.8 Results for hsqldb . . . . . . . . . . . . . . . . . . . . . . . . . . . . . . . . . . . . . . . . . . . . 31A.9 Results for jameleon . . . . . . . . . . . . . . . . . . . . . . . . . . . . . . . . . . . . . . . . . . . 32A.10 Results for antlr . . . . . . . . . . . . . . . . . . . . . . . . . . . . . . . . . . . . . . . . . . . . . 32A.11 Results for eje . . . . . . . . . . . . . . . . . . . . . . . . . . . . . . . . . . . . . . . . . . . . . . . 32
3

1 Introduction
Software Development is not always a “Green Field” process, and software developers often find themselvesmaintaining old code. UML CASE tools provide the ability to reverse engineer source code. Software developersmay find themselves needing to reverse engineer some source code in order to understand its design. Since thereare a number of UML CASE tools available, the question many organisations face is: Which one suits our needsbest? To answer this question they will need to evaluate all the available tools, measure the results of thisevaluation and rank the tools based on the evaluation.
This report is not about metrics per se, nor is it an investigation into the reverse engineering Process. Thisreport aims to establish a framework for benchmarking and evaluating UML CASE tools. Many organisationsneed to use reverse engineering UML CASE tools, and hence they need to know which tools are the mostaccurate and reliable. This report will establish a framework to determine which UML tools are most reliableand accurate. Later it will utilise the framework by evaluating eleven different UML CASE tools, and rankthese tools according to their accuracy.
In Section 2 we discuss the problems surrounding software maintenance such as missing or incomplete designdocuments that can occur over time. Section 2 will also investigate the related work in the fields of reverseengineering, the Unified Modelling Language and Software Metrics.
We discuss the need for an automated solution in Section 3 which explains how the process is multifaceted,complex and repetitive. The REM4j tool is explained and a brief example of its use is shown as well as a detaileddescription of REM4j’s constituent parts. For this report 11 UML CASE tools were selected for evaluation,Section 3 lists these tools and provides information about each tool’s vendor.
An integral part of this evaluation is the use of a Java application for which all its characteristics are known.A class diagram of this application is provided in Section 4, and from here on out is referred to as the Oraclecode. Also in Section 4 we detail the selection of the software metrics used in this application, then we examinehow accurate each UML CASE tool is at capturing each metric. Finally in Section 4 we rule out metrics thatare unsuitable for this evaluation and decide on the final metric set to be used.
With the Oracle code we knew before hand exactly what the metric value was for every metric, However,in a real world situation, we will not know these metric values, so in Section 5 we examine three methodologiesthat allow us to determine if a metric value given by a particular UML CASE tool is accurate. We discusscontrol charts, mean deviation and mode and how we can apply them to this evaluation in order to judge theaccuracy and reliability of the said tools. The three methods are demonstrated by applying them to just onemetric. Then in Section 6, we use the three methodologies on all metrics.
Section 7 describes the conclusions drawn form the evaluation in Section 6. We state categorically whichtool is the most accurate and reliable. Whilst stressing that the metrics chosen for this evaluation may not suiteveryone, we now have a fair and trustworthy framework and automation tool which make it easy to swap in andout software metrics. Section 7 also addresses areas of possible future work. We look at how we can extend theframework adding the ability to capture information about correlating metrics as well as future improvementsto the REM4j tool.
The appendix provides information about the mean, mode and standard deviation of each of the inputapplications on a per metric basis. It provides extra information on top of that already provided in Section 6.
2 Background and Related Work
In this section we look at background and related work in the areas of software metrics, reverse engineering andthe Unified Modeling Language. We also discuss related research in the metrics and reverse engineering area.
2.1 Reverse Engineering
Software engineering is not always a “Green Field” process and many organisations are battling to understandand maintain old legacy systems. Software decays with age and it is inevitable that more functionality will haveto be added to a software system over time. For example many legacy banking systems were put in place beforethe internet was born and so never anticipated the need for online ebanking [22]. Today’s software engineershave inherited these legacy systems which they know little about and have to maintain, extend and improve.Often legacy systems have an originally convoluted design, obsolete documentation, and the original developers
4

may have left the company. Software may have numerous patches and fixes applied over time. It can be anarduous task to understand a legacy system [12, 18].
Reengineering is the examination of a subject system to reconstitute it in a new form and the subsequentimplementation of the new form [5]. While this report does not go into depth on reengineering it focuses on amajor part of the reengineering process, reverse engineering which is the process of analyzing a subject systemwith two goals in mind: (1) to identify the system’s components and their interrelationships; and, (2) to createrepresentations of the system in another form or at a higher level of abstraction [5, 27, 16, 1].
Reverse engineering is essentially recovering lost information or even information that didn’t exist in thefirst place; this is often referred to as design recovery [2]. The Y2K Bug and introduction of the Euro and theEuro symbol are just two examples of the need to practice reverse engineering and reengineering.
However there has been much research carried out that investigates reverse engineering; one of the mostnoted is RIGI a well known example of a toolset for reverse engineering [26]. Other examples are the DaliWorkbench [15], CPPX [8] and Columbus/CAN [10]. Also in recent times a plethora of UML CASE tools haveentered the market. There is an abundance of reverse engineering UML tools on the market, both commercialand open source. These tools try to automate the process by taking classes and reengineering them back intoUML class diagrams.
2.2 The Unified Modelling Language (UML)
The Unified Modelling Language (UML) is an Object Management Group (OMG) standard for modelling soft-ware artifacts and is the software industry’s standard for specifying, visualising, constructing and documentingartifacts within a software system.
So in essence UML is an agreed format for representing a high level design of an application. When UML wasfirst launched there was no standard way to interchange UML models between different UML tools. Hence theOMG’s XML Metadata Interchange format (XMI) was born as a vendor independent format for saving, loadingand describing UML models. The main purpose of XMI is to enable easy interchange of metadata betweenmodeling tools (based on the OMG UML) and between tools and metadata repositories (OMG MOF based) indistributed heterogeneous environments [13, 25]. Meta-Object Faciltiy (MOF) is another OMG standard; it isused to standardise how models are exported, imported, transformed and rendered into other formats includingXMI [11].
As the need for reverse engineering is so strong, an abundance of UML CASE tools capable of reverseengineering have hit the market. As time goes by more and more UML CASE tools add the ability to reverseengineer Java source code. One of the major challenges that reverse engineering tool vendors face is the struggleto keep with continuously evolving UML and XMI versions [17].
XMI versions currently in use are 1.0, 1.1, 1.2, 2.0 and 2.1. The 2.x versions are radically different from the1.x series. Even though tools support XMI, they may not support radically different versions of XMI. Anotherissue with XMI is that it allows tool vendors to add their own specific attributes to it, so for instance one toolmay use a custom attribute to represent the layout of a diagram. If this XMI was to be opened by a differenttool, it would ignore the custom attributes from the previous tool[24, 19, 7].
This report will strive to see if the OMG has been successful, that is whether UML tools from diverse vendorsproduce the same XMI attributes when given the same Java source code as input.
2.3 Software Metrics
You cannot control what you cannot measure. Tom DeMarco, 1982[28].
An organisation developing software applications needs to measure and use metrics to ensure that its softwareis heading in the right direction, and that its goals are achievable and repeatable. Software metrics are measuresto help us make decisions. For example if we were to take the Inner Classes metric and use it against anapplication, and it was to show that a class had an Inner Classes level of four, that should ring alarm bells.This means the application contains a class which is nested in another class, that class is nested within anotherclass and again that class is nested within another class. Any software architect should be concerned as to whya particular class has such a high nesting level, it suggests a possibly flawed design, it is harder to understandand possibly less reliable.
5

The standard reference for object-oriented software metrics is generally accepted to be Chidamber andKemerer’s [4] article which justifies software metrics by applying principles of measurement theory. Also Briand,Debanbu and Melo offer a “a comprehensive suite of measures to quantify the level of class coupling during thedesign of object oriented systems”. [3]. Tegarden, Sheetz and Monarchi have questioned the effectiveness oftraditional software metrics [23].
Our tool REM4j is the next step in researching reverse engineering and is the centerpiece of our work, itpromotes a framework for evaluating UML CASE tools. The REM4j framework does not use metrics in thetraditional sense, where typically software metrics are used to discover disease or poor design in a piece of code[21]. In our approach, metrics provide us with a means to collect information about the characteristics of a Javaapplication without having to study the code in depth. These characteristics are important, since if we reverseengineer a Java application we would expect the characteristics exported in the XMI file to be an accuratereflection of the application.
The REM4j framework captures the characteristics of a Java application using metrics, for example if anapplication has 14 variables, we would expect a UML CASE tool to capture this characteristic. If a UML CASEtool reported 12 or 16 variables, the tool would be inaccurate and be reporting erroneous values. REM4j allowsus to capture this loss of metadata or indeed the addition of extra data, and using the REM4j framework wecan then determine which tools accurately represent the true characteristics of the Java applications.
In Section 4, there is a comprehensive listing and explanation of each metric that was deemed to be relevantfor this report.
The Oracle We chose the term Oracle to describe a piece of Java source code, for which all its characteristics,elements and attributes were known. The Oracle application was designed and written explicitly for this report.In particular, all of the metric values were calculated in advance and the code was constructed to have as manydifferent metric scenarios as was feasible.
With the Oracle code we have a metric value that is always right, this means we can categorically state if aUML CASE tool is accurate or erroneous. Unlike the rest of the Java applications where we have to determineby analysis if a tool is accurate or not, is it apparent with the Oracle. The Oracle is important in that it willhighlight UML CASE tools that fail to capture a particular metric, if a particular tool returns a metric valueof 0 for the Oracle application, we can state that that tool is inaccurate, it is failing to capture information.
2.4 Towards a framework
This report is not about metrics per se, nor is it an in-depth investigation into the reverse engineering process.This report is providing a framework that will allow anyone test the accuracy of any UML CASE tool with anyJava application’s source code. While David Cooper et al. studied the inaccuracies that occur from forwardengineering vs. reverse engineering, they stopped short at evaluation the reliability of the tool to export XMI[6].
Juanjuan Jiang and Tarja Systa explored the differences in exchange formats between UML CASE tools,they investigated if UML CASE tools delivered on the OMG ideal of interchangeable XMI files, they stoppedshort of automating the process [14]. REM4j is the next step in researching reverse engineering as it buildsupon sound research previously carried out.
There is a wealth of information exploring the virtues of software metrics, how UML CASE tools interactand reliability of reverse engineering. However there is a distinct lack of an automated tool that will answerthis question, Which UML CASE tools are most accurate at design recovery?. REM4j is unique in that it canautomate the reverse engineering, Metric capture and evaluation of metrics, so to provide the end user with theanswer they desire, Which tool is best for my circumstances?
3 Experimental Setup
In this section we discuss tool evaluation, we discuss the UML CASE tools that have been selected for evaluation.We then investigate what an Oracle application is and how to utilise it in the evaluation. Finally, we presentan overview of REM4j and its constituent parts.
6

UML CASE Tool Vendor Version Short NameArgoUML Tigris 0.22 AR
MagicDraw Magicdraw 12.0 MDBouml Bouml 2.17 BO
Metamill Metamill 4.2 MMVisual Paradigm Visual Paradigm 3.1 VP
Jude Change Vision Prof. 6.0 JUEnterprise Architect Sparx Systems 6.5 EA
UModel Altova 2006 rel. 2 UMESS-Model Ess-Model 2.2 ES
Ideogramic UML Ideogramic 2.3.3 ICPoseidon for UML Gentleware 4.2 PO
Table 1: The 11 UML CASE tools we have chosen for our study. This table lists the tool names, thevendors, and the version number of each UML CASE tool that was used. The final column gives a ‘Short Name’for each tool that we use in later tables.
3.1 Initial Research
From the initial research it became apparent the software engineering community needed a clear, unambiguousand unbiased framework to benchmark the reliability and accuracy of UML CASE tools. The first step in thisexperiment was to choose the UML CASE tools, where the only requirements were that they were capable ofreverse engineering Java source code back to Class Diagrams and exporting the same diagrams in XMI format.The tools chosen are listed in Table 1. It is worth noting that ArgoUML, Bouml and ESS-Model are noncommercial tools, i.e. they are available for use, free of charge.
Initially the experiment started out with six tools and started running the experiments against those sixtools, as time progressed more qualifying tools were found. As REM4j is a framework, it is trivial to add newUML CASE tools to it for evaluation, hence an additional five tools were added to this evaluation. Any tool thatcan reverse Java source code and export to XMI can be used with REM4j. The next logical step was to decidewhich Java applications to reverse engineer. The applications chosen for this report, and a brief explanation ofwhy they were chosen is outlined in section 6.
3.2 The building of REM4j
This section will outline how the REM4j (Reverse Engineer Metrics 4 Java) tool was designed and built, aswell as describing its various components. REM4j a modular tool, that establishes a framework for testing andbenchmarking any UML tool against its competitors. The separate components that come together to makeREM4j work are listed below.
REM4j Justified The UML CASE tool benchmarking process is complicated and multifaceted. We need toopen a UML CASE tool, import Java source code, reverse engineer it, export it to XMI, pipe the XMI into ametric calculation engine and gather and collate the results into one readable CSV file. Then repeat this forthe 11 UML CASE tools for each input application to be evaluated.
Later we will select Java applications to evaluate with, we will select 11 Java applications which will meanfor this report alone we would need to repeat the process 121 times! This is a framework for benchmarking, soit must be repeatable. That is why REM4j was created: it automates the highly repetitive, error prone andmundane tasks necessary in the benchmarking process. REM4j will allow anyone add a new UML CASE toolor Java applications to the benchmarking process.
As Figure 1 outlines, REM4j takes two inputs when starting. The first step is to select the root directory ordirectories of the Java source files you would like to reverse. There is no upper limit on the number of directoriesyou can enter. See Figure 2, which shows Java source directories being added to REM4j.
Next you must point REM4j at the AutoHotKey (AHK) directory, depicted as “AHK Macro Directory”,this can be set in the Properties tab. Once the AHK Macro Directory has been set, you can browse to the
7

Figure 1: The work-flow of our REM4j framework.The main components are the Java source directorywhich holds the Java programs to be reverse engineered, and the UML CASE tool under examination. Auxiliarycomponents include the AutoHotKey (AHK) macro tool and the SDMetrics metric calculation engine. Finally,the results of the metrics tool, stored as a CSV file, are depicted at the bottom of the figure.
Select UML Tools tab. REM4j will now scan the AHK Macro Directory of available UML tools. In order for aUML tool to be available it must have an associated AHK Macro script in the AHK Macro Directory.
Figure 2 shows The Select UML Tools tab, this tab allows you to select which tools you wish to benchmark.At this point REM4j now enters the loop section shown in Figure 1. If for example three source code
directories are selected and then three UML tools are selected the loop would execute nine times, each sourcecode directory would be reverse engineered and exported to XMI then piped into the metric calculation enginetool where the metric calculations would be extracted and returned to REM4j and the loop starts again.
When the REM4j automation tool has finished executing it generates a Master CSV File, this can be furthermanipulated by REM4j or you can open it in another application if you choose to do so. Another feature ofREM4j is the ability to produce charts and graphs to help visualise the results. Figure 4 shows a sample screenshot of the REM4j Charting functionality.
REM4j works in a very modular approach and the user can choose to run parts of the test or run the wholetest from beginning to end. REM4j utilises a number of open-source applications that are freely available, overtime these tools may be updated or replaced with different tools. Since it is built in a modular fashion it canalso evolve over time.
The next three sections discuss the tools encapsulated in REM4j.
SDMetrics The SDMetrics tool is a powerful commercial application that is capable of analysing XMI andcomputing metrics based on that XMI. One of the failings of OMG’s XMI standards is that there are so manyof them, with XMI standards ranging from 1.0 to 2.1, and different tool vendors supporting different versions, Itwas not fair to compare like for like in the XMI files. That is why SDMetrics was chosen for the metric calculationengine. SDMetrics is available under commercial and academic licence from http://www.sdmetrics.com
Figure 5 shows the SD metrics work-flow diagram, giving the main files used by the tool. As well as theXMI source file for the reverse engineered program, and the CSV metrics output, there are three additional filesused:
• The Meta-model definition file defines what SDMetrics knows about the meta classes, their attributes andrelationships, it maps the OMG UML meta-model to a simplified meta-model for SDMetrics.
8
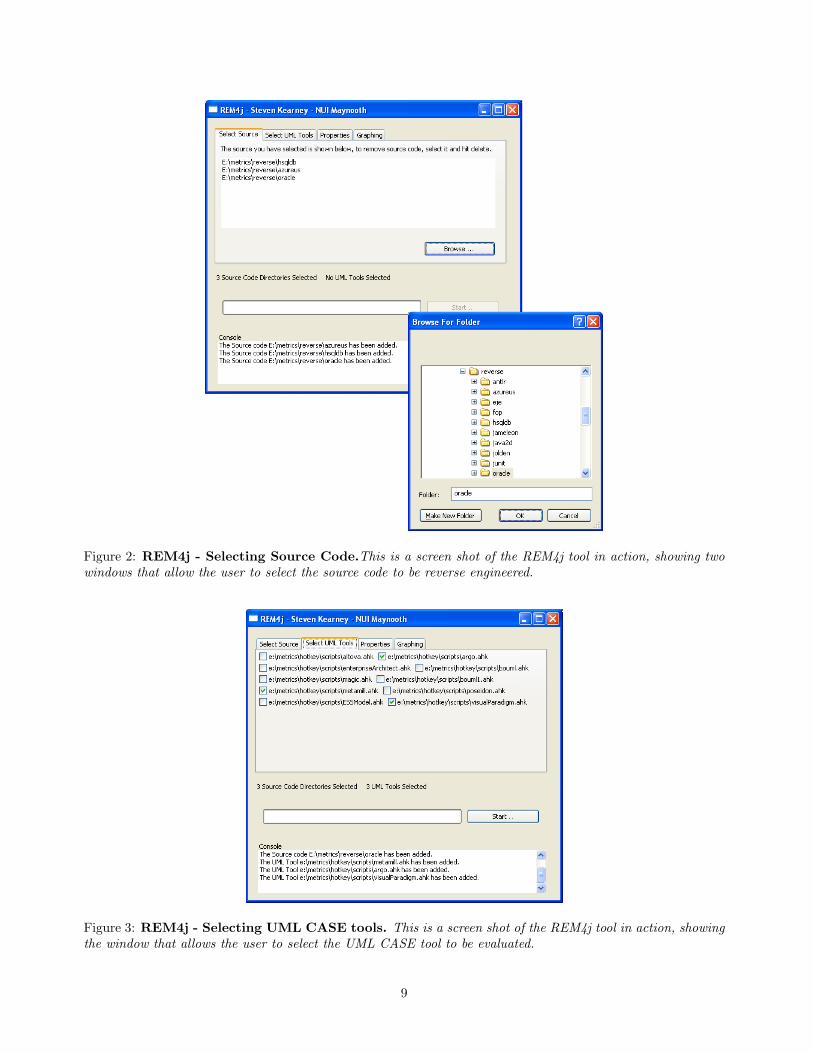
Figure 2: REM4j - Selecting Source Code.This is a screen shot of the REM4j tool in action, showing twowindows that allow the user to select the source code to be reverse engineered.
Figure 3: REM4j - Selecting UML CASE tools. This is a screen shot of the REM4j tool in action, showingthe window that allows the user to select the UML CASE tool to be evaluated.
9

Figure 4: Rem4j - Charting Example. This is a screen shot of the REM4j tool in action, showing thecharting ability of the tool. This allows the user to get a visual view on the Master CSV file created.
Figure 5: SDMetrics Work-flow Diagram.This figure shows the various parts of SDMetrics, the XMI SourceFile which is taken from the UML CASE tool is the main input, it also shows the three configuration files whichcontrol which metrics and how metrics are calculated. It also shows that SDMetrics exports its results to a CSVfile.
10

• The XMI Transformation file informs SDMetrics on how to extract information about the model fromthe XMI files, it provides a mapping from the UML as per the XMI file to SDMetrics meta model.
• The Custom Metrics Definition file provides the ability to add new metrics, or alter how the existingmetrics are calculated. This file is what makes SDMetrics so powerful, it is easy to add new metrics atany time.
Auto Hot Key AutoHotKey is a macro utility for Microsoft Windows. It has the ability to record keystrokesand mouse clicks, it can also execute logical statements such as if/then and loops. AutoHotKey provides theability to write a macro for a particular CASE tool and then compile it to a .exe file which could be executed onany Microsoft Windows system. The .exe can accept command line parameters, which makes the macro veryportable, as it can be used over and over again for different source directories. An AutoHotKey script only hasto be written once per UML CASE tool.
AutoHotKey was chosen as it was the fastest to create and deploy macros. REM4j is capable of startingan AutoHotKey file and terminating it as well as passing any parameters that may be necessary. In thefuture we intent to add this functionality directly into the REM4j tool, i.e. use Java scripting and macrorecording instead. AutoHotKey is freely available under The GNU General Public License (GPL) for downloadat http://www.autohotkey.com
Chart2D Chart2D is the Java graphing package used by REM4j. It is an open source charting class li-brary, freely available under The GNU General Public License (GPL) for download at http://www.chart2d.sourceforge.net
4 Exploratory Analysis, finding an Oracle
In order to make a preliminary judgement whether a tool is accurate in its XMI output we use a metrics-basedOracle application. With the Oracle application we know without doubt what the metric count is for eachmetric.
The class diagram for the Oracle application is sown in Figure 6. The Oracle application is written in Javawith a 0-1-2 (ZOT) metric policy in place. For example, the Oracle application had at least one class with noPublic Methods, at least one class with exactly one Public Method and at least one class with more than onePublic Method.
In the next three sections we will break down the metrics that this report investigates into Size Metrics,Inheritance Metrics and Coupling Metrics. We will consider each metric in turn in the context of the Oracleapplication, and discuss how accurate each UML CASE tool was at capturing the correct metric value.
4.1 Size Metrics
Size metrics measure the size of design elements. These are simply a count of the elements that are containedwithin an application.
Number of Variables (NoV) The Number of Variables metric refers to sum of the number of variables inall classes regardless of type, visibility, changeability or scope, it does not count inherited variables, or variablesthat are members of an association [20].
As shown in the class diagram the Oracle application clearly has 12 variables or attributes. However 4 ofthe 11 tools produced a figure other than 12. Both Jude and Bouml had the lowest total as they reported theOracle application having only 7 variables, while Poseidon reported 8 and Ideogramic UML reported 9.
Number of Methods (NoM) The Number of Methods metric has a value that is the sum of the numberof all methods in all classes regardless of type, visibility, changeability or scope, it does not count inheritedmethods, but it does count abstract methods [20].
The Oracle code contains exactly 23 methods, so any derivation from this total would suggest an inaccuratetool. All UML CASE tools with the exception of Bouml which reported 20, produced the correct total of 23.This is to say that Bouml was the only tool that didn’t report the metric as being 23.
11

Figure 6: Oracle Class Diagram. This is a Class Diagram showing the 11 classes of the Oracle application,it also shows the variables and methods of the application. Overlapping classes are inner classes. Dotted linesrepresent an implements relationship. A solid line represents an extends relationship.
12

Number of Public Methods (NoPM) The Number of Public Methods metric has a value which is thesum of the number of methods in all classes that have public visibility [20]. This metric is similar to Numberof Methods except that it only counts methods that are public, so this metric should never be greater than theNumber of Methods metric.
The Oracle application was written with exactly 20 public methods, all of the tools agreed with this totalexcept one, Bouml, which reported 18. This is not surprising as Bouml only reported a total of 20 methodswhen there was actually 23 methods in the application. When we combine this metric with Number of Methodswe can see that Bouml is under reporting the number of methods regardless of visibility.
Number of Setters (NoS) The Number of Setters metric counts any Method that begins with ‘set’, thismay yield inaccurate results as methods like ‘settleBalance’ may also be counted [29]. However as this problemwill occur in all tools, it negates the problem as all tools are equally effected, so this metrics is still useful forevaluating the UML tools.
The Oracle application contains five methods that begin with ‘set’. For this metric all tools agreed and alltools produced a metric value of 5.
Number of Getters (NoG) This metric counts any Method that begins with ‘get’, ‘is’ or ‘has’, this metricmay yield inaccurate results for methods like ‘isolateTag’ [29]. As with the Number of Setters metric, this issueaffects all tools equally and does not impact on the reliability of this metric.
This metric operates in a similar fashion to Number of Setters, the Oracle application contains 9 methodsthat either begin with ‘get’, ‘is’ or ‘has’ and all tools agree with the metric value being 9.
Inner Classes (IC) This metric will return the total number of inner classes nested within an application.The Oracle application contains the class RFIDAntenna which has an inner class RandomKeyClass which in
turn has an inner class Randomiser. So the nesting count for Randomiser is 0, the count for RandomKeyClassis 1, as it contains one inner class and the count for RFIDAntenna is 2 as it contains a class that contains aclass. The Oracle application also has one other class containing an inner class. So the Inner Classes metriccount for the Oracle application is 4.
Ideogramic UML, Bouml, Enterprise Architect and ESSModel all reported 0 Inner Classes, while MagicDrawUML Reported 7, these tools are incorrect. ArgoUML, Metamill, Poseidon, Visual Paradigm and Jude reportedthe correct number of Inner Classes, 4.
Total Number of Classes This is a count of the total amount of classes that the UML CASE tool exportedin its XMI document.
The class diagram clearly shows 11 classes however none of the UML CASE tools reported this total, theyall reported totals of between 9 and 53. This error has most likely occurred due to the fact that different toolstreat imported packages differently, such as the java.util.String class, while not part of the Oracle applicationit is used by it. Some tools count classes like the java.util.String class in the Total Number of Classes metric,Thus making the metric unreliable. The Total Number of Classes metric will not be evaluated further.
Size Metrics Summary As we know the correct value for all the size metrics, we can state if the tools passedor failed.
As table 2 shows Argo UML, Metamill and Visual Paradigm were the only tools to be correct on all evaluatedmetrics. The table displays the actual metric value, if a tool reported an incorrect value, the difference betweenthe reported and the correct value is displayed.
4.2 Inheritance Metrics
Inheritance metrics deal with polymorphism, depth and width of the inheritance tree, the number of ancestorsor descendants of a class.
13

UML Size MetricsTool NoV NoM NoPM NoS NoG IC ToCAR 0 0 0 0 0 0 +2MD 0 0 0 0 0 +3 +4BO -5 -3 -2 0 0 -4 -5
MM 0 0 0 0 0 0 -3VP 0 0 0 0 0 0 -2JU -5 0 0 0 0 0 +42EA 0 0 0 0 0 -4 +1UM 0 0 0 0 0 -4 +5ES 0 0 0 0 0 -4 +4IC -3 0 0 0 0 -4 -2
PO -4 0 0 0 0 0 +2Actual 12 23 20 5 9 4 11
Table 2: Size Metrics Results. This table shows, for each UML CASE tool, the difference between the actualexpected value and the value calculated for the Oracle application. The actual correct value for each metric isshown in the last row.
Interfaces Implemented (II) The total number of Interfaces that are implemented within an application.A single class may implement several interfaces.
The Oracle application contains two interfaces, both of these interfaces are implemented by RFIDAntennaand Tag. As both interfaces are implemented twice, the total number of interfaces implemented in the Oracleapplication is 4. Ideogramic, ArgoUML, Jude, Metamill and Bouml returned 0 as the metric value, all othertools agreed and returned 4.
Number of Children (NoC) This is a measurement of how many classes are going to inherit methods ofthe parent class, its the number of immediate subclasses subordinated to a class in the class hierarchy [4].
In the Oracle application, two classes, Object and RFIDObject are extended by another class, RFIDObjectextends Object and Tag extends RFIDObject. The value of this metric for the Oracle application is 2. All ofthe UML CASE tools agreed that it was 2, with the one exception of Enterprise Architect, which stated that itwas 3.
Inheritance Tree (IT) This metric represents the sum of the ancestors or descendants of each class withinthe application. The Oracle application has two instances where a class has a inheritance depth of greater than0, this is the Tag class which has a depth of 2 and the RFIDObject class which has a depth of 1.
The total Inheritance Tree metric value is 3. With the exception of Enterprise Architect which reported 4,all tools agreed on 3 being the correct metric value.
Class to Leaf Depth (CLD) With this metric we take a look at the longest path from a class to a leaf inthe inheritance hierarchy. For example the Object class has a depth of 2 in order to reach its longest leaf theTag class. Whereas the RFIDObject has a depth of 1 to reach its most far away leaf. These Class to Leaf Depthmetrics are then summed for each class in the application giving a metric value of 3.
All of the UML CASE tools agreed that the Class to Leaf Depth was 3 with one exception again, theEnterprise Architect tool.
Methods Inherited (MI) This metric is the sum of the number of methods inherited by each class. This iscalculated as the sum of Number of Methods taken over all ancestor classes of the class [20, 29].
The RFIDObject class in the Oracle application extends the Object class, therefore it inherits the twomethods in the Object class. The Tag class extends the RFIDObject class, so it inherits the one method in theRFIDObject class and it also inherits the two methods from the Object class. The Methods Inherited metricvalue is 5. All of the tools reported a value of 5.
14

UML Inheritance MetricsTool II NoC IT CtLD MI VIAR -4 0 0 0 0 0MD 0 0 0 0 0 0BO -4 0 0 0 0 0
MM -4 0 0 0 0 0VP 0 0 0 0 0 0JU -4 0 0 0 0 0EA 0 +1 +1 +1 0 0UM 0 0 0 0 0 0ES 0 0 0 0 0 0IC -4 0 0 0 0 0
PO 0 0 0 0 0 0Actual 4 2 3 3 5 2
Table 3: Inheritance Metrics Results. This table shows the actual expected value for each of the six inheri-tance metrics. It then shows, for each UML CASE tool, the difference between the expected value and the valuecalculated for the Oracle application.
Variables Inherited (VI) This is the sum of the number of variables each class in the application hasinherited. It works in much the same manner as Methods Inherited. The Oracle application produces a metricvalue of 3. All the UML CASE tools agree on this total.
Inheritance Metrics Summary As the table, 3 shows, the UML CASE tools were in agreement most ofthe time, with the exception of Enterprise Architect, which frequently over rated the metric value by 1.
4.3 Coupling Metrics
Coupling metrics are used to investigate how the different elements in an application are connected.
Associated Elements in the same scope This metric counts all associations including plain, aggregate,composite and bidirectional associations that are in the same scope or namespace as the class itself. i.e.associations within the same package.
Only Jude, Poseidon and Ideogramic UML produced a total other than 0. They did agree that the totalis 4, which is correct. However as only three tools able to capture this metric, it will not be used for furtherevaluations of the UML CASE tools reliability.
Associated Elements in the same scope branch For a class that is defined in a package, pack, this metricwill only count model elements that are in pack itself, in packages that pack contains and in packages containedby pack.
Like Associated Elements in the same scope only Jude, Poseidon and Ideogramic UML produced a totalother than 0. The correct total is 4 and Jude, Poseidon and Ideogramic UML reported 4.
External Class Use as Type The External Class Use as Type metric represents the number of attributesin other classes that have this class as their type. This metric will not be evaluated as the diverse tools differ onhow to calculate it. For example in the application is it correct to count the number of times the java.util.Stringclass is used as a Type? The java.util.String class is not part of our Oracle application, however it is used eleventimes.
As there is no definitively right or wrong way to calculate the use of the java.util.String class this metricwon’t be evaluated further. In order to use this metric, we would need to need to break this evaluation downinto a per class not per application evaluation.
15

Interface Class Parameters The sum of the parameters in the application that have a different class orinterface to the class they are being used in [3].
This metric suffers from the same fate as External Class Use as Type, in order to evaluate it fairly it needsto be taken on a per class basis. This metric will not be evaluated further.
Coupling Metrics Results Due to the nature of this evaluation, it was deemed unfair to benchmark thevarious UML CASE tools using Coupling Metrics, as they need to be evaluated on a per class basis. This issueis discussed in a later section on possible future work.
5 Determining Tool Accuracy
While the Oracle application gives us an estimate of the variability in the metrics calculated, it is also interestingto see how this impacts the study of real applications. When working with larger applications we need to beable to calculate the “correct” value of the metrics. We use a voting approach, where we evaluate each metricbased on the total votes of each tool.
This section will look at three different formulas that can aid us in determining which metric values arecorrect. As a running example, we apply each approach to the Number of Public Methods metric to demonstratehow the formula works.
5.1 Why metrics?
Before we go any further we must appreciate exactly what a metric is. In short it can be defined as the mappingof a particular characteristic of a measured entity to a numerical value [21].
We can measure everything, but where is the benefit in that? We need to measure specific characteristics sowe can draw useful conclusions, In the next section we will try to quantify and qualify the quality and reliabilityof reverse engineering and exporting to XMI a Java application.
We can use these measurements as a means to control quality. The question that needs to be answeredis is this UML CASE tool reliable and accurate? In order to answer this question we must set boundaries orthresholds, we must know when a numerical value mapped to a metric is too high or too low. We need controllimits.
5.2 Control Charts
The first method we will investigate is control charts. The control chart or Shewhart chart was devised byWalter A. Shewhart while working for Bell Labs in the 1920s. Shewhart devised a chart with five horizontallines running across it, they are:
• Center Line This is the middle line and it reflects the mean value of the metric.
• Upper Control Limit This is three standard deviations above the Center Line, any value above this lineis untrustworthy.
• Lower Control Limit This is three standard deviations below the Center Line, any tool that outputs ametric below this line is unreliable.
• Upper Warning Limit This is two standard deviations above the Center Line if a metric falls betweenthis line and the Upper Control Limit it will need further investigation, it may be a good idea to crossreference it against other metrics to ascertain its reliability.
• Lower Warning Limit This is two standard deviations below the Center Line it behaves the same as theUpper Warning Limit
Shewhart devised the limits to be used in the context of physical equipment tests, three standard deviationscan be quite a distance from the Mean of the metric.
Michele Lanza and Radu Marinescu suggest thresholds [21]:
16

Number ofUML CASE Tool Public Methods
ESSModel 3918Visual Paradigm 2610Altova UModel 2445
Enterprise Architect 2445Jude 2445
Magic Draw 2445Metamill 2445Poseidon 2445
Bouml 2257Ideogramic 2168ArgoUML 0
Table 4: Public Methods Metric Table. This table shows the actual metric values returned for the NoPMmetric for the hsqldb program, for each UML CASE Tool
• Lower Margin This is one standard deviation below the mean or center line.
• Higher Margin This is one standard deviation above the center line.
They also suggest thresholds of 1.5 deviations above and below for the very high and very low margins orUpper Control Limit and Lower Control Limit.
Illustrative Example To illustrate the use of these techniques, we take, as an example, the calculation ofthe Number of Public Methods for the hsqldb benchmark program. We use this as a running example for therest of this section.
By examining Table 4, two lines immediately draw our attention, the most alarming line is that for ArgoUML,it captured no Public Methods, on further inspection we find that ArgoUML actually failed in the reverseengineering process. ArgoUML did not produce and XMI output for the hsqldb application. ArgoUML willbe excluded when calculating the accuracy of the tools. That is to say when we calculate the mean we will notinclude the 0 value reported by ArgoUML.
The next line of concern is the ESSModel, it appears to be excessively larger than the other lines. Todetermine if this total is acceptable or an outlier we’ll use the Control Chart to see where its values fall.
The mean of the Number of Public Methods metric is:
x =1n·
n∑i=1
xi (1)
x = 2562 (2)
For our control lines we need to find the standard deviation, this is defined as the square root of the variance.It is the root mean square deviation from the average, thus it gives us a non negative number and has the sameunits as the data.
The Variance isvar(X) = E((X − µ)2). (3)
We can determine the the variance of Public Methods metric for the hsqldb to be 241270, and the standarddeviation to be
√241270 = 491. With the standard deviation calculated we can set the control limits:
Center Line = 2562Upper Control Limit = (2562 + (491 ∗ 1.5)) = 3299Lower Control Limit = (2562− (491 ∗ 1.5)) = 1826
Upper Warning Limit = (2562 + 491) = 3053Lower Warning Limit = (2562− 491) = 2071
17

Figure 7: hsqldb - Control Chart. Deep blue and red signifies the Lower and Upper Control Limits respec-tively. Light blue and orange signify the upper and lower warning limits respectively. The black line plots themetric value for each tool
If any metric falls above the Upper Control Limit or below the Lower Control Limit, we can rule it out andstate that it is an outlier and doesn’t accurately reflect the true metric value. If the metric value falls betweenan Upper Control Limit and an Upper Warning Limit or falls between a Lower Control Limit and a LowerWarning Limit, we will tentatively accept the metric, however further investigation to rule it an outlier may berequired.
Figure 7 contains a chart that plots the value of the Number of Public Methods metric for each of the reverseengineering tools, when applied to the hsqldb benchmark program. The black line plots the metric value foreach tool; the two blue lines below it plot the lower warning and control limits, and the two lines above it plotthe upper warning and control limits. From this chart, we can see that all reverse engineering tools calculatea value for the metric that is within all limits, apart from ESSModel, whose calculated metric value exceededboth the upper warning and upper control limit for the hsqldb application.
5.3 Mean Deviation
Another statistical analysis tool that can be used to check the correctness of the reported metric value is meandeviation, this is a measure of dispersion that gives the average absolute difference (i.e. it ignores ‘-’ minussigns) between each individual tools metric and the mean. It is sometimes referred to as the average deviation.
The mean deviation is calculated as follows:
md =1n
n∑i=1
|xi − x| (4)
With the mean deviation calculated we can see how many tools produced a metric that is greater than themean deviation above or below the mean.
Two vertical lines have been applied to Figure 8, the lines represent one mean deviation above and onemean deviation below the mean value, which is 281. Figure 8 clearly shows that the ESSModel tool produced ametric value that is above one mean deviation from the mean. In fact the ESSModel’s metric is nearly 5 meandeviations away from the mean.
18

Figure 8: hsqldb - Mean Deviation Chart. This chart shows two red lines that signify one mean deviationabove and below the mean. The black line plots the metric value for each tool.
5.4 Mode
So far we have looked at the Mean, Standard Deviation and Mean Deviation to decide how accurate the UMLCASE tools are, another statistical tool we have at our disposal is Mode, this is the value that occurs mostoften, it has the largest frequency. The purpose of XMI is to provide a standard for interoperability, that is toallow XMI files to be transferred between different UML tools, so it is reasonable to expect that tools shouldproduce the same metric count. Therefore the mode may prove to be interesting.
We can see that six out of ten UML CASE tools output 2445 as the Number of Public Methods metric, witha further 3 being within one standard deviation and one mean deviation. It is a reasonable assumption that2445 is in fact the correct metric count. The other three tools were tentatively accepted as being correct whilethe ESSModel tools metric value is an outlier and its results are unreliable.
6 Analysis of Real World Programs
In this section we discuss the Java applications chosen and investigate each tool’s effectiveness at reporting eachmetric for all the applications.
6.1 Java Application Selection
When selecting Java applications to use in this evaluation, diverse applications were sought as well as ran-dom applications. When selecting these tools, much inspiration was drawn from the DaCapo Benchmarks [9],available at http://www.dacapobench.org/.
• antlr, ANother Tool for Language Recognition, was chose from the DaCapo benchmark suite, it parsesone or more grammar files and generates a parser and lexical analyzer for each.
• fop, Formatting Objects Processor, it is a Java application that reads a formatting object tree andrenders the resulting pages to a specified output, typically a PDF. Again it was chosen from the DaCapobenchmark suite.
19
UML Test Suite ApplicationsTool eje antlr jam hsqldb fop junit jolden java2d xalan pmd pcj % PAR P P P F P P P P P P F 81.8MD P P P P P P P P P P P 100BO P P P P P P P P F P F 81.8
MM P P P P P P P P P P P 100VP P P P P P P P P P P P 100JU P P P P P P P P F P P 90.9EA P F P P P P P P P P F 81.8UM P P P P P P F P P P P 90.9ES P P P P P P P P P P P 100IC P P P P P P P P P F P 90.9
PO P P P P P P P P P P F 90.9% P 100 90.9 100 90.9 100 100 90.9 100 81.8 90.9 63.6
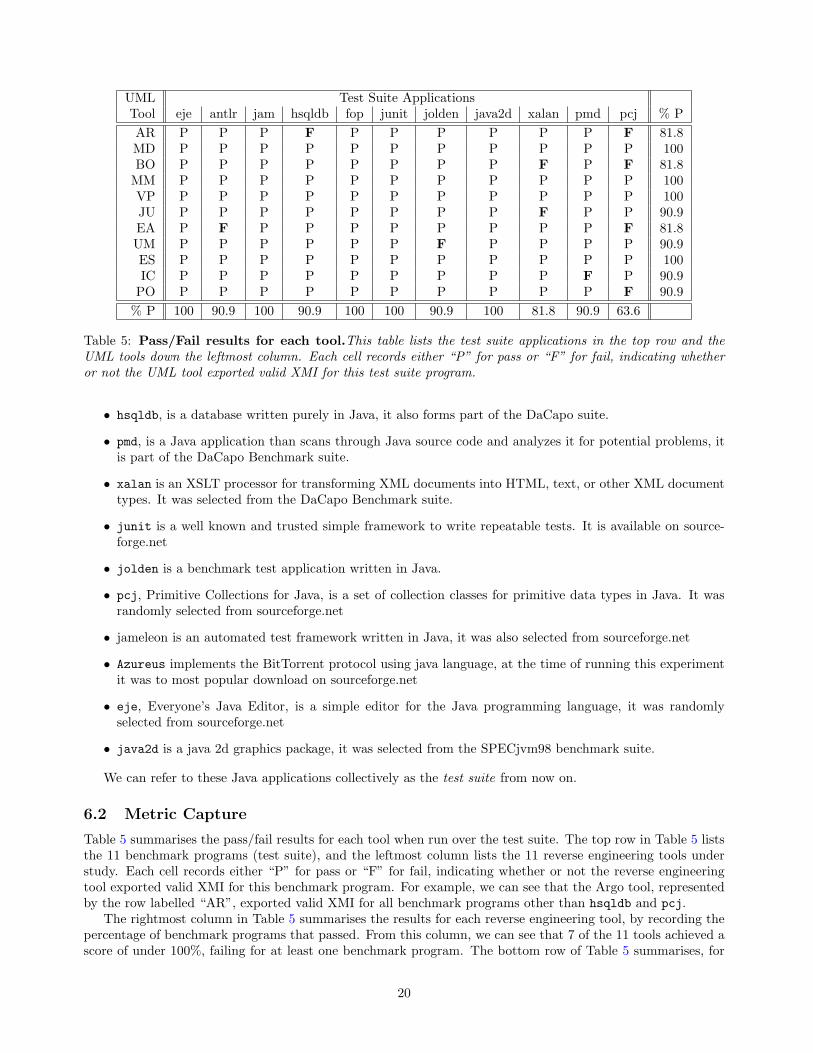
Table 5: Pass/Fail results for each tool.This table lists the test suite applications in the top row and theUML tools down the leftmost column. Each cell records either “P” for pass or “F” for fail, indicating whetheror not the UML tool exported valid XMI for this test suite program.
• hsqldb, is a database written purely in Java, it also forms part of the DaCapo suite.
• pmd, is a Java application than scans through Java source code and analyzes it for potential problems, itis part of the DaCapo Benchmark suite.
• xalan is an XSLT processor for transforming XML documents into HTML, text, or other XML documenttypes. It was selected from the DaCapo Benchmark suite.
• junit is a well known and trusted simple framework to write repeatable tests. It is available on source-forge.net
• jolden is a benchmark test application written in Java.
• pcj, Primitive Collections for Java, is a set of collection classes for primitive data types in Java. It wasrandomly selected from sourceforge.net
• jameleon is an automated test framework written in Java, it was also selected from sourceforge.net
• Azureus implements the BitTorrent protocol using java language, at the time of running this experimentit was to most popular download on sourceforge.net
• eje, Everyone’s Java Editor, is a simple editor for the Java programming language, it was randomlyselected from sourceforge.net
• java2d is a java 2d graphics package, it was selected from the SPECjvm98 benchmark suite.
We can refer to these Java applications collectively as the test suite from now on.
6.2 Metric Capture
Table 5 summarises the pass/fail results for each tool when run over the test suite. The top row in Table 5 liststhe 11 benchmark programs (test suite), and the leftmost column lists the 11 reverse engineering tools understudy. Each cell records either “P” for pass or “F” for fail, indicating whether or not the reverse engineeringtool exported valid XMI for this benchmark program. For example, we can see that the Argo tool, representedby the row labelled “AR”, exported valid XMI for all benchmark programs other than hsqldb and pcj.
The rightmost column in Table 5 summarises the results for each reverse engineering tool, by recording thepercentage of benchmark programs that passed. From this column, we can see that 7 of the 11 tools achieved ascore of under 100%, failing for at least one benchmark program. The bottom row of Table 5 summarises, for
20

each benchmark program, the percentage of the 11 reverse engineering tools that recorded a pass. From thisrow, we can see that five benchmark programs scored 100% by recording a pass for all tools, but that the pcjprogram had a particularly poor rate, passing for only 7, or 63.6%, of the tools.
MagicDraw UML, Metamill, ESSModel and Visual Paradigm succeeded in reverse engineering every Javaapplication in this evaluation, this however, does not inform us of their accuracy.
6.3 Results Per Tool
The following section details the results of each tool. It is useful to cross reference the charts presented inFigures 9 and 10 with the application result tables in the appendix.
Figures 9 and 10 contain a set of 11 bar charts, where each bar chart shows the results for a single tool. Ineach chart, the vertical axis is numbered from 0 up to 11, and each point on this axis represents an applicationfrom our test suite. The horizontal axis displays each metric, and the corresponding bar represents the accuracyof the UML CASE tool for this metric. Ror example the leftmost bar in the chart in Figure 9(a) shows theNumber of Variables (NoV) metric was captured for 9 applications by the Bouml tool.
The bars in the chart are colour coordinated:
• deep blue represents metric values that are under the control limit
• deep red shows metric values that are above the control limit
• light blue representes metric values in the lower warning zone
• orange represents metric values in the upper warning zone
Metric values shaded with deep blue or deep red are considered to be outliers and unreliable. Metric valuesthat are shaded light blue or orange are not outliers, but they may be inaccurate; we can say that these metricvalues are “somewhat reliable”.
White coloured metrics values are accurate and reliable, and these metrics can be trusted. The larger thewhite shading in the charts of Figures 9 and 10, the more accurate that tool is. For each UML tool there is thusa maximum of 132 possible opportunities for a white shading (11 applications being evaluated with 12 metrics).
Bouml Results In chart in Figure 9(a) we can clearly see that Bouml only reverse engineered and exportedvalid XMI for 9 out of 11 applications, or approximately 82% of the Java applications. For the 9 applicationsBouml did produce an output for, it failed to capture the Inner Classes (IC) and the Interfaces Implemented(II) metric.
The chart in Figure 9(a) also shows the trend of Bouml underestimating size metrics, while overestimatingInheritance metrics. The Methods Inherited (MI) metric is the only metric that Bouml produced that wascompletely accurate, with the Class to Leaf Depth (CLD) being slightly overestimated but acceptable.
Out of 132 individual metric values, Bouml captured 64 metrics that were correct or reported 48% of themetric values correctly. If we allow metrics that are in the warning or monitor zones Bouml was correct 76times or 58%.
UModel Results The chart in Figure 9(b) shows that UModel captured metrics for 10 out of 11 applications.That is to say that UModel successfully reverse engineered and exported to XMI 91% of the applications it wasevaluated with.
The 9(b) chart, shows a lot of white shading, it shows a trend of being correct a large proportion of thetime. UModel failed to capture one metric Number of Getters(NoG) for one application. It also shows thatnone of UModel’s metric values were outliers, with only one metric value being in the warning zone.
Out of 132 possible correct metric valuations, UModel reported 114 to be correct, or 86% of metric valuescaptured by UModel were correct. If we consider the warning zones to be acceptable we can say that UModelwas correct 119 times out of 132, or 90%.
21

(a) Bouml (b) Umodel
(c) Visual Paradigm (d) Argo UML
(e) Metamill (f) Enterprise Architect
Figure 9: Results for the first six tools. Each chart in this figure corresponds to the results for a singleUML CASE tool. Each of the 12 bars in the chart corresponds to a particular metric, with the total height ofthe bar reflecting the number of applications (up to 11) for which this tool calculated the corresponding metric.The bars reflect the accuracy of the metric value, and are colour coded as follows:
Deep blue = under the control limitLight blue = lower warning zoneWhite = accurate and reliableOrange = upper warning zoneDeep red = above the control limit
22

(b) ESSModel (c) MagicDraw
(d) Poseidon (e) Jude
(f) Ideogramic UML
Figure 10: Results for the last five tools. Each chart in this figure corresponds to the results for a singleUML CASE tool. Each of the 12 bars in the chart corresponds to a particular metric, with the total height ofthe bar reflecting the number of applications (up to 11) for which this tool calculated the corresponding metric.The bars reflect the accuracy of the metric value, and are colour coded as follows:
Deep blue = under the control limitLight blue = lower warning zoneWhite = accurate and reliableOrange = upper warning zoneDeep red = above the control limit
23

Visual Paradigm Results The chart in Figure 9(c) shows that Visual Paradigm was able to reverse engineerand export valid XMI for all of the Java applications used in this experiment. Visual Paradigm failed tocapture metrics for 5 of the Inheritance metrics and reported metric values below the Lower Control Level for3 Inheritance metrics.
The chart appears to show that Visual Paradigm was highly accurate with size metrics but struggled a littlewith Inheritance metrics. Visual Paradigm correctly reported 119 out of 132 metrics, i.e. it correctly reported90% of metrics. If we allow warning zones to be considered, Visual Paradigm correctly reported 91% of metrics.
ArgoUML Results Studying the chart in Figure 9(d), we can see that ArgoUML failed to reverse 2 of the 11Java applications, leaving just 9 for further evaluation. Within the 9 applications ArgoUML failed to capture5 metrics for one application.
The chart 9(d) shows that the tool has both under and over estimated many of the metrics, with a cleartrend showing, the tool under-estimating the size metrics while over-estimating the inheritance metrics. Wedeem 80 of ArgoUML’s reported metrics to be correct that is ArgoUML was correct for 61% of the cases. If thewarning limits were to be accepted we could say that Argo is correct for 73% of the metric values captured.
Metamill Results As chart in Figure 9(e) shows Metamill was able to reverse engineer and export to XMIall 11 Java applications. It failed to capture the Interfaces Implemented metric for all the applications, it alsofailed to capture the Inner Classes (IC) metric for one application.
The chart clearly shows mainly white shading, with some deep blue signifying a metric value below the LowerControl Limit. Out of 132 possible metric values, Metamill captured 120, or 91% of the metrics. Metamill hasno metric values in the warning zones, and just 2 outside the Control Limits. Metamill captured 118 metricscorrectly, that is to say Metamill was correct for 89% of the metric values captured.
Enterprise Architect Results If we take a look at Figure 9(f) we can see that Enterprise Architect onlysucceeded in reverse engineering and exporting XMI for 9 out of the 11 applications. Enterprise Architect alsofailed to capture Inner Class (IC) and Interfaces Implemented (II) metrics for any of the applications.
Investigating the results further, a trend becomes apparent, Enterprise Architect consistently under-estimatesall the metrics. Enterprise Architect reported 7 metric values that were outside the Control Limits and will bediscarded, When we add this to the 42 metrics that it failed to capture, we can say the Enterprise architect wascorrect 71 out of 132 times. If we accept warning zone values we can state that Enterprise Architect is correctin 63% of the cases.
ESSModel Results As we can see from Figure 10(b), ESSModel captured metrics for all 11 applications,but failed to capture the Inner Classes (IC) metric. ESSModel captured 92% of the available 132 metrics.ESSModel both over and under estimated metrics for a variety of different metrics, there was no noticeabletrend.
ESSModel reported 109 metric values that were deemed to be correct, this represents 83% of metric values.Another 9 metric values were within the warning zones and if we accept them as correct we can state thatESSModel has correctly reported 118 out of 132 metrics or 89%.
MagicDraw Results Investigating the chart in Figure 10(c), we find that MagicDraw captured all metricsfor all applications with only one exception, the Inner Classes (IC) metric for one application.
We can see that MagicDraw over and under reported the Inner Classes (IC) metric, the majority of the toolsstruggled to report this correctly, with many tools failing to capture it at all. MagicDraw captured 131 out of132 metrics, that is a 99% capture rate. We can see that MagicDraw correctly reported 117 metric values, thatis to say MagicDraw was correct in 89% of the cases. If the acceptance criteria is widened to include metricvalues in the warning zone we can say that MagicDraw is correct 95% of the time.
Poseidon Results Poseidon failed to reverse engineer and export valid XMI for one of the Java applicationsas shown in Figure 10(d). Out of the 10 applications it did report metrics for, it failed to capture 2 metrics forone application, so in total Poseidon captured 119 metric values.
24

(a) Absolute tool ranking, based on EQUAL
UMLTool LCL LWL EQUAL UWL UCLVP 7 1 119 (90%) 0 0
MM 2 0 118 (89%) 0 0MD 2 0 117 (89%) 9 3UM 0 0 114 (86%) 5 0ES 2 0 109 (83%) 9 1PO 7 8 98 (74%) 5 0JU 5 0 92 (70%) 0 0AR 4 3 80 (60%) 14 2EA 7 12 71 (54%) 0 0BO 12 1 64 (49%) 11 2IC 53 1 23 (17%) 0 0
(b) Tool ranking, allowing warning zones
UML LWL+UWLTool LCL +EQUAL UCLMD 2 126 (95%) 3VP 7 120 (91%) 0UM 0 119 (90%) 0MM 2 118 (89%) 0ES 2 118 (89%) 1PO 7 111 (84%) 0AR 4 97 (73%) 2JU 5 92 (70%) 0EA 7 83 (63%) 0BO 12 76 (58%) 2IC 53 24 (18%) 0
Table 6: Tool Rankings. These tables list the UML CASE tools in the leftmost column. Each column measuresthe number of metrics falling into a given metric level. The rows are ranked by the values in the middle column,which are also expressed as a percentage of the total possible metric values (132).
Figure 10(d) shows that for approximately half the metrics, Poseidon under reported them, with it onlyover reporting for the Interfaces Implemented (II) metric. Poseidon correctly reported 98 metric values, whichequates to 74%, if we accept the warning zones we can include another 13 metrics bring our accuracy level to84%.
Jude Results The chart in Figure 10(e) shows how Jude captured metrics from 9 of the Java applications,it also highlights how Jude failed to capture the Interfaces Implemented (II) metric.
Out of the metrics that were captures it appears that Jude was quite accurate, with only 2 metrics reportingvalues in outside the Control Limits. Jude reported no metrics within the warning zones, so we can state thatJude was 70% accurate.
Ideogramic UML Results Ideogramic UML reverse engineered and exported valid XMI for 10 out of 11 ofthe Java applications, however it failed to capture the Interfaces Implemented and Inner Classes metric. In themajority of metrics Ideogramic UML failed to capture a metric for each tool, in fact it only captured all themetrics values for 33% of the metrics. The chart in Figure 10(f) shows this trend.
Ideogramic UML captured 58% or 77 metric values. It captured 23 metrics that were deemed to be correct.Ideogramic UML reported 17% of the metrics correctly. If the scope is widened to include metric values in thewarning zones, we add 1 additional metric value and bring the level of correct metrics captured to 18%.
7 Conclusions and Future Work
In this section we will present our findings, explaining how we arrived at them. We also discuss areas of possiblefuture work and then rank the UML CASE tools by their accuracy.
7.1 Conclusion
Figure 11 sums up our findings on the eleven reverse engineering tools we have studied, and have presentedin Figures 9 and 10. However, unlike the previous section where a chart was displayed for every tool showingthe results of each individual metric, we have now summed the metric values and show only one chart with alleleven tools.
As with charts in the previous Section 6, the higher the proportion of white shading the higher the reliabilityof the tool. We can see that all tools over reported every metric at some stage, all the tools also under reportedat some stage with the exception of UModel, which didn’t under report.
25
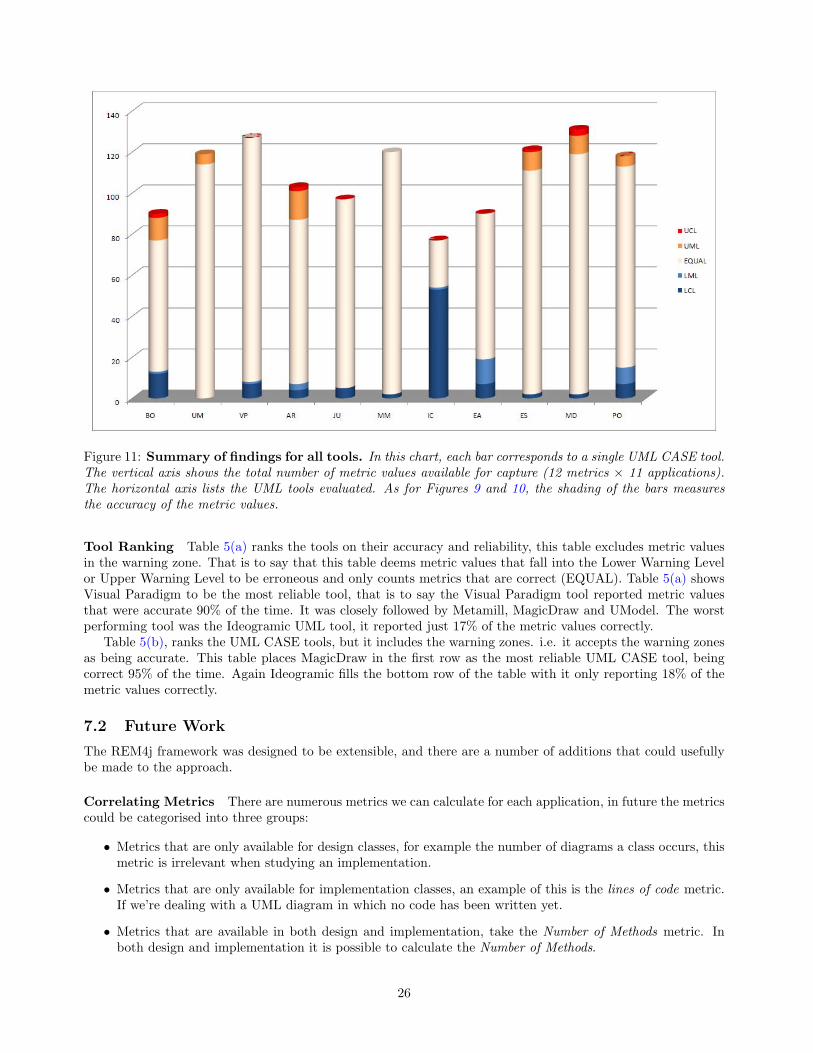
Figure 11: Summary of findings for all tools. In this chart, each bar corresponds to a single UML CASE tool.The vertical axis shows the total number of metric values available for capture (12 metrics × 11 applications).The horizontal axis lists the UML tools evaluated. As for Figures 9 and 10, the shading of the bars measuresthe accuracy of the metric values.
Tool Ranking Table 5(a) ranks the tools on their accuracy and reliability, this table excludes metric valuesin the warning zone. That is to say that this table deems metric values that fall into the Lower Warning Levelor Upper Warning Level to be erroneous and only counts metrics that are correct (EQUAL). Table 5(a) showsVisual Paradigm to be the most reliable tool, that is to say the Visual Paradigm tool reported metric valuesthat were accurate 90% of the time. It was closely followed by Metamill, MagicDraw and UModel. The worstperforming tool was the Ideogramic UML tool, it reported just 17% of the metric values correctly.
Table 5(b), ranks the UML CASE tools, but it includes the warning zones. i.e. it accepts the warning zonesas being accurate. This table places MagicDraw in the first row as the most reliable UML CASE tool, beingcorrect 95% of the time. Again Ideogramic fills the bottom row of the table with it only reporting 18% of themetric values correctly.
7.2 Future Work
The REM4j framework was designed to be extensible, and there are a number of additions that could usefullybe made to the approach.
Correlating Metrics There are numerous metrics we can calculate for each application, in future the metricscould be categorised into three groups:
• Metrics that are only available for design classes, for example the number of diagrams a class occurs, thismetric is irrelevant when studying an implementation.
• Metrics that are only available for implementation classes, an example of this is the lines of code metric.If we’re dealing with a UML diagram in which no code has been written yet.
• Metrics that are available in both design and implementation, take the Number of Methods metric. Inboth design and implementation it is possible to calculate the Number of Methods.
26

In the future, further study is needed on how these different metrics correlate. Do design and implementationmetrics correlate? One would also expect their to be a high correlation between the third category of metrics,those that are available in both implementation and design.
Per Class not Per Application As we found out REM4j in its current state is somewhat limited atcalculating metrics for coupling. This was due to the limitations of examining metrics on a per applicationrather than a per class basis. Perhaps in the future REM4j should be modified so it can fairly capture thecoupling metrics.
Tool Scripting Currently REM4j uses the Autohotkey macro facility to automate parts of the reverse engi-neering process, in the future the ability to do the macro recording should be built into the REM4j tool.
7.3 Summary
We have ranked the tools by the metrics we have chosen to evaluate them with, however every organisation isdifferent, to some organisations, size metrics may be of the up most importance, so they may choose to ignoreall other metrics. Likewise another organisation may decide to add a completely different suite of metrics, whichmay yield a different ranking for the tools. By design, REM4j is modular and its easy to add a new metricssuite at any time.
We set out to establish not just a tool for automating UML CASE tools, capturing metrics or calculatingmetrics, but a framework. The REM4j framework facilitates the steps necessary to evaluate a UML CASE tool,against any metric with any Java application.
REM4j encapsulates an automated tool that adheres to a sound framework for evaluating a UML CASEtools ability to reverse engineer and export valid XMI. It has benchmarked 11 UML CASE tools and clearlyshown which tools are reliable and which are untrustworthy.
References
[1] L. A. Barowski and J. H. Cross Ii, Extraction and use of class dependency information for Java, Proceedingsof the Ninth Working Conference on Reverse Engineering (2002), 309.
[2] Ted J. Biggerstaff, Design recovery for maintenance and reuse, Computer 22 (1989), no. 7, 36–49.
[3] Lionel Briand, Prem Devanbu, and Walcelio Melo, An investigation into coupling measures for C++,Proceedings of the 19th international conference on Software engineering (1997), 412–421.
[4] S. R. Chidamber and C. F. Kemerer, A metrics suite for object oriented design, IEEE Trans. Softw. Eng.20 (1994), no. 6, 476–493.
[5] Elliot J. Chikofsky and James H. Cross II, Reverse engineering and design recovery: A taxonomy, IEEESoftw. 7 (1990), no. 1, 13–17.
[6] David Cooper, Benjamin Khoo, Brian R. von Konsky, and Michael Robey, Java implementation verificationusing reverse engineering, Proceedings of the 27th Australasian conference on Computer science (2004),203–211.
[7] Andrea D’Ambrogio, A model transformation framework for the automated building of performance modelsfrom UML models, Proceedings of the 5th international workshop on Software and performance (2005),75–86.
[8] Thomas R. Dean, Andrew J. Malton, and Ric Holt, Union schemas as a basis for a C++ extractor,Proceedings of the Eighth Working Conference on Reverse Engineering (2001), 59.
[9] Stephen M Blackburn et al., The DaCapo benchmarks: Java benchmarking development and analysis,Proceedings of the 21st annual ACM SIGPLAN conference on Object-oriented programming systems,languages, and applications (2006), 169–190.
27

[10] R. Ferenc, F. Magyar, A. Beszedes, A. Kiss, and M. Tarkiainen., Columbus - tool for reverse engineeringlarge object oriented software systems, 7th Symposium on Programming Languages and Software Tools(2001), 1627.
[11] Anna Gerber and Kerry Raymond, MOF to EMF: there and back again, Proceedings of the 2003 OOPSLAworkshop on eclipse technology eXchange (2003), 60–64.
[12] Martin Gogolla and Ralf Kollmann, Re-documentation of Java with UML class diagrams, Proc. 7th Reengi-neering Forum, Reengineering Week 2000 Zurich (2000), 41–48.
[13] The Object Management Group, Proposal to the OMG OA&DTF RFP 3: Stream-based model interchangeformat (smif), 1998, pp. 1–246.
[14] Juanjuan Jiang and Tarja Systa, Exploring Differences in Exchange Formats - Tool Support and CaseStudies, Proceedings of the Seventh European Conference on Software Maintenance and Reengineering(2003), 389.
[15] Rick Kazman and S. Jeromy Carriere, Playing detective: Reconstructing software architecture from availableevidence, Automated Software Eng. 6 (1999), no. 2, 107–138.
[16] Martin Keschenau, Reverse engineering of UML specifications from Java programs, Companion to the 19thannual ACM SIGPLAN conference on Object-oriented programming systems, languages, and applications(2004), 326–327.
[17] Cris Kobryn, UML 2001: a standardization odyssey, Commun. ACM 42 (1999), no. 10, 29–37.
[18] Ralf Kollmann and Martin Gogolla, Metric-based selective representation of uml diagrams, Proceedings ofthe Sixth European Conference on Software Maintenance and Reengineering (2002), 89.
[19] Yasser Kotb and Takuya Katayama, Consistency checking of UML model diagrams using the XML seman-tics approach, Special interest tracks and posters of the 14th international conference on World Wide Web(2005), 982–983.
[20] M. Lorenz and J. Kidd, Object-oriented software metrics, Prentice Hall, 1994.
[21] Radu Marinescu and Michele Lanza, Object-oriented metrics in practice, Springer, 2006.
[22] Dave Randall and et al., Focus issue on legacy information systems and business process engineering:banking on the old technology: understanding the organisational context of Legacy issues, Commun. AIS 2(1999), 8.
[23] Steven D Sheetz, David E Monarchi, and David Tegarden, Effectiveness of Traditional Software Metricsfor Object-Oriented Systems, IEEE (1992), 359–368.
[24] James Skene and Wolfgang Emmerich, Specifications, not meta-models, Proceedings of the 2006 interna-tional workshop on Global integrated model management (2006), 47–54.
[25] Perdita Stevens, Small-Scale XMI programming: A revolution in UML tool use?, Automated Software Eng.10 (2003), no. 1, 7–21.
[26] Margaret-Anne D. Storey, Kenny Wong, and Hausi A. Muller, Rigi: a visualization environment for reverseengineering, Proceedings of the 19th international conference on Software engineering (1997), 606–607.
[27] Andrew Sutton and Jonathan I. Maletic, Mappings for accurately reverse engineering UML class modelsfrom C++, Proceedings of the 12th Working Conference on Reverse Engineering (2005), 175–184.
[28] Will Tracz, Book Reviews: The Deadline, A Novel about Project Management, Tom DeMarco, SIGSOFTSoftw. Eng. Notes 23 (1998), no. 1, 109–109.
[29] Jurgen Wust, SDMetrics, 2006, http://www.sdmetrics.com.
28
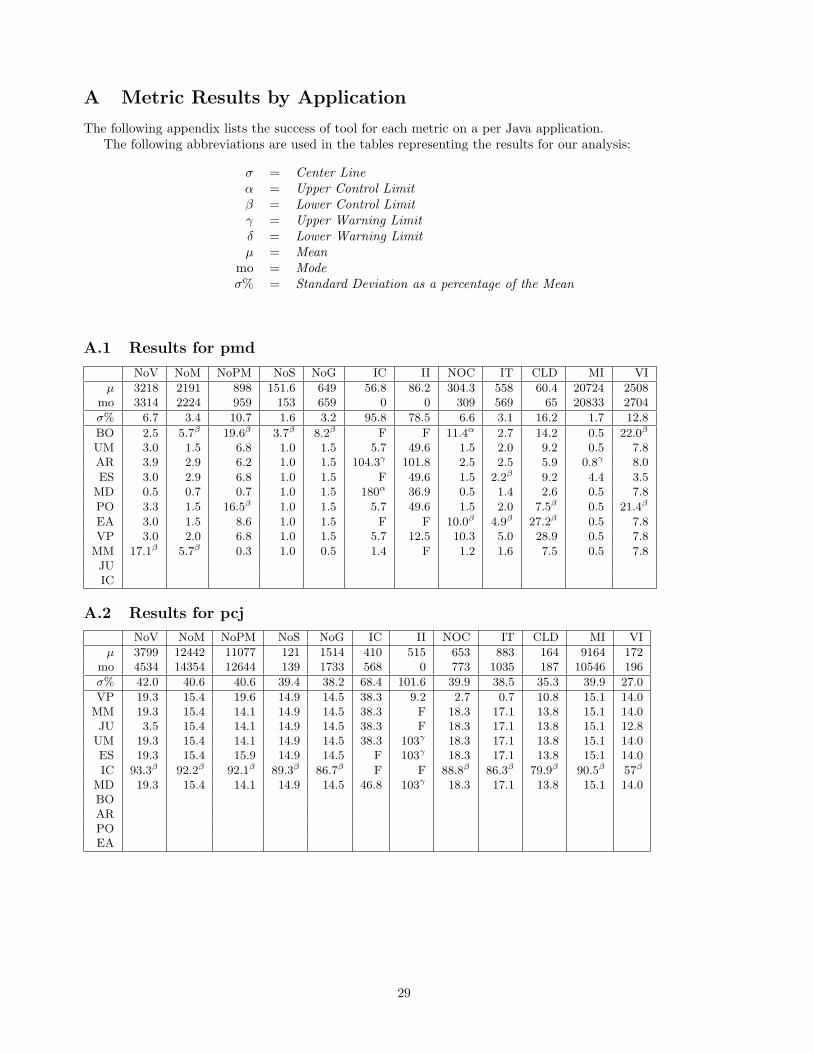
A Metric Results by Application
The following appendix lists the success of tool for each metric on a per Java application.The following abbreviations are used in the tables representing the results for our analysis:
σ = Center Lineα = Upper Control Limitβ = Lower Control Limitγ = Upper Warning Limitδ = Lower Warning Limitµ = Mean
mo = Modeσ% = Standard Deviation as a percentage of the Mean
A.1 Results for pmd
NoV NoM NoPM NoS NoG IC II NOC IT CLD MI VI
µ 3218 2191 898 151.6 649 56.8 86.2 304.3 558 60.4 20724 2508mo 3314 2224 959 153 659 0 0 309 569 65 20833 2704
σ% 6.7 3.4 10.7 1.6 3.2 95.8 78.5 6.6 3.1 16.2 1.7 12.8
BO 2.5 5.7β 19.6β 3.7β 8.2β F F 11.4α 2.7 14.2 0.5 22.0β
UM 3.0 1.5 6.8 1.0 1.5 5.7 49.6 1.5 2.0 9.2 0.5 7.8AR 3.9 2.9 6.2 1.0 1.5 104.3γ 101.8 2.5 2.5 5.9 0.8γ 8.0
ES 3.0 2.9 6.8 1.0 1.5 F 49.6 1.5 2.2β 9.2 4.4 3.5MD 0.5 0.7 0.7 1.0 1.5 180α 36.9 0.5 1.4 2.6 0.5 7.8
PO 3.3 1.5 16.5β 1.0 1.5 5.7 49.6 1.5 2.0 7.5β 0.5 21.4β
EA 3.0 1.5 8.6 1.0 1.5 F F 10.0β 4.9β 27.2β 0.5 7.8VP 3.0 2.0 6.8 1.0 1.5 5.7 12.5 10.3 5.0 28.9 0.5 7.8
MM 17.1β 5.7β 0.3 1.0 0.5 1.4 F 1.2 1.6 7.5 0.5 7.8JUIC
A.2 Results for pcj
NoV NoM NoPM NoS NoG IC II NOC IT CLD MI VI
µ 3799 12442 11077 121 1514 410 515 653 883 164 9164 172mo 4534 14354 12644 139 1733 568 0 773 1035 187 10546 196
σ% 42.0 40.6 40.6 39.4 38.2 68.4 101.6 39.9 38.5 35.3 39.9 27.0
VP 19.3 15.4 19.6 14.9 14.5 38.3 9.2 2.7 0.7 10.8 15.1 14.0MM 19.3 15.4 14.1 14.9 14.5 38.3 F 18.3 17.1 13.8 15.1 14.0JU 3.5 15.4 14.1 14.9 14.5 38.3 F 18.3 17.1 13.8 15.1 12.8
UM 19.3 15.4 14.1 14.9 14.5 38.3 103γ 18.3 17.1 13.8 15.1 14.0ES 19.3 15.4 15.9 14.9 14.5 F 103γ 18.3 17.1 13.8 15.1 14.0
IC 93.3β 92.2β 92.1β 89.3β 86.7β F F 88.8β 86.3β 79.9β 90.5β 57β
MD 19.3 15.4 14.1 14.9 14.5 46.8 103γ 18.3 17.1 13.8 15.1 14.0BOARPOEA
29

A.3 Results for java2d
NoV NoM NoPM NoS NoG IC II NOC IT CLD MI VI
µ 787 521 500 23 76 57 30 81 160 14 1216 1107mo 912 561 539 24 84 0 0 89 188 17 1348 1284
σ% 23.7 17.3 17.5 6.7 26.2 104.3 108.0 40.0 41.6 45.4 33.3 34.5
VP 15.8 7.5 7.7 2.7 10.5 17.6 60.8 24.7 38.2 46.3δ 10.8 15.9MM 15.8 7.5 7.7 2.7 10.5 17.6 F 9.9 17.4 14.0 10.8 15.9JU 18.9 7.5 7.7 2.7 10.5 19.3 F 9.9 17.4 14.0 10.8 7.0
BO 45.2β 41.0β 41.2β 18.7β 73.7β F F 56.8γ 42.4γ 67.7 2.5 4.3UM 15.8 7.5 7.7 2.7 10.5 17.6 112.2γ 9.9 17.4 14.0 10.8 15.9AR 15.8 7.5 7.7 2.7 10.5 55.7 112.2γ 32.1 28.7 34.1 10.8 15.9ES 15.4 7.5 8.1 2.7 10.5 F 112.2γ 9.9 17.4 14.0 10.8 15.9
IC 20.4 28.1β 28.8β 5.8 21.1 F F F F F F FMD 15.8 7.5 7.7 2.7 10.5 252α 112.2γ 9.9 17.4 14.0 10.8 15.9
PO 30.3δ 9.2 7.7 2.7 10.5 19.3 112.2γ 9.9 17.4 14.0 10.8 8.6EA 20.5 7.5 7.7 2.7 10.5 F F 23.5 37.5 39.6 10.8 15.9
A.4 Results for jolden
NoV NoM NoPM NoS NoG IC II NOC IT CLD MI VI
µ 100.4 155.5 270.3 13.0 12.7 1.9 2.8 5.7 5.6 2.9 71.8 40.5mo 92 203 314 15 15 3 0 6 6 3 74 47
σ% 65.4 41.9 34.8 33.2 31.5 87.5 107.5 37.0 35.9 37.9 36.9 46.5
VP 22.5 30.5 16.2 15.4 18.1 57.9 42.9 5.3 7.1 3.4 3.1 16.0MM 8.4 30.5 16.2 15.4 18.1 57.9 F 5.3 7.1 3.4 3.1 16.0JU 20.3 26.0 0.1 F 5.5 57.9 F 5.3 7.1 3.4 3.1 33.3BO 11.4 17.7 14.3 15.4 10.2 F F 40.4γ 25.0 37.9 3.1 33.3AR 20.3 13.8 0.1 F 5.5 57.9 114γ 5.3 7.1 3.4 3.1 16.0
ES 166.9β 30.5 16.2 15.4 18.1 F 114γ 5.3 7.1 3.4 28.1 55.6γ
IC 93.0δ 98.1β 97.0β 92.3β 84.3β F F F F F F FMD 9.4 28.0 15.4 15.4 18.1 111γ 114γ 5.3 7.1 3.4 25.3 55.6γ
PO 18.3 22.2 2.8 F 5.5 57.9 114γ 5.3 7.1 3.4 28.1 8.6EA 8.4 30.5 16.2 15.4 18.1 F F 22.8 25.0 37.9 3.1 16.0UM
A.5 Results for xalanNoV NoM NoPM NoS NoG IC II NOC IT CLD MI VI
σ 5433 3753 3073 360 1323 102 117 320.8 647 133 17042 3942mo 11980 9509 7633 921 3161 151 0 688 1378 287 35200 8463
µ% 66.6 52.9 52.8 51.9 57.0 82.9 99.5 71.4 71.7 69.1 72.9 73.2
AR 99.4δ 97.1β 96.6β 96.6β 97.9β 128α 89.8 F 99.8δ 99.0δ F FMD 46.8 34.0 31.0 32.6 36.3 79.2 101γ 53.1 52.9 48.5 51.9 59.6BO
MM 46.8 34.0 31.0 32.6 36.2 23.0 F 55.3 61.8 56.3 53.2 63.3VP 46.8 34.0 33.5 32.6 36.2 23.0 14.7 11.5 24.7 31.5 50.6 57.2JU
EA 89.2δ 64.7δ 68.1δ 71.8δ 86.9β F F 79.8δ 83.6δ 74.1δ 90.4δ 85.4δ
UM 46.8 34.0 31.0 32.6 36.2 23.0 101γ 53.1 50.6 51.1 50.6 57.2ES 42.3 33.8 44.2 32.6 35.6 F 101γ 53.1 40.6 37.1 31.9 36.8
IC 76.4δ 42.5 37.0 27.0 32.1 F F F F F F FPO 35.4 34.5 31.0 32.6 36.3 23.0 101γ 53.3 52.9 48.5 52.1 11.3
30

A.6 Results for junit
NoV NoM NoPM NoS NoG IC II NOC IT CLD MI VI
µ 275.1 97.8 369.8 6.5 58.3 6.9 7.9 30.4 37.7 20.5 304.5 19.5mo 343 112 462 8 78 0 0 30 46 18 370 25
σ% 38.8 52.5 40.1 41.8 52.4 133.4 97.8 35.7 36.4 32.5 39.9 57.1
VP 27.6 14.5 26.3 23.9 33.9 30.3 64.4 14.4 7.2 12.4 21.5 28.5MM 5.4 8.4 18.7 23.9 21.8 42.1 F 1.2 12.5 12.4 3.5 28.0JU 24.7 23.3 24.7 23.9 33.9 13.2 F 15.3 19.3 16.8 21.5 22.9EA 24.7 14.5 24.9 23.9 33.9 F F 11.1 4.6 7.5 21.5 28.5BO 12.0 28.4 11.1 23.9 23.6 F F 8.7 0.7 7.1 9.3 28.0UM 18.1 9.4 17.1 22.5 21.8 13.2 64.4 18.6 21.9 21.7 12.0 2.8AR 25.4 14.5 25.5 23.9 33.9 247γ 140γ 58.1γ 56.4γ 41.2γ 48.7γ 64.5γ
ES 17.8 120γ 23.5 8.5 46.8 F 77.0 2.1 1.9 11.9 20.9 95.3γ
IC 88.0β 88.8β 88.6β F 98.3β F F 90.1β 92.0β 85.4β F FMD 24.7 14.5 24.9 23.9 33.9 261γ 77.0 15.3 21.9 16.8 21.8 28.5
PO 56.7δ 55.0δ 61.1β 53.5δ 91.4β 71.1 77.0 1.2 1.9 2.2 32.0 69.2δ
A.7 Results for fop
NoV NoM NoPM NoS NoG IC II NOC IT CLD MI VI
µ 92.4 130.9 109.1 33.0 37.5 1.4 0.5 4.7 4.7 4.1 0 0mo 97 133 111 33 38 0 0 6 6 5 0 0
σ% 10.2 5.6 6.4 0.0 4.8 331.7 114.9 51.9 51.9 50.6 0.0 0.0
VP 5.0 1.6 2.7 0.0 1.5 F F F F F 0 0MM 5.0 1.6 1.8 0.0 1.5 F F 26.9 26.9 22.2 0 0
JU 28.5β 1.6 1.8 0.0 1.5 F F 26.9 26.9 46.7 0 0BO 1.8 1.6 1.8 0.0 1.5 F F 48.1 48.1 46.7 0 0UM 5.0 1.6 1.8 0.0 1.5 F 120γ 26.9 26.9 22.2 0 0AR 2.9 1.6 1.8 0.0 1.5 F 120γ 57.7 57.7 51.1 0 0IC 1.8 16.7 19.3 0.0 14.6 F F 26.9 26.9 22.2 0 0ES 5.0 1.6 2.7 0.0 1.5 F 120γ 26.9 26.9 22.2 0 0
MD 5.0 1.6 1.8 0.0 1.5 F 120γ 26.9 26.9 22.2 0 0PO 8.0 2.4 1.8 0.0 1.5 F 120γ 26.9 26.9 22.2 0 0EA 5.0 1.6 1.8 0.0 1.5 F F 78.8 78.8 75.6 0 0
A.8 Results for hsqldb
NoV NoM NoPM NoS NoG IC II NOC IT CLD MI VI
µ 3204 4586 2562 325 1268 62 48 118 158 75 2071 978mo 3499 4804 2445 340 1323 58 0 136 188 86 2322 1161
σ% 10.3 13.5 19.2 13.7 12.4 159.5 111.5 42.8 42.9 42.7 35.2 36.3
VP 9.2 4.7 1.9 4.6 4.3 6.9 2.9 25.9 31.4 26.2 11.7 18.2MM 9.2 4.7 4.6 4.6 4.3 6.9 F 14.5 18.4 14.6 12.1 18.6JU 10.2 4.7 4.6 4.6 4.3 6.9 F 14.5 18.4 13.3 12.1 1.2BO 6.9 0.5 11.9 2.4 0.5 F F 63.3γ 51.8γ 62.1γ 9.0 1.6UM 9.2 4.7 4.6 4.6 4.3 6.9 124.3γ 14.5 18.4 14.6 11.7 18.2
IC 15.8β 38.0β 15.4 38.8β 35.2β F F F F F F FES 2.2 4.7 52.9α 4.6 4.3 F 124.3γ 14.5 17.8 18.6 6.8 11.2
MD 9.2 4.7 4.6 4.6 4.3 434β 124.3γ 14.5 18.4 13.3 12.1 18.6
PO 11.1δ 5.4 4.6 4.6 4.3 6.9 124.3γ 14.5 18.4 13.3 12.3 0.6EA 9.4 4.7 4.6 4.6 4.3 F F 24.2 30.1 23.6 12.1 18.6AR
31

A.9 Results for jameleon
NoV NoM NoPM NoS NoG IC II NOC IT CLD MI VI
µ 498 1223 914 247 361 34 27 95 203 63 2592 679mo 547 1254 939 250 364 0 0 100 217 68 2667 759
σ% 14.2 7.4 8.8 3.6 1.8 183.8 105.8 20.5 22.1 19.9 9.6 17.3
VP 9.8 2.5 4.2 1.2 0.7 50.3 6.7 39.1β 36.9β 38.3β 2.9 11.6MM 9.8 2.5 2.7 1.2 0.7 50.3 F 10.2 6.9 7.6 2.9 11.6
JU 30.4β 2.5 2.7 1.2 0.7 44.4 F 10.2 6.9 7.6 2.9 36.8β
EA 9.8 2.5 2.7 1.2 0.7 F F 38.1β 36.5β 36.7β 2.9 11.6BO 9.5 0.4 0.1 0.4 0.7 F F 29.1γ 41.4α 26.6γ 2.9 15.9UM 9.8 2.5 2.7 1.2 0.7 50.3 72.9 5.0 6.9 7.6 2.9 11.6AR 7.6 2.8 3.2 1.2 0.7 113.6 201.7 0.8 13.8 5.0 3.0 10.8
IC 9.1 22.1β 26.3β 11.0β 5.4β F F 7.1 4.4 7.6 29.0β 8.7ES 9.8 2.5 2.7 1.2 0.7 F 72.9 5.0 6.9 7.6 2.9 11.6
MD 9.8 2.5 2.7 1.2 0.7 523.1 72.9 5.0 6.9 7.6 2.9 11.6
PO 17.1δ 2.5 2.7 1.2 0.7 41.5 72.9 5.0 6.9 7.6 2.9 19.3δ
A.10 Results for antlrNoV NoM NoPM NoS NoG IC II NOC IT CLD MI VI
µ 1768 735 2352 189 293 6 39 96 169 60 2088 666mo 884 2502 1857 196 304 5 0 99 177 62 2246 784
σ% 27.9 20.0 16.9 10.5 11.1 146.6 86.6 11.9 13.2 9.3 23.4 27.6
MM 5.0 20.2 6.4 3.3 3.5 24.2 F 4.2 4.6 3.2 7.5 17.7JU 5.0 12.5 6.4 3.3 3.5 24.2 F 3.1 4.6 3.2 7.5 15.2BO 4.5 27.6 6.0 3.3 3.5 F F 13.5γ 13.5γ 11.5γ 7.0 11.9UM 5.0 20.2 6.4 3.3 3.5 24.2 70.9 3.1 4.6 3.2 7.5 17.7AR 5.0 20.2 6.4 3.3 3.5 21.2 76.0 4.2 5.2 4.8 7.5 17.7ES 7.6 20.1 6.4 3.3 3.5 F 70.9 3.1 4.0 1.5 7.0 16.7
IC 48.0β 53.9β 56.9β 29.9β 31.6β F F 31.3β 32.6β 15.1β 66.7β 67.4β
MD 5.0 20.2 6.4 3.3 3.5 400β 70.9 3.1 4.6 3.2 7.5 17.7PO 5.0 27.2 6.4 3.3 3.5 24.2 70.9 3.1 4.6 3.2 7.5 10.8
VP 6.0 20.2 6.4 3.3 3.5 24.2 40.3 6.3 13.1 18.5β 7.5 17.7EA
A.11 Results for eje
NoV NoM NoPM NoS NoG IC II NOC IT CLD MI VI
µ 363 525 401 73 137 45 7 71 87 41 147 60mo 450 551 412 75 142 0 0 81 104 48 151 68
σ% 38.7 13.3 12.4 4.5 7.5 154.1 111.6 37.0 37.8 34.7 7.1 21.3
VP 23.7 4.8 10.2 1.6 3.1 21.4 36.0 67.9β 70.4β 70.9β 2.2 11.8MM 23.7 4.8 2.5 1.6 3.1 21.4 F 11.8 15.1 11.7 2.2 11.8
JU 69.5β 4.8 2.5 1.6 3.1 19.2 F 13.2 18.5 16.6 2.2 49.0β
EA 23.7 4.8 2.5 1.6 3.1 F F 66.5β 69.2β 68.4β 2.2 11.8
BO 4.7 20.1β 12.6δ 1.1 20.1β F F 25.8 7.7 9.3 2.2 0.3UM 23.7 4.8 2.5 1.6 3.1 21.4 79.1 13.2 18.5 16.6 2.2 11.8AR 28.4 13.0 12.0 1.6 3.8 65.9 219α 51.0γ 49.3γ 26.3 2.2 11.8
IC 38.7 31.9β 32.3β 13.3β 8.5δ F F 20.3 9.9 9.3 21.5β 0.3ES 23.7 4.8 7.5 1.6 3.1 F 79.1 13.2 18.5 16.6 2.2 11.8
MD 23.7 4.8 2.5 1.6 3.1 436α 79.1 13.2 18.5 16.6 2.2 11.8
PO 67.0β 5.0 2.5 1.6 3.1 19.2 79.1 13.2 18.5 16.6 2.2 34.2β
32