Benchmarking technical and cost factors in forest felling ...
13
Full Terms & Conditions of access and use can be found at http://www.tandfonline.com/action/journalInformation?journalCode=tife20 Download by: [IIASA] Date: 29 May 2017, At: 00:53 International Journal of Forest Engineering ISSN: 1494-2119 (Print) 1913-2220 (Online) Journal homepage: http://www.tandfonline.com/loi/tife20 Benchmarking technical and cost factors in forest felling and processing operations in different global regions during the period 2013–2014 Fulvio Di Fulvio , Dalia Abbas, Raffaele Spinelli, Mauricio Acuna, Pierre Ackerman & Ola Lindroos To cite this article: Fulvio Di Fulvio , Dalia Abbas, Raffaele Spinelli, Mauricio Acuna, Pierre Ackerman & Ola Lindroos (2017): Benchmarking technical and cost factors in forest felling and processing operations in different global regions during the period 2013–2014, International Journal of Forest Engineering, DOI: 10.1080/14942119.2017.1311559 To link to this article: http://dx.doi.org/10.1080/14942119.2017.1311559 © 2017 The Author(s). Published by Informa UK Limited, trading as Taylor & Francis Group. View supplementary material Published online: 26 May 2017. Submit your article to this journal Article views: 17 View related articles View Crossmark data
Transcript of Benchmarking technical and cost factors in forest felling ...

Full Terms & Conditions of access and use can be found athttp://www.tandfonline.com/action/journalInformation?journalCode=tife20
Download by: [IIASA] Date: 29 May 2017, At: 00:53
International Journal of Forest Engineering
ISSN: 1494-2119 (Print) 1913-2220 (Online) Journal homepage: http://www.tandfonline.com/loi/tife20
Benchmarking technical and cost factors in forestfelling and processing operations in differentglobal regions during the period 2013–2014
Fulvio Di Fulvio , Dalia Abbas, Raffaele Spinelli, Mauricio Acuna, PierreAckerman & Ola Lindroos
To cite this article: Fulvio Di Fulvio , Dalia Abbas, Raffaele Spinelli, Mauricio Acuna, PierreAckerman & Ola Lindroos (2017): Benchmarking technical and cost factors in forest felling andprocessing operations in different global regions during the period 2013–2014, International Journalof Forest Engineering, DOI: 10.1080/14942119.2017.1311559
To link to this article: http://dx.doi.org/10.1080/14942119.2017.1311559
© 2017 The Author(s). Published by InformaUK Limited, trading as Taylor & FrancisGroup.
View supplementary material
Published online: 26 May 2017. Submit your article to this journal
Article views: 17 View related articles
View Crossmark data

Benchmarking technical and cost factors in forest felling and processing operationsin different global regions during the period 2013–2014Fulvio Di Fulvio a,b, Dalia Abbasc, Raffaele Spinellid, Mauricio Acunae, Pierre Ackermanf and Ola Lindroos b
aEcosystems Services and Management Program (ESM), International Institute for Applied Systems Analysis (IIASA), Laxenburg, Austria;bDepartment of Forest Biomaterials and Technology, Swedish University of Agricultural Sciences, Umeå, Sweden; cWarnell School of Forestry andNatural Resources, Savannah River Ecology Lab, University of Georgia, Athens, GA, USA; dTrees and Timber Institute CNR-IVALSA, Sesto Fiorentino,Italy; eAustralian Forest Operations Research Alliance (AFORA), University of the Sunshine Coast, Sippy Downs, QLD, Australia; fDepartment ofForest and Wood Science, Stellenbosch University, Stellenbosch, South Africa
ABSTRACTIn a global bioeconomy, benchmarking costs is essential in the evaluation of current forest harvestingsystems and addressing decisions on the most efficient supply chains for available forest resources.Benchmarking cost rates in forestry is challenging, due to a lack of harmonized terminology anddifficulties in collecting information on comparable forest technologies. This study provides a first-time series of cost factors to be used when modeling and evaluating the cost competitiveness of forestfelling and processing operations on a global scale. It is based on an expert survey using a standardizedmethod of data collection. This benchmarking identifies and updates the knowledge of technical andsocio-economic factors capable of influencing the cost rates of forest felling and processing operationsacross different regions. This study is expected to act as a reference for larger investigations, and forregular updates, with the aim to provide current data that can be used by forest practitioners anddecision makers for improving their cost efficiency and for designing future supply systems moreeffectively.
ARTICLE HISTORYReceived 21 October 2016Accepted 21 March 2017
KEYWORDSInternational benchmarking;cost rating; forest harvest-ing; cost database;competitiveness
Introduction
The global competition for wood supply is increasingly intense,and it is expected to further intensify in the future, due to theneed of meeting the growing demand for wood fiber (Frickoet al. 2016). The different labor, harvesting and transportationsystems’ costs, coupled with the fluctuation of exchange rates,have led to different levels of supply costs in different countriesover time (Siry et al. 2006). Hence both technical and socio-economic factors need to be considered when evaluating thecost competitiveness of forest supply chains from differentregions of the world (Nordfjell et al. 2004).
Estimating production costs in forestry has always been oneof the core areas of forest engineering (Mathews 1942; Stridsberg& Algvere 1967; Miyata & Steinhilb 1981; Nurminen et al. 2009).Wood supply costs can be assessed by detailed calculations ofthe time-unit costs for machinery, labor, fuel and other con-sumables (e.g. Miyata 1980; Butler & Dykstra 1981; Tufts &Mills 1982; Brinker et al. 2002; Bilek 2009; Ackerman et al.2014) and of their respective production rates. Forest harvestingis mostly conducted in rough and unstructured environmentalconditions, which strongly affects work performance and theimpacts from operations should be minimized. At the sametime, the resources (i.e. trees) are highly variable, in both sizeand shape. Thus, the prediction of production rates is challen-ging and has resulted in a substantial body of research, where
different production systems have been investigated (e.g. Olsen& Kellog 1983; McNeel & Dodd 1997; Eliasson et al. 1999;Purfürst & Lindroos 2011; Eriksson & Lindroos 2014; Tolan &Visser 2015; Lindroos & Cavalli 2016).
The rationale of this study is based on the understandingthat although production rates are very susceptible to workconditions, they are not strongly influenced by country bor-ders. Thus, under similar conditions regarding, for instance,tree and terrain features, labor skills, and harvesting technol-ogy, the production rates will be more or less similar acrosscountries. Therefore, models to predict production ratesunder various work conditions are rather straightforward tobe used in international comparisons.
In contrast, international benchmarking of costs are lessstraightforward because of the strong influence of nationaleconomies. For instance, time-unit costs derived in one coun-try cannot directly be applied to another country with differ-ent costs of living, and would need to be corrected forpossible differences capital, labor and fuel costs, and taxationlevels, as well as exchange rates. Thus, even if the productionsystem and the production rates are similar, the productioncost may differ between countries.
Benchmarking is a means of discovering the best achievableperformance, in this case in the forest industry sector.Benchmarking approaches are also useful tools for acquiring
CONTACT Fulvio Di Fulvio [email protected] Ecosystems Services and Management Program (ESM), International Institute for Applied Systems Analysis(IIASA), Laxenburg, Austria
Supplemental data for this article can be accessed here
INTERNATIONAL JOURNAL OF FOREST ENGINEERING, 2017https://doi.org/10.1080/14942119.2017.1311559
© 2017 The Author(s). Published by Informa UK Limited, trading as Taylor & Francis Group.This is an Open Access article distributed under the terms of the Creative Commons Attribution-NonCommercial-NoDerivatives License (http://creativecommons.org/licenses/by-nc-nd/4.0/),which permits non-commercial re-use, distribution, and reproduction in any medium, provided the original work is properly cited, and is not altered, transformed, or built upon in any way.
information on factors leading to cost differences between coun-tries, and for addressing decisions on the most convenient supplyfrom available forest resources. Hence, benchmarking can be usedto implement best practices and to identify industry leadershipperformance targets. A series of benchmarking studies on factorsinfluencing the contract rates for forest operations in differentregions have been recently completed through long-term mon-itoring (Holzleitner et al. 2011). Also interviews with forest con-tractors (Baker et al. 2013; Abbas et al. 2014; Dodson et al. 2015;Spinelli et al. 2015) and analyses of web databases (Spinelli et al.2011; Malinen et al. 2016) have been conducted. These studiespoint out that benchmarking of cost rates is extremely challen-ging, due to the difficulties in harmonizing the technical termi-nology and collecting information on comparable technologies.
The objective of this benchmarking study is to explore thevariable technical and socio-economic factors capable ofinfluencing the cost rates of forest harvesting operationsacross different regions of the world. The study is based onan expert survey using standard data collection methods. Thestudy aims to integrate and update the existing information tobuild an expert’s validated reference database. The databaseprovides a first time series of cost factors to help model andevaluate the cost competitiveness of forest felling and proces-sing operations on a global scale. Results from the study couldaid in the development of market studies targeting woodsupply and demand factors globally.
Materials and methods
Data collection and harmonization
An expert-based data collection process was initiated inSeptember 2014. Experts in timber harvesting operationsthrough the authors’ professional networks, and experts’recommendations, from different regions of the world werecontacted by e-mail, face-to-face meetings, and telephonecalls. These experts were asked to provide an itemized anddetailed description of hourly costs for the most representa-tive technologies used for felling trees in their region and/orcountry. Experts were asked to select the most common fell-ing operations in their region/country from the followingthree options:
(A) Medium-sized wheeled harvester: cut-to-length (CTL)harvester equipped with single grip harvesting head,6–8 wheels, weight 15–20 tonnes, engine power140–180 kW (e.g. Komatsu 911, John Deere 1170).
(B) Medium-sized tracked harvester or feller-buncher:CTL or full tree-tracked harvester equipped with sin-gle grip harvesting head or with a feller-buncher head,weight 25–35 tonnes, engine power 200–250 kW (e.g.Tigercat 830, 845, CAT 522, 541).
(C) Motor-manual felling with chainsaw: a specializedoperator with heavy chainsaw, chainsaw weight6–8 kg and engine power 4–5 kW (e.g. Stihl 461,Husqvarna 395).
The order of priority for providing information was A toC, meaning that if they could not provide a good estimate ofcosts for A, they could provide estimations for B, or C, in that
order. If other forest felling and processing technologies werealso relevant in their region, they should provide a shortdescription and their cost rate estimation.
The aim of establishing the categories mentioned abovewas to create groups of equipment which are as comparableas possible, in terms of size, brand, and manufacturers.
The experts were asked to provide estimations of the mostcurrent cost rates, preferably from the years 2013 and 2014.The estimated costs reflect average operating conditions oftheir country or region and all costs provided in LocalCurrency Units (LCU).
The experts completed a standard MS Excel-based spread-sheet for accounting costs of forest harvesting operations(Ackerman et al. 2014). A guide on the approaches for asses-sing single cost components was provided, according to therecommendation given by Ackerman et al. (2014). Theexperts’ input the cost parameters using the fields (c.f.Table 1) to the costing model and checked the outputobtained from the cost model (as costs per hour, cost permonth and cost per year). However, experts could not modifythe model equations or calculations.
Experts’ contacts provided all relevant inputs needed forcalculation of machine cost rates per Productive MachineHour (PMH).1 VAT (Value Added Taxes) were excludedfrom cost accounting, as well as the profit margins for forestcompanies. Complementary information was also collected,
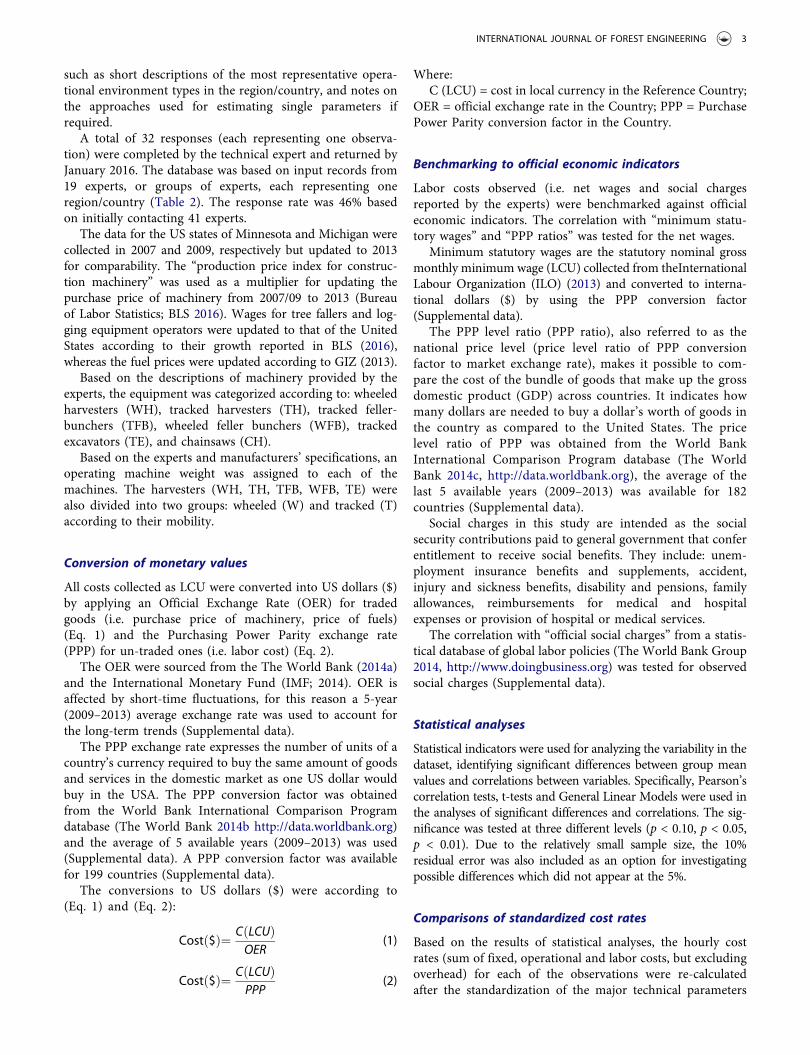
Table 1. Parameters collected with the standardized cost accounting template.
Input Unit
Machine type DescriptionCountry specific currency (Localcurrency unit)
LCU
Machine fixed cost inputsPurchase price or replacement cost LCUSalvage value LCU or % (Purchase Price)Expected economic life (EEL) PMHInterest rate %Machine tax/registration LCU/YearMachine insurance LCU/YearMachine transfers LCU/YearGaraging for machine LCU/YearMachine variable cost inputsFuel cost per liter LCU/literFuel consumption liter/PMHOil and lubricant cost % (Fuel Cost/PMH)Maintenance and repair cost LCU/Year or % (Purchase Price)Running gears LCU/PMHConsumables LCU/PMHOperator costsNumber of operators/shift No.Average net wage LCU/SMHSubsistence allowance LCU/SMHOther operator costs LCU/SMHSocial charges LCU/SMH or % net wagePersonal protective equipment LCU/SMHTraining LCU/SMHPhone charges LCU/SMHInsurance LCU/SMHOperator transportation LCU/SMHGeneral inputNumber of working days per year No.Number of shifts per day No.Scheduled hours per shift No.Machine utilization rate % (PMH/SMH)OtherMachine overhead + operator/s LCU/Year or % (fixed and variable
cost/PMH)
2 F. DI FULVIO ET AL.
such as short descriptions of the most representative opera-tional environment types in the region/country, and notes onthe approaches used for estimating single parameters ifrequired.
A total of 32 responses (each representing one observa-tion) were completed by the technical expert and returned byJanuary 2016. The database was based on input records from19 experts, or groups of experts, each representing oneregion/country (Table 2). The response rate was 46% basedon initially contacting 41 experts.
The data for the US states of Minnesota and Michigan werecollected in 2007 and 2009, respectively but updated to 2013for comparability. The “production price index for construc-tion machinery” was used as a multiplier for updating thepurchase price of machinery from 2007/09 to 2013 (Bureauof Labor Statistics; BLS 2016). Wages for tree fallers and log-ging equipment operators were updated to that of the UnitedStates according to their growth reported in BLS (2016),whereas the fuel prices were updated according to GIZ (2013).
Based on the descriptions of machinery provided by theexperts, the equipment was categorized according to: wheeledharvesters (WH), tracked harvesters (TH), tracked feller-bunchers (TFB), wheeled feller bunchers (WFB), trackedexcavators (TE), and chainsaws (CH).
Based on the experts and manufacturers’ specifications, anoperating machine weight was assigned to each of themachines. The harvesters (WH, TH, TFB, WFB, TE) werealso divided into two groups: wheeled (W) and tracked (T)according to their mobility.
Conversion of monetary values
All costs collected as LCU were converted into US dollars ($)by applying an Official Exchange Rate (OER) for tradedgoods (i.e. purchase price of machinery, price of fuels)(Eq. 1) and the Purchasing Power Parity exchange rate(PPP) for un-traded ones (i.e. labor cost) (Eq. 2).
The OER were sourced from the The World Bank (2014a)and the International Monetary Fund (IMF; 2014). OER isaffected by short-time fluctuations, for this reason a 5-year(2009–2013) average exchange rate was used to account forthe long-term trends (Supplemental data).
The PPP exchange rate expresses the number of units of acountry’s currency required to buy the same amount of goodsand services in the domestic market as one US dollar wouldbuy in the USA. The PPP conversion factor was obtainedfrom the World Bank International Comparison Programdatabase (The World Bank 2014b http://data.worldbank.org)and the average of 5 available years (2009–2013) was used(Supplemental data). A PPP conversion factor was availablefor 199 countries (Supplemental data).
The conversions to US dollars ($) were according to(Eq. 1) and (Eq. 2):
Cost $ð Þ¼ C LCUð ÞOER
(1)
Cost $ð Þ¼ C LCUð ÞPPP
(2)
Where:C (LCU) = cost in local currency in the Reference Country;
OER = official exchange rate in the Country; PPP = PurchasePower Parity conversion factor in the Country.
Benchmarking to official economic indicators
Labor costs observed (i.e. net wages and social chargesreported by the experts) were benchmarked against officialeconomic indicators. The correlation with “minimum statu-tory wages” and “PPP ratios” was tested for the net wages.
Minimum statutory wages are the statutory nominal grossmonthly minimumwage (LCU) collected from theInternationalLabour Organization (ILO) (2013) and converted to interna-tional dollars ($) by using the PPP conversion factor(Supplemental data).
The PPP level ratio (PPP ratio), also referred to as thenational price level (price level ratio of PPP conversionfactor to market exchange rate), makes it possible to com-pare the cost of the bundle of goods that make up the grossdomestic product (GDP) across countries. It indicates howmany dollars are needed to buy a dollar’s worth of goods inthe country as compared to the United States. The pricelevel ratio of PPP was obtained from the World BankInternational Comparison Program database (The WorldBank 2014c, http://data.worldbank.org), the average of thelast 5 available years (2009–2013) was available for 182countries (Supplemental data).
Social charges in this study are intended as the socialsecurity contributions paid to general government that conferentitlement to receive social benefits. They include: unem-ployment insurance benefits and supplements, accident,injury and sickness benefits, disability and pensions, familyallowances, reimbursements for medical and hospitalexpenses or provision of hospital or medical services.
The correlation with “official social charges” from a statis-tical database of global labor policies (The World Bank Group2014, http://www.doingbusiness.org) was tested for observedsocial charges (Supplemental data).
Statistical analyses
Statistical indicators were used for analyzing the variability in thedataset, identifying significant differences between group meanvalues and correlations between variables. Specifically, Pearson’scorrelation tests, t-tests and General Linear Models were used inthe analyses of significant differences and correlations. The sig-nificance was tested at three different levels (p < 0.10, p < 0.05,p < 0.01). Due to the relatively small sample size, the 10%residual error was also included as an option for investigatingpossible differences which did not appear at the 5%.
Comparisons of standardized cost rates
Based on the results of statistical analyses, the hourly costrates (sum of fixed, operational and labor costs, but excludingoverhead) for each of the observations were re-calculatedafter the standardization of the major technical parameters
INTERNATIONAL JOURNAL OF FOREST ENGINEERING 3

Table2.
Summaryof
collected
inform
ation:
Coun
try/Region
,Item
descrip
tion,
Machine
catego
ry,M
obility
grou
p,Operatio
nale
nviro
nment,Power,M
achine
weigh
t,ReferenceExpertGroup
anddata
sources.
Obs.
no.
Coun
try/
region
Machine
descrip
tionrepo
rted
Machine
catego
rya
Mob
ilityb
Operatio
nal
environm
ent
Engine
power
(kW)
Machine
weigh
t(kg)
Reference:Nam
e(s)andorganizatio
nSource
c
1Au
stralia
(AUS)
Trackedharvestermedium
THT
Eucalyptus
plantatio
n220
27,000
Mauricio
Acun
a,Moh
ammad
Ghaffariyan,
AFORA
Owncostmod
el
2Brazil
(BRA
)Trackedharvester,weigh
t22.7
tonn
es,
engine
119kW
THT
Eucalyptus
plantatio
n119
22,700
SauloGuerra,GuilhermeOgu
ri,UNESP
Forest
contractors
3Brazil
(BRA
)Feller-bu
nchertrackedweigh
t30
tonn
es,eng
ine205–219kW
TFB
TEucalyptus
plantatio
n212
30,000
SauloGuerra,GuilhermeOgu
ri,UNESP
Forest
contractors
4Canada
(CAN
)Medium
wheeled
harvesterKomatsu
mod
el931.1
WH
WBo
real
forest
185
19,000
LucLeBel,ShuvaHariG
autam,P
ierre-Serge
Trem
blay,U
niversity
ofLaval
-
5France
(FRA
)Wheel
Harvester
Medium
JD1270
DWH
WTemperate
forest
160
17,500
Paul
Magaud,
Philipp
eRu
ch,FCB
A-
6Germany
(DEU
)Wheel
Harvester
Medium-largeJD
1270–1470
WH
WTemperate
forest
170
18,600
Jörg
Hittenbeck,U
niversity
ofGöttin
gen
Ownteaching
cost
mod
el7
Italy (ITA)
Thinning
Harvester
4wheels,weigh
t15
tonn
es,eng
ine100kW
WH
WThinning
pine
forest
100
15,000
RaffaeleSpinelli,NatasciaMagagno
tti,CN
R-IVALSA
Forest
contractorsand
field
stud
ies
8Japan
(JPN
)Ch
ainsaw
operationmedium
size
Husqvarna
550XP
CH-
Thinning
forest
2.8
4.9
Kazuhiro
Arug
a,Utsun
omiyaUniversity
-
9Latvia
(LVA
)Medium
harvesterJD
1070
WH
WEarly
thinning
forest
136
14,100
AndisLazdiņš,SILAVA
Forest
contractors
10Norway
(NOR)
Medium
wheeled
harvester
WH
WForest
160
17,500
BruceTalbot,Skogo
glandskapInstitu
te-
11Portug
al(PRT)
Medium
wheeled
harvesterJD
1270D
WH
WPine
forest
and
eucalyptus
plantatio
n
160
17,500
HelderViana,PolytechnicInstitu
teof
Viseu
Forest
contractorsand
machine
dealers
12Slovenia
(SVN
)Ch
ainsaw
medium
CH-
Forest
4.9
7.0
NikeKrajnc,SFI
Owncostmod
el
13SouthAfrica
(ZAF
)TrackedharvesterTimberpro
TL725B
THT
Eucalyptus
plantatio
n225
25,000
Pierre
Ackerm
an,Simon
Ackerm
anStellenb
osch
University
Forest
contractors
14SouthAfrica
(ZAF
)Trackedexcavatorwith
HitachiZ
axis
200Lcwith
harvesterhead
TET
Eucalyptus
pulpwood
plantatio
n118
21,300
Pierre
Ackerm
an,Simon
Ackerm
anStellenb
osch
University
Forest
contractors
15SouthAfrica
(ZAF
)TrackedexcavatorVo
lvoEC210bfwith
harvesterhead
TET
Eucalyptus
pulpwood
plantatio
n115
23,000
Pierre
Ackerm
an,Simon
Ackerm
anStellenb
osch
University
Forest
contractors
16Spain
(ESP)
Medium
wheeled
harvester160kW
,18
tonn
esWH
WForest
160
18,000
Sand
raSanchez,ElenaCang
a,CETEMAS
Forest
contractorsand
field
stud
ies
17Sw
eden
North
(SWE_NO)
Harvester
JD1170
WH
WForest
145
16,700
OlaLind
roos,SLU
Forest
contractor
18Sw
eden
(SWE)
Harvester
medium
sized
WH
WForest
160
17,500
LarsEliasson
,Skogforsk
Forest
contractors
19US M
aine
(USA
_ME)
Trackedharvestermedium-large
THT
Forest
220
27,000
SteveBick,N
ortheastForests,LLC
Forest
contractors
20US M
aine
(USA
_ME)
Trackedfeller-bu
ncher
TFB
TForest
212
30,000
SteveBick,N
ortheastForests,LLC
Forest
contractors
21USMichigan
(USA
_MI)
Feller-bu
nchertracked179kW
TFB
TPartialcut
forest
179
24,700
DaliaAb
bas,MichiganStateUniversity
Forest
contractorsand
costmod
els
22USMichigan
(USA
_MI)
Harvester
medium
149kW
WH
WPartialcut
forest
149
16,700
DaliaAb
bas,MichiganStateUniversity
Forest
contractorsand
costmod
els
23USMinnesota
(USA
_MN)
Feller-bu
nchertrackedTimbco425160
kWTFB
TPartialcut
forest
127
22,600
DaliaAb
bas,University
ofMinnesota
Forest
contractorsand
costmod
els
24USMinnesota
(USA
_MN)
Feller-bu
nchertrackedFabtek
153123
kWTFB
TPartialcut
forest
123
20,400
DaliaAb
bas,University
ofMinnesota
Forest
contractorsand
costmod
els (Con
tinued)
4 F. DI FULVIO ET AL.
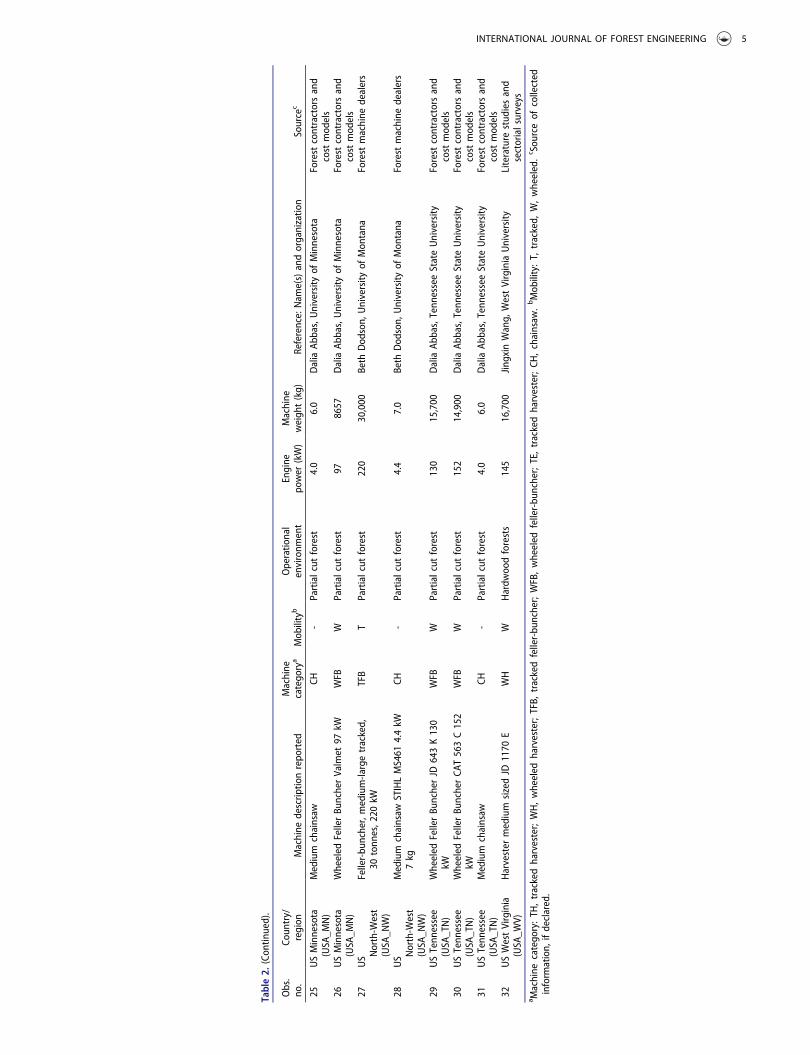
Table2.
(Con
tinued).
Obs.
no.
Coun
try/
region
Machine
descrip
tionrepo
rted
Machine
catego
rya
Mob
ilityb
Operatio
nal
environm
ent
Engine
power
(kW)
Machine
weigh
t(kg)
Reference:Nam
e(s)andorganizatio
nSource
c
25USMinnesota
(USA
_MN)
Medium
chainsaw
CH-
Partialcut
forest
4.0
6.0
DaliaAb
bas,University
ofMinnesota
Forest
contractorsand
cost
mod
els
26USMinnesota
(USA
_MN)
Wheeled
FellerBu
ncherValmet
97kW
WFB
WPartialcut
forest
978657
DaliaAb
bas,University
ofMinnesota
Forest
contractorsand
cost
mod
els
27US N
orth-W
est
(USA
_NW)
Feller-bu
ncher,medium-largetracked,
30tonn
es,2
20kW
TFB
TPartialcut
forest
220
30,000
Beth
Dod
son,
University
ofMon
tana
Forest
machine
dealers
28US N
orth-W
est
(USA
_NW)
Medium
chainsaw
STIHLMS461
4.4kW
7kg
CH-
Partialcut
forest
4.4
7.0
Beth
Dod
son,
University
ofMon
tana
Forest
machine
dealers
29USTenn
essee
(USA
_TN)
Wheeled
FellerBu
ncherJD
643K130
kWWFB
WPartialcut
forest
130
15,700
DaliaAb
bas,Tenn
esseeStateUniversity
Forest
contractorsand
cost
mod
els
30USTenn
essee
(USA
_TN)
Wheeled
FellerBu
ncherCA
T563C152
kWWFB
WPartialcut
forest
152
14,900
DaliaAb
bas,Tenn
esseeStateUniversity
Forest
contractorsand
cost
mod
els
31USTenn
essee
(USA
_TN)
Medium
chainsaw
CH-
Partialcut
forest
4.0
6.0
DaliaAb
bas,Tenn
esseeStateUniversity
Forest
contractorsand
cost
mod
els
32USWestVirginia
(USA
_WV)
Harvester
medium
sizedJD
1170
EWH
WHardw
oodforests
145
16,700
Jingxin
Wang,
WestVirginiaUniversity
Literature
stud
iesand
sectorialsurveys
a Machine
catego
ry:TH
,trackedharvester;WH,wheeled
harvester;TFB,
trackedfeller-bu
ncher;WFB,wheeled
feller-bu
ncher;TE,trackedharvester;CH
,chainsaw
.bMob
ility:T,
tracked,
W,wheeled.c Sou
rceof
collected
inform
ation,
ifdeclared.
INTERNATIONAL JOURNAL OF FOREST ENGINEERING 5
(salvage value, economic life and utilization). This enabledthe removal of possible effects due to the specific condition ofuse (e.g. size of the forest company) and isolate the maincountry borders’ effects.
Results
The benchmarking exercise consisted of 32 observations intotal: 12 WH, 6 TFB, 4 TH, 3 WFB, 2 TE and 5 CH opera-tions (see details in the Supplemental data).
Fixed costs
In the case of harvesters (WH, TH, TFB, WFB, TE) therewere large variations in the reported purchase price, whichranged from 200,000 to 700,000 $ (Figure 1). The same wastrue for chainsaws, with a purchase price varying from 800 to2,223 $.
A positive correlation (r = 0.36, p = 0.06) was observedbetween the weight of harvesters and their purchase price(Figure 1). Once weight was introduced in the comparisonas a covariate, the price of highly sophisticated CTL machines(WH, TH) was significantly higher (p < 0.001) than the priceof less sophisticated full-tree harvesting machines (TFB, TE,WFB), often based on multipurpose base machines. Machineweight and category (CTL vs. WT machine type) togetherexplained 72% of the variability in the purchase prices ofharvesters. The weight of the machines was also significantlycorrelated with their engine power rating (kW) (r = 0.49,p < 0.001).
The reported average salvage value was significantly lowerfor tracked harvesters (TH, TE, TFB = 12.2% of purchasevalue, SD = 5.1% units) than for wheeled harvesters (WH,WFB = 20.3%, SD = 7.8) (p = 0.001). The average salvagevalue for chainsaws was 9% (SD = 9%). The service life(years) and annual utilization (PMH/year) of harvesters didnot show any significant correlation with salvage value.
The EEL was 13,561 PMH (SD = 5177) for harvesters(WH, TH, TFB, TE, WFB) and 1976 PMH (SD = 881) forchainsaws (CH). EEL was significantly (p = 0.03) shorter forwheeled feller bunchers (8667 PMH) compared with otherharvesters (14,173 PMH). When reported in years, the EEL ofharvesters averaged 6.8 years (SD = 3.1), with a tendency(p = 0.1) to a shorter life for tracked excavators. However,only two machines were observed in this category. The aver-age EEL of chainsaws was 2.0 years (SD = 0.9).
In the case of harvesters, there was a large variation inreported annual productive work time (min = 960,max = 5376 PMH/year), which averaged 2332 PMH/year(SD = 1339), with a median of 1980 PMH/year. The annualproductive worktime was higher when the machines weredeployed in industrial plantations with short rotation cycles,where it reached 3634 PMH/year. This figure was significantly(p = 0.001) higher than for machines deployed on natural forests(1876 PMH/year). The annual productive worktime of chain-saws averaged 1058 PMH/year (SD = 298) and it was signifi-cantly (p ˂ 0.001) lower than the values recorded for harvesters.
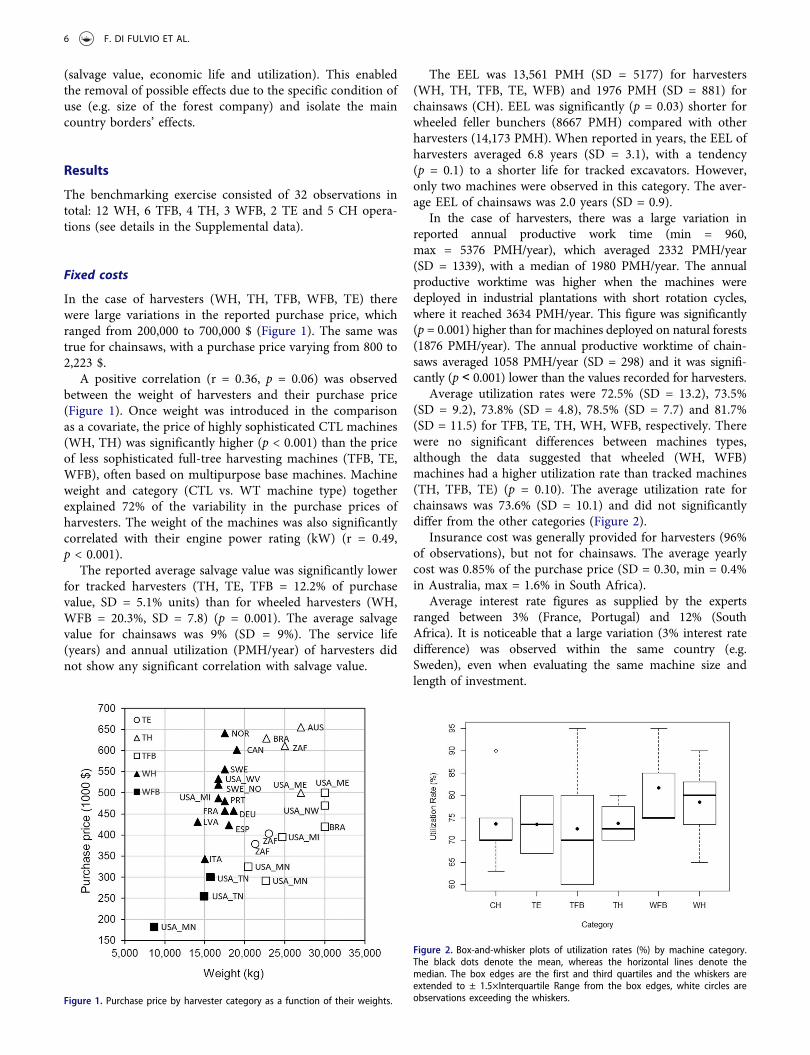
Average utilization rates were 72.5% (SD = 13.2), 73.5%(SD = 9.2), 73.8% (SD = 4.8), 78.5% (SD = 7.7) and 81.7%(SD = 11.5) for TFB, TE, TH, WH, WFB, respectively. Therewere no significant differences between machines types,although the data suggested that wheeled (WH, WFB)machines had a higher utilization rate than tracked machines(TH, TFB, TE) (p = 0.10). The average utilization rate forchainsaws was 73.6% (SD = 10.1) and did not significantlydiffer from the other categories (Figure 2).
Insurance cost was generally provided for harvesters (96%of observations), but not for chainsaws. The average yearlycost was 0.85% of the purchase price (SD = 0.30, min = 0.4%in Australia, max = 1.6% in South Africa).
Average interest rate figures as supplied by the expertsranged between 3% (France, Portugal) and 12% (SouthAfrica). It is noticeable that a large variation (3% interest ratedifference) was observed within the same country (e.g.Sweden), even when evaluating the same machine size andlength of investment.
Figure 1. Purchase price by harvester category as a function of their weights.
Figure 2. Box-and-whisker plots of utilization rates (%) by machine category.The black dots denote the mean, whereas the horizontal lines denote themedian. The box edges are the first and third quartiles and the whiskers areextended to ± 1.5×Interquartile Range from the box edges, white circles areobservations exceeding the whiskers.
6 F. DI FULVIO ET AL.
Taxes and registration fees were observed for harvesters onlyin five cases (19% of observations). The amount paid per yearwas highly variable (min = 50$ for a WH in Latvia, max = 1241$ for a TFB in US Minnesota), with a median of 216$/year.
Other fixed costs were collected for 52% of observations(transfer/relocation costs = 14 cases, garaging = 3 cases), andthese figure showed a very large variability (min = 3200$/year in US Michigan and max = 50,514 $/year inSweden). The median of these costs was 5057 $/year.However, the sample was too limited to explore the encoun-tered variability further.
Variable costs
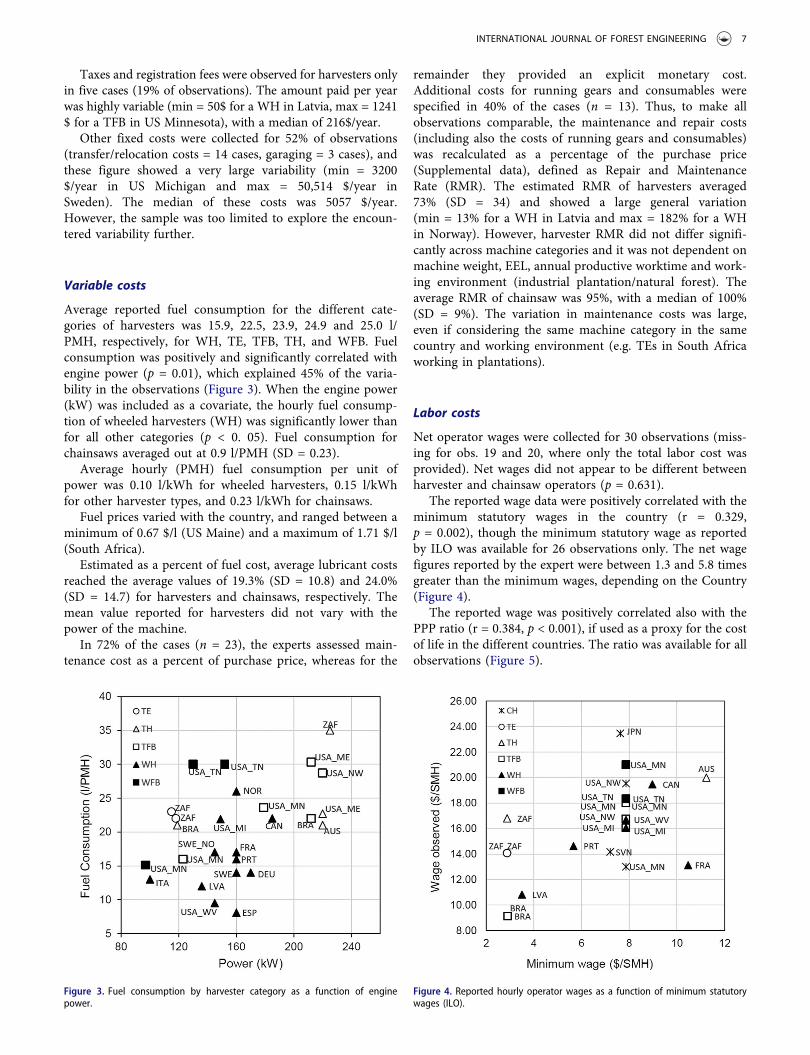
Average reported fuel consumption for the different cate-gories of harvesters was 15.9, 22.5, 23.9, 24.9 and 25.0 l/PMH, respectively, for WH, TE, TFB, TH, and WFB. Fuelconsumption was positively and significantly correlated withengine power (p = 0.01), which explained 45% of the varia-bility in the observations (Figure 3). When the engine power(kW) was included as a covariate, the hourly fuel consump-tion of wheeled harvesters (WH) was significantly lower thanfor all other categories (p < 0. 05). Fuel consumption forchainsaws averaged out at 0.9 l/PMH (SD = 0.23).
Average hourly (PMH) fuel consumption per unit ofpower was 0.10 l/kWh for wheeled harvesters, 0.15 l/kWhfor other harvester types, and 0.23 l/kWh for chainsaws.
Fuel prices varied with the country, and ranged between aminimum of 0.67 $/l (US Maine) and a maximum of 1.71 $/l(South Africa).
Estimated as a percent of fuel cost, average lubricant costsreached the average values of 19.3% (SD = 10.8) and 24.0%(SD = 14.7) for harvesters and chainsaws, respectively. Themean value reported for harvesters did not vary with thepower of the machine.
In 72% of the cases (n = 23), the experts assessed main-tenance cost as a percent of purchase price, whereas for the
remainder they provided an explicit monetary cost.Additional costs for running gears and consumables werespecified in 40% of the cases (n = 13). Thus, to make allobservations comparable, the maintenance and repair costs(including also the costs of running gears and consumables)was recalculated as a percentage of the purchase price(Supplemental data), defined as Repair and MaintenanceRate (RMR). The estimated RMR of harvesters averaged73% (SD = 34) and showed a large general variation(min = 13% for a WH in Latvia and max = 182% for a WHin Norway). However, harvester RMR did not differ signifi-cantly across machine categories and it was not dependent onmachine weight, EEL, annual productive worktime and work-ing environment (industrial plantation/natural forest). Theaverage RMR of chainsaw was 95%, with a median of 100%(SD = 9%). The variation in maintenance costs was large,even if considering the same machine category in the samecountry and working environment (e.g. TEs in South Africaworking in plantations).
Labor costs
Net operator wages were collected for 30 observations (miss-ing for obs. 19 and 20, where only the total labor cost wasprovided). Net wages did not appear to be different betweenharvester and chainsaw operators (p = 0.631).
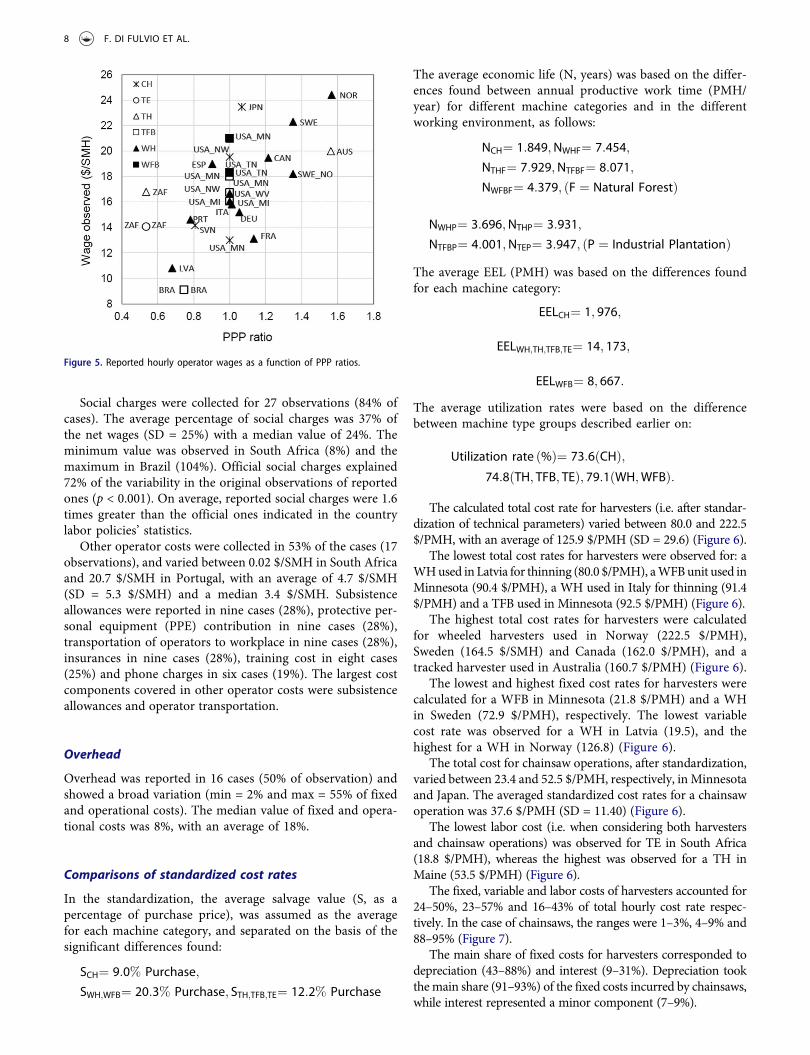
The reported wage data were positively correlated with theminimum statutory wages in the country (r = 0.329,p = 0.002), though the minimum statutory wage as reportedby ILO was available for 26 observations only. The net wagefigures reported by the expert were between 1.3 and 5.8 timesgreater than the minimum wages, depending on the Country(Figure 4).
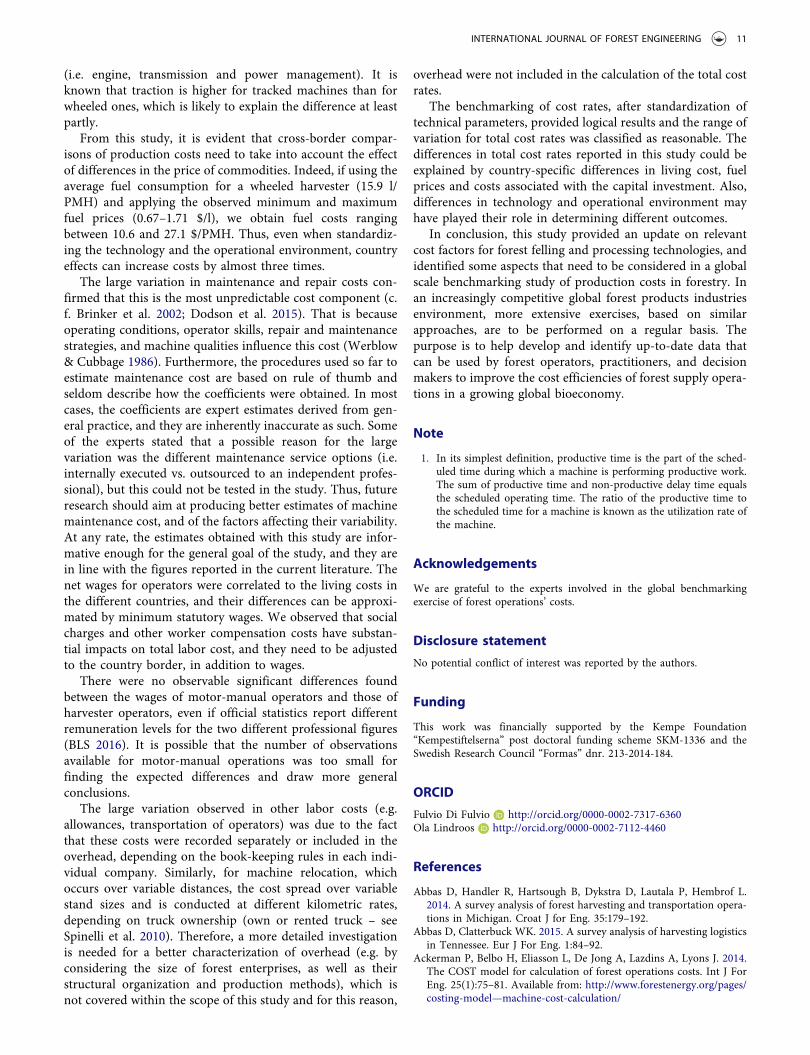
The reported wage was positively correlated also with thePPP ratio (r = 0.384, p < 0.001), if used as a proxy for the costof life in the different countries. The ratio was available for allobservations (Figure 5).
Figure 3. Fuel consumption by harvester category as a function of enginepower.
Figure 4. Reported hourly operator wages as a function of minimum statutorywages (ILO).
INTERNATIONAL JOURNAL OF FOREST ENGINEERING 7
Social charges were collected for 27 observations (84% ofcases). The average percentage of social charges was 37% ofthe net wages (SD = 25%) with a median value of 24%. Theminimum value was observed in South Africa (8%) and themaximum in Brazil (104%). Official social charges explained72% of the variability in the original observations of reportedones (p < 0.001). On average, reported social charges were 1.6times greater than the official ones indicated in the countrylabor policies’ statistics.
Other operator costs were collected in 53% of the cases (17observations), and varied between 0.02 $/SMH in South Africaand 20.7 $/SMH in Portugal, with an average of 4.7 $/SMH(SD = 5.3 $/SMH) and a median 3.4 $/SMH. Subsistenceallowances were reported in nine cases (28%), protective per-sonal equipment (PPE) contribution in nine cases (28%),transportation of operators to workplace in nine cases (28%),insurances in nine cases (28%), training cost in eight cases(25%) and phone charges in six cases (19%). The largest costcomponents covered in other operator costs were subsistenceallowances and operator transportation.
Overhead
Overhead was reported in 16 cases (50% of observation) andshowed a broad variation (min = 2% and max = 55% of fixedand operational costs). The median value of fixed and opera-tional costs was 8%, with an average of 18%.
Comparisons of standardized cost rates
In the standardization, the average salvage value (S, as apercentage of purchase price), was assumed as the averagefor each machine category, and separated on the basis of thesignificant differences found:
SCH¼ 9:0% Purchase;
SWH;WFB¼ 20:3% Purchase; STH;TFB;TE¼ 12:2% Purchase
The average economic life (N, years) was based on the differ-ences found between annual productive work time (PMH/year) for different machine categories and in the differentworking environment, as follows:
NCH¼ 1:849;NWHF¼ 7:454;
NTHF¼ 7:929;NTFBF¼ 8:071;
NWFBF¼ 4:379; F ¼ Natural Forestð Þ
NWHP¼ 3:696;NTHP¼ 3:931;
NTFBP¼ 4:001;NTEP¼ 3:947; P ¼ Industrial Plantationð ÞThe average EEL (PMH) was based on the differences foundfor each machine category:
EELCH¼ 1; 976;
EELWH;TH;TFB;TE¼ 14; 173;
EELWFB¼ 8; 667:
The average utilization rates were based on the differencebetween machine type groups described earlier on:
Utilization rate %ð Þ¼ 73:6 CHð Þ;74:8 TH; TFB; TEð Þ; 79:1 WH;WFBð Þ:
The calculated total cost rate for harvesters (i.e. after standar-dization of technical parameters) varied between 80.0 and 222.5$/PMH, with an average of 125.9 $/PMH (SD = 29.6) (Figure 6).
The lowest total cost rates for harvesters were observed for: aWHused in Latvia for thinning (80.0 $/PMH), aWFBunit used inMinnesota (90.4 $/PMH), a WH used in Italy for thinning (91.4$/PMH) and a TFB used in Minnesota (92.5 $/PMH) (Figure 6).
The highest total cost rates for harvesters were calculatedfor wheeled harvesters used in Norway (222.5 $/PMH),Sweden (164.5 $/SMH) and Canada (162.0 $/PMH), and atracked harvester used in Australia (160.7 $/PMH) (Figure 6).
The lowest and highest fixed cost rates for harvesters werecalculated for a WFB in Minnesota (21.8 $/PMH) and a WHin Sweden (72.9 $/PMH), respectively. The lowest variablecost rate was observed for a WH in Latvia (19.5), and thehighest for a WH in Norway (126.8) (Figure 6).
The total cost for chainsaw operations, after standardization,varied between 23.4 and 52.5 $/PMH, respectively, inMinnesotaand Japan. The averaged standardized cost rates for a chainsawoperation was 37.6 $/PMH (SD = 11.40) (Figure 6).
The lowest labor cost (i.e. when considering both harvestersand chainsaw operations) was observed for TE in South Africa(18.8 $/PMH), whereas the highest was observed for a TH inMaine (53.5 $/PMH) (Figure 6).
The fixed, variable and labor costs of harvesters accounted for24–50%, 23–57% and 16–43% of total hourly cost rate respec-tively. In the case of chainsaws, the ranges were 1–3%, 4–9% and88–95% (Figure 7).
The main share of fixed costs for harvesters corresponded todepreciation (43–88%) and interest (9–31%). Depreciation tookthemain share (91–93%) of the fixed costs incurred by chainsaws,while interest represented a minor component (7–9%).
Figure 5. Reported hourly operator wages as a function of PPP ratios.
8 F. DI FULVIO ET AL.

Maintenance (20–79%) and fuel (18–79%) accounted for thelargest share of operational costs for harvesters. In the case ofchainsaws, fuel (40–65%) was dominant over maintenance(25–52%).
Net wages represented the major share (41–100%) of laborcosts. However social charges (7–51%) and other costs (0–46%)could represent a significant share of labor cost.
Discussion
Experts from 15 countries, 12 of which were OECD-based,were involved in this benchmarking exercise, with represen-tatives from all five continents. The study constitutes the
first cost benchmarking exercise on a global scale in theforest operations’ domain. Similar benchmarking studieshave been undertaken in the past but they were essentiallylimited to single regions in the US or Europe (e.g. Bakeret al. 2013; Spinelli et al. 2015). The use of a standardizedcollection methodology and the involvement of academicresearches from different regions globally, has potentiallyimproved the reliability of results obtained in this study.Thus, this example is expected to act as a reference for largerinvestigations, and for regular updates. These results areconsidered preliminary and it is expected that the data setis regularly updated so that they can form the basis forimproved forest operations’ benchmarking practices.
Figure 6. Distribution of total cost rates (sum of fixed, variable and labor costs), after standardization of salvage value, economic life and utilization rates byharvester category.
Figure 7. Percentage distribution of total cost rates (sum of fixed, variable and labor costs), after standardization of salvage value, economic life and utilization ratesby harvester category (left) and chainsaws (right).
INTERNATIONAL JOURNAL OF FOREST ENGINEERING 9

Most of the observations were collected from Europe andthe United States (23 observations). Other regions of theworld were only represented though nine observations dueto language and accessibility barriers.
An additional 22 experts or Institutions were contactedover the expert groups, but in most of the cases they declinedto collaborate due to the lack of resources (i.e. time andmoney) or possible conflict of interests with the policies oftheir institution. This confirmed that the sharing of informa-tion regarding costs is a critical issue.
Tree felling and processing operations were selected forthis first benchmarking exercise with the intention to identifya starting point along the supply chain. Tree felling andprocessing operations allows a better comparability thanother harvesting operations (e.g. wood extraction), due tothe relatively limited number of systems, which allows theisolation of the difference due to specific cost factors ratherthan the difference due to the systems’ configurations.Contributors to this study were required to provide averagecosts in their region/country for a single piece of tree fellingmachinery. However, hourly costs are likely to differ betweencompanies due to economies of scale: this factor was notconsidered in our analysis because a more standardizedequipment-based costing method approach was used.Business size could have an impact on the way maintenanceand repair or fuels are sourced from the market (Baker et al.2013). At the same time, workman compensation (i.e. socialcharges) could be influenced by different regional regulations,depending on the size of the forest enterprise (Abbas andClatterbuck 2015).
Even if a standardized data collection spreadsheet wasused, there were still difficulties in the interpretation of howPMH and SMH were calculated between the different regionsand countries. The machine and labor costs are also depen-dent on the contractual forms adopted in the individualcountries, and therefore some approximations were needed.
Specific operational conditions could influence cost factorssuch as machine utilization and maintenance factors (Brinkeret al. 2002; Dodson et al. 2015). In this study, we tried togather additional information about work conditions (such asdifferentiating natural forests and industrial plantations).However, more observations and more detailed descriptionsare needed for a deeper analysis of the effects of the environ-mental conditions on the machine operating costs.
The source used to assess the cost rates were different(forest contractors, machine dealers, cost models and litera-ture), and in four observations the references were not dis-closed (see Table 2). The experts could have appliedestimations based on rule of thumb (i.e. salvage, economiclives, utilizations and maintenance rates), if they had notbetter data in their possession. The use of the rule of thumbinstead of collected values could interfere in the comparabilityof costs. A guide for assessment of all cost factors was pro-vided to the experts following Ackerman et al. (2014).However, the selection of the most appropriate factor orrule relied on the knowledge of operational and businessconditions in the possession of each expert. Therefore, giventhe type of study (i.e. expert’s interview), all observationswere considered to have the same relevance in our analyses.
The database was populated with up-to-date technologies,the oldest being from 2007 and the most recent from 2014.Ideally, all cost information should be collected for the sameyear, which is difficult to achieve. Thus we used the periodfrom the years 2009 to 2013 as a reference. All cost figureswere updated to the same period. They were compared byusing the average exchange rates during that period.Technological advances, for example in machine design,could have occurred between 2007 to 2014, which couldhave improved performances as well as costs and increasedpurchase prices (Nordfjell et al. 2010; Dodson et al. 2015).However, in an observation period shorter than 10 years thesechanges are expected to be relatively limited.
The study identified correlations between machine weightand purchase price, which is logical and expected. Similarcorrelations were identified when analyzing the resale valuesof harvesters in Europe (Malinen et al. 2016). Purchase pricewas also correlated with the level of specialization of machin-ery, indicating that CTL harvesting machines are more expen-sive capital investments than other machine types (e.g. feller-bunchers). However, there was a large unexplained variabilityin purchase price. This can be attributed to inherent differ-ences in machine configuration, but also to different tradetariffs and demand for machinery in different countries.
Salvage value for tracked machines and chainsaws wasclose to the figures (10%) reported by Ackerman et al.(2014), whereas the higher figures observed for wheeledmachines (20%) confirm the differences suggested byBrinker et al. (2002).
The expected economic life for wheeled harvesters wasbelow the technical life expected for similar machines (i.e.18,000 PMH, c.f. Spinelli et al. 2011), indicating that theobserved machinery was sold when one third of their techni-cal life was left.
Actual annual productive work time (PMH/year) ofmachines was lower in natural forests than in industrialplantations, where up to three shifts per day are often sched-uled (i.e. in Brazil and South Africa). In other studies, it wasnoticed that the annual work time of wheeled harvestersincreased when moving from Central Europe to the NordicCountries (Holzleitner et al. 2011; Spinelli et al. 2011). Otherlocal factors such as the weather conditions, type of businessand contract arrangements could also impact annual worktime (cf. Dodson et al. 2015).
The utilization rate figures found for wheeled harvesters(79%) were similar to those reported in a recent follow-upstudy performed in Sweden (i.e. 78% in Eriksson & Lindroos2014). Our study, confirmed a general increase of utilizationrate with the introduction of newer technologies, comparedto the values from older follow-up studies (c.f. Kuitto et al.1994). Tracked machinery tended to achieve lower utilizationrates than wheeled machinery, as also noted by Brinker et al.(2002) for feller-bunchers.
The average hourly fuel consumption per unit of power (l/kW h) for wheeled harvesters was close to the value found byHolzleitner et al. (2011) (0.10 l/kW h) for the same machinetype. The higher fuel consumption recorded for tracked har-vesters and feller-bunchers is likely due to different opera-tional conditions, as well as to differences in machine design
10 F. DI FULVIO ET AL.
(i.e. engine, transmission and power management). It isknown that traction is higher for tracked machines than forwheeled ones, which is likely to explain the difference at leastpartly.
From this study, it is evident that cross-border compar-isons of production costs need to take into account the effectof differences in the price of commodities. Indeed, if using theaverage fuel consumption for a wheeled harvester (15.9 l/PMH) and applying the observed minimum and maximumfuel prices (0.67–1.71 $/l), we obtain fuel costs rangingbetween 10.6 and 27.1 $/PMH. Thus, even when standardiz-ing the technology and the operational environment, countryeffects can increase costs by almost three times.
The large variation in maintenance and repair costs con-firmed that this is the most unpredictable cost component (c.f. Brinker et al. 2002; Dodson et al. 2015). That is becauseoperating conditions, operator skills, repair and maintenancestrategies, and machine qualities influence this cost (Werblow& Cubbage 1986). Furthermore, the procedures used so far toestimate maintenance cost are based on rule of thumb andseldom describe how the coefficients were obtained. In mostcases, the coefficients are expert estimates derived from gen-eral practice, and they are inherently inaccurate as such. Someof the experts stated that a possible reason for the largevariation was the different maintenance service options (i.e.internally executed vs. outsourced to an independent profes-sional), but this could not be tested in the study. Thus, futureresearch should aim at producing better estimates of machinemaintenance cost, and of the factors affecting their variability.At any rate, the estimates obtained with this study are infor-mative enough for the general goal of the study, and they arein line with the figures reported in the current literature. Thenet wages for operators were correlated to the living costs inthe different countries, and their differences can be approxi-mated by minimum statutory wages. We observed that socialcharges and other worker compensation costs have substan-tial impacts on total labor cost, and they need to be adjustedto the country border, in addition to wages.
There were no observable significant differences foundbetween the wages of motor-manual operators and those ofharvester operators, even if official statistics report differentremuneration levels for the two different professional figures(BLS 2016). It is possible that the number of observationsavailable for motor-manual operations was too small forfinding the expected differences and draw more generalconclusions.
The large variation observed in other labor costs (e.g.allowances, transportation of operators) was due to the factthat these costs were recorded separately or included in theoverhead, depending on the book-keeping rules in each indi-vidual company. Similarly, for machine relocation, whichoccurs over variable distances, the cost spread over variablestand sizes and is conducted at different kilometric rates,depending on truck ownership (own or rented truck – seeSpinelli et al. 2010). Therefore, a more detailed investigationis needed for a better characterization of overhead (e.g. byconsidering the size of forest enterprises, as well as theirstructural organization and production methods), which isnot covered within the scope of this study and for this reason,
overhead were not included in the calculation of the total costrates.
The benchmarking of cost rates, after standardization oftechnical parameters, provided logical results and the range ofvariation for total cost rates was classified as reasonable. Thedifferences in total cost rates reported in this study could beexplained by country-specific differences in living cost, fuelprices and costs associated with the capital investment. Also,differences in technology and operational environment mayhave played their role in determining different outcomes.
In conclusion, this study provided an update on relevantcost factors for forest felling and processing technologies, andidentified some aspects that need to be considered in a globalscale benchmarking study of production costs in forestry. Inan increasingly competitive global forest products industriesenvironment, more extensive exercises, based on similarapproaches, are to be performed on a regular basis. Thepurpose is to help develop and identify up-to-date data thatcan be used by forest operators, practitioners, and decisionmakers to improve the cost efficiencies of forest supply opera-tions in a growing global bioeconomy.
Note
1. In its simplest definition, productive time is the part of the sched-uled time during which a machine is performing productive work.The sum of productive time and non-productive delay time equalsthe scheduled operating time. The ratio of the productive time tothe scheduled time for a machine is known as the utilization rate ofthe machine.
Acknowledgements
We are grateful to the experts involved in the global benchmarkingexercise of forest operations’ costs.
Disclosure statement
No potential conflict of interest was reported by the authors.
Funding
This work was financially supported by the Kempe Foundation“Kempestiftelserna” post doctoral funding scheme SKM-1336 and theSwedish Research Council “Formas” dnr. 213-2014-184.
ORCID
Fulvio Di Fulvio http://orcid.org/0000-0002-7317-6360Ola Lindroos http://orcid.org/0000-0002-7112-4460
References
Abbas D, Handler R, Hartsough B, Dykstra D, Lautala P, Hembrof L.2014. A survey analysis of forest harvesting and transportation opera-tions in Michigan. Croat J for Eng. 35:179–192.
Abbas D, Clatterbuck WK. 2015. A survey analysis of harvesting logisticsin Tennessee. Eur J For Eng. 1:84–92.
Ackerman P, Belbo H, Eliasson L, De Jong A, Lazdins A, Lyons J. 2014.The COST model for calculation of forest operations costs. Int J ForEng. 25(1):75–81. Available from: http://www.forestenergy.org/pages/costing-model—machine-cost-calculation/
INTERNATIONAL JOURNAL OF FOREST ENGINEERING 11

Baker S, Greene D, Harris T, Mei R. 2013. Regional cost analysis and indicesfor conventional timber harvesting operations. In: Final report to theWood Supply Research Institute. Center for forest Business, Universityof Georgia & Wood Supply Research Institute; p. 39. Available from:http://wsri.org/resources/media/RegCostAnalFinalRpt.pdf
Bilek EM. 2009. Machine cost analysis using the traditional machine-ratemethod and CHARGEOUT! In: The proceedings from the 2009 Councilon Forest Engineering (COFE) Conference: “Environmentally SoundForest Operations”. Lake Tahoe (CA); June 15–18, 2009; p. 11. Availablefrom: http://web1.cnre.vt.edu/forestry/cofe/documents/COFE_2009_Bilek.pdf
BLS. 2016. United States Department of Labour Statistics, Bureau of LabourStatistics; [cited February 2016]. Available from: http://www.bls.gov/
Brinker RW, Kinard J, Rummer B, Lanford B. 2002. Machine rates forselected forest harvesting machines. Auburn (AL): AlabamaExperiment Station; p. 32.
Butler DA, Dykstra D. 1981. Logging equipment replacement: a quanti-tative approach. For Sci. 27:2–12.
Dodson E, Hayes S, Meek J, Keyes CR. 2015. Montana logging machinerates. Int J For Eng. 26(2):85–95. Available from: http://www.tandfonline.com/doi/full/10.1080/14942119.2015.1069497
Eliasson L, Bengtsson J, Cedergren J, Lageson H. 1999. Comparison ofsingle-grip harvester productivity in clear- and shelterwood cutting.Int J For Eng. 10:43–48.
Eriksson M, Lindroos O. 2014. Productivity of harvesters and forwardersin CTL operations in Northern Sweden based on large follow-updatasets. Int J For Eng. 25:179–200.
Fricko O, Havlik P, Rogelj J, Klimont Z, Gusti M, Johnson N, Kolp P,Strubegger M, Valin H, Amann M, et al. 2016. The marker quantifi-cation of the shared socioeconomic pathway 2: a middle-of-the-roadscenario for the 21st century. Global Environ Change. 42(1): 251–267.doi:10.1016/j.gloenvcha.2016.06.004
Deutche Gesellschaft fur Internationale Zusammenarbeit (GIZ) GmbH.Global Fuel Prices 2013. Available from: www.giz.de/transport
Holzleitner F, Stampfer K, Visser R. 2011. Utilization rates and costfactors in timber harvesting based on long-term machine data. CroatJ For Eng. 32:501–508.
International Labour Organization. 2013. Statutory nominal grossmonthly minimum wage effective December 31st (Local currency);[cited July 2015]. Available from: http://www.ilo.org/ilostat
International Monetary Fund. 2014. Currency units per SDR; [citedNovember 2014]. Available from: https://www.imf.org/
Kuitto PJ, Keskinen S, Lindroos J, Oijala T, Rajamaki J, Rasanen T, et al. 1994.Puutavaran koneellinen hakkuu jametsa kuljetus [Mechanized cutting andforest haulage] Metsateho. Metsatehon Tiedotus. 410:32–35. (In Finnish).
Lindroos O, Cavalli R. 2016. Cable yarding productivity models: asystematic review over the period 2000-2011. Int J For Eng. 27:79–94.
Malinen J, Laitila J, Väätäinen K, Viitamäki K. 2016. Variation in age,annual usage and resale price of cut-to-length machinery in differentregions of Europe. Int J For Eng. 27(2): 95–102. Available from:http://www.tandfonline.com/doi/full/10.1080/14942119.2016.1171964
Mathews DM. 1942. Cost control in the logging industry. New York(NY): McGraw-Hill Book Company; p. 374.
McNeel JF, Dodd KK. 1997. Improving cable thinning system pro-ductivity by modifying felling phase operations. Int J For Eng.8:47–56.
Miyata ES. 1980. Determining fixed and operating costs of loggingequipment. In: US Department of Agriculture General technical
report GTR-NC-55. St. Paul (MN): USDA Forest Service, NorthCentral Forest Experiment Station; p. 20.
Miyata ES, Steinhilb HM. 1981. Logging system cost analysis.Comparison of methods used. In: US Department of AgricultureResearch paper NC-208. St. Paul (MN): USDA Forest Service, NorthCentral Forest Experiment Station; p. 18.
Nordfjell T, Bacher M, Eriksson L, Kadlec J, Stampfer K, Suadicani K,Suwala M, Talbot B. 2004. Operational factors influencing the effi-ciency in conversion. In: Spiecker H, Hansen J, Klimo E, SkovsgaardJP, Sterba H, Von Teuffel K, editors. Norway spruce conversion-options and consequences. European Forest Institute ResearchReport 18. Leiden-Boston: Brill.
Nordfjell T, Björheden R, Thor M, Wästerlund I. 2010. Changes intechnical performance, mechanical availability and prices of machinesused in forest operations in Sweden from 1985 to 2010. Scand J ForRes. 25:382–389.
Nurminen T, Korpunen H, Uusitalo J. 2009. Applying the activity-basedcosting to cut-to-length timber harvesting and trucking. SilvaFennica. 43:847–870.
Olsen DE, Kellog LD. 1983. Comparison of time-study techniques forevaluating logging production. Trans ASAE. 26:1665–1668.
Purfürst T, Lindroos O. 2011. The correlation between long-term pro-ductivity and short-term performance ratings of harvester operators.Croat J Forest Eng. 32:509–519.
Siry JP, Greene WD, Harris TG, Izlar RL, Hamsley A, Eason KE, Tye T,Baldwin SS, Hydahl C. 2006. Wood supply chain efficiency and fibercost: what can we do better? For Prod J. 56:4–10.
Spinelli R, Magagnotti N, Picchi G. 2010. Deploying mechanized cut-to-length technology in Italy: fleet size, annual usage and costs. Int J ForEng. 21:23–31.
Spinelli R, Magagnotti N, Picchi G. 2011. Annual use, economic life andresidual value of cut-to-length harvesting machines. J For Econ.17:378–387.
Spinelli R, Visser R, Thees O, Hans Sauter U, Krajnc N, Riond C,Magagnotti N. 2015. Cable logging contract rates in the Alps: theeffect of regional variability and technical constraints. Croat J ForEng. 36:195–203.
Stridsberg E, Algvere KV, 1967. Cost studies in European forestry.Technical Report. Stockholm: Royal School of Forestry, Sveriges lant-bruksuniversitet. Studia forestalia Suecica; 49.
Tolan A, Visser R. 2015. The effect of the number of log sorts onmechanized log processing productivity and value recovery. Int JFor Eng. 26:36–47.
Tufts RA, Mills WL. 1982. Financial analysis of equipment replacement.For Prod J. 32:45–52.
The World Bank. 2014a. International Financial Statistics, Officialexchange rate (LCU per US$, period average); [cited October 2014].Available from: http://data.worldbank.org/.
The World Bank. 2014b. Purchasing power parity conversion factor;[cited October 2014]. Available from: http://data.worldbank.org/
The World Bank. 2014c. Price level ratio of PPP conversion factor(GDP) to market exchange rate; [cited October 2014]. Availablefrom: http://data.worldbank.org/
The World Bank Group. 2014. Economy Snapshots, paying-taxes; [citedNovember 2014]. Available from: http://www.doingbusiness.org
Werblow DA, Cubbage FW. 1986. Forest harvesting equipmentownership and operating costs in 1984. South J Ap Forest.10:10–15.
12 F. DI FULVIO ET AL.