BENCHMARKING STUDY - IFC
68
BENCHMARKING STUDY Resource Efficiency in Red Meat Abattoirs in South Africa IN PARTNERSHIP WITH
Transcript of BENCHMARKING STUDY - IFC

BENCHMARKING STUDYResource Efficiency in Red Meat Abattoirs in South Africa
IN PARTNERSHIP WITH

About IFC IFC – a member of the World Bank Group – is the largest global development institution focused on the private sector in
emerging markets. We work in more than 100 countries, using our capital, expertise, and influence to create markets
and opportunities in developing countries. In fiscal year 2020, we invested $22 billion in private companies and financial
institutions in developing countries, leveraging the power of the private sector to end extreme poverty and boost shared
prosperity. For more information, visit www.ifc.org.
© International Finance Corporation [2020]. All rights reserved.
2121 Pennsylvania Avenue, N.W.
Washington, D.C. 20433
Internet: www.ifc.org
The material in this work is copyrighted. Copying and/or transmitting portions or all of this work without permission
may be a violation of applicable law. IFC does not guarantee the accuracy, reliability or completeness of the content
included in this work, nor the conclusions or judgments described herein, and accepts no responsibility or liability for any
omissions or errors (including, without limitation, typographical errors and technical errors) in the content whatsoever,
or for reliance thereon.
Cover Image: ©depositphotos_sdenness

1Resource Efficiency in Red Meat Abattoirs in South Africa
ContentsAbbreviations 2
Acknowledgments 3
1. Executive Summary 5
2. Introduction 15Background to the Project ........................................................................................................................................... 15The South African Meat Processing Industry ................................................................................................................. 16Resource Efficiency Benchmarking ............................................................................................................................. 20Process Variation and the Impact on Resource Utilization ............................................................................................. 21Resource Utilisation ................................................................................................................................................... 23Project Methodology ..................................................................................................................................................24
3. International Benchmarks 27Australian Meat Processing Benchmarks ...................................................................................................................... 27European Union (EU) Meat Processing Benchmark Indicators .......................................................................................29New Zealand Benchmark Indicators............................................................................................................................. 31International Electricity, Fuel and Water Price Indicators ...............................................................................................34Water Utilisation Benchmarks .....................................................................................................................................36Energy Utilisation Benchmarks ................................................................................................................................... 40Enterprise Benchmark Adjustment Schedule ................................................................................................................ 41International Benchmark Summary .............................................................................................................................42
4. South African Benchmarks 45Data Limitations .........................................................................................................................................................45South African Slaughter Units and Carcase Weights ......................................................................................................45Participating Plant Profile ........................................................................................................................................... 47Results of Data Analysis ............................................................................................................................................. 48Practical Guide for Improving Resource Efficiency ......................................................................................................... 57
5. Benchmarking Tool for Self-Assessment 59Guidelines for Completing the Benchmark Tool ............................................................................................................59Presentation of Benchmark Output Data ..................................................................................................................... 61
References 62Annex 1 – Detailed Table of Important Benchmark Results 63Annex 2 – Example of Output Report from Benchmark Tool 64
FIGURES
Figure 1: Water Savings Potential for a Typical Abattoir .................................... 6Figure 2: Thermal Energy Savings Potential for a Typical Abattoir ........................7Figure 3: Livestock Slaughtering in South Africa (SU) ....................................... 8Figure 4: Water Source and Usage Benchmarks ................................................ 9Figure 5: Water Consumption and Water Cost Benchmarks ............................... 10Figure 6: Total Energy Source and Usage Benchmarks ....................................... 11Figure 7: Total Energy Usage (kWh) and Cost Benchmarks ................................12Figure 8: Estimate of GHG Emissions ..............................................................13Figure 9: Livestock Population in South Africa ................................................. 16Figure 10: Livestock Slaughtering in South Africa (Head).................................... 16Figure 11: Livestock Slaughtering in South Africa (SU) .......................................17Figure 12: South African Red Meat Exports ....................................................... 18Figure 13: Meat Industry Process Flow: Fully Integrated Enterprise ......................21Figure 14: Meat Processing Enterprise Flowcharts and Resource Consumption ..... 23Figure 15: Australian Resource Use Efficiency Indicators: 2015 Study ...................28Figure 16: Variation in Resource Utilisation Indicators over Time: Australia ......... 29Figure 17: UK Pig Slaughterhouse Water Consumption .......................................31Figure 18: Variation in Resource Utilisation Indicators over Time: New Zealand .... 34Figure 19: Global Electricity Prices (Dec 2019) ................................................... 34Figure 20: International LNG Prices ................................................................. 35Figure 21: South African Carcase Weights .........................................................46Figure 22: Slaughter Unit to Carcase Weight Conversion .................................... 47Figure 23: Water Source and Usage Benchmarks ...............................................49Figure 24: Water Consumption and Water Cost Benchmarks ...............................50Figure 25: Effluent Quality ..............................................................................51Figure 26: Water and Effluent Cost ...................................................................51Figure 27: Total Energy Source and Usage Benchmarks ...................................... 52Figure 28: Total Energy Usage (kWh) and Cost Benchmarks ...............................54Figure 29: Thermal Energy Usage (kWh) and Cost Benchmarks ........................... 55Figure 30: Electrical Energy Usage (kWh) and Cost Benchmarks .........................56Figure 31: Cost of Electricity and Thermal Energy ..............................................56Figure 32: Estimate of Greenhouse Gas Emissions ............................................. 57Figure 33: Expected Return on Capital (IRR) ..................................................... 57 Figure 34: Facility Data Input ......................................................................... 59
Figure 35: Consumption Data Input ............................................................... 60Figure 36: Supplementary Data Input ............................................................. 60Figure 37: Graphical Presentation of Benchmark Data ....................................... 61
TABLES
Table 1: Abattoirs by Province ...................................................................... 8Table 2: Participating Plant Profile ................................................................ 9Table 3: Energy and Water Unit Costs ............................................................12Table 4: RMLA Slaughter Statistics .............................................................. 18Table 5: Structure of the South African Red Meat Processing Sector .................. 19Table 6: Differences in Processing Operations ................................................ 22Table 7: Key Performance Indicators ............................................................. 24Table 8: Australian Meat Enterprise Characteristics in the 2015 Study ............... 27 Table 9: EU Resource Impact Data: Cattle, Sheep and Pig Processing................30Table 10: New Zealand Meat Processing Water Utilisation ................................ 32Table 11: New Zealand Meat Processing Energy Utilisation .............................. 32Table 12: Energy Use in New Zealand Meat Processing Plants ........................... 33Table 13: Australian Cost of Gas .................................................................... 35Table 14: Australian Cost of Water and Wastewater ......................................... 36Table 15: Water Consumption per Unit of Production ....................................... 37Table 16: Breakdown of Water Consumption ................................................... 38Table 17: Departmental Water Consumption ................................................... 38Table 18: Detailed Meat Plant Water Use ........................................................ 39Table 19: Detailed Meat Plant Energy Use...................................................... 40Table 20: Departmental Energy and Water Consumption Adjustments ............... 41Table 21: Input and Output Data for Pig Scalding & Dehairing per head ............. 41Table 22: International Benchmark Summary .................................................. 42Table 23: Participating Plant Profile ............................................................... 47Table 24: Impact of Plant Operation on Benchmark Outcomes ......................... 48Table 25: Relationship between Energy and Water Utilisation and Plant Operation .. 48Table 26: Water Benchmark Results ...............................................................49Table 27: Energy Benchmark Results .............................................................. 53Table 28: Important Benchmark Data ............................................................ 63

2 BENCHMARKING STUDY
APRE Agri-Processing Resource Efficiency
CO2 Carbon Dioxide
COD The Chemical Oxygen Demand (COD) test is used to indirectly measure the concentration of organic compounds in water. Most applications of COD determine the amount of organic material in surface water or wastewater, making COD a useful measure of water quality, expressed in milligrams per litre (mg/l), which indicates the mass of oxygen required to oxidise the chemical solutes and solids per litre of water.
COP Coefficient of Performance
CW Carcase Weight
DAFF Department of Agriculture, Forestry and Fisheries (of South Africa)
EU European Union
FAOSTAT Food and Agriculture Organization of the United Nations – Food and Agriculture Data
GHG Greenhouse Gas
HT High Throughput: >20 SUs per day
IFC International Finance Corporation
IRR Internal Rate of Return
ISLT Infrequently Slaughtering Low Throughput
kg Kilogram
kl Kilolitre
KPI Key Performance Indicator
kWh Kilowatt-hour
Lairage Stock-holding pen where animals are held pre-slaughter at an abattoir.
LNG Liquefied Natural Gas
LPG Liquefied Petroleum Gas
LT Low Throughput: 3-20 SUs per day
MAS Manufacturing, Agribusiness and Services
MLA Meat & Livestock Australia
MWh Mega Watt hour
Offal The organs of a slaughtered animal, usually divided into:• Red offal – heart, liver, kidney, tongue• Rough offal – stomachs, intestines, other
organs
Pre-breaker
Item of plant in which large pieces of condemned carcases are broken down to smaller-sized pieces, suitable for further processing, such as sterilising and rendering.
R South African Rands
RECP Resource Efficiency and Cleaner Production
Rendering Cooking and sterilising of animal waste products not fit for human consumption (i.e. “condemned”), as well as evaporation of moisture to produce a proteinaceous meal. Melted fat is normally recovered for further utilisation, such as tallow production.
RMAA Red Meat Abattoir Association
RMLA Red Meat Levy Administration
RT Rural Throughput: <=2 SUs per day
SECO Swiss State Secretariat for Economic Affairs
SEV Specific Effluent Volume is the wastewater volume generated in a particular period divided by the number of slaughter units processed during the same period.
Solar PV Solar Photovoltaic
SPL Specific Pollutant Load is the pollutant mass load for a period (in terms of any parameter, e.g. COD, TKN) arising from an industrial unit process divided by the number of SUs used in production during the same period.
SS Suspended Solids are small, solid particles which remain in suspension and are not dissolved in water. Suspended solids are important, as pollutants and pathogens are carried on the surface of particles. The smaller the particle size, the greater the total surface area per unit mass of particle, and so the higher the pollutant load that is likely to be carried.
Sticking The slitting of an animal’s throat after stunning, allowing the carcase to bleed.
Stunning Mechanical, electrical or other means of rendering an animal unconscious before slaughtering, in an approved and humane manner.
SU Slaughter Unit is the number of non-bovine species considered equivalent to one bovine animal for abattoir purposes, and is based on the South African standard whereby:
• One cattle animal equals one SU• Two pigs equal one SU• Six sheep equal one SU• Six goats equal one SU• Six small-stock (mixed species) equal one SU.
SWI Specific Water Intake is the water intake for a particular period divided by the number of SUs during the same period.
SWU Specific Water Use is the water used in an industrial unit process divided by the number of SUs processed.
Tonnes CW (tCW)
Carcase Weight – the volume (metric tonnes) of carcase weight processed.
TDS Total Dissolved Solids
tHSCW Tonne Hot Standard Carcase Weight
TKN Total Kjeldahl Nitrogen
UAE United Arab Emirates
UK United Kingdom
USA United States of America
WBG World Bank Group
Abbreviations

3Resource Efficiency in Red Meat Abattoirs in South Africa
Acknowledgments
The Benchmarking Study: Resource Efficiency in Red Meat Abattoirs in South Africa was produced as part of a broader
International Finance Corporation (IFC) Agri-Processing Resource Efficiency (APRE) project in South Africa,
aimed to assist companies engaged in agricultural processing to transition to better water and resource
efficiency practices. The project is expected to help mitigate water supply risks in the sector, resulting from the
water scarcity challenge in South Africa and throughout the region. The project is implemented in partnership
with the Swiss State Secretariat for Economic Affairs (SECO) and the Netherlands.
A Practical Guide for Improving Resource Efficiency in Red Meat Abattoirs in South Africa was developed in conjunction
with the Benchmarking Study. The Study involved benchmarking of the water and energy usage of 21 abattoirs
across the country against local and international best practices. The team would like to acknowledge the
contribution of the red meat abattoir owners, managers and other stakeholders who participated in the
Benchmarking Study and provided input into the Practical Guide for Improving Resource Efficiency.
The Study was managed by Raymond Greig and Rong Chen (IFC). IFC commissioned Resource Innovations Africa
(Pty) Ltd and ProAnd Associates Australia (Pty) Ltd to support the collection of information and the analysis, and
to provide technical recommendations. We appreciate the effort of the key experts, Darrin McComb (Director,
Resource Innovations Africa) and Jon Marlow (Director, ProAnd Associates Australia) and their teams. IFC has
partnered with the Red Meat Abattoir Association (RMAA) to facilitate implementation of the project and is
grateful to Gerhard Neethling (General Manager, RMAA) for coordinating stakeholder engagements and for
providing inputs to the report.
The team is also grateful to World Bank Group (WBG) colleagues for support of the assessment, as well as feedback
provided on the report. We would like to thank Alexander Larionov, Ivan Ivanov, Jerrard Müller, Nonhlanhla
Halimana and Robert Peck. Also, many thanks to Bonny Jennings and the full team at ITL Communication and
Design for the excellent production of the report.
©depositphotos_elnariz

4 BENCHMARKING STUDY©depositphotos_EcoPic

5Resource Efficiency in Red Meat Abattoirs in South Africa
Executive SummaryResource efficiency benchmarking provides the ability for enterprises to
examine and understand their own resource efficiency performance. The
results can be used to compare resource efficiency performance against
other enterprises at both local and international levels. They can also be
used as a guide on what to measure to determine overall resource efficiency
metrics. Comparing resource efficiency performance with peers provides
an understanding of where efficiencies may be different and thereby assists
enterprise management in any sector to identify areas of focus to increase
efficiencies, reduce resource consumption and reduce operating costs.
IFC and South Africa’s RMAA have partnered to conduct a resource efficiency
benchmarking study of red meat abattoirs in South Africa and assess the gaps
in the efficiency of the use of resources, with particular focus on water, and
identify areas for improvement in performance and sustainability.
A key conclusion that can be drawn from this study, the savings achieved over
time in other international red meat sectors, and the results of the individual
plant resource efficiency assessments conducted under this project is that a
20-28% reduction in water consumption is estimated to be possible across the
sector and that this would reduce overall water utilisation by approximately
178-245 l/slaughter unit (SU), or around 0.91-1.25 million cubic metres (a million
kl) nationally per annum, with savings of around R27-R37 million.
The prediction of water savings potential for South African abattoirs is
provided in Figure 1.
The water efficiency measures identified include:
• Implement a ground water strategy
• Rainwater recovery
• Optimise manual cleaning/rinse systems
• Dry cleaning techniques
• Optimise knife and hook sanitation systems
• Optimise boot and hand washing
• Water re-use opportunities
1
POTENTIAL SAVINGS FOR THE RED MEAT ABATTOIR INDUSTRY IN SOUTH AFRICA
WATER consumption can potentially be reduced by up to 28% resulting in national savings of 1.25 million cubic meters and R37 million per annum
ENERGY consumption can potentially be reduced by up to 24% resulting in national savings of 92,000 MWh and R105 million per annum

6 BENCHMARKING STUDY
FIGURE 1 – WATER SAVINGS POTENTIAL FOR A TYPICAL ABATTOIR1%
100
90
80
70
60
50
40
30
20
10
0
Ave. Cost/ SU Pre-Slaughter Slaughter Offal Post-Slaughter Cleaning
Other Potential
Other Post-Slaughter Cleaning Offal Slaughter Pre-Slaughter Saving
Improved efficiency/
profitability 27.5%
While it is more difficult to be precise because of the complexity of energy
utilisation, a 12-24% reduction in total energy consumption is considered possible,
which would reduce overall energy utilisation by 9-18 kWh/SU, and result in
national savings of 47-92 million kWh and industry savings in the order of R54-R105
million per annum.
Larger plants with on-site rendering would typically have steam systems utilising
coal boilers. Smaller abattoirs without rendering capability would utilise either
electrical heating elements or small liquid fuel-driven steam systems (flash steam
generators). The fuel cost per kilowatt-hour (kWh) is relatively high in the smaller
plants; however, their system efficiencies are significantly better, especially for
point-of-use heating applications (heating elements at the sterilisers). There
is significant scope for improving costs and efficiencies in the thermal heating
systems, especially in the smaller plants that have relatively high heating costs per
kWh. A typical abattoir could reduce its thermal energy consumed by an estimated
32% by implementing thermal energy efficiency measures.
The prediction of thermal energy savings potential for South African abattoirs is
provided in Figure 2.
1 Extracted from “Practical Guide for Improving Resource Efficiency in Red Meat Abattoirs in South Africa”, prepared as a component of this project.
THE THERMAL EFFICIENCY AND RELATED COST-SAVING MEASURES IDENTIFIED INCLUDE:
• Renewables and waste heat recovery
• Optimise steam system generation efficiency
• Insulate steam lines, valves and flanges
• Condensate recovery

7Resource Efficiency in Red Meat Abattoirs in South Africa
FIGURE 1 – WATER SAVINGS POTENTIAL FOR A TYPICAL ABATTOIR1
%
100
90
80
70
60
50
40
30
20
10
0
Ave. Cost/ SU Pre-Slaughter Slaughter Offal Post-Slaughter Cleaning
Other Potential
Other Post-Slaughter Cleaning Offal Slaughter Pre-Slaughter Saving
Improved efficiency/
profitability 27.5%
While it is more difficult to be precise because of the complexity of energy
utilisation, a 12-24% reduction in total energy consumption is considered possible,
which would reduce overall energy utilisation by 9-18 kWh/SU, and result in
national savings of 47-92 million kWh and industry savings in the order of R54-R105
million per annum.
Larger plants with on-site rendering would typically have steam systems utilising
coal boilers. Smaller abattoirs without rendering capability would utilise either
electrical heating elements or small liquid fuel-driven steam systems (flash steam
generators). The fuel cost per kilowatt-hour (kWh) is relatively high in the smaller
plants; however, their system efficiencies are significantly better, especially for
point-of-use heating applications (heating elements at the sterilisers). There
is significant scope for improving costs and efficiencies in the thermal heating
systems, especially in the smaller plants that have relatively high heating costs per
kWh. A typical abattoir could reduce its thermal energy consumed by an estimated
32% by implementing thermal energy efficiency measures.
The prediction of thermal energy savings potential for South African abattoirs is
provided in Figure 2.
1 Extracted from “Practical Guide for Improving Resource Efficiency in Red Meat Abattoirs in South Africa”, prepared as a component of this project.
FIGURE 2 – THERMAL ENERGY SAVINGS POTENTIAL FOR A TYPICAL ABATTOIR
%
100
90
80
70
60
50
40
30
20
10
0
% Generation Losses
Radiation Losses
Leakage Wasteful Usage
Productive Work
Potential
Productive Work Wasteful Usage Leakage Radiation Losses Generation Losses Saving
Improved efficiency/
profitability 31.8%
Refrigeration and chiller plants typically account for up to 45% of the electrical
demand of an abattoir and therefore offer the greatest electrical savings
opportunities. A typical abattoir could reduce its electrical energy consumption
by an estimated 12% by implementing energy-efficiency measures.
The red meat sector in South Africa is a dynamic, growing industry that makes
a significant contribution to domestic food supply and generates vital export
revenue. The past two decades have seen significant changes across South Africa’s
livestock and meat sector, with domestic livestock populations decreasing from
approximately 40 million head in 2001 to around 35 million head in 2018. While
the livestock population has been decreasing, the production volumes have
been increasing (see Figure 3), because the sector has substantially improved its
productivity through the adoption of feed finishing practices, higher slaughter
rates across all species, and heavier average carcase weights for cattle, sheep and
pigs (less so for goats).
THE ELECTRICAL ENERGY EFFICIENCY AND RELATED COST-SAVING MEASURES IDENTIFIED INCLUDE:
• Review electrical tariffs
• Reduce peak electrical demand
• Pump system optimisation
• Chiller system coefficient of performance (COP) management and optimisation
• Compressed air system optimisation
• Solar photovoltaic (PV)

8 BENCHMARKING STUDY
FIGURE 3 - LIVESTOCK SLAUGHTERING IN SOUTH AFRICA (SU)
7 000
6 000
5 000
4 000
3 000
2 000
1 000
02000/01 2002/03 2004/05 2006/07 2008/09 2010/11 2012/13 2014/15 2016/17
Cattle Slaughter (SUs) Sheep & Goat Slaughter (SUs) Pig Slaughter (SUs)
The industry has also been impacted by the destocking of farms due to drought and disease outbreaks.
Sustained drought conditions since 2018 throughout South Africa have intensified the need to find water-
saving opportunities in the processing sector without compromising food safety standards. The results of this
benchmarking report bring into sharper focus the fact that South African meat companies are already responding
to the challenge through more careful water management on-site and measurement of all resources used. Its
results are drawn from international references and the performance of 21 enterprises to give a clearer snapshot
of resource utilisation across the larger industry of 423 facilities (see Table 1).
To overcome the carcase weight differences between different species
that would inadvertently skew benchmarking results, expressed
on the basis of per livestock head slaughtered, the Benchmarking
Study uses the RMAA’s SU conversion rate whereby six goats/sheep
are equivalent to one cattle animal, and two pigs are equivalent to
one cattle animal. This enables far better interpretation of per-head
usage of resources.
The benchmark comparisons took into account that the South
African industry has several differences at an overall operational level
from international counterparts. These include, for example, that
livestock in South Africa are not washed prior to slaughter, hides
and skins are sent off-site without absorbing much in the way of
energy or water resources, red offal undergoes minimal processing
before despatch to the domestic market, and deboning operations
are almost always focused on hindquarter production which uses
markedly less energy. In addition, there are clear differences in water,
energy and fuel consumption between fully integrated works and
those that only undertake slaughter, chill and boning tasks.
TOTAL ABATTOIRS PER PROVINCE
Province Total Number
Eastern Cape 67
Free State 80
Gauteng 40
KZN 50
Limpopo 34
Mpumalanga 33
North West 35
Northern Cape 38
Western Cape 46
Total 423
TABLE 1 – ABATTOIRS BY PROVINCE

9Resource Efficiency in Red Meat Abattoirs in South Africa
FIGURE 3 - LIVESTOCK SLAUGHTERING IN SOUTH AFRICA (SU)
7 000
6 000
5 000
4 000
3 000
2 000
1 000
02000/01 2002/03 2004/05 2006/07 2008/09 2010/11 2012/13 2014/15 2016/17
Cattle Slaughter (SUs) Sheep & Goat Slaughter (SUs) Pig Slaughter (SUs)
The industry has also been impacted by the destocking of farms due to drought and disease outbreaks.
Sustained drought conditions since 2018 throughout South Africa have intensified the need to find water-
saving opportunities in the processing sector without compromising food safety standards. The results of this
benchmarking report bring into sharper focus the fact that South African meat companies are already responding
to the challenge through more careful water management on-site and measurement of all resources used. Its
results are drawn from international references and the performance of 21 enterprises to give a clearer snapshot
of resource utilisation across the larger industry of 423 facilities (see Table 1).
To overcome the carcase weight differences between different species
that would inadvertently skew benchmarking results, expressed
on the basis of per livestock head slaughtered, the Benchmarking
Study uses the RMAA’s SU conversion rate whereby six goats/sheep
are equivalent to one cattle animal, and two pigs are equivalent to
one cattle animal. This enables far better interpretation of per-head
usage of resources.
The benchmark comparisons took into account that the South
African industry has several differences at an overall operational level
from international counterparts. These include, for example, that
livestock in South Africa are not washed prior to slaughter, hides
and skins are sent off-site without absorbing much in the way of
energy or water resources, red offal undergoes minimal processing
before despatch to the domestic market, and deboning operations
are almost always focused on hindquarter production which uses
markedly less energy. In addition, there are clear differences in water,
energy and fuel consumption between fully integrated works and
those that only undertake slaughter, chill and boning tasks.
As a basis for comparison, the Benchmarking Study looked at data across three categories of plants:
i. Fully Integrated plants, which typically include full boning rooms as well as freezing, rendering and blood processing, and use steam for water heating.
ii. Slaughter, Chill and Bone plants, which include boning activity but no freezing or value-adding.
iii. Slaughter and Chill plants, which focus on despatching bone-in product to the marketplace and have minimal activity in other departments.
A profile of the 21 enterprises involved in the benchmark study is provided in Table 2.
TABLE 2 - PARTICIPATING PLANT PROFILE
PLANT PROFILES
Facility Slaughter & Chill 50% Slaughter, Chill & Bone 36% Fully Integrated 14%
Shifts Single Shift 93% Double Shift 7%
Offal Processing Trim & Rinse 79% Pack & Freeze 14% Combination 7%
Water Heating Steam 50% Electricity 50%
Refrigeration Hydrocarbon 79% Ammonia 21%
Blood Disposal Wastewater 57% Compost 21% Dried 14% Land 7%
Wastewater Disposal Irrigation 50% Sewer 43% Surface water 7%
The water source and usage results for the three plant categories on a per-SU basis are presented in Figure 4, and
the water consumption and cost benchmark results are presented in Figure 5.
FIGURE 4 - WATER SOURCE AND USAGE BENCHMARKS
Municipal
Borehole
Rainwater
River
Recycled
Other
Post-Slaughter Cleaning
Offal
Slaughter
Pre-Slaughter
SLAUGHTER UNIT BASIS
1 200
1 000
800
600
400
200
0South African Median
Benchmark
FULLY INTEGRATED
Water Source (Litre/SU)
Water Usage (Litre/SU) 1 200
1 000
800
600
400
200
0South African Median
Benchmark
SLAUGHTER, CHILL & BONE
Water Source (Litre/SU)
Water Usage (Litre/SU) 1 200
1 000
800
600
400
200
0South African Median
Benchmark
SLAUGHTER, CHILL
Water Source (Litre/SU)
Water Usage (Litre/SU)

10 BENCHMARKING STUDY
FIGURE 5 - WATER CONSUMPTION AND WATER COST BENCHMARKS
3 000
2 500
2 000
1 500
1 000
500
0
Inte
rnat
iona
l B
ench
mar
k
Sout
h A
fric
an
Ben
chm
ark
FULLY INTEGRATED SLAUGHTER, CHILL & BONE SLAUGHTER, CHILL
SLAUGHTER UNIT BASIS
100
90
80
70
60
50
40
30
20
10
0
Inte
rnat
iona
l B
ench
mar
k
Sout
h A
fric
an
Ben
chm
ark
3 000
2 500
2 000
1 500
1 000
500
0
Inte
rnat
iona
l B
ench
mar
k
Sout
h A
fric
an
Ben
chm
ark
100
90
80
70
60
50
40
30
20
10
0
Inte
rnat
iona
l B
ench
mar
k
Sout
h A
fric
an
Ben
chm
ark
3 000
2 500
2 000
1 500
1 000
500
0
Inte
rnat
iona
l B
ench
mar
k
Sout
h A
fric
an
Ben
chm
ark
100
90
80
70
60
50
40
30
20
10
0
Inte
rnat
iona
l B
ench
mar
k
Sout
h A
fric
an
Ben
chm
ark
Water Consumption (Litre/SU)
Water Cost (Rand/SU)
Water Consumption (Litre/SU)
Water Cost (Rand/SU)
Water Consumption (Litre/SU)
Water Cost (Rand/SU)
On this basis, South African plants across all three categories used a lesser volume of water per SU compared
to the international benchmark cohort, but paid similar costs for this resource, mainly due to higher volume
charges stemming from municipal supply and disposal charges. The low-cost plants utilise borehole water with
low or no costs, and dispose wastewater to irrigation.
The total energy source and usage results for the three plant categories on a per-SU basis are presented in Figure
6, and the total energy consumption and cost benchmark results are presented in Figure 7.
The results of the study with regards to energy source and energy usage were insightful. First, it is clear that
fossil fuels supply about 60% of energy supply at plant level, particularly in the Fully Integrated category, and
electricity supplies around 30% of the energy requirements. There is an emerging interest in solar PV usage by
facility operators. A Fully Integrated enterprise uses 120 kWh per SU, which is more than twice the requirement
of enterprises in the Slaughter and Chill category.

11Resource Efficiency in Red Meat Abattoirs in South Africa
FIGURE 6 – TOTAL ENERGY SOURCE AND USAGE BENCHMARKS
140
120
100
80
60
40
20
0
Supplied Electricity
Fossil Fuels
Solar PV
South African Median Benchmark
Other
Refrigeration
Hot Water / Steam
FULLY INTEGRATED SLAUGHTER, CHILL & BONE SLAUGHTER, CHILL
SLAUGHTER UNIT BASIS
Energy Source (kWh/SU)
Energy Usage (kWh/SU)
140
120
100
80
60
40
20
0South African Median Benchmark
Energy Source (kWh/SU)
Energy Usage (kWh/SU)
140
120
100
80
60
40
20
0South African Median Benchmark
Energy Source (kWh/SU)
Energy Usage (kWh/SU)
The results of international comparisons for energy contrasted with South African facilities (see Figure 7) show
South African enterprises using less energy on an SU basis. The study attributes this to the thermal heat load in
South African plants being different to Australian and New Zealand examples, due to the use of electrical energy
and heating elements to generate hot water, or the use of coal to produce steam (which results in high energy
use and boiler losses). Liquefied Petroleum Gas (LPG) is also frequently used in the South African industry for pig
singeing, although it is up to five times more costly than coal on a per kWh basis.
©depositphotos_manfredxy

12 BENCHMARKING STUDY
FIGURE 7 – TOTAL ENERGY USAGE (KWH) AND COST BENCHMARKS
FULLY INTEGRATED SLAUGHTER, CHILL & BONE SLAUGHTER, CHILL
SLAUGHTER UNIT BASIS
300
250
200
150
100
50
0
Inte
rnat
iona
l B
ench
mar
k
Sout
h A
fric
an
Ben
chm
ark
450
400
350
300
250
200
150
100
50
0
Inte
rnat
iona
l B
ench
mar
k
Sout
h A
fric
an
Ben
chm
ark
Total Energy (kWh/SU)
Total Energy Cost (Rand/SU) 300
250
200
150
100
50
0
Inte
rnat
iona
l B
ench
mar
k
Sout
h A
fric
an
Ben
chm
ark
450
400
350
300
250
200
150
100
50
0
Inte
rnat
iona
l B
ench
mar
k
Sout
h A
fric
an
Ben
chm
ark
Total Energy (kWh/SU)
Total Energy Cost (Rand/SU)300
250
200
150
100
50
0
Inte
rnat
iona
l B
ench
mar
k
Sout
h A
fric
an
Ben
chm
ark
450
400
350
300
250
200
150
100
50
0
Inte
rnat
iona
l B
ench
mar
k
Sout
h A
fric
an
Ben
chm
ark
300
250
200
150
100
50
0
Inte
rnat
iona
l B
ench
mar
k
Sout
h A
fric
an
Ben
chm
ark
450
400
350
300
250
200
150
100
50
0
Inte
rnat
iona
l B
ench
mar
k
Sout
h A
fric
an
Ben
chm
ark
Total Energy (kWh/SU)
Total Energy Cost (Rand/SU)
The study points out the likelihood that South African companies will continue to be reliant on coal and direct-
point electrical-based heating systems for the next decade or so; however, the establishment of natural gas
reserves and heavy CO2-equivalent taxes on coal-based systems may start to move industry towards other
systems in the longer term.
TABLE 3 - ENERGY AND WATER UNIT COSTS
FINANCIAL
INTERNATIONAL BENCHMARKS
SOUTH AFRICAN BENCHMARKS
Median Median
Cost / kWh Electrical including demand charges (R/kWh) R2.90 R1.30
Cost / kWh Thermal (R/kWh) R0.34 R1.13
Cost of water purchase (R/kl) R5.45 R14.00
Cost of water discharge including penalties (R/kl) R9.73 R7.50
Cost comparisons between the two energy inputs provided some contrasts: South African enterprises were
found to be paying around R1.30/kWh for electrical energy and 1.13/kWh for thermal energy, compared to the
equivalent of R2.90/kWh and R0.34/kWh, respectively in the international benchmark cohort. This disparity in
unit price in part explains the higher use of electricity for water heating in South Africa.
Estimates of Greenhouse Gas (GHG) emissions have been calculated from the energy data obtained from the
plants, and Figure 8 provides the median and range of GHG emissions.

13Resource Efficiency in Red Meat Abattoirs in South Africa
100
90
80
70
60
50
40
30
20
10
0
Inte
rnat
iona
l B
ench
mar
k
Sout
h A
fric
an
Ben
chm
ark
GHG Emissions (kg CO2/SU)
FIGURE 8 - ESTIMATE OF GHG EMISSIONS While the median level of emissions is similar for both South Africa
(27 kgCO2/SU) and internationally (22 kgCO2/SU), the South African
data shows some high levels of GHG emissions. This is essentially
due to the impact of the direct utilisation of electricity for hot
water heating where the electricity is primarily generated from
thermal fuel at a centralised generation facility. South Africa is still
heavily reliant on coal power stations, resulting in comparatively
high CO2 emissions per kWh electricity.
Emerging from this study is the development of a set of 18 key
performance indicators (KPIs) for the processing sector, with
particular focus on water consumption, wastewater generation
and energy use. These KPIs in turn have produced a detailed profile
of individual plants’ performance as well as findings about the
industry on a national level.
A key output of the study is a self-assessment
tool that can be used by other enterprises in
South Africa to benchmark themselves. The
self-assessment “Benchmark Tool” produces
a “Resource Efficiency Benchmark Report”
tailored to the participant plant.
A “Practical Guide for Improving Resource Efficiency in Red Meat Abattoirs in South Africa” has
also been produced and the opportunities and recommendations in this guide have been
incorporated into “Resource Efficiency Assessment Reports”, tailored to the circumstances
of each enterprise participating in the study. The Practical Guide for Improving Resource
Efficiency details specific, practical solutions that abattoirs can adopt to improve their
resource efficiency and competitiveness, and ultimately their sustainability.
©depositphotos_antiksu

14 BENCHMARKING STUDY©depositphotos_muha04

15Resource Efficiency in Red Meat Abattoirs in South Africa
IntroductionBackground to the ProjectWater scarcity, greater water demand and changes in water supplies due to climate
change are severely affecting large parts of Southern Africa, including South Africa,
posing a significant risk to the region. Coupled with the increasing cost of energy and
underdeveloped practices of handling agricultural waste, the availability of resources
in general presents a significant risk for companies engaged in agribusiness.
It has been estimated that South Africa’s red meat production sub-sector, including
beef, pork, sheep and goat meat processing, takes up to 10% of the total water
consumption and slightly less of the energy consumption in the agricultural
processing space (excluding pulp and paper). The sector possesses significant
potential to reduce the use of water and other resources, which would improve
its cost base and environmental footprint, and increase the competitiveness and
sustainability of abattoirs and integrated operators, as well as enhance their export
potential.
The IFC, a member of WBG, is the largest global development institution focused
exclusively on the private sector in developing countries. IFC’s Manufacturing,
Agribusiness and Services (MAS) Advisory team offers a diverse array of services
to private sector companies, assisting to improve productivity and mitigate risks
associated with environmental factors and climate change. In agribusiness, MAS
Advisory assists with the integration of smallholder farmers into food supply chains,
improving agricultural productivity and food safety, optimising the use of resources,
saving energy and water, and reducing waste.
In 2019, IFC and the SECO launched the APRE programme in South Africa. The
programme aims to assist the agri-processing sector in South Africa to improve
sustainability and competitiveness by emphasising reductions in water use, along
with related reductions in energy and fuel consumption (or usage). Red meat
processing has been identified as one of the priority sub-sectors, offering significant
potential to reduce resource consumption.
The RMAA is the leading industry association in South Africa that aims to improve
the competitiveness of domestic producers, promoting good operational practices,
facilitating linkages between sector players, and advocating for policy measures to
create a conducive enabling environment.
IFC and RMAA partnered to conduct the resource efficiency benchmarking of red meat
abattoirs in South Africa to assess gaps in the efficient use of resources with a focus on
water, and identify areas for improvements in performance and sustainability.
The following pages are a summary of the South African meat processing industry’s
performance against domestic (South African) and international benchmarks.
2
SOUTH AFRICA’S red meat production sub-sector, including beef, pork, sheep and goat meat processing, takes up to 10% of the total water consumption and slightly less of the energy consumption in the agricultural processing space (excluding pulp and paper).
Red meat processing has been identified as one of the priority sub-sectors, offering significant potential to reduce resource consumption.
©depositphotos_muha04

16 BENCHMARKING STUDY
The South African Meat Processing IndustryThe South African meat processing industry produces animal products for consumption in the South African
domestic market and a number of export markets.
FIGURE 9 – LIVESTOCK POPULATION IN SOUTH AFRICA2
45 000
40 000
35 000
30 000
25 000
20 000
15 000
10 000
5 000
02000/01 2002/03 2004/05 2006/07 2008/09 2010/11 2012/13 2014/15 2016/17
Sheep & Goat Population ('000) Cattle Population ('000) Pig Population ('000)
The red meat livestock population has decreased from 40 million head in 2001 to around 35 million head in 2018
(see Figure 9). While the population has been decreasing, production volumes have been increasing as the sector
has improved production efficiency, particularly through the adoption of feed finishing practices, but has also
been impacted by destocking of production properties due to drought and disease outbreaks.
FIGURE 10 – LIVESTOCK SLAUGHTERING IN SOUTH AFRICA (HEAD)2
8 000
7 000
6 000
5 000
4 000
3 000
2 000
1 000
02000/01 2002/03 2004/05 2006/07 2008/09 2010/11 2012/13 2014/15 2016/17
Sheep & Goats Slaughtered ('000) Cattle Slaughtered ('000) Pigs Slaughtered ('000)
2 Department of Agriculture, Forestry and Fisheries, 2019

17Resource Efficiency in Red Meat Abattoirs in South Africa
The South African Meat Processing IndustryThe South African meat processing industry produces animal products for consumption in the South African
domestic market and a number of export markets.
FIGURE 9 – LIVESTOCK POPULATION IN SOUTH AFRICA2
45 000
40 000
35 000
30 000
25 000
20 000
15 000
10 000
5 000
02000/01 2002/03 2004/05 2006/07 2008/09 2010/11 2012/13 2014/15 2016/17
Sheep & Goat Population ('000) Cattle Population ('000) Pig Population ('000)
The red meat livestock population has decreased from 40 million head in 2001 to around 35 million head in 2018
(see Figure 9). While the population has been decreasing, production volumes have been increasing as the sector
has improved production efficiency, particularly through the adoption of feed finishing practices, but has also
been impacted by destocking of production properties due to drought and disease outbreaks.
FIGURE 10 – LIVESTOCK SLAUGHTERING IN SOUTH AFRICA (HEAD)2
8 000
7 000
6 000
5 000
4 000
3 000
2 000
1 000
02000/01 2002/03 2004/05 2006/07 2008/09 2010/11 2012/13 2014/15 2016/17
Sheep & Goats Slaughtered ('000) Cattle Slaughtered ('000) Pigs Slaughtered ('000)
2 Department of Agriculture, Forestry and Fisheries, 2019
According to the Department of Agriculture, Forestry and Fisheries (DAFF), the
number of livestock processed per annum in South Africa between 2000 and
2018 (see Figure 10):
• Increased from 2.3 million to 3.3 million cattle
• Increased from 1.9 million to 3.1 million pigs
• Was stable at around six million sheep/goats.
The South African Red Meat Levy Admin (RMLA) reported that 2.7 million cattle,
4.9 million sheep, 722 goats and 3.2 million pigs were processed in 20193.
South Africa utilises a measure referred to as SUs to provide an overall indicator
of the total volume of red meat processed in the country.
Figure 11 provides the progression between 2000 and 2018 of livestock
slaughtering in South Africa based on SUs.
FIGURE 11 - LIVESTOCK SLAUGHTERING IN SOUTH AFRICA (SU)4
7 000
6 000
5 000
4 000
3 000
2 000
1 000
02000/01 2002/03 2004/05 2006/07 2008/09 2010/11 2012/13 2014/15 2016/17
Cattle Slaughter (SUs) Sheep & Goat Slaughter (SUs) Pig Slaughter (SUs)
The number of SUs slaughtered increased from 4.2 million SUs in 2000 to 5.9 million in 2018. This is a growth of
40% over 18 years and demonstrates the successful growth rate of the sector.
In the 12 months from November 2018 to October 2019, the RMLA recorded 5.1 million SUs processed (see Table
4). The difference between the Department of Agriculture, Forestry and Fisheries (DAFF) Statistics and the
RMLA data could be due to the DAFF data including an estimate for home kill.
3 Red Meat Levy Admin, 20204 Department of Agriculture, Forestry and Fisheries, 2019
SUs ARE BASED ON THE FOLLOWING CONVERSIONS:
• One cattle animal equals one SU
• Two pigs equal one SU
• Six sheep equal one SU
• Six goats equal one SU
• Six small-stock (mixed species) equal one SU.

18 BENCHMARKING STUDY
TABLE 4 – RMLA SLAUGHTER STATISTICS5
SLAUGHTER STATISTICS (HEAD) - RED MEAT LEVY AUTHORITY 12 MONTHS - NOVEMBER 2018 TO OCTOBER 2019
Province Cattle Sheep Goats Pigs
Eastern Cape 216 174 431 849 125 192 076
Free State 505 986 815 258 - 218 161
Gauteng 456 237 595 718 6 1 310 626
KwaZulu-Natal 234 728 121 352 - 448 058
Limpopo 150 054 19 581 179 59 411
Mpumalanga 537 131 88 039 86 156 041
North West 181 690 1 706 248 70 109 707
Northern Cape 254 849 39 754 143 85 524
Western Cape 119 963 1 117 512 113 645 237
TOTAL HEAD 2 656 812 4 935 311 722 3 224 841
TOTAL SU 2 656 812 822 552 120 1 612 421
TOTAL SU 5 091 905
FIGURE 12 - SOUTH AFRICAN RED MEAT EXPORTS6
200 000
180 000
160 000
140 000
120 000
100 000
80 000
60 000
40 000
20 000
0
Pork Offal
Sheep Offal
Lamb & Mutton
Beef Offal
Beef Products
Pork
Beef
Boneless Beef
SOUTH AFRICAN RED MEAT PRODUCTS 2017 EXPORT VALUE
(USD'000) BY PRODUCT
120 000
110 000
100 000
90 000
80 000
70 000
60 000
50 000
40 000
30 000
20 000
10 000
0
Other Destinations
Angola
Lesotho
Egypt
Qatar
Eswatini
Mozambique
Jordan
United Arab Emirates
Kuwait
China
SOUTH AFRICAN CHILLED & FROZEN BEEF EXPORT VALUE (USD'000) BY
MARKET (2019)
5 Red Meat Levy Admin, 20206 Food and Agriculture Organization of the United Nations, 2020

19Resource Efficiency in Red Meat Abattoirs in South Africa
Red meat exports are important to the South African economy and in 2017, exports were worth an estimated
US$200 million. These exports were dominated by beef products which made up over 80% of red meat exports.
Chilled and frozen beef in 2019 (not including offal items) was exported to a wide variety of destinations, with
China, Kuwait and the United Arab Emirates (UAE) accounting for 50% of export volumes, as depicted in Figure 12.
TABLE 5 – STRUCTURE OF THE SOUTH AFRICAN RED MEAT PROCESSING SECTOR7
TOTAL ABATTOIRS PER PROVINCE CATTLE ABATTOIR THROUGHPUT CAPACITY
Province Total Number High Throughput (HT)
Infrequently Slaughtering Low Throughput (ISLT)
Low Throughput (LT)
Rural Throughput (RT)
Eastern Cape 67 12 3 10 33
Free State 80 20 7 17 13
Gauteng 40 14 6 4
KwaZulu-Natal 50 16 7 7 8
Limpopo 34 8 6 9 36
Mpumalanga 33 13 4 8 2
North West 35 11 4 8 11
Northern Cape 38 9 3 9 6
Western Cape 46 16 7 16 2
Total 423 119 47 88 111
The structure of the red meat processing sector in South Africa is extremely diverse
and ranges from a relatively limited number of large, sophisticated enterprises
servicing the demand requirements of customers worldwide at one end, to a large
number of low production, simple “slaughter and chill” operations that supply red
meat carcases to local butchers and markets.
Table 5 provides an analysis of the provincial structure of the South African red meat
processing sector as at 2019, indicating a total of 423 enterprises.
Indicative production levels for High Throughput (HT), Low Throughput (LT) and
Rural Throughput (RT) plants are:
• HT: >20 SUs per day
• LT: 3-20 SUs per day
• RT: <=2 SUs per day.
It needs to be recognised that while the large plants servicing sophisticated domestic and international markets
usually have advanced management capabilities, this may not be the case in the smaller, low throughput and rural-
based enterprises.
The development of the Benchmark Tool which can be self-populated by enterprise management is seen as an
essential project component to engage management across the broad spectrum of red meat processing enterprise
capabilities.
7 Red Meat Abattoir Association, 2018
TABLE 5 ALSO PROVIDES THE NUMBER OF CATTLE ABATTOIRS BY THROUGHPUT CAPACITY; THIS DATA INDICATES THAT:
• Around one-third of cattle abattoirs are high throughput;
• Another one-third are intermediate or low throughput;
• Another one-third are rural throughput.

20 BENCHMARKING STUDY
Resource Efficiency BenchmarkingResource efficiency benchmarking provides the ability to examine and
understand resource efficiency performance in relation to others. The
results can be used to compare resource efficiency performance against
other red meat processing enterprises at both the international and the
local level. The report can also be used as a guide on what to measure,
to determine resource efficiency metrics relevant to red meat processing.
Comparing resource efficiency performance with peers provides an
understanding of where resource efficiencies may be different and thereby
helps enterprise management to identify areas of focus to increase
efficiencies, reduce resource consumption, and reduce operating costs.
This report provides performance benchmarks relevant to the South
African red meat processing sector, based on international references and
the performance of 21 meat processing plants located throughout South
Africa during the first quarter of 2020.
Data for this report has been collected from a variety of sources, including:
• Plant monitoring data
• In-plant surveys by the project team
• Accounting documentation
• Energy and material audit tools
• A desk study of international benchmarking.
The report provides resource efficiency benchmarking based on resource
usage and associated costs for water (incoming and outgoing volumes
and quality) and energy (electricity and fuel) in relation to the units of
meat produced (SU), and carcase weight (tonnes CW).
Choosing the right units for rationalising resource performance is
essential for providing useful resource efficiency information. Resource
efficiency measurements should not be based on the quantity or cost
of resources alone. Variations in processing procedures, departmental
operations and variability of finished products typically alter the quantity
and overall cost of resources consumed. Rationalising resource quantity
and cost against the “volume processed” provides a method to measure
resource efficiency performance and it is the unit used throughout this
report.
BENCHMARKING – PAINTING PICTURES
It is important to recognise that benchmarks are useful in providing an indication of relative performance. The reality however, is that meat processing plants often differ in some way or another (e.g. Fully Integrated plants with rendering facilities, retail ready, or further processing operations versus simple “Slaughter and Chill” operations).
While corrections have been made to the input information where data is available, and the “Benchmark Tool” makes a number of adjustments associated with processing operation, the outputs should be interpreted while understanding that the International Benchmarks (mostly representing fully integrated facilities) may not directly compare with the Domestic Benchmarks (which, for example, tend to not process offal as thoroughly and generally do not have rendering plants). The Domestic Benchmark data at a departmental level relies on data collected when undertaking plant visits where actual metering was not available.
The benchmarking provides a rating against KPIs, and such ratings will contain some level of imprecision.
©depositphotos_pixpack

21Resource Efficiency in Red Meat Abattoirs in South Africa
Process Variation and the Impact on Resource UtilizationA significant challenge for benchmarking in the red meat processing sector is an understanding of how the
industry operates so that benchmarking can be conducted on the basis of “best endeavours”.
The meat industry process flow outlined in Figure 13 represents a full set of operating departments associated
with what can be described as an “Integrated Meat Processing” enterprise. International benchmarking is
generally conducted on processing enterprises that have all the operating departments outlined in Figure 13.
FIGURE 13 - MEAT INDUSTRY PROCESS FLOW: FULLY INTEGRATED ENTERPRISE
There are no significant differences in technology and plant design, particularly in the slaughter and boning
areas of meat plants in South Africa, compared with international plants. While the livestock handling and
slaughtering operations are similar across the formal meat processing sector there are some significant
operating differences in other departments compared to South African enterprises. The differences at an overall
industry level are outlined in Table 6.
Slaughter Area Fabrication Area
Livestock handling at
works
Holding, feeding,
penning up
Carcase chilling
QuarterSort, chill Chill and freeze
Refrigeration
Stun & stick Hide removal Evisceration, head chain Trim, inspect
SlaughteringBoning Trim,
pack
Boning room
Blood processing
Hide processing
Edible offals
Other offals
Petfood offals Rendering
Chilled or frozen storage prior to
dispatch
Storage
Bloodmeal Hides Pharmaceutical Edible ofals
Petfood Meat meal tallow
Chilled primalsFrozen primalsFrozen bulk Chilled quartersFrozen quarters
Carcase/quarter
despatch
Source: ProAnd Associates
22 BENCHMARKING STUDY
TABLE 6 – DIFFERENCES IN PROCESSING OPERATIONS
DEPARTMENT FULLY INTEGRATED ENTERPRISES SOUTH AFRICAN ENTERPRISES
Livestock HandlingLivestock in Australia (particularly feedlot cattle) and New Zealand are generally washed before slaughter.
Livestock in South Africa are not washed before slaughter.
Blood Processing
Blood is coagulated and dried in a pneumatic drier to produce blood-meal. The process involves heat to dry and produces highly loaded stick-water from the coagulation process.
Blood is not processed on-site and is often despatched directly to a composting operation, with little to no energy or wastewater implications.
Hides
Hides and skins are often short-term preserved using chilled water or refrigeration involving energy and water consumption, and wastewater generation. They are sometimes salted.
Hides and skins are generally sent off-site daily in a fresh condition, not requiring the use of any water or energy resources.
Offal
Red and rough offal is cleaned and processed, packed into cartons and frozen (generally for export). This requires considerable amounts of water and generates contaminated wastewater. Freezing requires additional energy compared to chilling.
Red offal is regularly processed as full sets which are rinsed and chilled prior to despatch to the domestic market in chilled form. Rough offal is rinsed, cleaned and also despatched to the domestic market in chilled form. The use of water and energy is significantly less than for the fully integrated enterprise.
Boning
While there may be a small number of fresh carcases/quarters despatched, most carcases will be fully fabricated and packed prior to despatch. More energy will be associated with longer-term chilling, product freezing and storage.
Most boning rooms process mainly hindquarters, and the majority of forequarters are despatched as chilled bone-in quarters directly into the domestic market. Less energy is needed than in fully integrated enterprises.
Refrigeration
All plants have installed more efficient centralised ammonia refrigeration. Many have replaced blast freezers with more efficient plate freezers and have recently begun to install automated, unmanned carton handling and storage systems for both frozen and chilled product.
Many enterprises in South Africa continue to have less efficient distributed hydrocarbon systems for refrigeration systems and retain blast freezing and manual cold storage systems.
Rendering
Rendering is almost universally present in the fully integrated enterprises due to significant raw material volumes from the slaughter and boning processes. Almost all have heat recovery units installed, which generate hot water from rendering waste heat; however, the net energy use is high due to the rendering process itself.
Very few enterprises operate rendering facilities, as the raw material volume is small, and most items have a domestic market demand. Items that cannot be marketed are directed to composting operations with little to no impact on resource use.
In order to make comparisons there is a need to adjust the resource consumption in accordance with the
departmental operations employed by the enterprise.

23Resource Efficiency in Red Meat Abattoirs in South Africa
Resource UtilisationResource utilisation at meat processing operations involves the consumption of water, thermal energy
(heat) and electricity. Figure 14 provides an overview of process flow and resource consumption for cattle,
small-stock and pig processing.
FIGURE 14 - MEAT PROCESSING ENTERPRISE FLOWCHARTS AND RESOURCE CONSUMPTION
Cattle Supply
Cattle receival and holding
Principal resource
use
Water
Stunning & bleeding
Dressing (inc head, hoof, hide removal)
Evisceration
Carcase chilling
Boning & fabrication
Refrigeration & storage
Meat for consumption
Water
Heat
Electricity
Electricity
Electricity
Water
Blood processing
Hide preservation
Red offal processing
Rough offal processing
Rendering
Composting
Blood
Hide
Head & Hooves
Red offal
Rough offal
Inedible offal
Paunch contents
Fat & bone
Principal resource
use
Heat
Water
Water
Heat
Pig Supply
Pig receival and holding
Principal resource
use
Water
Stunning & bleeding
Scalding & dehairing
Evisceration
Carcase chilling
Boning & fabrication
Refrigeration & storage
Meat for consumption
Water
Heat
Electricity
Electricity
Electricity
Water
Blood processing
Red offal processing
Rough offal processing
Rendering
Blood
Red offal
Rough offal
Inedible offal
Fat & bone
Principal resource
use
Heat
Water
Water
Heat
CATTLE & SMALL-STOCK PROCESSING PIG PROCESSING

24 BENCHMARKING STUDY
Project MethodologyThe project identified a series of KPIs relevant to the red meat processing sector (including beef, pork, sheep and
goat), with a focus on water consumption, wastewater generation, and energy use. This was done through
discussions with the Project Reference Group (a group of stakeholders including abattoir managers and industry
specialists). The KPIs are summarised in Table 7.
TABLE 7 - KEY PERFORMANCE INDICATORS
INCOMING WATER ENERGY
1 Total abstracted water – municipal (kl) 10 Total energy used (kWh)
2 Total abstracted water – ground/surface/rainwater (kl)
11 Total energy used in refrigeration units (kWh)
3 Total re-used water (%) 12 Total thermal energy for steam and hot water systems (kWh)
4 Pre-slaughter water usage (kl) 13 GHG emissions (kg CO2e)
5 Rough offal handling (kl) FINANCIAL
6 Post- operative cleaning (kl) 14 Cost/kWh Electrical, including demand charges (R/kWh)
EFFLUENT 15 Cost/kWh Thermal (R/kWh)
7 Total volume discharge (kl) 16 Cost of water purchase (R/kl)
8 Average chemical oxygen demand (COD) (mg/l) 17 Cost of water discharge, including penalties (R/kl)
9 Average total dissolved solids (TDS) (mg/l) 18 Required IRR for projects (%)
With the assistance of the Project Reference Group, and in particular the RMAA, 30 firms engaged in the red
meat abattoir sector were identified to participate in the benchmarking (jointly with the RMAA and IFC), of
which 21 facilities participated in the project.
Baseline data across the agreed KPIs and subsectors was collected and where possible, data for 12 historical
months was gathered. Thirteen of the participating plants were visited by the project team, and plant processing
operations and performance were reviewed and data collected for the Benchmarking Project. A further 8 of the
selected meat processing firms were provided with the Data Input Sheets of the Benchmark Tool and a non-
specific version of the Benchmark Tool Output. These plants were contacted to assist with data collection in
compliance with the protocols of the Benchmark Project. It was considered important to visit a number of
plants to ensure that the operations were well understood and to make assessments of resource consumption
at a departmental level in plants where there was limited monitoring.
A literature search of international best practices associated with meat processing utilisation of water
and energy resources was conducted, and while a number of countries/regions have produced documents
associated with best practice for the meat processing industry, only Australia and New Zealand have
conducted benchmarking processes to a reasonable degree of rigour in recent years. While the Australian and
New Zealand industries produce more product for the international market than South Africa, the plant visits
confirmed that the technology employed and the processing practices were similar, with the differences as
identified in Table 6.

25Resource Efficiency in Red Meat Abattoirs in South Africa
A “Benchmark Tool” was developed that captures all relevant
data and produces a “Resource Efficiency Benchmark Report”
(see an example in Annex 2). This report provides comparisons
with both International and domestic (South African)
benchmark information. Participating plants were provided
with the “Resource Efficiency Benchmark Report” and a
second “Resource Efficiency Assessment Report”, providing
a gap analysis and making recommendations/observations
addressing opportunities to reduce resource utilisation
through the adoption of best practices.
Once the data collected had been checked for compliance,
this report titled “Benchmarking Study: Resource Efficiency in
Red Meat Abattoirs in South Africa” and a second report titled
“A Practical Guide for Improving Resource Efficiency in Red Meat
Abattoirs in South Africa” were generated.
The project was conducted in close collaboration with
stakeholders to develop relevant KPIs and to obtain feedback
on progress and recommendations as they arose.
©depositphotos_gyuszko

26 BENCHMARKING STUDY©depositphotos_benedamiroslav

27Resource Efficiency in Red Meat Abattoirs in South Africa
3OVERVIEW
A literature review was conducted to identify robust international benchmark data for the meat processing industry that could provide a basis for making comparisons with South African enterprises.
International BenchmarksWhile a number of regions and countries have reported consumption data for
the meat processing sector, only Australia and New Zealand have conducted
regular surveys and provided an analysis of the data that enables an
understanding of the functional departments operated by the benchmarked
enterprises. While the Australian and New Zealand industries produce more
product for the international market than South Africa, the plant visits
confirmed that the technology employed and the processing practices are
similar, with the differences as identified in Table 6.
The following section provides an overview of international benchmarks, with
an emphasis on data that has been published for Australia and New Zealand.
Australian Meat Processing BenchmarksIn 2015, the Australian meat processing sector conducted the fourth in a series
of benchmarking studies that had commenced in 1998. The 2015 Environmental
Performance Review Study8 conducted a survey of Australian meat processing
plants to assess their resource utilisation and made a comparison of gains
made over the period 1998 to 2015. The meat processing enterprises were
largely integrated plants (see Figure 13), with processing characteristics as
outlined in Table 8.
TABLE 8 - AUSTRALIAN MEAT ENTERPRISE CHARACTERISTICS IN THE 2015 STUDY
PARAMETER RANGE
Production 16 288 to 220 353 tCW/year
Animal mix Cattle only (9), mixed (3), small animal only (2)
Location New South Wales (3), Queensland (5), South Australia (2), Victoria (4)
Operations With rendering (12), without rendering (2)
The benchmark indicators (lowest, median and highest) for the plants represented
in Table 8 are provided in Figure 15.
8 Alexander, Ridoutt and Sanguansri, 2015
©depositphotos_racorn

28 BENCHMARKING STUDY
FIGURE 15 – AUSTRALIAN RESOURCE USE EFFICIENCY INDICATORS: 2015 STUDY
14 000
12 000
10 000
8 000
6 000
4 000
2 000
0
WATER UTILISATION(Litre/tonneCW)
Highest
Median
Lowest
1 200
1 000
800
600
400
200
0
ENERGY UTILISATION(kWh/tonneCW)
Highest
Median
Lowest
Australia's red meat processing sector reduced its water utilisation by 30% over 16 years, largely due to the impact of increased use of reused/recycled water.
Similar benchmark data was collected in Australia in 1998, 2003, 2009 and 2014.
The progression in indicators over this period is provided in Figure 16. It can be
observed from this data that over this 16-year period:
• Water utilisation fell from almost 12 kl/tCW to 8.5 kl/tCW. This represents a 30% overall reduction in water utilisation over 16 years. A significant impact on reduced water consumption was likely provided by an increased use of reused/recycled water.
• While energy utilisation reduction was more erratic, the overall reduction over the 16 years was around 12%.
• Solid waste data has been included to demonstrate how the red meat industry is able to respond when it is possible to focus on reducing a resource impact. Over the 16 years, the amount of solid waste disposed to landfill reduced by over 75% as plants concentrated on recycling solid waste.

29Resource Efficiency in Red Meat Abattoirs in South Africa
FIGURE 16 – VARIATION IN RESOURCE UTILISATION INDICATORS OVER TIME: AUSTRALIA5
14
12
10
8
6
4
2
01998 2003 2009 2014
kl/tCWWATER UTILISATION
1 200
1 000
800
600
400
200
01998 2003 2009 2014
kWh/tCWENERGY UTILISATION
30
25
20
15
10
5
01998 2003 2009 2014
kg/tCWSOLID WASTE TO LANDFILL
RESOURCE INDICATOR UNITS 1998 2003 2009 2014
WaterWater Utilization kl/tCW 11.8 10.6 9.4 8.6
Reuse & Recycling % NR NR 11 13
Energy Energy Utilization MJ/tCW 3 411 3 389 4 108 3 005
Energy Energy Utilization kWh/tCW 948 941 1 141 835
Solid waste Solid waste to landfill kg/tCW 26.7 11.3 5.9
GHG emissions GHG emissions intensity kg CO2e/tCW - 525 554 432
European Union (EU) Meat Processing Benchmark IndicatorsThe few European benchmark indicators which were reviewed are summarised in Table 9. It can be observed
from the table that the data provided in most cells indicates a wide range in results and there is little detail
on the enterprise departmental inclusions in the overall data. It is therefore considered that this information
is of limited use for comparison with South African enterprises. It should be noted, however, that the water
and energy consumption data cover ranges that are similar to the Australian data at the high end. It would be
expected that many meat processing enterprises in Europe are essentially “slaughter and chill” operations, with
a number of them also having fabrication operations. Very few European plants have rendering plants, as there
are many third-party rendering enterprises available to process organic waste material.

30 BENCHMARKING STUDY
TABLE 9 – EU RESOURCE IMPACT DATA: CATTLE, SHEEP AND PIG PROCESSING9
9 EU, 2005
PER TONNE CARCASE WEIGHT WATER CONSUMPTION (L) ENERGY CONSUMPTION (KWH) BOD EMISSION (KG)
CATTLE
Unloading/vehicle wash 200-320 0.4
Lairage 152-180 0.4-3.0
Slaughter
Bleeding
Hide removal 5
Head + hoof removal
Evisceration
Splitting 2.2
Chilling
Offal treatment
Intestine washing
Tripe washing 500-2 760
Cleaning
Total 1 623-9 000 90-1094 1.8-28
SHEEP
Unloading/vehicle wash
Lairage
Slaughter
Bleeding
Hide removal
Head + hoof removal
Evisceration 4-7 0.44
Splitting
Chilling
Offal treatment 1 667
Intestine washing
Tripe washing 278 0.33
Cleaning
Total 5 556-8 333 922-1 839 8.89
PIGS
Unloading +vehicle wash 78-290 0.3
Lairage 130-300
Slaughter 10-50
Bleeding 30-40 0.3
Skin removal 520-1 750
Scalding 150-156 17-39 0.23-0.26
Hair + toenail removal 78-120 0.91-2.2
Singeing 162-208 47-182
Rind treatment 260-460 1.25-2.21
Evisceration
Splitting 55 5.5
Chilling 0-226
Offal treatment
Intestine washing 442-680 0.98-3.25
Cleaning 325
Total 1 600-8 300 110-760 2.14-10

31Resource Efficiency in Red Meat Abattoirs in South Africa
FIGURE 17 - UK PIG SLAUGHTERHOUSE WATER CONSUMPTION10
Figure 17 provides a breakdown of water consumption in the United Kingdom (UK) pig slaughterhouses. This
indicates that around 7% of water is consumed in the scalding-dehairing process. This is consistent with the
estimates provided in section titled "Enterprise Benchmark Adjustment Schedule" on page 41.
New Zealand Benchmark IndicatorsThe New Zealand (NZ) meat processing sector conducted four benchmark projects between 1993 and 2011. These
studies were comprehensive and involved the installation of metering in plants to obtain improved data on
departmental consumption patterns.
A number of factors that impact on resource consumption do, however, need to be noted:
• Most plants in New Zealand operate in compliance with EU third-country processing requirements which are the most demanding processing conditions in relation to hygiene and sanitation.
• Most stock in New Zealand are washed pre-slaughter. Washing is conducted to ensure clean product with a long shelf life.
• Relative to other meat processing sectors, New Zealand processes a much higher proportion of small-stock, and uses more water for rough offal recovery and processing.
• Water supply is generally not an issue in New Zealand and therefore attracts a lower degree of management attention.
10 Atkins, 2000
200 000
180 000
160 000
140 000
120 000
100 000
80 000
60 000
40 000
20 000
0
Meat sprays & rinses31%Floor & equipment
cleaning 33%
Personal Hygiene 10%
Cooling Water 6%
Knife Sterilisation 5%
Scalding7%
Vehicle washing5%
Lairage washing3%

32 BENCHMARKING STUDY
TABLE 10 – NEW ZEALAND MEAT PROCESSING WATER UTILISATION
NZ MEAT PROCESSING WATER UTILISATION KL/TCW
1994/95 1995/96 2010/11
Potable water 26 27 21
Non-potable water 16 11 9
Total 42 37 31
Table 10 provides New Zealand data for water consumption for the three benchmark studies that have been
conducted. Observations that can be made in relation to the data in Table 10 include the following:
• Non-potable water is mostly used for livestock washing.
• Due to EU regulations, there is little reuse or recycled water used in New Zealand.
• Overall water consumption at over 30 kl/tCW is considerably higher than Australia at 8-10 kl/tCW and the EU at 1.6-9 kl/tCW,
• Even potable water consumption at over 20 kl/tCW is considerably higher than Australian and EU indicators.
TABLE 11 – NEW ZEALAND MEAT PROCESSING ENERGY UTILISATION
NZ MEAT PROCESSING THERMAL ENERGY UTILISATION - KWH/TCW
1993/94 1994/95 2001/02 2010/11
All surveyed 1 170 1 080 1 110 940
Rendering 1 440 1 420 1 440 1 280
Non-rendering 140 310 190 390
NZ MEAT PROCESSING ELECTRICITY UTILISATION - KWH/TCW
1993/94 1994/95 2001/02 2010/11
All surveyed 500 440 640 530
Rendering 560 530 690 610
Non-rendering 280 220 470 390
NZ MEAT PROCESSING TOTAL ENERGY UTILISATION - KWH/TCW
1993/94 1994/95 2001/02 2010/11
All surveyed 1 640 1 530 1 720 1 440
Rendering 2 000 1 940 2 140 1 890
Non-rendering 440 530 670 780
NZ MEAT PROCESSING THERMAL ENERGY UTILISATION - PERCENT OF TOTAL ENERGY
1993/94 1994/95 2001/02 2010/11
All surveyed 71% 71% 65% 65%
Rendering 72% 73% 67% 68%
Non-rendering 32% 58% 28% 50%
NZ MEAT PROCESSING ELECTRICAL ENERGY UTILISATION - PERCENT OF TOTAL ENERGY
1993/94 1994/95 2001/02 2010/11
All surveyed 30% 29% 37% 37%
Rendering 28% 27% 32% 32%
Non-rendering 64% 42% 70% 50%
The New Zealand industry has closely investigated energy consumption, and Table 11 and Table 12 provide analysis
of energy use distribution in New Zealand meat processing plants.

33Resource Efficiency in Red Meat Abattoirs in South Africa
TABLE 12 - ENERGY USE IN NEW ZEALAND MEAT PROCESSING PLANTS
THERMAL ENERGY USE IN A PLANT THAT INCLUDES RENDERING
Rendering process heat 75%
Hot water (Sourced from Rendering heat recovery) 35%
Other uses (space heating, etc.) 25%
ELECTRICITY USE IN A PLANT THAT INCLUDES RENDERING
Refrigeration plant room 40%
Freezers and stores 18%
Services (air, hot water, etc.) 12%
Air conditioning process areas 12%
Meat Chillers 8%
Rendering 8%
Other 2%
It can be noted from Table 11 that:
• In a fully integrated plant (including rendering), 68% of all energy consumed is thermal heat; however, this does not take into account the heat recovered from the rendering process which is used as hot water in the other processing departments.
• In a plant without rendering, only 50% of all energy consumed is thermal heat.
Table 12 indicates that 75% of thermal energy in a fully integrated processing
plant is used as rendering process heat (processing solid organic waste and
blood); however, around 35% of that heat is recovered and utilised to produce
hot water. Thermal heat used for hot water and other uses in New Zealand
therefore represents about 60% of total thermal use. Due to the colder climate in
New Zealand, more thermal energy is used for space heating; however, from this
analysis it is apparent that 40-50% of thermal energy in a fully integrated plant
is used for rendering blood and organic waste after subtracting the amount
of heat recovered for hot water. The 40-50% rendering utilisation of energy is
consistent with the adjustment table provided in Table 20.
Benchmark data was collected in New Zealand in 1993/94, 1994/95, 2001/02 and
2010/11. The progression in indicators over this period is provided in Figure 18.
IT CAN BE OBSERVED FROM THE NEW ZEALAND DATA THAT OVER THIS 17-YEAR PERIOD:
• Water utilisation fell from almost 42 kl/tCW to 30 kl/tCW. This represents a 28% overall reduction in water utilisation over 17 years. This has essentially been achieved through a reduction in the amount of water used for livestock washing and the adoption of water efficiency practices, including more efficient sterilisation and washing equipment, installation of interlock controls and monitoring systems, and the adoption of centralised detergent/sanitation systems.
• While energy utilisation reduction was more erratic, the overall reduction over the 17 years was around 12%. This is considered to be due to more efficient refrigeration practices, including chiller cycle control, the adoption of plate versus blast freezing, and improved electronic load control.

34 BENCHMARKING STUDY
FIGURE 18 – VARIATION IN RESOURCE UTILISATION INDICATORS OVER TIME: NEW ZEALAND11
45
40
35
30
25
20
15
10
5
01993/94 1994/95 2001/02 2010/11
kl/tCWWATER UTILISATION
2 000
1 500
1 000
500
01993/94 1994/95 2001/02 2010/11
Non-Potable Water (kl/tCW)
Potable Water (kl/tCW)
kWh/tCWENERGY UTILISATION
Electricity Utilization (kWh/tCW)
Thermal Energy Utilization (kWh/tCW)
RESOURCE INDICATOR UNITS 1993/94 1994/95 2001/02 2010/11
WaterPotable Water kl/tCW 26 27 NR 21
Non-Potable Water kl/tCW 16 11 NR 9
Thermal Energy Thermal Energy Utilization kWh/tCW 1 170 1 080 1 110 940
Electricity Electricity Utilization kWh/tCW 500 440 640 530
Total Energy Energy Utilization kWh/tCW 1 640 1 530 1 720 1 440
International Electricity, Fuel and Water Price IndicatorsInternational foreign exchange (forex) rates are volatile and therefore, to provide indicative international cost
benchmarks for water and energy use in meat processing industries, there is a need to determine indicative
energy and water prices to be used as multipliers.
FIGURE 19 - GLOBAL ELECTRICITY PRICES (DEC 2019)12
11 Kemp, 201112 Global Petrol Prices, 2020
3.50
3.00
2.50
2.00
1.50
1.00
0.50
0.00Australia New Zealand Brazil New India USA South Africa
Medium firm Large firm Extra large firm
RA
ND
/KW
H

35Resource Efficiency in Red Meat Abattoirs in South Africa
Figure 19 provides indicative electricity prices as at December 2019 for Australia, Brazil, India, New Zealand,
South Africa and the United States of America (USA), converted to Rand/kWh. It can be observed from Figure
19 that South African electricity prices at that time (rand to dollar exchange rate of R14.5:US$1) were less than
half the cost in Australia and New Zealand. This price advantage goes some way to explaining the greater use of
electrical hot water heating in South Africa compared with Australia and New Zealand that utilise thermal fuels
more for hot water heating (including indirect heating through heat recovery from rendering).
On the basis of the indicative prices provided in Figure 19, the Benchmark Tool was developed using the following assumptions to generate the international benchmark cost indicators (note that in the Benchmark Tool, these prices have been adjusted according to the ruling forex rate in April 2020):
• A low electricity price of R1.90/kWh
• A medium electricity price of R2.90/kWh
• A high electricity price of R3.90/kWh.
FIGURE 20 - INTERNATIONAL LNG PRICES13
Figure 20 provides indicative Liquefied Natural Gas (LNG) prices in Australian dollars over the period 2013 to 2020.
The major fuel used in the Australian meat processing industry is natural gas. It can be observed from Figure 20
that during 2019, the LNG spot price for Australian gas varied between $A8.00 and $A10.00/GJ.
Table 13 provides a conversion table converting $A/GJ to R/kWh.
TABLE 13 – AUSTRALIAN COST OF GAS10
AUSTRALIAN GAS COST $A/GJ $A/KWH R/KWH
Gas Cost - Low $8.00 $0.0288 R0.2883
Gas Cost - High $10.00 $0.0360 R0.3604
13 Rios, 2019
Australia New Zealand Brazil New India USA South Africa
Medium firm Large firm Extra large firm
8/14/2013 12/27/2014 5/10/2016 9/22/2017 2/5/2019 6/18/2020
25
20
15
10
5
0
AU
D/G
J
AUSTRALIAN GAS PRICES VERSUS OTHERS
N-E Asia LNG spot Henry Hub AU Spot

36 BENCHMARKING STUDY
On the basis of the indicative prices in Table 13, the Benchmark Tool has been constructed using the assumptions that the international benchmark cost indicators are as follows (note that in the Benchmark Tool, these prices have been adjusted according to the ruling forex rate in April 2020):
• A low LNG price of R0.23/kWh
• A medium LNG price of R0.34/kWh
• A high LNG price of R0.41/kWh.
The cost of water is highly variable in all countries of interest, depending on whether water can be sourced
from local ground water or needs to be purchased from the local supply authority. Similarly, wastewater costs
vary as rural enterprises are often able to treat and dispose treated wastewater by evaporation or irrigation,
whereas enterprises located in urban areas commonly need to discharge treated wastewater into sewers and
incur wastewater discharge charges. Table 14 provides indicative costs associated with purchasing water from a
supply authority, discharging to sewer and incurring discharge fees in Australia.
TABLE 14 - AUSTRALIAN COST OF WATER AND WASTEWATER14
AUSTRALIAN WATER COST $A/KL R/KL
Cost of water supply 0.85 8.5
Cost of discharge to sewer 1.39 13.9
On the basis of the indicative prices in Table 14, the Benchmark Tool has been constructed using the assumptions that the international benchmark cost indicators are as follows (note that in the Benchmark Tool, these prices have been adjusted according to the ruling forex rate in April 2020):
• Assuming ground water supply – R0.13/kl
• Assuming third party supply – R8.50/kl
• Assuming on-site treatment and disposal – R0.90/kl
• Assuming on-site treatment and disposal to sewer – R17.60/kl.
Water Utilisation BenchmarksSurveys of water consumption in meat processing plants show considerable variation between enterprises.
Factors that affect water consumption include:
• Final products produced – e.g. chilled carcases/quarters, bone-in product, boneless product, and chilled red and rough offal for domestic consumption versus packed frozen product for export.
• Operating format and cleaning practices – the impact of shift operation and use of rinsing versus cleaning and sanitising.
• Processing operations included on-site (see 'Process Variation and the Impact on Resource Utilisation').
• Level of hygiene compliance – plants processing long shelf-life, chilled, vacuum-packed products use more water, while processing plants which produce meat for export often have stricter hygiene requirements and therefore consume more water for cleaning and sanitising than domestic operations.
14 IPART, 2018

37Resource Efficiency in Red Meat Abattoirs in South Africa
In abattoirs, water is used for numerous purposes, including:
• Livestock watering and washing
• Livestock yards cleaning
• Truck washing
• Scalding and polishing of pigs
• Washing and cleaning of red and rough offal and carcases
• Cleaning and sterilising of knives and equipment
• Cleaning floors, work surfaces, equipment etc., both during operations and end-of-day cleaning and sanitation
• Transport of certain by-products and waste
• Make-up water for boilers
• Cooling of machinery (compressors, condensers etc.).
Table 15 provides a summary of data from industry surveys on water consumption as a basis of units of production
and demonstrates the high variability in results, with most datasets demonstrating multipliers of 2-5 times
between low and high consumption.
TABLE 15 - WATER CONSUMPTION PER UNIT OF PRODUCTION
COUNTRY KL/TCW KL/TCW KL/T MEAT L/HEAD
US (1984)15 4.2 – 16.7 4 – 12
UK (1980)13 5 – 15
Europe (1979)13 5 – 10
Hungary (1984)13 2 – 3.8
Germany (1992)13 0.8 – 6.2
Australia (1995)16
Australia (1998)17 6 – 15
Denmark (pigs) 5 – 2018 22519
Denmark (cattle) 4 – 1716 86017
The data in Table 16, although somewhat dated (1992-1995), provides a sound indication of the breakdown of
water consumption across different departments in meat processing enterprises and also provides some
comparison of the differences between cattle and pig processing.
15 Johns, 1993 – As quoted from Eco Efficiency Manual Reference 1216 MLA, 1995 – As quoted from Eco Efficiency Manual Reference 1217 MLA, 1998 – As quoted from Eco Efficiency Manual Reference 1218 Hansen & Mortensen, 1992 – As quoted from Eco Efficiency Manual Reference 1219 Hansen, 1997 – As quoted from Eco Efficiency Manual Reference 12

38 BENCHMARKING STUDY
TABLE 16 - BREAKDOWN OF WATER CONSUMPTION
AUSTRALIAN SURVEY DATA20 DANISH SURVEY DATA21
Purpose General Purpose Pig Cattle
Stockyard wash-down and stock watering 7 – 22% Livestock receipt and holding 8% 22%
Slaughter, evisceration and boning 44 – 60% Slaughter 32% 28%
Casings processing 9 – 20% Casings processing 24% 21%
Inedible and edible offal processing 7 – 38% Scalding (pigs) 3% NA
Rendering 2 – 8% Hair removal (pigs) 8% NA
Domestic-type uses 2 – 5% Dressing (cattle) NA 22%
Chillers 2% Cleaning 25% 7%
Boiler losses 1 – 4%
Table 17 provides an assessment of the percentage of water consumption by operational departments in a fully
integrated meat processing operation in Australia.
TABLE 17 - DEPARTMENTAL WATER CONSUMPTION22
KEY AREAS OF WATER CONSUMPTION
PERCENTAGE OF TOTAL FRESHWATER
CONSUMPTION
FLOW VOLUME
STRENGTH
Stockyards and truck washing 7 - 24% Medium High
Slaughter and evisceration 44 - 60%High High
Inedible and edible offal processing 9 - 20%
Boning 7 - 38% Low Medium
Casing processing 2 - 8% Medium High
Rendering 2 - 8% Low Very High
Chillers 2%
Low LowBoiler losses 1 - 4%
Amenities 2 - 5%
Table 18 provides a more detailed breakdown of water consumption based on a collation of data from MLA, 1995b
and internal data of the UNEP Working Group for Cleaner Production.
20 MRC, 1995 – As quoted from Eco Efficiency Manual Reference 1221 Hansen and Mortensen, 1992 – As quoted from Eco Efficiency Manual Reference 1222 GHD Pty Ltd, 2005 – As quoted from Eco Efficiency Manual Reference 12
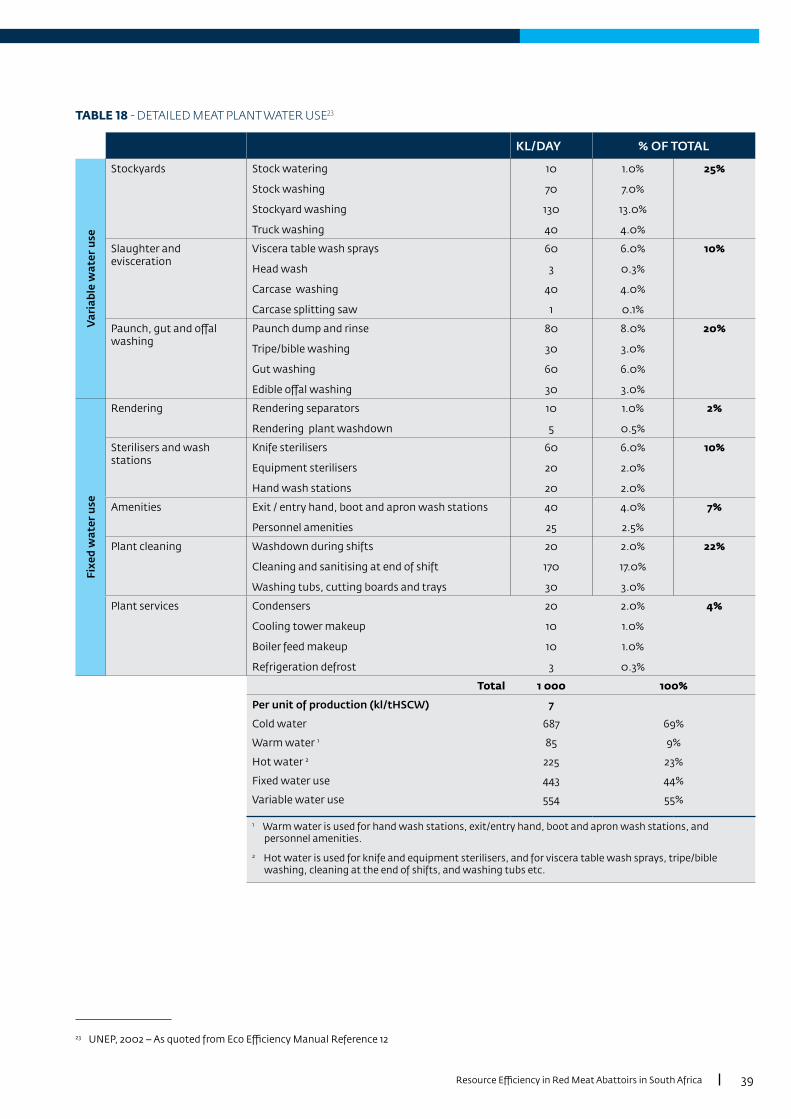
39Resource Efficiency in Red Meat Abattoirs in South Africa
TABLE 18 - DETAILED MEAT PLANT WATER USE23
KL/DAY % OF TOTAL
Var
iabl
e w
ater
use
Stockyards Stock watering
Stock washing
Stockyard washing
Truck washing
10
70
130
40
1.0%
7.0%
13.0%
4.0%
25%
Slaughter and evisceration
Viscera table wash sprays
Head wash
Carcase washing
Carcase splitting saw
60
3
40
1
6.0%
0.3%
4.0%
0.1%
10%
Paunch, gut and offal washing
Paunch dump and rinse
Tripe/bible washing
Gut washing
Edible offal washing
80
30
60
30
8.0%
3.0%
6.0%
3.0%
20%
Fixe
d w
ater
use
Rendering Rendering separators
Rendering plant washdown
10
5
1.0%
0.5%
2%
Sterilisers and wash stations
Knife sterilisers
Equipment sterilisers
Hand wash stations
60
20
20
6.0%
2.0%
2.0%
10%
Amenities Exit / entry hand, boot and apron wash stations
Personnel amenities
40
25
4.0%
2.5%
7%
Plant cleaning Washdown during shifts
Cleaning and sanitising at end of shift
Washing tubs, cutting boards and trays
20
170
30
2.0%
17.0%
3.0%
22%
Plant services Condensers
Cooling tower makeup
Boiler feed makeup
Refrigeration defrost
20
10
10
3
2.0%
1.0%
1.0%
0.3%
4%
Total 1 000 100%
Per unit of production (kl/tHSCW) 7
Cold water 687 69%
Warm water 1 85 9%
Hot water 2 225 23%
Fixed water use 443 44%
Variable water use 554 55%
1 Warm water is used for hand wash stations, exit/entry hand, boot and apron wash stations, and personnel amenities.
2 Hot water is used for knife and equipment sterilisers, and for viscera table wash sprays, tripe/bible washing, cleaning at the end of shifts, and washing tubs etc.
23 UNEP, 2002 – As quoted from Eco Efficiency Manual Reference 12

40 BENCHMARKING STUDY
Energy Utilisation BenchmarksTable 19 provides an analysis of energy use in an integrated meat processing enterprise.
The data in Table 19 has been used to provide adjustment guidelines so that benchmarks can be based on actual
enterprise operating departments. The resulting departmental adjustments are provided in Table 20. Although
the raw data in Table 19 is somewhat dated (2002), the percentages are unlikely to have changed in any significant
way and they have been used as the basis to construct Table 18.
TABLE 19 - DETAILED MEAT PLANT ENERGY USE24
HOT WATER
Areas of hot water use MJ/day Percent of total hot water use
Percent of total thermal energy
Knife and equipment sterilisers 30 000 34% 10%
Hand wash stations 5 000 6% 2%
Slaughter and evisceration 15 000 17% 5%
Plant cleaning 25 000 28% 8%
Amenities 5 000 6% 2%
Tripe / bible washing 2 000 2% 1%
Hook wash tanks 1 000 1% 0%
Heat loss from hot water pipes 5 000 6% 2%
Total 88 000 100%
STEAM
Areas of steam use t steam/day MJ/day Percent of total steam use
Rendering 54 150 000 70% 50%
Hot water production 10 28 000 13% 9%
Blood processing 7 20 000 9% 7%
Tallow processing 2 5 000 2% 2%
Heat loss from steam pipes 4 10 000 5% 3%
Total 77 213 000 100% 100%
ELECTRICITY
Areas of electricity use kWh/day MJ/day Percent
Refrigeration 22 222 80 000 68%
Motors (pumps, fans, conveyors etc.) 15 000 25 000 21%
Lighting 833 3 000 3%
Air compression 2 778 10 000 8%
Total 40 833 118 000 100%
TOTAL ENERGY USE
Energy Use GJ/tHSCW MJ/day Percent
Thermal 1.6 236 667 67%
Electricity 0.8 118 000 33%
Total energy input 2.4 354 667 100%
24 UNEP, 2002 – As quoted from Eco Efficiency Manual Reference 12

41Resource Efficiency in Red Meat Abattoirs in South Africa
Enterprise Benchmark Adjustment ScheduleOn the basis of interpretation of this water and energy data, Table 20 has been constructed to represent “best
estimate” average water and energy consumption by operating department. Table 20 is used in the Benchmark
Tool to make adjustments to accommodate South African meat processing enterprises with a different mix of
operational departments.
TABLE 20 - DEPARTMENTAL ENERGY AND WATER CONSUMPTION ADJUSTMENTS
THERMAL ENERGY
ELECTRICITY TOTAL ENERGY WATER
Percent Percent Percent Percent
Stockyards 0% 1% 1% 20%
Slaughter and Evisceration 25% 15% 23% 35%
Hide Processing 0% 1% 1% 1%
Blood Processing 6% 1% 4% 1%
Rendering 45% 10% 30% 5%
Paunch Processing 5% 1% 4% 20%
Offal Washing 5% 1% 4% 5%
Wastewater Treatment 1% 3% 2% 0%
Chilling 5% 35% 15% 1%
Boning 3% 5% 4% 10%
Packaging 0% 2% 2% 1%
Freezing 5% 25% 10% 1%
100% 100% 100% 100%
The majority of the recent international benchmark information relates to beef and small-stock processing.
In Australia and New Zealand, the greater majority of livestock are processed in single species plants, due to
the significant export orientation and the need to comply with Halal requirements, whereby pig processing is
almost always conducted at dedicated pork enterprises. In South Africa, there are dedicated pork plants as well
as many other plants processing multi-species, including pigs. To allow for this circumstance, an adjustment
has been considered necessary to account for the energy and water used in the scalding and dehairing process
associated with pig processing.
Table 21 provides data on the utilisation of water and energy associated with scalding and dehairing pork carcases.
TABLE 21 - INPUT AND OUTPUT DATA FOR PIG SCALDING & DEHAIRING PER HEAD25
INPUTS OUTPUTS
Item Quantity Item Quantity
Bled pig carcase 95 kg De-haired pig carcase 93 kg
Water 60 l Wastewater 60 l
Oil 0.6 l BOD5 0.3 kg
Gas (if used instead of oil) 0.5 m3 Pig hair & Scrapings 2 kg
The data from Table 21 is therefore used in the Benchmark Tool to adjust the
international and South African reference benchmarks to allow for the variation
caused due to scalding and dehairing during pig processing.
25 COWI Consulting Engineers & Planners, 2000
FROM TABLE 21 IT CAN BE ESTIMATED THAT FOR PORK SCALDING AND DEHAIRING THE:
• Extra water is about 60 l/head or 600 l/tCW (120 l/SU)
• Extra energy use is around 6 kWh/head or 60 kWh/tCW (12 kWh/SU) – assuming the calorific value for gas is 12 kWh/m3.

42 BENCHMARKING STUDY
International Benchmark SummaryTaking the above analysis into account, the international benchmarks used in the Benchmark Tool are
summarised in Table 22, which provides indicators on the basis of SU and tCW for:
• Fully Integrated plants (including rendering)
• Slaughter, Chill and Bone plants (no rendering)
• Slaughter and Chill operations.
TABLE 22 – INTERNATIONAL BENCHMARK SUMMARY
INTERNATIONAL BENCHMARKS - SLAUGHTER UNIT BASIS
KEY PERFORMANCE INDICATOR BASED ON SLAUGHTER UNIT (SU)
FULLY INTEGRATED PLANT (INC RENDERING)
Lowest Median Highest
Total water used (kl) 1 100 1 500 2 800
Total volume discharge (kl) 900 1 300 2 400
Total energy used (kWh) 100 200 200
KEY PERFORMANCE INDICATOR BASED ON SLAUGHTER UNIT (SU)
SLAUGHTER CHILL BONE PLANT (NO RENDERING)
Lowest Median Highest
Total water used (kl) 1 000 1 400 2 700
Total volume discharge (kl) 900 1 200 2 300
Total energy used (kWh) 100 100 200
KEY PERFORMANCE INDICATOR BASED ON SLAUGHTER UNIT (SU)
SLAUGHTER & CHILL PLANT
Lowest Median Highest
Total water used (kl) 900 1 200 2 300
Total volume discharge (kl) 700 1 100 1 900
Total energy used (kWh) 100 100 100
FINANCIAL Lowest Median Highest
Cost / kWh Electrical including demand charges (R/kWh) R1.50 R2.30 R3.10
Cost / kWh Thermal (R / kWh) R0.18 R0.27 R0.36
Cost of water purchase (R/kl) R0.10 R4.30 R8.50
Cost of water discharge including penalties (R/kl) R0.90 R7.40 R13.90

43Resource Efficiency in Red Meat Abattoirs in South Africa
INTERNATIONAL BENCHMARKS - CARCASE WEIGHT BASIS
KEY PERFORMANCE INDICATOR BASED ON CARCASE WEIGHT (tCW)
FULLY INTEGRATED PLANT (INC RENDERING)
Lowest Median Highest
Total water used (kl) 5 000 7 000 13 000
Total volume discharge (kl) 4 200 6 000 11 000
Total energy used (kWh) 470 840 1 100
KEY PERFORMANCE INDICATOR BASED ON CARCASE WEIGHT (tCW)
SLAUGHTER CHILL BONE PLANT (NO RENDERING)
Lowest Median Highest
Total water used (kl) 4 700 6 600 12 200
Total volume discharge (kl) 4 000 5 600 10 400
Total energy used (kWh) 310 550 730
KEY PERFORMANCE INDICATOR BASED ON CARCASE WEIGHT (tCW)
SLAUGHTER&CHILL PLANT
Lowest Median Highest
Total water used (kl) 4 050 5 700 10 500
Total volume discharge (kl) 3 400 4 850 8 900
Total energy used (kWh) 230 410 540
FINANCIAL Lowest Median Highest
Cost / kWh Electrical including demand charges (R/kWh) R1.50 R2.30 R3.10
Cost / kWh Thermal (R / kWh) R0.18 R0.27 R0.36
Cost of water purchase (R/kl) R0.10 R4.30 R8.50
Cost of water discharge including penalties (R/kl) R0.90 R7.40 R13.90
©depositphotos_debstheleo

44 BENCHMARKING STUDY©depositphotos_Anna_Shepulova

45Resource Efficiency in Red Meat Abattoirs in South Africa
South African Benchmarks
Data LimitationsObtaining the right resource use and cost data is an essential step in
understanding resource efficiency performance. Most meat processing
operations have data for labour, electricity, fuel and water, as the cost and
quantity of these resources are well known and tracked by the enterprise (or
can be obtained from invoices and accounting information). Data is less reliable
for departmental consumption (unless internal metering is in place), and for
organic and solid waste disposal.
Meat processing operations use a variety of methods to dispose of wastewater.
Enterprises in South Africa generally treat and dispose of wastewater to
municipal trade waste, or treat and dispose of water by irrigation onto nearby
pastoral land. In some instances, enterprises reuse the treated wastewater in
areas where potable water is not required, including wash yards, initial truck
rinse, on-site irrigation, etc. The variation in wastewater treatment methods
means that the data presented on wastewater volumes and quality is less
reliable than the data on water and energy use.
South African Slaughter Units and Carcase WeightsIn South Africa, meat processing enterprises monitor production levels based on
SUs and metric tonnes carcase weight.
However, the SU relationships are based on a measure initially designed to
indicate the capacity of carcase chilling facilities in meat processing enterprises.
As a result, production measurement based on SU is considered less accurate
than production measurement based on tCW.
4AN SU IS THE NUMBER OF NON-BOVINE SPECIES CONSIDERED EQUIVALENT TO ONE BOVINE ANIMAL. THE RELATIONSHIP IS ACCORDING TO THE FOLLOWING CONVERSIONS:
• One cattle animal equals one SU
• Two pigs equal one SU
• Six sheep, goats or mixed small-stock equal one SU.
©depositphotos_antiksu

46 BENCHMARKING STUDY
Some South African enterprises do not record carcase
weights as they are essentially a service process for third
parties.
As a result, processing plants do not have good records
of average carcase weights processed, but they all have
good records of numbers processed by species.
To determine production based on tCW for those that
do not have average carcase weight data, it is necessary
in the Benchmark Tool to use default carcase weights.
Figure 21 provides average carcase weights for the
period 1961-2017 as recorded by the Food and Agriculture
Organization of the United Nations – Food and
agriculture data (FAOSTAT).
The following default carcase weights have therefore
been assumed in the Benchmark Tool so that every
plant could be provided with benchmark data on the
basis of both SU and tCW:
• Average cattle carcase weight – 280 kg
• Average pig carcase weight – 80 kg
• Average sheep carcase weight – 25 kg
• Average goat carcase weight – 15 kg.
350
300
250
200
150
100
50
02000 2005 2010 2015
KG
/HEA
D
CATTLE
100.0
80.0
60.0
40.0
20.0
0.02000 2005 2010 2015
KG
/HEA
D
PIG
40.0
30.0
20.0
10.0
0.02000 2005 2010 2015
KG
/HEA
D
SHEEP & GOAT
Sheep Yield/Carcase Weight Goat Yield/Carcase Weight
FIGURE 21 – SOUTH AFRICAN CARCASE WEIGHTS

47Resource Efficiency in Red Meat Abattoirs in South Africa
Figure 22 provides a profile of the relationship between SU and tCW for South
African plants. It can be observed from Figure 22 that the relationship between
SU and tCW varies between 3.6 SU/tCW and 6.7 SU/tCW. This variable relationship
will have some impact on individual plant SU versus tCW benchmarks. In relation
to the international benchmarks, a weighted average of the relationship has been
employed to convert the international benchmark data to South African SUs.
FIGURE 22 - SLAUGHTER UNIT TO CARCASE WEIGHT CONVERSION
Participating Plant ProfileTable 23 provides a series of activities undertaken by plants that have participated in the Benchmark project.
TABLE 23 - PARTICIPATING PLANT PROFILE
PLANT PROFILES
Facility Slaughter & Chill 50% Slaughter, Chill & Bone 36% Fully Integrated 14%
Shifts Single Shift 93% Double Shift 7%
Offal Processing Trim & Rinse 79% Pack & Freeze 14% Combination 7%
Water Heating Steam 50% Electricity 50%
Refrigeration Hydrocarbon 79% Ammonia 21%
Blood Disposal Wastewater 57% Compost 21% Dried 14% Land 7%
Wastewater Disposal Irrigation 50% Sewer 43% Surface water 7%
A number of observations in relation to the impact on benchmark outcomes can be associated with the
different operations outlined in Table 23. These impacts are detailed in Table 24.
SU VERSUS TONNES PRODUCTION (tCW)
Due to the variability of the SU/tCW, relationship, Benchmark comparisons based on Production Unit (tCW) are considered to be more accurate indicators compared to those based on SUs.
400 000
350 000
300 000
250 000
200 000
150 000
100 000
50 000
0
8.0
7.0
6.0
5.0
4.0
3.0
2.0
1.0
0.0
SUs per Annum SU/tCW
SU/T
CW R
ATIO
SU P
ER A
NN
UM
WEIGHTED AVERAGE - 4.6SU/TCW

48 BENCHMARKING STUDY
TABLE 24 - IMPACT OF PLANT OPERATION ON BENCHMARK OUTCOMES
OPERATION BENCHMARK IMPACT
Facility A Fully Integrated plant uses a lot more specific energy (kWh/SU) than a Slaughter, Chill and Bone operation due to rendering, blood processing and the use of steam for water heating. A Slaughter and Chill plant uses even less energy due to the absence of boning processes, and lower or no need for refrigeration, chilling, freezing and storage of packaged product.
A Fully Integrated plant only uses marginally more specific water (kl/SU) than a Slaughter, Chill and Bone operation since the major water uses are associated with slaughter, chill and boning operations. A Slaughter and Chill operation uses less water as use associated with boning operations and cleaning is absent.
The relationship between facility operation, and utilisation of energy and water is profiled in Table 25.
Shift Operation A double shift operation uses less water per production unit than a single shift operation since a rinse is performed between shifts rather than a full clean-down.
Offal Processing
Plants that simply trim and rinse offal material before despatch to market use less water and energy than plants that trim, wash, process, pack, chill and freeze offal.
Water Heating Plants that use steam for water heating will use significantly more thermal energy than those that use electricity, and this is due to heat losses associated with boiler operation (flue gas losses) and heat losses from the distribution network.
Refrigeration Centralised ammonia refrigeration plants are more energy efficient than distributed hydrocarbon refrigeration installations.
Blood Disposal Plants that discharge blood to wastewater will have a significantly higher COD on discharge due to the oxygen demand associated with the blood.
Wastewater Disposal
Plants that can discharge to irrigation are able to take advantage of the water and nutrients (nitrogen and phosphorous) to not only minimise discharge costs but also generate income from farming operations. Plants that discharge to sewers incur significant costs associated with trade waste charges.
TABLE 25 - RELATIONSHIP BETWEEN ENERGY AND WATER UTILISATION AND PLANT OPERATION
THERMAL ENERGY
ELECTRICITYTOTAL
ENERGYWATER
Percent Percent Percent Percent
SLAUGHTER & CHILL 41% 57% 50% 82%
SLAUGHTER, CHILL & BONE 49% 89% 66% 94%
FULLY INTEGRATED 100% 100% 100% 100%
Results of Data AnalysisThe benchmark data has been represented graphically in Figures 24-26 and Figures 28-33. In these charts, the
range of data is presented with colour changes representing the median point of the data. Plants with utilisation
above the median are those that have a greater opportunity to achieve savings than those that are below the
median.
Water and Effluent Utilisation and Cost
Figure 23 provides graphical representations of median South African benchmarks based on SUs and carcase
weight for Fully Integrated; Slaughter, Chill and Bone; and Slaughter and Chill operations for:
Water Supply Source (by municipal, borehole, rainwater, river and recycled water). Municipal is the biggest
supplier of water, with borehole supply second. The use of rainwater, river water and recycled water is negligible.
Departmental Water Usage (by pre-slaughter, slaughter, offal, post-slaughter cleaning and other processes).
The Slaughter department is the biggest user of water, while the other four departments use similar quantities
per production unit.

49Resource Efficiency in Red Meat Abattoirs in South Africa
FIGURE 23 - WATER SOURCE AND USAGE BENCHMARKS
1 200
1 000
800
600
400
200
0South African Benchmark
FULLY INTEGRATED
Water Source (Litre/SU)
Water Usage (Litre/SU) 1 200
1 000
800
600
400
200
0South African Benchmark
SLAUGHTER, CHILL & BONE
Water Source (Litre/SU)
Water Usage (Litre/SU) 1 200
1 000
800
600
400
200
0South African Benchmark
SLAUGHTER, CHILL
Water Source (Litre/SU)
Water Usage (Litre/SU)
SLAUGHTER UNIT BASIS
Detailed benchmark results for water consumption and cost for Fully Integrated; Slaughter, Chill and Bone; and
Slaughter and Chill enterprises are provided in Table 26. The table provides lowest, median and highest benchmark
results on an SU basis. A full set of results also providing carcase weight data is provided in Annex 1 (Table 28).
TABLE 26 - WATER BENCHMARK RESULTS
KPI BASED ON SLAUGHTER UNIT (SU)
INTERNATIONAL BENCHMARKS - SLAUGHTER UNIT BASIS SOUTH AFRICAN BENCHMARKS - SLAUGHTER UNIT BASIS
FULLY INTEGRATED PLANT (INC RENDERING) FULLY INTEGRATED PLANT (INC RENDERING)
Lowest Median Highest Lowest Median HighestTotal water used (litre/SU) 1 087 1 522 2 826 700 1 000 2 600Water cost (purchase & discharge) (R/SU) 1 22 72 1 15 90
KPI BASED ON SLAUGHTER UNIT (SU)
SLAUGHTER CHILL BONE PLANT (NO RENDERING) SLAUGHTER CHILL BONE PLANT (NO RENDERING)
Lowest Median Highest Lowest Median Highest
Total water used (litre/SU) 1 011 1 413 2 630 650 930 2 400
Water cost (purchase & discharge) (R/SU) 1 20 67 1 13 85
KPI BASED ON SLAUGHTER UNIT (SU)
SLAUGHTER & CHILL SLAUGHTER & CHILL
Lowest Median Highest Lowest Median HighestTotal water used (litre/SU) 870 1 239 2 283 590 810 2 100Water cost (purchase & discharge) (R/SU) 1 16 59 1 12 75
5 000
4 500
4 000
3 500
3 000
2 500
2 000
1 500
1 000
500
0South African Benchmark
FULLY INTEGRATED
Water Source (litre/Metric
Ton CW)
South African Benchmark
SLAUGHTER, CHILL & BONE
South African Benchmark
SLAUGHTER, CHILL
Water Usage (litre/Metric
Ton CW)5 000
4 500
4 000
3 500
3 000
2 500
2 000
1 500
1 000
500
0
Water Source (litre/Metric
Ton CW)
Water Usage (litre/Metric
Ton CW)5 000
4 500
4 000
3 500
3 000
2 500
2 000
1 500
1 000
500
0
Water Source (litre/Metric
Ton CW)
Water Usage (litre/Metric
Ton CW)
Municipal Borehole Recycled
Rainwater River
Pre-Slaughter Slaughter Post-Slaughter Cleaning
Offal Other
CARCASE WEIGHT BASIS

50 BENCHMARKING STUDY
Figure 24 provides graphical representations of the range of South African and international benchmarks for
water consumption and water cost (supply and discharge) based on SUs and carcase weight for Fully Integrated;
Slaughter, Chill and Bone; and Slaughter and Chill operations.
FIGURE 24 - WATER CONSUMPTION AND WATER COST BENCHMARKS
3 000
2 500
2 000
1 500
1 000
500
0
Inte
rnat
iona
l B
ench
mar
k
Sout
h A
fric
an
Ben
chm
ark
FULLY INTEGRATED SLAUGHTER, CHILL & BONE SLAUGHTER, CHILL
SLAUGHTER UNIT BASIS
100
90
80
70
60
50
40
30
20
10
0
Inte
rnat
iona
l B
ench
mar
k
Sout
h A
fric
an
Ben
chm
ark
3 000
2 500
2 000
1 500
1 000
500
0
Inte
rnat
iona
l B
ench
mar
k
Sout
h A
fric
an
Ben
chm
ark
100
90
80
70
60
50
40
30
20
10
0In
tern
atio
nal
Ben
chm
ark
Sout
h A
fric
an
Ben
chm
ark
3 000
2 500
2 000
1 500
1 000
500
0
Inte
rnat
iona
l B
ench
mar
k
Sout
h A
fric
an
Ben
chm
ark
100
90
80
70
60
50
40
30
20
10
0
Inte
rnat
iona
l B
ench
mar
k
Sout
h A
fric
an
Ben
chm
ark
Water Consumption (Litre/SU)
Water Cost (Rand/SU)
Water Consumption (Litre/SU)
Water Cost (Rand/SU)
Water Consumption (Litre/SU)
Water Cost (Rand/SU)
14 000
12 000
10 000
8 000
6 000
4 000
2 000
0
Inte
rnat
iona
l B
ench
mar
k
Sout
h A
fric
an
Ben
chm
ark
FULLY INTEGRATED SLAUGHTER, CHILL & BONE SLAUGHTER, CHILL
CARCASE WEIGHT BASIS
450
400
350
300
250
200
150
100
50
0
Inte
rnat
iona
l B
ench
mar
k
Sout
h A
fric
an
Ben
chm
ark
Inte
rnat
iona
l B
ench
mar
k
Sout
h A
fric
an
Ben
chm
ark
Inte
rnat
iona
l B
ench
mar
k
Sout
h A
fric
an
Ben
chm
ark
Inte
rnat
iona
l B
ench
mar
k
Sout
h A
fric
an
Ben
chm
ark
Inte
rnat
iona
l B
ench
mar
k
Sout
h A
fric
an
Ben
chm
ark
Water Consumption (litre/Metric
Ton CW)
Water Cost (Rand/Metric
Ton CW)
14 000
12 000
10 000
8 000
6 000
4 000
2 000
0
450
400
350
300
250
200
150
100
50
0
Water Consumption (litre/Metric
Ton CW)
Water Cost (Rand/Metric
Ton CW)
14 000
12 000
10 000
8 000
6 000
4 000
2 000
0
450
400
350
300
250
200
150
100
50
0
Water Consumption (litre/Metric
Ton CW)
Water Cost (Rand/Metric
Ton CW)

51Resource Efficiency in Red Meat Abattoirs in South Africa
It can be observed from the charts that:
• The range per production unit is similar for the international and South African benchmarks for water consumption; however, the South African benchmarks are somewhat lower (by 15-30%) than international figures. This is expected due to higher food safety compliance for Australian and New Zealand plants to meet predominantly export conditions, and the lower use of water for offal processing in South Africa due to trim and rinse for local supply rather than fully processed, packaged and refrigerated product for Australia and New Zealand due to low domestic demand for these items.
• The water cost per unit of production varies widely between lower-end enterprises that are able to source borehole water and dispose wastewater to irrigation, and higher-end enterprises that source water from municipal potable supply, discharge to sewer and incur trade waste charges. The high water cost per unit of production in South Africa appears to be driven by higher charges associated with municipal supply and disposal to sewers.
Effluent Quality
Figure 25 provides the range of water quality parameters (COD
and TDS collected in the South African benchmark survey).
The wide range of COD results from the low COD levels being
associated with plants that perform primary and secondary
treatment processes prior to disposal, while the high COD
plants include blood disposal in the wastewater and discharge
to sewer without treatment.
TDS levels in abattoir wastewater are highly associated with
the TDS level of the incoming water. Low TDS levels would be
associated with surface water supplied either directly or via
a municipality, while higher TDS levels would more likely be
associated with borehole water supply. Very few companies
were monitoring TDS actively, which impacted on the sample
size as well as the range.
Water and Effluent Cost
Figure 26 provides an analysis of the range of water supply and
disposal costs for both international sites (essentially Australia
and New Zealand) and South Africa.
Water supply and disposal costs in South Africa can be high, as
it is controlled by municipalities which set their own tariff rates.
It appears from this analysis that high supply costs charged
by municipalities are impacting on the operational costs and
competitiveness of South African plants versus international
plants; however, the charge rates are somewhat countered by
lower utilisation levels in South Africa (see Figure 24).
12 000
10 000
8 000
6 000
4 000
2 000
0South African
Benchmark
COD (mg/l)
TDS (mg/l)12 000
10 000
8 000
6 000
4 000
2 000
0South African
Benchmark
FIGURE 25 – EFFLUENT QUALITY
40
35
30
25
20
15
10
5
0
FIGURE 26 – WATER AND EFFLUENT COST
Water Cost (Rand/kl)
Disposal Cost (Rand/kl)
30
25
20
15
10
5
0
Inte
rnat
iona
l B
ench
mar
k
Sout
h A
fric
an
Ben
chm
ark
Inte
rnat
iona
l B
ench
mar
k
Sout
h A
fric
an
Ben
chm
ark

52 BENCHMARKING STUDY
Energy Utilisation and Cost
Figure 27 provides graphical representations of median South African benchmarks based on SUs and carcase
weight for Fully Integrated; Slaughter, Chill and Bone; and Slaughter and Chill operations for:
• Total Energy Source (by electricity, fossil fuel, and solar PV). Fossil fuel makes up about 60% of supply and electricity makes up about 30%. Following discussions with plants, it appears that interest in establishing solar PV is increasing.
• Total Energy Usage (by hot water/steam, refrigeration and other, including plant equipment and lighting). Hot water/steam utilises about 66% of total energy, while refrigeration utilises about 20%. It should be noted that none of the companies were actively sub-metering electricity supply; the refrigeration utilisation was assumed based on local and international benchmarks.
FIGURE 27 – TOTAL ENERGY SOURCE AND USAGE BENCHMARKS
140
120
100
80
60
40
20
0South African Median Benchmark
FULLY INTEGRATED SLAUGHTER, CHILL & BONE SLAUGHTER, CHILL
SLAUGHTER UNIT BASIS
Energy Source (kWh/SU)
Energy Usage (kWh/SU)
140
120
100
80
60
40
20
0South African Median Benchmark
Energy Source (kWh/SU)
Energy Usage (kWh/SU)
140
120
100
80
60
40
20
0South African Median Benchmark
Energy Source (kWh/SU)
Energy Usage (kWh/SU)
600
500
400
300
200
100
0
Supplied Electricity
Fossil Fuels
Solar PV
South African Median Benchmark
Other
Refrigeration
Hot Water / Steam
FULLY INTEGRATED SLAUGHTER, CHILL & BONE SLAUGHTER, CHILL
Energy Source (kWh/Metric
Ton CW)
Energy Usage (kWh/Metric
Ton CW)
South African Median Benchmark
Energy Source (kWh/Metric
Ton CW)
Energy Usage (kWh/Metric
Ton CW)
South African Median Benchmark
Energy Source (kWh/Metric
Ton CW)
Energy Usage (kWh/Metric
Ton CW)600
500
400
300
200
100
0
600
500
400
300
200
100
0
CARCASE WEIGHT BASIS

53Resource Efficiency in Red Meat Abattoirs in South Africa
Detailed benchmark results for energy consumption and cost for Fully Integrated; Slaughter, Chill and Bone; and
Slaughter and Chill enterprises are provided in Table 27. The table provides lowest, median and highest benchmark
results on an SU basis. A full set of results also providing carcase weight data is provided in Annex 1 (Table 28).
TABLE 27 – ENERGY BENCHMARK RESULTS
KPI BASED ON SLAUGHTER UNIT (SU)
INTERNATIONAL BENCHMARKS - SLAUGHTER UNIT BASIS
SOUTH AFRICAN BENCHMARKS - SLAUGHTER UNIT BASIS
FULLY INTEGRATED PLANT (INC RENDERING) FULLY INTEGRATED PLANT (INC RENDERING)
Lowest Median Highest Lowest Median Highest
Electricity Used (kWh/SU) 33 54 72 25 40 65
Thermal Energy Used (kWh/SU) 67 125 163 16 80 200
Total Energy Used (kWh/SU) 102 180 239 40 120 265
Total Energy Cost (R/SU) 74 202 361 30 140 420
KPI BASED ON SLAUGHTER UNIT (SU)
SLAUGHTER CHILL BONE PLANT (NO RENDERING) SLAUGHTER CHILL BONE PLANT (NO RENDERING)
Lowest Median Highest Lowest Median Highest
Electricity Used (kWh/SU) 20 35 46 22 35 55
Thermal Energy Used (kWh/SU) 39 80 109 10 40 95
Total Energy Used (kWh/SU) 65 115 152 32 75 150
Total Energy Cost (R/SU) 48 128 228 25 88 240
KPI BASED ON SLAUGHTER UNIT (SU)
SLAUGHTER & CHILL SLAUGHTER & CHILL
Lowest Median Highest Lowest Median Highest
Electricity Used (kWh/SU) 15 26 35 13 20 35
Thermal Energy Used (kWh/SU) 33 61 80 7 35 80
Total Energy Used (kWh/SU) 48 85 113 20 55 115
Total Energy Cost (R/SU) 35 96 170 15 65 180
Figure 28 provides a graphical representation of the range of South African and international benchmarks for
total energy utilisation and cost based on SUs and carcase weight for Fully Integrated; Slaughter, Chill and Bone;
and Slaughter and Chill operations.
©depositphotos_temis1964

54 BENCHMARKING STUDY
FIGURE 28 – TOTAL ENERGY USAGE (KWH) AND COST BENCHMARKS
1 400
1 200
1 000
800
600
400
200
0
Inte
rnat
iona
l B
ench
mar
k
Sout
h A
fric
an
Ben
chm
ark
FULLY INTEGRATED SLAUGHTER, CHILL & BONE SLAUGHTER, CHILL
CARCASE WEIGHT BASIS
2 500
2 000
1 500
1 000
500
0
Inte
rnat
iona
l B
ench
mar
k
Sout
h A
fric
an
Ben
chm
ark
Total Energy (kWh/Metric
Ton CW)
Total Energy Cost (Rand/Metric
Ton CW)
Inte
rnat
iona
l B
ench
mar
k
Sout
h A
fric
an
Ben
chm
ark
Inte
rnat
iona
l B
ench
mar
k
Sout
h A
fric
an
Ben
chm
ark
Total Energy (kWh/Metric
Ton CW)
Total Energy Cost (Rand/Metric
Ton CW)
Inte
rnat
iona
l B
ench
mar
k
Sout
h A
fric
an
Ben
chm
ark
Inte
rnat
iona
l B
ench
mar
k
Sout
h A
fric
an
Ben
chm
ark
Inte
rnat
iona
l B
ench
mar
k
Sout
h A
fric
an
Ben
chm
ark
Inte
rnat
iona
l B
ench
mar
k
Sout
h A
fric
an
Ben
chm
ark
Total Energy (kWh/Metric
Ton CW)
Total Energy Cost (Rand/Metric
Ton CW)1 400
1 200
1 000
800
600
400
200
0
2 500
2 000
1 500
1 000
500
0
1 400
1 200
1 000
800
600
400
200
0
2 500
2 000
1 500
1 000
500
0
300
250
200
150
100
50
0
Inte
rnat
iona
l B
ench
mar
k
Sout
h A
fric
an
Ben
chm
ark
FULLY INTEGRATED SLAUGHTER, CHILL & BONE SLAUGHTER, CHILL
SLAUGHTER UNIT BASIS
450
400
350
300
250
200
150
100
50
0
Inte
rnat
iona
l B
ench
mar
k
Sout
h A
fric
an
Ben
chm
ark
Total Energy (kWh/SU)
Total Energy Cost (Rand/SU)
300
250
200
150
100
50
0
Inte
rnat
iona
l B
ench
mar
k
Sout
h A
fric
an
Ben
chm
ark
450
400
350
300
250
200
150
100
50
0
Inte
rnat
iona
l B
ench
mar
k
Sout
h A
fric
an
Ben
chm
ark
Total Energy (kWh/SU)
Total Energy Cost (Rand/SU)
300
250
200
150
100
50
0
Inte
rnat
iona
l B
ench
mar
k
Sout
h A
fric
an
Ben
chm
ark
450
400
350
300
250
200
150
100
50
0
Inte
rnat
iona
l B
ench
mar
k
Sout
h A
fric
an
Ben
chm
ark
300
250
200
150
100
50
0
Inte
rnat
iona
l B
ench
mar
k
Sout
h A
fric
an
Ben
chm
ark
450
400
350
300
250
200
150
100
50
0
Inte
rnat
iona
l B
ench
mar
k
Sout
h A
fric
an
Ben
chm
ark
Total Energy (kWh/SU)
Total Energy Cost (Rand/SU)
In South Africa, plants that operate deboning operations commonly only debone hindquarters and despatch
a significant proportion of forequarters directly to the domestic market in chilled form. Forequarters that are
boned normally yield a high proportion of product that comprises secondary cuts and manufacturing product
which is subsequently frozen. As a result, less electrical energy is required for refrigeration in South Africa.

55Resource Efficiency in Red Meat Abattoirs in South Africa
It can be observed from the charts that the range per production unit is significantly wider for South Africa than
for the international benchmarks for both consumption (kWh) and cost (Rand). This is considered to be the
result of:
• Thermal heat load in South Africa plants significantly differing from international counterparts in that they either utilise electrical energy and point-of-use heating systems (heating elements) for hot water generation, resulting in low energy use but high cost, or they utilise steam generated with coal as a fuel source, which results in high energy use (including boiler losses) and lower costs.
• LPG is used on pig processing lines for singeing and is significantly more expensive than international LNG prices. The reason for this is that LPG is predominantly used in domestic applications in South Africa as a replacement for electrical heating, and the supply chain and pricing structures align closely to electrical heating costs which are five times more costly than coal on a R/kWh basis.
It is likely that South African companies will continue to be reliant on coal and electrical-based heating systems
in the medium term (5-10 years); however, the establishment of natural gas reserves and heavy CO2-equivalent
taxes on coal-based systems may change this reliance in the longer term (10-20 years).
Figures 29 and 30 provide similar charts for thermal energy and electrical energy. These charts confirm the
impact of high costs for thermal energy and low costs for electrical energy.
FIGURE 29 – THERMAL ENERGY USAGE (KWH) AND COST BENCHMARKS
250
200
150
100
50
0
Inte
rnat
iona
l B
ench
mar
k
Sout
h A
fric
an
Ben
chm
ark
FULLY INTEGRATED SLAUGHTER, CHILL & BONE SLAUGHTER, CHILL
350
300
250
200
150
100
50
0
Inte
rnat
iona
l B
ench
mar
k
Sout
h A
fric
an
Ben
chm
ark
Thermal Energy (kWh/SU)
Thermal Energy Cost (Rand/SU)
Inte
rnat
iona
l B
ench
mar
k
Sout
h A
fric
an
Ben
chm
ark
Inte
rnat
iona
l B
ench
mar
k
Sout
h A
fric
an
Ben
chm
ark
Inte
rnat
iona
l B
ench
mar
k
Sout
h A
fric
an
Ben
chm
ark
Inte
rnat
iona
l B
ench
mar
k
Sout
h A
fric
an
Ben
chm
ark
Inte
rnat
iona
l B
ench
mar
k
Sout
h A
fric
an
Ben
chm
ark
Inte
rnat
iona
l B
ench
mar
k
Sout
h A
fric
an
Ben
chm
ark
250
200
150
100
50
0
350
300
250
200
150
100
50
0
Thermal Energy (kWh/SU)
Thermal Energy Cost (Rand/SU) 250
200
150
100
50
0
350
300
250
200
150
100
50
0
Thermal Energy (kWh/SU)
Thermal Energy Cost (Rand/SU)
SLAUGHTER UNIT BASIS
The analysis of thermal energy supply and use further indicates that at the median:
• A Fully Integrated enterprise uses 80 kWh/SU of thermal energy at a cost of R90/SU
• A Slaughter, Chill and Bone enterprise uses 45 kWh/SU of thermal energy at a cost of R50/SU
• A Slaughter and Chill enterprise uses 35 kWh/SU of thermal energy at a cost of R40/SU.

56 BENCHMARKING STUDY
FIGURE 30 - ELECTRICAL ENERGY USAGE (KWH) AND COST BENCHMARKS
80
70
60
50
40
30
20
10
0
Inte
rnat
iona
l B
ench
mar
k
Sout
h A
fric
an
Ben
chm
ark
FULLY INTEGRATED SLAUGHTER, CHILL & BONE SLAUGHTER, CHILL
SLAUGHTER UNIT BASIS – ELECTRICAL ENERGY
300
250
200
150
100
50
0
Inte
rnat
iona
l B
ench
mar
k
Sout
h A
fric
an
Ben
chm
ark
Electrical Energy (kWh/SU)
Electrical Energy Cost (Rand/SU)
Inte
rnat
iona
l B
ench
mar
k
Sout
h A
fric
an
Ben
chm
ark
Inte
rnat
iona
l B
ench
mar
k
Sout
h A
fric
an
Ben
chm
ark
Inte
rnat
iona
l B
ench
mar
k
Sout
h A
fric
an
Ben
chm
ark
Inte
rnat
iona
l B
ench
mar
k
Sout
h A
fric
an
Ben
chm
ark
Electrical Energy (kWh/SU)
Electrical Energy Cost (Rand/SU)
Electrical Energy (kWh/SU)
Electrical Energy Cost (Rand/SU)
80
70
60
50
40
30
20
10
0
300
250
200
150
100
50
0
80
70
60
50
40
30
20
10
0
300
250
200
150
100
50
0
The analysis of electrical energy supply and use further indicates that at the median:
• A Fully Integrated enterprise uses 40 kWh/SU of electrical energy at a cost of R50/SU
• A Slaughter, Chill and Bone enterprise uses 35 kWh/SU of electrical energy at a cost of R40/SU
• A Slaughter and Chill enterprise uses 21 kWh/SU of electrical energy at a cost of R30/SU.
Cost of Electricity and Thermal Energy
Figure 31 provides ranges for electricity and thermal energy costs
for international (Australia and New Zealand) and South African
environments. This figure clearly demonstrates:
• The low cost of electricity in South Africa compared to the international comparison median – R1.25/kWh (South Africa) to R2.90/kWh (internationally).
• The highly variable cost of thermal heat due to significant amounts of electricity being used in South Africa to provide direct water heating.
450
400
350
300
250
200
150
100
50
0
FIGURE 31 - COST OF ELECTRICITY AND THERMAL ENERGY
Electricity Cost (Rand/kWh)
Thermal Energy Cost (Rand/kWh)
1.80
1.60
1.40
1.20
1.00
0.80
0.60
0.40
0.20
0.0
Inte
rnat
iona
l B
ench
mar
k
Sout
h A
fric
an
Ben
chm
ark
Inte
rnat
iona
l B
ench
mar
k
Sout
h A
fric
an
Ben
chm
ark

57Resource Efficiency in Red Meat Abattoirs in South Africa
Estimate of GHG Emissions
GHG emissions have been calculated from the energy data obtained
from the plants, and Figure 32 provides the median and range of
GHG emissions.
While the median level of emissions is similar for both South Africa
(27 kgCO2/SU) and international environments (22 kgCO2/SU),
the South African data shows some high levels of GHG emissions.
This is essentially due to the impact of the direct utilisation of
electricity for hot water heating where the electricity is primarily
generated from thermal fuel at a centralised generation facility.
South Africa is still heavily reliant on coal power stations, resulting
in comparatively high CO2 emissions per kWh electricity.
Financial Parameters
During the benchmark survey, participants were asked to indicate
their expected Internal Rate of Return (IRR) for capital investment
projects. While many of the projects identified in the Practical
Guide for Improving Resource Efficiency would be fundable from
operating expenses as they require limited capital expenditure, an
indication of the expected IRR provides a top-level assessment of
the industry’s propensity to invest (the lower the IRR, the greater the
propensity to invest). For example, a low expected IRR for resource
efficiency projects, of say 10%, indicates a high willingness to invest
in projects of this kind because many projects / investments would
offer an IRR of greater than 10% and would therefore be attractive
to the company investing.
Figure 33 demonstrates that the range of expected IRR was
recorded from 10-25%, with a median of 15%. It is considered that
many water and energy efficiency interventions would provide
better returns than required, with an IRR limit of 15%.
Practical Guide for Improving Resource EfficiencyA Practical Guide for Improving Resource Efficiency has been developed as a separate document to
provide South African meat processing enterprises with a range of interventions that could reduce
the utilisation of water and energy resources.
It should be noted that the Australian and New Zealand experiences indicate that over time, with
management paying greater attention to resource utilisation, water consumption was reduced
by 30% and energy consumption by 12%.
The number of SUs processed in South Africa is approximately five million per annum
(according to RMLA).
Adopting the opportunities identified in the Practical Guide will have a significant impact
on meat processing plant operations and make a social contribution to South Africa by
reducing demand for water and reducing GHG emissions.
100
90
80
70
60
50
40
30
20
10
0
FIGURE 32 – ESTIMATE OF GREENHOUSE GAS EMISSIONS
GHG Emisions (kg CO2/SU)
Inte
rnat
iona
l B
ench
mar
k
Sout
h A
fric
an
Ben
chm
ark
30
25
20
15
10
5
0
FIGURE 33 - EXPECTED RETURN ON CAPITAL (IRR)
Finance IRR (%)
South African Benchmark
The median utilisation of water and energy in South Africa has been established to be 891 l/SU and 77 kWh/SU.

58 BENCHMARKING STUDY©depositphotos_MicEnin

59Resource Efficiency in Red Meat Abattoirs in South Africa
Benchmarking Tool for Self-Assessment
Guidelines for Completing the Benchmark ToolFigures 34 - 36 depict screenshots of the tab-sheets to illustrate how an enterprise can run a self-assessment
using the study’s benchmarking data, generating results in the graphic depicted in Figure 37.
FIGURE 34 – FACILITY DATA INPUT
Comments:
Fill in data in the ORANGE cells as indicated
Insert carcase weights if known – if not, the Tool will
assume the Default weight
The boned versus carcase weight should be added
together to be close to the current production,
multiplied by the appropriate carcase weights.
5 THE BENCHMARK TOOL IS CONTAINED WITHIN A MICROSOFT EXCEL SPREADSHEET WITH THREE TABS FOR DATA ENTRY:
1. “Facility Data Input” – see Figure 34
2. “Consumption Data Input” – see Figure 35
3. “Supplementary Data Input” – see Figure 36.

60 BENCHMARKING STUDY
FIGURE 36 – SUPPLEMENTARY DATA INPUT
FIGURE 35 – CONSUMPTION DATA INPUT
Comments:
Fill in data in the ORANGE cells as indicated.
Insert annual spend if known – if not, the Tool will
assume the Default rate.
The “Use of Water Table must add up to the same
total as the combined water used (i.e. Municipal +
Ground + River + Rain water used). The percentage
used will provide a guide to assist.
Comments:
Fill in data in the
dropdown cells as
indicated.
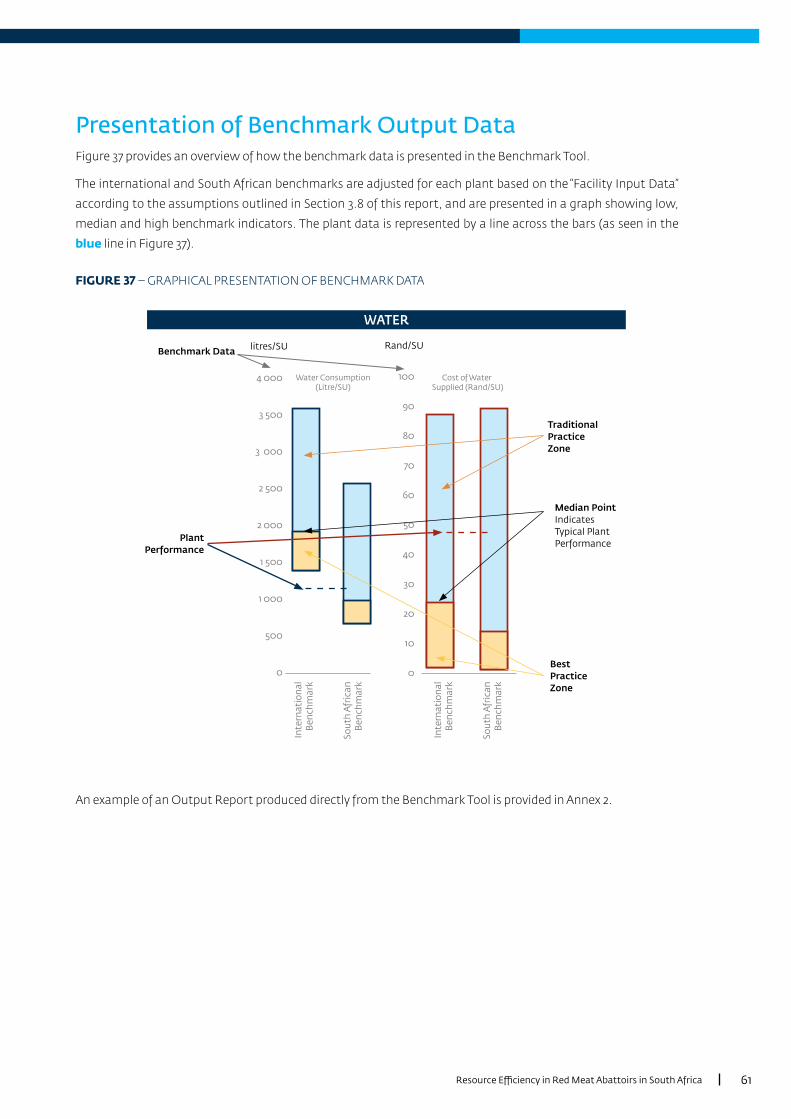
61Resource Efficiency in Red Meat Abattoirs in South Africa
Presentation of Benchmark Output DataFigure 37 provides an overview of how the benchmark data is presented in the Benchmark Tool.
The international and South African benchmarks are adjusted for each plant based on the “Facility Input Data”
according to the assumptions outlined in Section 3.8 of this report, and are presented in a graph showing low,
median and high benchmark indicators. The plant data is represented by a line across the bars (as seen in the
blue line in Figure 37).
FIGURE 37 – GRAPHICAL PRESENTATION OF BENCHMARK DATA
An example of an Output Report produced directly from the Benchmark Tool is provided in Annex 2.
4 000
3 500
3 000
2 500
2 000
1 500
1 000
500
0
Inte
rnat
iona
l B
ench
mar
k
Sout
h A
fric
an
Ben
chm
ark
WATER
100
90
80
70
60
50
40
30
20
10
0
Inte
rnat
iona
l B
ench
mar
k
Sout
h A
fric
an
Ben
chm
ark
Water Consumption (Litre/SU)
Cost of Water Supplied (Rand/SU)
Benchmark Data litres/SU Rand/SU
Plant Performance
Traditional Practice Zone
Median Point Indicates Typical Plant Performance
Best Practice Zone

62 BENCHMARKING STUDY
References• Alexander, D., Ridoutt, B. & Sanguansri, P. (2015). Environmental Performance Review: Red Meat Processing Sector.
Australian Meat Processor Corporation (AMPC).
• Atkins, W.S. (2000). Model Approach for Producing BAT Guidance for Specific Sub-sectors within the Food and Drink Industry, Red Meat Abattoirs. Environmental Protection Agency. United Kingdom.
• COWI Consulting Engineers and Planners, Denmark for United Nations Environment Programme (UNEP) Division of Technology, Industry and Economics. (2000). Cleaner Production Assessment in Meat Processing.
• Department of Agriculture, Forestry and Fisheries (DAFF). (2019). Abstract of Agricultural Statistics.
• European Union. (2005). Integrated Pollution Prevention and Control. Reference Document on Best Available Techniques in the Slaughterhouses and Animal By-products Industries. Intergovernmental Panel on Climate Change (IPCC).
• Food and Agriculture Organization (FAO) of the United Nations. Food and Agriculture Data. Retrieved 15 April 2020, from http://www.fao.org/faostat/en/#home.
• Global Petrol Prices. Retrieved 10 January 2020, from www.globalpetrolprices.com/data_electricity_download.php
• Independent Pricing and Regulatory Tribunal (IPART). (2018). 2019-23 Water and Sewerage Pricing Submission – Customer Summary. Retrieved 3 May 2020, from https://www.ipart.nsw.gov.au/files/sharedassets/website/shared-files/pricing-reviews-water-services-metro-water-working-papers-prices-for-essential-energys-water-and-sewerage-services-in-broken-hill-from-1-july-2019/essential-water-pricing-proposal-for-2019-customer-summary.pdf.
• Kemp, R. (2011). Energy & Water Benchmark Survey. Agresearch.
• Red Meat Abattoir Association, South Africa. List of Abattoirs. Retrieved 12 December 2019, from https://www.nda.agric.za/vetweb/VPH/AbattoirLists/Abattoir%20list%202018_13Feb2018.PDF.
• Red Meat Levy Admin. (2020). Abattoir Statistics for November 2018 to October 2019. Retrieved 30 July 2020, from https://levyadmin.co.za/statistics/.
• Rios, J. (2019). What’s Next for Australia’s Natural Gas Market. E&C Consultants. https://www.eecc.eu/blog/whats-next-for-australias-natural-gas-market
• United Nations Environment Programme (UNEP). (2002). Eco-Efficiency Manual for Meat Processing, Meat and Livestock Australia Ltd. Working Group for Cleaner Production in the Food Industry.
• J R Müller & Associates - South Africa: Water Research Commission (2017). NATSURV 7 - Water and Wastewater Management in the Red Meat Abattoir Industry (Edition 2).

63Resource Efficiency in Red Meat Abattoirs in South Africa
Annex 1 – Detailed Table of Important Benchmark Results
TABLE 28 – IMPORTANT BENCHMARK DATA
KPI BASED ON SLAUGHTER UNIT (SU)
INTERNATIONAL BENCHMARKS - SLAUGHTER UNIT BASIS
SOUTH AFRICAN BENCHMARKS - SLAUGHTER UNIT BASIS
FULLY INTEGRATED PLANT (INC RENDERING) FULLY INTEGRATED PLANT (INC RENDERING)
Lowest Median Highest Lowest Median Highest
Total water used (litre/SU) 1 087 1 522 2 826 700 1 000 2 600
Water Cost (Purchase & Discharge (R/SU) 1 22 72 1 15 90
Electricity Used (kWh/SU) 33 54 72 25 40 65
Thermal Energy Used (kWh/SU) 67 125 163 16 80 200
Total Energy Used (kWh/SU) 102 180 239 40 120 265
Total Energy Cost (R/SU) 74 202 361 30 140 420
KPI BASED ON SLAUGHTER UNIT (SU)SLAUGHTER CHILL BONE PLANT (NO RENDERING) SLAUGHTER CHILL BONE PLANT (NO RENDERING)
Lowest Median Highest Lowest Median Highest
Total water used (litre/SU) 1 011 1 413 2 630 650 930 2 400
Water Cost (Purchase & Discharge (R/SU) 1 20 67 1 13 85
Electricity Used (kWh/SU) 20 35 46 22 35 55
Thermal Energy Used (kWh/SU) 39 80 109 10 40 95
Total Energy Used (kWh/SU) 65 115 152 32 75 150
Total Energy Cost (R/SU) 48 128 228 25 88 240
KPI BASED ON SLAUGHTER UNIT (SU) SLAUGHTER&CHILL PLANT SLAUGHTER&CHILL PLANT
Lowest Median Highest Lowest Median Highest
Total water used (litre/SU) 870 1 239 2 283 590 810 2 100
Water Cost (Purchase & Discharge (R/SU) 1 16 59 1 12 75
Electricity Used (kWh/SU) 15 26 35 13 20 35
Thermal Energy Used (kWh/SU) 33 61 80 7 35 80
Total Energy Used (kWh/SU) 48 85 113 20 55 115
Total Energy Cost (R/SU) 35 96 170 15 65 180
KPI BASED ON CARCASE WEIGHT (TCW)
INTERNATIONAL BENCHMARKS - CARCASE WEIGHT BASIS
SOUTH AFRICAN BENCHMARKS - CARCASE WEIGHT BASIS
FULLY INTEGRATED PLANT (INC RENDERING) FULLY INTEGRATED PLANT (INC RENDERING)
Lowest Median Highest Lowest Median Highest
Total water used (litre/tCW) 5 000 7 000 13 000 3 220 4 600 11 960
Water Cost (Purchase & Discharge (R/tCW) 5 100 330 0 70 410
Electricity Used (kWh/tCW) 150 250 330 120 180 300
Thermal Energy Used (kWh/tCW) 310 575 750 70 370 920
Total Energy Used (kWh/tCW) 470 830 1 100 180 550 1 220
Total Energy Cost (R/tCW) 340 930 1660 140 640 1 930
SLAUGHTER CHILL BONE PLANT (NO RENDERING) SLAUGHTER CHILL BONE PLANT (NO RENDERING)
Lowest Median Highest Lowest Median Highest
Total water used (litre/tCW) 4 650 6 500 12 100 2 990 4 280 11 040
Water Cost (Purchase & Discharge (R/tCW) 5 90 310 0 60 390
Electricity Used (kWh/tCW) 90 160 210 100 160 250
Thermal Energy Used (kWh/tCW) 180 370 500 50 180 440
Total Energy Used (kWh/tCW) 300 530 700 150 350 690
Total Energy Cost (R/tCW) 220 590 1050 120 400 1 100
SLAUGHTER&CHILL PLANT SLAUGHTER&CHILL PLANT
Lowest Median Highest Lowest Median Highest
Total water used (litre/tCW) 4 000 5 700 10 500 2 710 3 730 9 660
Water Cost (Purchase & Discharge (R/tCW) 4 75 270 0 60 350
Electricity Used (kWh/tCW) 70 120 160 60 90 160
Thermal Energy Used (kWh/tCW) 150 280 370 30 160 370
Total Energy Used (kWh/tCW) 220 390 520 90 250 530
Total Energy Cost (R/tCW) 160 440 780 70 300 830
FINANCIALINTERNATIONAL BENCHMARKS SOUTH AFRICAN BENCHMARKS
Lowest Median Highest Lowest Median Highest
Cost / kWh Electrical including demand charges (R/kWh)
R1.90 R2.90 R3.90 R1.00 R1.30 R1.60
Cost / kWh Thermal (R / kWh) R0.23 R0.34 R0.46 R0.20 R1.13 R1.60
Cost of water purchase (R/kl) R0.13 R5.45 R1.77 R1.00 R14.00 R35.00
Cost of water discharge including penalties (R/kl) R1.14 R9.73 R17.60 R0.50 R7.50 R24.00

64 BENCHMARKING STUDY
Annex 2 – Example of Output Report from Benchmark Tool

65Resource Efficiency in Red Meat Abattoirs in South Africa

For More Information visit
www.ifc.org
IN PARTNERSHIP WITH