
Free and open source software in europe policies and implementations
U.P.B. Sci. Bull., Series C, Vol. 83, Iss. 3, 2021 ISSN 2286-3540
BENCHMARKING OPEN-SOURCE IMPLEMENTATIONS
FOR ENERGY TIME SERIES FEATURE EXTRACTION
METHOD
Cristina NICHIFOROV1, Grigore STAMATESCU2, Stelian – Sergiu ILIESCU3
The paper focuses on time series feature extraction technique benchmarking
for consumer-side energy applications which can be used to build robust learning
models for consumption forecasting and anomaly detection. More specifically we
analyze various open-source implementations of the Matrix Profile algorithm for
time series data mining available as software libraries written in the Python
programming language. Several replicable benchmarking results are carried out on
a reference large commercial building energy measurements data set while
reporting aggregate run times in conjunction with the particularities of each
algorithm. The work can serve as a practical guide for choosing appropriate
algorithm implementations for new intelligent data-driven systems for smart
building energy management.
Keywords: matrix profile, data mining, time series, feature extraction, energy
management
1. Introduction
Data-driven Internet of Things (IoT) systems are increasingly being
deployed in energy systems for monitoring and control purposes [1]. Several
reference case studies are discussed in [2] for energy-efficient scheduling in smart
homes and wireless power transfer for IoT devices in smart cities. These systems
have the ability of gathering large quantities of process data, both producer and
consumer side, and performing in situ analytics to extract meaningful patterns and
build prediction and anomaly detection models. In typical data science projects,
the majority of the time is spent on preliminary tasks such as data cleaning and
feature extraction/engineering, before the actual model selection, training and
evaluation, in accordance with the business logic. To this extent any improvement
in these early stages of a data-intensive research and development project can
have a high impact on the quality and timeliness of the results.
1 PhD Candidate and Teaching Assistant, Dept. of Automation and Industrial Informatics,
University POLITEHNICA of Bucharest, Romania, e-mail: [email protected] 2 Assoc. Prof., Dept. of Automation and Industrial Informatics, University POLITEHNICA of
Bucharest, Romania, e-mail: [email protected] 3 Prof., Dept. of Automation and Industrial Informatics, University POLITEHNICA of Bucharest,
Romania, e-mail: [email protected]

86 Cristina Nichiforov, Grigore Stamatescu, Stelian – Sergiu Iliescu
In previous work [3,4] we have focused on building machine learning
models that leverage temporal dependencies for improving short-term load
forecasting in large commercial buildings. For our current case study, we focus on
benchmarking various publicly available implementations of a time series data
mining technique, the Matrix Profile (MP) [5], for energy applications. This can
provide useful features such as time series motifs and discords that are used in the
early modelling stages for more robust results. In [6] we have illustrated several
features of the MP to extract information from active power measurements of
large commercial buildings which are prone to significant energy efficiency gains
using intelligent IoT based systems for energy management.
The main contribution of the current work lays in the experimental
evaluation of the computational performance of the Matrix Profile (MP) algorithm
as feature extraction primitive on reference commercial building energy datasets
under the Python programming language and associated development
environments.
2. Methodology
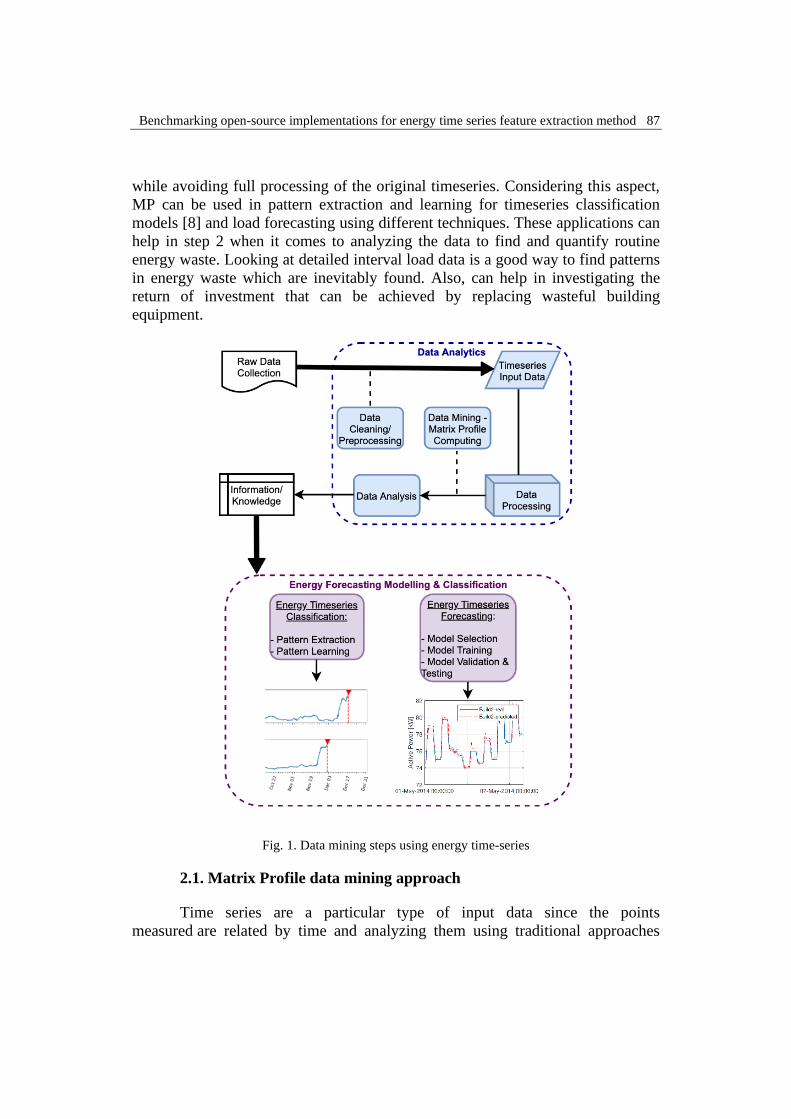
Figure 1 illustrates the steps thar are needed to compute MP for a time
series and how MP time series can help in an energy management system. MP
data mining technique is involved in the data analytics stage where the
preprocessed input data is used to compute de MP which helps in data analysis by
giving some important information about similar and unusual sequences within
the original timeseries and by eliminating most of the redundant information
contained in the input data.
When it comes to consumer-side applications of energy saving and energy
efficiency, energy management is the process of monitoring, controlling, and
optimizing the energy consumption in a building [7]. According to the literature,
this involves four important steps:
1. Energy consumption metering and data collecting.
2. Identifying opportunities to save energy and estimating how
much energy each opportunity could save; this can be automated
using current computational intelligence algorithms and tools.
3. Taking action to target the opportunities to save energy; this can be
implemented through smart building control systems that operate
in a predictive and optimal manner.
4. Tracking the progress by re-analyzing the data to see how well the
energy-saving efforts have worked at the building management
system (BMS) level.
We can discuss the MP efficiency in terms of the significant dimension
reduction achieved by labelling the relevant components of the energy time series
Benchmarking open-source implementations for energy time series feature extraction method 87
while avoiding full processing of the original timeseries. Considering this aspect,
MP can be used in pattern extraction and learning for timeseries classification
models [8] and load forecasting using different techniques. These applications can
help in step 2 when it comes to analyzing the data to find and quantify routine
energy waste. Looking at detailed interval load data is a good way to find patterns
in energy waste which are inevitably found. Also, can help in investigating the
return of investment that can be achieved by replacing wasteful building
equipment.
Fig. 1. Data mining steps using energy time-series
2.1. Matrix Profile data mining approach
Time series are a particular type of input data since the points
measured are related by time and analyzing them using traditional approaches
88 Cristina Nichiforov, Grigore Stamatescu, Stelian – Sergiu Iliescu
such as ARIMA or machine learning can often become quite difficult and
computationally inefficient as the amount of data increase. This also requires
specialized knowledge for identifying the appropriate model structure and
performing adjustments.
Lately, in the literature has been introduced a near universal time series
data mining tool called Matrix Profile (MP) [5]. According to the authors, this
novel approach has some important features that makes the MP algorithms
suitable for many time series data mining tasks. The most significative features
would be scalability, the reduced dimension of the approach, the less training
time, data and parameter tuning required compared to other data mining
techniques. Among the many different applications of time series data mining
where MP has been effective there can be mentioned: timeseries data
visualization, timeseries chain discovery, finding similar patterns among a time-
series i.e., motif detection, anomaly discovery i.e., discord detection, augmented
timeseries motif discovery, variable-length motif discovery [9], etc.
To introduce a short definition, giving a timeseries T, the Matrix Profile
computed for T is a compact timeseries that stores the z-
normalized Euclidean distance between each subsequence and its nearest
neighbor; n is the length of T, and m is the subsequence length [5]. The z-
normalized Euclidean distance or more general p-norm, used by MP is described
by the following formula [10]:
(1)
where Q and T are two timeseries of length m, µ and σ represents the mean and
standard deviation, respectively.
and . (2)
The ongoing research projects propose several algorithms and libraries
based on Matrix Profile developed using different technologies such as
MATLAB, Python, R, Java, Kotlin, etc. In the current research there were used
four scalable timeseries Matrix Profile algorithms: STUMP, STOMP, SCRIMP++
and MPX implemented in open-source libraries written in the Python
programming language. MP efficiency is closely related to the significant
dimension reduction achieved by labelling the relevant components of the energy
time series while avoiding full processing of the datasets.
Benchmarking open-source implementations for energy time series feature extraction method 89
3. Results
The current research presents the experimental results of the Matrix Profile
approach on a building energy repository that is publicly available through
Building Data Genome repository [11]. The datasets used for the research contain
the active power consumption for 422 academic (after filtering out) buildings
from U.S. and Europe. Among the datasets, there are four types of dominant
energy usage patterns, namely: classrooms, offices, laboratories, and dormitories.
All the data is collected over one-year period, the sampling time for each dataset
is one hour and they consist of 8.760 data points, reporting the active power in
kW drawn by the building at the given instant.
3.1. Matrix Profile Analysis
The Matrix Profile was computed for all datasets through STUMP
algorithm from STUMPY Library [12]. STUMP is Numba JIT-compiled version
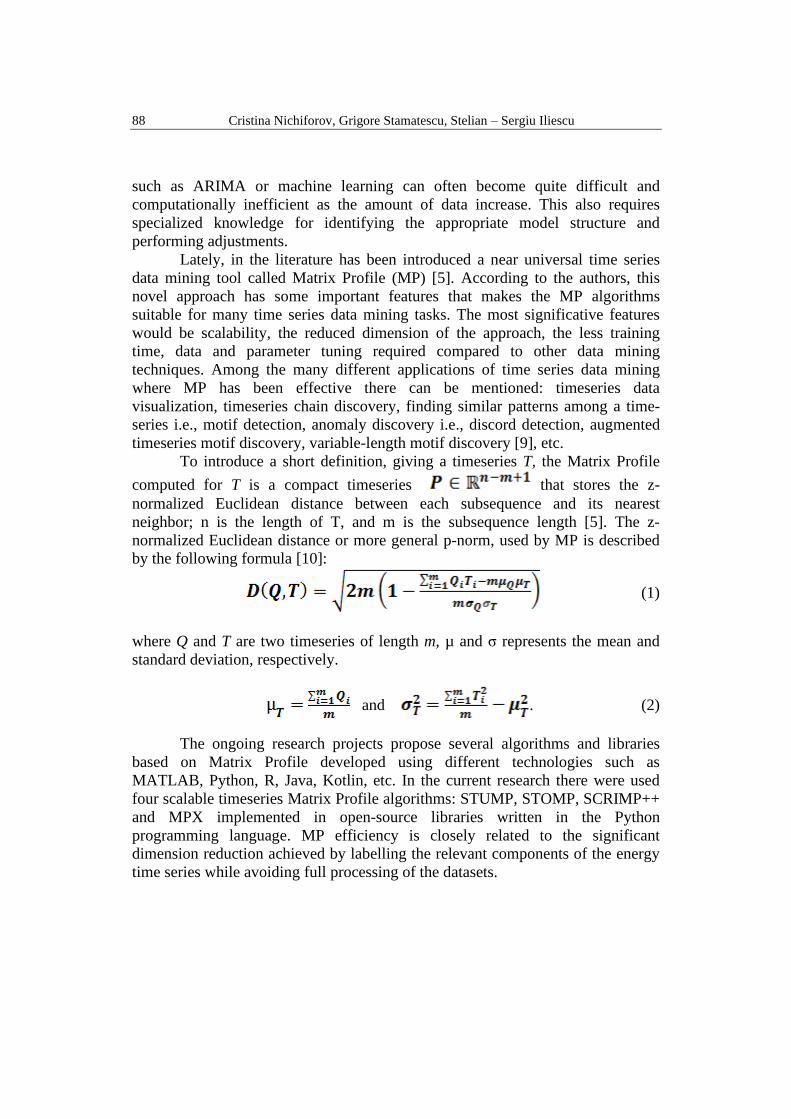
of the STOMP algorithm that is described in [13]. Fig. 2, Fig. 4, and Fig.5 present
the Matrix Profile results with several window-lengths for three datasets that has
as usage pattern an office, laboratory and classroom, respectively. The top subplot
of each figure presents the real data, the measured active power and the following
subplots present the Matrix Profile computed with one - day, 5 days, 7 days, 14
days and 30 days window length. It can be noticed that increasing the window
length have little impact on the resulting matrix profile but leads to a less granular
dataset which also leads to a better identification of patterns within the dataset.
Fig. 2. Matrix Profile – varying window length (Office)
90 Cristina Nichiforov, Grigore Stamatescu, Stelian – Sergiu Iliescu
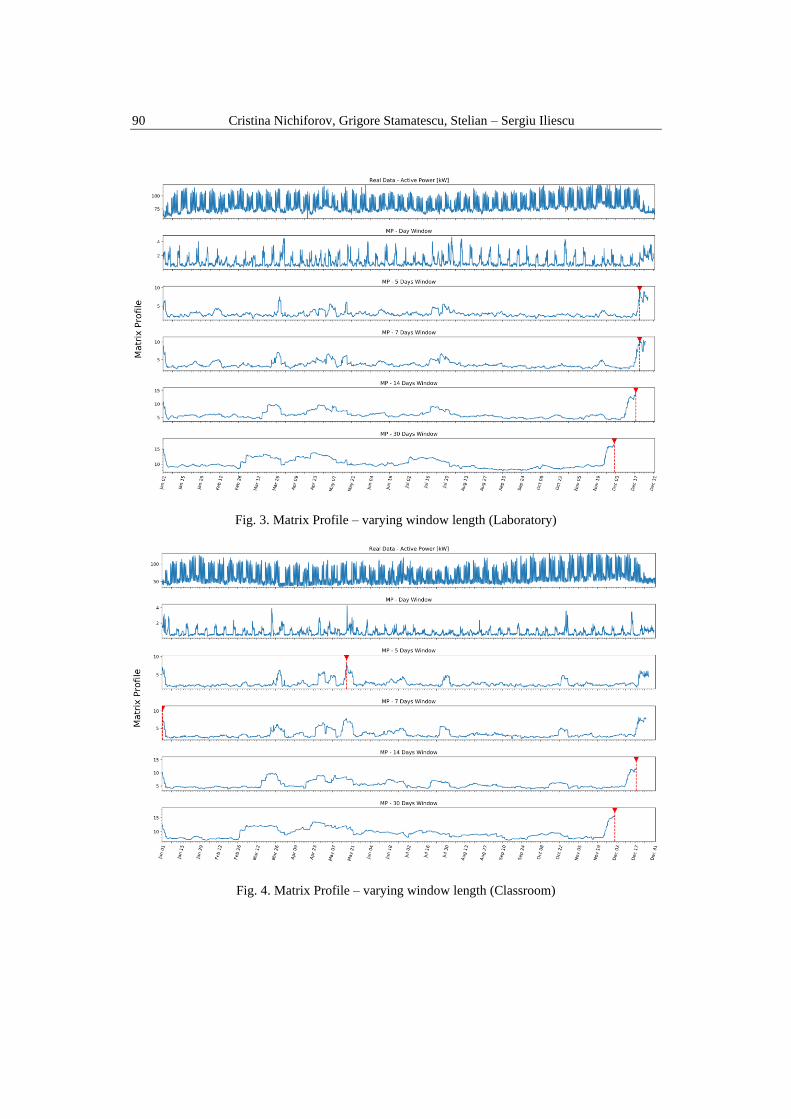
Fig. 3. Matrix Profile – varying window length (Laboratory)
Fig. 4. Matrix Profile – varying window length (Classroom)
Benchmarking open-source implementations for energy time series feature extraction method 91
Besides the Matrix Profile the index of the first discord identified within
each resulted dataset was also computed. The first discord represents the highest
relative peak on the Matrix Profile graph, and it is marked with a red arrow on
each figure. For this particular case, what is noticeable is that the one-day window
is not helpful in terms of identifying the top discords since there can be seen a lot
of peaks. Increasing the length of the window helps visualize that the top discord
is correlated with the period of winter holiday. This is one of the most unusual
patterns among the timeseries because during the holiday the activity in
universities is decreased, and highly dissimilar, compared to the rest of the
semester.
Taking into consideration that manipulating the window size has
insignificant impact on the MP, there was also computed the necessary time to
obtain the MP considering each window length variation, in order to see what the
cost is of increasing it in terms of performance. For this experiment there were
also computed MP using MPX, STOMP and SCRIMP++ algorithms from matrix
profile library [14] in Python using the Jupyter Notebook web application in the
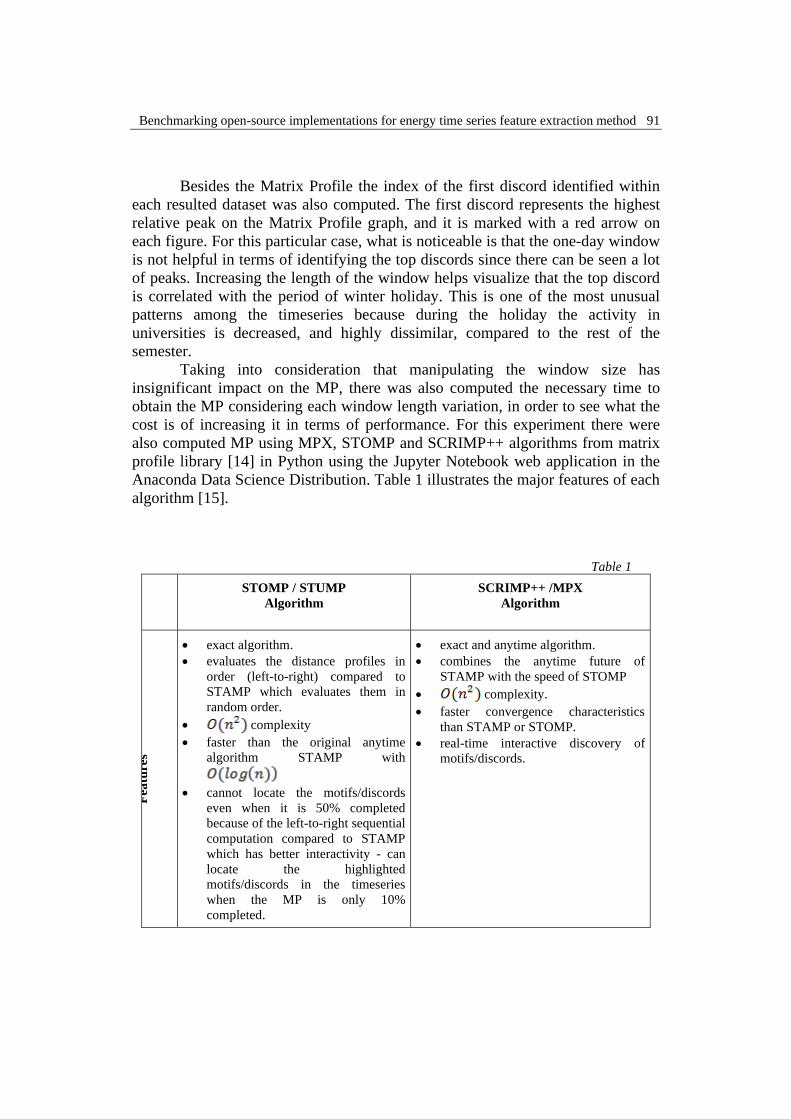
Anaconda Data Science Distribution. Table 1 illustrates the major features of each
algorithm [15].
Table 1
STOMP / STUMP
Algorithm
SCRIMP++ /MPX
Algorithm
Fea
ture
s
• exact algorithm.
• evaluates the distance profiles in
order (left-to-right) compared to
STAMP which evaluates them in
random order.
• complexity
• faster than the original anytime
algorithm STAMP with
• cannot locate the motifs/discords
even when it is 50% completed
because of the left-to-right sequential
computation compared to STAMP
which has better interactivity - can
locate the highlighted
motifs/discords in the timeseries
when the MP is only 10%
completed.
• exact and anytime algorithm.
• combines the anytime future of
STAMP with the speed of STOMP
• complexity.
• faster convergence characteristics
than STAMP or STOMP.
• real-time interactive discovery of
motifs/discords.
92 Cristina Nichiforov, Grigore Stamatescu, Stelian – Sergiu Iliescu
Table 2 and Table 3 present the quantitative results achieved as mean
values for Wall time and CPU time over 100 iterations of the algorithm on the
same input data. This is justified in order to establish statistical variation bounds
that account for the varying load of the host system during the experiments. Wall
time represents the actual time, measured in seconds, that the program takes to run
or to execute its assigned tasks/operations (e.g., MP computing). Opposed to it, is
the CPU time, which only includes the periods of time during which the CPU was
processing instructions. It can be noticed that in all cases, increasing the length of
the window leads to a relatively constant time complexity which is also mentioned
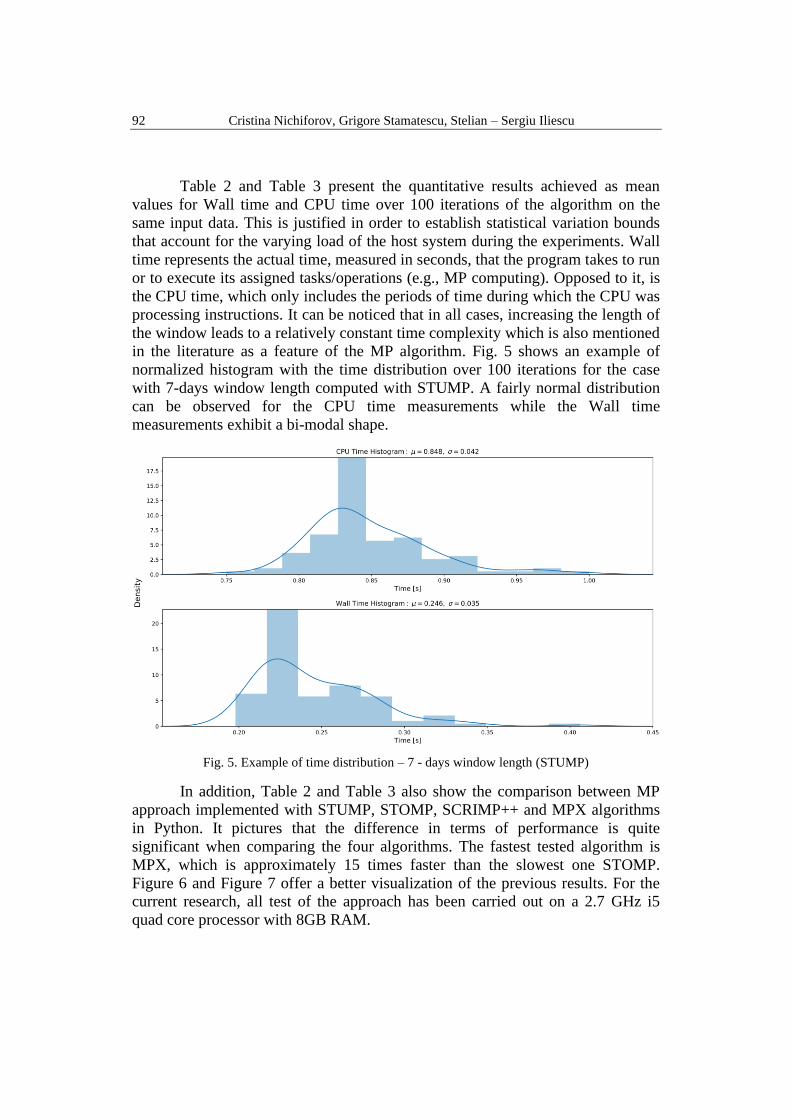
in the literature as a feature of the MP algorithm. Fig. 5 shows an example of
normalized histogram with the time distribution over 100 iterations for the case
with 7-days window length computed with STUMP. A fairly normal distribution
can be observed for the CPU time measurements while the Wall time
measurements exhibit a bi-modal shape.
Fig. 5. Example of time distribution – 7 - days window length (STUMP)
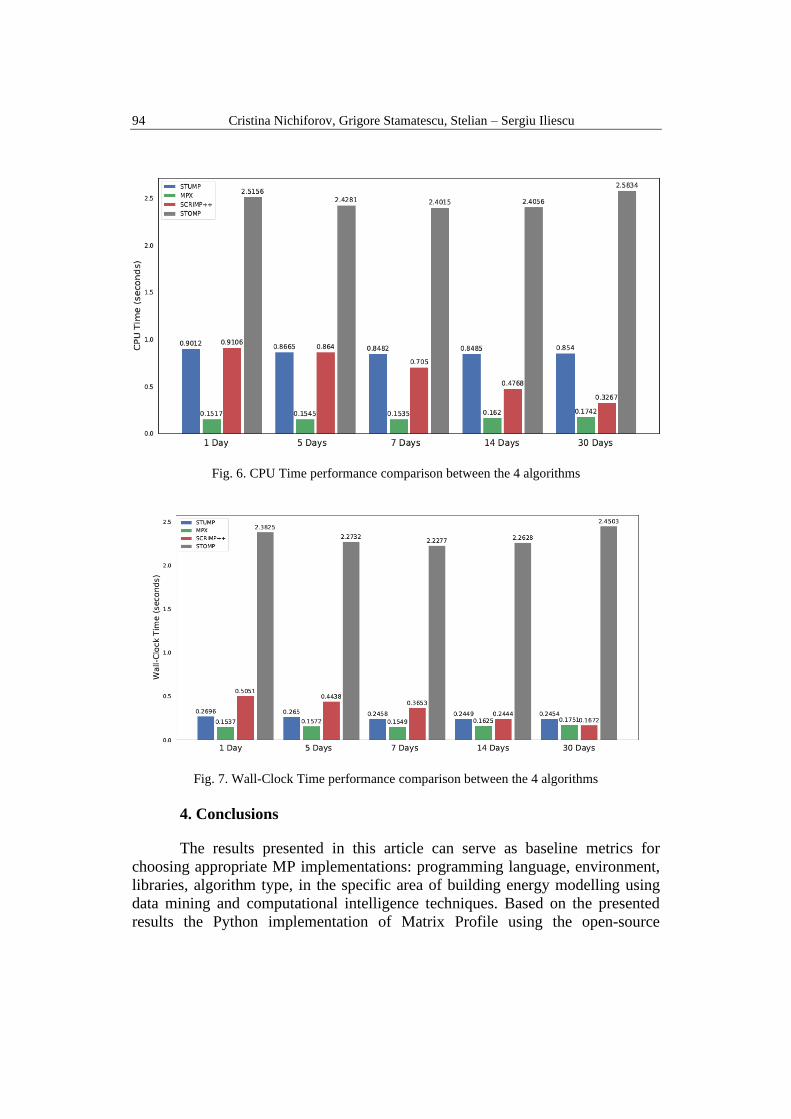
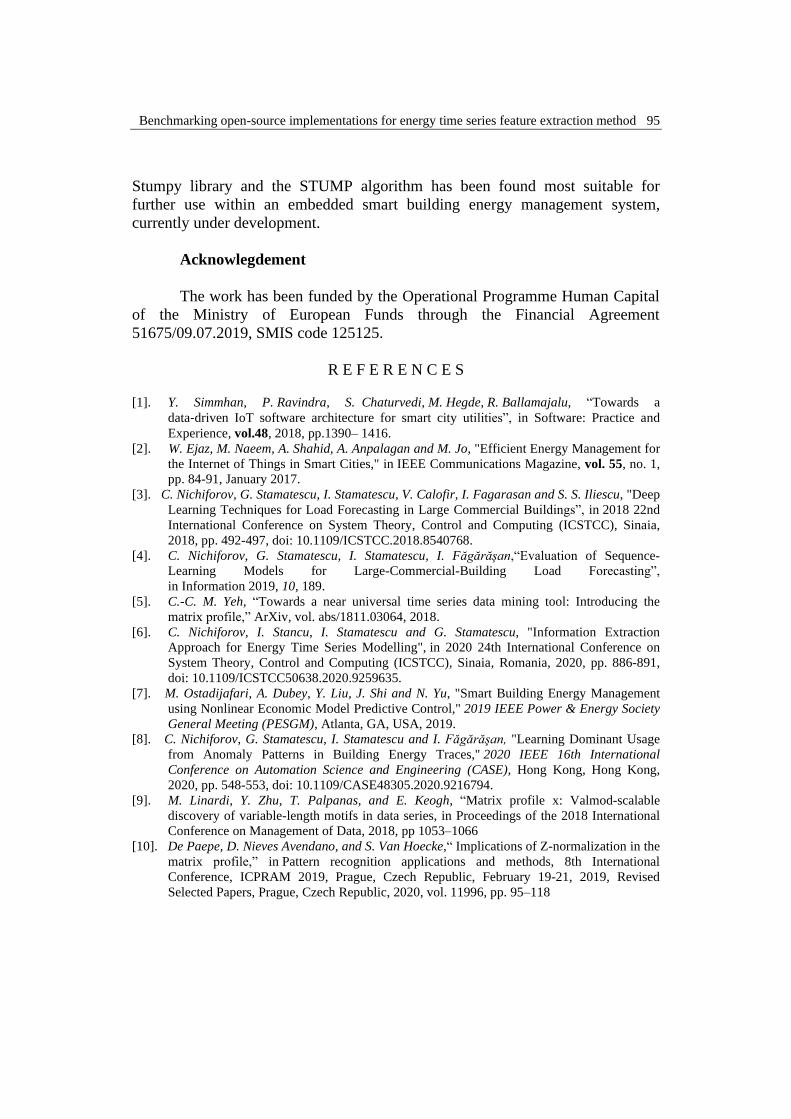
In addition, Table 2 and Table 3 also show the comparison between MP
approach implemented with STUMP, STOMP, SCRIMP++ and MPX algorithms
in Python. It pictures that the difference in terms of performance is quite
significant when comparing the four algorithms. The fastest tested algorithm is
MPX, which is approximately 15 times faster than the slowest one STOMP.
Figure 6 and Figure 7 offer a better visualization of the previous results. For the
current research, all test of the approach has been carried out on a 2.7 GHz i5
quad core processor with 8GB RAM.
Benchmarking open-source implementations for energy time series feature extraction method 93
Table 2
Window
Length
Wall-Clock Time
[seconds]
CPU Time
[seconds]
STUMP
algorithm
(STUMPY
Python)
MPX
algorithm
(Python)
STUMP
algorithm
(STUMPY
Python)
MPX
algorithm
(Python)
1 Day 0.2696 0.1537 0.9012 0.1517
5 Days 0.2650 0.1572 0.8665 0.1545
7 Days 0.2458 0.1549 0.8482 0.1535
14 Days 0.2449 0.1625 0.8485 0.1620
30 Days 0.2454 0.1751 0.8540 0.1742
Table 3
Window
Length
Wall-Clock Time
[seconds]
CPU Time
[seconds]
SCRIMP++
algorithm
(Python)
STOMP
algorithm
(Python)
SCRIMP++
algorithm
(Python)
STOMP
algorithm
(Python)
1 Day 0.5051 2.3825 0.9106 2.5156
5 Days 0.4438 2.2732 0.8640 2.4281
7 Days 0.3653 2.2277 0.7050 2.4015
14 Days 0.2444 2.2628 0.4768 2.4056
30 Days 0.1672 2.4503 0.3267 2.5834
94 Cristina Nichiforov, Grigore Stamatescu, Stelian – Sergiu Iliescu
Fig. 6. CPU Time performance comparison between the 4 algorithms
Fig. 7. Wall-Clock Time performance comparison between the 4 algorithms
4. Conclusions
The results presented in this article can serve as baseline metrics for
choosing appropriate MP implementations: programming language, environment,
libraries, algorithm type, in the specific area of building energy modelling using
data mining and computational intelligence techniques. Based on the presented
results the Python implementation of Matrix Profile using the open-source
Benchmarking open-source implementations for energy time series feature extraction method 95
Stumpy library and the STUMP algorithm has been found most suitable for
further use within an embedded smart building energy management system,
currently under development.
Acknowlegdement
The work has been funded by the Operational Programme Human Capital
of the Ministry of European Funds through the Financial Agreement
51675/09.07.2019, SMIS code 125125.
R E F E R E N C E S
[1]. Y. Simmhan, P. Ravindra, S. Chaturvedi, M. Hegde, R. Ballamajalu, “Towards a
data‐driven IoT software architecture for smart city utilities”, in Software: Practice and
Experience, vol.48, 2018, pp.1390– 1416.
[2]. W. Ejaz, M. Naeem, A. Shahid, A. Anpalagan and M. Jo, "Efficient Energy Management for
the Internet of Things in Smart Cities," in IEEE Communications Magazine, vol. 55, no. 1,
pp. 84-91, January 2017.
[3]. C. Nichiforov, G. Stamatescu, I. Stamatescu, V. Calofir, I. Fagarasan and S. S. Iliescu, "Deep
Learning Techniques for Load Forecasting in Large Commercial Buildings”, in 2018 22nd
International Conference on System Theory, Control and Computing (ICSTCC), Sinaia,
2018, pp. 492-497, doi: 10.1109/ICSTCC.2018.8540768.
[4]. C. Nichiforov, G. Stamatescu, I. Stamatescu, I. Făgărăşan,“Evaluation of Sequence-
Learning Models for Large-Commercial-Building Load Forecasting”,
in Information 2019, 10, 189.
[5]. C.-C. M. Yeh, “Towards a near universal time series data mining tool: Introducing the
matrix profile,” ArXiv, vol. abs/1811.03064, 2018.
[6]. C. Nichiforov, I. Stancu, I. Stamatescu and G. Stamatescu, "Information Extraction
Approach for Energy Time Series Modelling", in 2020 24th International Conference on
System Theory, Control and Computing (ICSTCC), Sinaia, Romania, 2020, pp. 886-891,
doi: 10.1109/ICSTCC50638.2020.9259635.
[7]. M. Ostadijafari, A. Dubey, Y. Liu, J. Shi and N. Yu, "Smart Building Energy Management
using Nonlinear Economic Model Predictive Control," 2019 IEEE Power & Energy Society
General Meeting (PESGM), Atlanta, GA, USA, 2019.
[8]. C. Nichiforov, G. Stamatescu, I. Stamatescu and I. Făgărăşan, "Learning Dominant Usage
from Anomaly Patterns in Building Energy Traces," 2020 IEEE 16th International
Conference on Automation Science and Engineering (CASE), Hong Kong, Hong Kong,
2020, pp. 548-553, doi: 10.1109/CASE48305.2020.9216794.
[9]. M. Linardi, Y. Zhu, T. Palpanas, and E. Keogh, “Matrix profile x: Valmod-scalable
discovery of variable-length motifs in data series, in Proceedings of the 2018 International
Conference on Management of Data, 2018, pp 1053–1066
[10]. De Paepe, D. Nieves Avendano, and S. Van Hoecke,“ Implications of Z-normalization in the
matrix profile,” in Pattern recognition applications and methods, 8th International
Conference, ICPRAM 2019, Prague, Czech Republic, February 19-21, 2019, Revised
Selected Papers, Prague, Czech Republic, 2020, vol. 11996, pp. 95–118
96 Cristina Nichiforov, Grigore Stamatescu, Stelian – Sergiu Iliescu
[11]. C. Miller and F. Meggers,“ The building data genome project: An open, public data set
from non-residential building electrical meters”, in Energy Procedia, vol. 122, 2017, pp.
439 – 444
[12]. S. Law,“ STUMPY: A Powerful and Scalable Python Library for Time Series Data
Mining”, in Journal of Open Source Software. vol. 4(39), 2019, pp. 1504, doi:
10.21105/joss.01504
[13]. Y. Zhu, Z. Zimmerman, N. Shakibay Senobari, C.-C. M. Yeh, G. Funning, A. Mueen, P.
Berisk, E. Keogh, “Matrix Profile II: Exploiting a Novel Algorithm and GPUs to break the
one Hundred Million Barrier for Time Series Motifs and Joins, in IEEE 16th International
Conference on Data Mining, Barcelona, 2016, pp. 739-748, doi: 10.1109/ICDM.2016.0085.
[14]. A. Van Benschoten, A. Ouyang, F. Bischoff, T. Marrs, “MPA: a novel cross-language API
for time series analysis, in Journal of Open Source Software, vol. 5(49), 2020, pp.
2179, https://doi.org/10.21105/joss.02179
[15]. Y. Zhu, C. M. Yeh, Z. Zimmerman, K. Kamgar, E. Keogh, "Matrix Profile XI: SCRIMP++:
Time Series Motif Discovery at Interactive Speeds", in IEEE International Conference on
Data Mining (ICDM), Singapore, 2018, pp. 837-846, doi: 10.1109/ICDM.2018.0009


![Benchmarking Software Implementations of 1st Round ......ing implementations of cryptographic algorithms [8]. Built to extend SUPER-COP, XBX and XXBX enhance the testing framework](https://static.fdocuments.net/doc/165x107/5f239184d349a1061b02e178/benchmarking-software-implementations-of-1st-round-ing-implementations-of.jpg)


