BENCHMARKING MIAMI’S TALENT BASEcarta.fiu.edu/.../19/2018/01/FINAL-Talent-Brief-1.pdf · TALENT...
16
BENCHMARKING MIAMI’S TALENT BASE Richard Florida Steven Pedigo
Transcript of BENCHMARKING MIAMI’S TALENT BASEcarta.fiu.edu/.../19/2018/01/FINAL-Talent-Brief-1.pdf · TALENT...

BENCHMARKING MIAMI’S TALENT BASERichard Florida Steven Pedigo
THE MIAMI URBAN FUTURE INITIATIVE The Miami Urban Future Initiative is a joint initiative with FIU’s College of Communication, Architecture + The Arts and the Creative Class Group sponsored in part by The John S. and James L. Knight Foundation, which will lead new research and mapping on economic, occupational, creative and technological assets in Miami, in partnership with renowned experts, to provide necessary data, evidence and strategy to grow a more inclusive, creative economy for a 21st century global Miami. Miami has reached a crossroads. Its economy – historically based on tourism, hospitality, transportation, and real-estate development – has deepened, diversified, and become more creative and idea-based, as banking, media, arts, education, and new technology-based industries have assumed a larger role. The region now finds itself at a critical inflection point. Through this Initiative, we hope to provide the thought leadership and awareness required to guide Miami’s evolution as a global city through data-driven research and assessments of the key trends shaping the region, disseminate this information and inform the broad strategic vision for the region’s private and public stakeholders through ongoing local convenings and briefs and bring global thought-leaders and practitioners to bear on thinking about the region’s future through high-level events and convenings on issues important to Miami and global cities.
@MIAUrbanFuture
www.miamiurbanfuture.org
BENCHMARKING MIAMI’S TALENT BASE Richard Florida is a university professor and director of cities at the Martin Prosperity Institute at the University of Toronto, a distinguished fellow at New York University’s Schack Institute of Real Estate, and a visiting fellow at Florida International University. He serves as senior editor for The Atlantic, where he cofounded and serves as editor at large for CityLab. He is also the author of the award-winning The Rise of the Creative Class. His latest book, The New Urban Crisis, was published by Basic Books in April 2017.
Steven Pedigo is the Director of Research for the Creative Class Group, a global think tank comprised of leading researchers, academics and strategists. He is also the Director of the NYU Schack Institute of Real Estate Urban Lab and a Clinical Assistant Professor for Economic Development at the NYU School of Professional Studies. Steven holds a bachelor’s degree from the University of Texas at Austin and graduate degrees from the H. John Heinz III School for Public Policy and Management at Carnegie Mellon University and the University of Illinois at Urbana-Champaign.
THE AUTHORS
RICHARD FLORIDA
STEVEN PEDIGO
@Richard_Florida
@iamstevenpedigo

3www.creativeclass.com - @creative_class
alent is a key driver of advanced economies. Highly educated and skilled individuals drive income, wages, and economic growth in cities and metros across the globe1. As Miami aspires to the ranks of leading global cities, how does its talent base stack up?
The following research brief from the Miami Urban Future Initiative provides a data-driven assessment of the Miami metro’s talent base, comparing its performance in recent years to all 53 of America’s large metros with populations of more than one million people.
We benchmark the region’s talent base across three key metrics. First, we look at occupation, measuring the share of Miami’s workforce that is employed in key knowledge, professional, and creative occupations—collectively referred to as the creative class2. Next, we look at education, measuring the share of adults with a graduate degree and/or bachelor’s degree and higher. Finally, we look at higher education, measuring the share of college and university graduates, students, and faculty. Figure 1 summarizes our key findings.
BENCHMARKING MIAMI’S TALENT BASE
T
Metric Value Rank Among Large U.S. Metros
Knowledge, Professional, and Creative Occupations 32.4% 50
Management Talent 10.6% 28
Legal Talent 1.6% 5
Healthcare Talent 5.6% 37
Arts, Media, and Design Talent 2.1% 24
Bachelor’s Degree and Higher 30.5% 42
Graduate and Professional Degrees 11.3% 39
University Graduates 94,060 8
University Student Enrollment 359,809 9
Figure 1: Miami’s Overall Talent Rankings
Note: Definitions and sources for all metrics are listed in the appendix.
Source: U.S. Census American Community Survey 2016; IPEDS, 2014-2015

KEY FINDINGS• Miami lags on its share of key knowledge, professional, and creative
occupations. With just under a million knowledge, professional, and creative workers, Miami ranks 11th among large metros on this metric. However, the metro falls behind according to its share of high-skill, high-paid workers. With just under a third (32.4 percent) of its workforce employed in knowledge, professional, and creative occupations, Miami ranks 50th among large metros and lags behind the national average of nearly 36 percent.
• Miami’s creative strength lies its legal, arts, and management occupations. Miami boasts a relatively large share of legal, arts, and management workers. Miami’s legal cluster is by far the strongest of its creative occupations, ranking ahead of the legal clusters in Boston and L.A. The sizes of Miami’s management workforce and arts, media, and design workforce also exceed the national average.
• Miami falls short of its competitors on educational attainment. With just over 30 percent of its adults having earned a bachelor’s degree and higher, Miami’s educational attainment is roughly on par with the national average but ranks far behind superstar metros like Washington, D.C. or San Jose. Miami performs slightly better according to its share of adults with a graduate degree but still falls below the U.S. average.
• Miami’s workforce is dominated by low-skill, low-wage service workers. With more than 1.4 million low-skill, low-wage service workers, Miami’s service jobs make up nearly half of its workforce. Miami has a larger share of service jobs than any other large metro except Las Vegas. In order to retain its competitiveness and strengthen its middle class, the metro must upgrade these jobs to more sustainable, family-supporting careers.
• Miami has a large pool of college students. Miami universities conferred more than 94,000 degrees and enrolled roughly 360,000 college students as of 2014-2015, ranking eighth and ninth on these measures, respectively.
4www.creativeclass.com - @creative_class

MIAMI’S TALENT BASEThe following section provides a more detailed, data-driven analysis of how Miami stacks up on key measures of talent.
KNOWLEDGE, PROFESSIONAL, AND CREATIVE CLASS TALENT• Creative Class Share. Miami ranks 50th among large U.S. metros
according to the share of its creative class workforce, which includes science and technology; arts, media, and culture; and traditional knowledge workers. With the creative class making up 32.4 percent of its total workforce (around 945,000 workers), Miami ranks ahead of just three other metros and slightly behind the national average of 35.9 percent.
• Creative Class Concentration. Miami again ranks 50th among large U.S. metros according to the concentration of its creative workforce. This figure is based on a “location quotient,” or LQ, which shows how concentrated a group or industry is compared to the U.S. as a whole3. With an LQ of 0.9, Miami’s share is 10 percent smaller than the national average and lags far behind metros like San Jose and Washington, D.C.
• Creative Class Wages. Miami ranks 49th among large U.S. metros according to the median annual earnings of its creative class. With Miami’s creative workers earning just over $54,000 a year, these wages fall behind the national average ($59,400) and comprise just half of the earnings of creative workers in San Francisco ($97,200).
5www.creativeclass.com - @creative_classwww.creativeclass.com - @creative_class

MAJOR KNOWLEDGE, PROFESSIONAL, AND CREATIVE WORKFORCE OCCUPATIONAL CLUSTERSWe now turn to the nine major occupations that make up the knowledge, professional, and creative workforce.
• Legal Talent. With around 45,000 legal workers (1.6 percent of its total workforce), Miami ranks fifth among large U.S. metros, just behind Washington, D.C., New Orleans, San Francisco, and New York. The region also ranks fifth among large U.S. metros according to the concentration of its legal workers, which is 39 percent larger than the national average.
• Arts, Media, and Design Talent. Miami ranks 24th among large U.S. metros on its share of arts, media, and design workers, which exceeds the shares for Chicago and Philadelphia. With an LQ of 1.03, Miami’s arts, media, and design workforce is 3 percent larger than the national average.
• Management. Miami ranks 28th among large U.S. metros on its share of management workers, which makes up 10.6 percent of the metro’s total workforce (nearly 310,000 workers). With an LQ of 1.03, Miami’s concentration of management workers is slightly higher than the national average.
• Healthcare Talent. Miami ranks 37th among large U.S. metros according to its share of healthcare practitioners, which makes up 5.6 percent of its total workforce. This places the metro ahead of Chicago, Seattle, and San Francisco, alongside Houston, and just behind New York. Miami’s total number of healthcare practitioners (163,000) is similar to that of Washington, D.C., and its concentration is 6 percent smaller than the national average.
• Business and Finance Talent. Miami ranks 45th among large U.S. metros according to the share of its workers employed in business and finance occupations. While the size of Miami’s business and finance workforce (nearly 135,000 workers) is similar to that of Seattle and Minneapolis, Miami ranks much further behind these metros according to its relative share of business and finance workers (4.6 percent of the metro’s total). With an LQ of 0.95, Miami’s concentration of business and finance talent is 5 percent smaller than the national average.
MIAMI’S TALENT BASE // CONTINUED
6www.creativeclass.com - @creative_classwww.creativeclass.com - @creative_class

Talent Metric Location Quotient (LQ) Share of Workforce Rank Among Large U.S. Metros
Legal Talent 1.39 1.6% 5
Arts, Media, and Design Talent 1.03 2.1% 24
Management Talent 1.03 10.6% 28
Healthcare Talent 0.94 5.6% 37
Business and Finance Talent 0.95 4.6% 45
Science Talent 0.46 0.4% 50
Education Talent 0.78 4.6% 51
Computer and Math Talent 0.64 1.9% 51
Architecture and Engineering Talent 0.59 1.1% 51
• Scientific Talent. Miami ranks 50th among large U.S. metros according to the share of its workers employed in science-related occupations, coming in far behind superstar metros like Boston, San Francisco, and Washington, D.C. With an LQ of 0.46, Miami’s science workforce is less than half the average national share.
• Computer and Math Talent. Miami ranks 51st among large U.S. metros on its share of workers employed in computer and mathematical occupations. With nearly 55,000 computer and mathematical workers (1.9 percent of the total workforce), Miami ranks behind all large U.S. metros except New Orleans and Riverside. With an LQ of 0.64, Miami’s computer and mathematical workforce is 36 percent smaller than the national average.
• Architecture and Engineering. Miami ranks 51st among large U.S. metros on its share of workers employed in architecture and engineering occupations. With nearly 32,000 architecture and engineering workers (1.1 percent of the total workforce), Miami falls just behind New York on this metric. With an LQ of 0.59, Miami’s architecture and engineering workforce is 41 percent smaller than the national average.
• Education Workers. Miami also ranks 51st among large U.S. metros according to its share of workers employed in education-related occupations, ranking alongside Sunbelt metros like Las Vegas, Orlando, and Tampa. While the metro has a significant number of education workers (nearly 135,000), these workers make up only 4.6 percent of the metro’s total workforce. With an LQ of 0.78, Miami’s education workforce is also 22 percent smaller than the national average.
MIAMI’S TALENT BASE > MAJOR KNOWLEDGE, PROFESSIONAL, AND CREATIVE WORKFORCE OCCUPATIONAL CLUSTERS // CONTINUED
Figure 2: Miami’s Creative Occupational Talent Metrics
Note: Large metros are those with more than one million people. National average equals 1.0. Location quotient, or LQ, refers to how concentrated an industry is compared to the U.S. as a whole.
Source: U.S. Census American Community Survey 2016
7www.creativeclass.com - @creative_classwww.creativeclass.com - @creative_class

SPOTLIGHT: ARTS, MEDIA, AND DESIGN TALENTMiami’s arts, media, and design cluster is the backbone of its creative economy, making up around 6.4 percent of its creative workforce. This cluster grew by 7.1 percent from 2011 to 2015 and is projected to grow by 8 percent from 2015 to 2024.
Many of the leading occupations within this cluster are directly related to the media industry. Miami has a huge competitive advantage in key occupations like broadcast technicians (LQ of 1.58), camera operators (1.53), sound engineers (1.42), film and video editors (1.38), broadcast news analysts (1.35), and radio and television announcers (1.23). Miami also has a significant advantage in terms of its number of interior designers (1.39), makeup artists (1.35), and entertainers and performers (1.21).
Miami’s advertising and marketing occupations tend to earn the highest salaries (around $77,400 each year) compared to other arts, media, and design workers and are expected to see the most significant job growth (14.4 percent) from 2015 to 2024. The next-highest earnings come from music and theater occupations ($47,600), followed closely by media ($45,300) and design ($42,300). Meanwhile, Miami’s visual arts occupations earn an average annual salary of just $38,000 and saw the least job growth (5.4 percent) from 2010 to 2015.
Occupation Location Quotient (LQ)
Broadcast Technicians 1.58
Camera Operators (Television, Video, and Motion Picture) 1.53
Sound Engineering Technicians 1.42
Interior Designers 1.39
Film and Video Editors 1.38
Broadcast News Analysts 1.35
Makeup Artists (Theatrical and Performance) 1.35
Radio and Television Announcers 1.23
Entertainers and Performers 1.21
Figure 3: Miami’s Leading Arts, Media, and Design Occupations
Note: Occupations include both payroll and self-employed individuals.
Source: EMSI 2015 and CCG Analysis 2015
8www.creativeclass.com - @creative_class

SERVICE AND WORKING CLASSES Miami’s remaining workforce can be broken down into the service and working classes.
• Service Class. Nearly 1.5 million workers in Miami are members of the service class, which consists of low-skill, low-paying jobs in fields like food preparation and service, retail trade, personal care, and clerical and administrative positions. Altogether, the service class makes up nearly half of Miami’s workforce—the second-highest share in the nation, behind Las Vegas and significantly higher than the national average (43.1 percent). And yet, Miami’s service class earns around $1,500 less each year than the national average.
• Working Class. More than half a million (530,000) workers in Miami are members of the working class, which consists mostly of blue-collar workers in industries like manufacturing, construction, transportation, and other manual trades. With the working class making up less than a fifth (18.2 percent) of its total workforce, Miami ranks 27th among large U.S. metros, behind Chicago, L.A., and Atlanta but ahead of Boston, San Francisco, and Washington, D.C. With an LQ of 0.9, Miami’s working class is also 10 percent smaller and earns nearly $6,000 less each year than the national average.
MIAMI’S TALENT BASE // CONTINUED
Figure 4: Service Sector for Large Metros
Note: Large metros are those with more than one million people. Ranking is based on share of residents.
Source: U.S. Census American Community Survey 2016
Rank Metro Service Class Share of Workforce
Total Number of Service Workers
Service Sector LQ
1 Las Vegas 55.5% 559,834 1.29
2 Miami 49.0% 1,428,437 1.14
3 Tucson 48.6% 211,745 1.13
4 Orlando 48.3% 566,455 1.12
5 Tampa 47.2% 652,374 1.09
6 Riverside 46.7% 882,727 1.08
7 San Antonio 46.5% 517,092 1.08
8 Buffalo 46.0% 250,403 1.07
9 Phoenix 45.9% 983,483 1.06
10 Jacksonville 45.8% 317,050 1.06
9www.creativeclass.com - @creative_class

EDUCATIONAL ATTAINMENT Educational attainment is a commonly used measure of a metro’s talent base. Highly educated workers are often found to be key drivers of regional economic growth. We determine educational attainment by the share of workers with a graduate degree and/or bachelor’s degree and higher4.
• Bachelor’s Degree and Higher. Miami ranks 42nd among large U.S. metros according to its share of adults with a bachelor’s degree and higher. With a share of 30.5 percent, Miami ranks ahead of Rustbelt metros like Detroit and Cleveland, just behind Sunbelt metros like Orlando and Phoenix, far behind a number of superstar metros, and roughly on par with the national average (31.3 percent).
• Graduate and Advanced Degrees. Miami ranks 39th among large U.S. metros according to the share of its adults with a graduate degree. With 11.3 percent of its workforce having earned this degree, Miami ranks just behind Dallas, Houston, and Los Angeles and slightly behind the national average (11.9 percent).
• Less-Educated. Miami ranks sixth among large U.S. metros according to its share of adults without a high school diploma. With a share of 15.2 percent, Miami ranks just behind three Texas metros—Houston, San Antonio, and Dallas—but ahead of New York and San Jose. Miami’s share of adults without a high school diploma also far exceeds the national average (12.5 percent).
Figure 5: Share of Adults without a High School Diploma for Large Metros
Note: Large metros are those with more than one million people. Ranking is based on share of residents.
Source: U.S. Census American Community Survey 2016
Los Angeles
Riverside
Houston
San Antonio
Dallas
Miami
Las Vegas
New Orleans
New York
San Diego
20.1%
20.0%
16.7%
16.2%
15.2%
15.2%
14.5%
14.2%
13.9%
13.6%
NO HIGH SCHOOL DIPLOMA, 2016METRO
MIAMI’S TALENT BASE // CONTINUED
10www.creativeclass.com - @creative_classwww.creativeclass.com - @creative_class

UNIVERSITY TALENT We now turn to three measures of Miami’s college and university talent: the number of students enrolled at colleges and universities, the number of graduates, and the number of university and college faculty.
• College and University Enrollment. Miami is one of America’s premier college towns, ranking particularly high—ninth among large U.S. metros—according to its university student enrollment for the 2014-2015 school year. With around 360,000 students enrolled in Miami colleges, the metro ranks behind Dallas and Boston but ahead of Houston and San Francisco.
• That said, Miami ranks significantly lower—33rd among large U.S. metros—according to the number of students enrolled in universities for every 100,0000 residents. (This metric provides a more accurate depiction of Miami’s student enrollment by controlling for the size of its population.) With around 5,900 college-enrolled students for every 100,000 residents, Miami ranks ahead of New York but far behind other superstar metros like L.A. and Boston.
• College and University Degrees. Miami ranks 18th among large U.S. metros according to the number of degrees conferred by its college and universities. With around 94,000 degrees awarded (2.3 percent of the U.S. total), Miami ranks ahead of Dallas and San Diego, alongside Washington, D.C., Boston, and Philadelphia, but far behind Phoenix, Chicago, L.A., and New York.
• Miami ranks 21st among large U.S. metros according to the number of degrees conferred by its college and universities for every 100,000 residents. With slightly more than 1,500 degrees conferred for every 100,000 residents, Miami ranks just behind Washington, D.C. but ahead of Chicago and L.A.
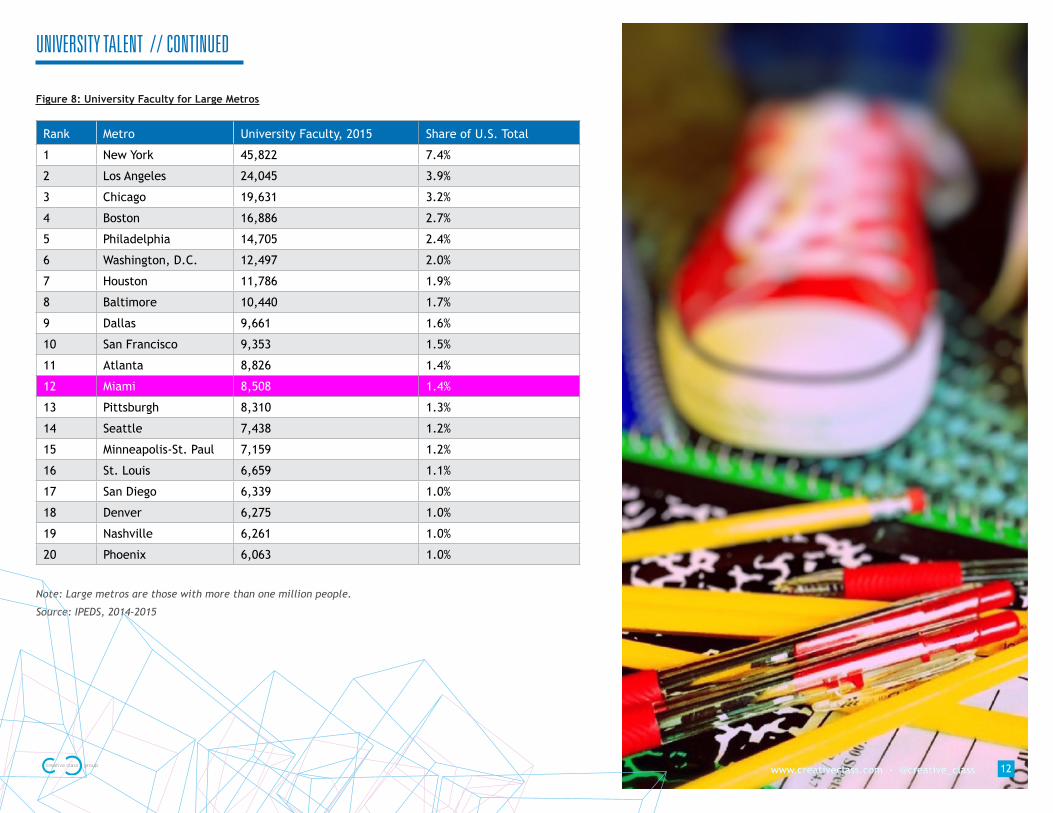
• University Faculty. Miami ranks 12th among large U.S. metros according to the size of its university faculty in 2015. With more than 8,500 university faculty members, Miami ranks ahead of Pittsburgh and Seattle but behind Atlanta and San Francisco.
Miami ranks much lower—46th among large U.S. metros—according to the size of its university faculty per 100,000 residents. With just 140 university faculty members for every 100,000 residents, Miami ranks alongside a number of Sunbelt metros, including Orlando, Charlotte, Dallas, and Phoenix.
Rank Metro University Student Enrollment Share of U.S. Total
1 New York 1,129,174 6.1%
2 Los Angeles 1,077,010 5.8%
3 Chicago 601,049 3.3%
4 Phoenix 527,629 2.9%
5 Washington, D.C. 426,048 2.3%
6 Philadelphia 405,579 2.2%
7 Boston 378,034 2.0%
8 Dallas 367,628 2.0%
9 Miami 359,809 1.9%
10 San Diego 318,932 1.7%
Rank Metro University Student Enrollment Share of U.S. Total
1 New York 273,226 6.7%
2 Los Angeles 203,633 5.0%
3 Chicago 145,949 3.6%
4 Phoenix 129,900 3.2%
5 Philadelphia 95,891 2.3%
6 Boston 95,861 2.3%
7 Washington, D.C. 95,453 2.3%
8 Miami 94,060 2.3%
9 Dallas 73,572 1.8%
10 San Diego 67,214 1.6%
Figure 6: University Student Enrollment for Large Metros
Figure 7: University Degrees Conferred for Large Metros
Note: Large metros are those with more than one million people.
Source: IPEDS, 2014-2015
Note: Based on degrees conferred. Large metros are those with more than one million people.
Source: IPEDS, 2014-2015
MIAMI’S TALENT BASE // CONTINUED
www.creativeclass.com - @creative_class 11www.creativeclass.com - @creative_class
UNIVERSITY TALENT // CONTINUED
Note: Large metros are those with more than one million people.
Source: IPEDS, 2014-2015
Figure 8: University Faculty for Large Metros
Rank Metro University Faculty, 2015 Share of U.S. Total
1 New York 45,822 7.4%
2 Los Angeles 24,045 3.9%
3 Chicago 19,631 3.2%
4 Boston 16,886 2.7%
5 Philadelphia 14,705 2.4%
6 Washington, D.C. 12,497 2.0%
7 Houston 11,786 1.9%
8 Baltimore 10,440 1.7%
9 Dallas 9,661 1.6%
10 San Francisco 9,353 1.5%
11 Atlanta 8,826 1.4%
12 Miami 8,508 1.4%
13 Pittsburgh 8,310 1.3%
14 Seattle 7,438 1.2%
15 Minneapolis-St. Paul 7,159 1.2%
16 St. Louis 6,659 1.1%
17 San Diego 6,339 1.0%
18 Denver 6,275 1.0%
19 Nashville 6,261 1.0%
20 Phoenix 6,063 1.0%
12www.creativeclass.com - @creative_classwww.creativeclass.com - @creative_class

BRAIN DRAIN AND TALENT RETENTION Like many metros, Miami must confront the growing challenge of brain drain, or the outmigration of graduate talent. While there are no perfect measures of brain drain or brain gain, a good approximation comes from talent retention levels at colleges and universities.
• Graduate Retention (All Colleges). Miami ranks 16th among large U.S. metros according to the share of college graduates from two- and four-year institutions that remain in the metro following graduation. With more than two-thirds (67.3 percent) of its college graduates choosing to stick around, Miami ranks ahead of San Francisco but slightly behind L.A. and San Jose.
• Graduate Retention (Four-Year Institutions). Miami also ranks 16th among large U.S. metros according to the share of graduates from four-year colleges that remain in the metro following graduation (59.6 percent). This places the metro just behind San Francisco and slightly further behind superstar metros like New York and L.A.
Despite conventional wisdom, Miami does reasonably well at retaining its graduate students. It is time for the region to reconsider its longstanding fixation on brain drain and instead focus on its more enviable position as a global hub of brain circulation—a phenomenon that propelled Silicon Valley’s evolution as an international center for innovation5.
Rank Metro Retention Rate
1 Detroit 77.7%
2 Houston 75.9%
3 New York 74.2%
4 Seattle 73.6%
5 Atlanta 73.2%
6 Dallas 71.8%
7 Portland 70.9%
8 Riverside 70.9%
9 Chicago 70.0%
10 Minneapolis-St. Paul 69.5%
11 San Jose 69.4%
12 Denver 68.4%
13 Los Angeles 68.4%
14 St. Louis 67.9%
15 Louisville 67.7%
16 Miami 67.3%
17 San Francisco 67.3%
18 Memphis 67.0%
19 Cleveland 65.7%
20 Indianapolis 65.2%
Figure 9: College Graduate Retention (Two- and Four-Year Institutions) for Large Metros
Note: Rates refer to the share of students from full-time and part-time adjusted fall 2012 cohorts that were still enrolled in fall 2013. Large metros are those with more than one million people.
Source: Jonathan Rothwell and Siddharth Kulkarni / Brookings Institution Metropolitan Policy Program
UNIVERSITY TALENT // CONTINUED
13www.creativeclass.com - @creative_classwww.creativeclass.com - @creative_class

Rank Metro Retention Rate
1 New York 71.1%
2 Riverside 70.6%
3 Detroit 70.2%
4 Houston 66.1%
5 San Jose 65.2%
6 Seattle 64.4%
7 Atlanta 64.2%
8 Dallas 63.7%
9 Louisville 63.0%
10 Los Angeles 62.9%
11 Chicago 62.2%
12 Portland 61.7%
13 Denver 61.7%
14 Minneapolis 61.7%
15 San Francisco 60.8%
16 Miami 59.6%
17 Indianapolis 57.0%
18 St. Louis 56.5%
19 Las Vegas 55.0%
20 Salt Lake City 55.0%
Figure 10: College Graduate Retention (Four-Year Institutions) for Large Metros
Note: Rates refer to the share of students from full-time and part-time adjusted fall 2012 cohorts that were still enrolled in fall 2013. Large metros are those with more than one million people.
Source: Jonathan Rothwell and Siddharth Kulkarni / Brookings Institution Metropolitan Policy Program
UNIVERSITY TALENT // CONTINUED
14www.creativeclass.com - @creative_classwww.creativeclass.com - @creative_class
APPENDIX
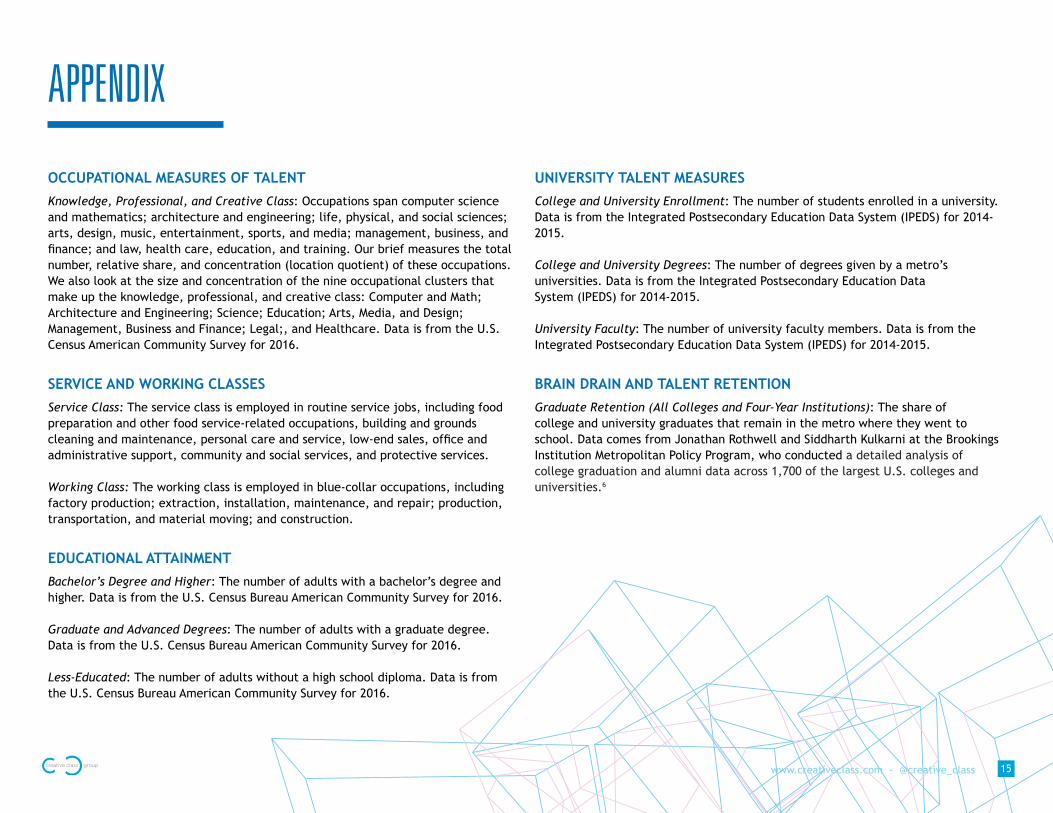
OCCUPATIONAL MEASURES OF TALENTKnowledge, Professional, and Creative Class: Occupations span computer science and mathematics; architecture and engineering; life, physical, and social sciences; arts, design, music, entertainment, sports, and media; management, business, and finance; and law, health care, education, and training. Our brief measures the total number, relative share, and concentration (location quotient) of these occupations. We also look at the size and concentration of the nine occupational clusters that make up the knowledge, professional, and creative class: Computer and Math; Architecture and Engineering; Science; Education; Arts, Media, and Design; Management, Business and Finance; Legal;, and Healthcare. Data is from the U.S. Census American Community Survey for 2016.
SERVICE AND WORKING CLASSES Service Class: The service class is employed in routine service jobs, including food preparation and other food service-related occupations, building and grounds cleaning and maintenance, personal care and service, low-end sales, office and administrative support, community and social services, and protective services.
Working Class: The working class is employed in blue-collar occupations, including factory production; extraction, installation, maintenance, and repair; production, transportation, and material moving; and construction.
EDUCATIONAL ATTAINMENTBachelor’s Degree and Higher: The number of adults with a bachelor’s degree and higher. Data is from the U.S. Census Bureau American Community Survey for 2016.
Graduate and Advanced Degrees: The number of adults with a graduate degree. Data is from the U.S. Census Bureau American Community Survey for 2016.
Less-Educated: The number of adults without a high school diploma. Data is from the U.S. Census Bureau American Community Survey for 2016.
UNIVERSITY TALENT MEASURES College and University Enrollment: The number of students enrolled in a university. Data is from the Integrated Postsecondary Education Data System (IPEDS) for 2014-2015.
College and University Degrees: The number of degrees given by a metro’s universities. Data is from the Integrated Postsecondary Education Data System (IPEDS) for 2014-2015.
University Faculty: The number of university faculty members. Data is from the Integrated Postsecondary Education Data System (IPEDS) for 2014-2015.
BRAIN DRAIN AND TALENT RETENTIONGraduate Retention (All Colleges and Four-Year Institutions): The share of college and university graduates that remain in the metro where they went to school. Data comes from Jonathan Rothwell and Siddharth Kulkarni at the Brookings Institution Metropolitan Policy Program, who conducted a detailed analysis of college graduation and alumni data across 1,700 of the largest U.S. colleges and universities.6
15www.creativeclass.com - @creative_class

1. Richard Florida, “Talent Beats Trade in Economic Development,” CityLab, September 11, 2012, https://www.citylab.com/life/2012/09/talent-beats-trade-economic-development/3083/.
2. Richard Florida, The New Urban Crisis, Basic Books, 2017; Richard Florida, “The Creative Class and Economic Development,” Economic Development Quarterly 28: no. 196 (2014), 196-2015.
3. Rob Sentz, “Understanding Location Quotient,” Esmi, October 14, 2011, http://www.economicmodeling.com/2011/10/14/understanding-location-quotient-2/.
4. Edward Glaeser, Triumph of the City, Penguin Books, 2011.
5. AnnaLee Saxenian, “Brian Circulation: How High-Skill Immigration Makes Everyone Better Off,” The Brookings Institution, December 1, 2002, http://www.brookings.edu/research/articles/2002/12/winter-immigration-saxenian.
6. Jonathan Rothwell and Siddharth Kulkarni, “Beyond College Rankings: A Value-Added Approach to Assessing Two- and Four-Year Schools,” The Brookings Institution Metropolitan Policy Program, April 2015, https://www.brookings.edu/wp-content/uploads/2015/04/BMPP_CollegeValueAdded.pdf.
REFERENCES
16www.creativeclass.com - @creative_classwww.creativeclass.com - @creative_class