Benchmarking for Power and Performance - SPEC...Benchmarking for Power and Performance Heather...
6
Benchmarking for Power and Performance Heather Hanson †* , Karthick Rajamani * Juan Rubio * , Soraya Ghiasi * and Freeman Rawson * * IBM Austin Research Lab † The University of Texas at Austin {karthick,rubioj,sghiasi,frawson}@us.ibm.com, [email protected] Abstract— There has been a tremendous increase in focus on power consumption and cooling of computer systems from both the design and management perspec- tives. Managing power has significant implications for system performance, and has drawn the attention of the computer architecture and systems research communities. Researchers rely on benchmarks to develop models of system behavior and experimentally evaluate new ideas. But benchmarking for combined power and performance analysis has unique features distinct from traditional per- formance benchmarking. In this extended abstract, we present our experi- ences with adapting performance benchmarks for use in power/performance research. We focus on two areas: the problem of variability and its effect on system power management and that of collecting correlated power and performance data. For the first, we have learned that benchmarks should capture the two sources of workload variability - intensity and nature of activity - and the benchmarking process should take into account the inherent variation in component power. Benchmarks not only have to test across all of these forms of variability, but they also must capture the dynamic nature of real workloads and real systems. The workload and the system’s response to it change across time, and how fast and well the system responds to change is an important consideration in evaluating its power management capabilities. In the second area, we have developed tools for collecting correlated power and performance data, and we briefly discuss our experience with them. I. I NTRODUCTION There has been a tremendous increase in focus on power and cooling of computer systems both from design and management perspectives. At the same time, there is an increasing interest in understanding the performance effects of power management actions. Most power man- agement actions such as dynamic voltage and frequency scaling have performance consequences, and understand- ing the trade-offs between power and performance is important at all levels of system design. Historically, performance measurement has concerned itself solely with peak sustained throughput or minimal sustained latency. The idea has been to apply a sustained load that drives the system to its peak performance. Power consumption has significant unique characteristics that need to be understood in relation to a broad spectrum of system loads. Systems are not always run at full capacity, and designers and users need to understand the power consumption and the performance that they are capable of delivering across the entire range of load intensity, from idle to peak capacity. At the same time, benchmarking for power and performance presents a more complex measurement problem than has existed for per- formance benchmarking alone. Power and performance data must be correlated with each other through time. Simple end-to-end numbers, t transactions consuming j Joules over s seconds do not provide enough information about dynamic runtime behavior. Thus, benchmarking for power and performance requires a broader approach to benchmark creation and execution than traditionally adopted for performance comparison purposes alone. Our primary concern is with the development and evaluation of techniques for system- and data center-level power management. We have made extensive use of exist- ing performance benchmarks, supplemented with power measurements, to develop models of system behavior and to evaluate our ideas and prototype implementations. Based on our experience, we believe that power and performance are affected by three types of variability. To serve the computer systems design and management communities, benchmarks must capture the time-varying nature, of real workloads, including the fact that the rate of time variation can itself change during the lifetime of the benchmark. To capture the real impact of the joint management of power and performance on systems, benchmarks need to address variability in activity among different workloads (for example, the differences between high-powered compute-bound programs and lower-power programs that stall often waiting for data from memory).
Transcript of Benchmarking for Power and Performance - SPEC...Benchmarking for Power and Performance Heather...
Benchmarking for Power and PerformanceHeather Hanson†∗, Karthick Rajamani∗ Juan Rubio∗, Soraya Ghiasi∗ and Freeman Rawson∗
∗IBM Austin Research Lab† The University of Texas at Austin
{karthick,rubioj,sghiasi,frawson}@us.ibm.com, [email protected]
Abstract— There has been a tremendous increase infocus on power consumption and cooling of computersystems from both the design and management perspec-tives. Managing power has significant implications forsystem performance, and has drawn the attention of thecomputer architecture and systems research communities.Researchers rely on benchmarks to develop models ofsystem behavior and experimentally evaluate new ideas.But benchmarking for combined power and performanceanalysis has unique features distinct from traditional per-formance benchmarking.
In this extended abstract, we present our experi-ences with adapting performance benchmarks for use inpower/performance research. We focus on two areas: theproblem of variability and its effect on system powermanagement and that of collecting correlated power andperformance data. For the first, we have learned thatbenchmarks should capture the two sources of workloadvariability - intensity and nature of activity - and thebenchmarking process should take into account the inherentvariation in component power. Benchmarks not only haveto test across all of these forms of variability, but theyalso must capture the dynamic nature of real workloadsand real systems. The workload and the system’s responseto it change across time, and how fast and well thesystem responds to change is an important consideration inevaluating its power management capabilities. In the secondarea, we have developed tools for collecting correlatedpower and performance data, and we briefly discuss ourexperience with them.
I. INTRODUCTION
There has been a tremendous increase in focus onpower and cooling of computer systems both from designand management perspectives. At the same time, there isan increasing interest in understanding the performanceeffects of power management actions. Most power man-agement actions such as dynamic voltage and frequencyscaling have performance consequences, and understand-ing the trade-offs between power and performance isimportant at all levels of system design. Historically,
performance measurement has concerned itself solelywith peak sustained throughput or minimal sustainedlatency. The idea has been to apply a sustained loadthat drives the system to its peak performance. Powerconsumption has significant unique characteristics thatneed to be understood in relation to a broad spectrumof system loads. Systems are not always run at fullcapacity, and designers and users need to understandthe power consumption and the performance that theyare capable of delivering across the entire range of loadintensity, from idle to peak capacity. At the same time,benchmarking for power and performance presents a morecomplex measurement problem than has existed for per-formance benchmarking alone. Power and performancedata must be correlated with each other through time.Simple end-to-end numbers, t transactions consuming j
Joules over s seconds do not provide enough informationabout dynamic runtime behavior. Thus, benchmarkingfor power and performance requires a broader approachto benchmark creation and execution than traditionallyadopted for performance comparison purposes alone.
Our primary concern is with the development andevaluation of techniques for system- and data center-levelpower management. We have made extensive use of exist-ing performance benchmarks, supplemented with powermeasurements, to develop models of system behaviorand to evaluate our ideas and prototype implementations.Based on our experience, we believe that power andperformance are affected by three types of variability.To serve the computer systems design and managementcommunities, benchmarks must capture the time-varyingnature, of real workloads, including the fact that the rateof time variation can itself change during the lifetimeof the benchmark. To capture the real impact of thejoint management of power and performance on systems,benchmarks need to address variability in activity amongdifferent workloads (for example, the differences betweenhigh-powered compute-bound programs and lower-powerprograms that stall often waiting for data from memory).

Lastly, the impact of systems needs to be captured byexposing the variability in power consumption character-istics among system components.
Not only do benchmarks have to capture variability inworkloads, across different components and at differentlevels of intensity, but they also must deal with thecomplexities of collecting and reporting two distinct typesof quantities – power and performance.
II. POWER VARIATION WITH WORKLOADS
The difference in power consumption due to workloadhas been recognized by several benchmarking organi-zations. As part of the Energy Star program, the U.S.Environmental Protection Agency developed a protocol tomeasure power under different performance settings [1].This document recommends that system vendors providecurves that show the power consumption under differentloads. The process for producing this curve consists inrunning the workload applying the maximum load to thesystem (100%), followed by runs with reduced loads untilthe system under test reaches an idle state (0%). It isexpected that system consumers can use this curve toestimate their overall energy consumption by multiplyingtheir average system utilization with the appropriate pointin the curve.
A. Sources of VariationSystem utilization is a measure of the percentage of
time that non-idle tasks run on the processor. Unlikebenchmarks designed to test the peak performance of asystem, real workloads exhibit a wide range in workloadintensity. Figure 1 shows the variation in web serverload from traces collected at two web-sites. Systems canincorporate power management solutions like dynamicvoltage and frequency scaling, such as Intel’s demand-based switching, that exploit this variation for higherpower efficiencies. It is important that benchmarks de-signed for system power comparison capture real-worldvariation in workload intensity to differentiate among thepower management capabilities of different systems. Anapproach to integrating real-world load variation with apeak-performance benchmark is presented in [2] wherethe TPC-W [3] benchmark is modified with the loadprofiles from real web-sites for developing a workloadto evaluate power management solutions.
Figure 2 shows the system utilization of the NYSEprofile in more detail. The NYSE website shows littleactivity during non-core business hours and a strong spikein usage during the day. Traditional allocation of tasks to
0%
20%
40%
60%
80%
100%
Time
Norm
alize
d Lo
ad
NYSE OlympicsFig. 1. Server utilization through a 24-hour period.
processors in the system attempts to load balance betweenall available processor. Dynamic voltage and frequencyscaling can take advantage of periods of low utilization byslowing the processors uniformly. An alternative approachis shown in Figure 3. In this case, the running tasks asso-ciated with the TPC-W workload are coalesced onto theminimum number of processors required to support theworkload without showing a reduction in performance.During periods of low activity, only a single processor ispowered and the remaining are put into a deep power-saving mode [4].
The EPA approach to power management does notcurrently capture this type of dynamic behavior. If datacenter operators provisioned power to account for averageutilization of the NYSE profile (∼43%), periods of peakactivity would present such a large draw that systemswould fail. An assumption of constant utilization ignoresthe realities of many workloads deployed in the realworld. Figure 1 shows the global nature of the Inter-net does not eliminate the variation seen over time asevidenced by the variation in system utilization for atrace collected on the 1998 Nagano Winter Olympics website. Any new power and performance benchmarks shouldreflect the time varying nature of system utilization.
While system utilization has an enormous impact onpower consumption it is not the only workload character-istic that must be considered. How a workload uses theresources of the processor also has significant impact onthe power consumption of the system. Figure 6 showsthe performance variation, as measured by Instructionsper Cycle (IPC), while Figure 5 shows the variationin processor chip power as different SPEC CPU2000benchmarks are executed on the processor. During this

0
50
100
150
200
250
300
350
1 6 11 16 21 26 31 36 41 46 51 56Time (minutes)
Utiliz
atio
n (%
)CPU 0 CPU 1 CPU 2 CPU 3
Fig. 2. Typical processor allocation would load balance the NYSErequests over all available processors, even when the extra processorsare not needed to meet performance guarantees.
0
50
100
150
200
250
300
350
2 7 12 17 22 27 32 37 42 47 52 57Time (minutes)
Utiliz
atio
n (%
)
CPU 0 CPU 1 CPU 2 CPU 3
Fig. 3. The NYSE requests can be packed onto a smaller number ofprocessors, allowing additional power savings modes to be utilized.
execution the system perceived utilization is 100% - allthe variability in power consumption can be traced to thedifference in microarchitecture-level activity among theworkloads and can be potentially exploited in intelligentpower management solutions [5]. Similar variation inpower consumption has been observed even in earliergeneration (Pentium 4) processors [6] and will be increas-ingly evident on newer processors as they employ fineractivity-oriented circuit-level power-reduction techniqueslike clock gating and power gating more extensively.
The current EPA approach to power managementmeasurement does not address this type of variation.A Pentium M system under identical system utiliza-tion, but with different workloads running can con-
sume power that varies by almost a factor of two. Itis important that new benchmarks that are designedfor system-power-comparison studies capture this rangeof microarchitecture-level activity in order to repre-sent the inherent variability in real workloads. A goodpower/performance benchmark needs to measure the re-sponse of the system under test to this type of variability.
Fig. 4. IPC variation for SPEC CPU2000 on a 2GHz Intel Pentium M.
2
4
6
8
10
12
14
16
18
0 500 1000 1500 2000 2500 3000 3500 4000
powe
r (W
atts
)
time (seconds)
Fig. 5. Power variation for SPEC CPU2000 on a 2GHz IntelPentium M.
A characteristic of both system utilization and micro-architectural utilization is the rate of change of activity orintensity. Workloads vary over time and the time scalesat which they vary can be very different. Some thingschange quickly, others more slowly. Benchmarks mustbe sensitive to the change over time AND the rate ofchange over time. The time function and its derivativeboth matter.
The rate of change can dictate what power managementmechanisms can be adopted without harming performancemore than a customer is willing to tolerate. For exam-ple, at the circuit-level clock gating has a much loweroverhead than power gating. At the microarchitecural-
0 2000 4000 6000 8000 10000 120000
0.5
1
1.5
2
2.5
samples
IPC
0 500 1000 1500 2000 2500 3000 3500 4000 4500 50000
0.5
1
1.5
IPC
samples
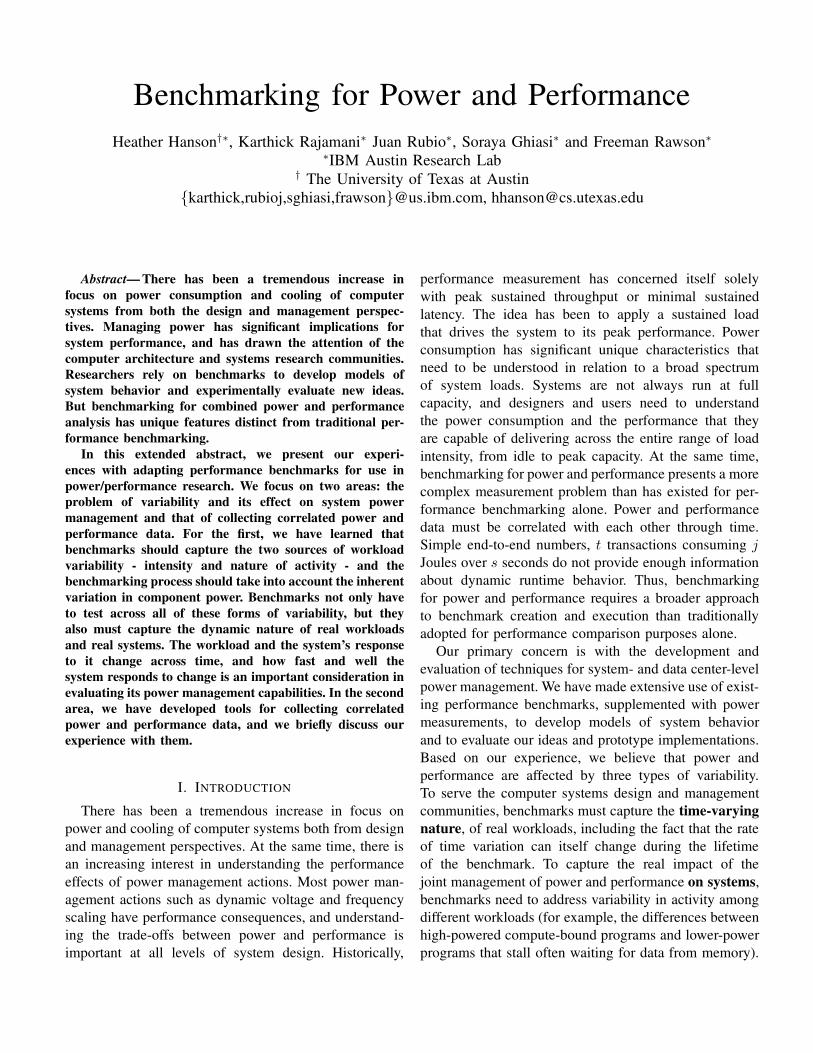
Fig. 6. Measured IPC for selected SPEC CPU2000 benchmarks: (a)gzip, (b) gcc.
level and system-level clock or pipeline throttling andfrequency scaling are significantly faster to initiate andhave lower overheads than supply voltage scaling, whichin turn has lower overheads than powering modules orsub-systems on or off. Figure 6 shows two applications– gzip which exhibits a number of different stablephases and gcc which has much more chaotic behavior.The techniques applicable to gzip can have start andend overhead, while gcc limits the power managementresponses to only those which can respond rapidly.
The current EPA approach does not consider the rateof change in the workloads or system utilization. Atechnique such as nap mode may work very well for acurrent-generation transactional web benchmark, but mayfail miserably when a new dynamic page is added thatrequires running a highly variable workload, one withexecution characteristics similar to gcc, to generate data.The importance of this time-varying nature of workloadsis discussed in [2] for a power management solution for aserver cluster. Thus, a power/performance-benchmarkingworkload should strive to capture realistic temporal vari-ation in workload activity to contrast the different power
1.10
1.08
1.03
1.08
1.00
0.94
0.96
0.98
1.00
1.02
1.04
1.06
1.08
1.10
1.12
Part 1 Part 2 Part 3 Part 4 Part 5
Norm
aliz
ed P
ower
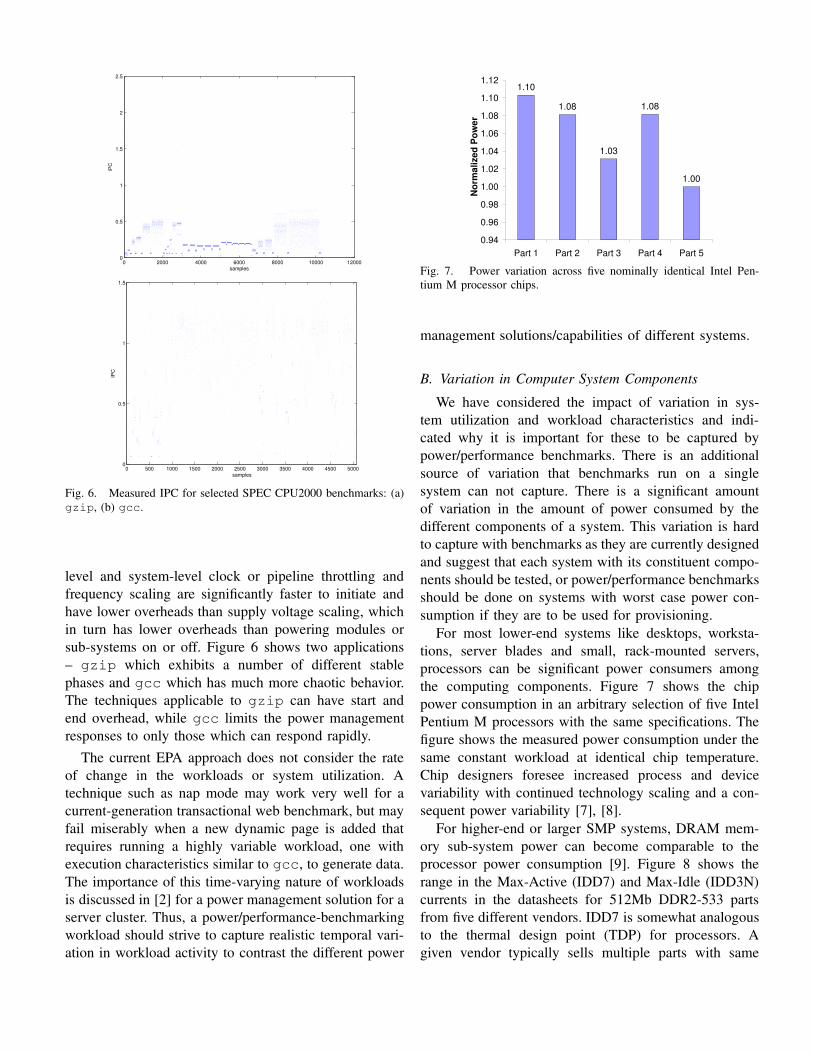
Fig. 7. Power variation across five nominally identical Intel Pen-tium M processor chips.
management solutions/capabilities of different systems.
B. Variation in Computer System ComponentsWe have considered the impact of variation in sys-
tem utilization and workload characteristics and indi-cated why it is important for these to be captured bypower/performance benchmarks. There is an additionalsource of variation that benchmarks run on a singlesystem can not capture. There is a significant amountof variation in the amount of power consumed by thedifferent components of a system. This variation is hardto capture with benchmarks as they are currently designedand suggest that each system with its constituent compo-nents should be tested, or power/performance benchmarksshould be done on systems with worst case power con-sumption if they are to be used for provisioning.
For most lower-end systems like desktops, worksta-tions, server blades and small, rack-mounted servers,processors can be significant power consumers amongthe computing components. Figure 7 shows the chippower consumption in an arbitrary selection of five IntelPentium M processors with the same specifications. Thefigure shows the measured power consumption under thesame constant workload at identical chip temperature.Chip designers foresee increased process and devicevariability with continued technology scaling and a con-sequent power variability [7], [8].
For higher-end or larger SMP systems, DRAM mem-ory sub-system power can become comparable to theprocessor power consumption [9]. Figure 8 shows therange in the Max-Active (IDD7) and Max-Idle (IDD3N)currents in the datasheets for 512Mb DDR2-533 partsfrom five different vendors. IDD7 is somewhat analogousto the thermal design point (TDP) for processors. Agiven vendor typically sells multiple parts with same

1.00
1.00
1.52
1.16
1.55
1.28
2.07
1.51
1.52
1.51
0.0
0.5
1.0
1.5
2.0
2.5
Max Active (Idd7) Max Idle (Idd3N)
Norm
aliz
ed C
urre
nt/P
ower
Vendor 1 Vendor 2 Vendor 3 Vendor 4 Vendor 5
Fig. 8. Power variation across five 512 MB DDR2-533 4-4-4 DRAMparts.
performance, but different power characteristics. Also, asthe fabrication process is tuned over time, manufacturersare typically able to lower the power consumption forthe same performance, a phenomenon that holds true forprocessors as well.
Depending on the system configuration, other com-ponents like disks, chipsets, graphics sub-system, etc.,can also be significant power consumers with somewhatsimilar inherent variability in their power consumption forthe same capability/performance. An illustrative exampleusing the processors and memory from Figures 7 and 8highlights the variation in total power that componentscan have. A data center administrator starts with thelowest powered parts and then replaces them as they failover time. A system which originally consumed at most20 Watts, may now consume 22 Watts. A single systemconsuming 2 additional Watts may not be problematic, buta 10% increase in power consumption across the entiredata center may exceed power and cooling capacities.
Another source of variability in the power drawn by thesystem comes from the efficiency of the power suppliesand converters used in the system. A survey of AC-DCsupplies by Calwell and Mansoor [10] arguing for moreusage of efficient power supplies shows that currentlymarketed power supplies range in efficiency from around60% to over 85%.
As a consequence of the variability in power con-sumption for same performance, assessing relative power-efficiencies of two systems becomes more difficult. Onemust account for or neutralize the difference in compo-nent variabilities (even if using ones with identical specifi-cations) between two systems before using their measuredpower to determine the difference from fundamentaldesign differences. Also if wall-power/AC is measured forthe two systems, but comparison is sought between the
efficiencies of the systems after the DC conversion by thepower supply, one may need to account for the potentialdifference in efficiencies between the power supplies.This problem is difficult not only because different powersupplies have different efficiencies, but also because asingle power supply has different efficiencies at differentloads.
III. POWER / PERFORMANCE MEASUREMENTTECHNIQUES
We have used a number of different platforms anddata-collection schemes in joint power/performance ex-periments. The most sophisticated method is describedhere to indicate what can be done, and how we have beenable to collect correlated power/performance data tracesfor modeling and evaluation.
The experimental infrastructure uses a Pentium M755 (90 nm Dothan) with Enhanced SpeedStep, whichsupports dynamic voltage and frequency scaling. ARadisys system board [11] with high-precision senseresistors between the processor and each of two voltageregulators is used to measure the power consumption ofthe processor. Figure 9 shows a diagram of the config-uration. The power measurement system is non-intrusiveand has a peak sampling capability of 333 K samples/s.The current, calculated from measured voltage acrossthe sense resistor, and the supply voltage are filtered,amplified, digitized and collected periodically with aNational Instruments SCXI-1125 module and NationalInstruments PCI-6052E DAQ card. The data are processedby a custom LabView program executing on a separatesystem to form an output trace of power values.
Fig. 9. Experimental platform: system under test with sense resistorsand data acquisition probes to measure processor power.
We have written a program, log, that drives our datacollection. Log is an application that
• monitors processor performance• monitors environmental information• controls operating conditions.When started, the application configures the perfor-
mance counters, clock throttling, operating frequency andvoltage of the processor. To get a synchronized trace of
application performance and processor power consump-tion, we use an I/O pin on the south-bridge of the systemboard as a marker for the beginning and end of thebenchmark. Immediately before log starts a benchmark,it raises the voltage of the pin and creates an entry in itsinternal performance data-collection buffer. As soon aslog starts running the benchmark, it begins periodicallysampling the value of the performance counters in aninternal trace buffer. Sampling periods can be specified,but we have observed that selecting a value in the rangeof 5 ms results in no statistically perceivable impact overour class of applications. Once the benchmark completes,log lowers the I/O pin and outputs a performance tracefile. Once the application completes, we can synchronizeboth traces – the power trace generated by the LabViewprogram and the performance trace generated by log –using post-processing scripts.
An alternate method is to send power measurementsand the I/O pin voltage from the data-acquisition systemto the primary system via UDP network packets. There isa delay involved in receiving packets, and the samplingrate must be slower to accommodate the extra overhead;the benefit of this approach is a consolidated output filewith power and performance data for experiments withlow-resolution sampling.
In either case, synchronization of the traces is oftenimperfect and achieving proper alignment is critical formeasuring accurate power and performance. We haveused a variety of post-processing techniques, trimmingoff the ends of both traces and counting the number ofsamples in each, to get approximate time correlations.Better temporal correlation of the power and performancedata is an on-going challenge.
IV. CONCLUSIONS
Power and energy concerns are now on par withperformance concerns for computer system design andmanagement. As computer system designs evolve towardhigh-efficiency from purely high-performance, systemsare now adopting active power management mechanismslike DVFS whose power and performance impact isdetermined by workload characteristics.
In order to model systems and evaluate power-management options, researchers need benchmarks thatevaluate power and performance together. This paperdiscusses the three sources of variability, all of whichmust be exposed by the benchmarking process and thendescribes some practical issues we encountered whileadding power measurement to the benchmarking process.
As new benchmarks specifically designed for jointpower and performance evaluation are developed, de-signers need to bear in mind several considerations.First, variability in intensity over time, in workload type,and across individual systems is growing; researchersand users need benchmarks which expose all formsof variability. Second, producing correlated, meaningfulmeasurements of two different quantities – power andperformance – is much more difficult than measuringjust one of them alone. Looking forward, we believethat standardized power-performance benchmarks shouldprovide a measure of power-management effectiveness,as well as sheer performance or power, to facilitatecomparisons between system power management options.
REFERENCES
[1] U.S. Environmental Protection Agency, “Serverenergy measurement protocol,” Nov. 3 2006.http://www.energystar.gov/ia/products/downloads/Finalserverenergyprotocol-v1.pdf.
[2] K. Rajamani and C. Lefurgy, “On Evaluating Request-Distribution Schemes for Saving Energy in Server Clusters,”in IEEE International Symposium on Performance Analysis ofSystems and Software, pp. 111–122, March 2003.
[3] W. D. Smith, “TPC-W: Benchmarking an ecommerce solution.”The Transaction Processing Performance Council, Feb. 2000.
[4] S. Ghiasi and W. Felter, “Cpu packing for multiprocessor powerreduction,” in Power Aware Computer Systems (B. Falsafi andT. N. Vijaykumar, eds.), Springer-Verlag, December 2003.
[5] K. Rajamani, H. Hanson, J. Rubio, S. Ghiasi, and F. Rawson,“Application-Aware Power Management,” in Proceedings of the2006 IEEE International Symposium of Workload Characteriza-tion (IISWC-2006), October 2006.
[6] C. Isci and M. Martonosi, “Runtime power monitoring in high-end processors: Methodology and empirical data,” in 36th An-nual ACM/IEEE International Symposium on Microarchitecture,December 2003.
[7] K. Bernstein, D. J. Frank, A. E. Gattiker, W. Haensch, B. L. Ji,S. R. Nassif, E. J. Nowak, D. J. Pearson, and N. J. Rohrer, “High-performance CMOS variability in the 65-nm regime and be-yond,” The IBM Journal of Research and Development, vol. 50,pp. 433–449, July/September 2006.
[8] A. Devgan and S. Nassif, “Power variability and its impact ondesign,” in Proceedings of the 18th International Conference onVLSI Design, pp. 679–682, January 2005.
[9] C. Lefurgy, K. Rajamani, F. Rawson, W. Felter, M. Kistler, andT. W. Keller, “Energy Management for Commercial Servers,” inIEEE Computer Special Issue on Power- and Temperature-AwareComputing, December 2003.
[10] Chris Calwell and Arshad Mansoor, “AC-DC Server PowerSupplies: Making the Leap to Higher Efficiency,” in AppliedPower Electronics Conference and Exposition (APEC), March2005.
[11] Radisys Corporation, “Endura LS855 Product Data Sheet.”http://www.radisys.com/oem products/ds-page.cfm?productdatasheetsid=1158, Oct. 10 2004.