benchmarking Financial Systems around the world
30
1 Benchmarking Financial Systems around the World managerial performance, this boosts the effi- ciency of corporations and reduces waste and fraud by corporate insiders. But that is not all. When equity, bond, and derivative markets enable the diversification of risk, this encour- ages investment in higher-return projects that might otherwise be shunned. And, when financial systems lower transaction costs, this facilitates trade and specialization—fun- damental inputs to technological innovation (Smith 1776). When financial systems perform these functions poorly, they hinder economic growth, curtail economic opportunities, and destabilize economies. For example, if finan- cial systems collect funds and pass them along to cronies, the wealthy, and the politically A growing body of evidence suggests that financial institutions—such as banks and insurance companies—and finan- cial markets—stock markets, bond markets, derivative markets, and so on—exert a pow- erful influence on economic development, poverty alleviation, and economic stability (Levine 2005). For example, when banks screen borrowers and identify firms with the most promising prospects, this is a key step that helps allocate resources, expand economic opportunities, and foster growth. When banks and securities markets mobilize savings from households to invest in promising projects, this is another crucial step in fostering eco- nomic development. When financial institu- tions monitor their investments and scrutinize GLOBAL FINANCIAL DEVELOPMENT REPORT 2013 15 • Financial systems are multidimensional. Four characteristics are of particular interest for benchmarking financial systems: financial depth, access, efficiency, and stability. These characteristics need to be measured for financial institutions and markets. • Financial systems come in all shapes and sizes, and differ widely in terms of the four characteristics. As economies develop, services provided by financial markets tend to become more important than those provided by banks. • The global financial crisis was not only about financial instability. In some economies, the crisis was associated with important changes in financial depth and access.
Transcript of benchmarking Financial Systems around the world

1benchmarking Financial Systems
around the world
managerial performance, this boosts the effi-ciency of corporations and reduces waste and fraud by corporate insiders. But that is not all. When equity, bond, and derivative markets enable the diversification of risk, this encour-ages investment in higher-return projects that might otherwise be shunned. And, when financial systems lower transaction costs, this facilitates trade and specialization—fun-damental inputs to technological innovation (Smith 1776).
When financial systems perform these functions poorly, they hinder economic growth, curtail economic opportunities, and destabilize economies. For example, if finan-cial systems collect funds and pass them along to cronies, the wealthy, and the politically
A growing body of evidence suggests that financial institutions—such as
banks and insurance companies—and finan-cial markets—stock markets, bond markets, derivative markets, and so on—exert a pow-erful influence on economic development, poverty alleviation, and economic stability (Levine 2005). For example, when banks screen borrowers and identify firms with the most promising prospects, this is a key step that helps allocate resources, expand economic opportunities, and foster growth. When banks and securities markets mobilize savings from households to invest in promising projects, this is another crucial step in fostering eco-nomic development. When financial institu-tions monitor their investments and scrutinize
g l o b a l f i n a n c i a l d e v e l o p m e n t R e p o R t 2 0 1 3 15
• Financial systems are multidimensional. Four characteristics are of particular interest for benchmarking financial systems: financial depth, access, efficiency, and stability. These characteristics need to be measured for financial institutions and markets.
• Financial systems come in all shapes and sizes, and differ widely in terms of the four characteristics. As economies develop, services provided by financial markets tend to become more important than those provided by banks.
• The global financial crisis was not only about financial instability. In some economies, the crisis was associated with important changes in financial depth and access.

16 b e n c H m a R k i n g f i n a n c i a l s y s t e m s a R o u n d t H e w o R l d GLOBAL finAnciAL DEVELOPMEnT REPORT 2013
across countries and regions and through time; and how financial systems have been affected by the global financial crisis.
To benchmark financial systems, the report measures the following four charac-teristics of financial institutions and mar-kets: (a) the size of financial institutions and markets (financial depth), (b) the degree to which individuals can and do use financial institutions and markets (access), (c) the effi-ciency of financial institutions and markets in providing financial services (efficiency), and (d) the stability of financial institutions and markets (stability). These characteristics are measured separately for financial institu-tions and financial markets (both equity and bond markets), leading to a 4x2 matrix of financial system characteristics. The report uses these measures to characterize and compare financial systems across economies and over time and to assess the relationships between these measures and financial sector policies.
In focusing on these four characteristics of financial institutions and markets, the report gives empirical shape and substance to the complex, multifaceted, and sometimes amor-phous concept of the functioning of financial systems. Financial depth, access, efficiency, and stability might not capture all features of financial systems, and the report does not try to construct a composite index of financial development. Instead, it uses these four char-acteristics to describe, compare, and analyze financial systems and their evolution in recent decades.
This chapter, together with the underly-ing data and analysis, highlights the multi-dimensional nature of financial systems. Deep financial systems do not necessarily provide broad financial access, highly effi-cient financial systems are not necessarily more stable than the less efficient ones, and so on. Each of these characteristics is asso-ciated with socioeconomic development, financial sector policies, and other parts of the enabling environment for finance. Finan-cial systems differ widely in terms of the 4x2 characteristics, so it is crucial to measure and evaluate each one.
connected, it slows economic growth and blocks potential entrepreneurs. And if finan-cial institutions fail to exert sound corporate governance over firms that they fund, that failure makes it easier for managers to pursue projects that benefit themselves rather than the firms and the economy. When financial institutions create complex financial instru-ments and sell them to unsophisticated inves-tors, it might generate more income for finan-cial engineers and executives associated with marketing the new instruments, distorting the allocation of society’s savings and imped-ing economic prosperity.
Evidence on the financial system’s role in shaping economic development is substantial and varied. But there are shortcomings asso-ciated with assessing financial systems. There are no good cross-country, cross-time mea-sures of how they (a) enhance information about firms and hence the efficiency of resource allocation; (b) exert sound corporate gover-nance over firms to which they channel those resources; (c) manage, pool, and diversify risk; (d) mobilize savings from savers so that these resources can be allocated to the most prom-ising projects in the economy; and (e) facili-tate trade. Instead, researchers have largely focused on the size of the banking industry as a proxy for financial development. But size is not a measure of quality, efficiency, or stabil-ity. And the banking sector is only one part of financial systems.
Accordingly, a key contribution of this chapter involves data. In recent years, substan-tial efforts have been made to improve these data, which this chapter uses. This report is accompanied by the new Global Financial Development Database, an extensive world-wide database that combines and updates several financial data sets (Čihák, Demirgüç-Kunt, Feyen, and Levine 2012). The data-base is available on the Global Financial Development Report Web page (http://www .worldbank.org/financialdevelopment).
But this chapter goes beyond compiling data. It answers some substantive questions using the data, such as how to empirically describe different characteristics of financial systems; how to compare financial systems

GLOBAL finAnciAL DEVELOPMEnT REPORT 2013 b e n c H m a R k i n g f i n a n c i a l s y s t e m s a R o u n d t H e w o R l d 17
the background, contributing to economic growth and poverty reduction. But when things go wrong, the malfunctioning of the financial system can slow growth, throw more people into poverty, and destabilize entire economies. Indeed, financial crises hurt not only those who work in finance or those who access financial systems. When the government undertakes costly bailouts of bankrupt financial institutions, this can lead to increases in public indebtedness, thus undermining governments’ ability to support key social objectives, including the fund-ing of education, health, and infrastructure programs. As a result, malfunctioning finan-cial systems can also lay the foundations for enduring economic crises, as illustrated quite dramatically by recent events.
With so much attention focused on sta-bility issues following the recent crisis, the powerful linkages between the functioning of the financial system and economic devel-opment have been somewhat underempha-sized. Although the focus on stability has been understandable, sound financial sector policies are not only about avoiding crises. Finance is also about the efficient allocation of capital, economic growth, and expanding economic horizons. Therefore, an impor-tant goal is to raise awareness of policies to enhance the operation of financial systems, develop a better understanding, and foster debate. To help in framing the debate, this section clarifies the definition of financial development and provides a review of the literature on the linkages between financial sector development, economic growth, and poverty reduction.
What is financial development?
Financial markets are imperfect. Acquiring and processing information about poten-tial investments is costly. There are costs and uncertainties associated with writing, interpreting, and enforcing contracts. And there are costs associated with transacting goods, services, and financial instruments. These market imperfections inhibit the flow of society’s savings to those with the best
The chapter also suggests that the global financial crisis resulted in more than financial instability: in some countries, it also caused problems along the other dimensions, such as making people’s and firms’ access to financial services more difficult. Finance is about more than just stability. Having financial systems channel society’s savings to those with the most promising investment opportunities is essential for fostering economic growth, alle-viating poverty, and enabling people to pur-sue their economic goals.
Finally, this chapter is linked to future editions of the Global Financial Develop-ment Report. The report is envisaged as part of a series, with future reports return-ing to the analysis of financial systems using updated and extended data. They will use the measurement framework introduced here to examine new topics, such as financial inclu-sion, capital market development, and oth-ers. Future editions might expand or improve on the framework, which is designed to be flexible to accommodate such adjustments if needed—for example, if new types of finan-cial data become available.
the impoRtance oF Financial SyStemS to Development
Finance is central to development. This may seem obvious to financial development experts. It may also seem obvious to bank depositors who just had their entire life sav-ings wiped out by a financial crisis. But finan-cial crises get forgotten after a period of time. And when compared with other factors that are also important—health, the environ-ment, and so on—the case for finance may appear less obvious. Indeed, when panels of the world’s leading economists tried to iden-tify “the 10 great global challenges” in both 2004 and 2008 as part of the Copenhagen Consensus Project, the list did not include any financial issues.1
This section argues that finance indeed matters. It matters both when it functions well and when it malfunctions. When oper-ating effectively, finance works quietly in

18 b e n c H m a R k i n g f i n a n c i a l s y s t e m s a R o u n d t H e w o R l d GLOBAL finAnciAL DEVELOPMEnT REPORT 2013
At a broader level, financial development can be defined as improvements in the quality of five key financial functions: (a) producing and processing information about possible investments and allocating capital based on these assessments; (b) monitoring individuals and firms and exerting corporate governance after allocating capital; (c) facilitating the trading, diversification, and management of risk; (d) mobilizing and pooling savings; and (e) easing the exchange of goods, services, and financial instruments. Financial insti-tutions and markets around the world dif-fer markedly in how well they provide these key services. Although this report sometimes focuses on the role of the financial systems in reducing information, contracting, and trans-action costs, it primarily adopts a broader view of finance and stresses the key functions provided by the financial system to the over-all economy.
Financial development and economic growth
Economists have long debated the finan-cial sector’s role in economic growth. Lucas (1988), for example, dismissed finance as an overstressed determinant of economic growth, and Robinson (1952, 86) quipped that “where enterprise leads finance follows.” From this perspective, finance responds to demands from the nonfinancial sector: it does not cause economic growth. At the other extreme, Miller (1998, 14) argued that the idea that financial markets contribute to economic growth “is a proposition too obvi-ous for serious discussion.” Bagehot (1873) and others rejected the idea that the finance-growth nexus can be ignored without limit-ing understanding of economic growth.
Recent literature reviews (such as Levine 2005) conclude that evidence suggests a posi-tive, first-order relationship between finan-cial development and economic growth. In other words, well-functioning financial sys-tems play an independent role in promoting long-run economic growth: countries with better-developed financial systems tend to
ideas and projects, thus curtailing economic development.
It is the existence of these costs—these market imperfections—that creates incen-tives for the emergence of financial contracts, markets, and intermediaries. Motivated by profits, people create financial products and institutions to ameliorate the effects of these market imperfections. And governments often provide an array of services—rang-ing from legal and accounting systems to government-owned banks—with the stated goals of reducing these imperfections and enhancing resource allocation. Some econo-mies are comparatively successful at develop-ing financial systems that reduce these costs. Other economies are considerably less suc-cessful, with potentially large effects on eco-nomic development.
At the most basic level, therefore, finan-cial development occurs when financial instruments, markets, and intermediaries mitigate—though do not necessarily elimi-nate—the effects of imperfect information, limited enforcement, and transaction costs. For example, the creation of credit registries tends to improve acquisition and dissemina-tion of information about potential borrow-ers, improving the allocation of resources with positive effects on economic develop-ment. As another example, countries with effective legal and regulatory systems have facilitated the development of equity and bond markets that allow investors to hold more diversified portfolios than they could without efficient securities markets. This greater risk diversification can facilitate the flow of capital to higher return proj-ects, boosting growth and enhancing living standards.
Defining financial development in terms of the degree to which the financial system eases market imperfections, however, is too narrow and does not provide much infor-mation on the actual functions provided by the financial system to the overall economy. Thus, Levine (2005) and others have devel-oped broader definitions that focus on what the financial system actually does.2

GLOBAL finAnciAL DEVELOPMEnT REPORT 2013 b e n c H m a R k i n g f i n a n c i a l s y s t e m s a R o u n d t H e w o R l d 19
business and who cannot, who can pay for education and who cannot, who can attempt to realize his or her economic aspirations and who cannot. Furthermore, by affecting the allocation of capital, finance can alter both the rate of economic growth and the demand for labor, with potentially profound implica-tions for poverty and income distribution.
Potentially, finance can have rather com-plex effects on the income distribution. It could boost returns to high-skilled work-ers or to low-skilled workers. The mecha-nisms are complex and could be good or bad for the poor and reduce or increase income inequality.
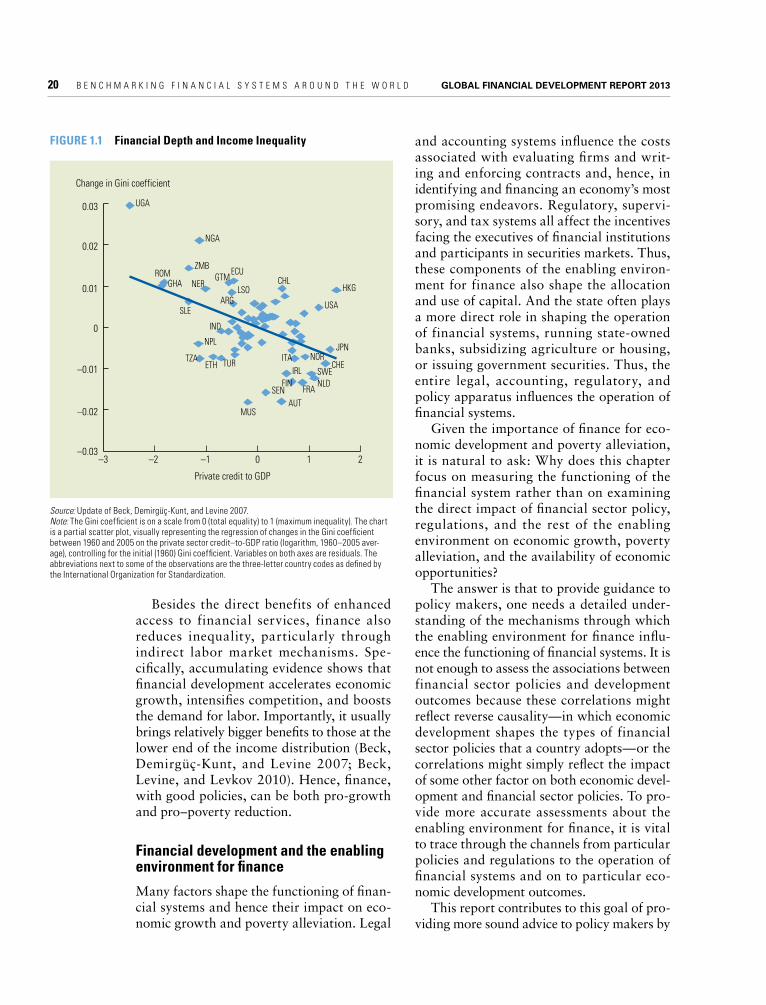
There is an emerging body of empirical research, however, suggesting that in prac-tice, improvements in financial contracts, markets, and intermediaries actually do tend to expand economic opportunities and reduce persistent income inequality. Figure 1.1 provides a basic empirical illustration of the link between financial development (approximated here in a simplified way by the ratio of private sector credit to gross domes-tic product) and income inequality (approxi-mated by changes in the Gini coefficient). The graph illustrates that higher levels of financial development are associated with declines in inequality.
More in-depth empirical research is con-sistent with this basic observation. For exam-ple, evidence suggests that access to credit markets increases parental investment in the education of their children and reduces the substitution of children out of schooling and into labor markets when adverse shocks reduce family income (Belley and Lochner 2007). Better-functioning financial systems stimulate new firm formation and help small, promising firms expand as a wider array of firms gain access to the financial system. Moreover, better-functioning financial sys-tems will identify and fund better projects, with less emphasis on collateral and incum-bency. Not only do they allow new, efficient firms to enter, they also force old, inefficient firms to leave, as evidenced by data (Kerr and Nanda 2009).
grow faster over long periods of time, and a large body of evidence suggests that this effect is causal (Demirgüç-Kunt and Levine 2008).3
Moreover, research sheds light on the mechanisms through which finance affects growth. The financial system influences growth primarily by affecting the alloca-tion of society’s savings, not by affecting the aggregate savings rate. Thus, when financial systems do a good job of identifying and funding those firms with the best prospects, not those firms simply with the strongest political connections, this improves the capi-tal allocation and fosters economic growth. Such financial systems promote the entry of new, promising firms and force the exit of less efficient enterprises. Such financial sys-tems also expand economic opportunities, so that the allocation of credit—and hence opportunity—is less closely tied to accumu-lated wealth and more closely connected to the social value of the project. Furthermore, by improving the governance of firms, well-functioning financial markets and institu-tions reduce waste and fraud, boosting the efficient use of scarce resources. By facilitat-ing risk management, financial systems can ease the financing of higher return endeavors with positive reverberations on living stan-dards. And, by pooling society’s savings, financial systems make it possible to exploit economies of scale—getting the biggest development boost from available resources.
Financial development and poverty reduction
Beyond long-run growth, finance can also shape the gap between the rich and the poor and the degree to which that gap persists across generations (Demirgüç-Kunt and Levine 2009). Financial development may affect to what extent a person’s economic opportunities are determined by individual skill and initiative, or whether parental wealth, social status, and political connec-tions largely shape economic horizons. The financial system influences who can start a
20 b e n c H m a R k i n g f i n a n c i a l s y s t e m s a R o u n d t H e w o R l d GLOBAL finAnciAL DEVELOPMEnT REPORT 2013
and accounting systems influence the costs associated with evaluating firms and writ-ing and enforcing contracts and, hence, in identifying and financing an economy’s most promising endeavors. Regulatory, supervi-sory, and tax systems all affect the incentives facing the executives of financial institutions and participants in securities markets. Thus, these components of the enabling environ-ment for finance also shape the allocation and use of capital. And the state often plays a more direct role in shaping the operation of financial systems, running state-owned banks, subsidizing agriculture or housing, or issuing government securities. Thus, the entire legal, accounting, regulatory, and policy apparatus influences the operation of financial systems.
Given the importance of finance for eco-nomic development and poverty alleviation, it is natural to ask: Why does this chapter focus on measuring the functioning of the financial system rather than on examining the direct impact of financial sector policy, regulations, and the rest of the enabling environment on economic growth, poverty alleviation, and the availability of economic opportunities?
The answer is that to provide guidance to policy makers, one needs a detailed under-standing of the mechanisms through which the enabling environment for finance influ-ence the functioning of financial systems. It is not enough to assess the associations between financial sector policies and development outcomes because these correlations might reflect reverse causality—in which economic development shapes the types of financial sector policies that a country adopts—or the correlations might simply reflect the impact of some other factor on both economic devel-opment and financial sector policies. To pro-vide more accurate assessments about the enabling environment for finance, it is vital to trace through the channels from particular policies and regulations to the operation of financial systems and on to particular eco-nomic development outcomes.
This report contributes to this goal of pro-viding more sound advice to policy makers by
Besides the direct benefits of enhanced access to financial services, finance also reduces inequality, particularly through indirect labor market mechanisms. Spe-cifically, accumulating evidence shows that financial development accelerates economic growth, intensifies competition, and boosts the demand for labor. Importantly, it usually brings relatively bigger benefits to those at the lower end of the income distribution (Beck, Demirgüç-Kunt, and Levine 2007; Beck, Levine, and Levkov 2010). Hence, finance, with good policies, can be both pro-growth and pro–poverty reduction.
Financial development and the enabling environment for finance
Many factors shape the functioning of finan-cial systems and hence their impact on eco-nomic growth and poverty alleviation. Legal
Change in Gini coefficient
0.03
0.02
0.01
0
–0.01
–0.02
–0.03–2 –1
Private credit to GDP
0 1 2–3
ARG
AUT
CHE
CHLECU
ETH
FINFRA
GHAGTM
HKG
IND
IRLITA
JPN
LSO
MUS
NER
NGA
NLD
NOR
NPL
ROM
SEN
SLE
SWETURTZA
UGA
USA
ZMB
FiguRe 1.1 Financial Depth and income inequality
Source: update of beck, demirgüç-kunt, and levine 2007. Note: the gini coefficient is on a scale from 0 (total equality) to 1 (maximum inequality). the chart is a partial scatter plot, visually representing the regression of changes in the gini coefficient between 1960 and 2005 on the private sector credit–to-gdp ratio (logarithm, 1960–2005 aver-age), controlling for the initial (1960) gini coefficient. variables on both axes are residuals. the abbreviations next to some of the observations are the three-letter country codes as defined by the international organization for standardization.

GLOBAL finAnciAL DEVELOPMEnT REPORT 2013 b e n c H m a R k i n g f i n a n c i a l s y s t e m s a R o u n d t H e w o R l d 21
the Global Financial Development DatabaSe anD the 4X2 meaSURement matRiX
introducing the global Financial Development Database
To measure the functioning of financial sys-tems, country officials, researchers, and oth-ers would ideally like to have direct measures of how well financial institutions and finan-cial markets (a) produce information ex ante about possible investments and allocate capi-tal; (b) monitor investments and exert cor-porate governance after providing finance; (c) facilitate the trading, diversification, and management of risk; (d) mobilize and pool savings; and (e) ease the exchange of goods and services. So if data were not an issue, the ideal approach to measurement would involve the following determinations: in terms of producing information about possible invest-ments and allocating capital, the financial
(a) developing and analyzing measures of the functioning of financial institutions and mar-kets (chapter 1) and (b) assembling databases on regulations, supervision, and institutional structures that shape financial system opera-tions (chapters 2 to 5).
To summarize the discussion in this sec-tion, figure 1.2 presents in a visual form the relationships between socioeconomic devel-opment, financial development, and the enabling environment. It is important to care about the process of financial development because it has a well-documented association with economic and social development more generally. It improves sustainable long-term growth and reduces poverty, thereby improv-ing social welfare. One can think about these as the ultimate developmental objectives. Fig-ure 1.2 also highlights that financial systems do not exist in a vacuum. Financial system characteristics depend on the enabling envi-ronment, which consists of financial sec-tor policies and other relevant policies and features.
FiguRe 1.2 Socioeconomic Development, Financial Development, and enabling environment
Source: based on the review of literature in cihák, demirgüç-kunt, feyen, and levine 2012.
Social welfare (sustainable long-term growth, poverty reduction)
financial sector functionsProducing information about investments and allocate capital; monitoring investments and exerting corporate governance; managing risks; pooling savings; and easing the exchange of goods and services
financial sector policies (examples)– Regulation (micro- and macro-prudential,
business conduct, etc.)– Direct interventions (state ownership,
guarantees, subsidies, liquidity provision)– Competition policy in finance (level playing
field, entry/exit, etc.)– Promotion of financial infrastructure/
technology
financial development outcomes(empirical proxies, measured separately for financial institutions and markets)– Depth– Access– Efficiency– Stability
Other policies and features (examples)– Macroeconomic policy framework (e.g.,
exchange rate regime, monetary policy, tax policy, capital controls)
– Legal framework, social capital, etc.– Concentration in the system– Internationalization, dollarization
Socioeconomic Development
Enabling Environment
financial Development

22 b e n c H m a R k i n g f i n a n c i a l s y s t e m s a R o u n d t H e w o R l d GLOBAL finAnciAL DEVELOPMEnT REPORT 2013
figure 1.2). For completeness, the accompa-nying database includes some variables that measure social welfare (the upper part of figure 1.2) as well as financial sector policies and the other factors that define the enabling environment for finance (the bottom of fig-ure 1.2). The following subsections introduce each dimension of this measurement frame-work. The annex to this chapter and Cihák, Demirgüç-Kunt, Feyen, and Levine (2012) provide more detailed information on each component of the measures of the four finan-cial system traits in the matrix.
To obtain a comprehensive characteriza-tion of financial systems, one must measure the four categories for the two key compo-nents of the financial sector, namely financial institutions (banks and nonbank financial institutions) and financial markets (stock market, bond market, and other markets). Therefore, to be comprehensive, one needs to assemble a 4x2 matrix: four characteris-tics for two components. Table 1.1 provides a summary representation of such a 4x2 matrix, with examples of variables that can be used to fill in each cell of the matrix. The same structure is used to organize the under-lying database. The following subsections go through the individual characteristics in turn. Box 1.1 focuses on the selection of represen-tative variables within the individual charac-teristics. Box 1.2 discusses the challenges of aggregating across the four dimensions.
Critically, this chapter looks beyond the size of banks and stock markets. Many fac-tors shape the mixture of financial interme-diaries and markets operating in an economy. Different types and combinations of infor-mation, enforcement, and transaction costs in conjunction with different legal, regula-tory, and tax systems have motivated distinct financial contracts, markets, and intermedi-aries across countries and throughout his-tory. Thus, financial institutions and mar-kets can and do look very different across countries and over time, but these structural differences do not necessarily translate into differences in the quality of the services pro-vided by the financial system to the economy. To measure financial systems, this chapter digs deeper into the functioning of financial
sector in Country A, for example, scores 60 on a scale from 0 to 100, while Country B’s financial sector scores 75; in terms of moni-toring investments and exerting corporate governance after providing finance, Country A scores 90, while Country B scores only 20 on a scale from 0 to 100, and so on.
So, instead of the direct measures, empiri-cal studies have focused on proxy variables, such as various measures of financial depth and access. And despite evidence of the cru-cial role of finance for economic develop-ment, there is a surprising lack of comprehen-sive data on basic aspects of financial systems across countries and over time. For example, there are major gaps in data on trading vol-umes in securities markets. Even data on financial institutions become rather patchy when one looks beyond the world’s major, publicly listed banks.
Against this background, one of the key contributions of the Global Financial Devel-opment Report is the launch of a new, com-prehensive online database on financial sys-tems—the Global Financial Development Database, which is made available online together with the report. The database, which will be updated on a regular basis, compiles and disseminates data on the char-acteristics of financial systems in 205 juris-dictions around world. The database has data going back some 50 years (to 1960), although some measures of financial system traits do not go back that far.4 The data from the Global Financial Development Database are integrated with the World Bank’s Open Data initiative. Some of the data are new, and this is the first time such comprehensive data are available. The data are made available in a Web-friendly form, allowing the users of the database to interact with the data, for example, by creating their own country peer groups and their own tables and charts.
The 4x2 measurement framework
This chapter develops and presents four mea-sures of the characteristics of financial sys-tems: depth, access, efficiency, and stability. The focus here is on empirically character-izing financial systems (the middle part of

GLOBAL finAnciAL DEVELOPMEnT REPORT 2013 b e n c H m a R k i n g f i n a n c i a l s y s t e m s a R o u n d t H e w o R l d 23
literature on financial development is private credit, defined as credit to the private sector from deposit money banks, as a percentage of GDP.5 There is a wide literature demon-strating the link between financial depth, approximated by private sector credit to GDP, on one hand, and long-term economic growth and poverty reduction on the other hand (for example, Demirgüç-Kunt and Levine 2008). Private credit varies widely across countries. For example, averaged over 1980–2010, private credit was less than 10 percent of GDP in Angola, Cambodia, and the Republic of Yemen, while exceeding
systems and does not just look at the size of particular institutions and markets.
First characteristic: Financial depth
The most common way to characterize finan-cial systems is by measuring the size of finan-cial institutions or markets relative to the size of the economy. “Financial depth” is an analytically incomplete, though empirically ubiquitous, measure of the functioning of financial systems.
For financial institutions, the variable that has received much attention in the empirical
Financial Institutions Financial Markets
DE
PT
H
Private sector credit to GDPFinancial institutions’ assets to GDPMoney (M2 aggregate) to GDPDeposits to GDPValue-added of the financial sector to GDP
Stock market capitalization plus outstanding domestic private debt securities to GDPPrivate debt securities to GDPPublic debt securities to GDP International debt securities to GDP Stock market capitalization to GDP Stocks traded to GDP
Ac
cE
SS
Accounts per thousand adults (commercial banks)Branches per 100,000 adults (commercial banks)Percent of people with a bank account (from user survey)Percent of firms with line of credit (all firms)Percent of firms with line of credit (small firms)
Percent of market capitalization outside of top 10 largest companiesPercent of value traded outside of top 10 traded companies Government bond yields (3 month and 10 year) Ratio of domestic to total debt securities Ratio of private to total debt securities (domestic) Ratio of new corporate bond issues to GDP
Eff
iciE
nc
Y
net interest marginLending-deposits spreadNoninterest income to total income Overhead costs (percent of total assets)Profitability (return on assets, return on equity) Boone indicator (Herfindahl, or H-statistic)
Turnover ratio (turnover/capitalization) for stock marketPrice synchronicity (co-movement) Price impact Liquidity/transaction costs Quoted bid-ask spread for government bonds Turnover of bonds (private, public) on securities exchange Settlement efficiency
STA
BiL
iTY
z-score (or distance to default) Capital adequacy ratiosAsset quality ratiosLiquidity ratiosOther (net foreign exchange position to capital, etc.)
Volatility (standard deviation/average) of stock price index, sovereign bond indexSkewness of the index (stock price, sovereign bond)Price/earnings (P/E) ratioDurationRatio of short-term to total bonds (domestic, international) Correlation with major bond returns (German, United States)
TABLe 1.1 Stylized 4x2 Matrix of Financial System Characteristics (with examples of candidate variables in each category)
Source: based on the review of literature in cihák, demirgüç-kunt, feyen, and levine 2012.Note: this is a stylized matrix. for details, see cihák, demirgüç-kunt, feyen, and levine (2012). variables that are highlighted in bold are the ones suggested for the benchmarking exercise. private sector credit to gdp is domestic private credit to the real sector times deposit money banks to gdp. accounts per thousand adults (commercial banks) is the num-ber of depositors with commercial banks per 1,000 adults. for each type of institution, this figure is calculated as the (reported number of depositors)*1,000/adult population in the reporting country. the net interest margin is the accounting value of the bank’s net interest revenue as a share of its average interest-bearing (total earning) assets. the z-score (or distance to default) is (Roa + equity)/assets)/sd(Roa), where Roa is average annual return on end-year assets and sd(Roa) is the standard deviation of Roa. stock market capitalization plus outstanding domestic private debt securities to gdp is defined as the value of listed shares to gdp plus amount of outstanding domestic private debt securities to gdp. percent of market capitalization outside of top 10 largest companies is the market capitalization out of the top 10 largest companies to total market capitalization. turnover ratio (turnover/capitalization) for stock market is the ratio of the value of total shares traded to market capitalization. volatility (standard deviation/average) of stock price index is the standard deviation of the sovereign bond index divided by the annual average of that index.

24 b e n c H m a R k i n g f i n a n c i a l s y s t e m s a R o u n d t H e w o R l d GLOBAL finAnciAL DEVELOPMEnT REPORT 2013
in the literature on financial development. In any case, the two variables are rather closely correlated, with a correlation coefficient of about 0.98 (figure 1.3), so private credit can provide a reasonably close approximation for total banking assets.6
Despite the literature’s focus on banks, the global financial crisis has highlighted issues in some nonbank financial institutions (NBFIs). Data coverage of NBFIs is less comprehensive than coverage of banks. Nonetheless, recog-nizing the importance of NBFIs, the Global Financial Development Database includes total assets of NBFIs to GDP, which includes
85 percent of GDP in Austria, China, and the United Kingdom. The annual average value of private credit across countries was 39 percent, with a standard deviation of 36 percent.
An alternative to private credit is total banking assets to GDP, a variable that is also included in the Global Financial Develop-ment Database. Compared to private credit, this variable also includes credit to govern-ment and bank assets other than credit. It is arguably a more comprehensive measure of size, but it is available for a smaller number of countries and has been used less extensively
BOX 1.1 Selecting the Representative Variables for individual Characteristics
For every category in the 4x2 matrix, several vari-ables could be used as proxies. Which combination of these variables should one choose when trying to compare financial systems?
In some cases, the variables in the same dimen-sion are complementary, and some are even additive. For example, the total assets of banks to GDP and total assets of nonbank financial institutions to GDP are in the same units and complement each other, so they can be added up to obtain a proxy of total assets of financial institutions to GDP. The result will be a good proxy variable, provided that the underlying variables are comprehensive in their coverage and that no double counting occurs between them. Other examples include measures of volatility in the stock market and volatility in the bond market. If these are measured in a similar way (as standard deviations), they can actually be added, using the capitaliza-tions of the two markets, as proxy for their relative weights (as well as the covariance between the two), to approximate the general volatility in the financial markets.
In other cases, the variables “compete” to mea-sure the similar things in slightly different ways. For example, private sector credit to GDP and total assets of financial institutions to GDP are both proxies for financial institutions’ size. The two variables differ in terms of their comprehensiveness and country cov-erage, with private sector credit to GDP covering a smaller set of assets but being available for a large number of countries.
How should one pick among such competing vari-ables? For the purpose of presenting the raw data in the database, it is not necessary to pick. Indeed, the Global Financial Development Database shows the competing variables, so that users can examine the data for themselves. However, for the purpose of characterizing financial systems and for comparisons across the dimensions, it is useful to pick one of the competing variables.
The general approach is to select indicators that are widely available and have a clearly documented link to long-term economic growth or poverty reduc-tion in the literature. When two variables capture the same dimension, and both have a link to economic development, one would select the variable that—even if it is perhaps less sophisticated—has greater country coverage. The more sophisticated variable is still included in the Global Financial Development Database, and relationships between some of these variables are explored in Cihák, Demirgüç-Kunt, Feyen, and Levine (2012). For most of the variables, the competing indicators tend to be highly (although not perfectly) correlated. For example, the correla-tion coefficient for private sector credit to GDP and total banking assets to GDP is 0.98 (figure 1.3).
The chapter’s illustrative comparison of the 4x2 characteristics across countries selects one variable from each dimension. The selected variables are highlighted in bold in table 1.1.

GLOBAL finAnciAL DEVELOPMEnT REPORT 2013 b e n c H m a R k i n g f i n a n c i a l s y s t e m s a R o u n d t H e w o R l d 25
on the mixture of financial institutions and markets operating in a financial system.7 The degree to which the financial system is rela-tively bank based or market based has been an important topic in the financial develop-ment literature. In a recent contribution to this literature, Demirgüç-Kunt, Feyen, and Levine (2012) find that as economies develop, services provided by financial markets tend to become relatively more important than those provided by banks.
Second characteristic: Financial access (inclusion)
But finance is not just about the size of finan-cial institutions and securities; finance is also about the ability of individuals and firms in an economy to access financial services. Mea-sures of financial access are indeed strongly associated with economic development, a relationship that is separate from the associa-tion between financial depth and economic development. Besides the direct benefits of enhanced access to financial services, finance
pension fund assets to GDP, mutual fund assets to GDP, insurance company assets to GDP, insurance premiums (life) to GDP, and insurance premiums (non-life) to GDP.
For financial markets, the two main seg-ments for which consistent worldwide data can be collected are stock markets and bond markets (both sovereign and corporate). To approximate the size of stock markets, the most common choice in the literature is stock market capitalization to GDP. For the size of the bond markets, the mostly commonly used proxy for size is the outstanding volume of debt securities (private and public) to GDP.
To measure the depth of stock markets, this report primarily uses the stock value traded indicator, which equals the value of stock market transactions as a share of GDP. This market development indicator incor-porates information on the size and activity of the stock market, not simply on the value of listed shares. Earlier work by Levine and Zervos (1998) indicates that the trading of ownership claims on firms in an economy is closely tied to the rate of economic growth. There is substantial variation across coun-tries. Although the mean value of stock value traded is about 29 percent of GDP, the stan-dard deviation is about double this value. In Armenia, Tanzania, and Uruguay, stock value traded annually averaged less than 0.23 per-cent over the 1980–2008 sample (10th per-centile). In contrast, stock value traded aver-aged over 75 percent in China (both mainland and Hong Kong SAR, China), Saudi Arabia, Switzerland, and the Unites States (90th per-centile). Also, this report confirms Levine’s and Zervos’s results using other market devel-opment indicators. In particular, it examines stock market capitalization, which simply measures the value of listed shares on a coun-try’s stock exchanges as a share of GDP and securities market capitalization, which equals the capitalization of the stock market plus the capitalization of the private domestic bond markets, divided by GDP.
The relative size of banks and markets—called the financial structure ratio—mea-sures the ratio of private credit to stock mar-ket capitalization and provides information
Domestic bank assets/GDP (%)
300
200
100
00 100 200 300
Private credit/GDP (%)
ABW
AFG
AGO
ALB
ARGARM
ATG
AUSAUT
AZEBDI
BEL
BENBFA
BGD
BHS
BIHBLR
BLZ
BOL
BRA
BTN
BWA
CAF
CHE
CHL
CHN
CIVCMR
COL
CPV
CRI
CYP
DEU
DMA
DOMDZA
ECU
EGY
ESP
ESTFIN
FJI
FRA
GAB
GBR
GEOGHA
GMB
GNB
GRC
GRD
GTMGUY
HKG
HND
HRV
HTIIDN
IND
IRL
ISL
ISR
ITA
JAM
JOR
JPN
KAZKEN
KHM
KNA
KOR
KSV
LBN
LCA
LKA
LSO
LTU
LUX
MAC
MAR
MDA
MDG
MDV
MEXMKD
MLI
MLT
MMR
MNE
MNGMOZ
MUS
MWI
MYS
NAM
NER
NGANIC
NLD
NPL
NZL
PAK
PAN
PER
PHLPNG
PRT
PRY
ROMRUSSAU
SDNSEN
SGP
SLBSLE
SLVSRB
STP
SVK
SVN
SWZ
SYCSYRTGO
THA
TMP
TON
TUNTUR
TZAUGA
UKR
URY
USAVCT
VEN
VNM
VUT
WSM
YEM
ZAF
ZMB
Private credit versus domestic bank assets
FiguRe 1.3 Correlations between Characteristics in Same Category (example)
Source: calculations based on the global financial development database.Note: correlation = 0.98. a significant correlation coefficient at the 5% level or better.

26 b e n c H m a R k i n g f i n a n c i a l s y s t e m s a R o u n d t H e w o R l d GLOBAL finAnciAL DEVELOPMEnT REPORT 2013
financial systems, these individuals and enterprises with promising opportunities are limited to their own savings and earnings. Financial access has been overlooked in tra-ditional literature on financial system char-acteristics, mostly because of serious data gaps on who has access to which financial services and a lack of systematic information on the barriers to broader access. The Global Financial Development Database contains both variables that measure the use of finan-cial services (which reflects both supply and demand) as well as variables that focus more closely on the supply of financial services.
The main proxy variable in the financial access category for financial institutions is the number of bank accounts per 1,000 adults. Other variables in this category include the number of bank branches per 100,000 adults (commercial banks), the percentage of firms with line of credit (all firms), and the percent-age of firms with line of credit (small firms). When using these proxies, one needs to be mindful of their weaknesses. For example, the number of bank branches is becom-ing increasingly misleading with the move toward branchless banking. The number of bank accounts does not suffer from the same issue, but it has its own limitations (in par-ticular, it focuses on banks only).
The measure of access in financial markets relies on various measures of concentration in the market, the idea being that a high degree of concentration reflects difficulties for access for newer or smaller issuers. The variables in this category include the percentage of mar-ket capitalization outside of the top 10 larg-est companies, the percentage of value traded outside of the top 10 traded companies, gov-ernment bond yields (3 month and 10 year), ratio of domestic to total debt securities, ratio of private to total debt securities (domestic), and ratio of new corporate bond issues to GDP.
The data for the financial access dimen-sion of the Global Financial Development Database came largely from the IMF’s recently established Access to Finance data-base, based on earlier work by Beck, Demir-güç-Kunt, and Martínez Pería (2007).8 In
also reduces inequality, particularly through indirect labor market mechanisms. Specifi-cally, accumulated evidence shows that finan-cial access accelerates economic growth, intensifies competition, and boosts the demand for labor—and it usually brings big-ger benefits to those at the lower end of the income distribution (see, for instance, Beck, Demirgüç-Kunt, and Levine 2007, and Beck, Levine, and Levkov 2010). It is important to emphasize that the issue is not only access to any form of finance, but also the quality of financial services available to people. In other words, having a bank account is nice, but it is also important to have a competitive interest rate, reliable payment services, and so on.
A well-functioning financial system offers savings, payments, and risk-management products to as large a set of participants as possible. It seeks out and finances good growth opportunities wherever they may be. Without inclusive financial systems, poor individuals and small enterprises need to rely on their personal wealth or internal resources to invest in their education, become entre-preneurs, or take advantage of promising growth opportunities. Though still far from conclusive, the existing body of evidence sug-gests that developing the financial sector and improving access to finance are likely not only to accelerate economic growth but also to reduce income inequality and poverty.
Access to financial services—financial inclusion—implies an absence of obstacles to the use of these services, whether the obsta-cles are price or nonprice barriers to finance. It is important to distinguish between access to—the possibility to use—and actual use of financial services. In some cases, a person or business has access to services but decides not to use them. But in other cases, price barriers or discrimination, for example, bar access. Failure to make this distinction can complicate efforts to define and measure access. Financial market imperfections, such as information asymmetries and transaction costs, are likely to be especially binding on the talented poor and on micro- and small enterprises that lack collateral, credit his-tories, and connections. Without inclusive

GLOBAL finAnciAL DEVELOPMEnT REPORT 2013 b e n c H m a R k i n g f i n a n c i a l s y s t e m s a R o u n d t H e w o R l d 27
analysis and other more sophisticated mea-sures; for example, Angelidis and Lyroudi (2006) apply data envelopment analysis and neural networks to calculate efficiency indexes using bank-by-bank data for the Ital-ian banking industry. But the data required for this type of analysis are available only for a small subsample of countries, and therefore much additional data-collection work would be needed to compile a comprehensive cross-country database. The background paper by Cihák, Demirgüç-Kunt, Feyen, and Levine (2012) contains a discussion on data envel-opment analysis and other examples of more sophisticated measures.
For financial markets, the basic measure of efficiency in the stock market is the turn-over ratio, that is, the ratio of turnover to capitalization in the stock market. The ratio-nale of using this variable is that the higher turnover relative to capitalization means rela-tively higher volumes of trading in the market and more liquidity. This in turn means more scope for price discovery, better transmission of information in the price, and greater effi-ciency of the market. In the bond market, the most commonly used variable is the tightness of the bid-ask spread (with the U.S. and West-ern European markets showing low spreads, and the Dominican Republic, Pakistan, Peru, Qatar, and Vietnam reporting high spreads) and the turnover ratio (although the mea-surement of the latter often suffers from incomplete data).
A range of other proxies for efficiency in financial markets have been used in empiri-cal literature (table 1.1). One of them is price synchronicity, calculated as a degree of co-movement of individual stock returns in an equity market. The variable aims to capture the information content of daily stock prices. It is based on the notion that a market oper-ates efficiently when prices are informative about the performance of individual firms. When their movements are highly synchro-nized, they are less likely to provide such individualized information (although one also needs to control for common shocks to economywide fundamentals to establish a benchmark for this variable). Also, efficiency
addition, a part of the financial access data is based on the Global Financial Inclusion Indi-cators database (Global Findex) that is being built at the World Bank (Demirgüç-Kunt and Klapper 2012). The Global Findex is the first public database of indicators that consistently measures individuals’ usage of financial prod-ucts across countries and over time. It can be used to track the effect of financial inclu-sion policies and facilitate a deeper and more nuanced understanding of how adults around the world save, borrow, and make payments. The data will be based on interviews with at least 1,000 people per country in up to 150 countries about their financial behav-ior through the Gallup World Poll survey. The survey was rolled out in January 2011. The first data set was made available to the public in April 2012, and the full database will be updated every three years, with head-line indicators of the use of bank accounts and formal credit, which are collected on an annual basis.
Third characteristic: Financial efficiency
To perform its functions well, a financial sec-tor should be efficient. It should perform its intermediating functions in the least costly way possible. If intermediation is costly, the higher costs may get passed on to households, firms, and governments. (In)efficiency mea-sures for institutions include indicators such as overhead costs to total assets, net interest margin, lending-deposits spread, noninterest income to total income, and cost to income ratio (table 1.1). Closely related variables include measures such as return on assets and return on equity. While efficient finan-cial institutions also tend to be more profit-able, the relationship is not very close (for example, an inefficient financial system can post relatively high profitability if it operates in an economic upswing, while an otherwise efficient system hit by an adverse shock may generate losses).
As with the other dimensions, these are relatively crude measures of (in)efficiency. For a subset of countries, it is possible to calculate efficiency indices based on data envelopment

28 b e n c H m a R k i n g f i n a n c i a l s y s t e m s a R o u n d t H e w o R l d GLOBAL finAnciAL DEVELOPMEnT REPORT 2013
has been used extensively in the empirical literature. For other indicators, such as the regulatory capital to risk-weighted assets and nonperforming loans to total gross loans, the Global Financial Development Database cross-references the Financial Soundness Indicators database available on the IMF website (http://fsi.imf.org). Variables such as the nonperforming loan ratios may be bet-ter known than the z-score, but they are also known to be lagging indicators of soundness Cihák and Schaeck 2010).
One of the few reliable forward-looking indicators of financial instability is excessive credit growth. The focus here is on excessive credit growth. A well-developing financial sector is likely to report expansion in credit growth. Without credit growth, financial sectors would lack depth or would not be able to provide good access to financial ser-vices. Credit growth is important, and indeed may be necessary, even if it is connected with some instability.10 But a very rapid growth in credit is one of the most robust com-mon factors associated with banking cri-ses (Demirgüç-Kunt and Detragiache 1997; Kaminsky and Reinhart 1999). IMF (2004), for example, estimated that about 75 percent of credit booms in emerging markets end in banking crises. Typically, credit expansions are fueled by overly optimistic expectations of future income and asset prices, often combined with capital inflows. Over time, households and firms accumulate substan-tial debt while income does not keep pace. A decline in income or asset prices then leads to an increase in nonperforming loans and defaults. If the problem is severe, the coun-try experiences a banking crisis. Drehmann, Borio, and Tsatsaronis (2011) examine the performance of different variables as anchors for setting the level of the countercyclical regulatory capital buffer requirements for banks, finding that the gap between the ratio of credit to GDP and its long-term backward-looking trend performs best as an indicator for the accumulation of capital, because this variable captures the build-up of systemwide vulnerabilities that typically lead to banking crises.
can be approximated by the real transaction cost. Based on daily return data of the listed stocks, this variable attempts to approximate the transaction costs associated with trad-ing a particular security. This variable helps determine the barriers to efficiency in the market. All these indicators are constructed by compiling and statistically processing firm-level data from a variety of market sources.
Fourth characteristic: Financial stability
Last, but not least, the degree of financial sta-bility is an important feature of the financial sector. There is a vast literature specifically on measuring systemic risk. Because of the importance of financial stability for broader macroeconomic stability, the topic is some-times treated as separate from the other three dimensions.9 But financial stability is an important feature of financial systems, and it is closely interlinked with the broader process of financial development. To illustrate this, imagine a country where banks’ lending stan-dards become very loose, with banks provid-ing loans left and right, without proper risk management and loan monitoring. On the surface, one could observe the rapid growth as a sign of deepening and increased access to finance. Also on the surface, the financial sector can seem efficient, for some period of time: without the loan approval process, such banks would be able to lower their costs, at least until the loans turned bad. And this is the problem, of course: the system would be unstable and likely would end in a crisis. For more on the complex linkages between financial development, financial fragility, and growth, see, for example, Loayza and Ran-ciere (2006).
The key variable used here to measure financial stability is the z-score, defined as the sum of capital to assets and return on assets, divided by the standard deviation of return on assets. This variable explicitly compares buffers (capitalization and returns) with the potential for risk (volatility of returns). The z-score has a direct link with the probabil-ity of default, and for this reason the variable

GLOBAL finAnciAL DEVELOPMEnT REPORT 2013 b e n c H m a R k i n g f i n a n c i a l s y s t e m s a R o u n d t H e w o R l d 29
For financial markets, the most commonly used proxy variable for (in)stability is mar-ket volatility, although other proxies are also included in the database (table 1.1). One of these variables is the skewness, the reason being that a market with a more negative skewed distribution of stock returns is likely to deliver large negative returns, and likely to be prone to instability.
Other variables approximating (in)stability in the stock market are the price-to-earnings ratio (P/E ratio) and duration (a refined ver-sion of the P/E ratio that takes into account factors such as long-term growth and inter-est rates). These variables are based on the empirical fact that market prices contain expectations of future cash flows and growth
The advantage of the credit growth vari-able is that it is relatively easy to observe and monitor. Also, unlike some of the other mea-sures (for instance, those that include nonper-forming loan ratios), it is a forward-looking measure of instability. A disadvantage is that the definition of “excessive” credit growth is not trivial. Also, this measure does not, by itself, capture situations where financial sec-tor problems have already crystallized in a full-blown crisis. In such situations, credit is declining in real terms rather than growing. It is therefore important to amend the exces-sive credit growth indicator, as an ex ante measure of financial instability, by including credit declines as ex post proxies for situa-tions of financial instability.
BOX 1.2 To Aggregate or Not
To provide a rough sense of how financial systems stack up across the 4x2 dimensions, it is helpful to convert the individual characteristics to the same scale. To prepare for this, the 95th and 5th percentile for each variable for the entire pooled country-year data set are calculated, and the top and bottom 5 percent of observations are truncated. Specifically, all observations from the 5th percentile to the minimum are replaced by the value corresponding to the 5th percentile, and all observations from the 95th percen-tile to the maximum are replaced by the value corre-sponding to the 95th percentile. In effect, the 5th and 95th percentile become the minimum and maximum of the new (truncated) data set. The main reason for truncating the “tails” of the distribution is that sometimes the best and worst scores are very extreme and may reflect some peculiar (idiosyncratic) features of a single jurisdiction. However, the top and bot-tom 5 percent of observations are not dropped from the sample completely. If they were dropped, the calculations would lose too much of the potentially valuable information. Replacing the top and bottom 5 percent of observations with the 95th and 5th per-centile value, respectively, ensures that much of the original information is still retained. This so-called winsorizing is consistent with approaches used in earlier literature.
To convert the representative indicator in each of the 4x2 characteristics to a 0–100 scale, each score is rescaled by the maximum for each indicator and the minimum for each indicator. The rescaled indicator can be interpreted as the percent distance between the worst (0) and the best (100) outcome, defined by the 5th and 95th percentile of the original distribu-tion. These winsorized and rescaled variables are the core of much of the analysis presented in this chapter.
To arrive at a more condensed aggregate indica-tor, it may be useful to examine the average across the various characteristics; however, a strong caveat applies. An ongoing and rather active debate on mul-tidimensional indices (such as the Multidimensional Poverty Index, Human Development Index, and various Unsatisfied Basic Needs indices long used in many countries) has focused much criticism on the difficulty of the choice of weights for such an index (for example, Ravallion 2011). Mindful of the debate and the shortcomings associated with creating such mash-up indices, this report does not explicitly pres-ent such a formal mash-up index. Nonetheless, the data made available on this report’s website allow interested users to assign different weights to the var-ious characteristics and calculate their own aggregate indices.

30 b e n c H m a R k i n g f i n a n c i a l s y s t e m s a R o u n d t H e w o R l d GLOBAL finAnciAL DEVELOPMEnT REPORT 2013
interventions. Finally, another group of indi-cators relates to the features of the underly-ing financial infrastructure. This includes basic indicators on information disclosure, contract enforcement, and other quantitative characteristics of financial infrastructure (for example, public registry coverage in percent of adults, private bureau coverage in percent of adults, procedures to enforce contracts, time to enforce contract, and cost to enforce contracts). Several other traits of the enabling environment for finance are included in the Global Financial Development Database and listed in this chapter’s annex.
But this is just a start. For policy evalua-tion and policy design purposes, it is impor-tant to start collecting more consistent and more comprehensive information on gov-ernment policies in the financial sector (for example, on supervision of nonbank financial institutions and financial markets). This is an important gap in the globally available data; future reports hope to go in more depth into how this gap might be filled.
SelecteD FinDinGS
Financial system multidimensionality
One basic, yet important, observation derived from the Global Financial Develop-ment Database is that the four characteris-tics of financial systems are far from closely correlated across countries (figure 1.4). Each characteristic captures a different, separate facet of financial systems. Capturing only financial institutions and not financial mar-kets would be insufficient. Also, looking only at financial depth as the only proxy would not be sufficient. And similarly, focusing only on financial stability or on access or on efficiency would be insufficient. Stability has particularly low correlation with the other three characteristics.
important differences across regions and income groups
A regional comparison shows major differ-ences in the four characteristics of financial
instead of current fundamentals only, and therefore stock prices may be more volatile and negatively skewed in the future.
Measuring the enabling environment for finance: A start and an important area for further data work
The focus of the 4x2 matrix is on charac-terizing financial systems (the middle part of figure 1.2). It does not explicitly include variables capturing financial sector policy, such as features of financial sector regula-tion and supervision (the bottom of figure 1.2). The reason for focusing on measures of the functioning of financial systems is that those indicators bridge the gap between policy measures and final objectives, such as growth, poverty alleviation, and the expan-sion of economic opportunities. Financial depth, access, efficiency, and stability func-tion as “intermediate” indicators and targets. To some extent, this is an analogy with mon-etary policy, where intermediate targets have a relatively clear link to the policy variable (such as a central bank’s interest rate) and an impact on the policy target (such as future inflation rate).
This report, however, has started the pro-cess of assembling comprehensive data on the enabling environment for finance: finan-cial sector policies, regulations, supervisory practices, legal and accounting systems, and so forth. As part of the work underly-ing chapter 2 of this report, a comprehen-sive and updated data set on bank regula-tion and supervision around the world was put together, building on earlier work by Barth, Caprio, and Levine (2004). The data-base also covers policies and issues that go beyond the narrow concept of banking regu-lation and supervision, such as deposit pro-tection systems and resolution issues. Also, the World Bank has recently published a comprehensive update on payment systems and the related policies around the world—some of these results are featured in chapter 5. As part of chapter 4, new data are pre-sented on development financial institutions and some other forms of direct government

GLOBAL finAnciAL DEVELOPMEnT REPORT 2013 b e n c H m a R k i n g f i n a n c i a l s y s t e m s a R o u n d t H e w o R l d 31
100
80
60
40
20
00 1,000 2,000 3,000
Private credit to GDP (%)
Depth vs. AccessCorrelation = 0.80*
AUTESPEST
GRC
HUN
ISR
ITAJPNKOR
MLTNLD
OMN
PRT
SAU
SGP
AFG
BGD
CAFCOMETH
HTI
KENKHM
MDG SLETCD
TGO
TZAUGAAGO
ARM
BLZ
CMR
COG
DJI GEO
GHA
KSV
LAO LSO
MAR
MDAMNG
PAK
PHLPNG SWZ
SYR
UKR
YEM
ARGAZE
BIH
BWA
CHL
DZA
GAB
KAZ
LBNMDV
MEX
MYS
NAM
PER SYC
THA
TUR
URY
ZAF
Accounts per thousands adults, commercial banksHigh income Low income Lower middle income Upper middle income High income Low income Lower middle income Upper middle income
High income Low income Lower middle income Upper middle income High income Low income Lower middle income Upper middle income
High income Low income Lower middle income Upper middle income High income Low income Lower middle income Upper middle income
CPV
100
60
40
20
0
80
80 85 90 95 100
Depth vs. EfficiencyCorrelation = 0.47*
Private credit to GDP (%)
100 minus lending-deposit spread (%)
ABW
AUS
BHR
BHS
BRB
BRN
CANCHE
CZE
EST
HKG
HRV HUN
ISR
JPNKOR
KWT
MAC
NZL
OMN
SGPSVN
TTO
BGD
COMGMB
HTI
KEN
LBRMDG
MMR
MOZ
MWI
NPL
SLETZAUGA
AGOARM
BLZ
BOL
DJI
EGY
FJI
GEOGTM
GUY
HND
IDN
LAO
LKA
LSO
MDAMNG
MRT
NGA NIC
PAK
PHLPNG
PRY
SLB
STP
SWZSYR
TMP
TON
UKR
VNM
VUT
WSM
YEMZMB
ALB
ARG
ATG
AZE
BIH
BLR
BRA
BWA
CHL
CHN
COL
CRI
DMA
DOM
DZA
GRD
IRN
JAM
JOR KNA LBN
LBY
LCA
LTUMDV
MEX
MKD
MUS
MYS
NAM
PAN
PER
ROMRUS
SRB
SURSYC
THA
URY
VCT
VEN
ZAF
NAM
LBN
100
80
60
40
20
00 20 40 60 80
Private credit to GDP (%)
Depth vs. StabilityCorrelation = 0.02
AUSAUT
BEL
BHR
BHS
BRB
BRN
CANCHECYP
CZE
DEU DNK ESPEST
FIN
FRAGBRGRC HKG
HRV
HUN
IRL
ISR
ITAJPNKOR
KWT
LUX
MAC
MLTNLDNZL
OMN
PRT
SAU
SGP
SVK
SVN
SWE
TTO
USA
AFG
BDIBEN
BFA
BGD
CAF
ETHGMBHTI
KEN
KHM
MDG
MLI
MMR
MOZ
MWINER
NPL
SLETCD
TGO
TZA UGAAGO
ARM
BLZ
BOLBTN
CIVCMR
EGYGEO
GHA
GTMGUY
HND
IDN
IND
LAO
LKA
LSO
MAR
MDAMNG
MRTNGANIC
PAK
PHLPNG
PRY
SDN
SEN
SLV
SWZSYR
UKR
VNM
VUT
WSM
YEMZMB
ALB
ARGAZE
BIH
BLR
BRA
BWA
CHN
COL
CRI
DMA
DOM
DZA
ECU
GAB
GRD
JAM
JOR
KAZ
KNA
LBY
LCA
LTU
MEX
MKD
MNE
MUS
MYS
PAN
PER
ROMRUS
SRB
SURSYC
THA
TUN
TUR
URYVEN
ZAF
Z-score-weighted average commercial bank
80 85 90 95 100
3,000
2,000
1,000
0
Accounts per thousands adults, commercial banks
Access vs. EfficiencyCorrelation = 0.46*
100 minus lending-deposit spread (%)
EST
HUNISR
JPNKOR
NOR
OMN
QAT
SGP
BGD
COM
HTI KEN
KGZMDG
RWASLE TZAUGAAGO
ARM
BLZ
DJI
GEO
LAO
LSO
MDAMNG
PAK
PHL
PNG
SWZ
SYR
UKR
WBG
YEM
ARG
AZE
BGR
BIH
BWA
CHL
DZA
LBN
LVAMDV MEX
MYS
NAM
PER
SYC
THA
URY
ZAF
80
60
40
20
00 2,000 3,0001,000
Z-score–weighted average commercial bank
Access vs. StabilityCorrelation = 0.02
AUT
ESP
EST
GNQ
GRC
HUNISR
ITAJPN
KOR
MLT
NLD
NOR
OMN
PRT
QAT
SAU
SGP
AFG
BGD
CAF
ETH
HTI
KEN
KGZ
KHMMDG
RWA
SLETCD
TGOTZA
UGAAGO
ARM BLZ
CMR
GEO
GHA
LAO
LSO
MAR
MDA
MNGPAK
PHL
PNG
SWZSYR
UKR
UZB
YEM ARG
AZE
BGR
BIH
BWA
DZA
GAB
KAZ
LBN
LVA
MEX
MYS
NAM
PER
SYC
THA
TUR
URY
ZAF
Accounts per thousands adults, commercial banks
80
60
20
0
40
Z-score–weighted average commercial bank
Efficiency vs. StabilityCorrelation = 0.18
AUS
BHR
BHSBRB
BRN
CAN
CHE
CZE
EST
HKG
HRV
HUNISR
JPN
KOR
KWT
MAC
NOR
NZL
OMN
QAT
SGP
SVN
TTO
BGD
GMB
HTI
KEN
KGZ
MDGMMR
MOZ
MWI
NPL
RWA
SLETJK
TZA
UGAZARAGO
ARM BLZBOL
EGY
FSM
GEO
GTM
GUY
HND
IDN
LAO
LKA
LSO
MDA
MNG
MRT
NGANIC
PAK
PHL
PNG
PRY
SWZSYR
UKR
VNMVUT
WSM
YEM
ZMB
ALB
ARG
AZE
BGR
BIH
BLR
BRA
BWA
CHN
COL
CRI
DMA
DOM
DZA
GRD
JAM
JOR
KNA
LBNLBY
LCA
LTULVA
MEX
MKD
MUS
MYS
NAM
PAN
PER
ROMRUS
SRBSURSYC
THA
URY
VEN
ZAF
80 85 90 95 100
100 minus lending-deposit spread (%)
a. Financial Institutions
FiguRe 1.4 Correlations among Financial System Characteristics
(figure continues next page)

32 b e n c H m a R k i n g f i n a n c i a l s y s t e m s a R o u n d t H e w o R l d GLOBAL finAnciAL DEVELOPMEnT REPORT 2013
FiguRe 1.4 Correlations among Financial System Characteristics (continued)
(Stock market capitalization + outstanding domestic private debt securities)/GDP (Stock market capitalization + outstanding domestic private debt securities)/GDP
Depth vs. AccessCorrelation = 0.39*
Percent market capitalization out of the top 10 largest companies (%)
200
100
50
0
150
0 4020 60 80
AUS
AUT
CAN
CHE
CYP
DEU
ESP GBR
GRC
HKG
HUN
IRL
ISR
ITA
JPN
KOR
LUX
MLT
NOR
NZLPOL
SAU
SGP
SVN
USA
EGY IDN
IND
LKA
MARPHL
ARG
BRA
CHL
CHN
COL
IRN
JOR
MEXMUS
MYS
PERRUS
THA
TUR
ZAF
Depth vs. EfficiencyCorrelation = 0.47*
Stock market turnover ratio (%)
200
50
0
150
100
80 50 150100
AUS
AUT
BEL
BHRBRB
CAN
CHE
CYP
CZE
DEU
DNK
ESP
EST
FIN
FRA
GBR
GRC
HKG
HRV
HUN
IRL
ISLISR
ITA
JPN
KOR
KWT
LUX
MLT
NLD
NOR
NZLOMN POL
PRT
SAU
SGP
SVK
SVN
SWE
TTO
USA
BGD
KEN
KGZ
MWINPL
UGA
ARM
BOL
CIV
EGYFJI
GEOGHA
IDN
IND
LKA
MAR
MNGNGA PAK
PHL
PNG
SLV UKR VNMZMBARGBGR
BRA
BWA
CHL
CHN
COL
CRIECUIRN
JAM
JOR
KAZ
KNA
LBN
LTULVA
MEX
MKD
MNE
MUS
MYS
NAM
PAN
PERRUS
SRB
THA
TUN
TUR
URYVEN
ZAF
200
150
100
50
010 20 30 40 50
(Stock market capitalization + outstanding domestic private debt securities)/GDP
Depth vs. (in)stabilityCorrelation = 0.09
Asset price volatility
AUS
BEL
BHR
CAN
CHE
CYPCZE
DEU
DNK
ESP
EST
FIN
FRA
GBR
GRC
HKG
HRV
HUN
IRL
ISL
ISR
ITA
JPN
KOR
KWT
LUX
MLT
NLD
NOR
NZLOMN
POL
PRT
SAU
SGP
SVK
SVN
SWE
USA
KENEGY
IDN
IND
LKA
MAR
MNGNGAPAK
PHL
UKRVNMARGBGR
BRA
BWA
CHL
CHN
COL
CRI
JAM
JOR
KAZLBN
LTULVA
MEX
MKD
MUS
MYS
NAM
PAN
PERRUS
SRB
THA
TUN
TUR
ZAF
Percent market capitalization out of the top 10 largest companies (%)
Access vs. EfficiencyCorrelation = 0.51*
Stock market turnover ratio (%)
0 50 100 150
80
60
40
20
0
AUS
AUT
CAN
CHE
CYP
DEU
ESPGBR
GRC
HKG
HUN
IRL
ISR
ITA
JPNKOR
LUXMLT
NOR
NZL POL
SAU
SGP
SVN
USA
EGYIDN
IND
LKA
MAR
PHL
ARG
BRA
CHL
CHN
COL
IRN
JORMEX
MUS
MYS
PERRUS
THA TUR
ZAF
Percent market capitalization out of the top 10 largest companies (%)
Access vs. (in)stabilityCorrelation = 0.21
Asset price volatility
80
60
40
20
00 20 30 40 50
AUS
CAN
CHE
CYP
DEU
ESP
GBR
GRC
HKG
HUN
IRL
ISR
ITA
JPNKOR
LUXMLT
NOR
NZLPOL
SAU
SGP
SVN
USA
EGYIDN
IND
LKA
MAR
PHL
ARG
BRA
CHL
CHN
COL
JORMEX
MUS
MYS
PERRUS
THA TUR
ZAF
*Indicates a significant correlation coefficient at the 5% level or better
Stock market turnover ratio (%)
Efficiency vs. (in)stabilityCorrelation = 0.24*
10 20 30 40 50
Asset price volatility
150
100
50
0
AUS
BEL
BHR
CANCHE
CYP
CZE
DEU
DNK
ESP
EST
FIN
FRA
GBR
GRC
HKG
HRV
HUN
IRL
ISL
ISR
ITA
JPN
KOR
KWT
LUXMLT
NLDNOR
NZLOMNPOL
PRT
SAU
SGP
SVKSVN
SWE
USA
KEN
EGY IDN
IND
LKA
MARMNG
NGA
PAK
PHL
UKR
VNM
ARGBGR
BRA
BWA
CHL
CHN
COL
CRIJAM
JOR
KAZ
LBNLTU
LVA
MEX
MKDMUS
MYS
NAMPAN PER
RUS
SRB
THA
TUN
TUR
ZAF
b. Financial Markets
High income Low income Lower middle income Upper middle income High income Low income Lower middle income Upper middle income
High income Low income Lower middle income Upper middle income High income Low income Lower middle income Upper middle income
High income Low income Lower middle income Upper middle income High income Low income Lower middle income Upper middle income

GLOBAL finAnciAL DEVELOPMEnT REPORT 2013 b e n c H m a R k i n g f i n a n c i a l s y s t e m s a R o u n d t H e w o R l d 33
systems across the key regions as of 2010 (table 1.2). The results are by and large in line with what one would expect, with Sub-Saharan Africa scoring the lowest on aver-age on most of the characteristics, and high-income countries scoring the highest on most dimensions. A remarkable number is the rela-tively low score of Middle East and North
(table continues next page)
FiguRe 1.4 Correlations among Financial System Characteristics (continued)
Source: calculations based on the global financial development database.Note: see table 1.2.
ARGARM
AUSAUT
BEL
BGDBOL
BRA
BWA
CHE
CHL
CHN
CIVCOL
CRI
CYP
DEU
ECU EGY
ESP
ESTFIN
FJI
FRA
GBR
GEOGHA
GRC
GUY
HKG
HRV
IDN
IND
IRL
ISL
ISR
ITA
JAM
JOR
JPN
KAZKEN
KNA
KOR
LBN
LKA
LTU
LUX
MAR
MEX
MKD
MLT
MNE
MNG
MUS
MWI
MYS
NAMNGA
NLD
NPL
PAK
PAN
PERPHL PNG
PRT
RUSSAU
SGP
SLVSRBSVK
SVN THA
TUN
TUR
UGA
UKR
URY
USA
VEN
VNM
ZAF
ZMB
Private credit /GDP (%)300
200
100
00 100 200 300 400 500
(Stock market capitalization + outstanding domestic private debt securities)/GDP
c. Financial Sector Depth: Institutions vs. Markets
Africa on access to finance (table 1.2). This number resonates with the complaints heard during the unrest in the region in 2011.11
Much of the differences among regions are correlated with differences in income levels. Countries that have lower income tend to also show lower values on the 0–100 scale in the 4x2 framework (table 1.2 and figure 1.5). However, the stability indicator is not very correlated with income level—a point highlighted quite dramatically by the global financial crisis.
Large disparities in financial systems across countries
Behind these regional and peer group aver-ages are vast differences among individual countries, and in some cases also major differences among different parts of each country’s financial sector. The data from the Global Financial Development Database demonstrate rather strikingly the large differ-ences in financial systems around the globe. For example, the largest financial system in the sample is more than 34,500 times the smallest one. Even if the financial systems are rescaled by the size of the corresponding economies (that is, by their GDP), the larg-est (deepest) financial system is still some 110 times the smallest (least deep) one. And even if the top and bottom 5 percent of this
TABLe 1.2 Financial System Characteristics: Summary
Financial Institutions East Asia Europe and Latin America Middle East and Sub-Saharan (Mean) High income and Pacific Central Asia and the Caribbean North Africa South Asia Africa
Depth 69 43 37 37 33 32 17Access 43 23 35 30 14 16 10Efficiency 80 70 65 62 83 81 51Stability 42 52 20 35 57 38 32
Financial Markets East Asia Europe and Latin America Middle East and Sub-Saharan (Mean) High income and Pacific Central Asia and the Caribbean North Africa South Asia Africa
Depth 43 38 12 21 24 17 20Access 46 80 56 40 50 85 77Efficiency 29 40 17 8 24 49 7Stability 66 60 43 64 81 56 54

34 b e n c H m a R k i n g f i n a n c i a l s y s t e m s a R o u n d t H e w o R l d GLOBAL finAnciAL DEVELOPMEnT REPORT 2013
examines country-level data, one finds vast differences in financial sector depth, as well as in the other characteristics.
The cross-country differentiation along the key characteristics of financial systems can be seen from the scatter plots in figure 1.4 as well as from cartograms such as the
distribution are taken out, the ratio of the largest to the smallest is about 28—a large degree of disparity, considering that these are not raw figures but ratios relative to the size of the economy. Similar orders of magnitude are obtained for the other characteristics of financial systems.12 In other words, when one
TABLe 1.2 Financial System Characteristics: Summary (continued)
Financial Institutions Upper middle Lower middle (Mean) High income income income Low income
Depth 84 44 28 13Access 55 32 19 5Efficiency 86 75 61 42Stability 35 38 40 35
Financial Markets Upper middle Lower middle (Mean) High income income income Low income
Depth 51 27 16 10Access 53 58 69 29Efficiency 45 19 20 21Stability 53 60 53 44
Source: calculations based on the global financial development database.Note: the summary statistics refer to the winsorized and rescaled variables (0–100), as described in the text. financial institutions—depth: private credit/gdp (%); access: number of accounts per 1,000 adults, commercial banks; efficiency: net interest margin; stability: z-score. under financial markets—depth: (stock market capitalization + outstanding domestic private debt securities)/gdp; access: percent market capitalization out of the top 10 largest companies (%); efficiency: stock market turnover Ratio (%); stability: asset price volatility.
FiguRe 1.5 Financial System Characteristics, by income group, 2010
Source: calculations based on the global financial development database.Note: the summary statistics refer to the winsorized and rescaled variables (0–100), as described in the text. see also table 1.2.
80
a. Financial institutions
60
40
20
0Depth
Inde
x (0
–100
)
Inde
x (0
–100
)
Access Efficiency Stability
b. Financial markets
70
60
50
40
30
20
Depth Access Efficiency Stability
High incomeLower middle income
Low incomeUpper middle income

GLOBAL finAnciAL DEVELOPMEnT REPORT 2013 b e n c H m a R k i n g f i n a n c i a l s y s t e m s a R o u n d t H e w o R l d 35
liquidity shocks. In addition, financial insti-tutions on average rebounded faster than markets, showing improvements in depth and efficiency after the crisis. This improve-ment seems to have been the case so far, for example, for Brazil and other Latin Ameri-can countries (de la Torre, Ize, and Schmuk-ler 2011), China (box 1.3), and many Sub-Saharan African countries (see, for example, World Bank 2012). However, the medium-term effect of the crisis on financial systems still remains to be seen, and will be examined further in future issues of the Global Finan-cial Development Report.
increased importance of securities markets at higher income levels
The Global Financial Development Database allows for an examination of the relative size of financial institutions and financial mar-kets around the world. The issue of finan-cial structure—usually approximated by the relative size of bank credit and stock market capitalization—has been an important topic in the policy debate.
In a recent paper that used data that are part of the Global Financial Development
one shown for illustration in figure 1.6. The scatter plots and the cartogram underscore the large cross-country differences. The mea-surement framework underscores that finan-cial sectors in jurisdictions such as the Repub-lic of Korea and the United States exhibit a relatively great financial market depth, as one would expect. The United States has less deep financial institutions, reflecting the less bank-centric (and more market-based) nature of the U.S. financial system. Several Euro-pean countries exhibit relatively great finan-cial depth.
Financial systems have changed. As illus-trated in figures 1.7 and 1.8, the most visible change is the observed declines in stability, which in turn reflects the increased volatility in returns by financial institutions in some countries and in most financial markets.
Overall, the data from the Global Finan-cial Development Database suggest that the key disparities among countries in terms of the nature of their financial systems have somewhat subsided in the aftermath of the recent crisis, as financial sectors in many medium- and low-income countries were relatively more isolated from the global tur-moil, and therefore less affected by the global
FiguRe 1.6 The uneven Nature of Financial Systems (illustration)
Source: calculations based on the global financial development database.Note: the map is for illustration purposes only. country sizes are adjusted to reflect the volume of financial sector assets in the jurisdiction, measured in u.s. dollars at the end of 2010. the image was created with the help of the mapwindow 4 and scapetoad software.

36 b e n c H m a R k i n g f i n a n c i a l s y s t e m s a R o u n d t H e w o R l d GLOBAL finAnciAL DEVELOPMEnT REPORT 2013
would need to find out if taxes, regulations, legal impediments, or other distortions are leading to excessive reliance on banks or markets. Using policy to facilitate a shift from a bank-centric system to a more market-based system is never an easy task. Actively intervening to develop markets is likely to be problematic. Interventions should be more along the lines of fostering an enabling envi-ronment and reducing impediments. Even in systems with a relatively strong state role in the economy, shifts in the financial sec-tor structure do not occur overnight. China (box 1.3) is a case in point: despite policy intentions and reforms aimed at promot-ing nonbank financial institutions and mar-kets, the financial system remains very much
Database, Demirgüç-Kunt, Feyen, and Levine (2012) examine empirically the issue of financial structure and find that, as econ-omies develop, use of services provided by securities markets increases relative to those provided by banks. This work suggests that policies and institutions should adapt as countries develop in order to allow financial structure to evolve.
The existing research and policy work do not provide enough guidance to justify tar-geting a particular financial structure for a particular country. However, if market or bank development is too skewed compared to what one could expect given their level of economic development, the above research findings provide a reason to dig deeper: one
FiguRe 1.7 Financial Systems: 2008–10 versus 2000–07 (Financial institutions)
Source: calculations based on the global financial development database.
100 90 80 70 60 50 40 30 20 10
0 0 10 20 30 40 50
Average 2000–07
60 70 80 90 100
Average 2008–10
a. Depth
100 90 80 70 60 50 40 30 20 10
0 0 10 20 30 40 50
Average 2000–07
60 70 80 90 100
Average 2008–10
b. Efficiency
100 90 80 70 60 50 40 30 20 10
0 0 10 20 30 40 50
Average 2000–07
60 70 80 90 100
Average 2008–10
c. Access
100 90 80 70 60 50 40 30 20 10
0 0 10 20 30 40 50
Average 2000–07
60 70 80 90 100
Average 2008–10
d. Stability

GLOBAL finAnciAL DEVELOPMEnT REPORT 2013 b e n c H m a R k i n g f i n a n c i a l s y s t e m s a R o u n d t H e w o R l d 37
in the fourth quarter of 2008, around the Lehman failure. On the surface, it may seem as if the U.K. financial sector underwent a “productivity miracle” from the 1980s onward, as finance appeared to rise as a share of GDP despite a declining labor and capital share. However, a decomposition of returns to banking suggests that much of the growth reflected the effects of higher risk taking (Haldane, Brennan, and Madou-ros 2010). Leverage, higher trading profits, and investments in deep-out-of-the-money options were the risk-taking strategies that generated excess returns to bank sharehold-ers and staff. Subsequently, as these risks materialized, the “miracle” turned into a mirage.
dominated by large banks, and in some ways has become even more bank-centric during the recent period of rapid credit growth.
The “bright” and “dark” sides of financial systems
The data from the Global Financial Devel-opment Database can be used to examine the notion that growth of financial systems may seem explosive. To some extent, this notion reflects the inadequacy of some of the available proxies for financial systems. For instance, in the case of the United Kingdom, the nominal value-added of the financial sec-tor (as measured in the System of National Accounts) grew at the fastest pace on record
FiguRe 1.8 Financial Systems: 2008–10 versus 2000–07 (Financial Markets)
Source: calculations based on the global financial development database.
100 90 80 70 60 50 40 30 20 10
0 0 10 20 30 40 50 60 70 80 90 100
100 90 80 70 60 50 40 30 20 10
0 0 10 20 30 40 50 60 70 80 90 100
100 90 80 70 60 50 40 30 20 10
0 0 10 20 30 40 50 60 70 80 90 100
100 90 80 70 60 50 40 30 20 10
0 0 10 20 30 40 50 60 70 80 90 100
Average 2000–07
Average 2008–10
a. Depth
Average 2000–07
Average 2008–10
b. Efficiency
Average 2000–07
Average 2008–10
c. Access
Average 2000–07
Average 2008–10
d. Stability

38 b e n c H m a R k i n g f i n a n c i a l s y s t e m s a R o u n d t H e w o R l d GLOBAL finAnciAL DEVELOPMEnT REPORT 2013
They observe that financial systems develop-ment paths exhibit “convexities,” as rising participation and interconnectedness gener-ate positive externalities that promote further participation and interconnectedness. Thus,
More examples of the explosive growth of financial systems using the data from the Global Financial Development Database can be found in de la Torre, Ize, and Schmukler (2011) and de la Torre, Feyen, and Ize (2011).
BOX 1.3 China Case Study: Large Banks and the Need to Diversify to Markets
The 4x2 measurement framework allows country officials and analysts to examine financial systems across borders and to put them in a broader interna-tional perspective. The rapid and somewhat uneven development of China’s financial system provides for an interesting case study.
Over the past three decades, China’s economy has maintained high growth rates. Since the start of reforms in 1978, productivity growth has been rapid and capacity has been expanded by very high levels of investment.
China has made progress in moving toward a more commercially oriented financial system and toward strengthening of its banks (World Bank 2011c). This progress has been underpinned by reforms that included recapitalizing the banking system, upgrad-ing the prudential regulatory regime, opening the financial system following accession to the World Trade Organization, and taking steps to reform inter-est rate and exchange rate policies. Reform of the joint-stock banks has boosted the commercial orien-tation of the banking system, and reform of the rural credit cooperatives has yielded some initial results.
The commercial banking sector has grown very rapidly in the past decade. In terms of the 4x2 frame-work, the Chinese banking sector was already rather large, being close to or at the 100 score in terms of the depth indicator (see figure B1.3.1). In this sense, China may seem already “developed” in terms of the size of its financial institutions. However, the rapid credit growth of the 2000s may have been too rapid and contributed to a somewhat reduced stability score. Perhaps greater increase in depth of the finan-cial markets may have been more warranted.
The 4x2 framework underscores that one of the challenges for the Chinese financial sector is to increase its diversification. Banks, particularly the largest ones, still dominate financial intermediation. Recognizing this challenge, the country authorities have taken steps to diversify the financial sector. In the securities sector, key companies have been
restructured, and a resolution mechanism and inves-tor protection scheme have been set up. Pension sec-tor reform has also progressed, with the establish-ment of a National Social Security Fund in 2000. The fixed income market has grown as an alterna-tive funding channel, but it remains heavily concen-trated in public sector securities. The equity market mainly meets the needs of large enterprises, in spite of recent progress in establishing a multilayer equity market to facilitate funding to small and medium enterprises (SMEs). Assets under management by the insurance sector corresponded to less than 11 percent of household bank deposits. Trust, financial leasing, and finance companies have all been grow-ing rapidly but remain small relative to banks. China also has a flourishing informal financial sector, parts of which provide funding to SMEs and small retail investors. Nonetheless, the large commercial banks make up almost two-thirds of commercial bank assets, with the assets of the four largest banks each exceeding 25 percent of GDP (and ranking among the largest banks in the world).
Source: calculations based on world bank 2011c. Note: for simplicity, the figure shows only four out of the eight variables in the 4x2 framework. see also the note to table 1.2.
100
Inde
x (0
–100
)
80
60
40
20
02000 2002 2004 2006 2008 2010
Depth (institutions) Stability (institutions)Depth (markets) Stability (markets)
FiguRe B1.3.1 The Chinese Financial Sector

GLOBAL finAnciAL DEVELOPMEnT REPORT 2013 b e n c H m a R k i n g f i n a n c i a l s y s t e m s a R o u n d t H e w o R l d 39
to the crisis. For example, the financial stabil-ity indicators for many countries show dete-rioration several years prior to the crisis (see figure B1.3.1 in box 1.3 for an illustration for China). This finding is consistent with the observation by Anginer and Demirgüç-Kunt (2011), who construct a default risk measure for publicly traded banks using the Merton contingent claim model, and exam-ine the evolution of the correlation struc-ture of default risk for some 1,800 banks in over 60 countries. Based on their measure, which is a more sophisticated analogue of the z-score used in this chapter, they find a significant increase in default risk codepen-dence over the three-year period leading to the financial crisis. They also find that coun-tries that are more integrated, and that have liberalized financial systems and weak bank-ing supervision, have higher codependence in their banking sector. The results support an increase in scope for international supervi-sory cooperation, as well as capital charges for “too-connected-to-fail” institutions that can impose significant externalities.
The 4x2 framework also allows examin-ing the effects of the global financial crisis. Box 1.4 illustrates this in the case of Roma-nia, a country whose financial sector seemed relatively sound based on conventional ratios (such as capital adequacy and nonperforming loan ratios) but that was subjected to rather large shocks during the crisis. Figures 1.7 and 1.8 examine the crisis effect in a cross-section of countries.
conclUSion
The 4x2 framework presented in this chapter puts a spotlight on the multifaceted nature of modern financial systems. Focusing only on one dimension—say, financial depth or finan-cial stability—would be shortsighted. Also, focusing only on financial institutions, or just on banks, is too much of a simplification and can lead to distorted results and biased policy conclusions.
This chapter illustrates that financial sectors come in different shapes and sizes, and they differ widely in terms of the 4x2
much of financial system growth may be explosive. According to the authors, a counter-part of such explosiveness is that the associa-tion between financial development (approxi-mated, for example, as private credit to GDP) and real development (output growth) exhibits decreasing returns. In other words, the asso-ciation between finance and growth levels off at some point. This result is consistent with findings of recent papers that regress output growth against financial depth indicators.13
A different aspect of this convexity has been brought up recently by Cihák, Muñoz, and Scuzzarella (2011). Using a subset of data from the Global Financial Development Data-base, and building on an earlier theoretical paper by Nier and others (2007), they exam-ine the “bright” and “dark” sides of cross- border financial interlinkages. They ask whether making a country’s banking sector more linked to the global banking network renders that country more or less prone to banking crises. Their answer, interestingly, is that it depends on how connected the coun-try’s banking sector already is. For banking sectors that are not very connected to the global banking network, increases in inter-connectedness are associated with a reduced probability of a banking crisis. Once intercon-nectedness reaches a certain value (estimated to be at about the 95th percentile of the distri-bution of countries in terms of interconnected-ness), further increases in interconnectedness can increase the probability of a banking cri-sis. Also, the analysis suggests that it is impor-tant to distinguish whether the cross-border interlinkages are stemming primarily from banks’ asset side or from their liabilities side: increasing interconnectedness on the liabilities (borrowing) side is more likely to become det-rimental to banking stability than increasing interconnectedness on the asset (creditor) side.
Analysis of the crisis: increased instability in the run-up, decreased access in the aftermath
The rich data set in the Global Financial Devel- opment Database allows one to examine in more depth the developments in the run-up

40 b e n c H m a R k i n g f i n a n c i a l s y s t e m s a R o u n d t H e w o R l d GLOBAL finAnciAL DEVELOPMEnT REPORT 2013
with this report, should help country offi-cials, researchers, and anybody else with interest in the matter to better benchmark financial systems. The Statistical Appendix to the report includes country tables with select indicators, as well as aggregates across regions and income groups. A pocket edi-tion of the database is also made available as Little Data Book on Financial Development. Finally, readers are encouraged to go online and explore this large and interesting source of data by themselves.
dimensions. More specifically, the chap-ter also documents developments during the global financial crisis, not only in terms of financial instability, but also in terms of financial depth, access, and efficiency.
Despite the remarkable progress in gather-ing data and information on financial systems around the world in recent years, researchers’ and practitioners’ ability to properly mea-sure financial systems has been constrained by lack of comprehensive data. The data that are being made publicly available, together
BOX 1.4 Romania Case Study: Rapid growth enabled by Foreign Funding
In the run-up to the global financial crisis, Romania’s financial sector has gone through a period of rapid growth, reflected in an increase in the measured financial depth. Similarly to many other countries in the region, the rapid growth of domestic credit was fueled by ample funding provided by parents of foreign-owned banks to their subsidiaries in Roma-nia. In terms of the 4x2 framework, Romania’s score for financial institutions’ depth grew from only 3 in 2000 to 28 in 2007, and its score for financial mar-kets’ depth grew from 1 to 13 over the same period.
The Romanian banking system, which dominates the financial sector, entered the crisis with relatively high reported capitalization and liquidity ratios (IMF 2009). Also, the ratios of nonperforming loans to total loans reported before the crisis were rather low; however, this finding was mostly just a reflec-tion of the high credit growth that masked to some extent the underlying weaknesses in the system. The z-score, that is, the proxy for stability used in the 4x2 framework, suggested that the soundness of Romanian banks was far from perfect in the run-up to the crisis.
A rapid deterioration in market confidence in the Romanian economy has led to bouts of down-ward pressure on the exchange rate, upward pres-sure on interest rates, and a large decline in equity values (some 80 percent between 2008 and 2009). These effects led to sharp increases in nonperform-ing loans, putting strains on bank capital positions. Stress-testing analysis performed during the recent Financial Sector Assessment Program (FSAP) (IMF 2009) suggested that some banks were at risk of
becoming undercapitalized as the downturn contin-ues. The FSAP therefore called for strengthening of capital positions of some banks and for maintain-ing by parents of foreign-owned banks those lines of credit to their subsidiaries and corporate borrowers in Romania. In terms of the 4x2 framework, these stability challenges are reflected in major declines of the stability indicators, both for financial institu-tions and financial markets, in 2008 and 2009. Also, the framework highlights that the crisis has halted, at least temporarily, Romania’s increases in financial depth.
Source: calculations based on world bank; imf 2009. Note: for simplicity, the figure shows only four of the eight variables in the 4x2 framework. see also the note to table 1.2
FiguRe B1.4.1 Romania’s Financial Sector
100
Inde
x (0
–100
)
80
60
40
20
02000 2002 2004 2006 2008 2010
Depth (institutions) Stability (institutions)Depth (markets) Stability (markets)

GLOBAL finAnciAL DEVELOPMEnT REPORT 2013 b e n c H m a R k i n g f i n a n c i a l s y s t e m s a R o u n d t H e w o R l d 41
new trends or observations, and they will focus on the relevant theme at hand, such as financial inclusion or capital market develop-ment, or other issues of policy relevance.
Future versions of the Global Financial Development Report will revisit issues of measurement of financial systems around the world. They will also report on substantial
chapter 1 annex: overview of the Data Sources Underlying the Global Financial Development Database
This annex is a summary. For more on the Global Financial Development Database, including the individual country data and metadata, see this report’s Statistical Appen-dix and the Global Financial Development Report website at http://www.worldbank .org/financialdevelopment.
Database on Financial Development and Structure (updated November 2010). This database was used a starting point for many of the basic indicators of size, activity, and efficiency of financial intermediaries and markets. Beck, Demirgüç-Kunt, and Levine (2010) describe the sources and construction of, and the intuition behind, different indica-tors and present descriptive statistics.
Bankscope (Bureau van Dijk, http:// www.bvdinfo.com/Products/Company-Information/International/BANKSCOPE .aspx) was used to obtain and update data on banks. Bankscope combines widely sourced data with flexible software for searching and analyzing banks. Bankscope contains com-prehensive information on banks across the globe. It can be used to research individual banks and find banks with specific profiles and analyze them. Bankscope has up to 16 years of detailed accounts for each bank.
Bloomberg (http://www.bloomberg.com/), Dealogic (http://www.dealogic.com/), and Thomson Reuters Datastream (http://thom sonreuters.com/products_services/financial/financial_products/a-z/datastream/) were used to obtain higher frequency data on stock exchange and bond markets that were aggregate on a country level.
The Doing Business database (http://www.doingbusiness.org/data), a part of the Doing Business project, offers an expansive array of economic data in 183 countries, covering the period from 2003 to the pres-ent. The data cover various aspects of busi-ness regulations, including those relevant to financial sector development issues, such as enforcing contracts and obtaining credit.
IMF’s Access to Finance database (http://fas.imf.org/) aims to systematically measure access to and use of financial services. Fol-lowing Beck, Demirgüç-Kunt, and Martínez Pería (2007), the database measures the reach of financial services by bank branch network, and availability of automated teller machines, and does so by using four key financial instruments: deposits, loans, debt securities issued, and insurance. The website contains annual data from about 140 respondents for the six-year period, including data for all G-20 countries.
The Global Financial Inclusion Index (Global Findex) is a new database of demand-side data on financial inclusion, which docu-ments financial usage across gender, age, education, geographic regions, and national income levels. The core set of indicators and subindicators of financial inclusion, based on the Global Findex database, includes Use of bank accounts (% of adults with an account at a formal financial institution, purpose of accounts, frequency of transactions; % of adults with an active account at a formal financial institution, mode of access); Savings (% of adults who saved in the past 12 months

42 b e n c H m a R k i n g f i n a n c i a l s y s t e m s a R o u n d t H e w o R l d GLOBAL finAnciAL DEVELOPMEnT REPORT 2013
Bank for International Settlements (BIS) (http://www.bis.org/) statistics were used for the aggregate data on bond statistics, includ-ing domestic debt securities by residence and type of instrument (bonds and notes vs. money market instruments, issued by finan-cial and nonfinancial corporations; based on publicly available or country-reported data). Domestic debt securities (Quarterly Review Table 16) for a given country comprise issues by residents in domestic currency targeted at resident investors, whereas international debt securities (Quarterly Review Table 11) are the ones targeted at nonresidents (a) in domes-tic currency on the domestic market, (b) in domestic and foreign currency on the inter-national market, plus (c) the issues in foreign currency in the domestic market (further information can be found in the Guide to the International Financial Statistics, http://www.bis.org/publ/bppdf/bispap14.htm).
Two different collection systems are used (s-b-s for international debt securities and aggregated data for domestic debt securities), resulting in some possible overlap (between domestic debt securities and international debt securities) and inconsistencies (classifi-cation of issuers).
Country authorities’ websites were used to reconfirm and fill in some of the gaps in the data.
noteS
1. See http://www.copenhagenconsensus.com. Among the top 30 solutions, microfinance was considered as a way to improve liveli-hoods of poor women, but this topic did not make it to the top 10.
2. This is not the only approach to classifying the functions provided by the financial system, but it is not dramatically different from other approaches (such as Merton 1992; Merton and Bodie 2004), and it is an approach that fits rather well with the large finance litera-ture, including recent research.
3. In the empirical literature, identifying the impact of finance has sometimes proved challenging. Some of the early literature on the subject requires the problematic iden-
using a formal financial institution, % of adults who saved in the past 12 months using an informal savings club or a person outside the family, % of adults who otherwise saved in the past 12 months); Borrowing (% of adults who borrowed in the past 12 months from a formal financial institution, % of adults who borrowed in the past 12 months from informal sources, % of adults with an outstanding loan to purchase a home or an apartment); Payments (% of adults who used a formal account to receive wages or govern-ment payments in the past 12 months, % of adults who used a formal account to receive or send money to family members living else-where in the past 12 months, % of adults who used a mobile phone to pay bills or send or receive money in the past 12 months); Insurance (% of adults who personally pur-chased private health insurance, % of adults who work in farming, forestry, or fishing and personally paid for crop, rainfall, or livestock insurance).
Financial Soundness Indicators database (http://fsi.imf.org/), hosted by the IMF, dis-seminates data and metadata on selected financial soundness indicators provided by participating countries.
World Development Indicators (http://data.worldbank.org/data-catalog/world-development-indicators) is the primary World Bank collection of development indicators, compiled from officially recognized interna-tional sources. It presents the most current and accurate global development data avail-able, and includes national, regional, and global estimates.
International Financial Statistics (http://elibrary-data.imf.org/FindDataReports. aspx?d=33061&e=169393), from the IMF, provides is a standard source of international statistics on all aspects of international and domestic finance. It reports, for most coun-tries of the world, basic financial and eco-nomic data on international banking, money and banking, interest rates, prices, produc-tion, international transactions, international liquidity, government accounts, exchange rates, and national accounts.

GLOBAL finAnciAL DEVELOPMEnT REPORT 2013 b e n c H m a R k i n g f i n a n c i a l s y s t e m s a R o u n d t H e w o R l d 43
8. See annex. 9. For example, many central banks around the
world publish reports focused almost exclu-sively on financial stability (Čihák, Muñoz, Teh Sharifuddin, and Tintchev 2012). Simi-larly, the IMF’s Global Financial Stability Report has a clear stability focus. There are, however, many complementarities between financial stability, depth, access, and effi-ciency, as emphasized for instance in the World Bank–IMF’s Financial Sector Assess-ment Program.
10. Ranciere, Tornell, and Westermann (2008), for example, find that countries that have experienced occasional financial crises have, on average, grown faster than countries with stable financial conditions.
11. In contrast, efficiency seems surprisingly relatively high in Middle East and North Africa, as well as in South Asia. This is in part because an important part of bank lend-ing goes to large companies and to the public sector, leading to relatively lower reported margins.
12. To put this in a more anthropomorphic per-spective, the tallest adult person on earth is less than 5 times taller than the smallest per-son (http://www.guinessworldrecords.com).
13. For example, Rioja and Valev (2004) find (a) no statistically significant relationship between finance and growth at low levels of financial development, (b) a strong positive relationship at intermediate levels of financial development, and (c) a weaker but still posi-tive effect at higher levels of financial devel-opment. Arcand, Berkes, and Panizza (2011) find that finance actually starts having a nega-tive effect on output growth when credit to the private sector exceeds 110 percent of GDP. Similarly, Cecchetti and Kharroubi (2012) find that the aggregate productivity growth in an economy increases with private sector credit to GDP, but only up to a point; after that point, increases in private sector credit to GDP are associated with lower aggregate productivity growth.
tifying assumption that legal origins matter for development only through their impacts on finance. But subsequent papers have tried more nuanced and more persuasive approaches to identification (such as Rajan and Zingales 1998).
4. The database builds on previous work within the World Bank Group, in particular the rel-evant papers by Beck, Demirgüç-Kunt, and Levine (2000, 2010) and Beck and others (2006). The database also builds on Finan-cial Soundness Indicators database (http://fsi.imf.org/) and the Financial Access Survey (http://fas.imf.org/). There are several major sets of data. Chapter 1 annex provides a basic description of the data sources. The Statisti-cal Appendix at the end of the report shows country-by-country data for 2008–10.
5. The data source is IMF’s International Finan-cial Statistics (see annex). Private credit iso-lates credit issued to the private sector and therefore excludes credit issued to govern-ments, government agencies, and public enterprises. Private credit also excludes credit issued by central banks.
6. This report includes other measures as well. Also relevant are indicators of structure within the individual financial segments, such as the concentration ratios (Herfindahl index, shares of various types of financial institutions in total assets and in GDP, and shares of individual markets in total market capitalization). Some of these measures (for example, the percentage of assets of the three or five largest financial institutions in GDP) are important for the stability dimension, because they provide a rough approximation for the potential for impact in the case of a major financial disruption.
7. Financial structure differs markedly across economies. Over the full sample period, the annual average value of the financial struc-ture ratio is 279. Countries such as Austra-lia, India, Singapore, and Sweden have this ratio at or below 2.35 (10th percentile), while Bolivia, Bulgaria, Serbia, and Uganda are examples of countries where this ratio is over 356 (90th percentile).