Benchmark Testing Results: Lawson System Foundation ...€¦ · Benchmark Testing Results: Lawson...
27
Benchmark Testing Results: Lawson System Foundation and Microsoft SQL Server i Benchmark Testing Results: Lawson System Foundation Running on SQL Server Benchmark testing confirms the performance and scalability of the Lawson System Foundation 9.0.1 running on SQL Server2008 R2 Enterprise and Windows Server 2008 R2 Enterprise Technical White Paper Published: October 2011 Applies to: Microsoft SQL Server 2008 R2 Enterprise Abstract Lawson and Microsoft worked together on a series of benchmarking tests using Lawson System Foundation (LSF) 9.0.1 running on Microsoft SQL Server 2008 R2 Enterprise and Windows Server 2008 R2 Enterprise. The goal of the benchmark testing was to confirm that the LSF module running on the Microsoft platform can meet the demands of the largest Lawson enterprise customers. The benchmark testing results confirm that LSF running on SQL Server is scalable and responsive. With its ability to scale on SQL Server, LSF not only meets the current needs of large customers, but can also scale as their needs grow. SQL Server can provide the additional benefits of reduced licensing, hardware, administration, and support fees for Lawson customers. Customers can be confident that LSF―deployed on SQL Server and Windows Server―provides a reliable, cost-effective, and low-maintenance platform that can help meet their performance and scalability requirements.
Transcript of Benchmark Testing Results: Lawson System Foundation ...€¦ · Benchmark Testing Results: Lawson...

Benchmark Testing Results: Lawson System Foundation and Microsoft SQL Server i
BenchmarkTestingResults:Lawson
SystemFoundationRunningonSQLServer
Benchmark testing confirms the performance and scalability of the Lawson System Foundation 9.0.1
running on SQL Server2008 R2 Enterprise and Windows Server 2008 R2 Enterprise
Technical White Paper Published: October 2011 Applies to: Microsoft SQL Server 2008 R2 Enterprise Abstract
Lawson and Microsoft worked together on a series of benchmarking tests using Lawson System Foundation
(LSF) 9.0.1 running on Microsoft SQL Server 2008 R2 Enterprise and Windows Server 2008 R2 Enterprise. The
goal of the benchmark testing was to confirm that the LSF module running on the Microsoft platform can
meet the demands of the largest Lawson enterprise customers.
The benchmark testing results confirm that LSF running on SQL Server is scalable and responsive. With its
ability to scale on SQL Server, LSF not only meets the current needs of large customers, but can also scale as
their needs grow. SQL Server can provide the additional benefits of reduced licensing, hardware,
administration, and support fees for Lawson customers.
Customers can be confident that LSF―deployed on SQL Server and Windows Server―provides a reliable,
cost-effective, and low-maintenance platform that can help meet their performance and scalability
requirements.

Benchmark Testing Results: Lawson System Foundation and Microsoft SQL Server ii
©2011 Microsoft Corporation. All rights reserved. This document is provided “as-is.” Information and views
expressed in this document, including URL and other Internet Web site references, may change without notice.
You bear the risk of using it.
This document does not provide you with any legal rights to any intellectual property in any Microsoft product.
You may copy and use this document for your internal, reference purposes.

Benchmark Testing Results: Lawson System Foundation and Microsoft SQL Server iii
TableofContents
Introduction .................................................................................................................................................. 1
Overview of Lawson and LSF ............................................................................................................................ 1
Benefits of SQL Server....................................................................................................................................... 2
Benchmark Testing Overview ........................................................................................................................ 3
Benchmark Testing Environment ................................................................................................................... 3
Hardware Used ................................................................................................................................................. 3
Software Used .................................................................................................................................................. 4
Benchmark Testing Procedures ..................................................................................................................... 4
Application Tests .............................................................................................................................................. 4
Environment Tuning ......................................................................................................................................... 5
Test Details and Results ................................................................................................................................. 6
Online Human Resource Processing Form (HR11) ............................................................................................ 6
Online Payroll Record Processing Form (PR36) ................................................................................................ 8
Payroll Cycle Batch Test (PR Cycle) ................................................................................................................. 10
Online Accounts Payable Basic Invoice Form (AP20) ...................................................................................... 14
Accounts Payable Batch Test (AP Cycle) ......................................................................................................... 16
Online Finance Department Journal Transaction Form (GL40) ...................................................................... 18
General Ledger Batch Test (GL Batch) ............................................................................................................ 21
Conclusion ................................................................................................................................................... 23
Additional Information ................................................................................................................................ 24
About Lawson ................................................................................................................................................. 24
About Microsoft.............................................................................................................................................. 24

Benchmark Testing Results: Lawson System Foundation and Microsoft SQL Server 1
Introduction The technological foundation of an organization’s business software determines, to a substantial
degree, its performance and value. Lawson has developed a standards-based infrastructure—
Lawson System Foundation (LSF)—that consolidates core Lawson technology and enterprise-class
technologies, with the goal of meeting or exceeding an organization’s expectations for ease of
implementation, application performance, investment protection, security, scalability, total cost of
ownership (TCO), and return on investment (ROI).
In August 2011, Lawson and Microsoft worked together on a series of benchmarking tests using LSF
9.0.1 running on Microsoft SQL Server 2008 R2 Enterprise and Windows Server 2008 R2 Enterprise.
The goal of the tests was to demonstrate overall scalability of the system as the workload increases,
to validate the base sizing formulas used for LSF on the Microsoft platform, and to prove that the
Microsoft platform is a viable solution for large customer implementations.
The benchmark testing results determined that LSF running on SQL Server and Windows Server
provided scalability, and LSF and other components in the technology stack were able to take full
advantage of the 32 available processing cores. Highlights of the benchmark testing include the
following:
• The overall system was able to provide significant scalability.
o The maximum sustained number of concurrent users tested was 6,000 for the
online payroll record processing form test.
o The maximum number of concurrent batch jobs tested was 72 jobs for the payroll
batch process test with a volume of 288,000 employees.
• No physical memory saturation or excessive paging was observed.
• SQL Server was not the limiting factor in any of the benchmark tests.
This white paper presents the details of the hardware and software used in the benchmark testing,
in addition to the full results. Links are provided for further information.
OverviewofLawsonandLSF Lawson provides software and service solutions to more than 4,500 customers worldwide in the
manufacturing, distribution, maintenance, healthcare, and service sectors. Lawson solutions help
customers simplify their businesses by helping them streamline processes, reduce costs, and
enhance business or operational performance.
Applications in the Lawson S3 product line are designed to help customers staff, source, and serve.
These applications primarily target services industries such as enterprise financial management,
human resource management, supply chain management, and business intelligence. Industries that
Benchmark Testing Results: Lawson System Foundation and Microsoft SQL Server 2
use Lawson S3 products include healthcare, retail, state government, local government, and K-12
education.
LSF, the Lawson middleware layer, insulates the Lawson S3 applications from the underlying
operating systems and databases on which the applications are deployed. LSF provides
performance, scalability, and security to the Lawson S3 applications. LSF combines an industry
standard, open run-time environment with tools for managing deployment, security, and
performance to meet an organization’s industry-unique operational needs.
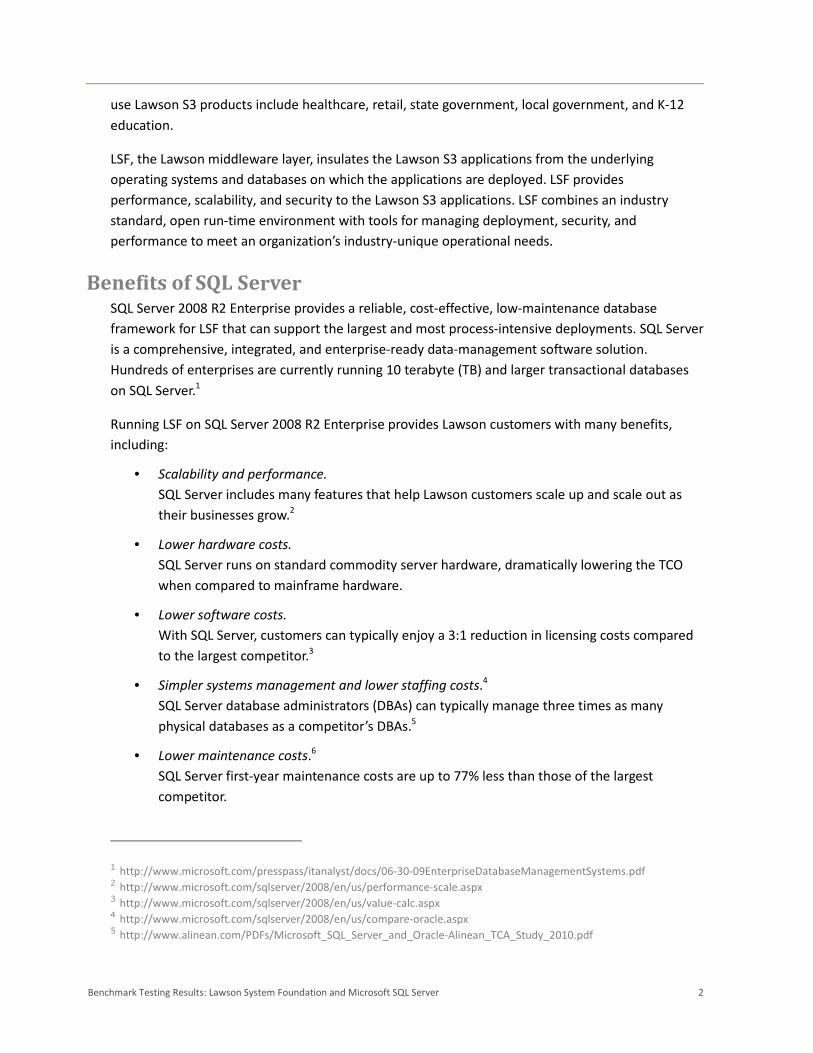
BenefitsofSQLServer SQL Server 2008 R2 Enterprise provides a reliable, cost-effective, low-maintenance database
framework for LSF that can support the largest and most process-intensive deployments. SQL Server
is a comprehensive, integrated, and enterprise-ready data-management software solution.
Hundreds of enterprises are currently running 10 terabyte (TB) and larger transactional databases
on SQL Server.1
Running LSF on SQL Server 2008 R2 Enterprise provides Lawson customers with many benefits,
including:
• Scalability and performance.
SQL Server includes many features that help Lawson customers scale up and scale out as
their businesses grow.2
• Lower hardware costs.
SQL Server runs on standard commodity server hardware, dramatically lowering the TCO
when compared to mainframe hardware.
• Lower software costs.
With SQL Server, customers can typically enjoy a 3:1 reduction in licensing costs compared
to the largest competitor.3
• Simpler systems management and lower staffing costs.4
SQL Server database administrators (DBAs) can typically manage three times as many
physical databases as a competitor’s DBAs.5
• Lower maintenance costs.6
SQL Server first-year maintenance costs are up to 77% less than those of the largest
competitor.
1 http://www.microsoft.com/presspass/itanalyst/docs/06-30-09EnterpriseDatabaseManagementSystems.pdf 2 http://www.microsoft.com/sqlserver/2008/en/us/performance-scale.aspx 3 http://www.microsoft.com/sqlserver/2008/en/us/value-calc.aspx 4 http://www.microsoft.com/sqlserver/2008/en/us/compare-oracle.aspx 5 http://www.alinean.com/PDFs/Microsoft_SQL_Server_and_Oracle-Alinean_TCA_Study_2010.pdf

Benchmark Testing Results: Lawson System Foundation and Microsoft SQL Server 3
• Fewer security vulnerabilities.
SQL Server consistently has fewer security vulnerabilities than the largest competitor.7
With SQL Server, Lawson customers can save with reduced licensing, hardware, administration, and
support fees, which translate into substantially lower costs over the system's life.
BenchmarkTestingOverview The goal of the benchmark testing was to demonstrate the scalability, performance, and cost
efficiency of using LSF 9.0.1 with SQL Server 2008 R2 Enterprise on the Windows Server 2008 R2
Enterprise edition operating system by replicating the demands of typical large Lawson customers.
The tests were run on commodity hardware to simulate a realistic cost of ownership.
The results of the benchmark testing demonstrate that LSF 9.0.1 on SQL Server 2008 R2 Enterprise
and Windows Server 2008 R2 Enterprise can meet the demanding performance requirements of
large Lawson customers.
BenchmarkTestingEnvironment The benchmarking tests were conducted at Microsoft in Redmond, Washington, in August 2011.
HardwareUsed The tests were performed on a single server that supported the database, application, and web
tiers.
Following are details of the hardware used:
• Hewlett Packard (HP) ProLiant DL580 G7 server
• 32 processor cores (Four 8-core Intel Xeon X7560 processors, running at 2.27 GHz)
• 256 GB memory
Following are details of the disk subsystem:
• Local storage:
146 GB SAS, 2.5", 15K RPM; operating system configured on a RAID 0 array made up of two
disks
• Host bus adapters (HBAs):
EMC Emulex LightPulse LPe12002 dual-channel HBA, 8 Gb/s per port, one port used
• Switch:
Brocade 5300s 8 Gb switch (80-port)
6 http://www.microsoft.com/sqlserver/2008/en/us/compare-oracle-calc.aspx
7 NIST National Vulnerability Database, http://nvd.nist.gov/

Benchmark Testing Results: Lawson System Foundation and Microsoft SQL Server 4
• Storage area network (SAN):
EMC CLARiiON CX4-960, two service processors, each with six ports, 4 Gb/s per port (total
potential throughput of 24 Gb/s, or 3.0 GB/s)
• Data disks:
268 GB 15K RPM Fibre Channel, configured on a RAID 10 array made up of eight disks
• Fusion-io solid-state drive (SSD):
Fusion-io ioDrive Duo 1.28 TB MLC, driver version 2.3.1, low-level format of 512 bytes
• Disk configuration (for data disks and Fusion-io SSD):
All disks were explicitly partitioned with an offset of 1 MB and 64K file allocation unit size
SoftwareUsed Tests were performed with the following software:
• SQL Server 2008 R2 Enterprise
• Windows Server 2008 R2 Enterprise
• Lawson System Foundation 9.0.1
• Lawson Applications 9.0.1.4
• IBM WebSphere Application Server 7.0.0.13—Network Deployment
• JDK 1.6.0_22
• Business Software Incorporated (BSI) Tax Factory 9b
• HP LoadRunner 11.0
BenchmarkTestingProcedures Following are the procedures Microsoft and Lawson used to analyze system performance and
scalability of the LSF module running on SQL Server and Windows Server.
ApplicationTests Four types of application procedures were tested:
• Human resources (HR)
• Payroll (PR)
• Accounts payable (AP)
• General ledger (GL)
Each procedure has a specific application form number that represents a business process (for
example, HR11 is the human resource processing form).
The HR and PR applications were tested first, followed by the AP and GL applications. Both online
test and batch tests, in which a number of processes run in sequence, were run.
Table 1 shows a summary and brief description of the online tests performed.

Benchmark Testing Results: Lawson System Foundation and Microsoft SQL Server 5
Table 1. Summary of online tests
Test Designation
(Form Number) Test Type Number of Concurrent Users
HR11 Employee entry 500 and 1,000 concurrent users
PR36 Time entry 2,000, 4,000, and 6,000 concurrent users
AP20 Invoice entry 2,000 and 4,000 concurrent users
GL40 Journal entry 2,000 and 4,000 concurrent users
Table 2 shows a summary and brief description of the batch tests that were performed:
Table 2. Summary of batch tests
Batch Test Volume Number of Concurrent Jobs
Payroll cycle processing
96,000 employees
1, 2, 4, 8, 12, 24, and 48 concurrent batch
jobs
Payroll cycle processing 288,000 employees 24, 48, and 72 concurrent batch jobs
Accounts payable monthly
close 120,000 invoices 1, 2, 6, and 12 concurrent batch jobs
General ledger monthly
close
256,000 journal
entries 1, 2, 8, and 16 concurrent batch jobs
EnvironmentTuning Before the benchmark testing was started, the system was tuned to increase the throughput and
improve overall response times and performance:
• Windows Server configuration:
o Windows Server settings were optimized for Applications instead of Background
Services. However, it was noted that there was no discernable performance impact
observed by changing this setting.
o The Processor Power Management (PPM) setting was changed from the default
setting of Balanced to High Performance. This ensured that the CPU utilization
reporting metrics were reporting utilization based on all 32 cores, and not on a
subset of the overall processing capacity of the server.

Benchmark Testing Results: Lawson System Foundation and Microsoft SQL Server 6
• LSF configuration:
o LaConfig
The desktop heap was set to 3072. This is necessary when running a large number
of concurrent users in the online tests. Note that a 32-bit COBOL launcher was
used.
o Pgmtrndef:
The users per process setting was set to three for all programs and all invoke
programs. This allowed multiple COBOL program executable instances for any given
token or program (for example, PR36), ensuring that a single executable did not
cause bottleneck conditions.
• WebSphere configuration:
o A five-node application server cluster was created, and the maximum JVM heap
was set to 2 GB for each node.
o The web container thread pool was set to expand beyond the default value of 50 if
needed. For the benchmark testing, however, the value did not exceed 50.
TestDetailsandResults Following are the detailed results for each of the processes tested.
OnlineHumanResourceProcessingForm(HR11) HR11 is the main user-interaction screen or form used to maintain employee records. HR11 can be
used to add employees to the system or to change employee data including location, department,
address, and benefit information, all of which is related to the individual record.
HR11TestingProcedure
In the benchmarking test, the HP LoadRunner load generation tool was used to simulate a number
of virtual users entering HR11 transactions at an average transaction-entry rate of 4.5 minutes per
employee added by each online user through the Lawson portal. (The “think” time for the HR11
script was set at a random delay between 180 seconds and 360 seconds.) Each HR11 transaction
added a new, unique employee record to the database.
The HR11 tests were run with 500 and 1,000 concurrent users.
With the script pacing used, more than 13,000 employees were added to the database each hour at
1,000 concurrent online users. Adding employees at this rate is unrealistic for all but the most
unique situations, such as a merger or acquisition when a very large employee population must be
added to the database. There was therefore no attempt to scale the HR11 benchmarking test
beyond 1,000 concurrent users.
Note that the HR11 form has the highest number of fields to complete, and therefore HR11 requires

Benchmark Testing Results: Lawson System Foundation and Microsoft SQL Server 7
the largest amount of data to be transferred and processed for each transaction.
HR11Database
The HR11 database was built using a medium retail-client type General Ledger company with
12,000 employees and 500 supervisors as the base dataset. A retail-client type of company is
defined as one that has 20% exempt employees and 80% non-exempt employees. A medium payroll
profile has 20 deductions and 12 time-records per employee. No historical data was generated for
the HR11 database.
HR11Results
Table 3 shows the total throughput in employees added per hour, maximum CPU utilization, and
reported average transaction response time (ATRT) with 500 and 1,000 concurrent users for the
HR11 test. Note that the ATRT for HR11 is the sum of the response times for several different HTTP
calls required to navigate the HR11 form and add an employee record.
Table 3. HR11 results
Number of
Concurrent Users
Employees Added
per Hour CPU Utilization
ATRT
(sec)
ATRT Ninetieth
Percentile (sec)
500 6,650 12.5% 0.587 0.792
1,000 13,358 17.7% 0.722 1.073
Figure 1 shows the results of the total throughput (in employees added per hour) and the maximum
CPU utilization.

Benchmark Testing Results: Lawson System Foundation and Microsoft SQL Server 8
Figure 1. HR11 throughput and CPU utilization
Figure 2 shows the ATRT for the HR11 tests. Note that reasonable response times were achieved
even for an unrealistically high throughput rate.
Figure 2. HR11 response time
OnlinePayrollRecordProcessingForm(PR36) The PR36 form is used to define time and pay records. This is a manual entry screen that is also
used for some interface purposes. Application testing for PR36 starts with the entry of time records
into the overall payroll process.

Benchmark Testing Results: Lawson System Foundation and Microsoft SQL Server 9
PR36TestingProcedure
In the benchmarking test, the HP LoadRunner load generation tool was used to simulate a number
of virtual users entering PR36 transactions at an average transaction entry rate of three minutes per
transaction by each online user through the Lawson Portal. (The “think” time for the PR36 script
was set at a random delay between 120 seconds and 240 seconds.) Each PR36 transaction added
three time records for an existing employee to the database.
The PR36 tests were run with 2,000, 4,000, and 6,000 concurrent users.
The PR36 transaction is a fairly small transaction in terms of the numbers of fields needing
completion and therefore of the overall amount of data that is transferred and processed for each
transaction.
PR36Database
The PR36 database, like the HR11 database, was built using a medium retail-client type General
Ledger company with 12,000 employees and 500 supervisors as the base dataset. (A retail-client
type of company is defined as one that has 20% exempt employees and 80% non-exempt
employees. A medium payroll profile has 20 deductions and 12 time-records per employee.) No
historical data was generated for the PR36 database.
PR36Results
Table 4 shows the total throughput in time records per hour (each transaction adds three time
records), maximum CPU utilization, and ATRT with 2,000, 4,000, and 6,000 concurrent users for the
PR36 test. Note that the reported ATRT for PR36 is the sum of the response time of several different
HTTP calls required to access the PR36 form, inquire on various fields, insert three distinct time
records for the employee, and complete the time record entry.
Table 4. PR36 results
Number of
Concurrent Users
Time Records Added
per Hour CPU Utilization
ATRT
(sec)
ATRT Ninetieth
Percentile (sec)
2,000 120,114 19.5% 0.216 0.255
4,000 239,999 33.5% 0.284 0.330
6,000 359,915 53.6% 1.078 1.737
Figure 3 shows total throughput (in time records added per hour) and the maximum CPU utilization
with 2,000, 4,000, and 6,000 concurrent users. The linear results show that there are no bottlenecks
in the system.

Benchmark Testing Results: Lawson System Foundation and Microsoft SQL Server 10
Figure 3. PR36 throughput and CPU utilization
Figure 4 shows the ATRT for the PR36 tests.
Figure 4. PR36 response time
PayrollCycleBatchTest(PRCycle) The PR cycle test is a multi-step procedure that executes the four critical batch jobs required to
complete the payroll cycle. The PR cycle test was run twice: once with 96,000 employees and once
with 288,000 employees.

Benchmark Testing Results: Lawson System Foundation and Microsoft SQL Server 11
PRCycleTestingProcedure
For this batch test, the Lawson benchmark kit was used to create data for, and to facilitate the
testing of, four Lawson Payroll (PR) critical batch processes:
• Calculate gross to net payroll (PR140)
• Print checks (PR160)
• Close payroll (PR197)
• Post to the General Ledger (PR198)
PRCycleDatabase
The PR cycle test database was built using a medium retail-client type General Ledger company. (A
retail-client type of company is defined as one that has 20% exempt employees and 80% non-
exempt employees. A medium payroll profile has 20 deductions and 12 time-records per
employee.)
For the first test, the database had 96,000 employees and 50 positions. In addition, a default of
three years of payroll historical data was created. For all transactions in this test, 48 distinct run
groups were created, each with 2,000 employees to process.
For the second test, the database had 288,000 employees and 50 positions. Again, a default of
three years of payroll historical data was created. For all transactions in this test, 144 distinct run
groups were created, each with 2,000 employees to process.
PRCycleResultsfor96,000Employees
The total time it took to complete all the run groups for each PR process was calculated. Table 5
shows the results for throughput (in employees processed per hour), maximum CPU utilization, and
total elapsed time (in hours:minutes:seconds) for a volume of 96,000 employees.

Benchmark Testing Results: Lawson System Foundation and Microsoft SQL Server 12
Table 5. PR cycle results for a 96,000 employee volume
Number of
Concurrent Batch
Jobs
Employees
Processed
per Hour
Maximum CPU
Utilization
Total Elapsed Time
(hours:minutes:seconds)
1 11,939 11.1% 8:02:27
2 23,427 11.9% 4:05:52
4 44,588 13.3% 2:09:11
8 84,354 18.2% 1:08:17
12 118,600 27.9% 0:48:34
24 197,373 45.4% 0:29:11
48 270,000 80.5% 0:21:20
Figure 5 shows total throughput (in employees processed per hour) and the maximum CPU
utilization as the number of concurrent batch jobs is increased.
Figure 5. PR cycle throughput and CPU utilization (96,000 employee volume)
Figure 6 shows the PR cycle elapsed time for a volume of 96,000 employees.

Benchmark Testing Results: Lawson System Foundation and Microsoft SQL Server 13
Figure 6. PR cycle elapsed time (96,000 employee volume)
PRCycleResultsfor288,000Employees
The total time it took to complete all the run groups for each PR process was calculated. Table 6
shows the results for throughput (in employees processed per hour), maximum CPU utilization, and
total elapsed time (in hours:minutes:seconds) for a volume of 288,000 employees.
Table 6. PR cycle results for a 288,000 employee volume
Number of
Concurrent Batch
Jobs
Employees
Processed
per Hour
Maximum CPU
Utilization
Total Elapsed Time
(hours:minutes:seconds)
24 142,144 43.7% 2:01:34
48 214,259 81.0% 1:20:39
72 241,678 100.0% 1:11:30
Figure 7 shows total throughput (in employees processed per hour) and the maximum CPU
utilization as the number of concurrent batch jobs is increased.

Benchmark Testing Results: Lawson System Foundation and Microsoft SQL Server 14
Figure 7. PR cycle throughput and CPU utilization (288,000 employee volume)
Figure 8 shows the PR cycle elapsed time for a volume of 288,000 employees.
Figure 8. PR cycle elapsed time (288,000 employee volume)
OnlineAccountsPayableBasicInvoiceForm(AP20) The AP20 form is the main data entry form used by accounts payable personnel to input and match
purchase order and non-purchase order invoices, and then create an invoice to be delivered to a
vendor.

Benchmark Testing Results: Lawson System Foundation and Microsoft SQL Server 15
AP20TestingProcedure
In the benchmarking test, the HP LoadRunner load generation tool was used to simulate a number
of virtual users entering AP20 transactions at an average transaction entry rate of three minutes per
transaction by each online user through the Lawson Portal. (The “think” time for the AP20 script
was set at a random delay between 120 seconds and 240 seconds.) AP20 added invoices and their
associated distributions.
The AP20 transaction is considered a “large” transaction in terms of the numbers of fields that need
to be completed, and therefore the overall amount of data that is transferred and processed for
each transaction is large. (AP20 is second only to the HR11 transaction in terms of size and
complexity.)
AP20Database
The AP20 database was built using a large General Ledger company and 40,000 invoices. No
historical data was generated for this database.
AP20Results
Table 7 shows the total throughput in invoice distribution lines per hour (one transaction is equal to
three invoice distribution lines), maximum CPU utilization, and ATRT with 2,000 and 4,000
concurrent users for the AP20 test. Note that the reported ATRT for AP20 is the sum of the response
time for several different HTTP calls required to navigate the AP20 form, perform inquiries on
certain fields, insert three AP distribution lines, and complete the add function.
Table 7. AP20 results
Number of
Concurrent Users
Distribution Lines
per Hour CPU Utilization
ATRT
(sec)
ATRT Ninetieth
Percentile (sec)
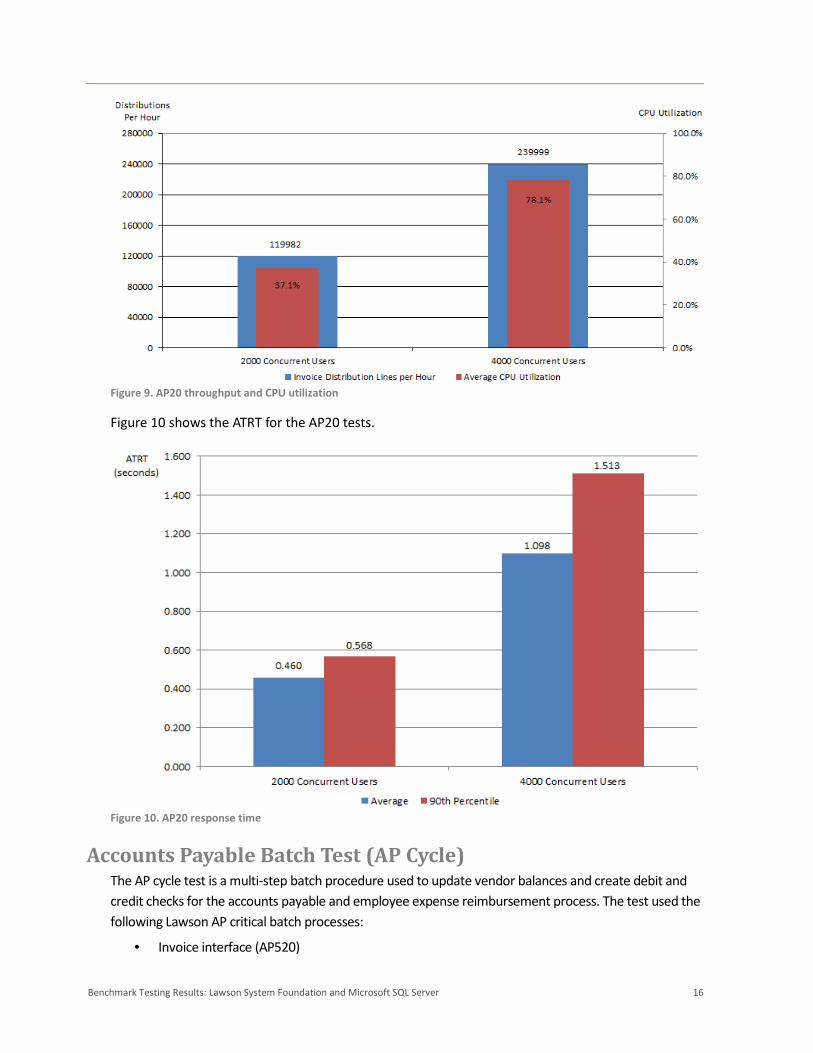
2,000 119,982 37.1% 0.460 0.568
4,000 239,999 78.1% 1.098 1.153
Figure 9 shows total throughput (in invoice distribution lines per hour) and maximum CPU utilization with
2,000 and 4,000 concurrent users.
Benchmark Testing Results: Lawson System Foundation and Microsoft SQL Server 16
Figure 9. AP20 throughput and CPU utilization
Figure 10 shows the ATRT for the AP20 tests.
Figure 10. AP20 response time
AccountsPayableBatchTest(APCycle) The AP cycle test is a multi-step batch procedure used to update vendor balances and create debit and
credit checks for the accounts payable and employee expense reimbursement process. The test used the
following Lawson AP critical batch processes:
• Invoice interface (AP520)

Benchmark Testing Results: Lawson System Foundation and Microsoft SQL Server 17
• Expense invoice release (AP125)
• Cash requirements (AP150)
• Payment forms creation (AP155)
• Check register (AP265)
• Payment closing (AP170)
• Invoice distribution closing (AP175)
• Period close (AP195)
APCycleDatabase
The AP cycle database was created with a large General Ledger company and 120,000 invoices, plus
a default of 600,000 historical invoices for accounts payable history. For all transactions except
period close (AP195), 12 distinct run groups, or jobs, were created each with 10,000 invoices to
process. For AP195, there was only one distinct run group.
APCycleResults
The total time it took to complete all the run groups for each AP process was calculated. Table 8
shows the results for throughput (in invoices processed per hour), maximum CPU utilization, and
total elapsed time (in hours:minutes:seconds).
Table 8. AP cycle results
Number of
Concurrent Batch
Jobs
Invoices Processed
per Hour
Maximum CPU
Utilization
Total Elapsed Time
(hours:minutes:seconds)
1 93,933 8.6% 1:16:39
2 181,818 9.3% 0:39:36
6 521,110 14.8% 0:13:49
12 927,039 32.8% 0:07:46
Figure 11 shows total throughput (in invoiced processed per hour) and the maximum CPU
utilization as the number of concurrent batch jobs is increased.

Benchmark Testing Results: Lawson System Foundation and Microsoft SQL Server 18
Figure 11. AP cycle throughput and CPU utilization
Figure 12 shows the elapsed time for the AP Cycle batch test.
Figure 12. AP cycle elapsed time
OnlineFinanceDepartmentJournalTransactionForm(GL40) The GL40 form is the main data entry point for inputting transactions or maintaining system
generated transactions that post to the general ledger.

Benchmark Testing Results: Lawson System Foundation and Microsoft SQL Server 19
GL40TestingProcedure
The GL40 test executes basic journal entry transactions. In the benchmarking test, the HP
LoadRunner load generation tool was used to simulate a number of virtual users entering GL40
transactions at an average transaction entry rate of three minutes per transaction by each online
user through the Lawson portal. The “think” time for the GL40 script was set at a random delay
between 120 seconds and 240 seconds. Each completed GL40 transaction added four journal
entries to the database.
GL40Database
The GL40 database was built using a medium General Ledger company and 16,000 journal entries.
No historical data was generated for this database.
GL40Results
Table 9 shows the total throughput in General Ledger journal entries per hour (one transaction is
equal to four journal entries), maximum CPU utilization, and ATRT with 2,000 and 4,000 concurrent
users for the GL40 test. Note that the reported ATRT for GL40 is the sum of the response time for
several different HTTP calls required to navigate the GL40 form, perform inquiries on certain fields,
insert four detailed journal entries, and complete the add function.
Table 9. GL40 results
Number of
Concurrent Users
Journal Entries
per Hour CPU Utilization
ATRT
(sec)
ATRT Ninetieth
Percentile (sec)
2,000 159.944 30.3% 0.347 0.419
4,000 319,890 56.4% 0.516 0.666
Figure 13 shows the total throughput (in General Ledger journal entries per hour) and the maximum CPU
utilization with 2,000 and 4,000 concurrent users.

Benchmark Testing Results: Lawson System Foundation and Microsoft SQL Server 20
Figure 13. GL40 throughout and CPU utilization
The GL40 transaction is considered a medium transaction in terms of the number of fields that need
to be completed and therefore the overall amount of data that is transferred and processed for
each transaction as well.
Figure 14 shows the ATRT for the GL40 tests.
Figure 14. GL40 response time

Benchmark Testing Results: Lawson System Foundation and Microsoft SQL Server 21
GeneralLedgerBatchTest(GLBatch) The General Ledger batch test (GL Batch) is made up of the actual procedures executed by multi-
batch programs to reconcile period close procedures. These procedures are performed periodically,
monthly, quarterly, and annually.
To execute the test, the benchmark kit submitted all run groups for each of three GL tests:
• Interface journal entries (GL165)
• Journal posting (GL190)
• Period closing (GL199)
GLBatchTestDataset
The database was created with an extra-large General Leger company and 256,000 journal entries
plus a default of 6 months of general ledger history. The number of run groups varied:
• GL165: 64 distinct run groups, or jobs, each with 4,000 journal entries
• GL190: 4 distinct run groups
• GL199: 1 run group
GLBatchTestResults
The total time it took to complete all the run groups for each GL process was calculated. Table 10
shows the results for throughput (in transactions processed per hour) and total elapsed time (in
hours:minutes:seconds).
Table 10. GL Batch results for a 256,000 journal volume
Number of
Concurrent Batch Jobs
Transactions
Processed
per Hour
Total Elapsed Time
(hours:minutes:seconds)
1 2,080,361 0:07:23
2 4,077,876 0:03:46
8 13,356,522 0:01:09
16 20,480,000 0:00:45
Figure 15 shows the throughput (in transactions processed per hour) as the number of concurrent
batch jobs is increased.

Benchmark Testing Results: Lawson System Foundation and Microsoft SQL Server 22
Figure 15. GL Batch throughput
With the GL Batch tests, fully linear scaling for the entire test is not possible for more than four
concurrent batch jobs because there are only four GL190 jobs to process (although there is only one
GL199 to process, the GL199 run time is typically only 2–3 seconds). However, the test clearly shows
that the transaction throughput continues to increase as the number of concurrent batch jobs is
increased.
CPU utilization statistics were not captured for the GL Batch runs. Because of the very short-lived
nature of the GL tests, the limited number of 15-second interval performance monitor (perfmon)
data captured was not meaningful.
Figure 17 shows the elapsed time for the GL batch test.

Benchmark Testing Results: Lawson System Foundation and Microsoft SQL Server 23
Figure 16. GL Batch elapsed time
Conclusion Lawson and Microsoft worked together to test Lawson applications using LSF 9.0.1 on SQL Server
2008 R2 Enterprise and Windows Server 2008 R2 Enterprise. The tests demonstrated the overall
scalability as the workload increased and proved that the Windows Server and SQL Server platform
is a viable solution for tier-1 Lawson customer implementations.
Highlights of the benchmark testing include:
• The overall system was able to provide significant scalability.
o The maximum sustained number of concurrent users tested was 6,000 for the
online payroll record processing (PR36) test.
o The maximum number of concurrent batch jobs tested was 72 jobs for the payroll
cycle batch (PR Cycle) test with a volume of 288,000 employees.
• LSF and the other components in the technology stack were able to take full advantage of
the 32 cores.
• SQL Server was not the limiting factor in any of the tests.
• Vertical scaling was used to achieve the high user-count tests, with five application server
nodes used for the PR36 test at 6,000 users.
• Neither physical memory saturation nor excessive paging was observed.

Benchmark Testing Results: Lawson System Foundation and Microsoft SQL Server 24
AdditionalInformation The following references provide more information about Lawson and Microsoft.
AboutLawson Lawson Software is an Infor affiliate with more than 4,500 customers worldwide, primarily in
specific services, trade and manufacturing/distribution industries.
For more information, visit: www.lawson.com
AboutMicrosoft Microsoft is motivated and inspired by how our customers use our software to find creative
solutions to business problems, develop breakthrough ideas, and stay connected to what's most
important to them. Microsoft believes their five business divisions―Windows & Windows Live,
Server and Tools, Online Services, Microsoft Business, and Entertainment and Devices―offer the
greatest potential to serve customers.
For more information, visit: www.microsoft.com