benchmark study - SIGsig.org/docs2/Zycus_-_P2P_Benchmark_Study.pdf · We are delighted to introduce...
32
benchmark study
Transcript of benchmark study - SIGsig.org/docs2/Zycus_-_P2P_Benchmark_Study.pdf · We are delighted to introduce...

benchmark study

Greetings from Zycus! We are delighted to introduce our first ever Zycus P2P Benchmark study in which we document dozens of key performance indicators relating to corporate processes and technologies for managing indirect spending. More than 450 procurement organizations worldwide
participated in the study. Rather than segmenting procurement teams into performance classes — as many other benchmarking studies attempt to do — our objective was to paint a complete and realistic global landscape of where procurement organizations stand on a broad array of indirect spending and procure-to-pay (P2P) process performance metrics. Our primary intent with this research is to provide procurement leaders with an understanding of where their organizations fit competitively, where they may wish to focus more and how they might progress on metrics that are most relevant to their organizational objectives. The study results paint a sobering — yet hopeful — view of procurement's progress in documenting, categorizing, analyzing, influencing, controlling and ultimately reducing corporate indirect spending. Some key findings:
n On average worldwide, some 60% of corporate indirect spending is now being addressed by some type of controlled P2P workstream (RFQ/PO/invoice VS. invoice only). One in four companies report that some 80%-100% of indirect spending now flows through a controlled P2P workstream. This builds a strong foundation for systematically capturing the data needed to fuel advanced analytics, which, in turn enable strategic procurement teams to evaluate markets and supplier proposals strategically, decide where and how to award business and negotiate competitive commercial terms and service-level agreements (SLAs) with suppliers of indirect goods and services.
n Despite relatively strong rates of indirect spend now flowing through controlled P2P workstreams, many companies still appear to be struggling with the transition from better transaction documentation to consistently generating actionable analytics for procurement. The study finds, for example, that only 45% of total indirect spend, on average, is currently being classified to a sufficient level of detail to enable spend analytics that procurement professionals would classify as 'actionable', meaning theyb believe that they could reliably deploy the intelligence within decision making processes, in negotiations with suppliers, in budgeting, forecasting activities and so forth. At the same time, one-third of companies report being above the average (either 61-80% or 81-100%) on this metric, indicating that there are tools in the marketplace today that can generate fully actionable analytics for indirect spending categories.
n Even when they do have actionable analytics for indirect spending, enterprise procurement organizations appear to be still challenged with other obstacles (for example, lack of resources, expertise, technology systems, corporate politics, etc) to placing more indirect spending categories under management by procurement. On average, study participants estimate that only 40% of total indirect spending is currently considered addressable by procurement, while nearly one-third estimate the figure much lower in the 0-20% range. Nonetheless, one in four procurement organizations place themselves into the top two performance tiers (61-80% or 81-100%), signifying that, with perseverance, such obstacles can be overcome.
n Even when procurement is addressing or directly managing indirect spend categories, there are still other challenges to overcome as various
EXECUTIVE SUMMARY
Page 2 | © 2014 Zycus Inc. All rights reserved

0%
20%
40%
60%
80%
100%
>3 bil 100 milto 3 bil
<100mil
N/A orprivate
30%35%
23%
12%
0%
20%
40%
60%
80%
100%
0-100mil
100-500mil
500mil to1 bil
>1bil N/A
37%
21%12%
18%12%
0%
20%
40%
60%
80%
100%
CPOVP
Exec
Dir Mgr PA orbuyer
Admin
12%
27%
41%
16%
4%
By annual revenue By annual indirect spend By job title
© 2014 Zycus Inc. All rights reserved | Page 3
compliance metrics documented in the Zycus P2P Benchmark study for indirect spending attest. On average, for example, only 40% of addressable indirect spending is currently under contract with preferred providers. And, where preferred providers are in place, only roughly half of indirect spending is considered compliant for contract and/or P2P process utilization or for consistent realization of negotiated prices, volume discounts, rebates and so forth, according to study.
n While P2P process control and automation technology has been around for quite some time — since the middle to late 1990s — the study also finds surprisingly little progress, to date, on key performance metrics that one might have expected to advance more substantially — for example in PO and invoice processing costs, P2P process cycle times and so forth. This may reflect known weaknesses in first-generation P2P solutions as well as implementation and adoption challenges, which companies are beginning to address by upgrading to next-generation P2P solutions. Next-generation P2P solutions are typically more consumer-like, more flexible in terms of workflow and less reliant on things such as e-catalogs, which introduce their own sets of challenges, bottlenecks and costs and are not particularly amendable to handling complex indirect spending categories.
We hope you find the report instructive and useful for informing your own P2P process-improvement journey going forward.
Sincerely,The Zycus Team
Here is a breakout of who is represented in the study results:

CONTENTSIndirect spend KPIs ............................................................................................ 6-12Indirect spend: flowing through controlled procurement workstreams, with granular/detailed visibility, addressable by procurement, under contract, using compliant processes, compliant for pricing, earning all discounts, rebates, etc.
P2P technology landscape ................................................................................14-18Manual versus technology-enabled P2P, indirect spend addressed by P2P technology, on/off catalog and
contract splits and invoice-to-PO matching in P2P solutions
P2P financial controls .......................................................................................20-23Purchase orders: accurate on first pass, matched to invoices on first pass, properly classified to spend taxonomy, properly coded for general ledger, properly approved; supplier invoices received electronically, costs to issue POs and invoices
P2P cycle times .................................................................................................25-27Cycle times for: supplier onboarding, requisition to order, invoice to payment
P2P technology adoption & use ....................................................................... 29-31End user adoption of P2P technology, end user P2P solution ratings, best tactics for boosting P2P solution adoption
Page 4 | © 2014 Zycus Inc. All rights reserved

© 2014 Zycus Inc. All rights reserved | Page 5
Indirect Spend KPIs

Page 6 | © 2014 Zycus Inc. All rights reserved
0%
25%
50%
75%
100%
0-20% 81-100%41-60% 61-80%21-40%
10% 15% 19%30% 26%
ID spend via procurement workstreamsLocking down corporate spending into controlled and analyzable workstreams is a critical early step in gaining consistent, accurate spend visibility
that can support high-performance enterprise strategic sourcing and spend management. The Zycus P2P Benchmark for indirect spending finds some 56% of enterprise procurement teams worldwide controlling 61% or more of indirect spending through requisition-PO-invoice workstreams, while the baseline weighted average for all companies in the sample is 60%. Other measurable workstreams include procurement-cards (P-Cards) and/or travel & expense (T&E) cards. According to the study, most corporations use one or the other of these card methods to control an additional 17-18% of indirect spending, leaving roughly 22-23% of total indirect spending covered by invoices alone.
WHAT TO DO if wanting to move on this metric:
n Pursue and issue corporate policies mandating that specified workstreams be used in order for suppliers to be paid.n Classify and segment spend categories into specific workstreams; then partner with finance and accounts payable to devise explicit response
and escalation protocols for addressing all parties — buyers and suppliers — to transactions taking place outside of specified workstreams. For example, pay first instance with warning, pay second instance with disciplinary action or note in personnel file, decline to pay third instance and any transactions thereafter.
n Conduct comprehensive communications campaigns to roll out and periodically reinforce these policies.n Track and report spend-process compliance at appropriate management levels.
Percent of indirect spend addressed by a controlled RFQ/PO/invoice workstream. Weighted avg: 60%
Page 6 | © 2014 Zycus Inc. All rights reserved

© 2014 Zycus Inc. All rights reserved | Page 7
Indirect spend w/detailed spend visibilityIt becomes increasingly difficult to achieve market and strategic sourcing wins over time without continuous improvement in the accuracy and
granularity of spend intelligence. Ideal P2P systems should obviate the need for after-the-fact spend-classification solutions. Rather than classifying transactions weeks or even months after they have occurred, spend should be classified accurately and thoroughly at the moment of transaction execution. What is more, this should happen without unduly burdening users or providing opportunities to misclassify due to time constraint, lack of knowledge or simple laziness. Theoretically, a P2P system with high spend coverage and accurate/detailed classification at point of order should enable virtually real-time visibility into spending and also be capable of actively preventing (or at least alerting to) budget line-item overruns. It should also automate compliance in terms of items, suppliers, prices and more. The ideal P2P system would also provide procurement with predictive intelligence to be utilized in strategy, planning, negotiation and demand management.
WHAT TO DO if wanting to move on this metric:
n If not locked into a particular P2P technology solution (if planning to invest or upgrade), be sure to make automated transaction classification capabilities a key element of your market due diligence. State-of-the-art P2P solutions are already capable of automatically — or at least semiautomatically — analyzing and classifying transactions using users' free-word item search terms.
0%
25%
50%
75%
100%
0-20% 81-100%41-60% 61-80%21-40%
24% 22% 22% 24%8%
Percent of indirect spend classified to a sufficient level of detail for strategic sourcing. Weighted avg: 45%

Page 8 | © 2014 Zycus Inc. All rights reserved
ID spend addressable by procurementAsked to estimate the percentage of total corporate indirect spending that enterprise procurement has in its sights for strategic sourcing and spend
management, procurement pros worldwide provide surprisingly low numbers, with some 54% suggesting that procurement currently intends to address less than 40% of total indirect spending, which is also the weighted average response for this KPI. As documented on page 7, poor visibility into indirect spending is one challenge. Other barriers typically causing CPOs to designate indirect spend categories as unaddressable include: perceived complexity, political sensitivity and/or power imbalances, market cost/price opacity, limited supply base, excessive bundling and/or industry price and sales models that do not easily lend themselves to structured competitive sourcing. Nonetheless, the study does find a small vanguard — some 5% to 25% of procurement teams — moving much more aggressively to influence corporate indirect spending.
WHAT TO DO if wanting to move on this metric:
n Even for categories that seem impossible to address at present, continue to work toward improving spend visibility, analytics and reporting to lay groundwork for future business cases; use eRFx and other efficient supplier information management tools to support in-depth market scans that identify game-changing new entrants and disruptive forces that might be leveraged to generate cost savings, improved service levels and so forth.
n Network and benchmark with procurement teams in other companies to understand which indirect categories — and which specific suppliers — they have succeeded in moving toward more structured competitive sourcing and spend management disciplines; prioritize to leverage work already done by trailblazers in such indirect spending categories as telecommunications hardware and services, contingent workforce, advertising, marketing and communications services, legal services, human resources and so forth.
0%
25%
50%
75%
100%
0-20% 81-100%41-60% 61-80%21-40%
31%23% 21% 20%
5%
Percent of indirect spend considered addressable by enterprise procurement. Weighted avg: 40%
Page 8 | © 2014 Zycus Inc. All rights reserved
© 2014 Zycus Inc. All rights reserved | Page 9
0%
25%
50%
75%
100%
0-20% 81-100%41-60% 61-80%21-40%
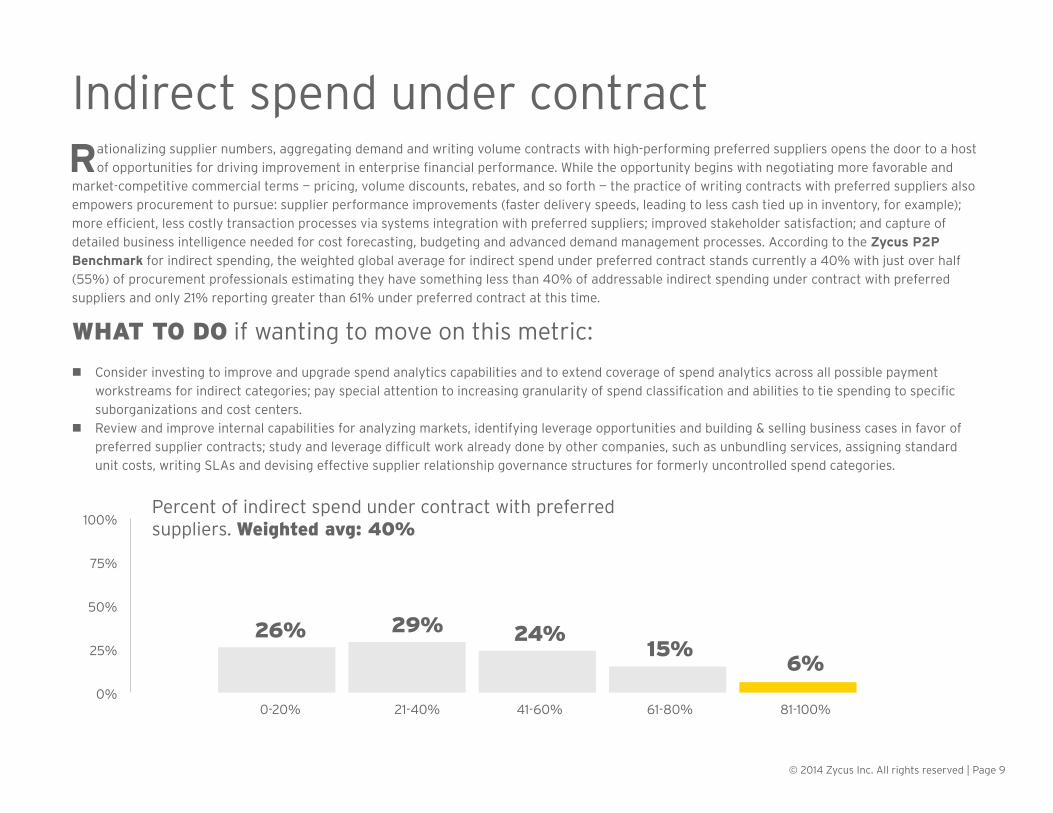
26% 29% 24%15%
6%
Indirect spend under contractRationalizing supplier numbers, aggregating demand and writing volume contracts with high-performing preferred suppliers opens the door to a host
of opportunities for driving improvement in enterprise financial performance. While the opportunity begins with negotiating more favorable and market-competitive commercial terms — pricing, volume discounts, rebates, and so forth — the practice of writing contracts with preferred suppliers also empowers procurement to pursue: supplier performance improvements (faster delivery speeds, leading to less cash tied up in inventory, for example); more efficient, less costly transaction processes via systems integration with preferred suppliers; improved stakeholder satisfaction; and capture of detailed business intelligence needed for cost forecasting, budgeting and advanced demand management processes. According to the Zycus P2P Benchmark for indirect spending, the weighted global average for indirect spend under preferred contract stands currently a 40% with just over half (55%) of procurement professionals estimating they have something less than 40% of addressable indirect spending under contract with preferred suppliers and only 21% reporting greater than 61% under preferred contract at this time.
WHAT TO DO if wanting to move on this metric:
n Consider investing to improve and upgrade spend analytics capabilities and to extend coverage of spend analytics across all possible payment workstreams for indirect categories; pay special attention to increasing granularity of spend classification and abilities to tie spending to specific suborganizations and cost centers.
n Review and improve internal capabilities for analyzing markets, identifying leverage opportunities and building & selling business cases in favor of preferred supplier contracts; study and leverage difficult work already done by other companies, such as unbundling services, assigning standard unit costs, writing SLAs and devising effective supplier relationship governance structures for formerly uncontrolled spend categories.
Percent of indirect spend under contract with preferred suppliers. Weighted avg: 40%

Page 10 | © 2014 Zycus Inc. All rights reserved
Indirect spend using compliant processes
0%
25%
50%
75%
100%
0-20% 81-100%41-60% 61-80%21-40%
26% 23%16% 21%
14%
Percent of indirect spend flowing through compliant P2P processes Weighted avg: 45%
Zycus' annual Pulse of Procurement 2014 study (conducted earlier this year) found that a Top 3 pain point for procurement teams worldwide is winning and maintaining compliance to preferred P2P processes, so the fact that nearly half of procurement organizations fall into the bottom
two tiers on this KPI comes as little surprise. Weak policy governance is the issue for some; for others, it is either an inability to track and/or compel compliance or an unwillingness of procurement and other business leaders to enforce policies that do exist. Even with detailed spend policies, procedures and systems in place, maverick spenders often rely on either zero or slap-on-the-wrist types of enforcement to circumvent established P2P workflows. Presence of P2P automation technology does, however, appear to have quite a positive effect on process compliance, especially when it represents the easiest way to buy or spend.
WHAT TO DO if wanting to move on this metric:
n Time and again, various Zycus studies have shown that policies alone are typically insufficient for winning strong compliance to preferred procurement processes, strategic suppliers and contracts. Routine compliance measurement and open reporting of results to all relevant business leaders (SBU leadership, budget owners and so forth) is consistently the number-one favored tactic among procurement organizations achieving best-in-class compliance results.
n Other top tactics for moving the meter on compliance is to increase investments in training; develop and actively communicate and sell business cases for compliance and ensure that preferred P2P processes are, by far, the easiest and fastest to execute.
Page 10 | © 2014 Zycus Inc. All rights reserved

© 2014 Zycus Inc. All rights reserved | Page 11
Indirect spend compliant for pricingVery often, companies that upgrade their analytics capabilities for indirect spending will rapidly and inevitably begin to discover many instances
where various divisions, locations or departments are paying dramatically different prices to the same suppliers for the same items or services — even when enterprise contracts are in place. The phenomenon can usually be tied to systemic inefficiencies on both the buyer and supplier sides of transactions. At the root is typically unawareness that negotiated contract prices exist. The Zycus P2P Benchmark Study finds that some 50% of indirect spending may be noncompliant with established or contracted supplier pricing, creating a significant source of savings leakage.
WHAT TO DO if wanting to move on this metric:
n Consider transitioning to a P2P system that takes an active role in guiding requisitioners first to preferred suppliers and then to best-cost standard choices within suppliers' product or service lines. An important prerequisite for achieving this is that the system be capable of accurately recognizing — based on free-text search — what a requisitioner is attempting to obtain and of employing a robust workflow to engage the correct procurement personnel very early in processes when needs can not be immediately recognized and/or matched by the P2P system.
0%
25%
50%
75%
100%
0-20% 81-100%41-60% 61-80%21-40%
16% 23% 25%23% 13%
Percent of indirect spend compliant in terms of contracted rates/prices Weighted avg: 50%

Page 12 | © 2014 Zycus Inc. All rights reserved
ID spend earning all discounts & rebatesAnother big source of procurement savings leakage is negotiated discounts and rebates that go unrealized due to weak vigilance in post-contracting
phases of strategic supply agreements. Some 70% of companies participating in the Zycus P2P Benchmark report achieving something less than 60% compliance in terms of actually booking all potential volume or early-payment discounts and rebates negotiated and contracted for by procurement. According to research by The Hackett Group, the world-class performance level for percent of early payment discounts taken is just shy of 80%. With that measure as a guide, only 10% of our study population might be considered best-in-class on this metric.
WHAT TO DO if wanting to move on this metric:
n Information integration is the key to improvement here. Integration enables more accurate tracking of compliant spending as well as creation of alerts and/or workflow triggers when various contract conditions such as purchase volumes are met. Meantime, automated matching of requisitions, POs and invoices enables greater promptness in supplier payments, allowing for more consistent realization of early payment and similar types of discounts.
0%
25%
50%
75%
100%
0-20% 81-100%41-60% 61-80%21-40%
22% 25% 23% 20%10%
Percent of indirect spend that is compliant in terms of earning all discounts & rebates. Weighted avg: 45%
Page 12 | © 2014 Zycus Inc. All rights reserved

© 2014 Zycus Inc. All rights reserved | Page 13
P2P Technology Landscape

Page 14 | © 2014 Zycus Inc. All rights reserved
Global P2P process breakout for indirect
The Zycus P2P Benchmark finds some 71% of procurement organizations claiming some form of
technology enablement and process automation for indirect spending with:
n 40% relying on procurement modules offered by their ERP providers,
n 7% having developed custom P2P solutions in house, andn 24% having invested in applications built from the
ground up and engineered specifically for procurement (versus financial or operations perspectives). For sake of simplicity, we shall refer to this group as 'organic P2P solutions' throughout our report.
Within the organic P2P solutions group, some 43% have deployed standalone solutions, while 57% have deployed P2P as part of an integrated procurement technology suite, which may also include spend analysis, e-sourcing, contract management, supplier information and performance management and so forth.
0% 10% 20% 30% 40%
24%
40%
7%
24%
5%
OrganicP2P sol’ns
ERP modules
Homegrownsol’ns
Manualprocesses
Other
Page 14 | © 2014 Zycus Inc. All rights reserved

© 2014 Zycus Inc. All rights reserved | Page 15
ID spend addressed by P2P technologyA certain subset of study questions was addressed only to companies already utilizing some form
of P2P automation technology for indirect spending. On average, procurement professionals believe that some 57% of total indirect spending might be addressed using their current P2P technology, while only 40% of indirect spending is actually being addressed in P2P solutions at present.
The large gap speaks to persistent difficulties in first-generation P2P technologies with driving to reasonable speed and efficiency in managing supplier catalogs and coping with substantial differences among various types of indirect spending. For example, automating requisitions, approvals and payments for contingent workers presents a very different set of challenges compared to office or MRO supplies. Of note, however, is that companies that have implemented P2P technology as part of larger integrated procurement suite deployments score substantially higher on this metric, addressing some 55% of indirect spending, on average, within their P2P systems. This suggests that integration capabilities should be a key selection criteria for companies that are either investing in P2P for the first time or considering upgrades to next-generation P2P solutions.
0%
25%
50%
75%
100%
0-20% 81-100%41-60% 61-80%21-40%
22% 17%30%
18% 13%
Percent of indirect spending considered capable of being addressed by P2P technology. Weighted avg: 57%
57%Capable of
being addressed
40%vs. being
addressed now

Page 16 | © 2014 Zycus Inc. All rights reserved
On/off catalog splits in P2P solutionsEarly incarnations of P2P technology were predicated mainly on the idea of using e-catalogs and
other e-commerce technology, such as shopping carts, to simulate consumer online shopping experiences while simultaneously ensuring strict backend compliance in terms of supplier, item and services selections, negotiated contract pricing and terms. Anticipated efficiency savings, however, were often gobbled up by higher-than-expected costs associated with creating and managing suppliers' e-catalogs. Or companies failed to achieve the critical mass of e-catalogs needed to encourage sufficient adoption, institutional learning and routine use of their P2P technology. While solutions have cropped up to automate and make e-catalog creation and management processes more efficient, the Zycus P2P Benchmark still finds widely varying degrees of progress toward more extensive use of e-catalogs within P2P systems. Overall, the average ratio of on- to off-catalog transactions stands right around 50:50. This belies, however, a broad distribution in the underlying detail as shown below.
WHAT TO DO if wanting to move on this metric:
n The concept of Guided Procurement Systems (GPS) has evolved as an alternative to focusing resources and effort on making e-catalog processes faster and more efficient. As long as non-catalog transactions can be captured and managed just as effectively as catalog transactions, there may no longer be a need to invest heavily in improving e-catalog creation and management processes.
0%
25%
50%
75%
100%
10/90 40/60 50/5020/80
7% 13% 7% 9% 6%
30/70 80/20 90/1060/40 70/30
17%9% 14% 11%
Less
7%
52%Requisitionson catalog
48%vs. off catalog
On- to off-catalog percentage splits for requisitions flowing through P2P technology solutions
Page 16 | © 2014 Zycus Inc. All rights reserved

© 2014 Zycus Inc. All rights reserved | Page 17
On/off contract splits in P2P solutionsFor P2P solutions to gain widespread adoption and use, they need to be capable of handling any
type of buy transaction that might arise within a corporate organization. However, enabling off-catalog and off-contract buys opens opportunities for maverick spending to slip under the radar of the company's trained and experienced sourcing professionals and negotiators. The Zycus P2P Benchmark study finds that, on average, 59% of transactions processed through P2P solutions are on contract versus 41% off. The averages, however, mask a surprisingly broad distribution (shown below) in actual on- to off-contract transaction ratios. By this view, some 47% of companies stand above the baseline split with one third reporting 80% or more of transactions being on-contract.
WHAT TO DO if wanting to move on this metric:
n One approach would be to focus on increasing the number of preferred supplier contracts represented in the P2P system. The other perhaps more realistic and cost effective solution is to more assiduously guide requisitioners through off-catalog buys. This can be accomplished using state-of-the-art Guided Procurement Systems (GPS) technology, which correctly interprets and classifies requisitioners' needs from point of first item search, dramatically improving chances of guiding a requisitioner to purchase from a preferred contract supplier (even when e-catalogs are not feasible) or of promptly escalating requirements needing intervention by trained procurement professionals.
0%
25%
50%
75%
100%
10/90 40/60 50/5020/80
4%12% 6% 12%
3%30/70 80/20 90/1060/40 70/30
16% 11%24%
12%
Less
0%
59%Requisitionson contract
41%vs. off
contract
On- to off-contract percentage splits for requisitions flowing through P2P technology solutions
Page 18 | © 2014 Zycus Inc. All rights reserved
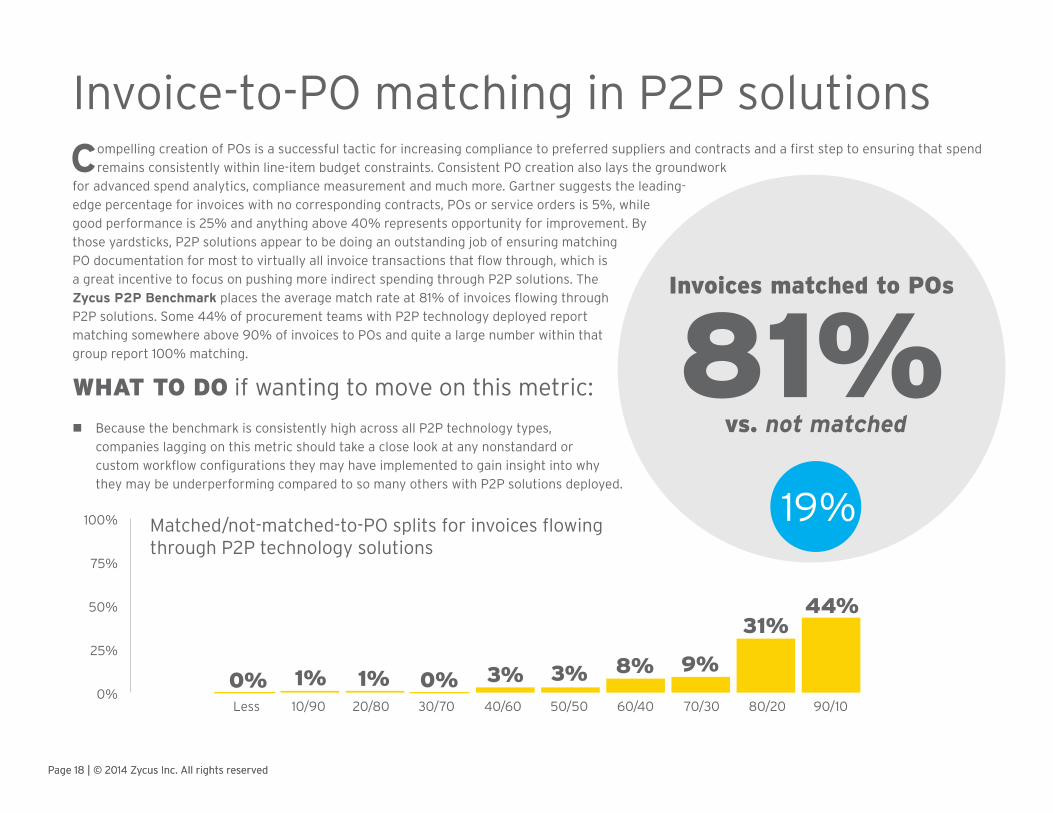
Invoice-to-PO matching in P2P solutionsCompelling creation of POs is a successful tactic for increasing compliance to preferred suppliers and contracts and a first step to ensuring that spend
remains consistently within line-item budget constraints. Consistent PO creation also lays the groundwork for advanced spend analytics, compliance measurement and much more. Gartner suggests the leading-edge percentage for invoices with no corresponding contracts, POs or service orders is 5%, while good performance is 25% and anything above 40% represents opportunity for improvement. By those yardsticks, P2P solutions appear to be doing an outstanding job of ensuring matching PO documentation for most to virtually all invoice transactions that flow through, which is a great incentive to focus on pushing more indirect spending through P2P solutions. The Zycus P2P Benchmark places the average match rate at 81% of invoices flowing through P2P solutions. Some 44% of procurement teams with P2P technology deployed report matching somewhere above 90% of invoices to POs and quite a large number within that group report 100% matching.
WHAT TO DO if wanting to move on this metric:
n Because the benchmark is consistently high across all P2P technology types, companies lagging on this metric should take a close look at any nonstandard or custom workflow configurations they may have implemented to gain insight into why they may be underperforming compared to so many others with P2P solutions deployed.
0%
25%
50%
75%
100%
10/90 40/60 50/5020/80
1% 1% 0% 3% 3%30/70 80/20 90/1060/40 70/30
8% 9%
31%44%
Less
0%
81%Invoices matched to POs
19%
vs. not matched
Matched/not-matched-to-PO splits for invoices flowing through P2P technology solutions
Page 18 | © 2014 Zycus Inc. All rights reserved

© 2014 Zycus Inc. All rights reserved | Page 19
P2P Financial Controls
Page 20 | © 2014 Zycus Inc. All rights reserved
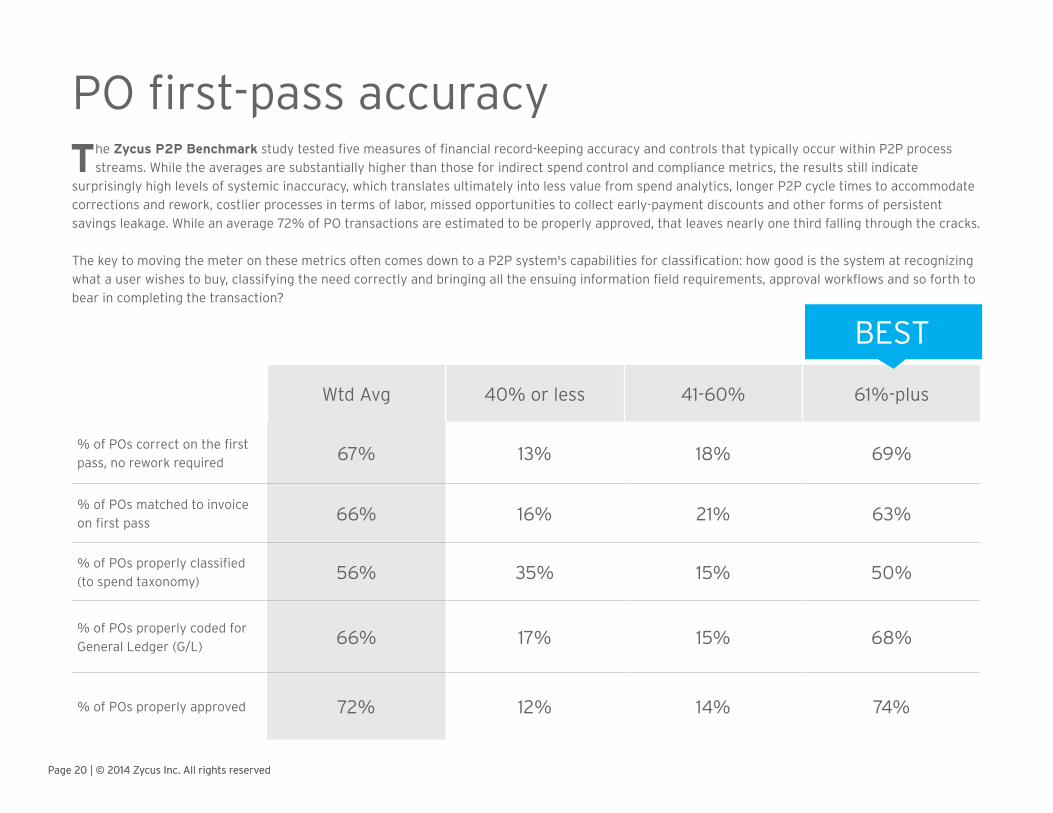
PO first-pass accuracyThe Zycus P2P Benchmark study tested five measures of financial record-keeping accuracy and controls that typically occur within P2P process
streams. While the averages are substantially higher than those for indirect spend control and compliance metrics, the results still indicate surprisingly high levels of systemic inaccuracy, which translates ultimately into less value from spend analytics, longer P2P cycle times to accommodate corrections and rework, costlier processes in terms of labor, missed opportunities to collect early-payment discounts and other forms of persistent savings leakage. While an average 72% of PO transactions are estimated to be properly approved, that leaves nearly one third falling through the cracks.
The key to moving the meter on these metrics often comes down to a P2P system's capabilities for classification: how good is the system at recognizing what a user wishes to buy, classifying the need correctly and bringing all the ensuing information field requirements, approval workflows and so forth to bear in completing the transaction?
Wtd Avg 40% or less 41-60% 61%-plus
% of POs correct on the first pass, no rework required 67% 13% 18% 69%
% of POs matched to invoice on first pass 66% 16% 21% 63%
% of POs properly classified (to spend taxonomy) 56% 35% 15% 50%
% of POs properly coded for General Ledger (G/L) 66% 17% 15% 68%
% of POs properly approved 72% 12% 14% 74%
Page 20 | © 2014 Zycus Inc. All rights reserved
BEST

© 2014 Zycus Inc. All rights reserved | Page 21
Supplier invoices received electronicallyReceiving invoices electronically from suppliers should, at least theoretically, reduce invoice processing
costs and accelerate invoice-to-payment cycle times when three-way matching of requisitions, purchase orders and invoices can be accomplished automatically. With that said, only one-third of companies participating in the Zycus P2P Benchmark and also employing P2P automation technology appear to be making digital invoice receipt a major priority.
WHAT TO DO if wanting to move on this metric:
n First, recognize that, unless you are an 800-lb gorilla in the marketplace that everyone wants to supply, you probably will not succeed with mandating just one way in which suppliers can submit invoices for payment, especially if your selection carries fees or other additional costs for suppliers. Prepare to accommodate a full range of options from the very smallest mom & pop suppliers all the way up to the most massive of global corporations.
n Consider offering savings-sharing incentives for digital invoice submission such as shorter standard payment terms and digital payment options that also help to cut suppliers' processing costs.
47%
0%
25%
50%
75%
100%
0-20% 81-100%41-60% 61-80%21-40%
22% 17%30%
18% 13%
Percent of invoices considered to be received electronically from suppliers (cXML, EDI, etc). Weighted avg: 47%
© 2014 Zycus Inc. All rights reserved | Page 21

Page 22 | © 2014 Zycus Inc. All rights reserved
0%
20%
40%
60%
80%
100%
0-5 20-2510-15 15-205-10
12%16%
8% 9%
33%
25-30 30+
10% 12%
There was a time in the distant past when cost to issue a purchase order was the premier performance metric for procurement. That was back when procurement was still seen primarily as overhead — pushing paperwork and essentially rubber stamping procurement decisions made in engineering,
operations, sales, marketing and so forth. While the metric has long been supplanted by more strategic measures of procurement performance and value contribution — such as total cost of ownership, supplier performance, time-to-market, supply-chain ramp speeds on new product introductions and so forth — it is still important to ensure that procurement efficiency remains in check.
Because our study was global, we asked participants to express costs in whatever unit of currency would apply to them. As such, the charts on this page and next, which express overall global results, should be interpreted with caution. However, as the vast majority of study participants are located in advanced, industrialized economies (the U.S., Canada, Western Europe, Australia/New Zealand and so forth), isolating for various regions and countries produces remarkably little variation in the results. U.S./Canada shows virtually no variation from the overall global average for cost to issue a PO; Europe averages slightly lower at 18.7, while Australia/New Zealand comes in somewhat higher at 24-25.
Costs to issue POs and pay invoices
19.7Average cost to
write a PO
Page 22 | © 2014 Zycus Inc. All rights reserved

© 2014 Zycus Inc. All rights reserved | Page 23
Both PO and invoice processing cost levels indicated in the Zycus P2P Benchmark seem alarmingly high compared to performance benchmarks suggested by other sources. Gartner, for example, suggests that $1 to process an invoice is leading edge, $3 is good — and anything $6 or above should be considered room for improvement. By the same token, the data show great improvement when compared to the $50-$60 range per PO or invoice
that was typical leading into the 1990s when P2P automation technology first became widely available.
WHAT TO DO if wanting to move on these metrics:
n Focus first on improving the various metrics detailed on page 20 of this report. Corrections and rework of financial documentation add zero — or even negative value — and make up a large share of overall processing costs.
n Improve and accelerate item search and selection capabilities and, where possible, automate data augmentation processes — for example, by prefilling required information fields or offering dropdown choices both to control and accelerate data entry in transaction processing.
0%
20%
40%
60%
80%
100%
0-5 20-2510-15 15-205-10
10%18%
11% 15%26%
25-30 30+
10% 10%
18.5Average cost to
process an invoice
© 2014 Zycus Inc. All rights reserved | Page 23

Page 24 | © 2014 Zycus Inc. All rights reserved
P2P Process Cycle Times

© 2014 Zycus Inc. All rights reserved | Page 25
Supplier onboarding cycle timesTwo weeks is the current norm for onboarding catalog suppliers, according to the Zycus P2P Benchmark for indirect spending. Noncatalog suppliers
take only slightly less time, on average, as roughly one in five companies surveyed worldwide report typical cycle times exceeding 30 days.
The challenges of creating and maintaining accurate and thorough supplier e-catalogs has long been an Achilles heel for P2P technology; benchmark study results suggest this remains a persistent pain point. Indeed, when asked to cite specific functionality wish lists for P2P technology, procurement professionals often cite things like:
n "Better e-catalog tools (with validation, etc)." n Capabilities to "manage catalogs in an easy way."n Functions that make it "easy to include new catalog items."
WHAT TO DO if wanting to move on this metric:
n Consider making P2P/e-commerce readiness a criteria for supplier selection.n Consider outsourcing e-catalog creation and management or adopting state-of-the-art automation solutions to support the process.
Supplier onboarding cycle times in days
© 2014 Zycus Inc. All rights reserved | Page 25
BEST
Wtd Avg 30+ days 10-30 days 0-5 days
Catalog 13.9 days 23% 50% 27%
Noncatalog 12.2 days 16% 51% 33%

Page 26 | © 2014 Zycus Inc. All rights reserved
Requisition-to-order cycle timesThe big spend management payoff to stakeholders in return for their compliance is budgets that stretch farther (without major sacrifices in product
or service features and quality) and/or savings that can be re-allocated to activities and investments that generate real value for the enterprise. But other payoffs should include easier routine work processes; faster, better customer service; lower inventory carrying requirements (because deliveries happen faster and more reliably); and better support from both procurement and suppliers. In terms of P2P service levels from procurement, the study benchmark for requisition-to-order cycle times comes in at 4.6 days for simple categories — essentially a full business week — and 13-14 days for more complex and services categories. Of note, is that other benchmarking research documents quite different views of this metric. For example, Gartner places the leading edge req-to-order cycle time at just four hours for simple categories and 30 days for capital equipment.
WHAT TO DO if wanting to move on this metric:
n Map all P2P workstreams in detail to identify and remove significant bottlenecks, paying attention to both people and technology. P2P automation technology should accelerate req-to-order cycle times, but only when underlying workflow capabilities are well designed and executed. Poor performance on this metric with a P2P solution present may signify the solution in place is either excessively difficult to use or 'kludgy' in that it fails to anticipate and allow for a full spectrum of potential behaviors, such as entering corrections at any process stage; enabling bypass of approvers who are traveling, sick or on vacation; allowing approvers or buyers to send reqs backward for clarification and so forth. Weak item-search capabilities may be another tech-based culprit contributing to longer-than-ideal req-to-order cycle times.
n Establish and communicate clear service-level agreements (SLAs), such as expected response times, for all process steps and participants (requisitioners, approvers, buyers and so forth) and also a long-term roadmap for improving service levels over time. Take full advantage of available workflow alert features and measure, track and report performance to SLAs until desired cycle times become established norms.
Wtd Avg 30+ days 6-30 days 0-5 days
Simple 4.6 days 3% 16% 81%
Complex 14.3 days 21% 50% 29%
Services 13.0 days 17% 44% 39%
Requisition-to-order cycle times in days
Page 26 | © 2014 Zycus Inc. All rights reserved
BEST

© 2014 Zycus Inc. All rights reserved | Page 27
Invoice-to-payment cycle timesTypical invoice-to-payment cycle time is a metric that tends to vary widely from one P2P benchmark study to the next. This is quite likely a function
of cross purposes. On the one hand, companies may be motivated to accelerate invoice to payment time, especially if trying to take advantage of early payment discounts or enabling critical and strategic suppliers to free up cash for investments in other priorities. On the other hand, there are many companies focusing on freeing up their own cash by extending standard supplier payment terms and/or paying precisely on-time per contracted payment terms. As a consequence, benchmark metrics become more difficult to interpret. In looking at the percentages yielded in the current study, it would seem that more companies fall into the latter camp, purposely paying at 30 days or even pushing out to 45. Where complex and outsourced services contracts are concerned, there is also substantial evidence of large savings leakages tied to rampant invoice inaccuracies and lack of strong governance and matching of invoice line items back to original contracts, SLAs and so forth. This may be preventing more rapid progression to automated processes for matching, clearing and paying indirect goods and services invoices in many situations.
WHAT TO DO if wanting to move on this metric:
n For companies that wish to accelerate invoice-to-payment cycle times, recommended actions would be similar to those for requisition-to-order cycle times and also for improving initial information accuracy and completeness of transaction data, reducing manual corrections and rework.
n For those working to extend payment terms and/or pay consistently on time rather than early, the focus needs to be first on improving compliance to preferred supplier contracts and terms and, second, on automating capture and structuring of key metadata from invoices arriving by multiple means and in various formats so that appropriate queuing and alerts can be implemented with personnel who are responsible for releasing payments against invoices.
Wtd Avg 30+ days 6-30 days 0-5 days
Simple 18.6 days 34% 42% 24%
Complex 21.1 days 46% 35% 19%
Services 20.9 days 44% 41% 15%
Invoice to payment cycle times in days
© 2014 Zycus Inc. All rights reserved | Page 27
BEST

Page 28 | © 2014 Zycus Inc. All rights reserved
P2P Technology Adoption & Use

© 2014 Zycus Inc. All rights reserved | Page 29
End user adoption of P2P solutionsEnd user adoption and use of P2P automation and workflow technology is all over the
map, according to the Zycus P2P Benchmark for indirect spending. On average, nearly half of all adopters of P2P technology are classified as using the solutions minimally or only as absolutely necessary. Weak user adoption, however, may not always signify poor spend compliance as a fairly common practice is for work groups to designate single or small numbers of representatives — administrative assistants, for example — to handle all requisitioning for a group. That approach, however, can yield its own set process bottlenecks (sick leave, vacation, etc), leading to stakeholder dissatisfaction and frustration when people are faced with having to re-learn processes — typically under time pressure — because they practice them only rarely.
WHAT TO DO if wanting to move on this metric:
n To make more frequent/powers users out of existing employees, check out top successful tactics reported on p31 of this report.
n While existing employees may be more difficult to convert to new processes and technologies, new employees are another matter. Collaborate with HR to embed P2P training and indoctrinization into new-employee onboarding processes.
0%
25%
50%
75%
100%
0-20% 81-100%41-60% 61-80%21-40%
19% 18% 20% 24% 19%
Percent of targeted end users who have adoptedP2P solutions
53%use routinely/advanced users
47%vs. use minimally only as necessary
© 2014 Zycus Inc. All rights reserved | Page 29
Among P2P technology adopters...

Page 30 | © 2014 Zycus Inc. All rights reserved
User P2P solution ratings
Weighted Avg Rating 1-10 scale (10=best)
Ease of learning 6.2
Ease of using 6.0
Ease of searching/finding what I am looking to purchase 6.0
Ease of classifying my transactions 6.4
Availability of support 6.5
Similarity to consumer online shopping experience 4.9
Approver response times 6.4
Transaction cycle times (from need to delivery) 6.6
50%Semi-mandatory
Mandatory
47%Voluntary 3%
The Zycus P2P Benchmark for indirect spending reserved a small set of questions for P2P technology end users to evaluate solutions in use within their corporate enterprises. First, users were asked to classify corporate policies in relation to P2P system usage for indirect spending. Some 47%
report that P2P solutions are largely mandatory for most ordering, while 50% classify their systems as semi-mandatory, meaning they cover only some indirect spend categories. A paltry 3%, meantime, say use of P2P technology remains entirely voluntary within their organizations. Asked to score P2P technology on a 1-10 scale (10 being very satisfied) across a variety of attributes, most scores average in a very tight 6-7 point range with transaction cycle times receiving the highest average score of 6.6 out of 10. The only attribute to fall outside that range is 'similarity to consumer online shopping experiences.' While some P2P solutions have attempted to emulate consumer experiences, substandard search capabilities, poor or lacking product images and requirements for manual or semimanual item classification, GL coding and so forth, appear to be undermining procurement's abilities to deliver more consumer-like experiences.
Page 30 | © 2014 Zycus Inc. All rights reserved
© 2014 Zycus Inc. All rights reserved | Page 31
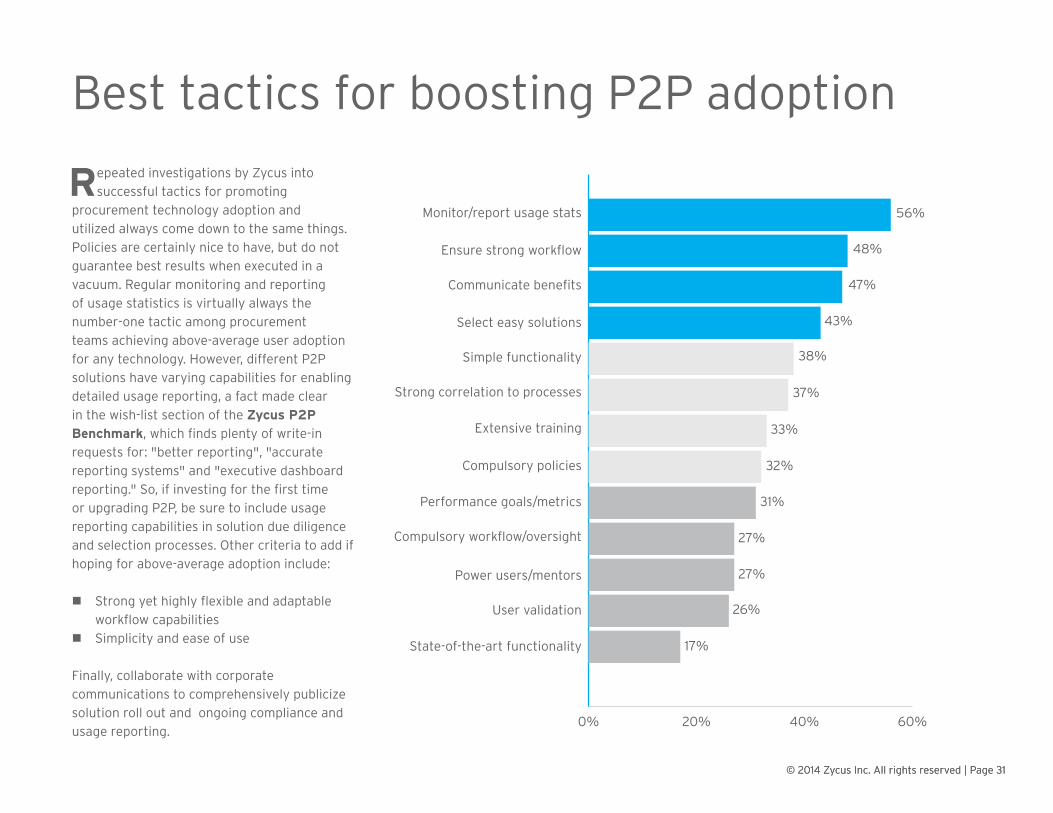
0% 20% 40% 60%
56%
48%
47%
43%
38%
37%
33%
32%
31%
27%
27%
26%
17%
Best tactics for boosting P2P adoption
Monitor/report usage stats
Ensure strong workflow
Communicate benefits
Select easy solutions
Simple functionality
Strong correlation to processes
Extensive training
Compulsory policies
Performance goals/metrics
Compulsory workflow/oversight
Power users/mentors
User validation
State-of-the-art functionality
Repeated investigations by Zycus into successful tactics for promoting
procurement technology adoption and utilized always come down to the same things. Policies are certainly nice to have, but do not guarantee best results when executed in a vacuum. Regular monitoring and reporting of usage statistics is virtually always the number-one tactic among procurement teams achieving above-average user adoption for any technology. However, different P2P solutions have varying capabilities for enabling detailed usage reporting, a fact made clear in the wish-list section of the Zycus P2P Benchmark, which finds plenty of write-in requests for: "better reporting", "accurate reporting systems" and "executive dashboard reporting." So, if investing for the first time or upgrading P2P, be sure to include usage reporting capabilities in solution due diligence and selection processes. Other criteria to add if hoping for above-average adoption include:
n Strong yet highly flexible and adaptable workflow capabilities
n Simplicity and ease of use
Finally, collaborate with corporate communications to comprehensively publicize solution roll out and ongoing compliance and usage reporting.
© 2014 Zycus Inc. All rights reserved | Page 31

Page 32 | © 2014 Zycus Inc. All rights reserved
Zycus is dedicated to positioning procurement at the heart of business performance. With our spirit of innovation and a passion to help procurement create even greater business advantages, we have evolved our portfolio to a complete Source-to-Pay suite of procurement
performance solutions which includes — Spend Analysis, e-Sourcing, Contract Management, Supplier Management, Financial Savings Management, and Procure-to-Pay.
Behind every Zycus solution stands an organization that possesses deep, detailed procurement expertise and a sharp focus on being responsive to customers. We are a large — 600+ and growing — company with a physical presence in virtually every major region of the globe. We see each customer as a partner in innovation and no client is too small to deserve our attention. With more than 200 solution deployments among Global 1000 clients, we search the world continually for procurement practices proven to drive competitive business performance. We incorporate these practices into easy-to-use solutions that give procurement teams the power to get moving quickly — from any point of departure — and to continue innovating and pushing business and procurement performance to new heights.
UNITED STATES103 Carnegie Center, Suite 201, Princeton NJ 08540609 799 5664
5600 N.River Road, Suite 800, Rosemont IL 60018847 993 3180
555 Northpoint Center East, 4th Floor, Alpharetta GA 30022678 366 5000
UNITED KINGDOMOffice No 104, 400 Thames Valley Park Drive, Thames Valley ParkReading, Berkshire, RG6 1PT+44 (0) 1189 637 493
INDIAPlot No. GJ - 07, Seepz++, Seepz SEZ, Andheri (East), Mumbai 400 096+91 22 66407676
AUSTRALIALevel 9, 440 Collins Street, Melbourne VIC 3000+61 03 8679 6562


![Zycus ASA Brochure 2008 Web[2]](https://static.fdocuments.net/doc/165x107/5554ff39b4c9051a5b8b49cf/zycus-asa-brochure-2008-web2.jpg)