
Ben Page - The State of Public Sector - PPMA Seminar April 2012
39
-
Upload
ppma-public-sector-people-managers-association -
Category
News & Politics
-
view
1.799 -
download
1
Transcript of Ben Page - The State of Public Sector - PPMA Seminar April 2012
The state of public sector Ben Page, Chief Executive Ipsos MORI [email protected] @benatipsosmori
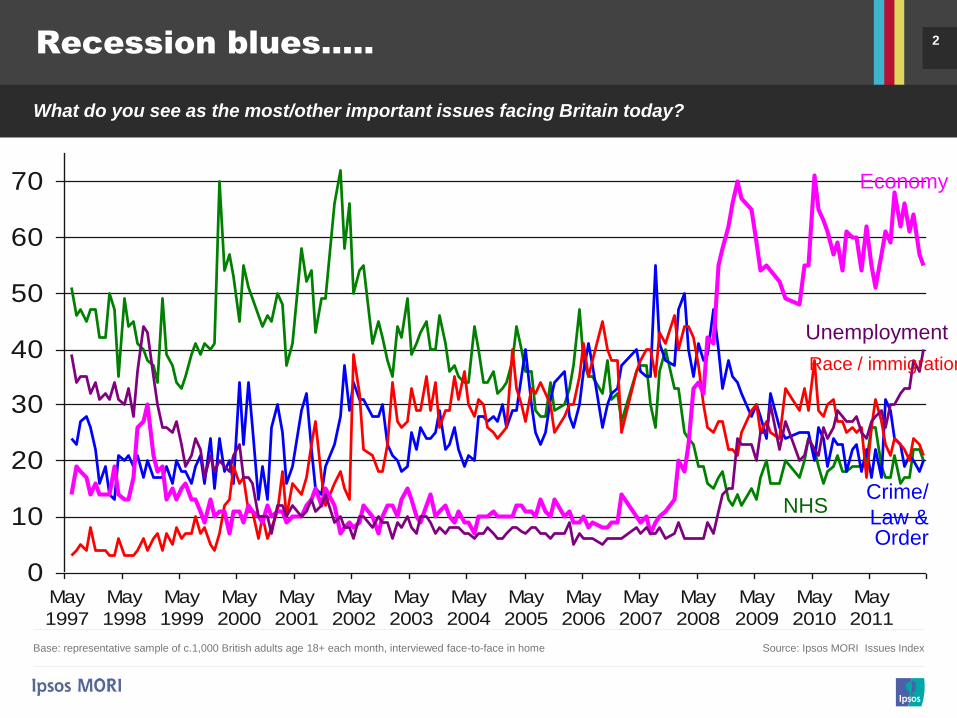
2 Recession blues.....
What do you see as the most/other important issues facing Britain today?
Base: representative sample of c.1,000 British adults age 18+ each month, interviewed face-to-face in home Source: Ipsos MORI Issues Index
0
10
20
30
40
50
60
70
May
1997
May
1998
May
1999
May
2000
May
2001
May
2002
May
2003
May
2004
May
2005
May
2006
May
2007
May
2008
May
2009
May
2010
May
2011
Unemployment
NHS Crime/
Law & Order
Race / immigration
Economy
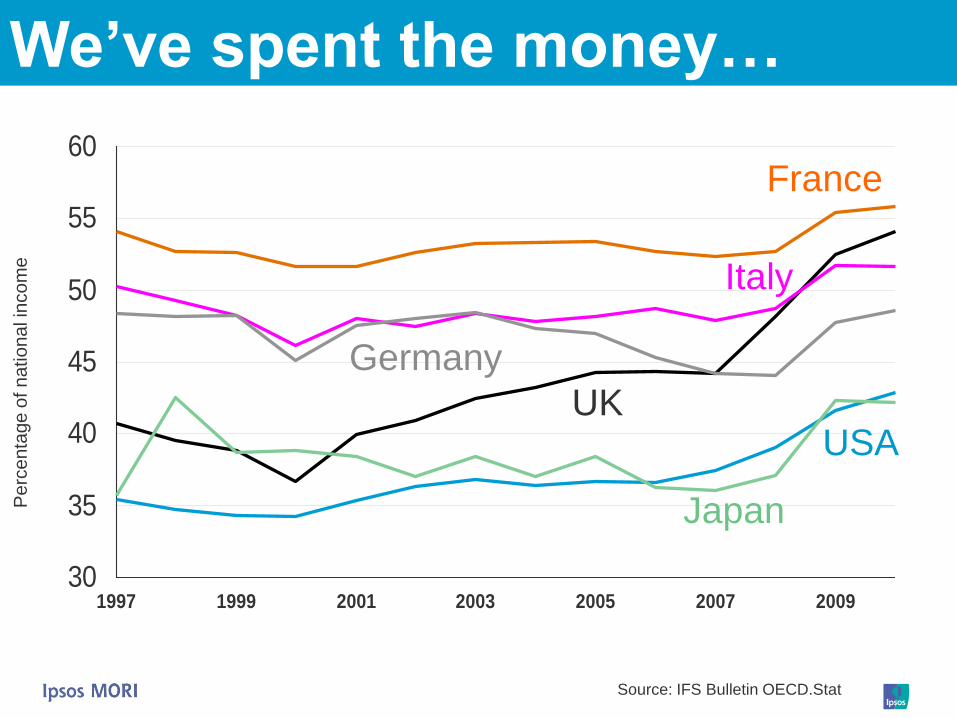
We’ve spent the money…
30
35
40
45
50
55
60
1997 1999 2001 2003 2005 2007 2009
Source: IFS Bulletin OECD.Stat
Pe
rce
nta
ge
of n
atio
na
l in
co
me
France
Germany
Italy
USA
Japan
UK
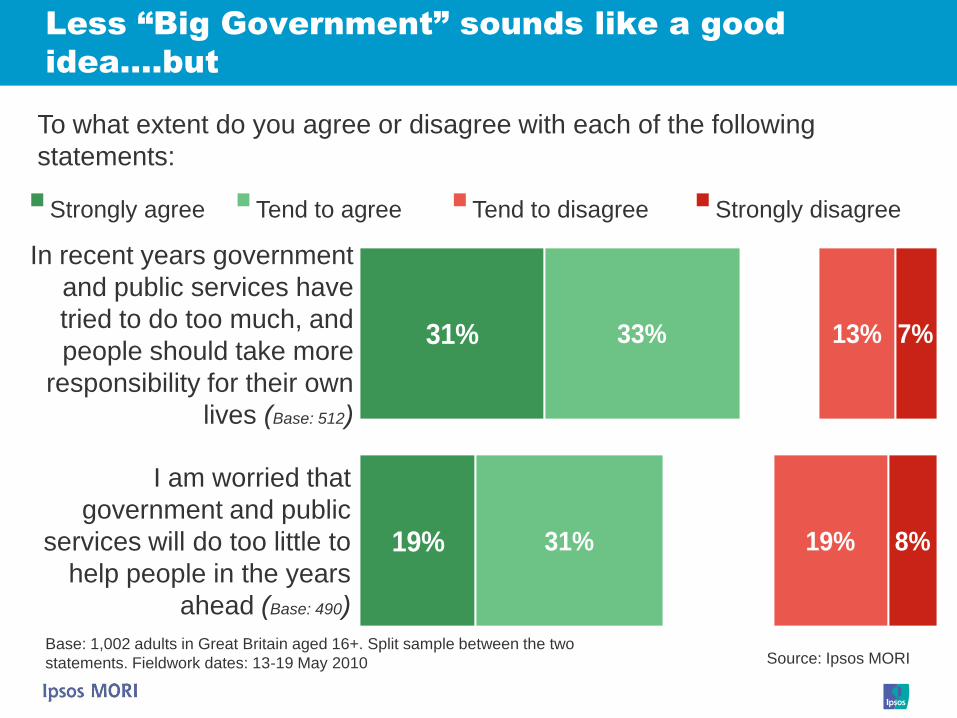
31%
19%
33%
31%
13%
19%
7%
8%
Less “Big Government” sounds like a good
idea….but
Base: 1,002 adults in Great Britain aged 16+. Split sample between the two
statements. Fieldwork dates: 13-19 May 2010
In recent years government
and public services have
tried to do too much, and
people should take more
responsibility for their own
lives (Base: 512)
I am worried that
government and public
services will do too little to
help people in the years
ahead (Base: 490)
Strongly agree Tend to agree Tend to disagree Strongly disagree
Source: Ipsos MORI
To what extent do you agree or disagree with each of the following
statements:
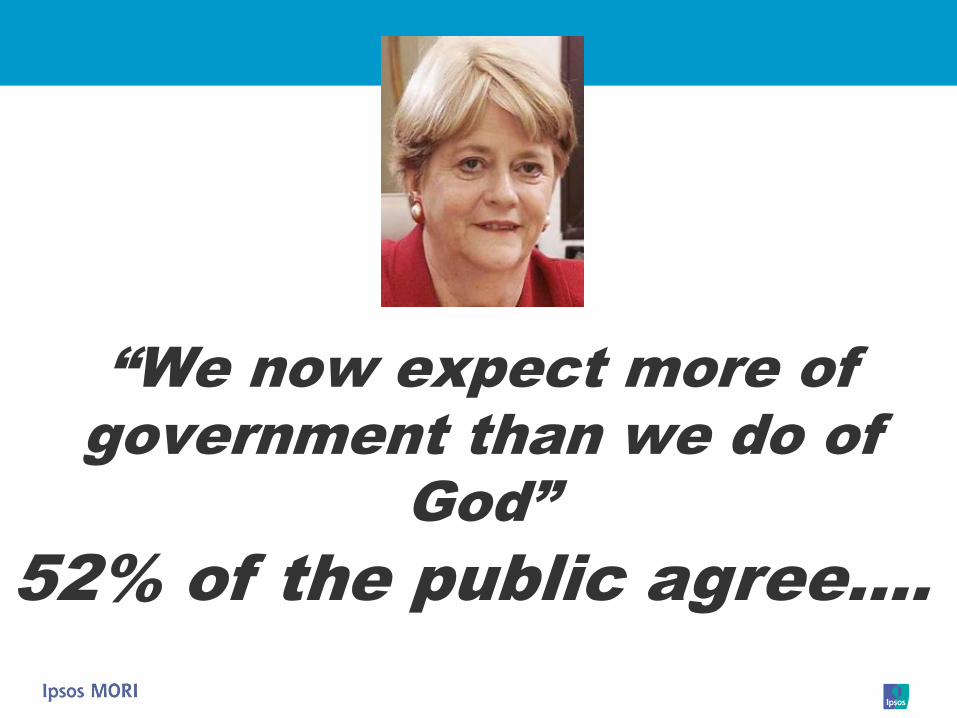
“We now expect more of
government than we do of
God”
52% of the public agree….

Where are you??
© Ipsos MORI 6
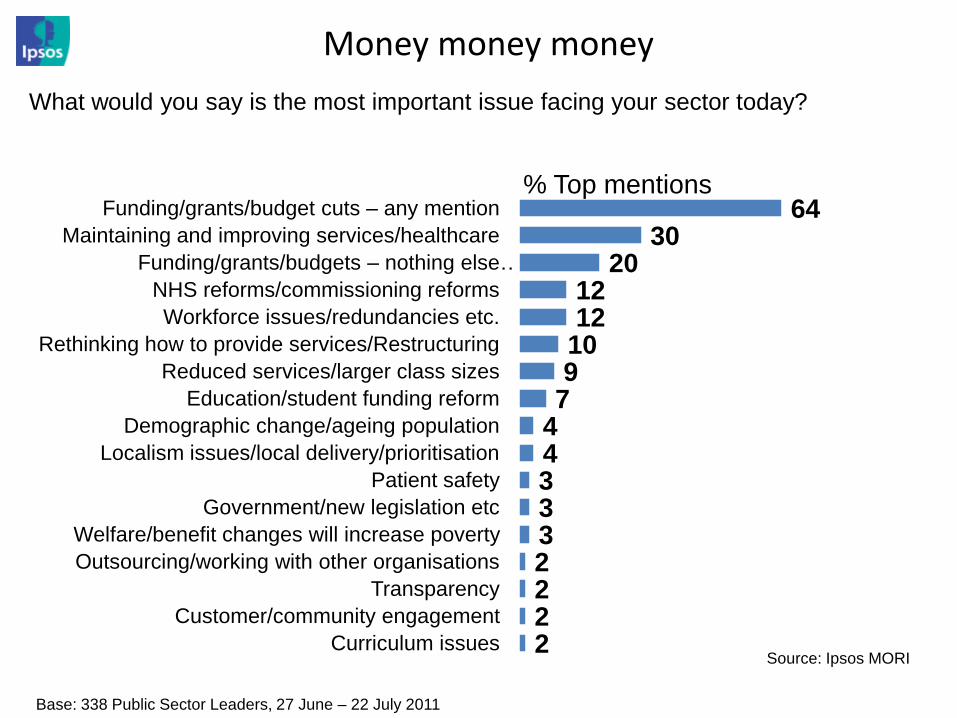
64 30
20 12 12
10 9
7 4 4 3 3 3 2 2 2 2
Funding/grants/budget cuts – any mention
Maintaining and improving services/healthcare
Funding/grants/budgets – nothing else …
NHS reforms/commissioning reforms
Workforce issues/redundancies etc.
Rethinking how to provide services/Restructuring
Reduced services/larger class sizes
Education/student funding reform
Demographic change/ageing population
Localism issues/local delivery/prioritisation
Patient safety
Government/new legislation etc
Welfare/benefit changes will increase poverty
Outsourcing/working with other organisations
Transparency
Customer/community engagement
Curriculum issues
Money money money
% Top mentions
Base: 338 Public Sector Leaders, 27 June – 22 July 2011
What would you say is the most important issue facing your sector today?
Source: Ipsos MORI
8
VFM
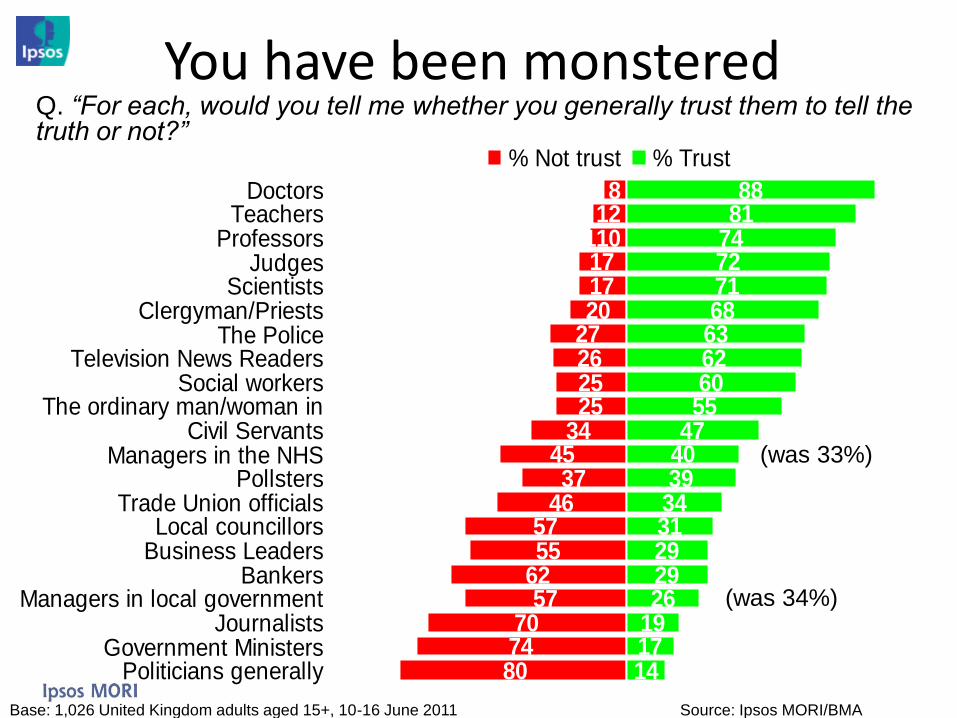
812
171720
27262525
344537
465755
6257
7074
8881
74727168
636260
5547
4039
3431292926
19171480
11110
DoctorsTeachers
ProfessorsJudges
ScientistsClergyman/Priests
The PoliceTelevision News Readers
Social workersThe ordinary man/woman in
Civil ServantsManagers in the NHS
PollstersTrade Union officials
Local councillorsBusiness Leaders
BankersManagers in local government
JournalistsGovernment Ministers
Politicians generally
% Not trust % Trust
You have been monstered Q. “For each, would you tell me whether you generally trust them to tell the truth or not?”
Base: 1,026 United Kingdom adults aged 15+, 10-16 June 2011 Source: Ipsos MORI/BMA
(was 33%)
(was 34%)
10
Overall satisfaction
with services holding up
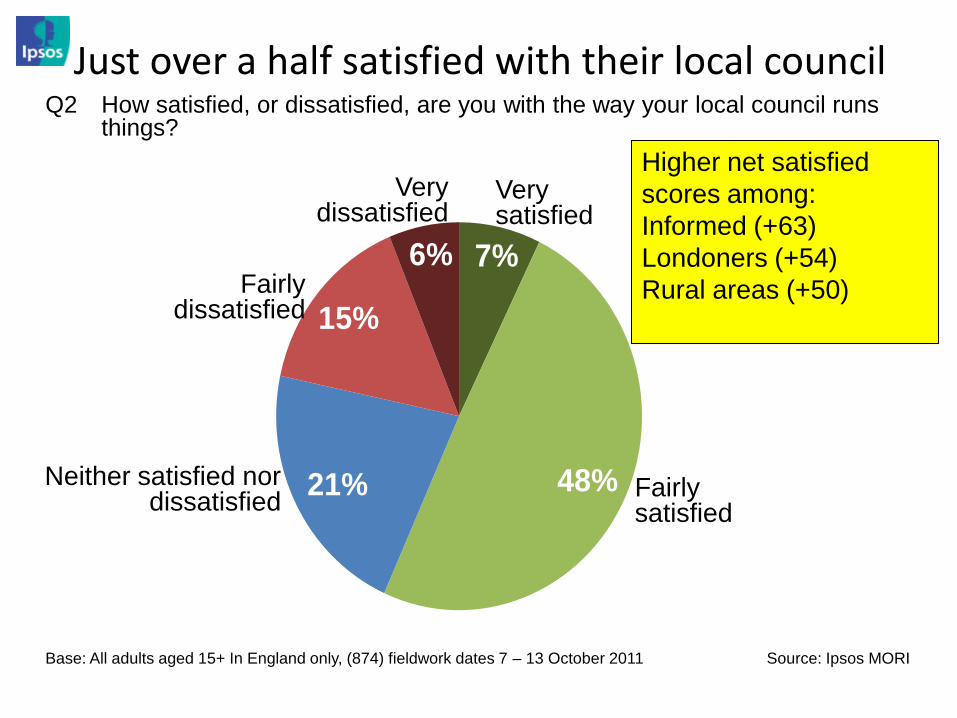
7%
48%21%
15%
6%
Just over a half satisfied with their local council
Neither satisfied nor dissatisfied
Very satisfied
Fairly dissatisfied
Fairly satisfied
Very dissatisfied
Base: All adults aged 15+ In England only, (874) fieldwork dates 7 – 13 October 2011
Q2 How satisfied, or dissatisfied, are you with the way your local council runs things?
Source: Ipsos MORI
Higher net satisfied
scores among:
Informed (+63)
Londoners (+54)
Rural areas (+50)
0%
5%
10%
15%
20%
25%
30%
35%
40%
45%
50%
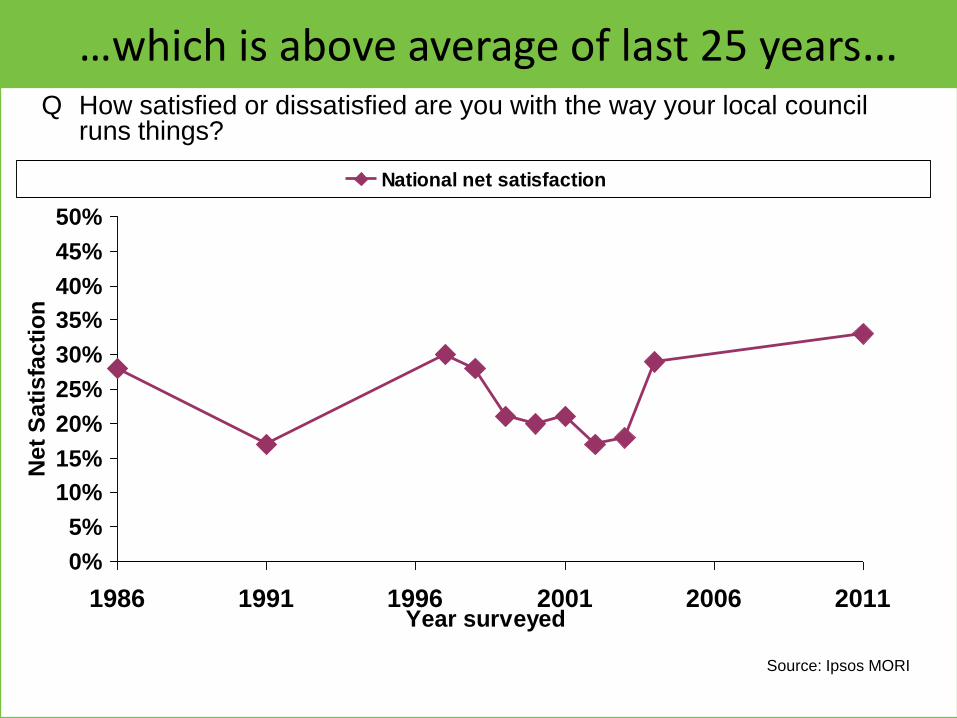
1986 1991 1996 2001 2006 2011Year surveyed
Net
Sa
tis
fac
tio
n
National net satisfaction
Q How satisfied or dissatisfied are you with the way your local council runs things?
…which is above average of last 25 years…
Source: Ipsos MORI
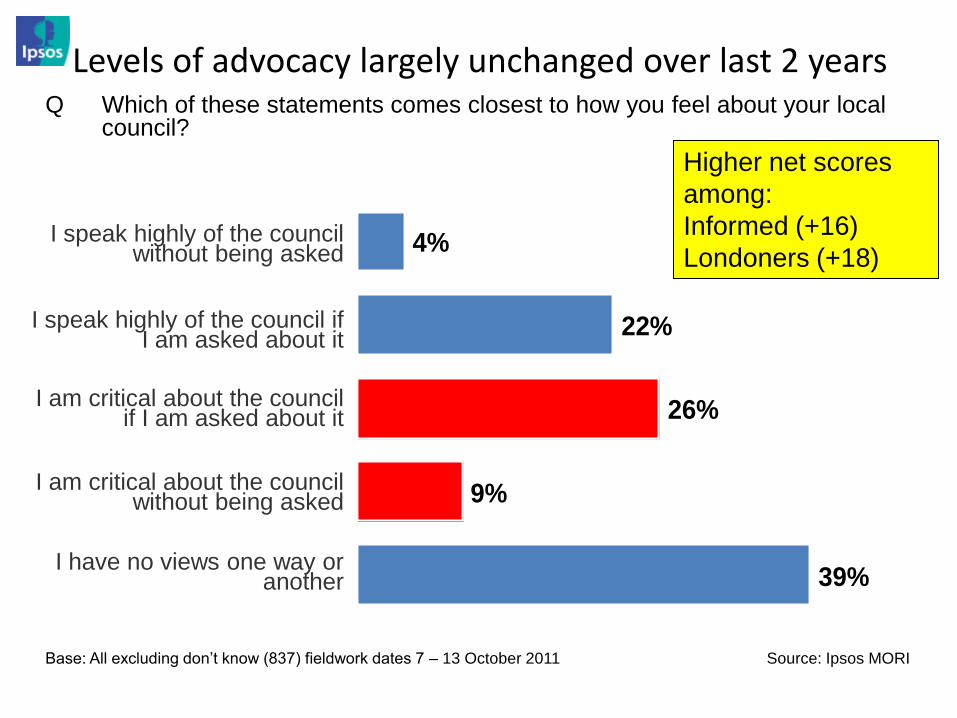
4%
22%
26%
9%
39%
Levels of advocacy largely unchanged over last 2 years
Base: All excluding don’t know (837) fieldwork dates 7 – 13 October 2011
I speak highly of the council without being asked
I speak highly of the council if I am asked about it
I am critical about the council if I am asked about it
I am critical about the council without being asked
I have no views one way or another
Q Which of these statements comes closest to how you feel about your local council?
Source: Ipsos MORI
Higher net scores
among:
Informed (+16)
Londoners (+18)
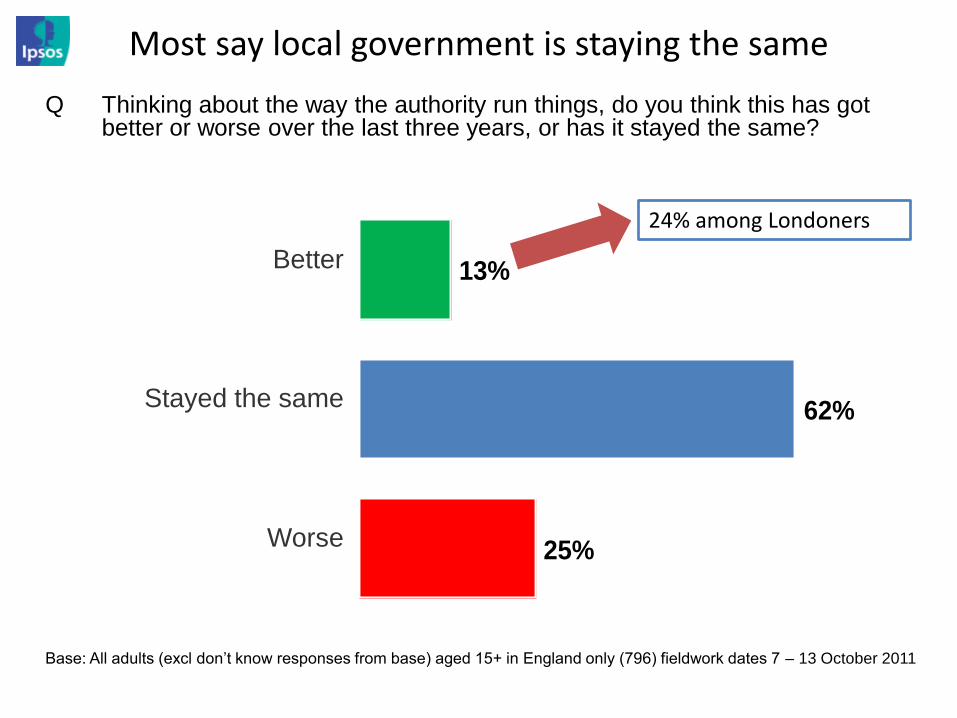
13%
62%
25%
Most say local government is staying the same
Base: All adults (excl don’t know responses from base) aged 15+ in England only (796) fieldwork dates 7 – 13 October 2011
Better
Stayed the same
Worse
Q Thinking about the way the authority run things, do you think this has got better or worse over the last three years, or has it stayed the same?
24% among Londoners

Image of local council is mixed - but
Base: All adults aged 15+ in England only (874) fieldwork dates 7 – 13 October 2011
Faceless
Q14 Please read through the list, and tell me which of the words, if any, that you think apply to your local council
Source: Ipsos MORI
Bureaucratic
Under-funded
Friendly
Unresponsive
Efficient
Keen to help
Unaccountable
Hardworking
Infuriating
Top answers
2007
30%
32%
25%
21%

36 38 37 35 34
29
36
52 54 57
60 61 62
64
10
20
30
40
50
60
70
2001 2003 2005 2007-08 2008-09 2009-10 2010-11
Pe
r cent
Parliament Local Council
And Trust is up…
Base: Core sample in England; (2001: 9,270, 2003: 8,859, 2005: 9,104, 2007-08: 8,729, 2008-09: 8,706, 2009-10: 8,677, 2010-11: 9,521)
Trust %
17
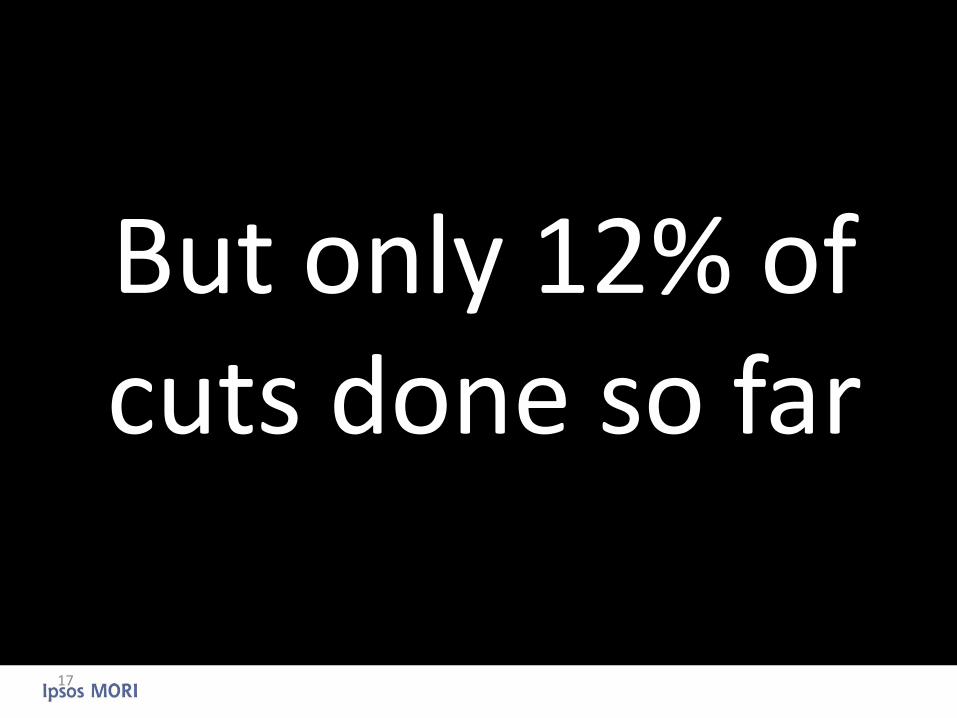
But only 12% of cuts done so far

On the classic change curve….
Pay has never been the main
factor in staff engagement -
but in the current climate, how
far are staff really beginning to
worry about declining living
standards?
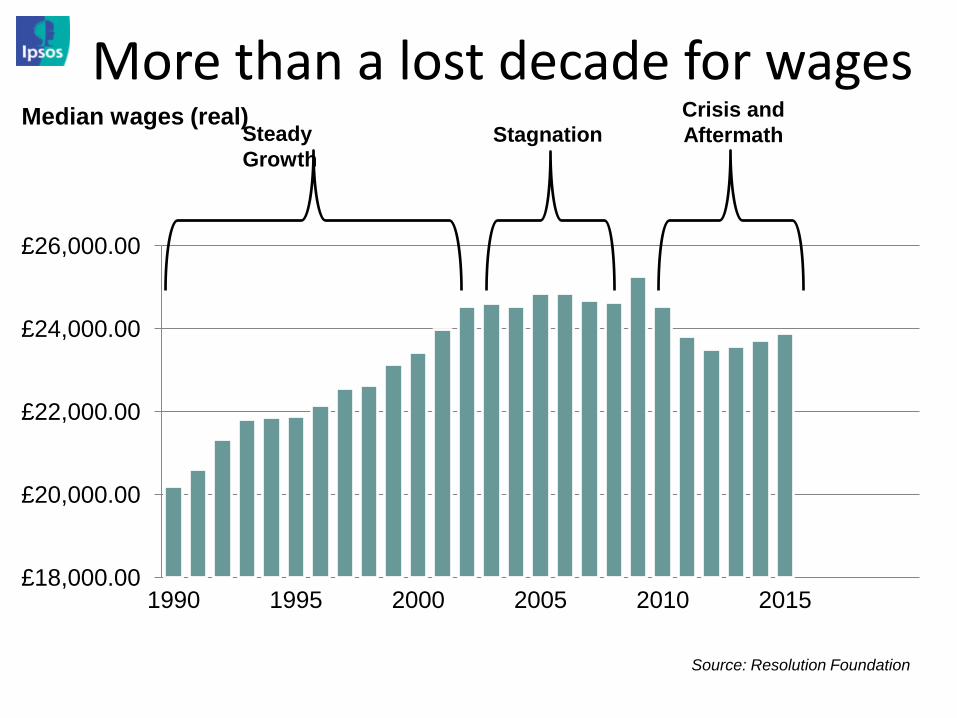
£18,000.00
£20,000.00
£22,000.00
£24,000.00
£26,000.00
1990 1995 2000 2005 2010 2015
More than a lost decade for wages
Source: Resolution Foundation
Steady
Growth Stagnation
Crisis and
Aftermath Median wages (real)
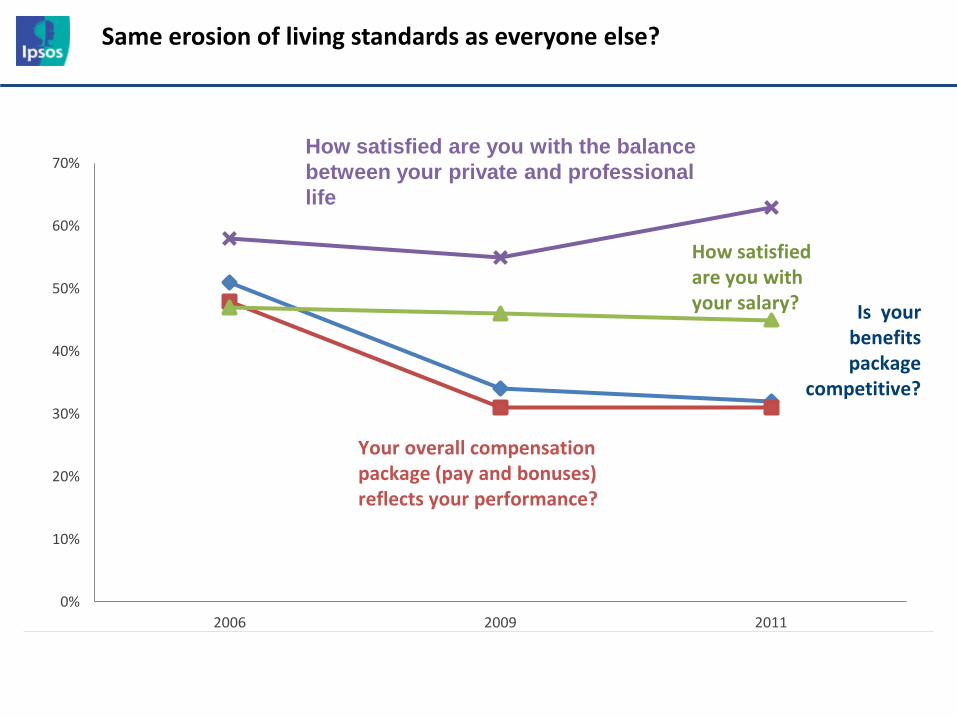
0%
10%
20%
30%
40%
50%
60%
70%
2006 2009 2011
Is your benefits package
competitive?
Your overall compensation package (pay and bonuses) reflects your performance?
How satisfied are you with your salary?
Same erosion of living standards as everyone else?
How satisfied are you with the balance
between your private and professional
life
People are still motivated and
believe in their “vocation” but
more demanding conditions
and declining real pay are
affecting happiness levels
0%
10%
20%
30%
40%
50%
60%
70%
80%
90%
2006 2009 2011
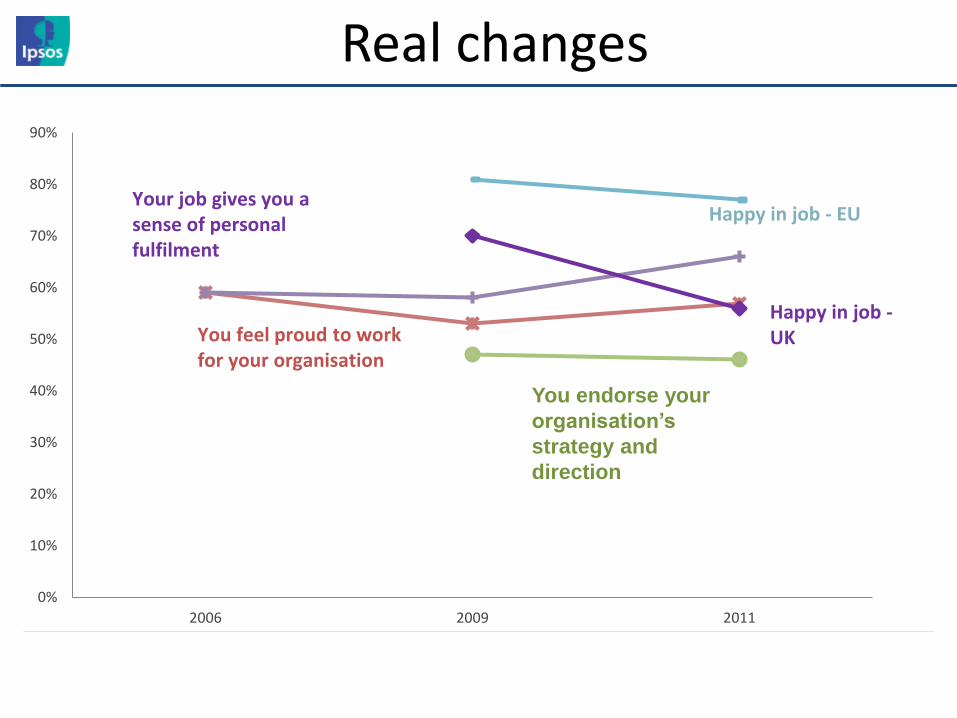
You feel proud to work for your organisation
Your job gives you a sense of personal fulfilment
Happy in job - EU
Happy in job - UK
Real changes
You endorse your
organisation’s
strategy and
direction
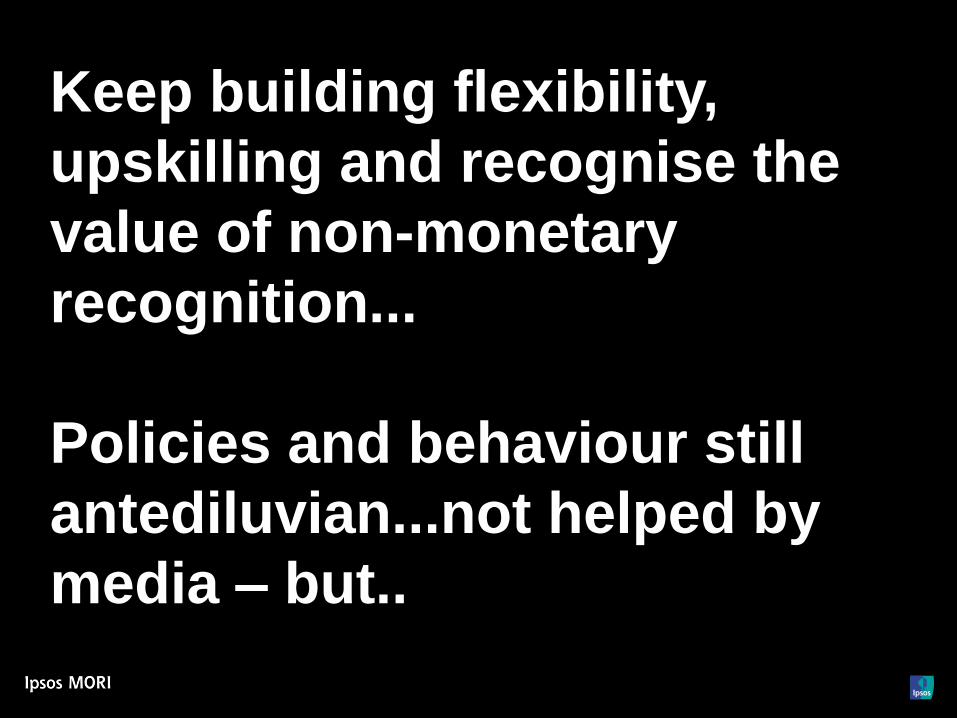
Keep building flexibility,
upskilling and recognise the
value of non-monetary
recognition...
Policies and behaviour still
antediluvian...not helped by
media – but..

20%
25%
30%
35%
40%
45%
50%
55%
2006 2009 2011
Change is well managed within your organisation You support
change
You feel valued and recognised
Worried about what’s next

FOR EXAMPLE........
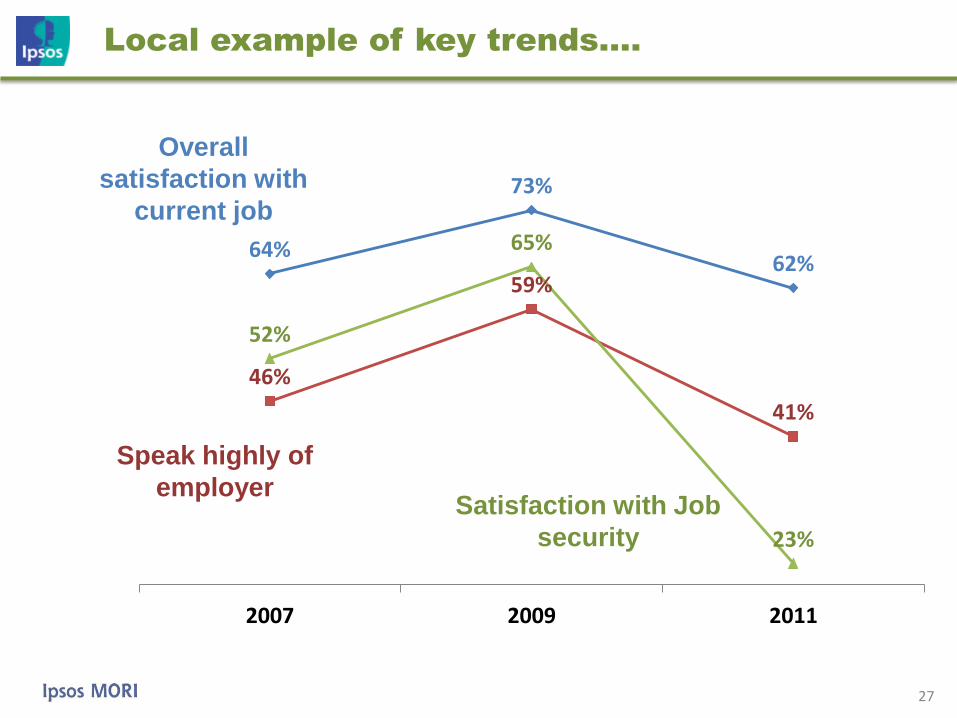
Local example of key trends….
27
64%
73%
62%
46%
59%
41%
52%
65%
23%
2007 2009 2011
Speak highly of
employer
Overall
satisfaction with
current job
Satisfaction with Job
security
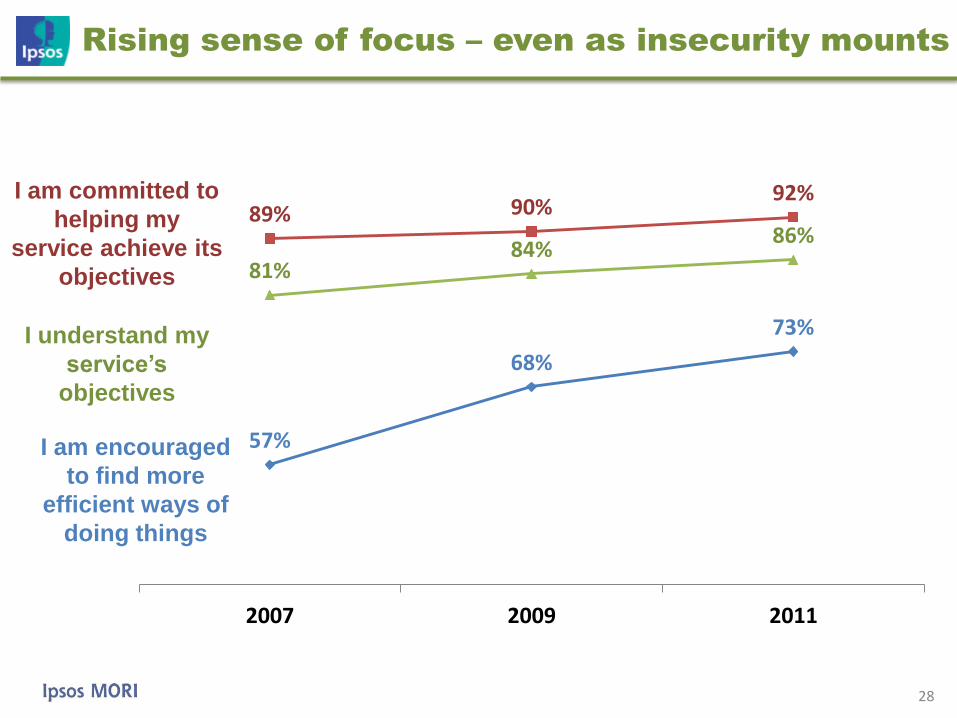
Rising sense of focus – even as insecurity mounts
28
57%
68%
73%
89% 90% 92%
81% 84%
86%
2007 2009 2011
I am committed to
helping my
service achieve its
objectives
I am encouraged
to find more
efficient ways of
doing things
I understand my
service’s
objectives
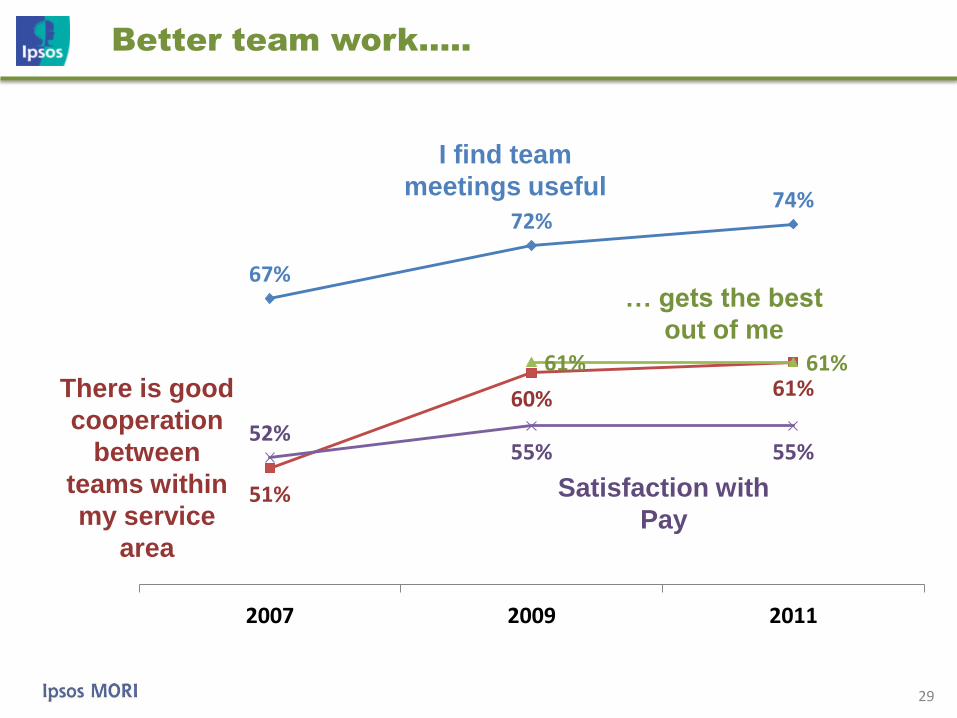
Better team work…..
29
67%
72% 74%
51%
60% 61% 61% 61%
52% 55% 55%
2007 2009 2011
Satisfaction with
Pay
I find team
meetings useful
… gets the best
out of me
There is good
cooperation
between
teams within
my service
area
But anxiety about change
© Ipsos MORI 30

Appetite for change
31
16
24 19
64
72
66
2007 2009 2011
Change is
well managed
I support
the need
for change
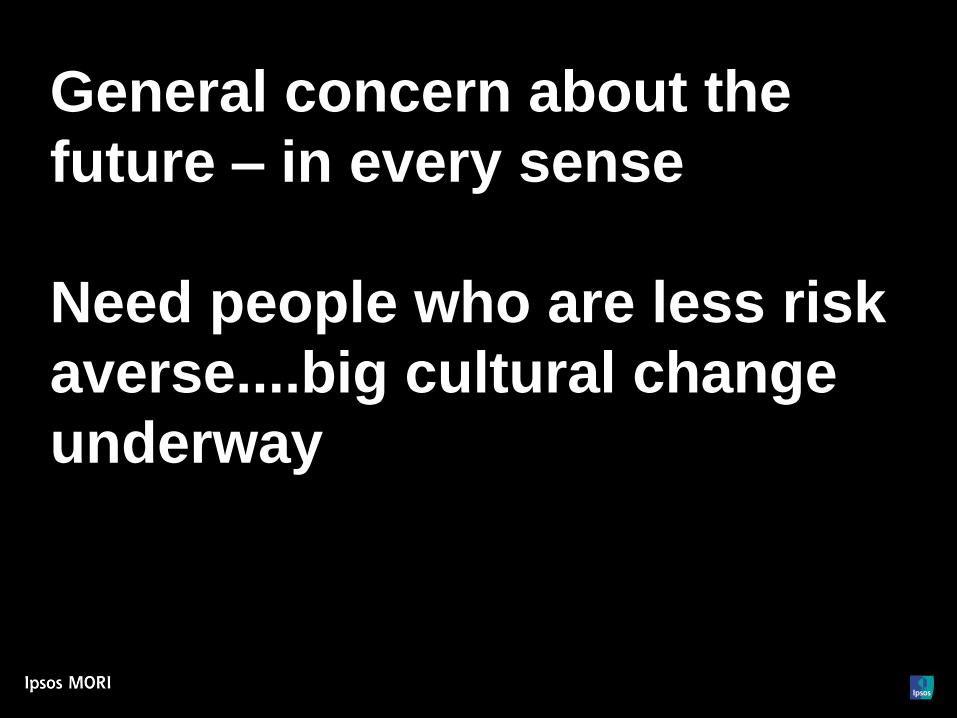
General concern about the
future – in every sense
Need people who are less risk
averse....big cultural change
underway
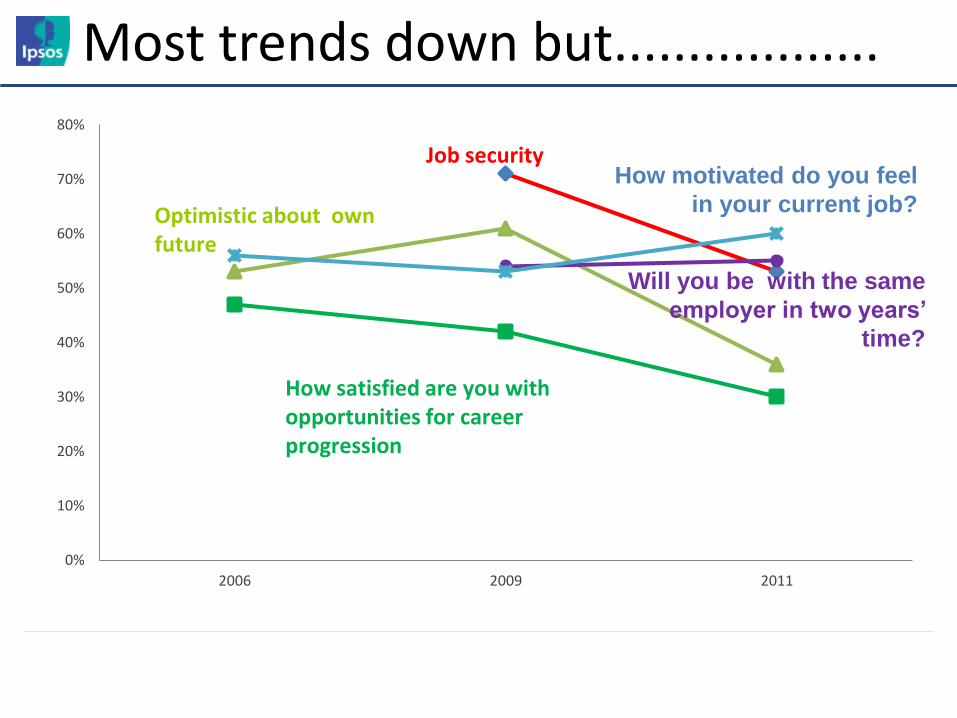
Most trends down but..................
0%
10%
20%
30%
40%
50%
60%
70%
80%
2006 2009 2011
Job security
How satisfied are you with opportunities for career progression
Optimistic about own future
How motivated do you feel
in your current job?
Will you be with the same
employer in two years’
time?
Like all employers, you are
highly reliant on staff
willingness to meet your
new objectives and
change…
© Ipsos MORI 34

© Engaging for Success, David MacLeod and Nita Clarke
What is engagement?
35
57% of staff on average say they support the need for change in
local government
Base size: 4094 36
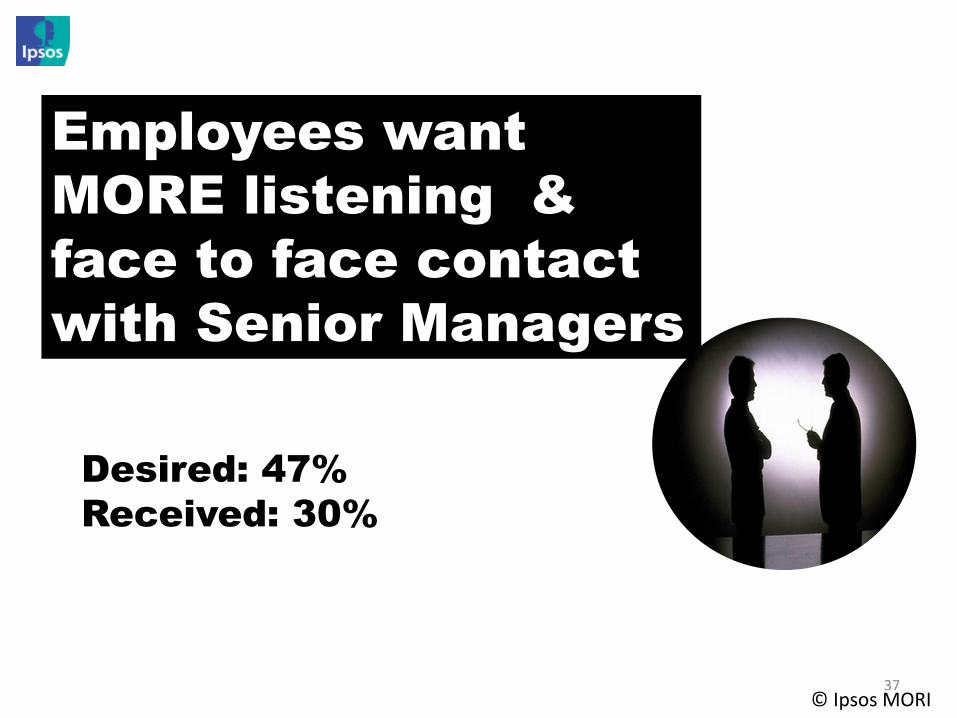
Employees want
MORE listening &
face to face contact
with Senior Managers
© Ipsos MORI
Desired: 47%
Received: 30%
37
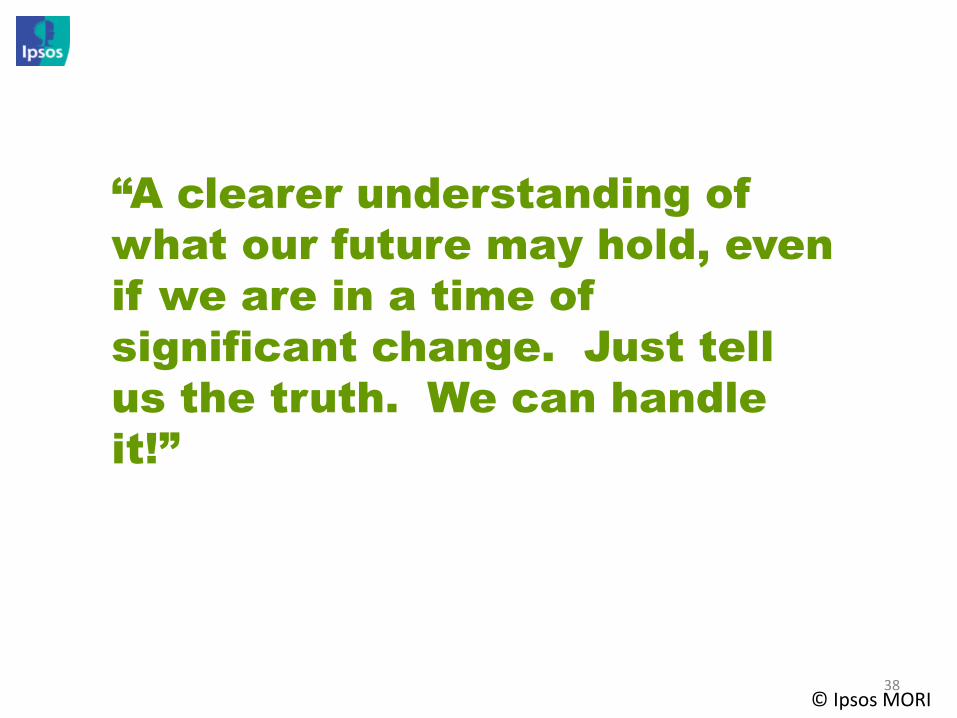
“A clearer understanding of
what our future may hold, even
if we are in a time of
significant change. Just tell
us the truth. We can handle
it!”
© Ipsos MORI
Capturing the mood…
38