
BELARUS Country Fiche 2016 - ETF · EU–Belarus cooperation has been ... The Belarusian economy...
16
BELARUS EDUCATION, TRAINING AND EMPLOYMENT DEVELOPMENTS 2016
Transcript of BELARUS Country Fiche 2016 - ETF · EU–Belarus cooperation has been ... The Belarusian economy...

BELARUS EDUCATION, TRAINING AND EMPLOYMENT DEVELOPMENTS 2016

The contents of this paper are the sole responsibility of the ETF and do not necessarily reflect the views of the EU institutions.
© European Training Foundation, 2017 Reproduction is authorised provided the source is acknowledged.

BELARUS 2016 | 03
KEY EDUCATION, TRAINING AND EMPLOYMENT DEVELOPMENTS
IN BELARUS
EU–Belarus cooperation has been evolving throughout 2016. The European Union (EU) lifted most of
its sanctions against Belarus in February 2016, and this has improved the political cooperation
between the EU and Belarus and enhanced Belarus’s opportunities to strengthen its cooperation with
European partners.
The first large package of EU financial assistance to Belarus to modernise its vocational education
and training (VET) and employment system is due to start at the beginning of 2017.
Belarus joined the European Higher Education Area (EHEA) on 14 May 2015, following a decision at
the ministerial meeting in Yerevan. The decision to accept the second application of Belarus is
supported by a roadmap for reforms, which is overseen by the Bologna Follow-Up Group, assisted by
an Advisory Group. This Advisory Group met for the first time in January 2016 in Chişinău and for the
second time in Minsk in June 2016. The Bologna Follow-Up Group will deliver a progress report in
2018.
The State Programme on Education and Youth Policy, which is the guiding strategy document for the
education sector for the period 2016–2020, was adopted by a government decree in March 2016.
It covers all education levels, including general education, VET and higher education.
The adoption of a national qualifications framework (NQF) and decisions on the reform of the
qualification system have been postponed, as Belarus has opted for a gradual approach to change
and is relying on the implementation and review of pilot projects that will be supported by the
upcoming EU project.
The Belarusian economy has faced serious challenges and the country’s growth has continued to be
negative (−3.9% in 2015). Official unemployment figures increased in 2015 and there are signs of
labour market problems, but it is difficult to assess their real scope owing to the absence of reliable
labour market data (labour force survey (LFS)). The government has delayed the publication of LFS
data until 2017.
The government is continuing to implement the state policy on full employment, resulting in high
activity and employment rates (over 80%) and a very low unemployment rate, despite the economic
recession in 2015–2016. Wage differentiations in the public sector remain very low. The adverse
consequences are underemployment and hoarded labour, and declining productivity and
competitiveness. It remains to be seen how long Belarus can continue to avoid restructuring its
economy, something that is likely to have a major impact on employment and the labour market.
In 2015 the government started strengthening skills anticipation mechanisms by setting up inter-
agency working groups on short- and long-term anticipation.
The ETF conducted a baseline study on the country’s labour market information systems (LMIS) and
skills anticipation in the first half of 2016. This is a rich source of information on the Belarusian labour
market and explains the peculiar characteristics of this labour market, in which the state is directly or
indirectly the main employer.
1. Key demographic and economic characteristics
Belarus is classified by the World Bank as an upper middle-income country with a gross domestic
product (GDP) per capita that has increased from $15 401 in 2010 to $18 185 in 2014 (purchasing
power parity (PPP), current international dollars). After a decade of strong economic growth, Belarus
has faced persistent macroeconomic turmoil since 2009. During most of the 2000s, a combination of
favourable external factors and loose macroeconomic policies boosted economic growth, with annual
growth rates averaging 9% for the period 2002–2008. However, this strong growth was associated
with increasing macroeconomic vulnerabilities and growing external imbalances, resulting in two
BELARUS 2016 | 04
crises, in 2009 and 2011. The second crisis led to the loss of control of the exchange rate and sharply
accelerating inflation. Belarus’s economy contracted by 3.9% in 2015, reversing the short-lived mild
recovery seen in 2014. In the first quarter of 2016, GDP declined by 3.6% and the World Bank and
International Monetary Fund forecast a 3% decline in GDP in 2016. Belarus’s dependence on Russia,
with over 50% GDP exposure to the Russian economy, represents a high degree of vulnerability in
terms of falling export demand, remittances and investment from Russia. This is exacerbated by
Belarus’s own external imbalances, liquidity risks, low levels of reserves and structural limitations on
economic growth. Contingent liabilities of the government represent another source of vulnerability,
given the heavy participation of the state in the economy, where a large proportion of enterprises
remain state-owned and have yet to be restructured. In terms of the contribution to GDP by different
sectors, agriculture declined from 9.4% (2011) to 7.8% (2015), industry remained relatively stable at
40.1% (2015), and services increased slightly from 47.8% (2011) to 52.1% (2015). As regards
employment by sector, in 2015 agriculture accounted for 9.7%, industry 31.1% and services 59.2%.
While the gradual reform approach has helped Belarus to avoid the social costs of economic
restructuring, the biggest challenge for the country is to make the transition from economic growth that
is focused on resources and that depends on low-cost labour and capital to growth that is based on a
high rate of productivity and innovations.
Belarus’s population at the beginning of 2016 was 9.5 million people, 77.6% of whom live in urban
areas. The demographic profile of the country is characterised by a low birth rate and an ageing
population. These demographic trends are likely to translate into new demands on the lifelong learning
system and on employment policy.
In 2013 the Belarusian poverty rate declined to 5.5 %, which is far below the Commonwealth of
Independent States (CIS) average of 10.5% and the Eastern European average of 11.4%. In terms of
income equality, Belarus has one of the lowest Gini coefficients in the CIS and Eastern Europe (0.283
versus 0.345 and 0.339, respectively) and the country performs well on social indicators, being ranked
50 out of 188 countries in the UN Human Development Index (2015).
The Programme of Socio-Economic Development of Belarus for 2011–2015, which set out operational
priorities for the National Strategy for Sustainable Socio-Economic Development of Belarus for the
period to 2020, calls for new approaches to the matching of skills supply and demand, and to the
opening up of new business opportunities for small and medium-sized enterprises (SMEs). One of the
strategic objectives of the programme for investing in human capital aims to improve the effectiveness
of labour resources and workforce competitiveness in the labour market. A long-term goal is to change
the sectoral structure of the economy to reduce the proportion of production in which high levels of
energy and material are consumed, and to replace inefficient types of production with new ones that
are based on high technology, innovations and new materials. Structural adjustments of industry are
carried out in accordance with the Programme for Development of Industrial Complex of the Republic
of Belarus for the period to 2020, which prioritises the development of advanced high-tech and
energy-saving industrial sub-sectors, and of export-oriented and import-substituting industries.
The National Strategy for Sustainable Socio-Economic Development of Belarus for the period to 2030
was adopted in February 2015. The strategy is based on the previous government strategy, which
covered the period to 2020. The implementation of the strategy is specified in the State Programme on
Socio-Economic Development for 2016–2020.

BELARUS 2016 | 05
2. Education and training
2.1 Trends and challenges
The multi-indicator cluster survey of the status of children and women that was organised by the
National Statistics Committee (Belstat) in 2012 suggests that the literacy rate of young people aged
15–24 years is 100%, with no differences in terms of place of residence, region or social situation. The
only available data on adult literacy (15+ years), which dates from 2009 (based on census data),
indicates a very high level of literacy, at 99.6%. The latest available information on the structure of the
population by educational attainment is also based on the census of 20091.
As regards the education system, gross enrolment rates in both primary and secondary education are
close to 100%. One-third of the adult population is estimated to have tertiary education, around 40%
has VET education and 25% upper secondary education. In 2014 the share of upper secondary
students in VET pathways was 42.8%.
In May 2015, Belarus’s application to join the Bologna Process was accepted by the ministerial
meeting of the EHEA, and a roadmap for reforms in higher education endorsed. A progress report by
the Bologna Follow-Up Group is due in 2018. Joining the Bologna Process opens new opportunities
for Belarus to move towards better integration of its higher education system with the EHEA. The
roadmap includes developing the NQF, guaranteeing academic freedom, increasing the autonomy of
universities, improving students’ participation in university councils, increasing the mobility of teachers
and students, and improving the quality assurance of higher education.
In May 2016 the ETF conducted a joint seminar with the Council of Europe on how to move forward
with the NQF implementation in Belarus. The government stressed the importance of a gradual
change and reform of the qualification system while preserving strong national traditions and learning
actively from international practice. The new EU-financed project on Employment and VET (2017–
2020) will contribute to the NQF implementation as well as to developing and piloting new
qualifications in Belarus.
The World Bank project in the education sector (launched in 2016) aims to strengthen the education
management information system (EMIS) and will also support Belarus’s participation in the next round
of the Programme for International Student Assessment (PISA) in 2018. It is therefore expected that
new data and information on the quality of the education and training system will be available in the
coming years.
2.2 Education and training policy and institutional setting
VET is state regulated, and is managed by the Ministry of Education, by other ministries and by state
authorities/organisations at national, regional and local levels. The Ministry of Education governs the
VET system through six regional departments of education and the Education Committee of Minsk
City. The Republican Institute of Vocational Education (RIPO) is responsible for the development of
national standards and training materials, research and analysis on VET, VET teacher in-service
training and other support and methodological work related to VET. It is the largest VET agency in the
post-Soviet countries. It has strong institutional and human resource capacity to support VET policy
development and implementation, and has been appointed as a reference institute on VET by the CIS.
Belarus has succeeded in improving its VET system in recent years, despite only limited international
assistance and cooperation. VET decision makers have applied a blend of continuity and change: they
1 Source: www.belstat.gov.by/ofitsialnaya-statistika/bazy-dannyh/baza-dannyh-po-statistike-naseleniya/perepis-naseleniya-2009-goda/index.php?sphrase_id=105628

BELARUS 2016 | 06
have preserved the VET system’s characteristics and, in parallel, modernised VET provision by
equipping training providers with new technologies and machinery, retraining teachers and updating
national curricula and standards. VET institutions have sought to actively learn from developments in
the EU and establish partnerships with other countries. Participation in international skills competitions
(including World Skills Belarus) has contributed to an improvement in the image and attractiveness of
VET.
Restructuring of the VET school network has led to a reduction of the number of schools and learners.
In 2015/16 there were 161 technical vocational schools, 172 specialised secondary schools (including
12 private schools), 17 pedagogical learning centres and 41 structural units of higher education
institutions (data from RIPO, 2016). After completing general secondary education, about 55% of
graduates continue their studies in higher education, about 25% go to specialised (professional)
secondary schools and about 17% progress to technical vocational schools. This two-level (pre-
university) VET system explains the high participation rates in VET.
Public expenditure on education has declined slightly, from 6% in 2011 to 5% in 2014. VET financing
accounted for 9.8% of the total education expenditure. Belarus developed a proposal on an NQF in
2015, but has not yet formally approved any documents. Social partners’ participation in overall policy
development and implementation is still very limited.
The scope and structure of VET are defined annually by the ‘state order’ (government-financed
enrolment plan) for the training of workers and specialists, taking into account the current labour
market situation, the regional demography and the capacity of educational establishments. Since
participation in courses in the initial VET system is based on a contractual agreement, graduates are
channelled into employment after leaving school. This practice has a long tradition, but current
analysis indicates a trend towards declining job retention of young workers. Poor job retention can be
caused by a range of factors. On the one hand, professional guidance may be ineffective, and
sometimes there is inadequate matching between the requirements of employers and graduates’
learning outcomes. On the other hand, jobs are characterised by a low level of competitiveness, owing
to low wages and the inadequacy of social protection packages.
In 2015 and 2016 a number of government decrees and decisions that regulate and have an impact
on both education and employment policies have been adopted (ETF, 2016). The guiding strategy
document for the education sector is the State Programme on Education and Youth Policy adopted by
Government Decree No 250 on 28 March 2016. It covers all education levels, including general, VET
and higher education.
3. Labour market and employment
3.1 Trends and challenges
It is difficult to assess the labour market situation in Belarus, as data from the LFS is not yet published
and available for analysis. Belstat has conducted the LFS on a quarterly basis since 2012, but the
distribution and use of the data is highly restricted, and is available only to selected government
officials. This limitation adversely affects both the understanding and the comparability of data within
the international context. The publication of the LFS data has been delayed. The authorities report that
the data will be made public in 2017, and this will allow a better overview of labour market
developments and international comparability.
According to the 2009 census, the unemployment rate was 6.1%. The discrepancy between the
unemployment rate from administrative records and that from the census data led the Belarusian
authorities to launch an LFS, with technical assistance from the World Bank, with a view to capturing a

BELARUS 2016 | 07
more reliable picture of the labour market and employment. Experts estimate that the real
unemployment rate is around 5–6%.
Data from the International Labour Organisation (ILO) show that activity rates in Belarus are high, and
that they increased from 76.4% in 2006 to 82.1% in 2015. Figures for 2015 show a higher economic
activity rate for women (85.5%) than for men (78.9%). National data set the activity rate at 73% in
2015 (Belstat, 2016). The differences between national and international (ILO) estimates may reflect
the early retirement regulations (for both women and men) in Belarus as well as aspects of the
methodologies for collecting and processing the data. Employment rates are also high, at over 80%.
The official unemployment rate, which is currently based on registered unemployment figures from
regional labour, employment and social protection offices, is very low (1%), but it doubled in 2015 (in
2014 it was 0.5%), which could indicate that the economic slowdown has led to the loss of many jobs
and also increased the real unemployment rate in the country. Similar trends on the decreasing
number of vacancies and the increasing number of unemployed jobseekers are also reported by
private recruitment agencies such as Rabota.tut.by (https://jobs.tut.by). The economic crisis impacted
the Belarusian labour market in 2015 and 2016. Job creation declined rapidly in the first half of 2016,
and the data for 2015 showed a large increase in the number of employees on involuntary unpaid
leave or working part-time2.
Administrative data on unemployment show that the real-time unemployment rate is around six times
higher than the annual average, given the average duration of unemployment, which is 2.9 months.
The inadequate level of unemployment benefit (around EUR 10 per month in December 2015) does
not encourage unemployed people to register. Moreover, most of the vacancies reported to the
employment services are not attractive to many jobseekers, as they are mainly low-paid jobs requiring
low-level qualifications (Vankevich, 2016).
The Ministry of Labour and Social Protection and regional employment offices have a portal
(www.gsz.gov.by) for labour market information, which includes vacancy information and the
opportunity for employers to register jobs online. It also allows jobseekers to upload their СVs. This
portal was reported to have had 2 million hits in 2015. The largest vacancy and recruitment portal is
privately owned and managed by Rabota.tut.by. It includes over 1.2 million CVs and 15 800 vacancies
(September 2016), and has an average of 35 million hits per month. The portal also includes various
analyses of vacancies, and placements, guidance and counselling information for jobseekers.
The number of workers employed in the services sector grew from 55.8% in 2011 to 59.2% in 2015.
Employment in agriculture decreased slightly (9.7% in 2015), as it did in industry (31.1% in 2015).
Employment has been steadily increasing in the private sector and decreasing in the public/state
sector, although the share of employment in the private sector is among the lowest in the region. In
the period 2010–2015, employment in the state sector decreased from 44.7% to 39.3%, as a result of
labour outflow to the private sector, while over the same period, employment in the private sector
increased from 53.6% to 57.3% and employment in foreign-owned companies increased from 1.7% to
3.4% (Belstat, 2016). However, data on private sector employment also includes limited and joint
stock companies, in which government ownership can reach 99% (Vankevich, 2016). Therefore, it can
be concluded that employment in the public sector and state-owned enterprises predominates in the
Belarusian labour market, and the real share of private sector employment requires further research.
As indicated above, labour turnover in Belarus is very high, at 51.3% in 2014 (Vankevich, 2016).
According to the data, the main reasons for the low retention of employees are the end of employment
contracts and dismissal for disciplinary reasons. The natural outflow of employees remains very low
(below 1.5%). Although the total number of individuals employed is gradually declining, employers
2 Source: Case Belarus, 2016

BELARUS 2016 | 08
tend to recruit more or less the same number of new staff for the same jobs. Such a high turnover is
likely to be decreasing the productivity of enterprises and increasing their costs on staff training, skills
upgrading and recruitment.
Despite the severe decline of GDP in the 1990s, the number of people employed in Belarus did not
decrease proportionally, unlike the situation in most of the other post-Soviet countries and transition
economies. Belarus has preserved a high employment rate and the structure of the labour market has
remained virtually unchanged, based on a high number of large employers, inefficient and
unproductive industries and slow development of the SME sector. In this context, administrative data
from the employment authorities cannot be considered as an objective indicator of the real labour
demand.
There is no reliable data available on informal employment (Vankevich, 2016). There are a number of
employee categories that can be related to informal employment, such as individual entrepreneurs
and artisans. According to expert estimates (Vankevich, 2016), the share of informal employment is
not high, and remains below 8%.
OECD data (2013) indicate that 17.9% of Belarusian employers identify an inadequately educated
workforce as a major constraint for their competitiveness. Similar results were identified in a
Belarusian study in 2013, in which 19.8% of SMEs surveyed reported low skills levels and the low
quality of the workforce as obstacles for their business (IPM Research Center, 2013). These figures
are an indication of skill gaps. More in-depth analysis on the scale and nature of skills mismatch is
needed. The focus on manpower planning should move towards combining quantitative and
qualitative analyses on the dynamics of occupations and skills.
In order to strengthen skills anticipation and forecasting at national level, at the end of 2015 the
Belarusian government established a national working group on skills anticipation/forecasting involving
the key ministries (Ministry of Labour and Social Protection, Ministry of Education and Ministry of
Economy), expert organisations and businesses. Their work plan was approved by a government
decree in October 20153. The working group has charged the Ministry of Economy with leading the
skills anticipation work at national level. Another working group on enrolment planning was established
under the same decree. This group has developed a matrix on skills anticipation that includes three
modules: economy, labour market and professional education. The working groups have also
developed their work plans for the period 2015–2020.
In 2016 the ETF conducted a baseline study on the LMIS and skills anticipation, and this is a
comprehensive source of data and assessment of the current LMIS. The study produced an analysis
of the existing sources of labour market information in Belarus, the main actors in the system and the
legal framework. It also identified gaps and areas for improvement. The overall conclusion of the
analysis was that Belarus has a strong statistical and information base on labour market information
and that the data and information are regularly generated and used, particularly at macro level. Formal
structures (the recently appointed official working groups) and current practices (for example, the
Automatic System on Enrolment Planning) can become foundations for the skills anticipation system.
Information gaps were identified, for example regarding skills issues at enterprise/establishment level.
The main recommendations of the study are to develop modern skills anticipation approaches and
methodologies in order to gain a better understanding of future needs, to increase the dissemination
and use of labour market information among various stakeholders and users, and to further develop
3 The work plan on short-term planning of training and improvement of medium- and long-term forecasting staffing needs as of 19.10.2015 # 05 / 225-1218, approved by the Deputy Prime Minister of the Republic of Belarus Kochanova N.I. The compositions of the two working groups in the respective directions approved by the Decree of the Ministry of Economy, Ministry of Labour and Social Protection, Ministry of Education, 30 October 2015 No 62/68/125.

BELARUS 2016 | 09
information sources (Vankevich, 2016). Many of the recommendations will be followed up by the
upcoming EU-financed project on Employment and VET in Belarus, which has a substantial labour
market information component.
3.2 Employment policy and institutional setting
The Ministry of Labour and Social Protection leads employment policy in Belarus. The employment
services function is delegated to the departments of labour, employment and social protection in
regional administrations. The Scientific Institute of Labour and Social Protection supports the ministry
in evidence collection and analyses. Formal structures for social partnership and dialogue are in place
and a number of social partner organisations exist. However, the dominant role of the government in
the economy and labour market has reduced the need for social partner involvement, although there is
a growing awareness of the importance of involving social partners regularly in all education and
employment policy discussions and development.
The government adopted a new State Programme on Social Protection and Employment Promotion
for 2016–2020 by Council of Ministers Decree No 73 of 30 January 2016. The programme includes
funding and measures on active and passive labour market policies, occupational safety and health,
and specific measures targeting vulnerable groups, particularly people with disabilities and their social
inclusion. The programme is implemented by the Ministry of Labour and Social Protection and its
regional employment offices. However, given the specific features of the Belarusian labour market, it is
difficult to assess either the efficiency of the services provided by the regional employment offices or
the impact of the state employment policy based only on quantitative data and statistics. Therefore,
further research and analysis is needed in this area.
Belarus has maintained a number of features from the Soviet period in managing its labour force. One
is the placement of graduates for a two-year assignment in public sector or state-owned enterprises.
This is compulsory for students who have studied free of charge on government-financed training
places in higher education and specialised secondary education. Such a scheme is no longer likely to
work when, and if, the economy is privatised and the share of public employment decreases.
Nevertheless, at the moment the system provides guaranteed first jobs for a large number of young
people, thus reducing youth unemployment.

BELARUS 2016 | 10
ANNEXES
Statistical annex
This annex reports annual data from 2011 and 2015 or the last available year.
Indicator 2011 2015
1 Total population (000) 9 481 9 481
2 Relative size of youth population (age group 15–24) (%)(1) 20.0 16.6
3 Youth dependency ratio (%) 21.0 23.0
4 Old-age dependency ratio (%) 19.7 20.0
5 Global Competitiveness Index Rank N.A. N.A.
Score N.A. N.A.
6 GDP growth rate (%) 5.5 -3.9
7 GDP per capita (PPP) (current international $) 16 603.4 17 660.9
8 GDP by sector (%) Agriculture added value 9.4 7.8
Industry added value 42.7 40.1
Services added value 47.8 52.1
9 Poverty headcount ratio at $3.10 a day (2011 PPP) (%) 0.0 0.0 (2012)
10 Gini index (%) 26.5 26.0 (2012)
11 Educational attainment of adult population (aged 15+) (%)
Low M.D. M.D.
Medium M.D. M.D.
High M.D. M.D.
12 Gross enrolment rates in secondary education (%) 106.3 107.0 (2014)
13 Share of VET students in secondary education (%) 15.8 13.3 (2014)
14 Gross enrolment rates in upper secondary education (%) 120.8 113.2 (2014)
15 Share of VET students in upper secondary education (%) 42.7 42.8 (2014)
16 Low achievement in reading, mathematics and science – PISA (%)
Reading N.A. N.A.
Mathematics N.A. N.A.
Science N.A. N.A.
17 Participation in training/lifelong learning (age group 25–64) by sex (%)
Total M.D. M.D.
Male M.D. M.D.
Female M.D. M.D.
18 Early leavers from education and training (age group 18–24) by sex (%)
Total M.D. M.D.
Male M.D. M.D.
Female M.D. M.D.
19 Activity rates (aged 15+) by sex (%)(2) (3) Total 81.8 82.1
Male 78.0 78.9
Female 85.8 85.5
BELARUS 2016 | 11
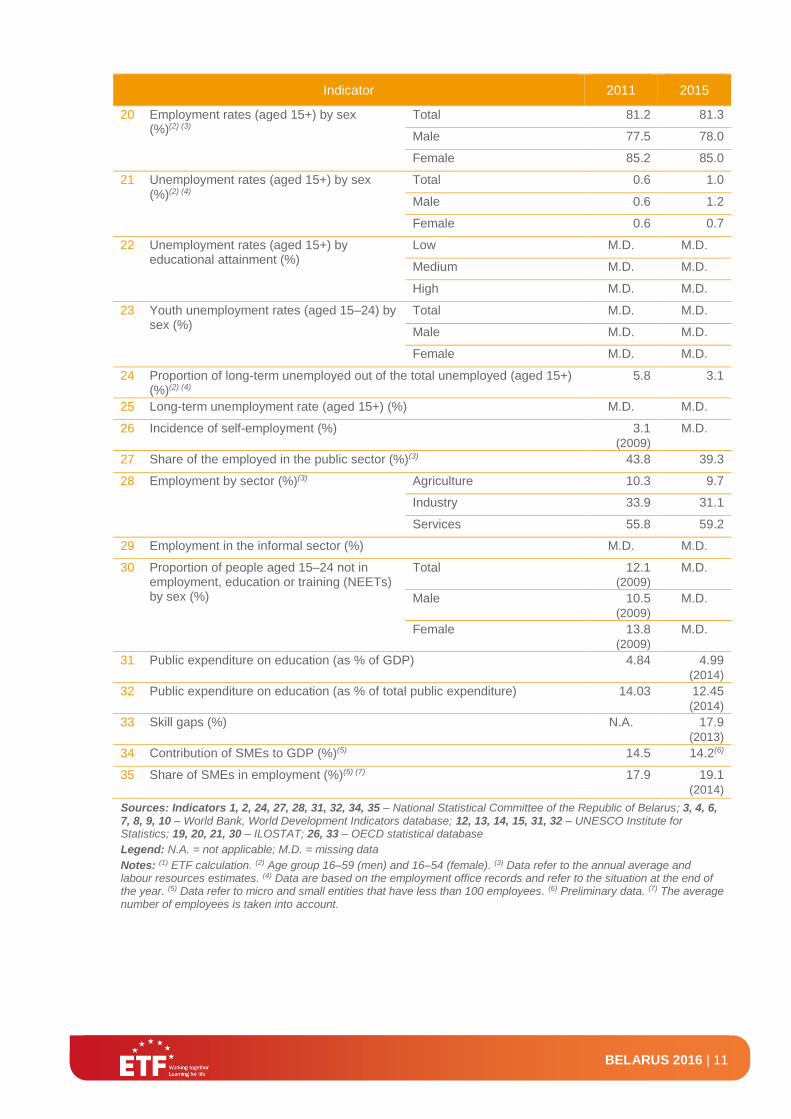
Indicator 2011 2015
20 Employment rates (aged 15+) by sex (%)(2) (3)
Total 81.2 81.3
Male 77.5 78.0
Female 85.2 85.0
21 Unemployment rates (aged 15+) by sex (%)(2) (4)
Total 0.6 1.0
Male 0.6 1.2
Female 0.6 0.7
22 Unemployment rates (aged 15+) by educational attainment (%)
Low M.D. M.D.
Medium M.D. M.D.
High M.D. M.D.
23 Youth unemployment rates (aged 15–24) by sex (%)
Total M.D. M.D.
Male M.D. M.D.
Female M.D. M.D.
24 Proportion of long-term unemployed out of the total unemployed (aged 15+) (%)(2) (4)
5.8 3.1
25 Long-term unemployment rate (aged 15+) (%) M.D. M.D.
26 Incidence of self-employment (%) 3.1 (2009)
M.D.
27 Share of the employed in the public sector (%)(3) 43.8 39.3
28 Employment by sector (%)(3) Agriculture 10.3 9.7
Industry 33.9 31.1
Services 55.8 59.2
29 Employment in the informal sector (%) M.D. M.D.
30 Proportion of people aged 15–24 not in employment, education or training (NEETs) by sex (%)
Total 12.1 (2009)
M.D.
Male 10.5 (2009)
M.D.
Female 13.8 (2009)
M.D.
31 Public expenditure on education (as % of GDP) 4.84 4.99 (2014)
32 Public expenditure on education (as % of total public expenditure) 14.03 12.45 (2014)
33 Skill gaps (%) N.A. 17.9 (2013)
34 Contribution of SMEs to GDP (%)(5) 14.5 14.2(6)
35 Share of SMEs in employment (%)(5) (7) 17.9 19.1 (2014)
Sources: Indicators 1, 2, 24, 27, 28, 31, 32, 34, 35 – National Statistical Committee of the Republic of Belarus; 3, 4, 6, 7, 8, 9, 10 – World Bank, World Development Indicators database; 12, 13, 14, 15, 31, 32 – UNESCO Institute for Statistics; 19, 20, 21, 30 – ILOSTAT; 26, 33 – OECD statistical database
Legend: N.A. = not applicable; M.D. = missing data
Notes: (1) ETF calculation. (2) Age group 16–59 (men) and 16–54 (female). (3) Data refer to the annual average and labour resources estimates. (4) Data are based on the employment office records and refer to the situation at the end of the year. (5) Data refer to micro and small entities that have less than 100 employees. (6) Preliminary data. (7) The average number of employees is taken into account.

BELARUS 2016 | 12
Definition of indicators
Description Definition
1 Total population (000) The total population is estimated as the number of persons having their usual residence in a country on 1 January of the respective year. When information on the usually resident population is not available, legal or registered residents can be considered.
2 Relative size of youth population (age group 15–24) (%)
The ratio of the youth population (aged 15–24) to the working-age population (usually aged 15–64 or 15–74).
3 Youth dependency ratio (%) The ratio of younger dependents (people younger than 15) to the working-age population (those in the 15–64 age group).
4 Old-age dependency ratio (%) The ratio of older dependents (people older than 64) to the working-age population (those in the 15–64 age group).
5 Global Competitiveness Index The Global Competitiveness Index assesses the competitiveness landscape, providing insight into the drivers of countries’ productivity and prosperity. It is expressed as a score on a 1 to 7 scale, with 7 being the most desirable outcome.
6 GDP growth rate (%) The annual percentage growth rate of GDP at market prices based on constant local currency.
7 GDP per capita (PPP) (current international $)
The market value of all final goods and services produced within a country in a given period of time (GDP), divided by the total population and converted into international dollars using purchasing power parity (PPP) rates.
8 GDP by sector (%) The share of value added from agriculture, industry and services.
9 Poverty headcount ratio at $2 a day (PPP) (%)
The percentage of the population living on less than $2.00 a day at 2005 international prices.
10 Gini index (%) A Gini index measures the extent to which the distribution of income (or, in some cases, consumption expenditure) among individuals or households within an economy deviates from a perfectly equal distribution. A Gini index of 0 represents perfect equality, while an index of 100 implies perfect inequality.
11 Educational attainment of adult population (aged 25–64 or 15+) (%)
Educational attainment refers to the highest educational level achieved by individuals expressed as a percentage of all persons in that age group.
12 Gross enrolment rates in secondary education (%)
The number of students enrolled in a given level of education, regardless of age, expressed as a percentage of the official school-age population corresponding to the same level of education.
13 Share of VET students in secondary education (%)
The proportion of VET students in secondary education out of the total number of pupils and students in secondary education (general + VET).
14 Gross enrolment rates in upper secondary education (%)
The number of students enrolled in a given level of education, regardless of age, expressed as a percentage of the official school-age population corresponding to the same level of education.
15 Share of VET students in upper secondary education (%)
The proportion of VET students in upper secondary education out of the total number of pupils and students in upper secondary education (general education + VET).
16 Low achievement in reading, mathematics and science – PISA (%)
The share of 15-year-olds failing to reach level 2 in reading, mathematics and science.
17 Participation in training/lifelong learning (age group 25–64) by sex (%)
The share of persons aged 25–64 who stated that they had received education or training in the four weeks preceding the (LFS) survey.

BELARUS 2016 | 13
Description Definition
18 Early leavers from education and training (age group 18–24) by sex (%)
The percentage of the population aged 18–24 with at most lower secondary education who were not in further education or training during the four weeks preceding the (LFS) survey. Lower secondary education refers to ISCED 1997 levels 0–3C short for data up to 2013 and to ISCED 2011 levels 0–2 for data from 2014 onwards.
19 Activity rates (aged 15+) by sex (%)
Activity rates represent the labour force as a percentage of the working-age population.
20 Employment rates (aged 15+) by sex (%)
Employment rates represent persons in employment as a percentage of the working-age population.
21 Unemployment rates (aged 15+) by sex (%)
Unemployment rates represent unemployed persons as a percentage of the labour force.
22 Unemployment rates (aged 15+) by educational attainment (%)
Educational levels refer to the highest educational level successfully completed. Three levels are considered: low (ISCED levels 0–2); medium (ISCED levels 3–4); and high (ISCED 1997 levels 5–6 and ISCED 2011 levels 5–8).
23 Youth unemployment rates (aged 15–24) by sex (%)
Youth unemployment rates represent young unemployed persons (aged 15–24) as a percentage of the labour force (15–24).
24 Proportion of long-term unemployed out of the total unemployed (aged 15+) (%)
The number of unemployed persons aged 15+ who are long-term unemployed (12 months or more) as a percentage of unemployed persons aged 15+.
25 Long-term unemployment rate (aged 15+) (%)
The number of unemployed persons aged 15+ who are long-term unemployed (12 months or more) as a percentage of the labour force aged 15+.
26 Incidence of self-employment (%) The share of self-employed as a proportion of the total employed. Self-employment includes employers, own-account workers, members of producers’ cooperatives and contributing family workers.
27 Share of the employed in the public sector (%)
The share of those employed in the public sector as a proportion of the total employed.
28 Employment by sector (%) The share of those employed in agriculture, industry and services.
29 Employment in the informal sector The share of persons employed in the informal sector in total non-agricultural employment.
30 Proportion of people aged 15–24 not in employment, education or training (NEETs) (%)
The percentage of the population of a given age group who are not employed and not involved in further education or training.
31 Public expenditure on education (as % of GDP)
Public expenditure on education expressed as a percentage of GDP. Generally, the public sector funds education either by directly bearing the current and capital expenses of educational institutions, or by supporting students and their families with scholarships and public loans, as well as by transferring public subsidies for educational activities to private firms or non-profit organisations. Both types of transactions together are reported as total public expenditure on education.
32 Public expenditure on education (as % of total public expenditure)
Public expenditure on education expressed as a percentage of total public expenditure. Generally, the public sector funds education either by directly bearing the current and capital expenses of educational institutions, or by supporting students and their families with scholarships and public loans as well as by transferring public subsidies for educational activities to private firms or non-profit organisations. Both types of transactions together are reported as total public expenditure on education.
33 Skill gaps (%) The percentage of firms identifying an inadequately educated workforce as a major constraint.
34 Contribution of SMEs to GDP (%) The share of value added from small and medium-sized businesses.
35 Share of SMEs in employment (%)
The share of persons employed in small and medium-sized businesses.

BELARUS 2016 | 14
ABBREVIATIONS AND ACRONYMS
Belstat National Statistics Committee
CIS Commonwealth of Independent States
EHEA European Higher Education Area
ETF European Training Foundation
GDP Gross domestic product
ILO International Labour Organisation
LFS Labour force survey
LMIS Labour market information system
NEET Not in employment, education or training
NQF National qualifications framework
PISA Programme for International Student Assessment
PPP Purchasing power parity
RIPO Republican Institute of Vocational Education
SMEs Small and medium-sized enterprises
VET Vocational education and training

BELARUS 2016 | 15
REFERENCES
Belstat, Annual Statistical Yearbook, 2016.
CASE Belarus, ‘Economic Trends in Belarus’ (in Russian), September 2016.
ETF (European Training Foundation), ‘Torino Process 2016–17: Belarus’, Draft, 2016.
IPM Research Center, Business in Belarus 2013: Status, Trends, Perspectives, 2013.
Vankevich, A., ‘LMIS and Skills Anticipation in Belarus’, ETF, 2016.

FOR FURTHER INFORMATION ABOUT OUR ACTIVITIES PLEASE CONTACT:
COMMUNICATION DEPARTMENT EUROPEAN TRAINING FOUNDATION VIALE SETTIMIO SEVERO 65I - 10133 TORINO
E: [email protected] T: +39 011 6302222 F: +39 011 6302200 WWW.ETF.EUROPA.EU


