BEHAVIOURAL CONSEQUENCES OF CHANGES TO...
31
1 BEHAVIOURAL CONSEQUENCES OF CHANGES TO PERFORMANCE BASED COMPENSATION SYSTEMS By Mandy M Cheng The University of New South Wales Susan M. Robertson RMIT Axel K-D Schulz* University of Melbourne * Corresponding Author Axel Schulz Department of Accounting and Business Information Systems The University of Melbourne Victoria 3010, Australia Ph +61 3 83447665 Fax +61 2 93492397 Email [email protected] (Draft – Please do not quote without permission of the authors)
-
Upload
nguyentram -
Category
Documents
-
view
213 -
download
0
Transcript of BEHAVIOURAL CONSEQUENCES OF CHANGES TO...

1
BEHAVIOURAL CONSEQUENCES OF CHANGES TO PERFORMANCE
BASED COMPENSATION SYSTEMS
By
Mandy M Cheng
The University of New South Wales
Susan M. Robertson
RMIT
Axel K-D Schulz*
University of Melbourne
* Corresponding Author Axel Schulz Department of Accounting and Business Information Systems The University of Melbourne Victoria 3010, Australia Ph +61 3 83447665 Fax +61 2 93492397
Email [email protected]
(Draft – Please do not quote without permission of the authors)

2
BEHAVIOURAL CONSEQUENCES OF CHANGES TO PERFORMANCE
BASED COMPENSATION SYSTEMS
ABSTRACT
This study investigates how changes in performance based compensation systems
(PBCS) affect managerial effort allocation and commitment to the system. In
particular we empirically examined how the introduction of a new measure and the
associated change in bonus weighting affected the individual’s effort choice.
Consistent with our prior expectations and prior literature we found changes in bonus
weights to have the desired effects on changes in effort allocation. However, also
consistent with our expectations but not considered in prior literature, we found
dysfunctional consequences of the change in terms of both effort allocation and
managerial commitment to the system. Our results show that, while necessary,
changes to the PBCS may not be costless.
Our results have direct consequences to designers of PBCSs as they need to be aware
of potential negative consequences of changes made to the system.
Keywords: Performance Based Compensation Systems, Compensation Weights,
Expectancy Theory

3
I. Introduction
One of the primary roles performance-based compensation systems (PBCS) fulfil is to
persuade individuals to pursue the strategic goals and priorities of their organisation.
A fundamental underpinning of research into PBCS design is the proposition that
these systems must be appropriately aligned with organisational structure, strategic
priorities and business processes if an organisation is to successfully achieve its
strategic goals (Abernethy, 2001; Miles and Snow, 1992; Fisher, 1998). Within both
the practitioner and academic literature, articles attempting to identify attributes of
PBCSs that represent the best “fit” for different organisational environments abound
(For instance, see Abernethy and Lillis, 2001; Chapman, 1998; McAdam and Braillie,
2002).
In recent times, organisational environments have become progressively complex and
dynamic. Global competition, significant technological advancements, a greater
emphasis on strategic priorities such as time, quality, and customer service and
knowledge acquisition have created innumerable competitive opportunities, which in
turn have led to substantial change, and in particular strategic change for many
organisations.
Not surprisingly, researchers and practitioners are continually encouraging
organisations to constantly improve, adapt or modify their PBCSs (for instance, see
Bih-Ru and Fredendall, 2002; McAdam and Braillie, 2002; Cooke, 2002; Frigo, 2002
a & b; Stivers and Joyce, 2000; Bourne et al, 2000; O’Mara et al, 1998; Russell, 1997;
Feurer and Chaharbaghi, 1995; Neely et al, 1994) to ensure that these systems keep
pace with their increasingly complex and dynamic organisational environments.

4
Innumerable articles have been written both in practitioner and academic journals,
which provide anything from simple guidelines (e.g. Anderson and Fagerhaug, 2002;
Bourne et al , 2000; Upton, 1998; Azzone and Noci, 1998; Neely et al, 1995; Sinclair
and Zairi, 1995; Freurer and Chaharbaghi, 1995; Vitale et al, 1994) to more elaborate
models (e.g. Medori and Steeple, 2000; Kaplan and Norton, 1992, 1996 and 2001) for
choosing appropriate performance measures in different organisational settings. The
development of the Balanced Scorecard (Norton and Kaplan, 1992, 1996) is one of
the most well known of these models.
Evidence indicates that organisations are taking on board the recommendations of
both practitioners and researchers to continually modify their PBCSs. Findings from
the most recently published Performance Measurement Survey (Frigo 2001)
conducted by the Cost Management Group of the IMA reveal that 80% of respondents
reported that their businesses made changes to their performance-based compensation
systems during the last three years. 33% indicated that these changes represented a
“major overhaul” or “new performance-based compensation system”. Furthermore,
50% of respondents indicated that their organisations were currently in the process of
changing their PBCSs. Findings also indicated that 40% of respondents used or were
intending to use the Balanced Scorecard within the next year. In addition, users of the
Balanced Scorecard tended to have a much greater mix of performance measures, and
66% of respondents agreed that the Balanced Scorecard helped identify new
measures. These findings together provide clear indications that performance-based
compensation system design is a dynamic, shifting process.

5
Very little research however has been undertaken on the behavioural outcomes of
changing PBCSs. There appears to be an assumption that, if changes made to a PBCS
result in that system becoming more appropriately aligned with strategic priorities and
goals, behaviour will also change appropriately. It is almost taken for granted that
individuals will be better able to understand the behaviours required to achieve their
organisation’s strategic goals, and will be motivated to do so. There will be no
residual effects of the old system, nor will there be any negative effects arising from
change itself. The purpose of this study is to examine the impact of changing a PBCS
on a particularly important type of behaviour – individual effort allocation decisions.
The study examines firstly whether individuals do redirect their effort in ways that are
consistent with the changes to the PBCS. Secondly, the study explores the potential
for dysfunctional behavioural resulting from changing PBCSs.
Changes to PBCSs can come in many forms. Within the context of this study, two
types of modifications will be emphasised – changes to the types of performance
measures included within the PBCS, and changes to the weightings placed on those
measures when they are used for compensation determination.
In particular this study investigates:
1. The link between the introduction of a new performance measure and an
individual’s effort allocation decision.
2. The link between the introduction of new weightings to performance measures
and an individual’s effort allocation decision.
3. The impact on effort allocation decision of removing weightings from existing
performance measures.

6
4. The impact of PBCS change in general on overall effort allocation.
5. The impact of PBCS change in general on commitment to the PBCS.
The answers to these questions contribute to our knowledge of the behavioural
influences implicit in PBCS design. Given the need for firms to continually update
and modify their PBCSs, and the importance of this task to the successful
implementation of strategy, it is critical that first, change in PBCSs does lead to
change in behaviour, and second, unintended and unwanted behaviours are identified
and take into consideration.
II. Theoretical Framework
The role of performance-based compensation systems
Most PBCSs comprise three elements 1) performance measures, 2) a target level of
performance attached to each performance measure and 3) a weighting used to
determine the amount of compensation received for a given target level of
performance. The role of PBCSs is well established in the literature. Two related
theoretical perspectives – goal-setting theory and expectancy theory – provide a well-
documented framework in which to outline the role of performance-based
compensation systems. Goal-setting theory suggests that performance measures and
targets that represent goals that are specific, challenging but achievable provide a
powerful mechanism by which organisations can provide information to direct
managers towards the types of work behaviours and outcomes that lead to strategy
achievement (Locke and Latham 1990). Managers are expected to use the
information contained in the measures on which their performance is based as a

7
means for setting their own work goals and ultimately and most importantly effort
allocation choices. Vroom, (1964) was the first to establish an explicit expectancy
theory model. Numerous models representing Vroom's theory have been developed
and used within many research disciplines (see for instance Campbell and Pritchard,
1976; Ronen and Livingstone, 1975; Harrell and Stahl, 1986), however the underlying
propositions of all the models remain the same. Expectancy theory argues that an
individual’s motivation to exert effort towards a particular activity or task will be
determined by the multiplicative relationship of three factors – expectancy,
instrumentality and valence. Expectancy refers to the degree to which an individual
perceives that their effort will lead to valued performance. Instrumentality relates to
the extent to which an individual believes that particular outcomes1 are tied to
achievement of valued performance. Finally, valence refers to the degree to which an
individual desires those outcomes2. Within the expectancy theory framework, it can
be argued that the use of performance measures and targets3 contained in the PBCS
provide individuals with an understanding of the relationship between their effort
choices and valued performance, hence expectancy and instrumentality is enhanced.
The attachment of rewards to targeted performance, through the use of compensation
weightings, enhances instrumentality and valence. Thus the use of PBCSs is able to
influence an individual’s motivation to exert effort on a particular activity and as a
result their effort allocation decisions.
1 These outcomes have also been categorized as either first or second level outcomes (Galbraith and Cummings 1969, House, 1974). First level outcomes tend to be represented by performance itself – e.g. goal accomplishment. Second level outcomes are those that are expected to arise from first level outcomes – e.g. pay or promotion. 2 The literature also identifies two sources of valence – extrinsic and intrinsic valence. Sources of extrinsic valence are those outcomes that are formally mediated by the organisation, such as pay and promotion. Sources of intrinsic valence are those outcomes that come from the individual – such as self-esteem, accomplishment or self-fulfillment. 3 In keeping with goal setting theory it is assumed that these performance measures and targets would be specific, challenging but achievable.
8
Changing the Performance-Based Compensation System
When organisations choose to change their PBCSs, often in response to changes in
strategic priorities or goals, designers of PBCSs use the three elements of the system
to redirect and re-align individual effort to those activities that are most likely to result
in strategy achievement. To use a simple example, if product quality has become the
new strategic priority within an organisation, introducing a new measure, such as a
defect rate, sends signals to individuals that exerting effort on activities reflected by
that measure will lead to performance that is valued. Within the context of
expectancy theory, individuals will be provided with information that allows them to
better understand the effort allocation required to achieve desired performance.
Hence expectancy is enhanced, and individuals will be motivated to exert effort
towards those activities. Conversely removing a measure from the PBCS would send
signals that exerting effort on activities reflected by that measure, instead of those
measures still within the system, will not lead to performance that is as valued. As a
result expectancy would decrease. Decreasing or increasing the targeted level of
performance will also alter expectancy, as required performance becomes more or less
difficult to achieve, and thus more or less likely to be achieved.
Altering weightings attached to targeted performance allows designers of PBCSs to
change the valence or “attractiveness” of outcomes arising from a particular type and
level of effort expenditure (Mento, Cartledge and Locke, 1980; Mowen, Middlemist,
and Luther, 1981). For instance, if a particular performance measure target was
initially given a 60% weighting in the determination of compensation4 and this was
then changed to 20%, effort exerted on activities required to reach that target would

9
have less valence, and thus an individual would have less motivation to exert that
level of effort. For example, in an experimental study involving a loan-processing
task, Edminster and Locke (1987) found significant correlations between goal weights
set by subjects and their subsequent performance on three of their five performance
measures. While Edminster and Locke (1987) did not directly measure subjects’ effort
allocation, their result suggests that weightings in PBCSs is an important
consideration when subjects are striving towards achieving their performance target.
The framework outlined above provides arguments to suggest that when organisations
need to modify their PBCSs to reflect changes in strategic priorities and goals,
designers of these systems will reflect those changes through the removal or inclusion
of performance measures, adjustment of the targeted level of performance or
alterations in the weightings attached to measures. Most importantly, in light of the
aims of this study, individuals will alter the effort choices consistent with the changes
made to the system. These arguments form the basis for the development of a set of
hypotheses that test the relationship between a number of common changes in the
elements of PBCSs and an individual’s effort allocation decision. These changes
include 1) the inclusion of a new measure without a compensation weighting attached,
2) the inclusion of a new measure with a compensation weighing attached and 3) the
removal of a compensation weighting from an existing measure. These hypotheses
are presented in the following section.
4 This would mean that 60% of total compensation will be determined by reference to performance on this particular measure.

10
III. Hypothesis Development
This study investigates the impact of a change in the PBCS on individual behaviour.
Specifically we are interested to see whether the introduction and shifting of a
performance measure weight redirects individual effort and whether there are
dysfunctional consequences resulting from this change. Although these changes are
not strictly independent, we examine their effects separately.
Inclusion of a new measure
One of the most obvious changes that could be made to a PBCS would be the
inclusion of a new measure. Consistent with the discussion of the previous section,
the inclusion of a new performance measure and target5 would signal to individuals
that exerting effort on the activities underlying that measure would be likely to lead to
valued performance; hence expectancy that effort would lead to desired performance
would be strong. It would be expected that valence would also be positive, as
individuals would find the achievement of desired performance itself (a level 1
outcome) attractive. These two effects together would lead individuals to allocate
effort to activities underlying the new measure. Stated more formally,
H1: Individual effort allocated to activities underlying a new measure of
performance will be greater than zero.
5 The situation of a measure being introduced without a target of performance attached is not considered in this study as very few performance measures would be of this nature.

11
Inclusion of a new measure with compensation weightings attached
If compensation weightings were also attached to the new performance measure, it
would be expected that effort allocation to underlying activities would be greater than
if no weighting was attached to that measure. In this situation effort could lead to
both first and second level outcomes (performance achievement and compensation
respectively). Hence instrumentality and total valence would increase, and
individuals would choose to allocate relatively more effort to activities underlying the
new measure. These arguments lead to the following hypothesis.
H2: Individual effort allocated to activities underlying a new measure of
performance will be greater for measures linked to compensation weightings
than for measures that are not linked to compensation weightings
Removal of compensation weightings
It is also likely that a particular type of performance may continue to be measured, but
the link to compensation determination is removed. The discussion contained within
the preceding section suggests that if designers of PBCSs remove the compensation
weightings attached to existing performance measures, effort allocated to the activities
underlying that measure should decline. Note that effort allocation will not
necessarily decline to zero, as there could be some remaining valence still associated
with achievement of performance on those activities that have been valued in the past.
The preceding discussion leads to the following hypothesis.

12
H3: Individual effort allocated to activities underlying a particular measure of
performance will be lower when compensation weightings are removed then
when they remain attached to the measure.
The impact of change itself
While the preceding discussion addresses issues of individual changes to PBCSs, it is
possible that change in general may have behavioural implications for the effort
allocation decisions of individuals. When performance measurement systems are
consistent and stable over time, individuals are able to form a more complete
understanding of outcomes associated with their particular effort allocation choices
and consequently the type and amount of effort required to achieve desired
performance and subsequent outcomes is better understood. Conversely, when
change occurs in an individual’s PBCS links between effort choices and outcomes
become less easily understood and more uncertain. Hence a stable PBCS is likely to
be associated with higher expectancy that effort will lead to valued performance than
would a PBCS that has new elements. The implication of this is that when PBCSs
change, an individual’s motivation to exert effort would fall and thus the overall effort
they allocate to activities underlying performance measures would also decline.
Stated formally,
H4: Total individual effort allocated to activities represented by the PBCS will be
lower when elements in that system change.
It is further hypothesised that, when PBCSs exhibit change, the increased level of
uncertainty and subsequent fall in expectancy is likely to lead to reduced commitment

13
to the PBCS. Hollenbeck and Klein (1987) define goal commitment as the
determination to try for a goal continually over time. Commitment therefore reflects a
willingness to exert effort over the long-term. Hollenbeck and Klein argue that strong
goal commitment requires a high level of expectancy that effort will lead to goal
attainment. When expectancy is low, goals seem less attainable and thus the
willingness to continue to try for the goal will be low. Consistent with Hollenbeck and
Klein’s arguments, it is anticipated that when expectancy that effort will lead to
valued performance falls, commitment to the performance measures underlying the
PBCS will also decline. These arguments are represented by the following
hypothesis.
H5: Total individual commitment to the PBCS will be lower when elements in that
system change.
III. Research method
Overview of design
To test the proposed hypotheses we conducted an experiment using a 2 x (2) between
repeated design. The independent variable was the stability of the performance
measurement system (Stable Performance Weights – SPW or Changing Performance
Weights – CPW). The repeated measure represented the configuration of the
performance measurement system in the first period (where both treatment groups
received the same measures) and the second period (where treatment groups received
different weights). Subjects were randomly allocated to the treatment groups.

14
Subjects
A total of 46 subjects took part in the experiment. The subjects were completing a
part-time Master of Accounting degree at a major university. There were 24 males
and 22 females and their average age was 25 years (range 21 – 31). The subjects had
on average 2.6 years of work-experience.
As subjects were volunteers, we offered them a $25 incentive for taking part in the
experiment. The incentive was not tied to any aspect of task of task performance.
Experimental task
The experimental task consisted of three parts, experimental period one, period two
and manipulation test. Subjects assumed the role of a business unit manager of a large
international company, and were randomly assigned to one of the two experimental
groups (SPW or CPW). In part one all subjects were told that, prior to 2002, their
PBCS comprised one financial performance measure (measure F) and three non-
financial measures (NFA, NFB and NFC), which were linked equally to their annual
bonus.
In part two, a change in the PBCS initiated by the head office, however, saw the
introduction of a further non-financial measure (NFD) in 2003. In 2003 the
performance weights depended on the treatment groups, with SPW receiving the same
weights as in 2002 and CPW receiving equal annual bonus weighting for NFB, NFC,
NFD and F. The 2003 period also saw the introduction of the managers “pet” project,
which was not part of the formal PBCS.

15
Subjects were then asked to allocate up to 1,000 units of their effort between the four
performance measures in part one and between the five performance measures in
part two. The experiment was set up so that 1,000 units of effort was sufficient to
meet all measured aspects of the task and thus permit subsequent analysis of effort
allocation on each measure independently of all other measures.
To establish a clear linkage between effort and performance, subjects were told that,
based on their pervious year’s performance, there was a high level of certainty that
every 1 unit of effort allocated to these areas would result in 0.5 unit of output, with
the exception of the new measurement which had a higher level of uncertainty as no
previous year performance was available. Further, as previous literature has
suggested that different levels of difficulty associated with multiple performance
targets may affect individuals’ effort allocation among multiple performance targets
(e.g. Yearta, Maitlis and Briner 1995; Gilliland and Landis 1992), the same level of
performance target (100 output units) was set for each of the performance areas. In
addition to their effort allocation decisions, subjects were also asked to justify their
decision by writing a short comment to explain why they chose to allocate the amount
of effort units for each performance area.
The “pet” project was created to provide another avenue for managers to allocate
effort if they chose not to allocate it to one of the five measured aspects. As such it
provides a cost to the effort allocated by each subjects in the absence of a physical
necessity to exert effort.

16
Administrative procedures
Subjects received part one of the task upon commencement of the experiment. Once
subjects signalled to the researcher that they had completed the first effort allocation
in part one, they were given part two of the experimental task, which involved the
second effort allocation decision for subsequent year. Once subjects have completed
part two, the experimental instrument was collected and a post-test questionnaire (part
three), which contained a set of manipulation check and demographic type questions,
were administered, after which the subjects were thanked and incentive payment
distributed. The entire experimental session lasted on average 30 minutes.
Dependent variables
The overall dependent variable was the total amount of effort allocated to measured
aspects of the PBCS. In addition, we measured effort allocation on each of the
performance measures separately. Due to the repeated nature of the experiment, each
dependent variable was measured twice, once in part one again in part two of the
experiment. Furthermore, we also measured subjects’ commitment to the PBCS by
asking subjects to indicate, on a scale of 1 to 7, the degree to which they were
committed to achieve each of the five performance areas. The theoretical range of
commitment was therefore 5 (minimum commitment) to 35 (maximum commitment).
Independent variables
The overall independent variable was stability versus change in the PBCS. Recall that
both treatment groups received the same performance weights in part one. For part
two subjects in the treatment group receiving the same performance weights (SPW)

17
were told that the new performance measure (NFD) was not linked to their annual
bonus. In contrast, for part two subjects in the treatment group receiving the change
in performance weights (CPW) were told that while the new performance measure
(NFD) would now constitute 25% of their annual bonus, the existing performance
measure for Area A (NFA) would no longer be linked to their annual bonus.
Manipulation check
We used a total of three manipulation checks in this study. The first two checks were
conducted in relation to the subjects’ perception of reward weights used for the two
manipulated measures (NFA and NFD). The third check was to assess subjects’
perceptions of the personal opportunity (i.e. the “pet project”). A total of 6 subjects
failed either or both of the first two checks, while none of the subjects failed the third
check. The distribution of the 6 subjects failing the first two checks was almost
consistent across both treatment groups, with 4 subjects from SPW and 2 subjects
from the CPW treatment groups. While we report our tests in this study on the
complete data set, we also conducted all tests with these 6 subjects omitted from the
analysis. None of the results reported in this study changed as a result of omitting
these 6 subjects.
Finally, analyses were conducted on the demographic data collected in the post-test
questionnaire. No significant differences were found in the distribution of age,
gender, study program or work experience across the two treatment groups.
18
IV. Results
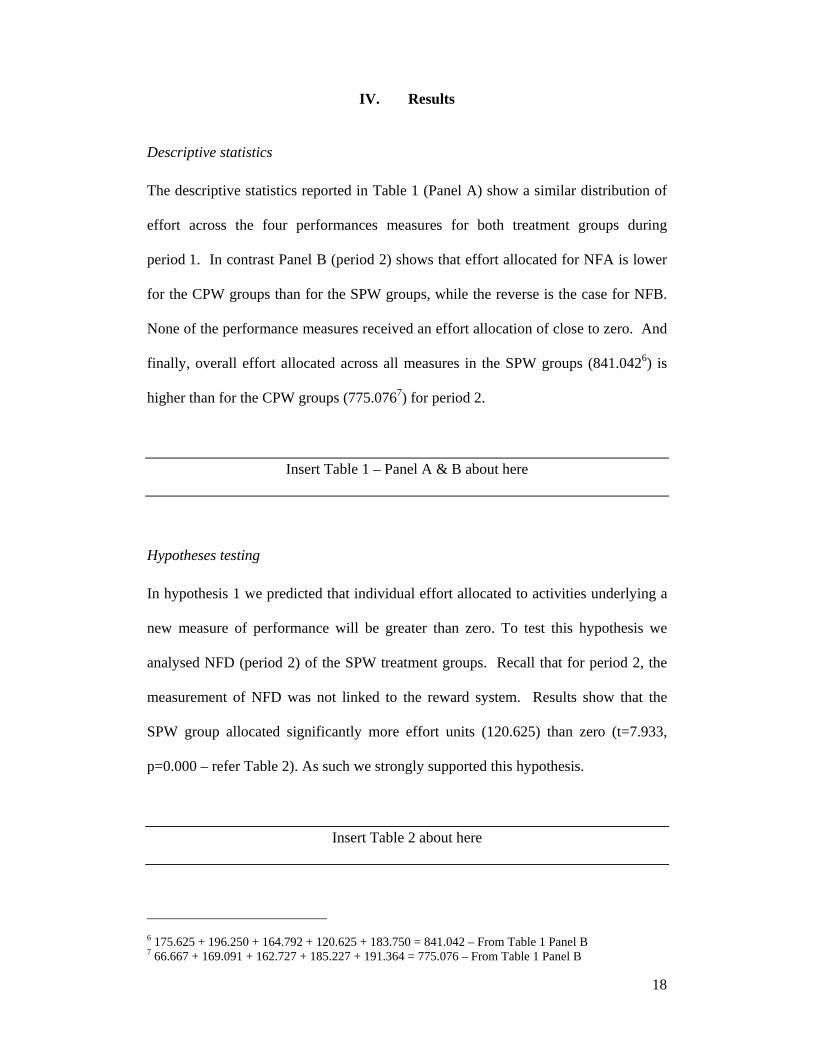
Descriptive statistics
The descriptive statistics reported in Table 1 (Panel A) show a similar distribution of
effort across the four performances measures for both treatment groups during
period 1. In contrast Panel B (period 2) shows that effort allocated for NFA is lower
for the CPW groups than for the SPW groups, while the reverse is the case for NFB.
None of the performance measures received an effort allocation of close to zero. And
finally, overall effort allocated across all measures in the SPW groups (841.0426) is
higher than for the CPW groups (775.0767) for period 2.
Insert Table 1 – Panel A & B about here
Hypotheses testing
In hypothesis 1 we predicted that individual effort allocated to activities underlying a
new measure of performance will be greater than zero. To test this hypothesis we
analysed NFD (period 2) of the SPW treatment groups. Recall that for period 2, the
measurement of NFD was not linked to the reward system. Results show that the
SPW group allocated significantly more effort units (120.625) than zero (t=7.933,
p=0.000 – refer Table 2). As such we strongly supported this hypothesis.
Insert Table 2 about here
6 175.625 + 196.250 + 164.792 + 120.625 + 183.750 = 841.042 – From Table 1 Panel B 7 66.667 + 169.091 + 162.727 + 185.227 + 191.364 = 775.076 – From Table 1 Panel B

19
For hypothesis 2 we predicted that individual effort allocated to activities underlying a
new measure of performance will be greater for measures linked to compensation
weightings than for measures that are not linked to compensation weightings. We
analysed NFD (period 2) to test this hypothesis. As discussed previously this measure
was newly introduced in period 2 to both treatment groups. The SPW received the
measure without a link to their reward system, while CPW not only received the
measure but also were told that the measure was tied to 25% of their bonus. The
difference in effort allocated by SPW compared to CPW represents the change
attributed to the introduction of the reward system link. The former allocated
significantly less effort units to the measure than the latter (SPW=120.625 vs.
CPW=185.227, t=3.241 p=0.002 – refer to Table 1 Panel B and Table 3). Hence
hypothesis 2 is supported.
Insert Table 3 about here
In hypothesis 3 we stipulated that individual effort allocated to activities underlying a
particular measure of performance will be lower when compensation weightings are
removed then when they remain attached to the measure. Table 1 (Panel A & B)
contains the descriptive statistics related to the amount of effort exerted by subjects in
terms of NFA. Recall that in period 2, the stable performance weight (SPW)
treatment group continued to receive a 25% weighting while the change performance
weight (CPW) treatment group saw the weighting drop to 0%. While both treatment
groups assigned approximately the same amount of effort in the first period (251.50
for SPW and 232.05 for CPW), in the second period the CPW treatment group
significantly reduced the amount of effort allocated to the task dimension measured

20
by NFA relative to the SPW treatment group (66.67 for CPW and 175.62 for SPW,
F=17.607, p=0.000 – refer Table 4). We thus support hypothesis 3.
Insert Table 4 about here
For hypothesis 4 we predicted that total individual effort allocated to activities
represented by the PBCS will be lower when elements in that system change. To test
this hypothesis we use the total amount of effort allocated to measured aspects of the
task. Recall that managers had the opportunity in period 2 to allocate effort not only
to measured aspects of the task but also unmeasured aspects, which were described as
their “pet project”. Results reported in Table 5 show that managers receiving stable
performance measures (in terms of their link to the reward system) are significantly
more likely to exert effort than managers receiving performance measures which are
changing in respect to their link with the reward system (SPW = 841.04 vs. CPW =
780.24, t=2.103, p=0.041). We thus support hypothesis 4
Insert Table 5 about here
And finally for hypothesis 5 we proposed that total individual commitment to the
PBCS would be lower when elements in that system change. To test hypothesis 5 we
examined the total amount of commitment reported by managers on all measures
(refer Table 6). The results show a significantly greater amount of commitment
reported by managers in the SPW treatment group (25.087) compared to the CPW
group (20.048, t=2.554, p=0.014). We thus support hypothesis 5.

21
Insert Table 6 about here
IV. Discussions and conclusions
Discussion of results
Results found in this study continue to support the mainstream accounting literature
both in terms of “what gets measured gets done” as well as in terms of “what gets
rewarded gets done”. Our findings show that managers are more likely to withhold
effort where incentive system weights are changed, which has not been traditionally
considered by designers of PBCSs. As any change in the performance measurement
system is likely to be accompanied by changes to the compensation system, it might
be necessary to consider potential costs associated with the potential consequence of
managers withholding effort.
In particular and unlike prior literature on PBCSs, we have considered the effect of
measurement and rewards separately. Our findings suggest that the introduction of a
new measure, even in the absence of explicit linkage to the compensation system,
have the effect of increasing managers’ effort allocation towards the associated
performance area. Conversely, the removal of a performance measure from the
compensation scheme does not necessarily result in managers reducing their relevant
effort allocation to zero. Rather, our results show that there may be some “residual
effect” whereby managers continue to allocate effort despite the lack of explicit
linkage between effort exertion and compensation. This residual effect is particularly

22
of concern to designers of PBCSs who are considering using compensation weighting
as a means of communicating strategic priorities to managers.
Furthermore, our results also show that managerial commitment to their PBCSs is
affected by changes in the reward system weights. Consistent with our expectations,
changes in the reward system weighting were accompanied by a general decline in
commitment reported by managers as they face changes in their PBCSs. This implies
that designers of PBCSs must carefully balance their desire to continuously improve
their reward system, and the potentially undesirable impact on managers’
commitment.
Research contributions
This study makes a fundamental contribution to our understanding concerning the
impact of introducing change to PBCSs on individual’s effort allocation decisions, by
providing empirical support for the proposition that changes in the PBCS is not
costless in motivational terms. As such, it adds anther dimension to aspects control
system designers have to consider in their quests for a better control system.
From the practitioner’s perspective, designers of PBCSs must consider the impact of
continuous changes on managers’ commitment and total effort exerted. For example,
our results suggest that modifications of PCBS must be accompanies by other
initiatives that can maintain or improve managers’ commitment to the new system.

23
Furthermore, minor adjustment to PCBS in the name of continuos improvement may
not always be appropriate, as the cost may outweigh the benefit for such changes.
From the perspective of researchers our study extends the expectancy theory to
incorporate multiple performance measures. Our result confirms that, given multiple
measures, the role of valence and instrumentality affects both the amount of effort
individuals allocate to individual performance areas (the direction of effort allocation)
as well as the total amount of effort managers choose to exert on behalf of the
organisation.
Limitations and future research directions
Several limitations to this study should also be noted. As this study is based on a
laboratory experiment, the task represents a simplified PBCS. As such, the task did
not include all the information potentially considered by managers in their effort
allocation. This study also only considered an externally imposed PBCS. Future
research could investigate how negotiation around both the types of measures and the
targets set for those measures influence managerial acceptance and effort allocation.
Further, as our study demonstrates that a “residual effect” may exist whereby
managers continue to allocate effort towards performance areas that are no longer tied
to their compensation scheme, future research could also examine more closely the
factors that affect managers’ decision to exert or withhold effort on performance areas
they have been excluded from their PBCS. Finally, future research could also
investigate the interaction between goal setting theory and expectancy theory, for

24
example, by considering the interaction effect of goal weights, goal difficulty, effort
allocation and performance.

25
References
Abernethy, M., and Lillis, A. 1995. The impact of manufacturing flexibility on
management control system design. Accounting, Organizations and Society. 20: 241-
258.
____________., __________. 2001. Interdependencies in organizational design: a
test in hospitals. Journal of Management Accounting Research. 13: 107-129.
Anderson, B., and Fagerhaug, T. 2002. Eight steps to a new performance
measurement system. Quality Progress. 35(2): 112-113.
Azzone, G., and Noci, G. 1998. Identifying effective PMS’s for the deployment of
“green” manufacturing strategies. International Journal of Operations & Production
Management. 18(4) 308-336.
Bih-Ru, L., and Fredendall, L. 2002. The impact of management accounting, product
structure, product mix algorithm, and planning horizon on manufacturing
performance. International Journal of Production Economics. 79(3): 279-291.
Bourne, M., Mills, J., Wilcox, M., Neely, A., and Platts, K. 2000. Designing,
implementing and updating performance measurement systems. International
Journal of Operations and Production Management. 20(7): 754-765.
Cooke, J. 2003. Want real collaboration? Change your measures. Logistics
Management. 42(1): 37-41.
Edminster, R. and Locke, E. 1987. The effects of differential goal weights on the
performance of a complex financial task. Personnel Psychology. 40: 505-517
Feurer, R., Chaharbaghi, K. 1995. performance measurement in strategic change.
Benchmarking for Quality Management & Technology. 2(2): 64-74.

26
Frigo, M. 2001. 2001 CMG survey on performance measurement: trends and
challenges in performance measurement. Cost Management Update. 115: 1-3.
_______. 2002a. Strategy and the balanced scorecard. Strategic Finance. 84(5): 6-
15.
_______. 2002b. Non-financial performance measures and strategy execution.
Strategic Finance. 84(2): (6-9).
Gilliland, S. and Landis, R. 1992. Quality and quantity goals in a complex decision
task: strategies and outcomes. Journal of Applied Psychology. 77(5): 672-681
Harrell, A., and Stahl, M. 1986. Additive information processing and the relationship
between expectancy of success and motivational force. Academy of Management
Journal. 29(2): p. 424-433.
Hollenbeck, J. and Klein, H. 1987. Goal commitment and the goal-setting process:
problems, prospects and proposals for future research. Journal of Applied
Psychology. 72(2): 212-220.
Kaplan, R. and D. Norton. 1992. The balanced scorecard? Measures that drive
performance. Harvard Business Review (Jan/Feb): 71-79
_________. and _________. 1996. Translating Strategy into Action: the Balanced
Scorecard. Boston, Massachusetts: Harvard Business School Press.
_________. and _________. 2001. Transforming the balanced scorecard from
performance measurement to strategic management: part II. Accounting Horizons.
15(2) 147-160.
Locke, E. and G. Latham. 1990. A Theory of Goal Setting and Task Performance.
Englewood Cliffs, New Jersey: Prentice Hall.

27
McAdam, R., and Bailie, B. 2002. Business performance measures and alignment
impact on strategy: the role of business improvement models. International Journal
of Operations & Production Management. 22(9/10): 972-996.
Medori, D., and Steeple, D. 2000. A framework for auditing and enhancing
performance measurement systems. International Journal of Operations &
Production Management. 20(5): 520-532.
Mento, A., Cartledge, N., and Locke, E. 1980. Maryland vs. Michigan vs.
Minnesota: another look at the relationship of expectancy and goal difficulty to task
performance. Organizational Behavior and Human Performance. 25: 419-440.
Miles, R. and Snow, C. 1992. Causes of failure in network organizations. California
Management Review. 34(4): 53-72.
Mowen, J., Middlemist, R., and Luther, D. 1981. joint effects of assigned goal level
and incentive structure on task performance: a laboratory study. Journal of Applied
Psychology. 66: 598-603.
Neely, A., Mills, J., Platts, K., Gregory, M., and Richards, H. 1994. Realizing
strategy through measurement. International Journal of Operations & Production
Management. 14(3): 140-142.
Neely, A., Gregory, M., and Platts, K. 1995. International Journal of Operations &
Production Management. 15(4) 80-116.
O’Mara, C., Hyland, P., and Chapman, R. 1998. Performance measurement and
strategic change. Managing Service Quality. 8(3): 178-183.
Russell, J. 1997. Driving change through performance measurement. Strategy &
Leadership. 25(2): 40-41.
Selto, F., Renner, C., and Young, S. 1995. Assessing organizational fit of a just-in-
time manufacturing system: testing selection, interaction and systems models of

28
contingency theory conglomerate. Accounting, Organizations and Society. 20: 665-
684.
Sinclair, D,. and Zairi, M. 1995. Effective process management through performance
measurement part I – applications of total quality-based performance measurement.
Business Process Re-engineering & Management Journal. 1(1): 75-86.
Stivers, B., and Joyce, T. 2000. Building a balanced performance management
system. Advanced Management Journal. 65(2): 22-29.
Upton, D. 1998. Just-in-time and performance measurement systems. International
Journal of Operations & Production. 18(11) 1101-1108.
Vroom, V.H. 1964. Work and Motivation. Jossey Bass Classics. San Francisco.
Vitale, M., Mavrinac, S. and Hauser, M. 1994. New process/financial scorecard: a
strategic performance measurement system. Strategy & Leadership. 22(4): 12-18.
Yearta, S., Maitlis, S. and Briner, R. 1995. An exploratory study of goal setting in
theory and practice: a motivational technique that works? Journal of Occupational
and Organizational Psychology. 68: 237-252.

29
Table 1 Panel A – Effort allocation (units) for Period 1 SPW Group
NFA(1) NFB(1) NFC(1) F(1) N of cases 24 24 24 24 Minimum 150.000 200.000 150.000 100.000 Maximum 400.000 300.000 300.000 400.000
Mean 251.500 252.917 223.583 236.667 Standard Dev 59.433 42.064 41.936 75.393
CPW Group
NFA(1) NFB(1) NFC(1) F(1) N of cases 22 22 22 22 Minimum 100.000 100.000 100.000 100.000 Maximum 310.000 300.000 300.000 500.000
Mean 232.045 227.500 233.182 263.409 Standard Dev 67.905 49.946 51.375 96.774
Table 1 Panel B – Effort allocation (units) for Period 2 SPW Group
NFA(2) NFB(2) NFC(2) NFD(2) F(2)N of cases 24 24 24 24 24Minimum 100.000 100.000 100.000 0.000 0.000Maximum 275.000 300.000 250.000 250.000 300.000
Mean 175.625 196.250 164.792 120.625 183.750Standard Dev 51.146 46.514 47.947 74.488 63.507
CPW Group
NFA(2) NFB(2) NFC(2) NFD(2) F(2)N of cases 21 22 22 22 22Minimum 0.000 100.000 100.000 100.000 100.000Maximum 200.000 240.000 215.000 300.000 500.000
Mean 66.667 169.091 162.727 185.227 191.364Standard Dev 68.160 45.556 44.070 58.969 78.212

30
Table 2 – Effort allocation for NFD – Period 2 (SPW) Effort allocation (units) Standard deviation 74.488t-statistic (Probability) 7.933 (p=0.000)Confidence interval (95%) 89.171-152.079Degree of freedom 23
Table 3 – Effort allocation for NFD – Period 2 (SPW vs CPW)
Mean Standard deviation t-statistics
SPW 24 120.625 74.488 3.241 0.002
CPW 22 185.227 58.969
Table 4 – Effort allocation for NFA – ANOVA results
Between Subjects
SS df MS F p Group 93577.002 1 93577.002 18.016 0.000Error 223340.598 43 5193.967
Within Subjects
SS df MS F p
NFA 323632.891 1 323632.891 129.479 0.000NFA * GP 44008.224 1 44008.224 17.607 0.000
Error 107478.932 43 2499.510

31
Table 5 – Total effort assigned to all performance measures (units)
Group N Mean SD t-statistic p SPW 24 841.042 94.593 2.103 0.041CPW 21 780.238 99.228
Table 6 – Total Commitment
Group N Mean* SD t-statistic p SPW 23 25.087 7.292 2.554 0.014 CPW 21 20.048 5.590
*Theoretical range = 5-25 (sum of five 7-point questions on subjects’ commitment to
each performance measure), the higher the number, the stronger the commitment.