Behavioral Management Patients Scale for Use with Acute ...
197
Persistent link: http://hdl.handle.net/2345/1839 This work is posted on eScholarship@BC, Boston College University Libraries. Boston College Electronic Thesis or Dissertation, 2011 Copyright is held by the author, with all rights reserved, unless otherwise noted. Development of an Agitation Rating Scale for Use with Acute Presentation Behavioral Management Patients Author: Tania Denise Shaffer Strout
Transcript of Behavioral Management Patients Scale for Use with Acute ...

Persistent link: http://hdl.handle.net/2345/1839
This work is posted on eScholarship@BC,Boston College University Libraries.
Boston College Electronic Thesis or Dissertation, 2011
Copyright is held by the author, with all rights reserved, unless otherwise noted.
Development of an Agitation RatingScale for Use with Acute PresentationBehavioral Management Patients
Author: Tania Denise Shaffer Strout

Boston College
William F. Connell Graduate School of Nursing
DEVELOPMENT OF AN AGITATION RATING SCALE FOR USE WITH
ACUTE PRESENTATION BEHAVIORAL MANAGEMENT PATIENTS
a dissertation
by
TANIA D. S. STROUT
submitted in partial fulfillment of the requirements for the degree of
Doctor of Philosophy
May, 2011

©copyright by TANIA D. S. STROUT
2011
Acknowledgements
My most sincere thanks to those who have supported the development of my
work; I would not have been able to complete this work without their support:
• June Andrews Horowitz, Ph.D., R.N., F.A.A.N., Professor, William F.
Connell School of Nursing, Boston College, my committee chair, advisor,
and guide through this work;
• Patricia A. Tabloski, Ph.D., R.N., F.A.A.N., Associate Dean for Graduate
Programs and Associate Professor, William F. Connell School of Nursing,
Boston College, an agitation expert who makes me think in new ways;
• Michael R. Baumann, M.D., Professor, Tufts University School of Medicine
and Vice-Chair/Medical Director Maine Medical Center, my research
partner and consummate supporter;
• Alyce A. Schultz, Ph.D., R.N., F.A.A.N., EBP Concepts, my first research
mentor and agitation advisor who instilled in me a love of research;
• My wonderful family, without their patience, support, encouragement,
and sacrifice, I would not have come this far; and
• My incredible classmates: Rachel DiFazio, Douglas Schlichting, Brian
French, Martha Healey, and Lisa Wolf – each one of you gave me your
unending support, love, and pushes when I needed them.
iii

Thank you so very much to each of you. I will be forever grateful.
Dedication
I am honored to dedicate this work to my loving family, who has always
supported me in my quest to learn more:
• To my wonderful parents, who have selflessly sacrificed to support my
education for as long as I can remember. Thank you so much. I would
not be in this place without you.
• To my beautiful, smart, incredible children: Meighan Li and Molly
Xiao Yu. I am sorry that I had to go to school so much. I missed you
every minute that I was away but I hope that my example has taught
you to work diligently to accomplish your goals.
• To my amazingly supportive husband, Ken. Thank you so much for
encouraging me to do this, for supporting me, for picking up my slack,
and for sticking it out. I love you.
I love you all so much and am so grateful to have each of you in my life. Thank
you.
iv

DEVELOPMENT OF AN AGITATION RATING SCALE FOR USE WITH
ACUTE PRESENTATION BEHAVIORAL MANAGEMENT PATIENTS
Abstract
Tania D. S. Strout
Advisor: June Andrews Horowitz, Ph.D., R.N., F.A.A.N.
Agitation is a distressing set of behaviors frequently observed in
emergency department psychiatry patients. Key to developing and evaluating
treatment strategies aimed at decreasing and preventing agitation is the
availability of a reliable, valid instrument to measure behaviors representative of
agitation. Currently, an agitation rating instrument appropriate for use in the
emergency setting does not exist and clinicians are left without standard
language for communicating about the phenomenon. The Agitation Severity
Scale was developed to fill this void using facilitated focus groups to generate an
initial item pool. Beginning evidence of content validity was established through
a survey of clinical providers and a panel of content experts. The objectives of
this methodological study were to: (a) develop an observation-based rating scale
to assess the continuum of behaviors known as agitation in adult emergency
department patients, and (b) to evaluate the psychometric properties of the
newly developed instrument. Psychometric evaluation was conducted using a
v

sample of 270 emergency department psychiatric patients. A 17-item instrument
with a standardized Cronbach’s alpha coefficient of 0.91 resulted, providing
evidence of a high degree of internal consistency reliability. Principle
components analysis revealed a 4-component solution accounting for 69% of
observed variance. Internal consistency reliability ranged from 0.71 to 0.91 for the
scale components. Equivalence reliability was established through the evaluation
of Agitation Severity Scores assigned by independent evaluators, r = 0.99, Κ =
0.98. Construct validity was established through comparison of mean scores for
subjects in the highest and lowest scoring quartiles. A statistically significant
difference in scores was noted when comparing these groups, t = -17.688, df = 155,
p < 0.001. Convergent validity was evaluated by testing the association between
Agitation Severity Scores and scores obtained using a well-established
instrument, the Overt Agitation Severity Scale. Pearson’s correlation coefficient
for the associations between the scores ranged from 0.91 to 0.93, indicating a
strong, positive relationship between the scores. Finally, the Rasch measurement
model was employed to further evaluate the functioning of the instrument. In
sum, the Agitation Severity Scale was found to be reliable and valid when used
to measure agitation in the emergency setting.
vi

Table of Contents
Page
Acknowledgements . . . . . . . . . . . . . . . . . . . . . . . . . . . . . . . . . . . . . . . . . . . . . . . . . . . . iii
Dedication . . . . . . . . . . . . . . . . . . . . . . . . . . . . . . . . . . . . . . . . . . . . . . . . . . . . . . . . . . . . iv
Abstract . . . . . . . . . . . . . . . . . . . . . . . . . . . . . . . . . . . . . . . . . . . . . . . . . . . . . . . . . . . . . . v
List of Tables . . . . . . . . . . . . . . . . . . . . . . . . . . . . . . . . . . . . . . . . . . . . . . . . . . . . . . . . . . xi
List of Figures . . . . . . . . . . . . . . . . . . . . . . . . . . . . . . . . . . . . . . . . . . . . . . . . . . . . . . . xiii
CHAPTER 1
1. Overview of the Proposed Study
Introduction . . . . . . . . . . . . . . . . . . . . . . . . . . . . . . . . . . . . . . . . . . . . . . . 1
Statement of the Problem . . . . . . . . . . . . . . . . . . . . . . . . . . . . . . . . . . . . 2
Purpose . . . . . . . . . . . . . . . . . . . . . . . . . . . . . . . . . . . . . . . . . . . . . . . . . . . 3
Significance . . . . . . . . . . . . . . . . . . . . . . . . . . . . . . . . . . . . . . . . . . . . . . . 3
Theoretical
Influences . . . . . . . . . . . . . . . . . . . . . . . . . . . . . . . . . . . . . . 7
Research Questions . . . . . . . . . . . . . . . . . . . . . . . . . . . . . . . . . . . . . . . . 12
Definitions . . . . . . . . . . . . . . . . . . . . . . . . . . . . . . . . . . . . . . . . . . . . . . . 13
Assumptions . . . . . . . . . . . . . . . . . . . . . . . . . . . . . . . . . . . . . . . . . . . . . 16
Limitations . . . . . . . . . . . . . . . . . . . . . . . . . . . . . . . . . . . . . . . . . . . . . . . 16
vii
Summary . . . . . . . . . . . . . . . . . . . . . . . . . . . . . . . . . . . . . . . . . . . . . . . . 17
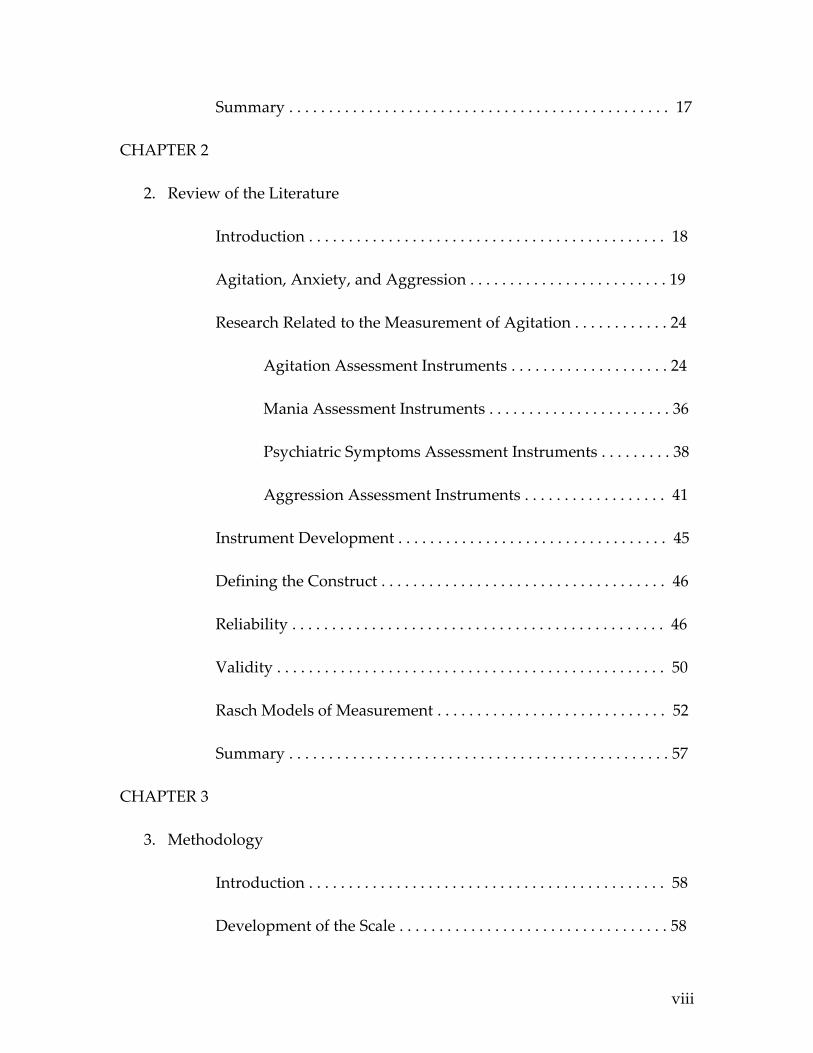
CHAPTER 2
2. Review of the Literature
Introduction . . . . . . . . . . . . . . . . . . . . . . . . . . . . . . . . . . . . . . . . . . . . . 18
Agitation, Anxiety, and Aggression . . . . . . . . . . . . . . . . . . . . . . . . . 19
Research Related to the Measurement of Agitation . . . . . . . . . . . . 24
Agitation Assessment Instruments . . . . . . . . . . . . . . . . . . . . 24
Mania Assessment Instruments . . . . . . . . . . . . . . . . . . . . . . . 36
Psychiatric Symptoms Assessment Instruments . . . . . . . . . 38
Aggression Assessment Instruments . . . . . . . . . . . . . . . . . . 41
Instrument Development . . . . . . . . . . . . . . . . . . . . . . . . . . . . . . . . . . 45
Defining the Construct . . . . . . . . . . . . . . . . . . . . . . . . . . . . . . . . . . . . 46
Reliability . . . . . . . . . . . . . . . . . . . . . . . . . . . . . . . . . . . . . . . . . . . . . . . 46
Validity . . . . . . . . . . . . . . . . . . . . . . . . . . . . . . . . . . . . . . . . . . . . . . . . . 50
Rasch Models of Measurement . . . . . . . . . . . . . . . . . . . . . . . . . . . . . 52
Summary . . . . . . . . . . . . . . . . . . . . . . . . . . . . . . . . . . . . . . . . . . . . . . . . 57
CHAPTER 3
3. Methodology
Introduction . . . . . . . . . . . . . . . . . . . . . . . . . . . . . . . . . . . . . . . . . . . . . 58
Development of the Scale . . . . . . . . . . . . . . . . . . . . . . . . . . . . . . . . . . 58
viii

Setting . . . . . . . . . . . . . . . . . . . . . . . . . . . . . . . . . . . . . . . . . . . . . . . . . . 64
Sample . . . . . . . . . . . . . . . . . . . . . . . . . . . . . . . . . . . . . . . . . . . . . . . . . . 65
Study Procedures . . . . . . . . . . . . . . . . . . . . . . . . . . . . . . . . . . . . . . . . . 65
Instruments . . . . . . . . . . . . . . . . . . . . . . . . . . . . . . . . . . . . . . . . . . . . . . 66
Agitation Severity Scale . . . . . . . . . . . . . . . . . . . . . . . . . . . . . 66
Overt Agitation Severity Scale . . . . . . . . . . . . . . . . . . . . . . . . 67
Analytic Methods. . . . . . . . . . . . . . . . . . . . . . . . . . . . . . . . . . . . . . . . . 67
Protection of Human Subjects . . . . . . . . . . . . . . . . . . . . . . . . . . . . . . 72
Summary . . . . . . . . . . . . . . . . . . . . . . . . . . . . . . . . . . . . . . . . . . . . . . . . 73
CHAPTER 4
4. Results
Introduction . . . . . . . . . . . . . . . . . . . . . . . . . . . . . . . . . . . . . . . . . . . . . . 75
Data Preparation . . . . . . . . . . . . . . . . . . . . . . . . . . . . . . . . . . . . . . . . . . 75
Characteristics of the Study Subjects . . . . . . . . . . . . . . . . . . . . . . . . . 76
Research Question 1 . . . . . . . . . . . . . . . . . . . . . . . . . . . . . . . . . . . . . . . 79
Research Question 2 . . . . . . . . . . . . . . . . . . . . . . . . . . . . . . . . . . . . . . . 82
Research Question 3 . . . . . . . . . . . . . . . . . . . . . . . . . . . . . . . . . . . . . . . 88
Research Question 4 . . . . . . . . . . . . . . . . . . . . . . . . . . . . . . . . . . . . . . . 90
Research Question 5 . . . . . . . . . . . . . . . . . . . . . . . . . . . . . . . . . . . . . . . 91
Summary of Findings . . . . . . . . . . . . . . . . . . . . . . . . . . . . . . . . . . . . . 117
ix

CHAPTER 5
5. Conclusions and Discussion
Introduction . . . . . . . . . . . . . . . . . . . . . . . . . . . . . . . . . . . . . . . . . . . . . 120
Development of the Instrument . . . . . . . . . . . . . . . . . . . . . . . . . . . . 120
Psychometric Evaluation of the Instrument . . . . . . . . . . . . . . . . . . 121
Limitations . . . . . . . . . . . . . . . . . . . . . . . . . . . . . . . . . . . . . . . . . . . . . . 124
Implications for Research and Practice. . . . . . . . . . . . . . . . . . . . . . . 125
Future Research with the Agitation Severity Scale . . . . . . 125
Clinical Implications . . . . . . . . . . . . . . . . . . . . . . . . . . . . . . . .127
Summary . . . . . . . . . . . . . . . . . . . . . . . . . . . . . . . . . . . . . . . . . . . . . . . 128
REFERENCES . . . . . . . . . . . . . . . . . . . . . . . . . . . . . . . . . . . . . . . . . . . . . . . . . . . . . . . 130
APPENDICES
Appendix A. Maine Medical Center IRB Exemption . . . . . . . . . . . . . . . . 153
Appendix B. Boston College IRB Approval . . . . . . . . . . . . . . . . . . . . . . . . .155
Appendix C. Item Selection Survey . . . . . . . . . . . . . . . . . . . . . . . . . . . . . . . 158
Appendix D. Content Validity Survey . . . . . . . . . . . . . . . . . . . . . . . . . . . . . 161
Appendix E. Agitation Severity Scale . . . . . . . . . . . . . . . . . . . . . . . . . . . . . .176
Appendix F. Overt Agitation Severity Scale . . . . . . . . . . . . . . . . . . . . . . . . 178
Appendix G. Data Collection Instrument . . . . . . . . . . . . . . . . . . . . . . . . . . 180
Appendix H. Permission to Use Figure . . . . . . . . . . . . . . . . . . . . . . . . . . . 182
x

LIST OF TABLES
Table 1: Agitation Attributes Identified in the Literature . . . . . . . . . . . . . . . . . . . . 21
Table 2: Summary of Published Instruments Utilized for
Measuring Agitation . . . . . . . . . . . . . . . . . . . . . . . . . . . . . . . . . . . . . . . . . . . 26
Table 3: Content Validity Findings – Representativeness . . . . . . . . . . . . . . . . . . . . 58
Table 4: Content Validity Findings – Clarity . . . . . . .. . . . . . . . . . . . . . . . . . . . . . . . 59
Table 5: Demographic Characteristics of the Study Subjects N=270 . . . . . . . . . . .78
Table 6: Age of Study Subjects by Total Agitation Scale Score
Quartile N=270 . . . . . . . . . . . . . . . . . . . . . . . . . . . . . . . . . . . . . . . . . .. . . . . . . 79
Table 7: Item-Total Correlations for the Agitation Severity Scale, Initial
21 Items N = 270 . . . . . . . . . . . . . . . . . . . . . . . . . . . . . . . . . . . . . . . . . . . . . . . . 81
Table 8: Principle Components Analysis Factor Loadings in the Unrotated
Factor Matrix for the Agitation Severity Scale N=270 . . .. . . . . . . . . . . . . . 86
Table 9: Mean Agitation Severity Scale Scores and Overt Agitation Scale
Scores N=270. . . . . . . . . . . . . . . . . . . . . . . . . . . . . . . . . . . . . . . . . . . . . . . . . . . 87
Table 10: Item-Total Correlations for Factor I, Aggressive Behaviors, of the
Agitation Severity Scale N=270 . . . . . . . . . . . . . . . . . . . . . . . . . . . . . . . . . . . 89
Table 11: Item-Total Correlations for Factor II, Interpersonal Behaviors, of the
xi
Agitation Severity Scale N=270 . . . . . . . . . . . . . . . . . . . . . . . . . . . . . . . . . . . 89
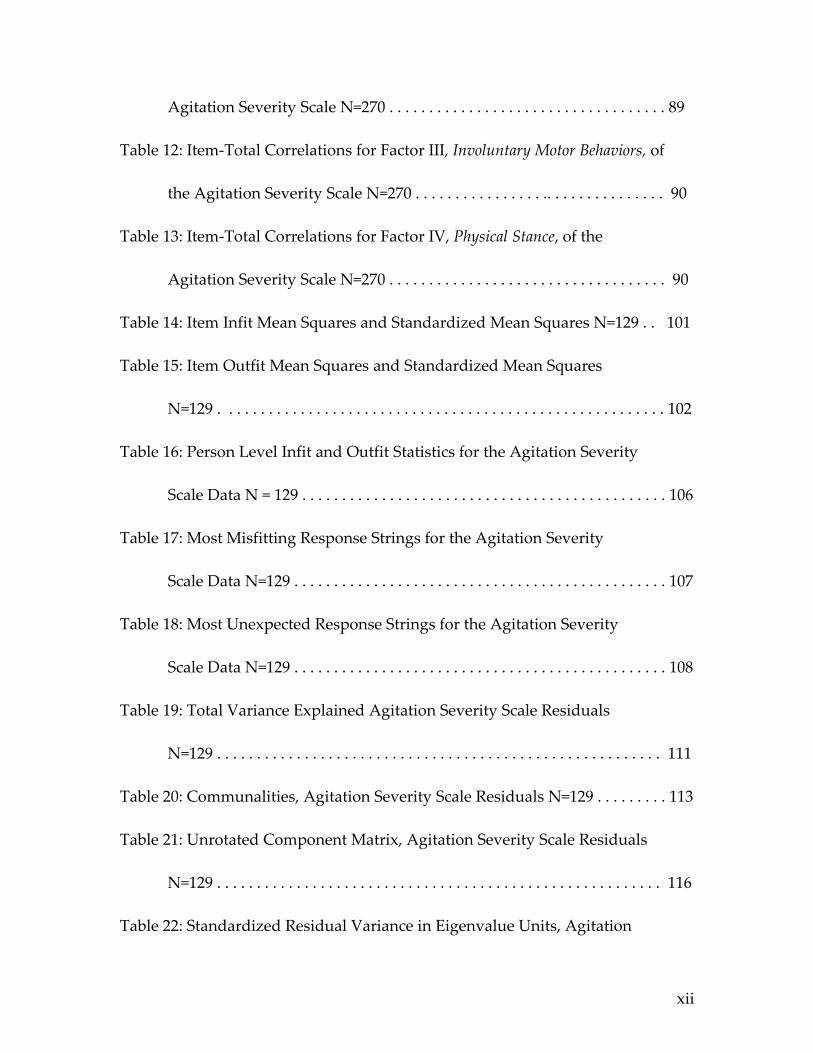
Table 12: Item-Total Correlations for Factor III, Involuntary Motor Behaviors, of
the Agitation Severity Scale N=270 . . . . . . . . . . . . . . . . .. . . . . . . . . . . . . . . 90
Table 13: Item-Total Correlations for Factor IV, Physical Stance, of the
Agitation Severity Scale N=270 . . . . . . . . . . . . . . . . . . . . . . . . . . . . . . . . . . . 90
Table 14: Item Infit Mean Squares and Standardized Mean Squares N=129 . . 101
Table 15: Item Outfit Mean Squares and Standardized Mean Squares
N=129 . . . . . . . . . . . . . . . . . . . . . . . . . . . . . . . . . . . . . . . . . . . . . . . . . . . . . . . . 102
Table 16: Person Level Infit and Outfit Statistics for the Agitation Severity
Scale Data N = 129 . . . . . . . . . . . . . . . . . . . . . . . . . . . . . . . . . . . . . . . . . . . . . . 106
Table 17: Most Misfitting Response Strings for the Agitation Severity
Scale Data N=129 . . . . . . . . . . . . . . . . . . . . . . . . . . . . . . . . . . . . . . . . . . . . . . . 107
Table 18: Most Unexpected Response Strings for the Agitation Severity
Scale Data N=129 . . . . . . . . . . . . . . . . . . . . . . . . . . . . . . . . . . . . . . . . . . . . . . . 108
Table 19: Total Variance Explained Agitation Severity Scale Residuals
N=129 . . . . . . . . . . . . . . . . . . . . . . . . . . . . . . . . . . . . . . . . . . . . . . . . . . . . . . . . 111
Table 20: Communalities, Agitation Severity Scale Residuals N=129 . . . . . . . . . 113
Table 21: Unrotated Component Matrix, Agitation Severity Scale Residuals
N=129 . . . . . . . . . . . . . . . . . . . . . . . . . . . . . . . . . . . . . . . . . . . . . . . . . . . . . . . . 116
Table 22: Standardized Residual Variance in Eigenvalue Units, Agitation
xii

Severity Scale Data N=129 . . . . . . . . . . . . . . . . . . . . . . . . . . . . . . . . . . . . . . 117
LIST OF FIGURES
Figure 1: Humans as Adaptive Systems . . . . . . . . . . . . . . . . . . . . . . . . . . . . . . . . . . 11
Figure 2: Scree Plot of Eigenvalues for the Agitation Severity Scale
Items N=270 . . . . . . . . . . . . . . . . . . . . . . . . . . . . . . . . . . . . . . . . . . . . . . . . . . . 85
Figure 3: Variable Map for the Agitation Severity Scale N=270 . . . . . . . . . . . . . . 94
Figure 4: Variable Map for the Agitation Severity Scale Highest 50%
of Scores N=129 . . . . . . . . . . . . . . . . . . . . . . . . . . . . . . . . . . . . . . . . . . . . . . . . . 96
Figure 5: Keymap for the Agitation Severity Scale Data on the
Original Logit Scale N=129 . . . . . . . . . . . . . . . . . . . . . . . . . . . . . . . . . . . . . . . 99
Figure 6: Scree Plot for Agitation Severity Scale Residual Analysis . . . . . . . . . 114
xiii

CHAPTER 1
Overview of the Study
Introduction
Agitation is a frequent and problematic set of behaviors observed in
emergency department patients, particularly those with acute psychiatric
concerns (Hazlett, McCarthy, Londner, & Onyike, 2004; Martel, Sterzinger,
Miner, Clinton, & Biros, 2005; Rund, Ewing, Mitzel & Votolato, 2006; Young,
1987). Recently published estimates based on data from the Healthcare Cost and
Utilization Project (HCUP) Nationwide Emergency Department Sample (NEDS)
suggest that at least 12.0 million psychiatric-related emergency department visits
occurred in 2007, accounting for 12.5% of all emergency department visits in the
United States that year (Owens, Mutter & Stocks, 2010). Additional research has
shown that agitated psychiatric patients in the emergency department are
frequently physically restrained or secluded at a rate of 20 to 25%, a rate that is
significantly higher than the rate of restraint experienced by inpatients (Frengley
& Mion, 1986; Mion, Frengley, Jakovcic, & Marino, 1989; Telintelo, Kuhlman &
Winget, 1983; Zun & Downey, 2008). Recently, Zun and Downey (2008) clearly
identified a relationship between agitation and likelihood of physical restraint in
emergency psychiatry patients and found evidence that some restrained patients
did not meet written guidelines for the severity of their agitation, suggesting that
1

clinicians require defined rating scales to evaluate patients with greater
consistency. Despite regulation of restraint and seclusion by the Joint
Commission on Accreditation of Healthcare Organizations, Centers for Medicare
and Medicaid Services, and many states, there are few studies of agitation in the
emergency setting conducted with emergency patients (Kanich, Brady, Huff,
Perron, Holsteg, Lindbeck, & Carter, 2002; Martel et al., 2005; Zun & Downey,
2008).
An additional concern for nurses caring for agitated patients is the lack of
a standard definition for the phenomenon (Day, 1999; Kong, 2005; Kopecky,
Kopecky, & Yudofsky, 1998; Yudofsky, Kopecky, Kunik, Silver, & Endicott,
1997). The lack of a standard definition of agitation leads to difficulty in
communicating about agitation, difficulty in quantifying the agitation that one
observes, and difficulty in evaluating the effectiveness of interventions aimed at
alleviating agitated behaviors. In addition, as patients experiencing agitation are
often suffering from mental illness and/or addiction, the current approach to
evaluating agitation is often value-laden and judgmental, rather than patient-
centric. The related concepts of anxiety and aggression are clearly defined in the
literature and objective, valid, reliable instruments have been developed to
facilitate their measurement. What is needed is a patient-centric, valid, reliable
2

tool for the assessment of agitation in acute psychiatry patients that is
appropriate for use in the fast-paced emergency setting.
Statement of the Problem
Currently, an objective, reliable, valid, emergency department-
appropriate, observation-based scale for the assessment of the continuum of
behaviors collectively known as agitation does not exist. Published agitation
rating scales typically involve extended periods of observation, patient
participation, or observer judgments that are not possible or appropriate in the
emergency setting. Emergency nurses and other clinicians caring for acute
psychiatry patients need a standardized assessment tool to enhance
communication about agitation, to evaluate the effectiveness of their
interventions, and to limit subjective judgments regarding the patients being
observed. Therefore, additional development of the Agitation Severity Scale is
warranted.
Purpose
The objectives of this methodological study were: (a) to develop an
observation-based rating scale to assess the continuum of behaviors known as
agitation in an adult emergency department population, and (b) to evaluate the
psychometric properties of the newly developed instrument.
Significance
3

The lack of an objective, reliable and valid instrument for the assessment
of agitation in the emergency setting leaves nurses without a language for
communicating about their patients. This limits nurses’ ability to share
assessments with colleagues, to rapidly identify changes in their patients’
conditions, to quantify their assessments, and to measure outcomes in agitation-
related research accurately. Importantly, agitation left unrecognized and
untreated has significant consequences for patients and the progress of their
treatments. Agitation sequelae include physical restraint, impaired development
of therapeutic relationships, extended times to treatment, expense, and distress
and frustration for patients and caregivers.
The relationship between agitated behavior and physical restraint has
been clearly illustrated in the literature (Kong, 2005; Kopecky & Yudofsky, 1999;
Struble & Siversten, 1987; Taft, 1989; Zun & Downey, 2008). While definitions of
physical restraint vary widely, generally, “restraint” refers to physically
restricting movement (Mohr, Petti, & Mohr, 2003). While there is very little
evidence supporting the efficacy and safety of physical restraint for patients with
mental illness, the practice has a long history of use in this population and is
traditionally considered to be therapeutic (Sailas & Fenton, 2000; Johnson, 1998;
Evans, Wood, & Lambert, 2003; Gerolamo, 2006; Irving, 2002). In fact, while there
is a paucity of literature reporting restraint-associated benefit, there is an
4

abundance of literature reporting complications of restraint use, such as injury
and death (Gerolamo, 2006; Zun, 2003). Staff injury frequently occurs during
restraint procedures (Henderson, Siddons, Wasser, Gunn, & Spisszak, 2005;
Murphy, 2002; Sequeira & Halstead, 2004). Restraint use has been found to give
rise to increased length of hospitalization (Frengley & Mion, 1986; Mion
Frengley, Jakovicic, & Marino, 1989, Robbins, Boyko, Lane, Cooper, & Jahnigen,
1987) higher mortality (Zun, 2003; Frengley & Mion, 1986; Mion et al., 1989;
Robbins et al., 1987; Molasitotis, 1995), pressure sores (Lofgren, MacPherson,
Granieri, Myllenbeck, & Sprafka, 1989; Stiebeling, Schor, Morris, & Lipsitz, 1990),
higher rates of nosocomial infections (Mion et al., 1989; Robbins et al., 1987;
Molasitotis, 1995; Lofgren et al., 1989), higher rates of falls (Mion et al., 1989;
Tinetti, Liu, & Ginter, 1992) and aggression-coercion cycles for both patients and
staff (Goren, Singh, & Best, 1993). A recent integrative review of the qualitative
literature revealed that patients often experience physical restraint as demeaning
and with negative psychological impacts such as retraumatization in those with
previous traumatic experiences (Strout, 2010). To reduce and prevent the use of
physical restraint, identification of and intervention for agitated patients is
essential. Given the central role that nurses play in caring for agitated patients,
these are important nursing responsibilities.
5
Arising from personal knowing, therapeutic use of self has been described
as a key strategy utilized in nursing practice (Carper, 1978; Chinn & Kramer,
2008). For Peplau, the interpersonal relationship developed between nurses and
their patient is described as the “crux” or “heart” of nursing (Peplau, 1952, 1962,
1965). It is through the interpersonal relationship that nurses strive to assist
patients in their journeys towards healing, growth, and development (Peplau,
1952). Agitation has been associated with treatment challenges stemming from
the difficulty inherent in establishing and nurturing a therapeutic relationship
(Taft, 1989; Dyck, 1997; Dunkin & Anderson-Hanley, 1998). Agitated behavior
inhibits the therapeutic relationship, in turn limiting the potential for wellness
and creating social isolation (Taft, 1989; Kong, 2005). The ability to assess
agitated behavior accurately may enhance early intervention, facilitating
development of healing interpersonal relationships.
Emergency overcrowding has become a national public health crisis as
increasing numbers of Americans have limited access to primary care (Derlet &
Richards, 2000; Institute of Medicine, 2006; Forster, Stiell, Wells, Lee, &
VanWalraven, 2003; McCabe, 2001). An important component of overcrowding is
emergency department length of stay, including the time it takes for patients to
reach a clinical disposition. Untreated agitated behavior contributes to length of
stay as agitated patients must reach a state where they can, at minimum, be
6

assessed by clinicians and at best, participate fully in their treatment. Without
appropriate ways to evaluate agitated behavior, nurses and other clinicians are
left with a best guess as to when patients may be assessed and begin treatment.
Secondary burdens include increased financial costs and the need for increased
patient/staff ratios to care for agitated patients (Cohen-Mansfield & Billig, 1986;
Taft, 1989; Diwan & Phillips, 2001; Bartles, Horn, Smout, Dums, Flaherty, Jones,
Monane, Taler, & Voss, 2003; Moore, Zhu, & Clipp, 2001). In today’s healthcare
environment, reductions in the need for increased staffing and the time to
definitive treatment for mental health patients is important for responsible
stewardship of limited resources, as well as for patients themselves.
Importantly, agitation has been documented as being distressing,
unpleasant, upsetting, and frustrating for patients and their families (Taft, 1989;
Kong, 2005; Day, 1999; Struble & Siversten, 1987; Hurley, Volicer, Camberg,
Ashley, Woods, Odenheimer, Ooi, McIntyre & Mahoney, 1999). While the relief
of such unpleasant symptoms is an important goal for nurses and other
clinicians, it is also important to note that agitation has been shown to decrease
quality of life for those experiencing it (Taft, 1989; Kong, 2005). As facilitating
quality of life is an important focus of the work of nursing, decreasing agitation
follows to that end (Willis, Grace, & Roy, 2008). The development of an agitation
rating instrument that is observation-based, reliable, valid, and appropriate to
7

use in the emergency setting will fill these gaps in practice and therefore allow
important advances in the care of mental health patients to be made.
Theoretical Influences
At the heart of this work is the central unifying focus for the discipline of
nursing proposed by Willis, Grace, and Roy: “facilitating humanization,
meaning, choice, quality of life, and healing in living and dying” (2008). Willis
and colleagues defined nursing as, “a healthcare discipline and healing
profession, both an art and science, which facilitates and empowers human
beings in envisioning and fulfilling health and healing in living and dying
through the development, refinement, and application of nursing knowledge for
practice” (2008, p. E33). Nurses facilitate humanization through their, “open-
minded, caring, intentional, thoughtful, and responsible unconditional
acceptance and awareness of human beings as they are” (Willis, Grace, & Roy,
2008, p. E33-E34).
Through this work, I aim to facilitate humanization for and empower
mental health patients attending the emergency department. Because of the
important consequences of agitation, including inhibition of therapeutic
relationships, physical and chemical restraint, social isolation, frustration and
distress, development of an objective rating scale to identify and quantify
agitation is essential to planning and implementing interventions aimed at
8

reducing agitation. Only when we are able to assess agitation accurately can we
evaluate the efficacy of agitation-related interventions. Preventing and reducing
agitation for people who are already vulnerable and often marginalized is an
important step towards empowerment for those who experience it. Reducing
agitation allows patients the opportunity to make choices, to enjoy improved
quality of life, and to work towards wholeness and healing.
Additional theoretical support for this study was drawn from the works
of Hildegard Peplau. Peplau described nursing as, “an educative instrument, a
maturing force, that aims to promote forward movement of the personality in the
direction of creative, constructive, productive, personal and community living”
(Peplau, 1952, p. 16) and later as, “an enabling, empowering, transforming art”
(Peplau, 1988). She believed the interpersonal relationship between a patient and
nurse to be the “crux” of nursing, the instrument through which nurses influence
patient outcomes and foster the personal development of their patients (Peplau,
1952, 1962, 1965). The presence of agitation is a barrier to the formation and
maintenance of therapeutic interpersonal relationships for nurse-patient dyads.
The central role of these relationships and their impact on patient outcomes
supported the need for continued psychometric evaluation of the Agitation
Severity Scale (Dearing, 2004; Whittemore, 2000; Radwin, 1996; Morse, 1991;
Kralik, Koch, & Wolton, 1997).
9

Roy described people as adaptive systems, where adaptation represents
the process and outcome whereby thinking and feeling people use conscious
awareness and choice to create human and environmental integration (Roy, 2008,
p. 26). Figure 1 depicts humans as adaptive systems. Here, internal or external
stimuli provoke a response from the person (Roy, 2008, p. 34). The person’s
response is determined by their level of adaptation and can be observed through
their behavior. Adaptation levels can be integrated, compensatory, or
compromised with compromised adaptation resulting from inadequate
integrated and compensatory life processes. Integrated adaptation represents
situations where the structures and functions of life processes are working as a
whole to meet human needs. Compensatory adaptation is activated by a
challenge to the integrated processes. An example of compensatory adaptation is
fever, which inhibits the multiplication of bacteria and increases metabolic rate to
enhance recovery from illness. Compromised adaptation occurs when integrated
and compensatory processes are inadequate to address the challenging stimuli
(Roy, 2008, pp. 36-38).
For the purposes of this research, agitation was viewed through the lens of
adaptation. Here, agitation is considered an observable manifestation of a
person’s struggle for adaptation, a response to some internal or external stimuli
present within their environment. Agitation is a behavioral response
10
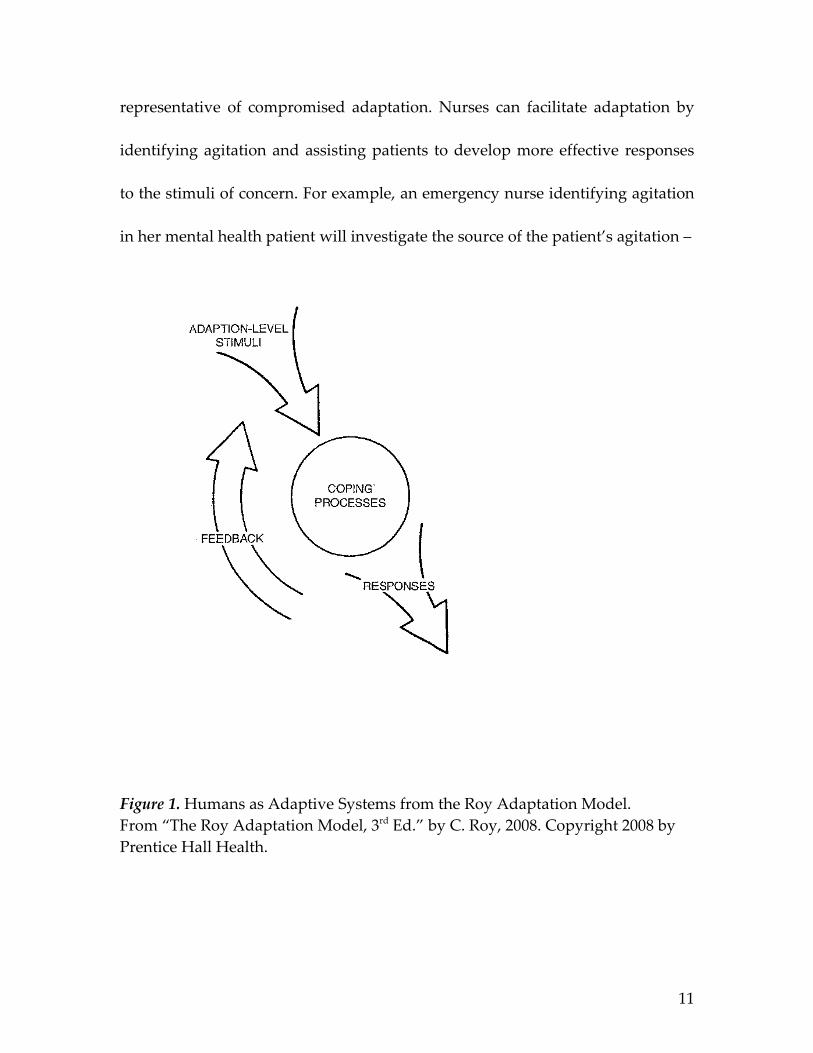
representative of compromised adaptation. Nurses can facilitate adaptation by
identifying agitation and assisting patients to develop more effective responses
to the stimuli of concern. For example, an emergency nurse identifying agitation
in her mental health patient will investigate the source of the patient’s agitation –
Figure 1. Humans as Adaptive Systems from the Roy Adaptation Model. From “The Roy Adaptation Model, 3rd Ed.” by C. Roy, 2008. Copyright 2008 by Prentice Hall Health.
11

the bothersome stimuli. Nurses can encourage the use of strategies to cope with
the stimuli that are more integrated, such as deep breathing exercises, dim
lighting, or the presence of a calming support person or favorite music. Only
when nurses have the ability to objectively identify and evaluate agitation can
they begin to promote adaptation and evaluate the results of their interventions.
The Roy Adaptation Model supported this project both in conceptualizing
agitation and in demonstrating the need for further development of the Agitation
Severity Scale. Currently, the lack of an objective agitation rating scale limits the
ability of nurses to facilitate adaptation in this patient population.
Purpose
The objectives of this methodological study were: (a) to develop an
observation-based rating scale to assess the continuum of behaviors known as
agitation in an adult emergency department population, and (b) to evaluate the
psychometric properties of the newly developed instrument. These goals were
accomplished by addressing the following research questions.
Research Questions
The research questions addressed by this study included the following:
1. Does the Agitation Severity Scale demonstrate acceptable levels of
reliability (equivalence and internal consistency)?
12

2. Do all of the items of the Agitation Severity Scale interrelate in measuring
the concept of agitation (construct validity/principle components
analysis)?
3. How reliable are the individual subscales, and the total scale for the
Agitation Severity Scale as demonstrated by principle components
analysis?
4. What is the relationship between Agitation Severity Scale scores and
scores on the Overt Agitation Severity Scale (Yudofsky, Kopecky, Junik,
Silver, & Endicott, 1997) (convergent validity)?
5. Do the Agitation Severity Scale items perform as anticipated, specifically:
(a) do the items define a unidimensional continuum in the domain and,
(b) do the items follow a hierarchical ordering in their definition of the
domain (Ludlow, Enterline, & Cochran-Smith, 2008) (Rasch measurement
model analysis)?
Definitions
For the purposes of this study, these terms were defined as follows:
1. Agitation was conceptually defined as a range of observable behaviors
that can be characterized as a manifestation of an individual human
being’s struggle to adapt to some circumstance or happening within their
internal or external environment. Operationally, agitation was described
13

as, “a progressive set of objective neurobiologic and anatomical/functional
vocal and motor behaviors on a continuum of behavioral expressions that
extend from anxiety to aggression” (Yudofsky, Kopecky, Kunik, Silver, &
Endicott, 1997; Kopecky, Kopecky, & Yudofsky, 1998).
2. Adult acute psychiatric patients were defined as people aged 18 years or
older presenting to the emergency department with a mental health
concern and ultimately diagnosed with a Diagnostic and Statistical
Manual of Mental Disorders IV Text Revision (DSM-IV-TR) (American
Psychiatric Association, 2000) diagnosis.
3. Psychometric evaluation was defined as the determination of the
reliability and validity of the Agitation Severity Scale.
4. Equivalence reliability was defined as the extent to which the same results
are obtained when the same subjects are observed at the same time by
different observers (Jacobson, 1997). Operationally, equivalence reliability
was examined through calculation of Pearson’s product moment
correlation and Cohen’s weighted kappa.
5. Internal consistency reliability was defined as the extent to which all items
on the scale measure the same variable (Burns & Grove, 2009; Waltz,
Strickland, & Lenz, 1991). Cronbach’s alpha coefficient was utilized to
measure internal consistency reliability.
14

6. Construct validity refers to the totality of evidence about whether a
particular operationalization of a construct adequately represents what is
intended by theoretical account of the construct being measured
(Jacobson, 1997). Using the known-groups method, data for subjects
known to be agitated (highest quartile of scores) and known not to be
agitated (lowest quartile of scores) was compared using the independent
samples t-test.
7. Convergent validity refers the degree to which a measure is correlated
with other measures that it is theoretically predicted to correlate with and
was evaluated by examining the relationship between scores on the
Agitation Severity Scale and scores on the Overt Agitation Severity Scale
(Burns & Grove, 2009; Yudofsky et al., 1997). Pearson’s product-moment
correlation coefficient was calculated for this purpose.
8. Principle components analysis was defined as a set of mathematical
techniques aimed at examining the underlying structure of the items
comprising the Agitation Severity Scale (Nunnally, 1978).
9. Agitation Severity Scale Scores were conceptually defined as scores
representative of the degree of agitation, a range of observable behaviors
that can be characterized as a manifestation of an individual human
being’s struggle to adapt to some circumstance or happening within their
15

internal or external environment. Operationally, Agitation Severity Scale
scores were defined as the sum of items endorsed on the instrument.
10. Overt Agitation Severity Scale Scores were defined as scores obtained by
multiplying intensity scores by frequency scores on the OASS instrument.
Conceptually, OASS scores were defined as an objective measure of
observable behavior representative of agitation (Yudofsky et al., 1997).
Assumptions
There were several assumptions, based on the works of Roy and Peplau,
underlying this study (Peplau, 1952; Roy, 2008). First, it was assumed that there
is a range of behaviors representative of the concept of agitation. It was further
assumed that those behaviors are observable manifestations of an individual
human being’s struggle to adapt to some circumstance or happening within their
internal or external environment. When agitated behavior is not identified, a lack
of appropriate interventions can lead to the escalation of agitated behavior to
aggressive behavior, as well as to interference with the optimal development of
the nurse-patient relationship. Finally, it was assumed that nurses and other
clinicians can identify behaviors representative of agitation.
Limitations
For this investigation, subjects were observed on a convenience basis and
therefore, the results obtained cannot be considered representative of all adult
16
acute psychiatry patients attending emergency departments. Due to the
geographic location of the study institution, the study sample was, as
anticipated, primarily white and, as a result, is not necessarily representative of
results for people of different races. The study was conducted at a single
institution by a single investigator and the results are reflective of this.
Summary
Agitation has serious implications for patients who experience it,
including the escalation of agitated to aggressive behaviors, physical restraint,
and disruption of the establishment of the therapeutic nurse-patient
interpersonal relationship. To date, agitation in the adult acute psychiatry
population has been rarely studied and is defined in an inconsistent manner,
with few rating scales designed measure it objectively. This study addressed
these issues by examining the measurement of agitation in the acute psychiatry
population. The aim of the study was an evaluation of the psychometric
properties, using both classical test theory and item response theory (1-
parameter logistic or Rasch) analyses, of the Agitation Severity Scale when used
with the population of interest.
17

CHAPTER 2
Review of the Literature
Introduction
Agitation is a symptom frequently observed in behavior management
patients presenting to the Emergency Department (ED) (Young, 1987). Despite its
prevalence, there is no standard, accepted definition of agitation in the scientific
literature (Day, 1999).
Walker and Avant (2005) described the importance of clarifying concepts
such as agitation, “The only way we will be able to demonstrate the evidence
base for our practice is to be able to first describe the phenomena in a measurable
or at least communicable way” (p. 63). Emergency nurses caring for acute
psychiatric patients do not currently possess a common definition for agitation;
there is conceptual confusion and the boundaries of agitation and closely related
concepts are unclear. This lack of conceptual clarity interferes with emergency
nurses’ ability to identify, describe, and monitor the range of behaviors currently
identified as agitation. Without conceptual clarity around agitation, little can be
done to develop effective measurement instruments or evaluate interventions
aimed at improving agitated symptoms in emergency patients. With this in
mind, a review of the current literature on the construct of agitation and the
related concepts of anxiety and aggression is presented, followed by a review of
18

existing instruments utilized to measure agitation severity. The process of
instrument development is also discussed. The purpose of this review is to
establish support for the continued development and psychometric testing of the
Agitation Severity Scale.
Agitation, anxiety, and aggression. The word agitation has its origins in
the Latin agitationem, meaning “motion, agitation, moving to and fro,” and has an
early English definition of “mental tossing to and fro” (Online Etymology
Dictionary, 2009). Additional sources provide similar definitions, “the act of
agitating or the state of being agitated; extreme emotional disturbance; the
stirring up of public interest in a matter of controversy,” and “a state of extreme
emotional disturbance; the feeling of being agitated, not calm” (American
Heritage Dictionary, 2009; WordNet 3.0, 2006). Medical, nursing, and allied
health dictionary definitions are represented by the following: “extreme
restlessness, as manifested in depression and other mental disorders,”
“describing a condition of psychomotor excitement characterized by purposeless,
restless activity,” “excessive restlessness, increased mental and physical activity,
especially the latter; severe motor restlessness, usually nonpurposeful, associated
with anxiety,” and “severe anxiety associated with motor restlessness” (Miller-
Keane & O’Toole, 1997, p. 44; Anderson, Anderson, & Glanze, 1998, p. 50; Venes,
2009, p. 61; Sadock & Sadock, 2005, p. 849). The Diagnostic and Statistical Manual
19

of Mental Disorders (DSM-IV-TR) (American Psychiatric Association, 2000, p.
139) described agitation as, “excessive motor activity associated with a feeling of
inner tension.”
Authors have often cited the definition developed by Cohen-Mansfield
and Billig (1986): “inappropriate verbal, vocal, or motor activity that is not
explained by needs or confusion, per se” (p. 712). In research reports relating to
agitation in the nursing, medical, and allied health literature, this is the most
commonly utilized definition.
Review of published definitions and research on agitation reveals two
defining attributes whose existence has been deemed necessary for agitation to
be present. These defining attributes are 1) excessive motor and/or vocal activity,
and 2) judged inappropriateness of the observed activity. In every discussion of
agitation reviewed, excessive motor activity is identified as an essential
component of agitation. Most definitions include excessive or repetitive vocal or
verbal activity as a component of motor activity. Table 1 summarizes agitation
attributes described in the literature.
The observer-judged inappropriateness of the motor or vocal activity is
the second attribute currently defining agitation. While Kong identified the word
“inappropriate” as “a value-laden term” (2005, p. 528), it has been widely-
accepted by most authors describing agitation. Cohen-Mansfield and Billig (1986)
20

Table 1. Agitation attributes identified in the literature.
Excessiveness Non-purposeful behavior
Barnes & Raskind, 1980 Barnes & Raskind, 1980Taft, 1989 Day, 1999Mungas et al., 1989 Kopecky & Yudofsky, 1999Bogner & Corrigan, 1995Haskell, et al., 1997Zubenko, 1998Kopecky & Yudofsky, 1999Cohen-Mansfield & Billig, 1986
Inappropriateness Observable behaviors
Cohen-Mansfield & Billig, 1986 Rosen et al., 1992Taft, 1989 Hurley et al., 1999Kopecky & Yudofsky, 1999 Kopecky et al., 1998
Cohen-Mansfield, 2003Repetitiveness
Cohen-Mansfield & Billig, 1986Cohen-Mansfield et al., 1989American Psychiatric Association, 1994Rosen et al., 1994Hurley et al., 1999Day, 1999Bogner et al., 2000
Non-specific behaviors
Barnes & Raskind, 1980Struble & Sivertsen, 1987Ancill, 1991Roper, 1991Gerdner & Buckwalter, 1994Verma et al., 1998Lindenmayer, 2000Webster & Grossberg, 2003Cohen-Mansfield, 2003
21

specifically identify three categories of inappropriateness for agitated behavior:
behavior that is abusive or aggressive to self or others, appropriate behavior
performed with inappropriate frequency, and behavior that is inappropriate
according to social standards or norms for the specific situation. While the
inappropriateness of agitated behavior is widely recognized by clinicians, the
conceptualization of particular behaviors as inappropriate has important
implications for value judgments that are easily transferred from a behavior to a
patient as an individual. For the purposes of this project, observer judgment on
appropriateness was not required for agitation to be deemed present.
Anxiety is a concept that is closely related to agitation. The Diagnostic and
Statistical Manual of Mental Disorders (DSM-IV-TR) (American Psychiatric
Association, 2000) describes anxiety as consisting of subjective symptoms
manifested through a variety of somatic complaints expressed by patients.
Subjective descriptions of anxiety provided by patients include
apprehensiveness, distractibility, difficulty sleeping, difficulty concentrating,
muscular tension, headaches, fear, nervousness, palpitations, and nausea
(Jönsson, 2007; Watkins, Grossman, Krishnan & Sherwood, 1998; Brenes, Miller,
Stanley, Williamson, Knudson & McCall, 2009; Victor & Bernstein, 2009; Spira,
Stone, Beaudreau, Ancoli-Israel, Yaffe, 2009). This review provides clear
evidence that patients’ subjective descriptions of anxiety are not consistent with
22

the identified defining attributes of agitation, suggesting that they are
independent, but related concepts.
Aggression is another concept closely related to agitation. It is important
to note that aggression is described as overt physical or verbal attacks towards
the self, others, or objects (Yudofsky, Silver & Hales, 2008) while agitated
behavior is not necessarily aggressive in nature. The demonstration of aggressive
behaviors by agitated persons often leads to the blurring of conceptual
boundaries and difficulty in evaluating individual agitated patients.
It should be noted that the majority of published work on agitation relates
specifically to older adults, particularly those with dementia or dementia-like
illnesses. While some authors have examined agitation in post-brain injury
patients, very little literature regarding agitation observed specifically in acute
psychiatric patients is available (Zun & Downey, 2008). The reasons for this gap
are unknown, but given that the differentiation of anxiety, agitation, and
aggression is subjective and difficult, it is not surprising.
In sum, agitation can be described as a continuum of observable,
bothersome behaviors ranging from anxiety to aggression. There is a subjective
component of agitation experienced by patients, but there are also behaviors that
are able to be observed by others. In addition, there are currently a number of
valid and reliable instruments often used to measure agitation, including those
23

developed for the measurement of different constructs, such as aggression or
sedation. The next section will review those instruments.
Research related to the measurement of agitation. Numerous rating
scales have been previously developed with the aim of measuring agitation and
many more, developed to measure other constructs such as mania or sedation,
are frequently used by clinicians in an attempt to quantify agitation. Table 2
summarizes these existing instruments by title, author(s), type, construct
measured, and reported reliability and validity. Despite the number of available
instruments, none has been developed for or is appropriate to use with acute
psychiatric patients in the emergency setting.
Agitation assessment instruments. One of the most widely cited agitation rating
instruments is the Cohen-Mansfield Agitation Inventory (CAMI) (Cohen-
Mansfield, 1986). Originally designed for use by researchers, the CAMI
instrument consists of a list of 29 behaviors rated on a 7-point scale of frequency.
An important limitation of the CAMI is its requirement that ratings pertain to
behavior observed in the two weeks prior to CAMI administration. Calculating a
total score for the CAMI is not recommended; rather, the author encouraged
users to monitor particular behaviors of interest over time. This scoring method
encourages individual users of the CAMI to create individual conceptualizations
of the included behaviors, combining behaviors considered applicable to create
24

individual scoring systems for specific investigations. Ultimately, this method
has limited the interpretation of findings obtained using the CAMI as it creates
the situation in which the concept of agitation is not measured consistently or
specifically. Rather, groupings of disruptive behaviors that occur along a
continuum between anxiety and aggression are measured.
Psychometric analysis of the CAMI demonstrated strong interrater
reliability, r = 0.92 (Cohen-Mansfield & Billig, 1986). Factor analysis revealed
three factors in a sample of 32 patients: physically aggressive behavior, verbally
aggressive behavior, and nonaggressive behavior. Despite years of wide usage,
the results of this factor analysis might be considered suspect as the technique
generally requires a sample of 100 or more observations or 5 to 10 participants
per item (Marsh & Hocevar, 1983). The observational time frame, scoring
methodology, lack of an assessment of agitation in the present moment, and
intended population make the CAMI inappropriate for use with the psychiatric
emergency patient.
Developed for the assessment of agitation in patients with
traumatic brain injury, the Agitated Behavior Scale (ABS) is a 14-item,
observation-based instrument that rates individual behaviors representing
agitation according to their presence and frequency (Corrigan, 1989). The ABS is
intended for use over time so that the effects of treatment interventions may be
25

Table 2. Summary of Published Instruments Utilized for Measuring Agitation.
INSTRUMENT AUTHOR(S) TYPE CONSTRUCT RELIABILITY & VALIDITYYoung Mania Rating Scale (YMRS)
Young, Biggs, Ziegler, Meyer, 1978
Observational Rating Mania Interrater Reliability: r = 0.84Intraclass Correlation: r = 0.36 – 0.96Inter-item Correlation YMRS and Petterson Rating Scale: r = 0.88; YMRS and Beigel Mania Rating Scale: r = 0.71; YMRS and global mania rating scale: r = 0.88.
Cohen-Mansfield Agitation Inventory (CAMI)
Cohen-Mansfield, 1986
Observational Rating or Interview Rating
Agitated Behavior Interrater Reliability: r = 0.92Factor analysis = 3 factors: aggressive behavior, physically non-aggressive behavior, verbally agitated behavior
Brief Psychiatric Rating Scale (BPRS)
Overall & Gorham, 1962
Observational Rating or Interview Rating
Conceptual disorganization
Hallucinatory behaviors
Unusual thought content
Emotional withdrawal
Interrater Reliability: r = 0.80 or greater for 10 of 13 studies in a comprehensive reviewInter-item correlation between BPRS and Scale for the Assessment of Positive Symptoms & Scale for the Assessment of Negative
26

Motor retardationHostilitySuspiciousnessUncooperativenessAnxietyGuilt feelingsDepressive moodTensionMannerisms and posturing
Excitement
Symptoms: r = 0.63
Disruptive Behavior Rating Scale (DBRS)
Mungus, Weiler, Franzi, Henry, 1989
Observational Rating Physical AggressionVerbal AggressionAgitationWandering
Agitation: correlation between the DBRS & Nurse’s Assessment Ratings for severity: r = 0.73, p = 0.001For distress: r = 0.51, p = 0.05Interrater Reliability: r = 0.70
Agitated Behavior Scale (ABS)
Corrigan, 1989 Observational Rating DisinhibitionAggressionLability
Interrater Reliability: r = 0.92Factor analysis = 3 factors: disinhibition, aggression, lability
Overt Aggression Scale – Modified (OAS-M)
Coccaro, Harvey, Kupsaw-Lawerence,
Interview Rating AggressionIrritabilitySuicidality
Interrater Reliability: ICC > 0.91Test-retest Reliability: ICC =
27
Herbert, Bernstein, 1991
0.46, 0.54 (1 and 2 weeks)Inter-item Correlation OAS-M and AIAQ: r = 0.48, 0.44, 0.53, 0.36 for subscales
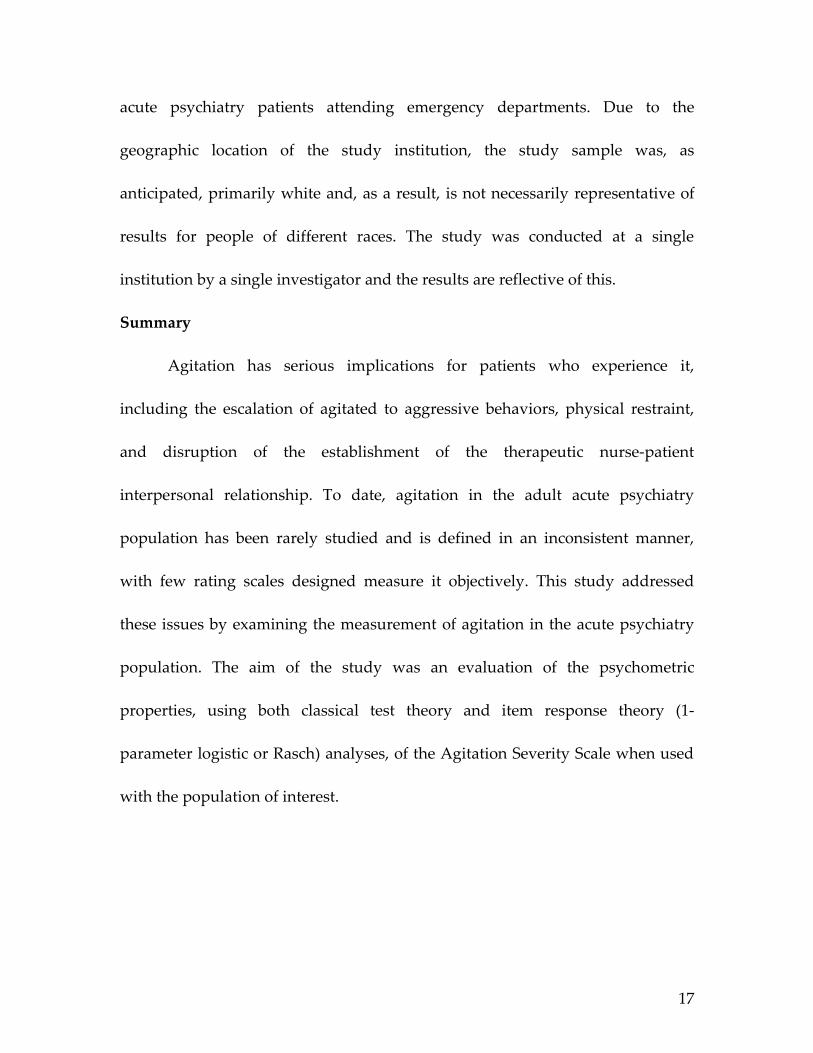
Anger, Irritability, and Assault Questionnaire (AIAQ)
Coccaro, Harvey, Kupsaw-Lawrence, Herbert, Bernstein, 1991
Self-Report Labile angerIrritabilityAssault
Test-retest Reliability: r = 0.57-0.86, 0.70-0.76, 0.53-0.93 for subscalesInter-item Correlations AIAQ and OAS-M: r = 0.50, 0.48 for subscales
Behavioral and Emotional Activities Manifested in Dementia (BEAM-D)
Sinha, Zemlan, Nelson, Bienenfeld, Thienhaus, Ramaswamy, Hamilton, 1992
Observational Rating HostilityAggressionDestructionDisruptionUncooperativenessNon-complianceAttention-seekingSexually inappropriate
WanderingHoarding
Interrater Reliability: r = 0.90
Brief Agitation Rating Scale (BARS)
Finkel, Lyons, and Anderson, 1993
Observational Rating Physical AggressionPhysical Non-Aggressive
Verbal Agitation
Inter-item correlation between CMAI and BARS: r = 0.74 – 0.82Interrater Reliability: r = 0.73
28
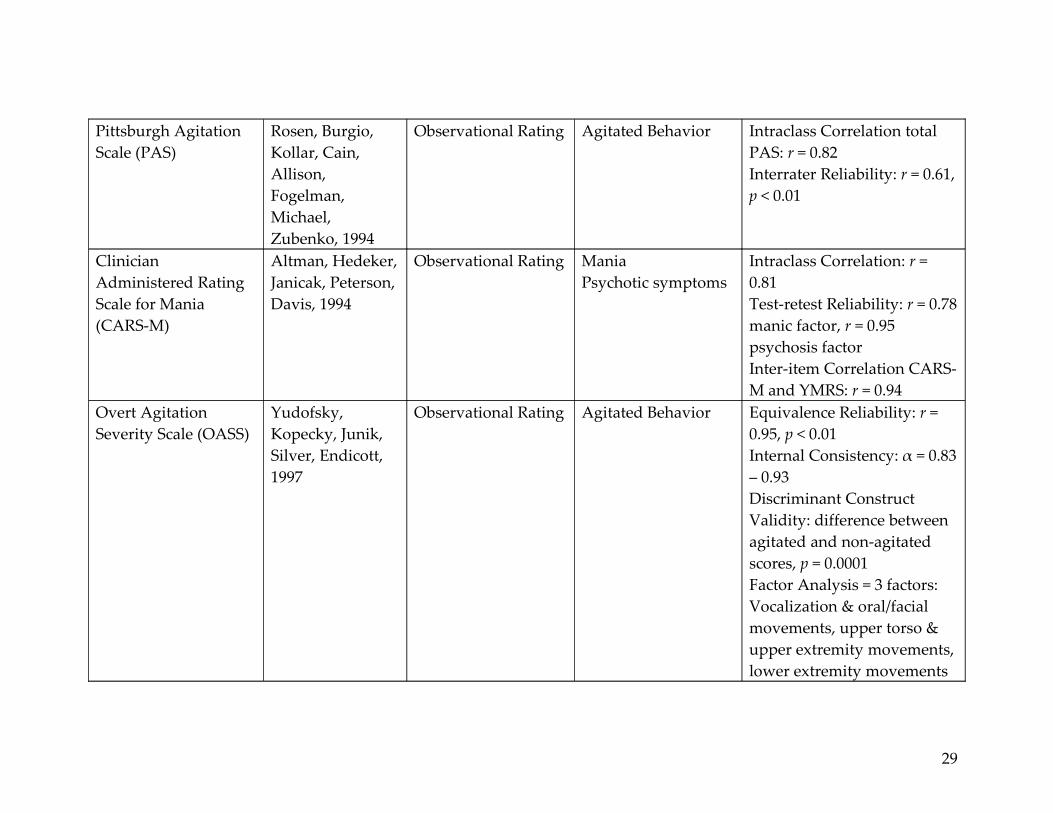
Pittsburgh Agitation Scale (PAS)
Rosen, Burgio, Kollar, Cain, Allison, Fogelman, Michael, Zubenko, 1994
Observational Rating Agitated Behavior Intraclass Correlation total PAS: r = 0.82Interrater Reliability: r = 0.61, p < 0.01
Clinician Administered Rating Scale for Mania (CARS-M)
Altman, Hedeker, Janicak, Peterson, Davis, 1994
Observational Rating ManiaPsychotic symptoms
Intraclass Correlation: r = 0.81Test-retest Reliability: r = 0.78 manic factor, r = 0.95 psychosis factorInter-item Correlation CARS-M and YMRS: r = 0.94
Overt Agitation Severity Scale (OASS)
Yudofsky, Kopecky, Junik, Silver, Endicott, 1997
Observational Rating Agitated Behavior Equivalence Reliability: r = 0.95, p < 0.01Internal Consistency: α = 0.83 – 0.93Discriminant Construct Validity: difference between agitated and non-agitated scores, p = 0.0001Factor Analysis = 3 factors: Vocalization & oral/facial movements, upper torso & upper extremity movements, lower extremity movements
29

Sedation-Agitation Scale (SAS)
Riker, Picard, Fraser, 1999
Observational Rating SedationAgitation
Interrater Reliability: r = 0.83, p < 0.001Weighted kappa: k = 0.92, p < 0.001Inter-item Correlation: SAS with Ramasy: r = 0.83, p <0.001, SAS with Harris: r = 0.86, p < 0.001
30

assessed. To administer the scale, an observer rates each listed behavior on a
scale of 1 to 4, where 1 is a “not present” and 4 indicates behavior “present to an
extreme degree.” From these ratings, a total score is calculated and may be
followed over time. Subscale sores for Disinhibition, Aggression, and Lability can
also be calculated by summing particular scale items.
The initial study of the ABS was conducted with a sample of post-
traumatic head injury patients being treated on an inpatient rehabilitation unit.
Appropriate levels of interrater reliability, internal consistency, and concurrent
validity were established (Corrigan, 1989). Later works further substantiated
construct validity by identifying the underlying factor structure of the ABS
(Corrigan & Bogner, 1994; Bogner, Corrigan, Bode & Heinemann, 2000). The
ability of the ABS to predict changes in cognitive status (Corrigan & Mysiw,
1988) and to differentiate between confusion and inattention (Corrigan & Mysiw,
1988; Corrigan, Mysiw, Gribble, & Chock, 1992) has also been established.
Interrater reliability was later re-examined with both traumatic brain injury and
dementia patients, where correlation coefficients for the brain injury subset were
r = 0.920 and for the dementia subset ranged from r = 0.860 to 0.906 (Bogner,
Corrigan, Stange, Rabold, 1999).
Despite the ABS’ strong psychometric properties in two populations, the
instrument has not been studied in a psychiatric population, or in a setting
31

requiring frequent re-assessments such as the emergency department. In
addition, the underlying characteristics of the construct of agitation vary from
population to population, those identified for the head injury and dementia
populations may differ from those observed in patients with psychiatric
disorders.
The Brief Agitation Rating Scale (BARS) is a 10-item instrument designed
to measure agitation in elders with dementia (Finkel, Lyons, & Anderson, 1993).
The items for the scale were derived from items on the Cohen-Mansfield
Agitation Inventory (CAMI). BARS items are rated by observing clinicians based
upon the frequency of occurrence and include behaviors such as hitting,
restlessness, and pacing/aimless wandering. Interrater reliability between rater
pairs was reported as r = 0.73. Internal consistency reliability was evaluated for
each of three nursing shifts and was r = 0.74, 0.82, and 0.80 for days, evenings,
and nights, respectively. Correlations between the BARS and CAMI on the shifts
were r = 0.95, 0.94, and 0.95. Convergent validity is supported by significant
correlations with scores on the Behavioral Pathology in Alzheimer’s Disease
(BEHAVE-AD) and Behavioral Syndromes Scale for Dementia (BSSD)
instruments. The BARS is limited in that it was not designed for or tested in
populations other than geriatric dementia patients. In addition, it requires the
recall of the clinical provider over a period of 2 weeks.
32

The Pittsburgh Agitation Scale (PAS) is an intensity rating instrument
designed to measure the degree of severity of observed behavior in patients with
dementia (Rosen, Burgio, Kollar, Cain, Allison, Fugleman, Michael, & Zubenko,
1994). The PAS measures four types of behavior including: aberrant
vocalizations, motor agitation, aggressiveness, and resisting care. Reliability
examinations demonstrated moderate interrater reliability (r = 0.61, p < 0.01) and
a strong interclass correlation, r = 0.82. Construct validity was assessed utilizing
the known-groups method, examining the extent to which the PAS instrument
measured agitation in individuals known to be agitated as compared to
individuals known not to be agitated. Correlation between PAS behaviors and
the degree of agitation in those known to be agitated was r = 0.87 while a
correlation of r = 0.10 was observed in the group known not to be agitated (Rosen
et al., 1994).
This observation-based scale is relatively simple to use as the scale is
comparatively brief and requires only direct observation of the individual by the
rater. The scale is limited in its theoretical basis as agitation is defined only as
aggressiveness, excluding the continuum of behaviors lying between anxiety and
aggression. In addition, the instrument has not been psychometrically evaluated
in populations other than those with dementia.
33

Initially developed with a sample of elderly psychiatric inpatients, the
Overt Agitation Severity Scale (OASS) was designed to measure the frequency
and intensity of agitated behaviors (Yudofsky, Kopecky, Kunik, Silver, Endicott,
1997). The OASS differs from other agitation rating scales conceptually in that it
is intended to measure observable agitated behavior without regard for its
underlying cause. The scale consists of 47 behaviors characterizing agitation that
are subcategorized into 12 behaviorally-related units (Yudofsky et al., 1997). The
12 units are further divided into three groups for ease of administration:
vocalizations and oral/facial movements, upper torso and upper extremity
movements, and lower extremity movements. In scoring the OASS, intensity
scores are multiplied by frequency scores for each behavior in all three sections
prior to summing these values.
Early psychometric testing evaluated internal consistency with corrected
split-half reliabilities for two raters. For rater 1, r = 0.88 and for rater 2, r = 0.91.
Evidence of equivalence reliability was provided by a corrected Pearson’s
correlation coefficient of 0.90, p < 0.01 between the total OASS scores of the two
raters. Evidence of convergent construct validity was established by strong
associations between the OASS and Pittsburgh Agitation Scale (PAS) (r = 0.81,
0.82 for two raters) while support for discriminant validity between the OASS
and Overt Aggression Scale (OAS) was provided by a low positive correlation, r
34

= 0.28, p < 0.01. Additional evidence of discriminant validity was provided
through a low positive correlation between agitated and non-agitated ratings (r =
0.29, p < 0.01). (Yudofsky et al., 1997) Later study of the OASS provided evidence
of reliability and validity in a population of adult psychiatric inpatients
(Kopecky, Kopecky, & Yudofsky, 1998).
Limitations of the OASS instrument for the emergency setting include the
calculation involved in scoring and the fifteen minute observation period
required. However, considering observable agitated behaviors without concern
for their underling cause is a useful strategy in planning assessment for
emergency department patients with undifferentiated agitation.
Riker and colleagues developed the Sedation-Agitation Scale (SAS) for use
with critically ill adults (1999). The found the SAS to be reliable, with strong
interrater agreement (r = 0.86, p < 0.001), and valid, as demonstrated by high
correlations with both the Harris and Ramsay scales (Ramsay, Savege, Simpson,
& Goodwin, 1974; Harris, O’Donnell, & Macmillan, 1991). The population
studied consisted of 45 intensive care unit patients, 78% of whom were intubated
(Riker, Picard & Fraser, 1999).
The SAS is a seven-point observation-based scale covering a range of
behaviors frequently observed in intubated critical care patients. The scale is
anchored with descriptors ranging from “unarousable” to “dangerous agitation,”
35
where the latter is defined as, “pulling at endotracheal tube, trying to remove
catheters, climbing over bedrail, striking at staff, thrashing side-to-side.” The
SAS is widely used in critical care settings, but has also been used to evaluate
patients with psychiatric-based symptomatology. The instrument was not
developed for and has not been studied in populations other than the critically
ill. While widely used in the intubated critical care population, the SAS measures
behaviors different from those observed in emergency psychiatric patients and is
not appropriate for use with this population.
Mania assessment instruments. The Young Mania Rating Scale (YMRS)
was designed to measure the severity of manic symptoms and to evaluate the
effect of treatment on mania severity (Young, Biggs, Ziegler, & Meyer, 1978). The
instrument is a list of eleven items ranked on scale of 0-4 or 0-8. Items were
selected as representative of the core features of mania and were intended to
reflect symptoms occurring in both mild and severe illness. Interrater reliability
has been established at r = 0.84 (Altman, Hedeker, Janicak, Peterson, & Davis,
1994), while intraclass correlation coefficients among raters evaluating 14
videotapes of patients ranged from r = 0.36 to r = 0.96.
Validity for the YMRS was examined by comparing its performance with
the Petterson Mania Scale (Petterson, Fyro, & Sedval, 1973) the Brief Mania
Rating Scale (BMRS) (Beigel, Murphy, & Bunney, 1971), and a global measure of
36

mania (Young, Biggs, Ziegler, & Meyer, 1978). Correlation between the YMRS
and a global mania measure was r = 0.88, between the YMRS and the BMRS was
r = 0.71, and between the YMRS and the Petterson Rating Scale was r = 0.89. In
addition, Young and colleagues found the YMRS to be sensitive to change as
treated manic patients demonstrated statistically significantly different scores
when compared with the scores of manic patients prior to treatment (1978).
Despite demonstrated reliability and validity, the YMRS has very limited
utility for measurement of agitation in the emergency department because it does
not specifically measure the construct of agitation, requires 15 to 30 minutes to
administer, and has not been studied in other populations, such as a mixed
emergency department population.
The Clinician Administered Rating Scale for Mania (CARS-M) was
designed to evaluate the severity of symptoms representative of the core features
of mania and to detect changes in manic symptoms over time or with treatment
(Altman, Hedeker, Janicak, Peterson, & Davis, 1994). The CARS-M consists of 15
items that are rated from 0 to 5 using a Likert-type scale with the exception of a
single item that is scored on a 0 to 4 scale. The instrument includes subscales for
both mania and psychotic symptoms, and takes approximately 30 minutes for
clinicians to administer.
37
From their study of 96 patients with bipolar disorder, schizoaffective
disorder, major depressive disorder, and schizophrenia, Altman and colleagues
found internal consistency, as measured by Cronbach’s alpha, to be 0.63 for the
psychosis factor and 0.88 for the manic factor (1994). The intraclass correlation
coefficient for 5 raters of 14 videotaped patients was 0.81, on average, with a
range of 0.54 to 0.99. Test-retest reliability was r = 0.78 for the manic factor and r
= 0.94 for the psychosis factor. Validity was examined by comparison with the
Young Mania Rating Scale (YMRS) and their correlation was found to be 0.94.
As with the YRMS, the CARS-M does not measure the construct of
agitation, requires a significantly long period of time to administer, and has not
been studied in a mixed emergency department population.
Psychiatric symptoms assessment instruments. Developed in
hospitalized patients with functional psychotic disorders, the Brief Psychiatric
Rating Scale (BPRS) is a clinician-administered observation and interview-based
tool designed to measure changes in symptomatology in those experiencing
psychotic illness (Overall & Gorham, 1962, 1988). The instrument initially
consisted of 16 items, with two additional added in 1972. Today the full, 18-item
instrument is most commonly used to gauge the effectiveness of treatment
interventions.
38

Numerous studies have examined some of the psychometric properties of
the BPRS (Hedlund & Vieweg, 1980; Flemenbaum & Zimmermann, 1973). A
review of published research using the BPRS and reporting interrater reliability
found Pearson correlations to be 0.80 or greater in 10 of 13 reviewed studies.
Little data on internal consistency are currently available, with one study
defining only positive and negative symptoms demonstrating good internal
consistency, Cronbach’s alpha = 0.81 and 0.91, respectively. (Nicholson,
Chapman, Neufeld, 1995).
Hedlund and Vieweg (1980) report on many studies comparing scores on
the BPRS to those obtained with other scales. Items from the BPRS recognized as
components of the diagnostic criteria for schizophrenia (e.g. conceptual
disorganization, emotional withdrawal) have been found to be correlated with
scores on two scales designed to measure the severity of both positive and
negative symptoms in those with schizophrenia or schizoaffective disorder, r =
0.63. (Gur, Mozley, Resnick, Levick, Erwin, Saykin, & Gur, 1991). BPRS positive
and negative symptoms scores have also been correlated with scores from the
Positive and Negative Syndrome Scale (PANSS), r = 0.92 and 0.82, respectively
(Bell, Milstein, Beam-Goulet, Lysaker, & Cicchetti, 1992). Total scores for the
BPRS and PANSS were also highly correlated, r = 0.84. To date, hundreds of
investigators have utilized the BPRS successfully in studies to measure change in
39

psychotic symptoms, particularly in pharmacologic treatment trials (Perkins,
Stroup, & Lieberman, 2000). Agitation is not represented as an item on any of the
four BPRS subscales.
The Behavioral and Emotional Activities Manifested in Dementia (BEAM-
D) Scale was developed to facilitate the assessment of disruptive behaviors often
present in dementia, in particular for the evaluation of treatment efficacy (Sinha,
Zemlan, Nelson, Bienenfeld, Thienhaus, Ramaswamy, & Hamilton, 1992).
Instrument utilization is based on interviews with both patients and caregivers.
Behavioral categories within the BEAM-D are considered to represent clinically
significant deviations from normative behavior in geriatric dementia patients,
including: hostility/aggression, destruction of property, disruption of others’
activities, uncooperativeness, noncompliance, attention-seeking behavior,
sexually inappropriate behavior, wandering, and hoarding.
Reliability and validity have been assessed for the BEAM-D in a cohort of
45 patients diagnosed with degenerative dementia. The mean interrater
reliability for BEAM-D items was r = 0.90. (Sinha et al., 1992; Teri & Logsdon,
1995) Concurrent validity was established through comparisons with scores on
the Brief Psychiatric Rating Scale (BPRS) and the Sandoz Clinical Assessment-
Geriatric (SCAG). Strong relationships with conceptually similar behavioral
dimensions were noted between BEAM-D items and items from the BPRS and
40

SCAG. (Sinha et al., 1992). Because the BEAM-D requires interviews with
patients and caregivers, and because it is intended to measure deviation from
behavioral norms for geriatric patients with dementia, it is not appropriate for
use with emergency psychiatric patients.
Aggression assessment instruments. The Disruptive Behavior Rating
Scale (DBRS) is an observation-based instrument developed for measuring
agitation in patients with dementia (Mungus, Weiler, Franzi, & Henry, 1989). The
instrument measures four dimensions of disruptive behavior frequently
demonstrated by those with dementia, including: physical aggression, verbal
aggression, agitation, and wandering. Interrater reliability for the scale has been
established at r = 0.70 with a sample of sixteen patients. Discriminate and
convergent validity have also been established for all of the instrument subscales,
excepting the verbal aggression component.
The DBRS is used over a period of seven days in order to evaluate for
changes in disruptive behavior over time. This feature may be useful in research
or extended care settings, but renders the instrument inappropriate for use in the
emergency setting. As with other instruments, the DBRS was developed for use
with dementia patients and has not been studied in other populations.
With items adapted from the inpatient-only Overt Aggression Scale
(Yudofsky, Silver, Jackson, Endicott, & Williams, 1986), the Overt Aggression
41

Scale – Modified (OAS-M) was developed to assess manifestations of aggression
in outpatients (Coccaro, Harvey, Kupsaw-Lawrence, Herbert, & Bernstein, 1991).
The OAS-M measures the severity, type, and frequency of aggressive behavior
in three domains: aggression, irritability, and suicidality. Reliability was studied
in a sample of 22 subjects with either personality disorder or major depressive
disorder. Interrater reliability for the aggression and irritability domains was
greater than 0.91. Test-retest reliability, assessed over a 1-to-2 week period was
0.46 and 0.54 for aggression and irritability, respectively. This result is to be
expected given that aggression is a variable, rather than static, behavior.
Intercorrelations between scores on the irritability and aggression subscales were
r = 0.53, suggesting that the subscales are measuring a related construct. Later
work using standardized patients demonstrated improved interrater reliability
with interclass correlation coefficients between 0.96 and 0.98 (Endicott, Tracy,
Burt, Olson, & Coccaro, 2002). External validity has only been evaluated by
comparing items on the OAS-M with items from the Anger, Irritability, and
Assault Questionnaire (AIAQ). Correlations between OAS-M subjective
irritability items and AIAQ irritability items were not significant. The OAS-M
Global Irritability subscale did correlate with the AIAQ Labile Anger Subscale, r
= 0.48. No psychometric data on the suicidality portion of the OAS-M instrument
is currently available.
42

The OAS-M is a 25-item, clinician-administered semi-structured interview.
It takes approximately 30 minutes to interview patients and utilize the
instrument. Scoring the OAS-M is more complicated than with some other
instruments as four formats are used, subscale items are not mutually exclusive,
and the final score involves the weighted sum of all observed/reported
behaviors. As with other scales, the OAS-M does not specifically measure
agitation and was designed to measure behavior occurring over approximately 1
week’s time, rather than acutely.
Designed for use in neurobiological patients, the Anger, Irritability, and
Assault Questionnaire (AIAQ) measures impulsive aggression (Coccaro, Harvey,
Kupsaw-Lawrence, Herbert, & Bernstein, 1991). The three original instrument
domains, Labile Anger, Irritability, and Assault, were chosen for their
relationships with serotonin dysfunction in impulsive-aggressive patients. A
later version of the instrument adds the domains of Indirect Assault and Verbal
Assault (Coccaro & Kavoussi, 1997). The original AIAQ instrument is a self-
report survey consisting of 84 items, while the revised version has 210 items. For
the AIAQ, scores are computed for the subscales only; no total score is
calculated.
While little published data on the AIAQ exist, the original research on the
first version of the AIAQ provided data for 20 outpatient psychiatric subjects and
43

22 nonpatient control subjects. Test-retest reliability was measured over a 1-to-2
week period, with coefficients for the psychiatric subjects reported to be 0.57-0.86
for the Labile Anger subscale, 0.70-0.76 for Irritability, and 0.53-0.93 for Assault.
Nonpatient control subjects had test-retest reliability coefficients of 0.66-0.98 for
Labile Anger, 0.88-0.94 for Irritability, and 0.78-0.84 for Assault. External validity
has only been evaluated by comparing items on the AIAQ with items from the
Overt Aggression Scale – Modified (OAS-M). Correlations between OAS-M
Subjective Irritability items and AIAQ Irritability items were not significant. The
OAS-M Global Irritability subscale correlated poorly with the AIAQ Labile
Anger subscale, r = 0.48 and the Irritability subscale, r = 0.48.
The AIAQ was designed for research rather than clinical purposes and
requires cooperative patients who are able to read English and self-report their
symptoms. The instrument may take up to 50 minutes for patients to complete
and it has not been studied in other populations. Therefore, this instrument is not
appropriate for use in the emergency setting.
In sum, these instruments are not appropriate for use in the emergency
setting with acute psychiatric patients. Many were developed for evaluating
agitation over a long period of time, require lengthy observation periods not
possible in the emergency department, and are too long for use in this fast-paced
environment. In addition, none was specifically developed for the population of
44

interest. Clinicians are left without a reliable, valid measure to assess agitation in
this specific population.
Instrument Development
Nunnally (1978) described measurement as consisting of rules for the
assignment of numbers to objects in such a way as to represent quantities of
attributes. We are not measuring objects; rather, we measure their attributes. In
classical measurement theory, it is assumed that every observed score on any
scale is made up of a quantity of true score and a quantity of error score (Crocker
& Algina, 2008; Waltz, Strickland, & Lenz, 1991; Nunnally, 1978). Nunnally
stressed the importance of minimizing measurement error as it affects the
distribution of observed scores around the true score. He proposed that reducing
sources of error, such as errors in scoring, subjectivity, poorly standardized
instructions, and sampling bias, is essential to increasing the reliability of our
instruments (1978).
There are two models of measurement error in classical measurement
theory: domain-sampling and parallel tests. The parallel test model assumes that
the correlation between any two tests in a single domain is a complete and
precise determination of the reliability coefficient, rather than an estimate (Waltz,
Strickland, & Lenz, 1991). The domain sampling model, the model for
measurement error used in this study, assumes instruments to be comprised of a
45

random sample of items drawn from a hypothetical domain of all items that
measure the core concept (Nunnally, 1978). This model allows for analysis of
scores that a subject would obtain if all possible items in that domain were
measured. Reliability here depends on the correlation of sample items with true
scores and is reflective of the degree to which measures are free of measurement
error.
Defining the construct. Exploration and definition of the construct of
agitation was completed following the stages proposed by Green and Lewis for
developing the foundation of content validity (1986). Their steps include (a)
reviewing the literature, (b) personal reflection and dialog on the concept being
studied, (c) identifying the substrata or the components that make up the
concept, (d) identifying multiple items that demonstrate the concept, and (e)
empirical analysis of the items and their interrelationships. Development of the
Agitation Severity Scale to the time of the current study is described in Chapter
3.
Reliability. Reliability addresses the consistency or repeatability of a
given measure over time (Crocker & Algina, 2008; Strout & Kendrick, 2008;
Burns & Grove, 2009; Jacobson, 1997) and is considered to be one measure of
random error in the measurement technique. As human constructions,
instruments designed to measure human behavior cannot perfectly capture the
46

complexities of the phenomena they are intended to measure. Measurement
error is defined as the difference between an abstract concept or idea, considered
the ‘true’ state, and the ‘observed’ measurement provided by an empirical
instrument (Carmines & Zeller, 1979; Crocker & Algina, 2008; Higgins & Straub,
2006). As reliability exists in degrees, it is expressed as a correlation coefficient
where +1.00 (more precisely, nearly +1.00 as reliability cannot ever reach exactly
+1.00) represents perfect correlation between ‘observed’ and ‘true’ scores, while
-1.00 represents no correlation (Jacobson, 1997); in reliability assessment,
correlation coefficients typically fall between 0.00 and +1.00.
There are three important facets of reliability to consider: stability,
equivalence, and internal consistency (Burns & Grove, 2009). Reliability as
stability is examined in two forms: test-retest reliability and intrarater reliability.
Test-retest reliability refers to the correlation between scores from the same
subjects observed at two different times. Pearson’s correlation coefficient and the
intraclass correlation coefficient (preferred when sample size is small) are the
statistical procedures most often used to examine test-retest reliability. Intrarater
reliability is concerned with the consistency with which one rater assigns scores
to a single event on two different occasions. Correlation between the two ratings
is calculated from the scores assigned at the two observation times, often using
Pearson’s correlation coefficient or Cohen’s weighted kappa statistic. Cohen’s
47

simple kappa measures chance-corrected agreement for nominal outcomes, and
weighted kappa adjusts for degrees of discordance within ordinal (rank ordered)
scales (Fleiss & Cohen, 1973; Landis & Koch, 1977). For example, using weighted
kappa, a discordant response between OASS ratings of one (no observable
agitation) and 120 (extremely agitated) would have a greater effect (reduction) on
the kappa than a discordant response between OASS ratings of four and twelve
would.
Reliability as equivalence centers on comparing two versions of the same
instrument (parallel or alternate forms reliability) or two observers measuring
the same event with a single instrument (interrater reliability). Because the
construction of parallel tests measuring the same trait in the same way is very
difficult, it is primarily used in the development of standardized educational
tests (Jacobson, 1997). More common in the development of clinical measures is
interrater reliability, requiring two or more raters to observe and record the
scores independently for the same event using a standardized protocol. The
observation of at least 10 subjects is required to evaluate interrater reliability
(Washington & Moss, 1988). Pearson’s correlation coefficient is the statistical test
most often utilized to calculate inter-rater reliability in instrument development.
Calculation of the percent agreement between raters and the use of Cohen’s
weighted kappa are also possible (Fleiss & Cohen, 1973; Jacobson, 1997).
48

Coefficient values of less than 0.80 are cause for concern when examining
reliability (Burns & Grove, 2009).
Internal consistency reliability measures the degree to which all items in
an instrument measure the same construct (Burns & Grove, 2009; Waltz,
Strickland, & Lenz, 1991). Cronbach’s alpha coefficient is used to measure the
degree to which responses on any item of an instrument correlated with
responses on any other item of the instrument at a single administration of the
instrument. A correlation coefficient of 1.00 indicates that each item in the
instrument is measuring exactly the same thing, while lower values (0.80 to 0.90)
indicate that the instrument detects fine distinctions between levels of the
construct (Burns & Grove, 2009).
Traditionally, internal consistency was measured using the split-half
technique. Here items on a single scale are divided into halves (i.e., odd and even
numbered items) and are scored separately. A correlation coefficient is calculated
using the scores on each half of the instrument. As reliability is related to test
length, a split-halves correlation coefficient systematically underestimates the
reliability of the scale as a whole. The Spearman-Brown formula is a statistical
correction that adjusts for this issue, yielding an estimate closer to that of a full-
length instrument. However, because the alpha coefficient is equal to the average
49

of all possible split-halves (odd/even splits, or first-half/second-half splits, etc.)
some consider it to be preferable over Spearman –Brown (Ferketick, 1990).
Validity. The validity of an instrument refers to the degree to which the
instrument measures what it is intended to measure, the extent to which it
reflects the abstract concept being measured (Burns & Grove, 2009; Strout &
Kendrick, 2008). Three primary types of validity are commonly discussed:
content validity, predictive validity, and construct validity. Historically, many
subtypes of validity (e.g. face validity, criterion related validity) have fallen
under these three categories. Currently, however, validity is commonly
conceptualized by measurement experts as construct validity, a single broad
method of measurement evaluation (Berk, 1990; Burns & Grove, 2009; Jacobson,
1997). Under this conceptualization, all previously identified subtypes of validity
are considered to be evidence of construct validity. As validity increases,
systematic error (the degree to which the instrument measures items other than
the intended concept) decreases. Validity varies between samples and situations;
therefore, it is important to note that validity is established for a specific group
rather than for the instrument itself (Burns & Grove, 2009). In practice, when
validity is show across a variety of populations we come to consider the measure
valid for wide usage.
50

Content validity has traditionally been concerned with whether or not
items on an instrument are representative and comprehensive in their sampling
of the content area of interest (Jacobson, 1997). In concert with current views of
validity as a unitary construct, it can be seen that content validity is a part of
construct validity because item content is central to the eventual meaning of
instrument scores. Evidence of content validity is obtained from the literature,
through discussion with representatives of relevant populations, and through the
use of content experts (Burns & Grove, 2009). Documentation of content validity
begins with the process of instrument development, following through to
psychometric testing of the newly developed instrument (Berk, 1990; Burns &
Grove, 2009; Green & Lewis, 1986; Lynn, 1986; McGartland Rubio, Berg-Weger,
Tebb, Lee, & Rauch, 2003; Slocumb & Cole, 1991). Statistical evaluation of content
validity involves the calculation of a content validity index (CVI) for instrument
items as well as for the instrument as a whole (Waltz & Bausell, 1981).
Evidence of construct validity can also be established using the known-
groups method. Here, an instrument is administered to two groups known to be
high and low on the measured concept, such as agitated and non-agitated
patients. If the groups’ scores differ significantly in the anticipated direction,
construct validity is supported (Jacobson, 1997).
51

Exploratory factor analysis and principle components analysis may also
provide evidence for construct validity. The aim of factor analysis is to reduce
the instrument’s items to smaller factors – clusters of correlated items. The
content of the items within a factor, as well as the mathematical weights of the
factors, are used to define the concept further. Instruments can be refined by
identifying items that do not load (fall into a cluster). This process is also useful
in determining whether a concept is uni- or multi-dimensional, helping to clarify
whether or not subscale scores should be calculated (Burns & Grove, 2009;
DeVellis, 1991; Jacobson, 1997; Kim & Mueller, 1978). Together, these methods
provide cumulative support for validity.
Rasch Models of Measurement
While the primary measurement model underlying this work is classical
test theory (CTT), the limitations of CTT are recognized, specifically that the
ability estimate of a person is dependent upon the difficulty of the items, the
standard error applies equally to all ability levels, and that item discrimination
can be too high (Brennan, 2001; Hattie, Jaeger & Bond, 1999; Masters, 1988;
Traub, 1997; Wainer, 1986). As a result of these limitations, many researchers
have turned to item response theory (IRT) models as an alternative (Ludlow,
2010).
52

Item response theory models are a group of statistical models that are
designed to define an underlying construct, such as agitation, by calculating the
probability of a specific response from an individual to a specific item
(Hambleton, Swaminathan, & Rogers, 1991; Ludlow, Enterline, & Cochran-
Smith, 2008). In this case, an IRT model could provide information on how an
individual’s demonstration of a particular agitated behavior relates to the
underlying construct measured by the items on the Agitation Severity Scale. IRT
models are differentiated by the number of parameters, or item characteristics
(item difficulty, item discrimination, item pseudo-guess parameter), that the
model takes into account. The 1-parameter logistic model, or Rasch model, takes
item difficulty into account. Two-parameter models also take item discrimination
into account while 3-parameter logistic models consider item difficulty,
discrimination and pseudo-guessing (Harris, 1989).
In the Rasch model, the discrimination parameter is held constant,
implying that all of the items are equally discriminating. In addition, there is no
lower asymptote parameter, implying that people with low ability (low levels of
agitation) will have a near zero chance of endorsing (exhibiting) a difficult item
(a very agitated behavior). In this way, the Rasch model is a simpler version of
the 3-parameter logistic model. Some benefits of the Rasch model (over 2-and 3-
parameter models) include the fact that the total test score is a sufficient statistic
53

for estimating person ability and the number of persons correctly responding to
an item is a sufficient statistic for estimating item difficulty, which is not the case
for 2-and 3-parameter models. In addition, persons with the same person ability
(same degree of agitation) will have the same predicted ability in the Rasch
model (Harris, 1989).
There are several important attributes of Rasch models in comparison to
the CTT model of measurement. These are as follows: (a) item statistics are
considered to be “sample free,” (b) examinee estimates are considered to be “test
free,” (c) there is a standard error for each item and each person estimate, (d)
Rasch models provide an expected value for performance on an item, and (e)
they provide a confirmatory test of the instrument’s construct validity. These
characteristics offer benefit over the limitations of the CTT model of
measurement.
The notion of sample free calibration means that when the data fit the
model in a Rasch scale, the scale can be administered to different sets of people
(e.g. different groups of students or patients) and the same difficulty estimates
should result for the items. Similarly, item free measurement means that students
(or patients) can take different combinations of the items and get the same ability
estimates, leading to the possibility of construction of item banks and the
development of computerized adaptive tests that hone in on the abilities of a
54

specific student. These important properties are the result of person ability and
item difficulty estimates being separated in the exponent portion of the
expanded logistic function in the unconditional maximum likelihood estimation
procedure (Ludlow, 2010b). This is not possible with CTT models as item
statistics are group dependent, an individual’s scores are group dependent, the
standard error of measurement is treated the same for all individuals, and there
is no expected performance (prediction) on a given item.
Conceptually, Rasch models assume the construct under study to be
unidimensional and stretching across a continuum upon which a hierarchical
series of items can be constructed. The statistical models that estimate the
probability of a response to a specific item differ, giving us Rasch, 2-and 3-
parameter models to choose from (Hambleton, Swaminathan, & Rogers, 1991;
Harris, 1989). The process of instrument development involves developing a
clear idea of the variable, constructing specific items to represent the variable,
testing the congruence of the scale solution to your a priori theory, and testing the
congruence between the observed and expected responses, or fit (Ludlow, 2010).
The fundamental difference in these types of models lies within their
purposes. Two- and 3-parameter models are primarily concerned with
maximizing the extent to which variations in item responses are accounted for
and because of this purpose, they always offer a better mathematical “fit” than
55

Rasch models. Rasch models are concerned with offering understanding the
variable of interest; with understanding what it means or looks like to be a
“high” or “low” scorer on the instrument or to move along the continuum the
goal. They are confirmatory tests of the extent to which scales have been
developed according to measurement criteria set a priori, including
unidimensionality, hierarchical structuring, and the notion of the variable as a
continuum.
Despite the better mathematical fit of multiparameter IRT models over
Rasch models, there is important benefit to use of the Rasch model, particularly
in the human sciences. In nursing and medical science, we are most often
concerned with developing a full understanding of the phenomenon of interest.
We want to be able to, more than having knowledge of a person’s numeric score,
understand what it means to have a particular score. We want to know what it
means to move from one score to another, to move along the continuum we have
developed. Simply having the best numeric fit does not offer the in depth
understanding of the characteristics of a particular score that Rasch models offer.
As with linear regression models, having an understanding that makes clinical
sense in terms of explaining a phenomena is often much more valuable than
having the highest R2 value. For these reasons, this study utilized the Rasch
measurement model in addition to the traditional CTT analyses.
56

Summary
The construct of agitation and the related concepts of anxiety and
aggression have been reviewed for their defining attributes and current methods
of measurement. Current measurement instruments were reviewed and their
limitations identified in terms of their utility for the measurement of agitation in
the emergency setting, establishing the need for the Agitation Severity Scale.
Stages of instrument development based upon classical measurement theory,
from defining the construct through reliability and validity testing were
discussed. Classical test theory was contrasted to item response theory models,
with focus on the Rasch model used in this study. This review provides support
for the need for additional psychometric analysis of the initial version of the
Agitation Severity Scale.
57

CHAPTER 3
Methodology
Introduction
The aims of this methodological study were (a) to develop an observation-
based rating scale to assess the continuum of behaviors known as agitation in an
adult, emergency department population, and (b) to evaluate the psychometric
properties of the newly developed instrument. In this chapter, the early
development of the Agitation Severity Scale is reviewed. In addition, details of
the study methods including the setting, sample, instruments, study procedure,
analytic methods, and human subjects protections are presented.
Development of the Scale
Development of the Agitation Severity Scale began with clinical
recognition of the multiple ways in which providers of emergency psychiatric
care recognize and define agitation. In order to understand this phenomenon
better, a series of moderator facilitated focus groups was held with a diverse
group of emergency care providers, including emergency department nurses,
emergency department and psychiatry service physicians, patient care
technicians, security personnel, prehospital care providers, and social workers.
Focus group sessions were audiotaped and verbatim transcriptions of the
audiotapes were created. A qualitative descriptive approach was used to identify
58

common themes and meanings from the transcripts. From these data, a
preliminary list of scale items was developed.
Forty-five items developed from the focus groups’ results were organized
into a survey for emergency department staff and are presented in Appendix C.
Participating staff were asked to rate each item on a Likert-type scale of 0 to 5
based on their belief about the degree of agitation represented by the item. Items
identified by staff as not being representative of agitation were excluded from
the initial draft of the scale; items with the highest means and standard
deviations were retained. This process produced 26 items for further
consideration. The behaviors identified as relevant became the domains of the
construct of agitation. The construct was further examined through the process
of literature review and concept analysis, as described by Walker and Avant
(2005).
Consistent with recommendations in the literature, an interdisciplinary
panel of eight experts in the provision of emergency psychiatric care and
instrument development was assembled to review items for the draft scale
(Crocker & Algina, 2008; Waltz, Strickland & Lenz, 1991; Davis, 1992; Grant &
Davis, 1997). Experts were asked to evaluate item representativeness and clarity,
in addition to identifying a domain for individual items (Appendix D). Space
was provided for experts’ comments and their recommendations were solicited.
59

In addition to the content validity survey instrument, the expert panel was
provided with the study objectives, information regarding the population of
interest, and instructions on completion of the survey instrument.
Calculated measures included the item- and scale-level index of content
validity (CVI), the factorial validity index, and modified kappa. The content
validity index is the most widely utilized method of quantifying content validity
amongst nurse researchers (Polit, Beck, & Owen, 2007). There are alternate ways
of calculating both item-level and scale-level CVIs; however, raters are typically
asked to rate the relevance and clarity of each item on a four-point ordinal scale,
most often a variation on: 1 = not relevant (clear), 2 = somewhat relevant (clear), 3 =
quite relevant (clear), and 4 = highly relevant (clear) (Davis, 1992). For each item, the
CVI is then calculated as the number of experts rating the item a 3 or 4 divided
by the number of experts. This method was used to calculate the item-level CVI
for the Agitation Severity Scale. The scale-CVI/average approach (Polit, Beck, &
Owen, 2007) was used in calculating the scale-level CVI for the instrument. Here,
item level CVIs are averaged across the scale.
As the simple kappa statistic does not account for chance agreements, the
probability of a chance agreement was calculated for individual scale items using
the formula for a binominal random variable with one specific outcome:
PC = [N!/A!(N-A)!]*0.5expN (1)
60

where N equals the number of experts and A equals the number of experts
agreeing on good relevance (Cohen, 1960; Polit, Beck & Owen, 2007). In addition,
a modified kappa statistic was utilized in order adjust each item-level CVI for
chance agreement. Modified kappa was calculated using the formula:
k = (I-CVI - pc)/(1-pc) (2)
where PC is the probability of chance agreement calculated above (Polit, Beck &
Owen, 2007). Following these calculations, the standards described by Landis
and Koch (1977) were used to interpret the findings. Table 3 summarizes content
validity findings for representativeness and Table 4 provides information
regarding the clarity of the items, as judged by the content experts.
Initial analysis of all items revealed scale-level content validity indexes of
0.725 for both representativeness and clarity. Eliminating four items with low
(0.142-0.375) item-level CVIs (getting attention with voice, inappropriate
behavior, unable to reason, and disorganized thinking) improved scale-level
content validity to 0.80 for both representativeness and clarity. Importantly,
inappropriate behavior was one of the eliminated items. Removal of this item
does help to focus the instrument on observable behaviors, rather than bystander
judgments, unlike many existing agitation scales.
The factorial validity index (FVI) is a relatively new approach designed to
measure the degree to which surveyed experts correctly identify the domain to
61

Table 3. Content Validity Findings – Representativeness.
Item Rater A
Rater B
Rater C
Rater D
Rater E
Rater F
Rater G
Rater H
Experts in Agreement
Item CVI
PC k Evaluation
Spit x x x x x / x x 7/8 0.875 0.031 0.871 Very GoodBite x x x x x x / x 7/7 1.00 0.008 1.00 Very Good
Grind x x x / x x x / 6/7 1.00 0.055 1.00 Very GoodVoice x x / / x / / x 4/8 0.50 0.273 0.312 FairRed x x / / x / x / 4/7 0.571 0.273 0.410 ModerateDart x / x x x / / / 4/7 0.714 0.273 0.607 GoodYell x x / x x x x / 7/7 1.00 0.008 1.00 Very Good
Demand x x x / x x x / 5/7 0.714 0.164 0.658 GoodQuick x / / x x / x / 5/7 0.714 0.164 0.658 GoodAngry x x x / x x x x 6/8 0.750 0.109 0.719 Good
Disrupt x x x x x x x x 8/8 1.00 0.004 1.00 Very GoodViolence x x x x x / x x 7/8 0.750 0.031 0.742 GoodThrow x x x / x x / x 6/8 0.750 0.109 0.719 GoodViolate x x x x x / / / 5/6 0.833 0.094 0.816 Very GoodIn Face x x x x x x / x 7/7 1.00 0.008 1.00 Very GoodAway / / x x x / x x 5/8 0.625 0.219 0.520 Moderate
Impulsive x x / x x / / x 5/8 0.625 0.219 0.520 ModeratePuffed Up x x x x x x / x 7/8 0.875 0.031 0.871 Very Good
Tap x / x x x x x x 7/8 0.875 0.031 0.871 Very GoodRestless x x / x x x x x 7/8 0.750 0.031 0.742 GoodConfront x x x / x / x x 6/8 0.750 0.109 0.719 Good
Calm x X x x x x / x 7/8 0.875 0.031 0.871 Very GoodInappropriate / / / / / / x / 1/7 0.143 0.055 0.093 Poor
Labile x / x x x x / / 5/8 0.625 0.219 0.520 ModerateReason / / / x x x / / 3/8 0.375 0.219 0.199 Poor
Disorganized / / / x / / x / 2/7 0.286 0.164 0.146 PoorAverage
CVI =0.803 Average
k =0.765
Proportion Relevant =
0.85 0.69 0.65 0.69 0.92 0.54 0.58 0.58
62

Table 4. Content Validity Findings – Clarity.
Item Rater A
Rater B
Rater C
Rater D
Rater E
Rater F
Rater G
Rater H
Experts in Agreement
Item CVI
PC k Evaluation
Spit x x x x x / x x 7/8 0.875 0.031 0.871 Very GoodBite x x x x x x / x 7/7 1.00 0.008 1.00 Very Good
Grind x x x / x x x x 7/8 0.875 0.031 0.871 Very GoodVoice x x / / x / / x 4/8 0.50 0.273 0.312 FairRed x / / / x x x x 5/8 0.625 0.219 0.520 ModerateDart x / x / x x / x 5/8 0.625 0.219 0.520 ModerateYell x x x x x x x x 8/8 1.00 0.004 1.00 Very Good
Demand x x / / x x x x 6/8 0.750 0.109 0.719 GoodQuick x / x x x x / x 6/8 0.750 0.109 0.719 GoodAngry x x x x x x x x 8/8 1.00 0.004 1.00 Very Good
Disrupt x x x x x x x x 8/8 1.00 0.004 1.00 Very GoodViolence x x x x x x x x 8/8 1.00 0.004 1.00 Very GoodThrow x x x / x x x / 7/8 0.875 0.031 0.871 Very GoodViolate / / x / x / / x 2/8 0.250 0.109 0.158 PoorIn Face x / x / x x / x 5/7 0.710 0.164 0.653 GoodAway / / x x x / x x 5/8 0.625 0.219 0.520 Moderate
Impulsive x / x / x / / x 4/8 0.500 0.273 0.312 FairPuffed Up x x x / x x / x 6/8 0.750 0.109 0.719 Good
Tap x / x x x x x x 7/8 0.875 0.031 0.871 Very GoodRestless x / x x x x x / 6/7 0.857 0.055 0.849 Very GoodConfront x x x / x / x x 6/8 0.750 0.109 0.719 Good
Calm x x x x / x / x 6/8 0.750 0.109 0.719 GoodInappropriate / / / / / / x / 1/8 0.125 0.031 0.097 Poor
Labile x x x x x x / x 7/8 0.875 0.031 0.871 Very GoodReason x x x / x x / x 6/8 0.750 0.109 0.719 Good
Disorganized x x x / x / x x 6/7 0.857 0.055 0.849 Very GoodAverage CVI =
0.787 Average k =
0.749
Proportion Relevant =
0.88 0.62 0.87 0.46 0.92 0.69 0.58 0.88
63

which each potential items belongs. For each item, the number of respondents
who correctly associated the item and domain is divided by the total number of
respondents. As previously, the average is calculated across the items to
determine FVI for the measure as a whole (McGartland Rubio, Berg-Weger,
Tebb, Lee, & Rauch, 2003). In developing the Agitation Severity Scale, it was
noted that the experts had difficulty in correctly identifying domains for the
individual items, with a scale-level FVI of 0.50. Additional work in refining scale
domains was undertaken during psychometric analysis of the instrument and
will be described in Chapter 4.
Setting
The study took take place within the Department of Emergency Medicine
at Maine Medical Center. Maine Medical Center (MMC) is an academic tertiary
care referral center and Level-1 trauma center located in Portland, Maine. The
MMC emergency department has specific pediatric, psychiatric, critical care,
prompt care, medical/surgical treatment areas, as well as an observation unit.
The MMC emergency department mental health treatment area consists of a
clinical area that is separated from patient treatment rooms by one-way glass,
making it possible to observe patients without interrupting their care or being
physically present within their treatment space. At the time of the study, the
department served approximately 80,000 patients per year on two campuses.
64

Permission and support to conduct the study was obtained from relevant
stakeholders, including the department Chair, Vice-Chair, and Director of
Research.
Sample
Based upon the recommendations of Nunnally (1978) as well as Tinsley
and Tinsley (1987) requiring 5 to 10 subjects per item being evaluated,
approximately 260 mental health patients were required to adequately power the
study. Ultimately, 270 subjects were observed during the study. Subjects were
emergency department patients who are being evaluated for a mental health-
related complaint. Subjects were selected for participation on a convenience
basis, when the investigator was present in the study emergency department.
Potential subjects were identified through their emergency department chief
complaints as listed on the department’s electronic tracking board as all mental
health patients are identified in the system by a single chief complaint. Patients
were excluded from participation if they were seeking treatment for a non-
mental health emergency.
Study Procedures
During the study, the investigator sat in the clinical area to observe
patients, recording information as required by the Agitation Severity Scale and
Overt Agitation Severity Scale instruments, described below. For each subject,
65

demographic data including gender, age in years, ethnicity, diagnosis, and
medications received in the emergency department was collected from patient
health records (Appendix G). No other information, including any patient
identifiers, was collected. Each subject was observed and evaluated with the
study instruments at least two times and up to four times during their
emergency department evaluation in order to facilitate known-groups analysis.
Instrument ratings obtained during the observations were not be shared with
clinical providers and did not have an impact on clinical care. For a subset of
subjects, a second trained clinician was asked to observe a random sampling
subjects and independently assign an Agitation Severity Score for the subjects in
order to facilitate interrater reliability analysis.
Instruments
Agitation Severity Scale. As previously described, the version of the
Agitation Severity Scale used in the study consisted of twenty-six items aimed at
assessing the continuum of behaviors representative of agitation. The instrument
is an observation-based rating instrument designed for use with acute psychiatric
patients in the emergency setting and has demonstrated early evidence of
content validity, with scale level indices of content validity of 0.80 for both
representativeness and clarity. The instrument requires direct observation by a
clinician, followed by the completion of a pencil-and-paper assessment of the
66

frequency of a list of observable behaviors. A scale-level score was calculated by
summing values for each behavior endorsed. The version of the Agitation
Severity Scale utilized in the study is included as Appendix E.
Overt Agitation Severity Scale. The Overt Agitation Severity Scale
(OASS) was also developed to measure the observable features of agitation and
has demonstrated reliability and validity in both dementia and mental health
patients. The OASS has limited utility in the emergency setting due to the
prolonged fifteen minute observation period required for each rating. However,
extended direct observation of subjects was required by the design of this study,
facilitating the collection of OASS data for the purposes of this research. The
OASS instrument is available as Appendix F and was utilized for each subject in
the study. OASS data was used to assess convergent validity for the Agitation
Severity Scale.
Analytic Methods
Data were collected by the investigator using a standardized data
collection sheet. Multiple observations for a single subject were noted by using
an alphanumeric system, for example, subject number one’s first observation
sheet was labeled “1a” while subsequent observations were labeled “1b” and so
on. Data were entered into a Microsoft Excel (Redmund, WA) spreadsheet
program and were analyzed using SPSS for Windows v. 18.0 (Chicago, IL) as
67

well as MedCalc v. 11.3.1.0 (Mariakerke, Belgium) statistical software. The
WINSTEPS v. 3.69.0 software package was used to perform Rasch analysis
(Linacre, 2009). The study data sheet can be viewed as Appendix G.
Categorical demographic information (e.g. race/ethnic categories, gender)
is reported as numbers and frequencies while continuous data (e.g. age) is
reported using appropriate measures of central tendency and dispersion.
Confidence intervals were calculated using the exact method and significance
was set at an alpha of 0.05. Diligent effort was made to avoid missing data;
however, four subjects did have incomplete data. Missing data and how it was
handled will be discussed in Chapter 4.
For each variable, descriptive statistics were computed and data were
systematically examined for normality, missing values, and outlying values.
Symmetry was evaluated utilizing Pearson’s Skewness Statistic, calculated using
the formula provided in equation three:
3*(Mean – Median) / Standard Deviation (3)
where values falling outside the -1.00 to +1.00 range indicate severe skewness
(Hair et al., 1998; Munro, 2001).
A classical test theory (CTT) analysis was be performed. Item analysis,
including item difficulty (arithmetic mean) and item discrimination (point
biserial index), was completed. The internal consistency reliability of the
68

Agitation Severity Scale was evaluated by computing Cronbach’s coefficient
alpha for the scale. Interrater reliability was examined for a subset of subjects by
calculating Pearson’s product-moment correlation coefficient and Cohen’s
weighted kappa to examine the relationship between scores assigned by two
independent raters.
In addition to the content validity evaluation already completed with the
Agitation Severity Scale, construct validity was also evaluated. Using the known-
groups method, data for subjects known to be agitated (highest quintile of
scores) and known not to be agitated (lowest quintile of scores) was compared
using the independent samples t-test. Convergent validity was evaluated by
examining the relationship between scores on the Agitation Severity Scale and
scores on the Overt Agitation Severity Scale. Pearson’s product-moment
correlation coefficient was calculated for this purpose. Agitation Severity Scale
items were subjected to exploratory factor analytic methods as well.
Appropriateness for factor analysis was determined using the Kaiser-Meyer-
Olkin (KMO) statistic, an assessment of the determinant |R|, and Bartlett’s test of
sphericity. Following common factor analysis, principle components analysis
(PCA) with iterations followed by orthogonal (varimax) rotation and Kaiser
normalization was completed in order to examine the internal structure of the
data. Kaiser-Guttman’s criterion of using all unrotated components with
69

eigenvalues greater than 1.0 was applied in order to identify components
accounting for the maximum amount of variance (Kaiser, 1960; Nunnally, 1978).
Subscales were identified and the internal consistency of those subscales was
examined by computing Cronbach’s alpha coefficients for the subscales.
While classical test theory was the primary measurement model utilized
for this work, Item Response Theory (IRT) models are another option. When a
construct is conceptualized as existing along a continuum, as in this case, it is
possible to use a particular IRT model, the one-parameter Rasch model, to
determine whether the scale items can be ordered in a hierarchical fashion
(Ludlow, Enterline, & Cochran-Smith, 2008). The statistical form of the Rasch
rating scale model used in this analysis is as follows:
(4)
where nixπ is the probability
of person n responding in
category x to item i where a.) δ is the location of item i on the variable, b.) τ is the
location of the kth step in each item relative to that item’s scale value (the
threshold parameter), and c.) x = 0, 1, . . . . m.
β and δ (person ability and item difficulty, respectively) are logits or
logistic units. The person logit is the natural log odds of a person succeeding on
0
)]([
)]([
0
0
∑=
+−
+−
∑
∑=
=
=
m
k
nix k
jjin
nix
jjin
e
e
τδβ
τδβ
π
70
an item with 0 logit difficulty. Thus, the higher the logit, the higher the person’s
ability. The item logit is the natural log odds of a person with 0 logit ability
failing an item. The higher the logit, the more difficult the item. These are the
natural logarithm of odds ratios (the probability of getting an item right / the
probability of getting an item wrong) and are our estimates of ability and
difficulty (Cox, 1970). In the Rasch model, the probability of a correct response
on an item is modeled as a logistic function of the difference between the person
and item parameters. Converting odds ratios into logarithms of odds ratios is
helpful because it changes them into units that have the same meaning (the
difference between one odds ratio and another does not necessarily mean the
same thing) and it also avoids the floor effect that occurs with odds of less than 1-
to-1 asymptote towards zero. Logits can be used to obtain estimates of the
probability of getting any item on a scale correct (odds of success) or incorrect
(odds of failure). They provide information regarding a person’s relative ability
(positive logit) or inability (negative logit) and about an item’s difficulty (hard
item = positive logit, easy item = negative logit) (Ludlow & Haley, 1995). We can
use logits as follows to determine an expected value for a person on any item.
Imagine that we have 12 items of equal difficulty and get 8 correct, or
66.7%. The odds of getting any item correct are the probability of getting the item
right over the probability of getting the item wrong:
71

Probability right = 0.67 = 2.0 (5) Probability wrong 0.33
Now we can use the natural log of 2:
In(2) = 0.6931 logit (6)
which is our estimate of person ability, β. We can then use the logit 0.6931 to
calculate our probability of getting any item correct this way:
δβ
δβ
−
−
= +=
e
ePx 11 where δ = 0, (7)
06931.0
06931.0
1 1 −
−
= +=
e
ePx = =
3
20.66
(8)
In this example, the probability of getting any item correct is 0.66; this is the way
we can compute expected values for a person on any item.
This analysis may be useful in further refining the Agitation Severity Scale
as it would allow clinicians to not only track an individual’s movement along the
continuum, but also to predict behaviors as the level of agitation increases or
decreases. For this reason, the data obtained in the study were further evaluated
using Rasch analysis and Rasch analysis-of-fit.
Protection of Human Subjects
Diligent effort was made to protect the human subject participants and
their data. All data was stored in a locked cabinet in a locked office within the
Maine Medical Center Department of Emergency Medicine Research Offices, a
72

locked facility without public access. Computer databases were housed on the
secure MaineHealth server, requiring unique file passwords and individual user
log-ons and passwords. Prior to entry into the study database, data was de-
identified to protect confidentiality. Future scientific presentations and
publications will not contain identifying data. Results for the cohort are
presented in aggregate. Data are accessible only to the study investigator, her
dissertation advisor and committee members, and other Institutional Review
Board or federal personnel as required by law. Institutional Review Board
exemption/approval was provided by the Maine Medical Center and Boston
College IRBs prior to the study. In addition, the investigator completed training
programs in the ethical conduct of research and the protection of human subjects.
Summary
This chapter has described the methodology utilized to develop and
psychometrically evaluate an observation-based rating scale to assess the
continuum of behaviors known as agitation in an adult emergency department
population. Information on the setting, sample, instrumentation, study
procedures, analytic methods, and protection of human subjects has been
presented. The described methodology was designed to answer the specific
research questions posed in Chapter 1.
73
CHAPTER 4
Results
Introduction
This methodologic study focused on examining facets of reliability and
validity for the Agitation Severity Scale when utilized with a sample of
emergency department psychiatric patients. A psychometric evaluation of the 21-
item Agitation Severity Scale was undertaken, including both classical test theory
and single parameter item response theory (Rasch model) analyses, as well as
comparison of the Agitation Severity Scale to the Overt Agitation Severity Scale
(OASS). In this chapter, the results of the data analyses are presented.
Data Preparation
Prior to undertaking statistical analysis, the study data (N=270) were
systematically examined for normality, missing values, and outlying values.
Study variables were found to be normally distributed and Pearson’s skewness
statistic was noted to be within the -1.0 to +1.0 standard deviation units range,
indicating very minimal skew for each variable (Hair, Anderson, Tatham, &
Black, 1998). No outlying values were detected. Four study subjects left the
emergency department before all four planned observations could be completed:
one subject missed the last (time four) observation and three subjects missed the
third and fourth (times three and four) observations. In order to maintain the
74

maximal sample size, these missing data were handled on a comparison-by-
comparison basis, rather than by excluding the entire case.
Prior to factor analysis, the data were examined for factoring
appropriateness using the Kaiser-Meyer-Olkin (KMO) statistic, an assessment of
the determinant |R|, and Bartlett’s test of sphericity. The Kaiser-Meyer-Olkin
measure verified the sampling adequacy for the analysis, KMO = 0.856. Bartlett’s
test of sphericity confirmed that the R-matrix was not an identity matrix,
indicating that correlations between items were sufficiently large for factor
analysis, χ2 = 3019.188, df = 136, p < 0.001. Finally, the determinant of the R-matrix
was nonzero, indicating that multicollinearity was not a problem in this data.
Therefore, it was determined that the correlation matrix for the Agitation
Severity Scale data was appropriate for factor analytic techniques.
Characteristics of the Study Sample
The study sample consisted of 270 subjects selected on a convenience basis
from the emergency department population of a single acute care hospital over a
two-month period. During the study period, approximately 640 patients with
primary psychiatric complaints were cared for in the emergency department. The
study sample represents roughly 42% of the psychiatric emergency department
population at the time of the study. Table 5 provides demographic characteristics
for the study cohort. Approximately equal numbers of male (n=137, 50.7%) and
75

female (n=133, 49.3%) subjects were included in the study. The sample was
comprised of primarily white subjects (n=265, 98.1%), reflecting the demographic
profile of the area in which the study took place.
All study subjects were treated in the emergency department for a
primary psychiatric complaint as evidenced by a DSM-IV-TR diagnosis
(American Psychiatric Association, 2000). The most frequently observed
diagnoses included Mood Disorders (n=118, 44.2%), Substance-related Disorders
(n=60, 22.5%), Schizophrenia and Other Psychotic Disorders (n=33, 12.4%),
Anxiety Disorders (n=28, 10.5%), and Adjustment Disorders (n=19, 7.1%).
Table 6 provides data regarding the mean age for study subjects based
upon the quartile of their mean Agitation Severity Score. Chi-square analysis did
not detect statistically significant differences in demographic characteristics
based upon the quartile groups (age: p = 0.357, diagnosis: p = 0.270, sex: p = 0.321,
race: p = 0.682).
76

Table 5
Demographic Characteristics of the Study Subjects N = 270
Demographic Variables n (%) Gender Male 137 (50.7) Female 133 (49.3)
Race White 265 (98.1) Hispanic 2 (0.7) Black 2 (0.7) Asian 1 (0.4)
Diagnostic Group Adjustment Disorder 19 (7.1) Anxiety Disorder 28 (10.5) Attention-deficit/ Hyperactivity Disorder 2 (0.7) Autism Spectrum Disorder 1 (0.4) Delirium 2 (0.7) Dementia 2 (0.7) Impulse-Control Disorder 2 (0.7) Mood Disorder 118 (44.2) Personality Disorder 2 (0.7) Schizophrenia/Other Psychotic Disorder 33 (12.4) Substance-related Disorder Alcohol 43 (16.1) Other Substance 15 (5.6) Unclassified* 3 (1.1)
Note. *Three study subjects left the emergency department prior to receiving a diagnosis; these subjects were not assigned a diagnostic group.
77
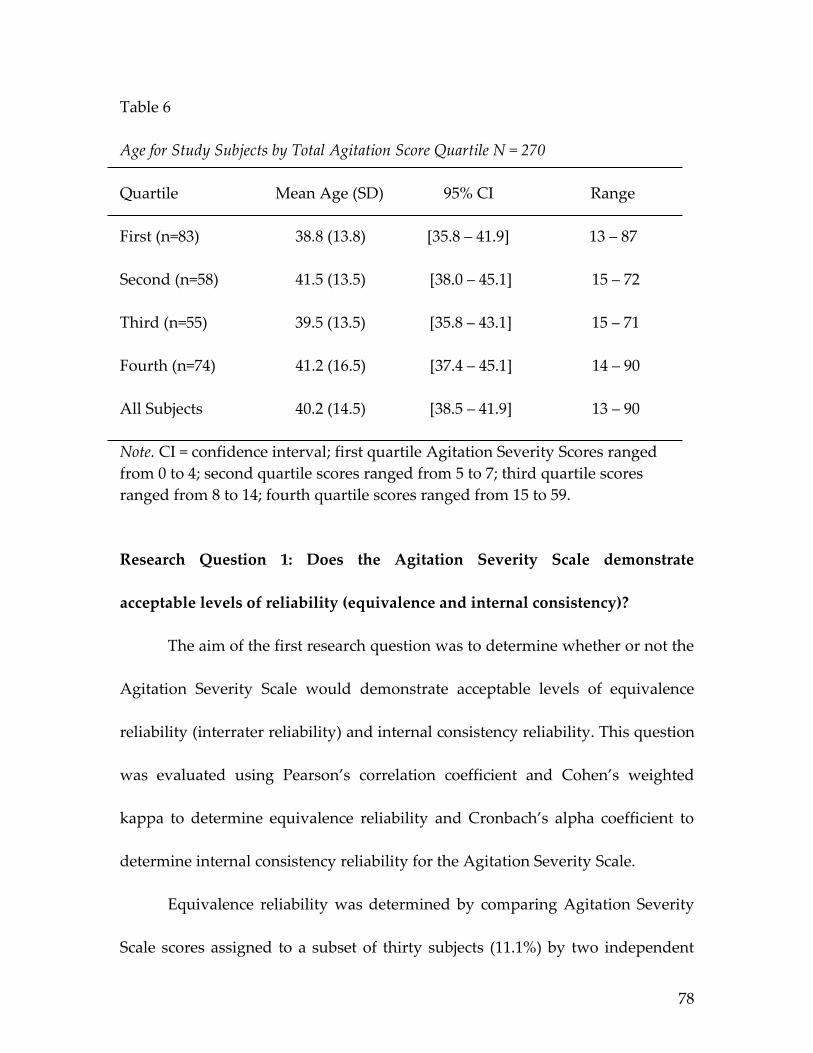
Table 6
Age for Study Subjects by Total Agitation Score Quartile N = 270
Quartile Mean Age (SD) 95% CI Range First (n=83) 38.8 (13.8) [35.8 – 41.9] 13 – 87
Second (n=58) 41.5 (13.5) [38.0 – 45.1] 15 – 72
Third (n=55) 39.5 (13.5) [35.8 – 43.1] 15 – 71
Fourth (n=74) 41.2 (16.5) [37.4 – 45.1] 14 – 90
All Subjects 40.2 (14.5) [38.5 – 41.9] 13 – 90
Note. CI = confidence interval; first quartile Agitation Severity Scores ranged from 0 to 4; second quartile scores ranged from 5 to 7; third quartile scores ranged from 8 to 14; fourth quartile scores ranged from 15 to 59.
Research Question 1: Does the Agitation Severity Scale demonstrate
acceptable levels of reliability (equivalence and internal consistency)?
The aim of the first research question was to determine whether or not the
Agitation Severity Scale would demonstrate acceptable levels of equivalence
reliability (interrater reliability) and internal consistency reliability. This question
was evaluated using Pearson’s correlation coefficient and Cohen’s weighted
kappa to determine equivalence reliability and Cronbach’s alpha coefficient to
determine internal consistency reliability for the Agitation Severity Scale.
Equivalence reliability was determined by comparing Agitation Severity
Scale scores assigned to a subset of thirty subjects (11.1%) by two independent
78

raters who were blinded to each other’s assessments. A corrected Pearson’s
product moment correlation statistic tested the association between the two
raters’ scores and found a high, positive degree of equivalence reliability (r =
0.99, p < 0.001, n = 30). Cohen’s weighted kappa statistic further supported this
finding, Κ = 0.98, 95% CI: 0.96 – 1.00. As a result, the Agitation Severity Scale was
found to possess adequate equivalence (interrater) reliability.
The initial standardized reliability coefficient, based upon all 21 initial
Agitation Severity Scale items, was 0.88. As shown in Table 7, four items were
found to have corrected item-total correlations that were below 0.30 (biting, 0.14;
grinding teeth, 0.20; throwing objects, 0.11; emotionally labile, anxious, nervous,
0.03); these items were deleted from the scale. The resulting 17-item Agitation
Severity Scale was found to have a standardized alpha coefficient of 0.91
(N=270), indicating high internal consistency reliability.
79

Table 7
Item-Total Correlations for the Agitation Severity Scale, Initial 21 Items N = 270
Item Corrected Item-Total Alpha if Item Correlation Deleted
A .54 .87B .14 .88C .20 .88E .63 .86F .61 .86G .72 .86H .49 .87I .37 .88J .64 .86K .59 .87L .67 .86M .11 .88N .65 .87O .35 .87P .69 .86Q .46 .87R .36 .88S .46 .87T .67 .86U .67 .86W .03 .89
Standardized item alpha .88
80

Research Question 2: Do all of the items of the Agitation Severity Scale
interrelate in measuring the concept of agitation (construct validity/principle
components analysis)?
The 17 remaining Agitation Severity Scale items were next subjected to
principle components analysis (PCA) with iterations followed by varimax
rotation and Kaiser normalization. Varimax orthogonal rotation was used as a
means of maximizing the independence, or separateness, of the factors (Crocker
& Algina, 1986). Kaiser-Guttman’s criterion of using all unrotated components
with eigenvalues greater than 1.0 was applied in order to identify the
components accounting for the maximum amount of variance (Kaiser, 1960;
Nunnally, 1978). An additional criterion for deciding on the number of
components to retain was that each component needed to account for the
variance of at least two items. Application of these criteria resulted in a four-
component solution accounting for 69% of common variance. Evaluation of the
scree plot of eigenvalues provided additional evidence for a parsimonious four-
component solution (Figure 2); using these criteria, the four-component solution
was accepted. As shown in Table 8, the four components accounted for a total of
69% of initially extracted common variance. For the rotated solution, component
1, with an eigenvalue of 4.5, accounted for 26.7% of variance. Component 2, with
an eigenvalue of 3.0, explained an additional 17.5% of variance. Component 3
81
accounted for 14.4% of variance and had an eigenvalue of 2.5 while component 4
accounted for 10.3% of variance with an eigenvalue of 1.8.
Component 1 was found to be comprised of 7 items (A: spitting, E: red in
the face, K: persistent disruptive verbalizations, L: physical violence to self or
others, N: violating self or others, P: decreased self-control, impulsiveness, and
U: unable to be calmed) and was labeled Aggressive Behaviors because it contained
some of the most aggressive agitated behaviors. Component 2 was made up of 4
items (G: yelling, speaking louder than baseline, H: demanding behavior, J:
angry tone of voice, and T: confrontational behavior/attitude). As component 2
contained items observable during interpersonal interactions, it was labeled
Interpersonal Behaviors. Component 3 also contained 4 items: F: darting eyes, I:
speaking more quickly than baseline, R: tapping, clenching, involuntary
movements of hands, and S: restless. Because these behaviors are generally
involuntary in nature, component 3 was named Involuntary Motor Behaviors.
Component 4 was comprised of two items, including O: “in your face” and Q:
puffed up, chest up, threatening posture and was labeled Physical Stance.
Agitation Severity Scale scores ranged from 0 to 59, with the mean score
being 9.6, SD 9.3, 95% CI: 9.0 to 10.1. Table 9 displays mean Agitation Severity
Scores and Overt Agitation Severity Scores for each of the four observation
periods. Agitation Severity Scores were transformed into quartiles to facilitate
82

comparison of scores for subjects in the lowest (least agitated) and highest (most
agitated) scoring quartiles. The first quartile scores ranged from zero to 4, second
quartile scores ranged from 5 to 7, third quartile scores ranged from 8 to 13 and
fourth quartile scores ranged from 14 to 59. Comparison of the lowest and
highest quartile scores (those for subjects known to be and not to be agitated)
revealed a statistically significant difference, t = -17.688, df = 155, p < 0.001,
providing evidence for the construct validity of the Agitation Severity Scale.
Taken together, these findings provide evidence that all of the items
making up the Agitation Severity Scale do interrelate in measuring the concept of
agitation.
83

Figure 2. Scree Plot of Eigenvalues for the Agitation Severity Scale Items N = 270.
84

Table 8
Principle Components Analysis Factor Loadings in the Unrotated Factor Matrix for the Agitation Severity Scale (N = 270)
Component
Item 1 2 3 4
Factor 1: Aggressive Behaviors, 26.7% of Variance (7 items)L .94N .89U .78K .71P .63E .60A .56
Factor 2: Interpersonal Behaviors, 17.5% of Variance (4 items)J .84T .81H .73G .52
Factor 3: Involuntary Motor Behaviors, 14.4% of Variance (4 items)R .79S .71F .70I .69
Factor 4: Physical Stance, 10.3% of Variance (2 items)O .83Q .70
Total extracted common variance: 69%Total scale Cronbach’s alpha: 0.91
85

Table 9
Mean Agitation Severity Scale Scores and Overt Agitation Scale Scores N = 270
Time 1 Time 2 Time 3 Time 4Score Mean (SD) 95% CI Mean (SD) 95% CI Mean (SD) 95% CI Mean (SD) 95% CI Agitation Severity Score 10.5 (10.4) [9.3 – 11.8] 10.6 (10.5) [9.4 – 11.9] 9.2 (8.5) [8.1-10.2] 8.0 (7.4) [7.1 – 8.8]
Overt Agitation Severity Score 12.7 (11.3) [11.4 – 14.1] 12.8 (11.3) [11.4 – 14.1] 11.0 (9.3) [9.9 – 12.1] 9.7 (8.2) [8.7 – 10.7]
Note. CI = confidence interval
86

Research Question 3: How reliable are the individual subscales, and the total scale for the Agitation Severity Scale as demonstrated by principle components analysis?
Internal consistency reliability was evaluated for the entire 17-item
Agitation Severity Scale as well as for the four PCA-derived components.
Cronbach’s alpha for the entire Agitation Severity Scale was 0.91. The Aggressive
Behaviors 7-item factor (component 1) had a standardized Cronbach’s alpha
coefficient of 0.91. The Interpersonal Behaviors 4-item factor (component 2) had a
standardized alpha coefficient of 0.85. The standardized Cronbach’s alpha for
component 3, the Involuntary Motor Behaviors 4-item factor, was 0.74. Component
4, the Physical Stance 2-item factor, had a standardized alpha coefficient of 0.71.
Tables 10 through 13 present corrected item-total correlations for each of the four
Agitation Severity Scale subscales. Thus, the 17-item Agitation Severity Scale and
the 4 Agitation Severity Scale subscales were judged to possess acceptable
internal consistency when used with psychiatric patients in the emergency
setting (Bartee, Grandjean, & Bieber, 2004; Burns & Grove, 2009; George &
Mallery, 2003).
87

Table 10
Item-Total Correlations for Factor I, Aggressive Behaviors, of the Agitation Severity Scale N = 270
Item Corrected Item-Total Alpha if Item Correlation Deleted
L .86 .88N .80 .88U .76 .89K .69 .89P .72 .89A .69 .89E .62 .91
Standardized item alpha .91
Table 11
Item-Total Correlations for Factor II, Interpersonal Behaviors, of the Agitation Severity Scale N = 270
Item Corrected Item-Total Alpha if Item Correlation Deleted
J .81 .73T .81 .73H .57 .84G .57 .85
Standardized item alpha .85
88

Table 12
Item-Total Correlations for Factor III, Involuntary Motor Behaviors, of the Agitation Severity Scale N = 270
Item Corrected Item-Total Alpha if Item Correlation Deleted
R .55 .66S .50 .69F .57 .65I .49 .70
Standardized item alpha .74
Table 13
Item-Total Correlations for Factor IV, Physical Stance, of the Agitation Severity Scale N = 270
Item Corrected Item-Total Alpha if Item Correlation Deleted
O .55 -Q .55 -
Standardized item alpha .71
Research Question 4: What is the relationship between Agitation Severity
Scale scores and scores on the Overt Agitation Severity Scale (Yudofsky,
Kopecky, Junik, Silver, & Endicott, 1997) (convergent validity)?
89

To establish evidence of the Agitation Severity Scales’ validity, tests of
association were undertaken using a well-established agitation-rating
instrument, the Overt Agitation Severity Scale (OASS) (Yudofsky, Kopecky,
Junik, Silver, & Endicott, 1997). Pearson’s product moment correlation coefficient
was used to evaluate the relationship between Agitation Severity Scale scores
and OASS scores at four observation points for the entire sample. At time 1,
Pearson’s correlation coefficient was 0.93, p < 0.001 (N=270). For the second
observation period, the two scores were also strongly and positively correlated, r
= 0.93, p < 0.001 (N=270). At time three, the two scores remained correlated, r =
0.91, p < 0.001 (N=269). Pearson’s correlation for the two scores obtained at time 4
was also strong and positive, r = 0.90, p < 0.001 (N=266). The previously described
Table 9 presents data describing the mean Agitation Severity Scale and OASS
scores at each of the 4 observation periods. These results provide evidence of the
convergent validity of the Agitation Severity Score when utilized in this
population and setting.
Research Question 5: Do the Agitation Severity Scale items perform as
anticipated, specifically: (a) do the items define a unidimensional continuum
in the domain and, (b) do the items follow a hierarchical ordering in their
90

definition of the domain (Ludlow, Enterline, & Cochran-Smith, 2008) (Rasch
measurement model analysis)?
Following the classical test theory analysis, the Rasch rating scale model
was employed to ascertain how individual subjects and items were functioning
along the Agitation Severity Scale continuum. For this analysis, the WINSTEPS
(Version 3.69.0) software package was utilized (Linacre, 2009). Variable maps for
the Agitation Severity Scale were generated and analyzed to assess the degree to
which subjects and items were logically falling along the agitation continuum,
from mild to severe agitation (Figure 3 and Figure 4). Item and person separation
statistics were also evaluated to assess the degree to which the Agitation Severity
Scale was effectively discriminating between subjects and items as these statistics
are a measure of the degree to which items are spread out across the agitation
continuum.
Figure 3 displays the variable map of Agitation Severity Scale scores for
all 270 subjects. Within the map, the items are ordered from the easiest to
endorse, located towards the bottom of the map, to the hardest to endorse,
towards the top of the map. Items appear on the right-hand side of the map. The
study subjects are ordered from the lowest scoring on the Agitation Severity
Scale, at the bottom of the map, to the highest scoring, again, at the top of the
map. Subjects appear on the left-hand side of the map. It is important to recall at
91

this point that on the Agitation Severity Scale, higher scores represent a higher
degree of agitation while lower scores represent a lesser degree of agitation.
Examination of the distribution of study subjects’ locations on the map
indicates that, in general, most subjects were experiencing agitation that was on
the lesser, rather than greater, side; these subjects are depicted towards the
bottom of the map. Relatively few subjects had scores indicating a very high
degree of agitation; individuals experiencing extreme levels of agitation would
have been located at the top of the map. Note that there are gaps between the
lowest scorers and the easiest to endorse items (restless, speaking more quickly
than baseline). This creates the situation where we know little about the
differences between subjects falling in these “gap” areas; additional items could
be added in these spaces to allow for more differentiation between people with
lower levels of agitation.
In addition, it was noted that the majority of the Agitation Severity Scale
items were clustered together towards the middle of the map. This pattern
indicates that many of the items are measuring the same degree of the
phenomenon of interest, agitation. For example, note the proximity of the two
items “violating self or others” and “physical violence towards self or others.”
Elimination of one of these items may help to make the scale more succinct and
92

PERSON - MAP - ITEM <more>|<rare> 3 + | | | | . | | 2 + |T | . | “in your face” | . | spitting . | puffed up/chest out/threatening posture 1 . +S | | | T| demanding phys violence self/others violate self/others . | . | decreased self control/impulsiveness 0 . +M red in the face persistent disruptive verbalizations . | confrontational unable to be calmed . | .# | darting eyes angry tone tap/clench/invol. hand movement .# | yelling/louder baseline speaking more quickly baseline .### S| .## | -1 .## +S .## | # | .### | .## | .## | ##### M|T -2 + ##### | | .####### | | | | restless -3 S+ .############ | | | | | | -4 + .## T| | | | | | -5 ########## + <less>|<frequ>
Figure 3. Variable Map for the Agitation Severity Scale, N=270. Each “#” represents 4 subjects, each “.” represents 1 to 3 subjects. Items in pink type comprise the component 1 subscale. Items in orange type comprise the component 2 subscale. Items in green type comprise the component 3 subscale. Items in blue type comprise the component 4 subscale.
Less Agitation Easy Items
93

clinically useful without inhibiting the ability to detect agitated behavior at that
particular place on the agitation continuum.
As many of the study subjects experienced lower levels of agitation, the
Rasch analysis was repeated using data from only the subjects with the highest
one-half of agitation scores (N=129). The variable map from this analysis is
presented in Figure 4. As anticipated, examination of this variable map revealed
subjects more spread along the agitation continuum (experiencing all levels of
agitation) and items covering the levels of agitation experienced by the study
subjects. Clustered items (e.g. violating self or others and physical violence
towards self or others) continued to be apparent. The easiest items to endorse
appear at the bottom of the variable map (e.g. restless) and the most difficult
items to endorse (e.g. spitting) appear at the top of the map. All items were
endorsable to some degree. In addition, items tended to cluster together in a
pattern generally consistent with the components identified in the PCA.
The location of the items along the variable map makes intuitive sense
when one considers the clinically observable behavior of a patient experiencing
agitation in the emergency department. Agitated people often become restless,
frequently pacing, jiggling their legs, or clenching or tapping their hands. As
their level of agitation increases, they often begin to yell out and speak
94

PERSON - MAP - ITEM <more>|<rare> 3 + | | | | . | | 2 + | | |T | . | “in your face” | . | spitting | . | puffed up/chest out/threatening posture 1 + # | |S | | | T| demanding violating self/others | physical violence towards self/others . | . | decreased self-control/impulsiveness 0 . +M red in the face persistent disruptive verbalizations # | . | confrontational unable to be calmed | ## S| angry tone tapping/clenching/invol. hand movements .# | darting eyes .## | yelling/louder baseline speaking more quickly baseline .### | ### |S ##### | -1 .## + ## M| ##### | ## | ####### | .#### | | #### |T ######## | S| -2 .### + | | restless .# | | | # | T| | -3 + <less>|<frequ>
Figure 4. Variable Map for the Agitation Severity Scale Highest 50% of Scores, N=129. Each “#” represents 2 subjects while each “.” represents 1 subject. Items in pink type comprise the component 1 subscale. Items in orange type comprise the component 2 subscale. Items in green type comprise the component 3 subscale. Items in blue type comprise the component 4 subscale.
Less Agitation Easy Items
Hard ItemsMore Agitation
95

rapidly. Frequently, patients with this level of agitation are unable to be calmed
by care providers, escalating to an angry state where they may exhibit
confrontational behavior. As their agitation increases, these patients may become
red-faced and may eventually cause physical harm to themselves or others. In
extreme cases, agitated people may become physically threatening and spit at
their care providers.
When “extreme scorers” are included in the computations, the item
separation statistic for the Agitation Severity Scale was 5.19 and the person
separation statistic was 2.01. Extreme scorers are those subjects scoring the
lowest possible or highest possible score; these subjects were included in the
analysis because they importantly include people representative of individuals
with a high level of agitation. Person separation is a measure of the degree of the
spread of subjects along the construct’s continuum, meaning that the sample
contained an adequate array of agitation experiences. Item separation is a
measure of whether or not there are enough items spread along the continuum,
as opposed to having a cluster of items that represents only a portion of the
continuum (Bond & Fox, 2007). Although the person separation statistic was just
over the critical standard of 2.0, when coupled with the robust item separation
statistic value and the variable maps, these results suggest that we can quite
reliably be confident in the placement of persons and items along the agitation
96

continuum across other samples (Bond & Fox, 2007). In the Rasch rating scale
model, the extent to which an instrument separates people into distinct strata of
the construct while taking into account measurement error, is an estimate of the
instrument’s reliability (Bogner et al., 2000). The critical value for separation,
2.00, corresponds to a Cronbach’s alpha coefficient of approximately 0.80.
Examination of the keymap shown in Figure 5 provides information
regarding the expected responses to individual scale items for subjects with
various total Agitation Severity Scale scores. Items, shown along the right-hand
side of the figure, are ordered from easiest to endorse (bottom of figure) to
hardest to endorse (top of figure). Items that are easy to endorse represent lower
levels of agitation while those that are hardest to endorse represent very agitated
behavior. For example, the vertical line drawn upwards through the mean of the
responses indicates that the average subject is most likely to endorse a response
between 2 and 3 for the “restless” item, a 1 for “angry tone of voice” and a zero
for “physical violence to self or others.” Clinically, this would mean that a person
with an average total Agitation Severity Scale score (approximately 10 or -1.2
logits) could be expected to display restless behavior some to most of the time, to
use an angry tone of voice rarely, and not to exhibit physical violence. Moving
97

-4 -3 -2 -1 0 1 2 3 4|------+------+------+------+------+------+------+------| NUM ITEM0 0 : 1 : 2 : 33 11 o – “in your face”| |0 0 : 1 : 2 : 3 3 1 a - spitting0 0 : 1 : 2 : 3 3 13 q – puffed up/chest out/threatening posture| || |0 0 : 1 : 2 : 3 3 10 n – violating self or others0 0 : 1 : 2 : 3 3 5 h – demanding behavior0 0 : 1 : 2 : 3 3 9 l – physical violence towards self or others| |0 0 : 1 : 2 : 3 3 12 p – decreased self-control/impulsiveness0 0 : 1 : 2 : 3 3 8 k – persistent disruptive verbalizations0 0 : 1 : 2 : 3 3 2 e – red in the face0 0 : 1 : 2 : 3 3 17 u – unable to be calmed0 0 : 1 : 2 : 3 3 16 t - confrontational0 0 : 1 : 2 : 3 3 14 r – tapping/clenching/involuntary movement of hands0 0 : 1 : 2 : 3 3 7 j – angry tone of voice0 0 : 1 : 2 : 3 3 3 f – darting eyes0 0 : 1 : 2 : 3 3 6 i – speaking more quickly than baseline0 0 : 1 : 2 : 3 3 4 g – yelling/louder than baseline| || |0 0 : 1 : 2 : 3 3 15 s - restless|------+------+------+------+------+------+------+------| NUM ITEM-4 -3 -2 -1 0 1 2 3 4 1 1 111 2 3 7689444107841122 2 11 1 1 PERSON T S M S T 0 20 40 60 80 90 99 PERCENTILE
Mild Agitation Severe Agitation
Figure 5. Keymap for the Agitation Severity Scale Data on the Original Logit Scale N=129.The vertical arrow indicates the expected responses on each item for a subject with a total Agitation Severity Score at the mean.
Easy to Endorse
Hard to Endorse
98

from the vertical line towards the right side of the figure, it is noted that a person
with a higher total Agitation Severity Scale score (+1.0 logits) could be expected
to exhibit yelling or being louder than baseline nearly all of the time, to exhibit
physical violence between most and all of the time, and to exhibit spitting rarely
to some of the time. The keymap does not present a pattern suggesting that those
with a low level of agitation are likely to exhibit behaviors that represent a great
deal of agitation or vice versa, indicating that the items are functioning as
intended.
Smith (1993) wrote that, “a unique strength of the Rasch model is its
requirement that the outcome of any interaction between person and item be
solely determined by just two parameters, the ability of the person and the
difficulty of the item.” With this in mind, it is possible to examine the fit of the
data and the model. Because the Rasch model allows computation of the
expected response under the model, it is possible to calculate residuals – the
difference between the observed and expected responses. Positive residuals are
the result of higher than expected responses and negative residuals result from
lower than expected responses. Examining the pattern of residuals for each
person-and-item combination allows for identification of misfitting item-person
combinations (Bond & Fox, 2007; Ludlow, 1985, 1986).
99

Table 14
Item Infit Mean Squares and Standardized Mean Squares N = 129
Item Infit Mean Square Standardized Infit Mean Square
A 1.01 .20E .81 -1.00F 1.04 .50G .69† -3.40†
H 1.23 1.20I 1.56* 4.70*J .88 -1.30K .90 -0.50L .74 -1.10N .76 -1.00O 1.73* 1.80P .74 -1.80Q 1.32 0.90R 1.51* 4.90*S 1.11 0.70T .83 -1.70U .72 -1.80
Note. † indicates overfitting items; *indicates underfitting items.
100

Table 15
Item Outfit Mean Squares and Standardized Mean Squares N = 129
Item Outfit Mean Square Standardized Outfit Mean Square
A .20† -0.80E 1.85* 1.90F 1.01 .10G .67† -2.50†
H 1.11 .40I 2.40* 7.00*J .82 -1.40K 1.51 1.20L .40† -1.80N .41† -1.50O .77 0.00P .55† -1.90Q .65† -0.20R 1.72* 5.60*S 1.28 1.50T .74 -1.70U .62† -1.20
Note. † indicates overfitting items; *indicates underfitting items.
The first step in examining the fit of the data and model was to evaluate
the mean square infit and outfit statistics, displayed in Tables 14 and 15,
respectively. These values reflect the amount of variation in the observed data, as
compared to that predicted by the Rasch model. Infit statistics are weighted and
outfit statistics are based upon conventional sum of squared standardized
101

residuals. For example, the value 1.56 for the item I (speaking more quickly than
baseline) indicates that there was 56% more variation in the observed data than
the model predicted. Similarly, the value of 0.69 for item G (yelling, speaking
louder than baseline) indicates that there was 31% less (1 – 0.69) variation in the
observed data than was predicted by the model. Variation in the observed data is
acceptable, it indicates that a person’s responses might have been more
haphazard than was anticipated (Bond & Fox, 2007). A common example might
be a multiple choice test when a person with high ability unexpectedly provides
an incorrect response to an easy item. As an example from the agitation scale,
this might occur when a very agitated person does not exhibit a behavior that is
typically reached with a lower level of agitation. This may also occur if there
was an observation or documentation error, for example, if an agitated behavior
was observed and inadvertently not documented. Values of greater than 1.3
indicate a response pattern that is too haphazard and has too much variation;
these are termed underfits. Values that are less than 0.70 indicate a response
pattern that is too determined and has too little variation; these are called overfits
(Bond & Fox, 2007).
For the Agitation Severity Scale data there are three underfits (items I, O,
and R) and a single overfit (item G). The overfitting value for the yelling, speaking
louder than baseline item, 0.69, indicates that there is 31% less variation in the
102

observed responses than predicted by the model. This might have occurred
because there was little variation in the responses to the item because the volume
of people’s voices typically does increase as agitation increases (moving from a
quiet to a loud voice), yielding a Guttman-like response pattern. The underfitting
items (speaking more quickly than baseline; “in your face;” and tapping, clenching,
involuntary movements of hands) indicate too much variation in the data.
Examination of the unweighted outfit mean square statistics revealed
three underfits for items E, I, and R and overfits for seven other items (A, G, L, N,
P, Q, and U). This indicates more variation than anticipated for the three
underfits and less than predicted for the seven overfits. While this amount of
overfit can indicate a lack of local independence, meaning that the items are not
functioning independently, this is somewhat to be expected due to the nature of
the behaviors associated with the agitation construct. For example, one would
not logically anticipate that in a patient with severe agitation who is spitting (the
most agitated behavior) and exhibiting violence against self or others (next most
agitated behavior) that the patient would also exhibit restlessness (least agitated
behavior) simultaneously. While mathematically advantageous, this type of
variation in the data would not make clinical sense.
The next step in examining fit was to explore the standardized infit and
outfit values, which take sample size into account. Expected values for the
103
standardized infit and oufit measures are zero with negative observed values
indicating less variation than expected and positive values indicating more
variation than expected. Values of greater than 2.0 indicate a response pattern
that is too haphazard and contains too much variation while values less than -2.0
indicate too little variation and a response pattern that is too determined (Bond &
Fox, 2007). Our infit standardized mean square values contain one overfit with a
value of -3.40, for the yelling, speaking louder than baseline item. Infit standardized
mean square values also revealed two underfitting items, item I (speaking more
quickly than baseline) and R (tapping, clenching, involuntary movement of hands). For
the outfit standardized mean square values, there was also one overfit with a
value of -2.50 for the yelling, speaking louder than baseline item, and two underfit
items, again speaking more quickly than baseline and tapping, clenching, involuntary
movements of hands.
Repeating the examination of infit and outfit mean square errors and
standardized mean squares at the person level was the next step in examining fit.
Table 16 provides summary information from this process.
At the person level, mean square infit and outfit values indicted a much
greater problem with overfit than with underfit, representing too little variation
and response patterns that were overly determined. On the contrary, there was
only a slight underfit (too much variation and haphazard response pattern)
104
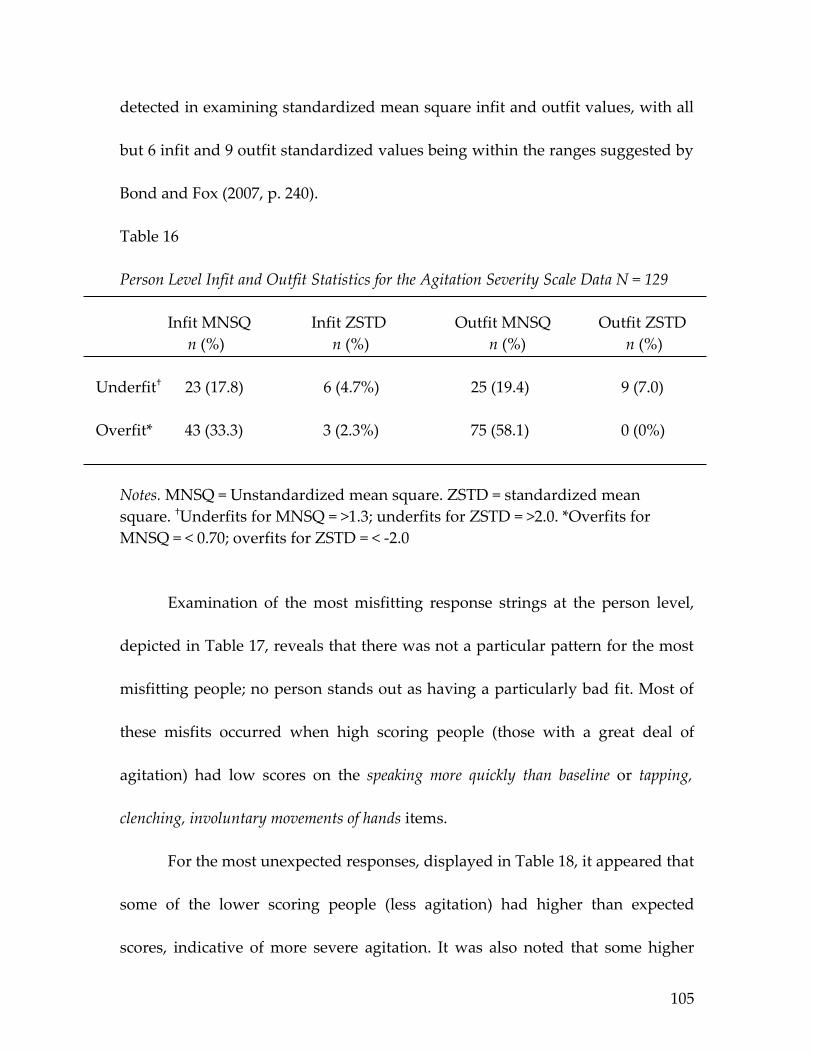
detected in examining standardized mean square infit and outfit values, with all
but 6 infit and 9 outfit standardized values being within the ranges suggested by
Bond and Fox (2007, p. 240).
Table 16
Person Level Infit and Outfit Statistics for the Agitation Severity Scale Data N = 129
Infit MNSQ Infit ZSTD Outfit MNSQ Outfit ZSTD n (%) n (%) n (%) n (%)
Underfit† 23 (17.8) 6 (4.7%) 25 (19.4) 9 (7.0)
Overfit* 43 (33.3) 3 (2.3%) 75 (58.1) 0 (0%)
Notes. MNSQ = Unstandardized mean square. ZSTD = standardized mean square. †Underfits for MNSQ = >1.3; underfits for ZSTD = >2.0. *Overfits for MNSQ = < 0.70; overfits for ZSTD = < -2.0
Examination of the most misfitting response strings at the person level,
depicted in Table 17, reveals that there was not a particular pattern for the most
misfitting people; no person stands out as having a particularly bad fit. Most of
these misfits occurred when high scoring people (those with a great deal of
agitation) had low scores on the speaking more quickly than baseline or tapping,
clenching, involuntary movements of hands items.
For the most unexpected responses, displayed in Table 18, it appeared that
some of the lower scoring people (less agitation) had higher than expected
scores, indicative of more severe agitation. It was also noted that some higher
105

scoring people exhibited lower than expected agitation behaviors. Examination
of the residuals confirms this finding. It is useful to note, however, that the
unexpected responses were not extreme. In other words, a score of 2 might have
been expected and a score of 3 was observed, indicating that the unexpected
Table 17
Most Misfitting Response Strings for the Agitation Severity Scale Data N=129
PERSON OUTMNSQ |ITEM |1 111 1 11 1 |54637467282950311 high----------------- 125 001 9.90 A|........3........ 67 000 4.88 B|..0.............. 16 37 4.64 C|0.00.0.........2. 79 000 3.50 D|02.......2....... 81 000 3.50 E|02.......2....... 86 000 3.50 F|02.......2....... 41 000 2.76 G|..0..0.........3. 129 001 2.49 H|...000.....3.3... 10 24 2.61 I|..0.........0.... 71 000 2.49 J|.....0........2.2 113 001 2.49 K|..0.............. 30 000 2.38 L|0....0........... 45 000 2.31 M|................2 63 000 2.13 N|..............1.1 70 000 2.12 O|.....0..........2 107 001 1.43 P|............0.... 96 000 1.58 Q|0................ 28 75 1.83 R|.....0........... 7 21 1.78 S|........3........ 90 000 1.75 T|..............2.. 32 000 1.75 U|..0...........222 39 000 1.60 V|............2.... 68 000 1.24 W|.........3....... 80 000 1.46 X|..0..0........... 53 000 1.11 Y|.........3....... 46 000 1.41 Z|..0.............2 |-------------low- |14637111281951111 |5 467 2 03 1
Notes. Rows represent an individual subjects’ data, with each row beginning with a subject identifier, e.g. 125 001. OUTMNSQ = outfit mean square, individuals are sorted, in descending order, by outfit mean square. Columns represent the Agitation Severity Scale items, with the easiest to endorse (least agitated) items on the left and hardest to endorse items (most agitated) on the right. In the figure, item 15 (restless) is represented by the first column. These are the Agitation Severity Scale items with the most unexpected responses.
106

Table 18
Most Unexpected Response Strings for the Agitation Severity Scale Data N=129
PERSON MEASURE |ITEM |1 111 1 11 1 |54637467282950311 high----------------- 67 000 2.18 B|..0.............. 28 75 1.53 R|.....0........... 107 001 1.25 P|............0.... 113 001 1.13 K|..0.............. 10 24 .93 I|..0.........0.... 41 000 .21 G|..0..0.........3. 46 000 .07 Z|..0.............2 32 000 .01 U|..0...........222 16 37 -.06 C|0.00.0.........2. 80 000 -.12 X|..0..0........... 129 001 -.38 H|...000.....3.3... 30 000 -.44 L|0....0........... 40 000 -.44 |...0.0........... 71 000 -.51 J|.....0........2.2 70 000 -.57 O|.....0..........2 11 25 -.71 |.............2... 45 000 -.71 M|................2 53 000 -.71 Y|.........3....... 90 000 -.71 T|..............2.. 24 63 -.79 |...........2.2... 68 000 -.79 W|.........3....... 31 000 -.94 |...........2.2... 37 000 -.94 |............2.... 3 13 -1.02 |............2.... 48 000 -1.02 |............2.... 58 000 -1.02 |............2.... 108 001 -1.02 |.........2..2.... 62 000 -1.11 |............2.... 33 000 -1.20 |............2.... 63 000 -1.20 N|..............1.1 91 000 -1.20 |..........2.2.... 96 000 -1.20 Q|0................ 106 001 -1.20 |..............1.. 109 001 -1.30 |..........2...... 120 001 -1.30 |..........2..1... 127 001 -1.30 |.......2..2...... 7 21 -1.41 S|........3........ 27 72 -1.41 |.......3......... 87 000 -1.41 |............2.... 12 27 -1.53 |..3.............. 39 000 -1.67 V|............2.... 116 001 -1.67 |.......2......... 83 000 -1.83 |...3............. 85 000 -1.83 |.....3........... 79 000 -2.03 D|02.......2....... 81 000 -2.03 E|02.......2....... 84 000 -2.03 |..2.............. 86 000 -2.03 F|02.......2....... 94 000 -2.03 |...2............. 125 001 -2.29 A|........3........ |-------------low- |14637111281951111 |5 467 2 03 1
Notes. Rows represent an individual subjects’ data and columns represent the Agitation Severity Scale items, with the easiest to endorse (least agitated) items on the left and hardest to endorse items (most agitated) on the right. Rows (subjects) are sorted by measure, in descending order. In the figure, item 15 (restless) is represented by the first column. These are the person response strings with the most unexpected responses.
107

responses were a matter of degree. For example, on any item, a “2” response is
associated with the description “present most of the time” while a “3” response
corresponds to “always present.” Extreme unexpected scores were not observed.
As an assessment of the dimensionality of the Agitation Severity Scale,
that is, the degree to which the Agitation Severity Scale measures the single
construct of agitation, additional residual analysis was performed. A person-by-
item matrix of standardized residuals was generated following the Rasch
analysis. This matrix was then subjected to Rasch residual-based principle
components analysis (PCA) to attempt to identify any common variance among
the aspects of the data that remains unexplained by the primary Rasch model.
The determinant of this matrix was non-zero (0.002) and was larger than the
determinant for the raw Agitation Severity Scale data (0.00001). Because these
determinants are both derived from correlation matrices, they are able to be
compared. As the determinant is an estimate of generalized variance, the larger
value in the residuals indicates greater unique variance, and less shared variance,
in the residuals (Ludlow & Mahalik, 2002).
Next, the Kaiser-Meyer-Olkin (KMO) statistic was evaluated. The KMO
statistic is a measure of sampling adequacy that examines covariation in the non-
zero, off-diagonal elements of the anti-image correlation matrix. The KMO
statistic is a ratio of the overall common variance to the overall common plus
108

unique variance. Kaiser (1974) recommends a bare minimum value of 0.5, with
values between 0.5 and 0.7 being fair, between 0.7 and 0.8 being good, between
0.8 and 0.9 being great, and values above 0.9 being superb (Hutcheson &
Sofroniou, 1999). The higher the KMO value, the more we are assured of the
adequacy of our sample for factoring. The KMO value for the residual matrix
was 0.336, compared with the raw data KMO of 0.856, a positive result indicating
that the residual matrix contains too little shared variation to be meaningfully
divided through PCA.
Bartlett’s test is a test of whether or not the correlation matrix is like an
identity matrix in that none of the variables correlate – that they are independent
of each other. Because we are looking for clusters of variables that are related,
complete independence of the variables is not generally desirable. A significant
Bartlett’s test means that the correlations are significantly different from zero,
that they are correlated, and this is what we want for factor analysis. If the
variables are completely unrelated, Bartlett’s test would not be significant and
factor analysis might not be appropriate. In the case of Rasch residual analysis, a
significant Bartlett’s test is not desirable and in this analysis, one was observed
(χ2 = 761.098, df = 136, p < 0.001), indicating that there is enough left in the matrix
to factor analyze.
109

Table 19 displays the unrotated, principle components solution for the
Agitation Severity Scale residuals. SPSS has identified 17 factors before
Table 19
Total Variance Explained, Agitation Severity Scale Residuals N=129
Component
Initial Eigenvalues Extraction Sums of Squared Loadings
Total % of Variance
Cumulative %
Total % of Variance
Cumulative %
1 2.928 17.222 17.222 2.928 17.222 17.2222 2.512 14.778 32.001 2.512 14.778 32.0013 1.687 9.921 41.922 1.687 9.921 41.9224 1.507 8.863 50.784 1.507 8.863 50.7845 1.155 6.795 57.580 1.155 6.795 57.5806 1.043 6.136 63.715 1.043 6.136 63.7157 0.975 5.735 69.4508 0.959 5.642 75.0929 0.897 5.278 80.37010 0.815 4.792 85.16111 0.675 3.972 89.13312 0.601 3.535 92.66813 0.426 2.507 95.17514 0.349 2.053 97.22815 0.299 1.757 98.98416 0.111 0.651 99.63517 0.062 0.365 100.000
Note. Extraction method = Principle components analysis.
extraction, one for each Agitation Severity Scale item. The table provides
eigenvalues for each eigenvector before and after extraction. The SPSS default,
110

consistent with Kaiser’s criterion of retaining factors with eigenvalues greater
than 1 was used as the extraction technique because an eigenvalue of 1
represents a significant amount of variation for this instrument. In the initial
solution, the first component accounts for 17.22% of total variance. SPSS then
extracted the components with eigenvalues greater than 1, leaving the solution
with six components. The eigenvalues associated with these components along
with the percentage of variance they explain (63.72%) is displayed in the second
portion of Table 19, under the heading “Extraction Sums of Squared Loadings.”
The other components identified by SPSS (components 7 through 17) explain
smaller amounts of the total variance, 0.37% to 5.74%. Ultimately, this indicates
that there is a small amount variance left over that is unexplained by the Rasch
model.
Table 20 displays communalities, the proportion of common variance
within a variable, before and after extraction. Principle components analysis
initially assumes that all variance is common variance; therefore, the initial
communality values are all equal to one. The communalities displayed under the
heading “extraction” reflect the common variance estimated for the sample. For
example, we now can say that 66.7% of the variance associated with the
“spitting” item in the Agitation Severity Scale residuals is common variance.
111

These values represent the variance explained by the retained factors following
extraction. The communalities for the Agitation Severity Scale residuals by item
Table 20
Communalities, Agitation Severity Scale Residuals N=129
Item Initial Extraction
A 1.00 .667E 1.00 .608F 1.00 .453G 1.00 .752H 1.00 .552I 1.00 .483J 1.00 .724K 1.00 .726L 1.00 .899N 1.00 .871O 1.00 .660P 1.00 .496Q 1.00 .754R 1.00 .548S 1.00 .445T 1.00 .722U 1.00 .472
Note. Extraction method = Principle components analysis.
range from 0.445 to 0.899, accounting for a large proportion of the common
variance. This is also not a positive finding in this circumstance because it
indicates that there may be a factor left in the residuals.
112

Figure 6 depicts the scree plot for the Agitation Severity Scale residual
data. Here, we see that there does appear to be a distinct point of inflection,
meaning that a factor may remain in the residuals.
Figure 6. Scree Plot for Eigenvalues for the Agitation Severity Scale Residual Analysis N=129.
Table 21 displays the component matrix prior to rotation. The values contained
in the table are the loadings of each variable onto each component. It was noted
that the confrontational behavior/attitude; angry tone of voice; tapping, clenching,
113

involuntary movements of hands; darting eye; restless; speaking more quickly than
baseline; and demanding behavior item residuals all loaded highly onto the first
component. The physical violence to self or others; violating self or others; and unable
to calm item residuals loaded onto the second component. The third component
was comprised of residuals from the yelling, speaking louder than baseline and
persistent disruptive verbalizations items. The fourth component consisted of
residuals from the puffed up and “in your face” items. Component 5 only
contained residuals from the spitting item and the last component contained
residuals from the red in the face and decreased self-control items.
The WINSTEPS program was then utilized to create a table of
standardized residual variance in eigenvalue units as a check on the
dimensionality of the Agitation Severity Scale; this is provided as Table 22. Table
22 demonstrates that 51.6% of the variance in the data is explained by the Rasch
dimension. The largest secondary dimension, labeled the “first contrast” in the
residuals, explains 8.3% of the variance, a bit larger than the approximately 4%
that is observed in random data simulated to fit the Rasch model. In the
Agitation Severity Scale data, the variance explained by the items, 37.9%, is about
five times the variance explained by the first contrast, 8.3%, greater than the
threshold of four times suggested by Linacre (2009). These results indicate that
114

Table 21
Unrotated Component Matrix, Agitation Severity Scale Residuals N=129
Component
Item 1 2 3 4 5 6
Component 1T .73J .71R -.68F -.52S -.50I -.49H -.41
Component 2L .91N .84U .53
Component 3G .78K .65
Component 4Q .72O .67
Component 5A -.58
Component 6E .61P .44
Note. Extraction method = Principle components analysis.
115

there is probably not another large dimension in the data that is not explained by
the Rasch dimension and provides evidence supporting the unidimensionality of
the Agitation Severity Scale. In addition, the eigenvalue of the first contrast, 2.9,
indicates that it has the strength of about three items, just a bit larger than the
Table 22
Standardized Residual Variance in Eigenvalue Units, Agitation Severity Scale Data N=129
Empirical Modeled
Total raw variance in observations 35.1 100.0% 100.0% Raw variance explained by measures 18.1 51.6% 51.7% Raw variance explained by persons 4.8 13.7% 13.7% Raw variance explained by items 13.3 37.9% 37.9%Raw unexplained variance (total) 17.0 48.4% 49.2% Unexplained variance in 1st contrast 2.9 8.3% Unexplained variance in 2nd contrast 2.5 7.2% Unexplained variance in 3rd contrast 1.7 4.8% Unexplained variance in 4th contrast 1.5 4.3% Unexplained variance in 5th contrast 1.2 3.3%
Note. Method of extraction = Principle components analysis.
strength of two items (an eigenvalue of 2.0), the smallest amount that could be
considered another dimension (Linacre, 2009).
Summary
116

This chapter presented findings from the psychometric evaluation of the
Agitation Severity Scale. The Agitation Severity Scale was found to be comprised
of 4 factors: Aggressive Behaviors, Interpersonal Behaviors, Involuntary Motor
Behaviors, and Physical Stance which accounted for 69% of the common variance
observed in the study sample. The Agitation Severity Scale was judged to
possess excellent equivalence reliability following evaluation of scores assigned
by two independent raters (r = 0.99, p < 0.001, n = 30; Κ = 0.98, 95% CI: 0.96 – 1.00,
n = 30).
Evidence of high internal consistency reliability was provided by a
standardized alpha coefficient of 0.91 for the 17 items with corrected item-total
correlations that were above 0.30. Internal consistency reliability for the 4
individual subscales of the Agitation Severity Scale ranged from 0.71 to 0.91,
indicating acceptable internal consistency for a newly developed instrument.
Construct validity was established by comparing mean Agitation Severity
Scale scores for subjects in the highest (most agitated) and lowest (least agitated)
scoring quartiles. A statistically significant difference was noted when comparing
scores for these groups (t = -17.688, df = 155, p < 0.001), suggesting that the
Agitation Severity Scale is able to discriminate between subjects with and
without high levels of agitation and providing evidence of the instrument’s
construct validity.
117

Convergent validity was evaluated by testing the association between
Agitation Severity Scale scores and scores obtained using the well-established
Overt Agitation Severity Scale. Pearson’s correlation coefficients for the
associations between the two scores at four observation periods ranged from 0.91
to 0.93, indicating a strong, positive relationship between the scores and
providing evidence of convergent validity.
The Rasch measurement model was employed to evaluate further the
performance of the Agitation Severity Scale when conceptualizing the construct
of agitation as existing along a continuum where scale items and people can be
ordered in a hierarchical fashion along the continuum. Rasch modeling revealed
a hierarchy for the Agitation Severity Scale items ranging from behaviors
observed at low levels of agitation to behaviors observed at high levels of
agitation. Information gained from this analysis allows for the elimination of
duplicative items (e.g. physical violence to self or others and violating self or
others) and the ability to predict behaviors for persons with a particular
Agitation Severity Scale score, resulting in a more succinct and clinically useful
instrument. Although a small amount of residual variance was noted, in sum the
Rasch residual analysis provided support for the Agitation Severity Scale as
being unidimensional, measuring the single construct of agitation.
118

CHAPTER 5
Conclusions and Discussion
Introduction
The objectives of this methodological study were: (a) to develop an
observation-based rating scale to assess the continuum of behaviors known as
agitation in an adult emergency department population, and (b) to evaluate the
psychometric properties of the newly developed instrument. This chapter will
summarize the study, present the study conclusions and discuss implications for
clinical practice and further research.
Development of the Instrument
Emergency clinicians noted the need for an instrument to measure the
phenomenon of agitation in the emergency setting. Existing instruments were
evaluated and found to be limited by the length of time required for
administration, difficulty in scoring, or having a focus on a different population,
all precluding use with the acute psychiatric population in the emergency
setting. With these limitations in mind, the Agitation Severity Scale was
developed to fill this void: specifically, development of an observation-based,
patient-centric instrument that is quick to use, simple to score, and specific to the
acute psychiatric patient in the emergency setting was the goal.
119

An initial item pool was generated following a series of focus groups
conducted with providers of acute psychiatric care. Clinicians were then
surveyed regarding the representativeness and clarity of the potential items in a
first round of content validity assessment. A panel of experts was assembled for
a second round of formal content validity testing, which yielded a 21-item draft
of the Agitation Severity Scale with scale-level indices of content validity equal to
0.80 for both clarity and representativeness.
Psychometric Evaluation of the Instrument
Psychometric evaluation of the Agitation Severity Scale was accomplished
using data from a sample of 270 adult emergency department patients with
primary psychiatric chief complaints and DSM-IV-TR diagnoses. The researcher
used the Agitation Severity Scale to rate the subjects on 21 items representing the
phenomenon of agitation. Item-total correlations were computed for the 21 initial
Agitation Severity Scale items. Four items (biting; grinding teeth; throwing
objects; and being emotionally labile, anxious, nervous) were found to have
corrected item-total correlations that were below the 0.30 cut-off; therefore, these
four items were excluded from further analysis. Corrected item-total correlations
ranged from 0.34 to 0.73. The standardized Cronbach’s alpha coefficient for the
final, 17-item scale was 0.91, providing evidence of a high degree of internal
consistency reliability.
120

Equivalence, or interrater, reliability was established by comparing
Agitation Severity Scale scores assigned to a subset of 30 subjects by two blinded,
independent raters. A corrected Pearson’s product moment correlation statistic
tested the association between the two raters’ scores and found a high, positive
degree of equivalence reliability (r = 0.99, p < 0.001, n = 30). Cohen’s weighted
kappa statistic further supported this finding, Κ = 0.95, 95% CI: 0.96 – 1.00.
The 17 Agitation Severity Scale items were subjected to principle
components analysis with iterations followed by varimax rotation and Kaiser
normalization. Kaiser-Guttman’s criterion of using all unrotated components
with eigenvalues greater than 1.0 was applied in order to identify the
components accounting for the maximum amount of variance. In addition, each
component needed to account for the variance of at least two items. Application
of these criteria resulted in a four-component solution accounting for 69% of
common variance. Component 1, Aggressive Behaviors, had 7 items and an
eigenvalue of 4.5, accounting for 26.7% of variance. Component 2, Interpersonal
Behaviors, was comprised of 4 items and had an eigenvalue of 3.0, explaining an
additional 17.5% of variance. Component 3, Involuntary Motor Behaviors, also
contained 4 items, had an eigenvalue of 2.5, and accounted for 14.4% of variance.
Physical Stance, Component 4, consisted of 2 items with an eigenvalue of 1.8 and
accounted for an additional 10.3% of variance.
121

Internal consistency reliability, as measured by Cronbach’s alpha
coefficient, was evaluated for each of the PCA-derived components. Aggressive
Behaviors had a standardized alpha coefficient of 0.91. For the Interpersonal
Behaviors component, alpha was 0.85. The Involuntary Motor Behaviors component
was found to have an alpha coefficient of 0.74. Finally, the Physical Stance
component had a standardized alpha coefficient of 0.71. As a result of these
findings, the Agitation Severity Scale and its 4 subscales were judged as
possessing acceptable internal consistency when used with psychiatric patients
in the emergency setting.
Evidence for the convergent validity of the Agitation Severity Scale was
obtained through the performance of tests of association using a well-established
agitation rating instrument, the Overt Agitation Severity Scale (OASS). Pearson’s
product moment correlation coefficient was computed to evaluate the
relationship between Agitation Severity Scale scores and OASS scores at four
time points. Strong, positive correlations were noted at each of the observation
points, r = 0.90 – 0.93, p < 0.001 for each.
Agitation Severity Scale scores were divided into quartiles to facilitate an
evaluation of construct validity. Mean scores from the lowest quartile of scorers
(least agitated) and highest quartile of scorers (most agitated) were compared
using the independent samples t-test. This comparison revealed a statistically
122

significant difference in mean scores for the lowest and highest quartile of
scorers, t = -17.688, df = 155, p < 0.001, providing evidence for the construct
validity of the Agitation Severity Scale.
In addition to the classical test theory analyses described above, the Rasch
rating scale model was employed to evaluate further the functioning of the
Agitation Severity Scale and its items. Variable maps demonstrated that the scale
items can be organized into a logical hierarchy representing the continuum of
agitation. The person separation statistic (2.00) indicated that the Agitation
Severity Scale effectively discriminates between subjects with varied degrees of
agitation. The item separation statistic (5.19) indicates that the items are well
spread out across the agitation continuum. Several items were noted to be
clustered together, indicating some duplication in these areas, for example,
“violating self or others” and “physical violence towards self or others.” Such
items may be combined or eliminated in future versions of the scale. Keymaps
demonstrated the ability to predict behaviors for subjects with particular
Agitation Severity Scale scores.
Limitations
Several important limitations should be considered when interpreting the
study findings. First, subjects were enrolled on a convenience basis, introducing
the possibility of bias in subject selection. In addition, the sample was comprised
123

primarily of white subjects, due to the racial composition of the population in the
area where the study was conducted. As a result, the study sample is not
representative of all adult acute psychiatric patients treated in emergency
departments. Thus, sampling characteristics and selection may limit the
generalizability of these findings to more racially and geographically diverse
populations. However, current literature does not provide evidence that agitated
behaviors vary based on race.
Additional limitations are inherent to the study design. Study data were
collected by the primary investigator, who was not blinded to the study
hypotheses. As the developer of the Agitation Severity Scale, the investigator had
particular interest in the success of the instrument. These issues may have
introduced bias as the data were collected. To combat this, the investigator
followed a strict study protocol and used only the approved data collection
instruments. In addition, a second clinician independently assigned Agitation
Severity Scale scores to a subset of 30 subjects to facilitate interrater reliability
analysis. The results of this analysis indicated very strong agreement between
the two raters, providing a check on the neutrality of the data collection process.
Implications
Future research with the Agitation Severity Scale. The limitations of this
study provide a starting place for additional research with the Agitation Severity
124

Scale. Future work should begin with enrollment of subjects on a consecutive,
rather than convenience, basis to limit potential selection bias. Certainly the
psychometric properties of the instrument should be examined in more racially
(Black/African American, Asian) and ethnically diverse (Hispanic/Latino)
populations in order to enhance applicability of the findings. Additional study
with data collection performed by people who are blinded to the study
hypotheses and who are less invested in the success of the instrument would
ensure neutrality in the collection of study data.
Important limitations in previously established agitation rating
instruments have precluded their use in the emergency setting. Specifically, the
length of observation required by many instruments and the complexity of their
scoring systems have rendered them a poor fit for use by emergency clinicians.
The current version of the Agitation Severity Scale consists of 4 behavioral
domains and 14 items, still a lengthy scale for emergent use as it generally
requires approximately 5 to 7 minutes for observation and scoring. Utilization of
the Rasch rating scale findings presented here may allow for revision of the
instrument to be more concise for greater clinical utility and to fill in identified
gaps is less agitated behavior with additional items. Future studies would need
to re-evaluate the psychometric properties of a shortened or altered instrument
to ensure adequate reliability and validity in clinical practice.
125

Having a reliable and valid agitation rating instrument designed
specifically for this setting and population facilitates the development and
testing of interventions aimed at preventing and decreasing agitation.
Correlational studies can be used to evaluate the relationship between scores on
the Agitation Severity Scale and important markers of emergency department
throughput, including length of stay and time to definitive treatment. In
addition, establishing the presence of a relationship between Agitation Severity
Scale scores and the length of time that patients are physically restrained or
secluded would provide an important impetus for clinicians to work towards
decreasing agitation levels in their patients.
Clinical implications. Initial psychometric evaluation of the Agitation
Severity Scale has demonstrated acceptable levels of reliability and validity when
used in the emergency setting with adult acute psychiatry patients. Due to the
limitations discussed above, additional refinement of the instrument is
warranted before widespread clinical use of the Agitation Severity Scale can be
recommended. Despite this, the instrument could be used as an adjunct to
current, more subjective, methods of evaluating agitation levels in the emergency
setting.
The Agitation Severity Scale holds promise for several clinical uses. First,
the instrument could be used to detect and verify the presence of agitation in
126

acute psychiatric patients. It could also be used as an instrument for repeated
measurements with the same patient, in order to evaluate the effectiveness and
timeliness of interventions aimed at agitation reduction. Findings from the Rasch
analysis demonstrate the utilization of the Agitation Severity Scale as a
predictive tool, allowing clinicians to know the likelihood of specific behaviors,
for example spitting, for patients with particular agitation levels. Use of the scale
in this way could allow clinicians to anticipate potentially dangerous behaviors
prior to their occurrence, which may encourage the use of de-escalation
techniques in an effort to prevent harmful behaviors and which may facilitate
identification of patients who are at risk for escalation in their behavior.
Summary
Agitation is a distressing set of behaviors frequently observed in
emergency department patients with acute psychiatric presentations. Important
sequelae of agitation include a patient’s progression to aggressive behaviors, as
well as clinician responses to agitation such as physical restraint, seclusion, social
isolation, disruption of necessary care, and impaired development of the
therapeutic nurse-patient relationship. Key to developing and evaluating
treatment strategies aimed at decreasing and preventing agitation is the
availability of a reliable and valid instrument to measure observed behaviors
representative of agitation.
127

The objectives of this methodological study were to: (a) develop an
observation-based rating scale to assess the continuum of behaviors known as
agitation in adult emergency department patients, and (b) to evaluate the
psychometric properties of the instrument. The Agitation Severity Scale was
developed through review of the literature and focus groups, and content
validity was established. Psychometric evaluation was conducted with a sample
of 270 adult acute psychiatry patients in the emergency department setting.
Results indicated that the scale appears to be sufficiently reliable and valid for
future use with this patient population in the emergency setting. Additional
research with a more racially and ethnically diverse patient population is
warranted to improve generalizability of the study findings.
128

References
agitation. (n.d.). Online Etymology Dictionary. Retrieved February 09, 2009, from
Dictionary.com website: http://dictionary.reference.com/browse/agitation.
agitation. (n.d.). The American Heritage® Dictionary of the English Language, Fourth
Edition. Retrieved February 09, 2009, from Dictionary.com website:
http://dictionary.reference.com/browse/agitation.
agitation. (n.d.). WordNet® 3.0. Retrieved February 09, 2009, from Dictionary.com
website: http://dictionary.reference.com/browse/agitation.
Altman, E.G., Hedeker, D.R., Janicak, P.G., Peterson, J.L., & Davis, J.M. (1994).
The clinician administered rating scale for mania (CARS-M):
development, reliability, and validity. Biological Psychiatry, 36, 124-134.
American Psychiatric Association. (2000). Diagnostic and statistical manual of
mental disorders, 4th edition, text revision (DSM-IV-TR). Washington, D.C.:
American Psychological Association.
Ancill, R. J., Carlyle, W.W., Liang, R.A., & Holliday, S.G. (1991). Agitation in the
demented elderly: a role for benzodiazepines? International Clinical
Psychopharmacology, 6, 141-146.
Anderson, K.N., Anderson, L.E., & Glanze, W.D. (1998). Mosby’s medical, nursing,
& allied health dictionary, 5th edition. St. Louis: Mosby.
129

Barnes, R., & Raskind, M. (1980). Strategies for diagnosing and treating agitation
in the aging. Geriatrics, 35, 111-119.
Bartee, R.T., Grandjean, B.D. & Bieber, S.L. (2004). Confirming the reliability of a
theory-based questionnaire. American Journal of Health Studies, 19.3.
Retrieved from http://www.va-ajhs.com/19-3/index.aspx.
Bartles, S.J., Horn, S.D., Smout, R.J., Dums, A.R., Flaherty, E., Jones, J.K., Monane,
M., Taler, G.A. & Voss, A.C. (2003). Agitation and depression in frail
nursing home elderly patients with dementia. American Journal of Geriatric
Psychiatry, 11, 231-238.
Beigel, A., Murphy, D.L., & Bunney, W.E.J. (1971). The manic-state rating scale:
scale construction, reliability, and validity. Archives of General Psychiatry,
25, 256-262.
Bigelow, L.B. & Berthat, B.D. (1989). The psychiatric symptom assessment scale
(PSAS). Psychopharmacology Bulletin, 25, 168-173.
Bell, M., Milstein, R., Beam-Goulet, J., Lysaker, P., & Cicchetti, D. (1992). The
positive and negative syndrome scale and the brief psychiatric rating
scale: reliability, comparability, and predictive validity. Journal of Nervous
and Mental Disease, 180, 723-728.
Berk, R.A. (1990). Importance of expert judgment in content-related validity
evidence. Western Journal of Nursing Research, 12, 659-671.
130

Bogner, J. & Corrigan, J.D. (1995). Epidemiology of agitation following brain
injury. NeuroRehabilitation, 5, 293-297.
Bogner, J.A., Corrigan, J.D., Stange, M., & Rabold, D. (1999). Reliability of the
agitated behavior scale. Journal of Head Trauma Rehabilitation, 14, 91-96.
Bogner, J.A., Corrigan, J.D., Bode, R.K., & Heinemann, A.W. (2000). Rating Scale
analysis of the agitated behavior scale. Journal of Head Trauma
Rehabilitation, 15, 656-669.
Bond, T.G. & Fox, C.M. (2007). Applying the Rasch model: Fundamental measurement
in the human sciences. Mahwah, N.J.: Lawrence Erlbaum Associates.
Brenes, G.A., Miller, M.E., Stanley, M.A., Williamson, J.D., Knudson, M., &
McCall, W.V. (2009). Insomnia in older adults with generalized anxiety
disorder. American Journal of Geriatric Psychiatry, 17, 465-472.
Brennan, R.L. (2001). Some problems, pitfalls, and paradoxes in educational
measurement. Educational Measurement: Issues and Practice, 20, 6-18.
Burns, N. & Grove, S.K. (2009). The concepts of measurement. In N. Burns & S.K.
Grove (Eds.), The Practice of Nursing Research: Appraisal, Synthesis, and
Generation of Evidence (pp. 371-394, 6th ed.). St. Louis, MO: Elsevier
Saunders.
Carmines, E.G. & Zeller, R.A. (1979). Reliability and validity assessment. Newbury
Park: Sage Publications.
131

Carper, B.A. (1978). Fundamental patterns of knowing in nursing. ANS. Advances
in Nursing Science, 1, 13-23.
Chinn, P.L. & Kramer, M.K. (2008). Integrated theory and knowledge development in
nursing. St. Louis, MO: Mosby-Elsevier.
Coccaro, E.F., Harvey, P.D., Kupsaw-Lawrence, E., Herbert, J.L., & Bernstein,
D.P. (1991). Development of neuropharmacologically based behavioral
assessments of impulsive aggressive behavior. Journal of Neuropsychiatry &
Clinical Neurosciences, 3, S44-S51.
Coccaro, E.F. & Kavoussi, R.J. (1997). Fluoxetine and impulsive-aggressive
behavior in personality disordered subjects. Archives of General Psychiatry,
54, 1081-1088.
Cohen, J. (1960). A coefficient of agreement for nominal scales. Educational and
Psychological Measurement, 20, 37-46.
Cohen-Mansfield, J. (1989). Agitated behaviors in the elderly: II. Preliminary
results in the cognitively deteriorated. Journal of the American Geriatrics
Society, 34, 722-727.
Cohen-Mansfield, J. (2003). Agitation in the elderly: definitional and theoretical
conceptualizations. In D.P. Hay & D.T. Klein (Eds., pp. 1-21) Agitation in
Patients with Dementia: A Practical Guide to Diagnosis and Management.
Clinical Practice Series. Washington, D.C.: American Psychiatric Publishing.
132

Cohen-Mansfield, J., & Billig, N. (1986). Agitated behaviors in the elderly. I. A
conceptual review. Journal of the American Geriatrics Society, 34, 711-721.
Cohen-Mansfield, J., Marx, M.S., & Rosenthal, A.S. (1989). A description of
agitation in a nursing home. Journal of Gerontology, 44, M77-M84.
Corrigan, J.D. (1989). Development of a scale for assessment of agitation
following traumatic brain injury. Journal of Clinical and Experimental
Neuropsychology, 11, 261-277.
Corrigan, J.D. & Mysiw, W., J. (1988). Agitation following traumatic head injury:
equivocal evidence from a discrete stage of cognitive recovery. Archives of
Physical Medicine and Rehabilitation, 69, 487-492.
Corrigan, J.D., Mysiw, W.J., Gribble, M., & Chock, S. (1992). Agitation, cognition
and attention during post-traumatic amnesia. Brain Injury, 6, 155-160.
Corrigan, J.D. & Bogner, J.A. (1994). Factor structure of the agitated behavior
scale. Journal of Clinical and Experimental Neuropsychology, 16, 386-392.
Crocker, L. & Algina, J. (2008). Introduction to classical and modern test theory.
Mason, OH: Cengage Learning.
Cox, D.R. (1970). The analysis of binary data. London: Chapman and Hall.
Davis, L.L. (1992). Instrument review: getting the most from a panel of experts.
Applied Nursing Research, 5, 104-107.
133

Day, R.K. (1999). Psychomotor agitation: poorly defined and badly measured.
Journal of Affective Disorders, 55, 89-98.
Dearing, K.S. (2004). Getting it, together: how the nurse patient relationship
influences treatment compliance for patients with schizophrenia. Archives
of Psychiatric Nursing, 5, 155-163.
Derlet, R.W. & Richards, J.R. (2000). Overcrowding in the nation’s emergency
departments: complex causes and disturbing effects. Annals of Emergency
Medicine, 35, 63-68.
DeVellis, R.F. (1991). Scale development: Theory and applications. Newbury Park,
CA: Sage.
Diwan, S. & Phillips, V.L. (2001). Agitation and dementia-related problem
behaviors and case management in long-term care. International
Psychogeriatrics, 13, 5 – 21.
Dunkin, J.J. & Anderson-Hanley, C. (1998). Dementia caregiver burden: a review
of the literature and guidelines for assessment and intervention.
Neurology, 51, S53-S67.
Dyck, G. (1997). Management of geriatric behavior problems. Psychiatric Clinics of
North America, 20, 165-180.
134

Endicott, J., Tracy, K., Burt, D., Olson, E., & Coccaro, E.F. (2002). A novel
approach to assess inter-rater reliability in the use of the overt aggression
scale – modified. Psychiatry Research, 112, 153-159.
Evans, D., Wood, J. & Lambert, L. (2003). Patient injury and physical restraint
devices: a systematic review. Journal of Advanced Nursing, 41, 274-282.
Ferketich, S. (1990). Internal consistency estimates of reliability. Research in
Nursing & Health, 13, 437-440.
Finkel, S.I., Lyons, J.S., & Anderson, R.L. (1993). A brief-agitation rating scale
(BARS) for nursing home elderly. Journal of the American Geriatrics Society,
41, 50-52.
Fleiss, J.L. & Cohen, J. (1973). The equivalence of weighted kappa and the
intraclass correlation coefficient as measures of reliability. Educational and
Psychological Measurement, 3, 613-619.
Flemenbaum, A., & Zimmermann, R.L. (1973). Inter-and intra-rater reliability of
the brief psychiatric rating scale. Psychological Reports, 36, 783-792.
Forster, A., Stiell, I., Wells, G., Lee, A., Van Walraven, C. (2003). Effect of hospital
occupancy on emergency department length of stay and patient
disposition. Annals of Emergency Medicine, 10, 127-133.
135

Frengley, J.D. & Mion, L.C. (1986). Incidence of physical restraints on acute
general medical wards. Journal of the American Geriatrics Society, 34, 565-
568.
George, D. & Mallery, P. (2003). SPSS for Windows step by step: A simple guide and
reference. 11.0 update (4th ed.). Boston: Allyn & Bacon.
Gerdner, L.A. & Buckwalter, K.C. (1994). A nursing challenge: assessment and
management of agitation in Alzheimer’s patients. Journal of Gerontological
Nursing, 20, 11-20.
Gerolamo, A.M. (2006). The conceptualization of physical restraint as a nurse-
sensitive adverse outcome in acute psychiatric treatment settings. Archives
of Psychiatric Nursing, 20, 175-185.
Goren, S., Singh, N.N., & Best, A.M. (1993). The aggression-coercion cycle: use of
seclusion and restraint in a child psychiatric hospital. Journal of Child and
Family Studies, 2, 61-73.
Grant, J.S. & Davis, L.L. (1997). Selection and use of content experts for
instrument development. Research in Nursing & Health, 20, 269-274.
Green, L.W. & Lewis, F.M. (1986). Measurement and evaluation in health education
and health promotion. Palo Alto, CA: Mayfield.
136

Gur, R.E., Mozley, P.D., Resnick, S.M., Levick, S., Erwin, R., Saykin, A.J., & Gur,
R.C. (1991). Relations among clinical scales in schizophrenia. American
Journal of Psychiatry, 148, 472-278.
Hair, J.F., Anderson, R.E., Tatham, R.L., & Black, W.C. (1998). Multivariate data
analysis (5th ed.). Upper Saddle River, NJ: Prentice-Hall.
Hambleton, R.K., Swaminathan, H., & Rogers, H.J. (1991). Fundamentals of item
response theory. Newbury Park, CA: Sage.
Harris, D. (1989). Comparison of 1-, 2-, and 3-parameter IRT models. Educational
Measurement: Issues and Practice, 8, 35-41.
Harris, C.E., O’Donnell, C., & Macmillan, R.R. (1991). Use of propofol by infusion
for sedation of patients undergoing haemofiltration – assessment of the
effect of haemofiltration on the level of sedation and on blood propofol
concentration. International Journal of Drug Development, 4, S37-S39.
Haskell, R.M., Frankel, H.L., & Rotondo, M.F. (1997). Agitation. AACN Clinical
Issues, 8, 335-350.
Hattie, J., Jaeger, R.M. & Bond, L. (1999). Persistent methodological questions in
educational testing. Review of Research in Education, 24, 393-446.
Hazlett, S.B., McCarthy, M.L., Londner, M.S. & Onyike, C.U. (2004).
Epidemiology of adult psychiatric visits to US emergency departments.
Academic Emergency Medicine, 11, 193-195.
137

Hedlund, J.L. & Vieweg, B.W. (1980). The brief psychiatric rating scale (BPRS): a
comprehensive review. Journal of Operational Psychiatry, 11, 48-65.
Henderson, L., Siddons, K., Wasser, T., Gunn, S., & Spisszak, E. (2005).
Frequency of client and staff injury during physical restraint episodes: a
comparison of 2 child restraint systems. Journal of Clinical Outcomes
Management, 1, 193-198.
Higgins, P.A. & Straub, A.J. (2006). Understanding the error of our ways:
Mapping the concepts of validity and reliability. Nursing Outlook, 54, 23-
29.
Hurley, A.C., Volicer, L., Camberg, L., Ashley, J., Woods, P., Odenheimer, G.,
Ooi, W.L., McIntyre, K., & Mahoney, E. (1999). Measurement of observed
agitation in patients with dementia of the Alzheimer type. Journal of
Mental Health & Aging, 5, 117-133.
Hutcheson, G. & Sofroniou, N. (1999). The multivariate social scientist. London:
Sage.
Institute of Medicine. (2006). Hospital-based emergency care: at the breaking point.
Retrieved March 30, 2009 at http://www.nap.edu/catalog/11621.html#toc.
Irving, K. (2002). Governing the conduct of conduct: are restraints inevitable?
Journal of Advanced Nursing, 40, 405-412.
138

Jacobson, S.F. (1997). Evaluating instruments for use in clinical nursing research.
In M. Frank-Stromborg & S.J. Olsen (Eds.), Instruments for Clinical Health-
Care Research (pp. 3-19, 2nd Ed.). Sudbury, MA: Jones and Bartlett
Publishers.
Johnson, M.E. (1998). Being restrained: a study of power and powerlessness.
Issues in Mental Health Nursing, 19, 191-206.
Jönsson, P. (2007). Respiratory sinus arrhythmia as a function of state anxiety in
healthy individuals. International Journal of Psychophysiology, 63, 48-54.
Kaiser, H.F. (1960). The application of electronic computers to factor analysis.
Educational and Psychological Measurement, 20, 141-151.
Kaiser, H.F. (1974). An index of factorial simplicity. Psychometrika, 39, 31-36.
Kanich, W., Brady, W.J., Huff, S., Perron, A.D., Holstege, C., Lindbeck, G., &
Carter, C.T. (2002). Altered mental status: evaluation and etiology in the
ED. American Journal of Emergency Medicine, 20, 613-617.
Kim, J.O. & Mueller, C.W. (1978). Factor analysis: statistical methods and practical
issues. Newbury Park, CA: Sage.
Kong, E.H. (2005). Agitation in dementia: concept clarification. Journal of
Advanced Nursing, 52, 526-536.
139

Kopecky, H.J., Kopecky, C.R., & Yudofsky, S.C. (1998). Reliability and validity of
the overt agitation severity scale in adult psychiatric inpatients. Psychiatric
Quarterly, 69, 301-323.
Kopecky, H.J. & Yudofsky, S.C. (1999). Agitation: conceptualization,
measurement, and treatment. Bulletin of the Menninger Clinic, 63, A31-A52.
Kralik, D., Koch, T., & Wolton, K. (1997). Engagement and detachment:
understanding patients’ experiences with nursing. Journal of Advanced
Nursing, 26, 399-407.
Landis, J.R. & Koch, G.G. (1977). The measurement of observer agreement for
categorical data. Biometrics, 33, 159-174.
Linacre, J.M. (2009). Winsteps® (Version 3.69.0) [Computer Software]. Beaverton,
OR: Winsteps.com. Retrieved April 1, 2010. Available from
http://www.winsteps.com/
Lindenmayer, J.P. (2000). The pathophysiology of agitation. Journal of Clinical
Psychiatry, 61, 5-10.
Lofgren, R.P., MacPherson, D.S., Granieri, R., Myllenbeck, S., Sprafka, J.M. (1989).
Mechanical restraints on the medical wards: are protective devices safe?
American Journal of Public Health, 79, 735-738.
Ludlow, L.H. (1985). A strategy for the graphical representation of Rasch model
residuals. Educational and Psychological Measurement, 45, 851-859.
140

Ludlow, L.H. (1986). Graphical analysis of item response theory residuals.
Applied Psychological Measurement, 10, 217-229.
Ludlow, L.H. (2010). Classical test theory, item response theory, and Rasch
measurement principles: transforming psychometric theory into practice.
Chestnut Hill, MA: Author.
Ludlow, L.H. (2010b). A workshop on Rasch models for item response data. Chestnut
Hill: Author.
Ludlow, L. H., Enterline, S.E., & Cochran-Smith, M. (2008). Learning to teach for
social justice-beliefs scale: an application of Rasch measurement
principles. Measurement and Evaluation in Counseling and Development, 40,
194-214.
Ludlow, L.H. & Haley, S.M. (1995). Rasch model logits: interpretation, use, and
transformation. Educational and Psychological Measurement, 55, 967-975.
Ludlow, L.H. & Mahalik, J.R. (2002). Congruence between a theoretical
continuum of masculinity and the Rasch model: examining the
Conformity to Masculine Norms Inventory. Journal of Applied
Measurement, 2, 205-221.
Lynn, M.R. (1986). Determination and quantification of content validity. Nursing
Research, 35, 382-385.
141

Marsh, H.W. & Hocevar, D. (1983). Confirmatory factor analysis of multitrait-
multimethod matrices. Journal of Education Measurement, 20, 231-248.
Martel, M., Sterzinger, A., Miner, J., Clinton, J., & Biros, M. (2005). Management
of acute undifferentiated agitation in the emergency department: a
randomized double-blind trial of droperidol, ziprasidone, and
midazolam. Academic Emergency Medicine, 12, 1167-1172.
McCabe, J.B. (2001). Emergency department overcrowding: a national crisis.
Academic Medicine, 76, 672-674.
Masters, G. (1988). Item discrimination: When more is worse. Journal of
Educational Measurement, 25, 15-29.
McGartland Rubio, D., Berg-Weger, M., Tebb, S.S., Lee, E.S., & Rauch, S. (2003).
Objectifying content validity: conducting a content validity study in social
work research. Social Work Research, 27, 94. Retrieved August 10, 2009 from
http://find.galegroup.com.proxy.bc.edu/itx/start.do?prodId=AONE>.
Miller-Keane O’Toole, M.T. (1997). Miller-Keane encyclopedia & dictionary of
medicine, nursing, & allied health, 6th edition. Philadelphia: W.B. Saunders
Company.
142

Mion, L.C., Frengley, J.D., Jakovicic, C.A., & Marino, J.A. (1989). A further
exploration of the use of physical restraints in hospitalized patients.
Journal of the American Geriatrics Society, 37, 949-956.
Molasitotis, A. (1995). Use of physical restraints: consequences. British Journal of
Nursing, 4, 31-39.
Mohr, W.K., Petti, T.A., & Mohr, B.D. (2003). Adverse effects associated with
physical restraint. Canadian Journal of Psychiatry, 48, 330-337.
Moore, M.J., Zhu, C.W. & Clipp, E.C. (2001). Informal costs of dementia care:
estimates from the National Longitudinal Caregiver Study. Journals of
Gerontology Series B-Psychological Sciences & Social Sciences, 56, S219-S228.
Morse, J.M. (1991). Negotiating commitment and involvement in the nurse-
patient relationship. Journal of Advanced Nursing, 16, 455-468.
Mungas, D., Weiler, P., Franzi, C., & Henry, R. (1989). Assessment of disruptive
behavior associated with dementia: the disruptive behavior rating scales.
Journal of Geriatric Psychiatry and Neurology, 2, 196-202.
Munro, B.H. (2001). Statistical methods for health care research (4th ed.). Philadelphia:
Lippincott.
Murphy, M.C. (2002). The agitated psychotic patient: guidelines to ensure staff
and patient safety. Journal of the American Psychiatric Nurses Association, 8,
S2-S8.
143

Nicholson, I.R., Chapman, J.E., & Neufeld, R.W.J. (1995). Variability in BPRS
definitions of positive and negative symptoms. Schizophrenia Research, 17,
177-185.
Nunnally, J.C. (1978). Psychometric theory. New York: McGraw-Hill .
Overall, J.E. & Gorham, D.R. (1962). The brief psychiatric rating scale.
Psychological Reports, 10, 799-812.
Overall, J.E. & Gorham, D.R. (1988). The brief psychiatric rating scale (BPRS):
recent developments in ascertainment and scaling. Psychopharmacology
Bulletin, 24, 97-99.
Peplau, H.E. (1952). Interpersonal relations in nursing. New York: G.P. Putnam’s
Sons.
Peplau, H.E. (1962). Interpersonal techniques: the crux of psychiatric nursing.
American Journal of Nursing, 62, 50-54.
Peplau, H.E. (1965). The heart of nursing: interpersonal relations. Canadian Nurse,
61, 273-275.
Peplau, H.E. (1988). The art and science of nursing: similarities, differences, and
relations. Nursing Science Quarterly, 1, 8-15.
Perkins, D.O., Stroup, T.S., & Lieberman, J.A. (2000). Psychotic disorders
measures. In American Psychiatric Association, Handbook of Psychiatric
144
Measures (pp. 490-494). Washington, D.C.: American Psychiatric
Association.
Petterson, V., Fyro, B., & Sedval, G. (1973). A new scale for the longitudinal
rating of manic states. Acta Psychiatric Scandinavia, 49, 248-256.
Polit, D.F., Beck, C.T., & Owen, S.V. (2007). Is the CVI an acceptable indicator of
content validity? Appraisal and recommendations. Research in Nursing &
Health, 30, 459-467.
Radwin, L.E. (1996). ‘Knowing the patient:’ a review of research on an emerging
concept. Journal of Advanced Nursing, 23, 1142-1146.
Ramsay, M.A.E., Savege, T.M., Simpson, B.R.J., & Goodwin, R. (1974). Controlled
sedation with alphaxalone-alphadolone. British Journal of Medicine, 2, 656-
659.
Riker, R., Picard, J.T., & Fraser, G.L. (1999). Prospective evaluation of the
sedation-agitation scale for adult critically ill patients. Critical Care
Medicine, 27, 1325-1329.
Robbins, L.J., Boyko, E., Lane, J., Cooper, D., Jahnigen, D.W. (1987). Binding the
elderly: a prospective study of the use of mechanical restraints in the acute
care hospital. Journal of the American Geriatric Society, 35, 290-296.
Roper, J.M., Shapira, J., & Chang, B.L. (1991). Agitation in the demented patient.
A framework for management. Journal of Gerontological Nursing, 17, 17-21.
145

Rosen, J., Mulsant, B.H. & Wright, B.A. (1992). Agitation in severely demented
patients. Annals of Clinical Psychiatry, 4, 207-215.
Rosen, J., Burgio, L., Kollar, M., Cain, M., Allison, M., Fogleman, M., Michael, M.,
& Zubenko, G.,S. (1994). The Pittsburgh agitation scale: A user-friendly
instrument for rating agitation in dementia patients. American Journal of
Geriatric Psychiatry, 2, 52-59.
Roy, C. (2008). The Roy Adaptation Model, 3rd ed. Upper Saddle River, NJ: Prentice
Hall Health.
Rund, D.A., Ewing, J.D., Mitzel, K., & Votolato, N. (2006). The use of
intramuscular benzodiazepines and antipsychotic agents in the treatment
of acute agitation or violence in the emergency department. Journal of
Emergency Medicine, 31, 317-324.
Sadock, B.J. & Sadock, V.A. (2005). Kaplan & Sadock’s comprehensive textbook of
psychiatry, 8th edition. Philadelphia: Lippincott, Williams, & Wilkins.
Sailas, E. & Fenton, M. (2000). Seclusion and restraint for people with serious
mental illnesses. Cochrane Database of Systematic Reviews, (1): CD001163.
Sequeira, H. & Halstead, S. (2004). Psychological effects on nursing staff of
administering physical restraint in a secure psychiatric hospital: “When I
go home, it’s then that I think about it.” The Journal of Forensic Practice, 4, 9-
18.
146

Sinha, D., Zemlan, F.P., Nelson, S., Bienenfeld, D., Thienhaus, O., Ramaswamy,
G., & Hamilton, S. (1992). A new scale for assessing behavioral agitation in
dementia. Psychiatry Research, 41, 73-88.
Slocumb, E.M. & Cole, F.L. (1991). A practical approach to content validity.
Applied Nursing Research, 4, 192-195.
Smith, R.M. (1993). Guessing and the Rasch model. Rasch Measurement
Transactions, 6, 262-263.
Spira, A.P., Stone, K., Beaudreau, S.A., Ancoli-Israel, S., & Yaffe, K. (2009).
Anxiety symptoms and objectively measured sleep quality in older
women. American Journal of Geriatric Psychiatry, 17, 136-143.
Stiebeling, M., Schor, J., Morris, J., Lipsitz, L. (1990). Morbidity of physical
restraints among institutionalized elderly. Journal of the American Geriatric
Society, 38, 45A.
Strout, T.D. (2010). Perspectives on the experience of being physically restrained:
an integrative review of the qualitative literature. International Journal of
Mental Health Nursing, 19, 416-427.
Strout, T.D. & Kendrick, D.B. (2008). Patient assessment: pain scales and
observation in clinical practice. In J.H. Burton & J. Miner (Eds.), Emergency
Sedation and Pain Management (pp. 55-66). Cambridge, NY: Cambridge
University Press.
147

Struble, L.M. & Sivertsen, L. (1987). Agitation - behaviors in confused elderly
patients. Journal of Gerontological Nursing, 13, 40-44.
Taft, L.B. (1989). Conceptual analysis of agitation in the confused elderly.
Archives of Psychiatric Nursing, 3, 102-107.
Telintelo, S., Kuhlman, T.L., & Winget, C. (1983). A study of the use of restraint in
a psychiatric emergency room. Hospital and Community Psychiatry, 34, 164-
165.
Teri, L. & Logsdon, R.G. (1995). Methodologic issues regarding outcome
measures for clinical drug trials of psychiatric complications in dementia.
Journal of Geriatric Psychiatry & Neurology, 8 Suppl 1, S8-S17.
Tinetti, M.E., Liu, W., & Ginter, S.F. (1992). Mechanical restraint use and fall-
related injuries among residents of skilled nursing facilities. Annals of
Internal Medicine, 116, 369-374.
Tinsley, H.E. & Tinsley, D.J. (1987). Uses of factor analysis in counseling
psychology research. Journal of Counseling Psychology, 34, 414-424.
Traub, R.E. (1997). Classical test theory in historical perspective. Educational
Measurement: Issues and Practice, 16, 8-14.
Venes, D. (2009). Taber’s cyclopedic medical dictionary, 21st edition. Philadelphia:
F.A. Davis Company.
148

Verma, S.D., Davidoff, D.A., & Kambhampati, K.K. (1998). Management of the
agitated elderly patient in the nursing home: the role of the atypical
antipsychotics. Journal of Clinical Psychiatry, 59, 50-55.
Victor, A.M. & Bernstein, G.A. (2009). Anxiety disorders and posttraumatic stress
disorder update. Psychiatric Clinics of North America, 32, 57-69.
Wainer, H. (1986). Can a test be too reliable? Journal of Educational Measurement,
23, 171-173.
Walker, L.O. & Avant, K.C. (2005). Concept analysis. In L.O. Walker & K.C.
Avant (Eds.), Strategies for theory construction in nursing (4th Ed., pp. 63-86).
Upper Saddle River, NJ: Pearson-Prentice-Hall.
Waltz, C.W. & Bausell, R. B. (1981). Nursing Research: design, statistics, and
computer analysis. Philadelphia: F.A. Davis.
Waltz, C.F., Strickland, O.L., & Lenz, E.R. (1991). Reliability and validity of norm-
referenced measures. In C.F. Waltz, O.L. Strickland, & E.R. Lenz (Eds.),
Measurement in Nursing Research (2nd Ed., pp. 161-194). Philadelphia: F.A.
Davis.
Washington, C.C. & Moss, M. (1988). Pragmatic aspects of establishing interrater
reliability in research. Nursing Research, 37, 190-191.
Watkins, L.L., Grossman, P., Krishnan, R., & Sherwood, A. (1998). Anxiety and
vagal control of heart rate. Psychosomatic Medicine, 60, 498-502.
149

Webster, J. & Grossberg, G.T. (2003). Differential diagnosis of agitation in
dementia: delirium, depression, psychosis, and anxiety. In D.P. Hay &
D.T. Klein (Eds., pp. 67-79) Agitation in Patients with Dementia: A Practical
Guide to Diagnosis and Management. Clinical Practice Series. Washington,
D.C.: American Psychiatric Publishing.
Whittemore, R. (2000). Consequences of not “knowing the patient.” Clinical
Nurse Specialist, 14, 75-81.
Willis, D.G., Grace, P.J., & Roy, C. (2008). A central unifying focus for the
discipline. Facilitating humanization, meaning, choice, quality of life, and
healing in living and dying. Advances in Nursing Science, 31, E28-E40.
Wright, B.D. & Linacre, M. (1998). WINSTEPS. Chicago: MESA Press.
Young, G.P. (1987). The agitated patient in the emergency department.
Emergency Medicine Clinics of North America, 5, 765-781.
Young, R.C., Biggs, J.T., Ziegler, V.E., & Meyer, D.A. (1978). A rating scale for
mania: reliability, validity, and sensitivity. British Journal of Psychiatry, 133,
429-435.
Yudofsky, S.C., Silver, J.M., & Hales, R.E. (2008). Psychopharmacological
treatments for patients with neuropsychiatric disorders. In S.C. Yudofsky,
J.M. Silver, R.E. Hales (Eds., 5th Ed.), The American Psychiatric Publishing
150

Textbook of Neuropsychiatry and Behavioral Neurosciences. Washington, DC:
American Psychiatric Publishing.
Yudofsky, S.C., Silver, J.M., Jackson, W., Endicott, J., & Williams, D. (1986). The
overt aggression scale for the objective rating of verbal and physical
aggression. American Journal of Psychiatry, 143, 35-39.
Yudofsky, S.C., Kopecky, H.J., Kunik, M., Silver, J.M., & Endicott, J. (1997). The
overt agitation severity scale for the objective rating of agitation. Journal of
Neuropsychiatry, 9, 541-548.
Zubenko, G.S. (1998). Agitation in dementia. Biological Psychiatry, 43, 395-396.
Zun, S. (2003). A prospective study of the complication rate of use of patient
restraint in the emergency department. Journal of Emergency Medicine, 24,
119-124.
Zun, L.S. & Downey, LaV.A. (2008). Level of agitation of psychiatric patients
presenting to the emergency department. The Primary Care Companion to
the Journal of Clinical Psychiatry, 10, 108-113.
151
Appendix A
Maine Medical Center Institutional Review Board Exemption
152

153

Appendix B
Boston College Institutional Review Board Approval
154

155

156

Appendix C
Agitation Severity Scale Item Selection Survey
157

ED PROVIDER ASSESSMENT OF AGITATED BEHAVIORSProvider Gender: Male______Female______Provider Title: RN______MD______Ed Tech______PA______NP______ Other__________Years of Experience: _____________
Please review each behavior listed below and circle the degree of agitation you believe this behavior represents.0 = No Agitation 5 = Severe Agitation
158

Criteria to be Assessed 0 = No Agitation 5 = Severe AgitationNon-Verbal Facial
• Too much eye contact • Darting eyes• Decreased eye contact• Scared Face• Grinding teeth• Spitting• Non-communicative• Red Face• Frown• Biting• Crying• Getting attention with voice
0 1 2 3 4 5 0 1 2 3 4 5 0 1 2 3 4 5 0 1 2 3 4 5 0 1 2 3 4 5 0 1 2 3 4 5 0 1 2 3 4 5 0 1 2 3 4 5 0 1 2 3 4 5 0 1 2 3 4 5 0 1 2 3 4 5 0 1 2 3 4 5
Verbal
• Mutter, grumble, sputter• Engaging more frequently• Yelling/Audibly louder• Tone of Voice• Persistent verbalizations• Increased questions• Demanding• Speed
0 1 2 3 4 5 0 1 2 3 4 5 0 1 2 3 4 5 0 1 2 3 4 5 0 1 2 3 4 5 0 1 2 3 4 5 0 1 2 3 4 5 0 1 2 3 4 5
Purposeful Motor
• “Get Away”• Pacing• “In Your Face”• Violate others or self• Physical violence to others or self• Throwing objects
0 1 2 3 4 5 0 1 2 3 4 5 0 1 2 3 4 5 0 1 2 3 4 5 0 1 2 3 4 5 0 1 2 3 4 5
159

Criteria to be Assessed 0 = No Agitation 5 = Severe AgitationNon-Purposeful Motor
• Posturing• Restless, not still• Fidget• Increased movements• Involuntary movement of legs/feet• Repetitive motions• Tapping, clenching, involuntary hand movements• Out of room• Decreased control/impulsiveness• Puffed up
0 1 2 3 4 5 0 1 2 3 4 5 0 1 2 3 4 5 0 1 2 3 4 5 0 1 2 3 4 5 0 1 2 3 4 5 0 1 2 3 4 5 0 1 2 3 4 5 0 1 2 3 4 5 0 1 2 3 4 5
Interpersonal/Behavioral• Unable to calm• Emotionally labile/anxious/nervous• Confrontational• Inappropriate behavior• Disorganized thinking• Won’t engage• Unable to reason• Focused on self/interrupts frequently• Perspiration
0 1 2 3 4 5 0 1 2 3 4 5 0 1 2 3 4 5 0 1 2 3 4 5 0 1 2 3 4 5 0 1 2 3 4 5 0 1 2 3 4 5 0 1 2 3 4 5 0 1 2 3 4 5 0 1 2 3 4 5
Any Comments or Additional Suggestions Welcome on the Back!
160

Appendix D
Content Validity Survey
161

Agitation Scale Item Representativeness Clarity Dimension Comments or Suggestions
Conceptual/theoretical definitions:Agitation: Frequently, clinicians consider agitation itself to be a disorder, and focus treatment on ‘managing’ agitated behavior. For this purpose, please conceptualize agitation non-diagnostically by considering the behaviors, if they are present, as an alert to clinicians to seek the underlying disorder that elicits the agitation.1
1 = the item is not representative2 = the item needs major revision to be representative3 = the item needs minor revision to be representative4 = the item is representative
Circle Number Below
1 = the item is not clear2 = the item needs major revision to be clear3 = the item needs minor revision to be clear4 = the item is clear
Circle Number Below Check Dimension Below
Spitting
1 2 3 4
not veryrepresentative representative
1 2 3 4
not veryclear clear
Non-verbal Facial Behavior
Verbal Behavior Purposeful Motor
Behavior Non-Purposeful
Motor Behavior Interpersonal
Behavior Unable to Classify
Biting
1 2 3 4
not veryrepresentative representative
1 2 3 4
not veryclear clear
Non-verbal Facial Behavior
Verbal Behavior Purposeful Motor
Behavior Non-Purposeful
Motor Behavior Interpersonal
Behavior Unable to Classify
162

Agitation Scale Item Representativeness Clarity Dimension Comments or Suggestions
Conceptual/theoretical definitions:Agitation: Frequently, clinicians consider agitation itself to be a disorder, and focus treatment on ‘managing’ agitated behavior. For this purpose, please conceptualize agitation non-diagnostically by considering the behaviors, if they are present, as an alert to clinicians to seek the underlying disorder that elicits the agitation.
1 = the item is not representative2 = the item needs major revision to be representative3 = the item needs minor revision to be representative4 = the item is representative
Circle Number Below
1 = the item is not clear2 = the item needs major revision to be clear3 = the item needs minor revision to be clear4 = the item is clear
Circle Number Below Check Dimension Below
Grinding Teeth
1 2 3 4
not veryrepresentative representative
1 2 3 4
not veryclear clear
Non-verbal Facial Behavior
Verbal Behavior Purposeful Motor
Behavior Non-Purposeful
Motor Behavior Interpersonal
Behavior Unable to Classify
Getting Attention with
Voice
1 2 3 4
not veryrepresentative representative
1 2 3 4
not veryclear clear
Non-verbal Facial Behavior
Verbal Behavior Purposeful Motor
Behavior Non-Purposeful
Motor Behavior Interpersonal
Behavior Unable to Classify
163

Agitation Scale Item Representativeness Clarity Dimension Comments or Suggestions
Conceptual/theoretical definitions:Agitation: Frequently, clinicians consider agitation itself to be a disorder, and focus treatment on ‘managing’ agitated behavior. For this purpose, please conceptualize agitation non-diagnostically by considering the behaviors, if they are present, as an alert to clinicians to seek the underlying disorder that elicits the agitation.
1 = the item is not representative2 = the item needs major revision to be representative3 = the item needs minor revision to be representative4 = the item is representative
Circle Number Below
1 = the item is not clear2 = the item needs major revision to be clear3 = the item needs minor revision to be clear4 = the item is clear
Circle Number Below Check Dimension Below
Red in the Face
1 2 3 4
not veryrepresentative representative
1 2 3 4
not veryclear clear
Non-verbal Facial Behavior
Verbal Behavior Purposeful Motor
Behavior Non-Purposeful
Motor Behavior Interpersonal
Behavior Unable to Classify
Darting Eyes
1 2 3 4
not veryrepresentative representative
1 2 3 4
not veryclear clear
Non-verbal Facial Behavior
Verbal Behavior Purposeful Motor
Behavior Non-Purposeful
Motor Behavior Interpersonal
Behavior Unable to Classify
164

Agitation Scale Item Representativeness Clarity Dimension Comments or Suggestions
Conceptual/theoretical definitions:Agitation: Frequently, clinicians consider agitation itself to be a disorder, and focus treatment on ‘managing’ agitated behavior. For this purpose, please conceptualize agitation non-diagnostically by considering the behaviors, if they are present, as an alert to clinicians to seek the underlying disorder that elicits the agitation.
1 = the item is not representative2 = the item needs major revision to be representative3 = the item needs minor revision to be representative4 = the item is representative
Circle Number Below
1 = the item is not clear2 = the item needs major revision to be clear3 = the item needs minor revision to be clear4 = the item is clear
Circle Number Below Check Dimension Below
Yelling, Audibly Louder than
Baseline
1 2 3 4
not veryrepresentative representative
1 2 3 4
not veryclear clear
Non-verbal Facial Behavior
Verbal Behavior Purposeful Motor
Behavior Non-Purposeful
Motor Behavior Interpersonal
Behavior Unable to Classify
Demanding
1 2 3 4
not veryrepresentative representative
1 2 3 4
not veryclear clear
Non-verbal Facial Behavior
Verbal Behavior Purposeful Motor
Behavior Non-Purposeful
Motor Behavior Interpersonal
Behavior Unable to Classify
165

Agitation Scale Item Representativeness Clarity Dimension Comments or Suggestions
Conceptual/theoretical definitions:Agitation: Frequently, clinicians consider agitation itself to be a disorder, and focus treatment on ‘managing’ agitated behavior. For this purpose, please conceptualize agitation non-diagnostically by considering the behaviors, if they are present, as an alert to clinicians to seek the underlying disorder that elicits the agitation.
1 = the item is not representative2 = the item needs major revision to be representative3 = the item needs minor revision to be representative4 = the item is representative
Circle Number Below
1 = the item is not clear2 = the item needs major revision to be clear3 = the item needs minor revision to be clear4 = the item is clear
Circle Number Below Check Dimension Below
Speaking More Quickly than
Baseline
1 2 3 4
not veryrepresentative representative
1 2 3 4
not veryclear clear
Non-verbal Facial Behavior
Verbal Behavior Purposeful Motor
Behavior Non-Purposeful
Motor Behavior Interpersonal
Behavior Unable to Classify
Angry Tone of Voice
1 2 3 4
not veryrepresentative representative
1 2 3 4
not veryclear clear
Non-verbal Facial Behavior
Verbal Behavior Purposeful Motor
Behavior Non-Purposeful
Motor Behavior Interpersonal
Behavior Unable to Classify
166

Agitation Scale Item Representativeness Clarity Dimension Comments or Suggestions
Conceptual/theoretical definitions:Agitation: Frequently, clinicians consider agitation itself to be a disorder, and focus treatment on ‘managing’ agitated behavior. For this purpose, please conceptualize agitation non-diagnostically by considering the behaviors, if they are present, as an alert to clinicians to seek the underlying disorder that elicits the agitation.
1 = the item is not representative2 = the item needs major revision to be representative3 = the item needs minor revision to be representative4 = the item is representative
Circle Number Below
1 = the item is not clear2 = the item needs major revision to be clear3 = the item needs minor revision to be clear4 = the item is clear
Circle Number Below Check Dimension Below
Persistent Disruptive
Verbalizations
1 2 3 4
not veryrepresentative representative
1 2 3 4
not veryclear clear
Non-verbal Facial Behavior
Verbal Behavior Purposeful Motor
Behavior Non-Purposeful
Motor Behavior Interpersonal
Behavior Unable to Classify
Physical Violence to Self
or Others
1 2 3 4
not veryrepresentative representative
1 2 3 4
not veryclear clear
Non-verbal Facial Behavior
Verbal Behavior Purposeful Motor
Behavior Non-Purposeful
Motor Behavior Interpersonal
Behavior Unable to Classify
167

Agitation Scale Item Representativeness Clarity Dimension Comments or Suggestions
Conceptual/theoretical definitions:Agitation: Frequently, clinicians consider agitation itself to be a disorder, and focus treatment on ‘managing’ agitated behavior. For this purpose, please conceptualize agitation non-diagnostically by considering the behaviors, if they are present, as an alert to clinicians to seek the underlying disorder that elicits the agitation.
1 = the item is not representative2 = the item needs major revision to be representative3 = the item needs minor revision to be representative4 = the item is representative
Circle Number Below
1 = the item is not clear2 = the item needs major revision to be clear3 = the item needs minor revision to be clear4 = the item is clear
Circle Number Below Check Dimension Below
Throwing Objects
1 2 3 4
not veryrepresentative representative
1 2 3 4
not veryclear clear
Non-verbal Facial Behavior
Verbal Behavior Purposeful Motor
Behavior Non-Purposeful
Motor Behavior Interpersonal
Behavior Unable to Classify
Violating Self or Others
1 2 3 4
not veryrepresentative representative
1 2 3 4
not veryclear clear
Non-verbal Facial Behavior
Verbal Behavior Purposeful Motor
Behavior Non-Purposeful
Motor Behavior Interpersonal
Behavior Unable to Classify
168

Agitation Scale Item Representativeness Clarity Dimension Comments or Suggestions
Conceptual/theoretical definitions:Agitation: Frequently, clinicians consider agitation itself to be a disorder, and focus treatment on ‘managing’ agitated behavior. For this purpose, please conceptualize agitation non-diagnostically by considering the behaviors, if they are present, as an alert to clinicians to seek the underlying disorder that elicits the agitation.
1 = the item is not representative2 = the item needs major revision to be representative3 = the item needs minor revision to be representative4 = the item is representative
Circle Number Below
1 = the item is not clear2 = the item needs major revision to be clear3 = the item needs minor revision to be clear4 = the item is clear
Circle Number Below Check Dimension Below
“In Your Face”
1 2 3 4
not veryrepresentative representative
1 2 3 4
not veryclear clear
Non-verbal Facial Behavior
Verbal Behavior Purposeful Motor
Behavior Non-Purposeful
Motor Behavior Interpersonal
Behavior Unable to Classify
Trying to “Get Away”
1 2 3 4
not veryrepresentative representative
1 2 3 4
not veryclear clear
Non-verbal Facial Behavior
Verbal Behavior Purposeful Motor
Behavior Non-Purposeful
Motor Behavior Interpersonal
Behavior Unable to Classify
169

Agitation Scale Item Representativeness Clarity Dimension Comments or Suggestions
Conceptual/theoretical definitions:Agitation: Frequently, clinicians consider agitation itself to be a disorder, and focus treatment on ‘managing’ agitated behavior. For this purpose, please conceptualize agitation non-diagnostically by considering the behaviors, if they are present, as an alert to clinicians to seek the underlying disorder that elicits the agitation.
1 = the item is not representative2 = the item needs major revision to be representative3 = the item needs minor revision to be representative4 = the item is representative
Circle Number Below
1 = the item is not clear2 = the item needs major revision to be clear3 = the item needs minor revision to be clear4 = the item is clear
Circle Number Below Check Dimension Below
Decreased Self-Control,
Impulsiveness
1 2 3 4
not veryrepresentative representative
1 2 3 4
not veryclear clear
Non-verbal Facial Behavior
Verbal Behavior Purposeful Motor
Behavior Non-Purposeful
Motor Behavior Interpersonal
Behavior Unable to Classify
“Puffed Up,” Chest Out,
Threatening Posture
1 2 3 4
not veryrepresentative representative
1 2 3 4
not veryclear clear
Non-verbal Facial Behavior
Verbal Behavior Purposeful Motor
Behavior Non-Purposeful
Motor Behavior Interpersonal
Behavior Unable to Classify
170

Agitation Scale Item Representativeness Clarity Dimension Comments or Suggestions
Conceptual/theoretical definitions:Agitation: Frequently, clinicians consider agitation itself to be a disorder, and focus treatment on ‘managing’ agitated behavior. For this purpose, please conceptualize agitation non-diagnostically by considering the behaviors, if they are present, as an alert to clinicians to seek the underlying disorder that elicits the agitation.
1 = the item is not representative2 = the item needs major revision to be representative3 = the item needs minor revision to be representative4 = the item is representative
Circle Number Below
1 = the item is not clear2 = the item needs major revision to be clear3 = the item needs minor revision to be clear4 = the item is clear
Circle Number Below Check Dimension Below
Tapping, Clenching,
Involuntary Movements of
Hands
1 2 3 4
not veryrepresentative representative
1 2 3 4
not veryclear clear
Non-verbal Facial Behavior
Verbal Behavior Purposeful Motor
Behavior Non-Purposeful
Motor Behavior Interpersonal
Behavior Unable to Classify
Restless
1 2 3 4
not veryrepresentative representative
1 2 3 4
not veryclear clear
Non-verbal Facial Behavior
Verbal Behavior Purposeful Motor
Behavior Non-Purposeful
Motor Behavior Interpersonal
Behavior Unable to Classify
171

Agitation Scale Item Representativeness Clarity Dimension Comments or Suggestions
Conceptual/theoretical definitions:Agitation: Frequently, clinicians consider agitation itself to be a disorder, and focus treatment on ‘managing’ agitated behavior. For this purpose, please conceptualize agitation non-diagnostically by considering the behaviors, if they are present, as an alert to clinicians to seek the underlying disorder that elicits the agitation.
1 = the item is not representative2 = the item needs major revision to be representative3 = the item needs minor revision to be representative4 = the item is representative
Circle Number Below
1 = the item is not clear2 = the item needs major revision to be clear3 = the item needs minor revision to be clear4 = the item is clear
Circle Number Below Check Dimension Below
Confrontational
1 2 3 4
not veryrepresentative representative
1 2 3 4
not veryclear clear
Non-verbal Facial Behavior
Verbal Behavior Purposeful Motor
Behavior Non-Purposeful
Motor Behavior Interpersonal
Behavior Unable to Classify
Unable to Be Calmed
1 2 3 4
not veryrepresentative representative
1 2 3 4
not veryclear clear
Non-verbal Facial Behavior
Verbal Behavior Purposeful Motor
Behavior Non-Purposeful
Motor Behavior Interpersonal
Behavior Unable to Classify
172

Agitation Scale Item Representativeness Clarity Dimension Comments or Suggestions
Conceptual/theoretical definitions:Agitation: Frequently, clinicians consider agitation itself to be a disorder, and focus treatment on ‘managing’ agitated behavior. For this purpose, please conceptualize agitation non-diagnostically by considering the behaviors, if they are present, as an alert to clinicians to seek the underlying disorder that elicits the agitation.
1 = the item is not representative2 = the item needs major revision to be representative3 = the item needs minor revision to be representative4 = the item is representative
Circle Number Below
1 = the item is not clear2 = the item needs major revision to be clear3 = the item needs minor revision to be clear4 = the item is clear
Circle Number Below Check Dimension Below
Inappropriate Behavior
1 2 3 4
not veryrepresentative representative
1 2 3 4
not veryclear clear
Non-verbal Facial Behavior
Verbal Behavior Purposeful Motor
Behavior Non-Purposeful
Motor Behavior Interpersonal
Behavior Unable to Classify
Emotionally Labile, Anxious,
Nervous
1 2 3 4
not veryrepresentative representative
1 2 3 4
not veryclear clear
Non-verbal Facial Behavior
Verbal Behavior Purposeful Motor
Behavior Non-Purposeful
Motor Behavior Interpersonal
Behavior Unable to Classify
173

Agitation Scale Item Representativeness Clarity Dimension Comments or Suggestions
Conceptual/theoretical definitions:Agitation: Frequently, clinicians consider agitation itself to be a disorder, and focus treatment on ‘managing’ agitated behavior. For this purpose, please conceptualize agitation non-diagnostically by considering the behaviors, if they are present, as an alert to clinicians to seek the underlying disorder that elicits the agitation.
1 = the item is not representative2 = the item needs major revision to be representative3 = the item needs minor revision to be representative4 = the item is representative
Circle Number Below
1 = the item is not clear2 = the item needs major revision to be clear3 = the item needs minor revision to be clear4 = the item is clear
Circle Number Below Check Dimension Below
Unable to Reason
1 2 3 4
not veryrepresentative representative
1 2 3 4
not veryclear clear
Non-verbal Facial Behavior
Verbal Behavior Purposeful Motor
Behavior Non-Purposeful
Motor Behavior Interpersonal
Behavior Unable to Classify
Disorganized Thinking
1 2 3 4
not veryrepresentative representative
1 2 3 4
not veryclear clear
Non-verbal Facial Behavior
Verbal Behavior Purposeful Motor
Behavior Non-Purposeful
Motor Behavior Interpersonal
Behavior Unable to Classify
174

Considering the items together, as a whole measure of agitation, are there any items you would suggest adding?
Considering the items together, as a whole measure of agitation, are there any items you would suggest deleting?
Please provide any additional comments or suggestions here.
Thank you very much for your participation!
175

Appendix E
Agitation Severity Scale
176

Agitation Severity Scale
Behavior Frequency ScoreNot
PresentRarely Present
Present Most of the
Time
Always Present
Non-Verbal Facial BehaviorsSpitting 0 1 2 3Biting 0 1 2 3
Grinding Teeth 0 1 2 3Getting Attention with
Voice0 1 2 3
Red in the Face 0 1 2 3Darting Eyes 0 1 2 3
Verbal BehaviorsYelling, Audibly Louder
than Baseline0 1 2 3
Demanding 0 1 2 3Speaking More Quickly
than Baseline0 1 2 3
Angry Tone of Voice 0 1 2 3Persistent Disruptive
Verbalizations0 1 2 3
Purposeful Motor BehaviorsPhysical Violence to Self
or Others0 1 2 3
Throwing Objects 0 1 2 3Violating Self or Others 0 1 2 3
“In Your Face” 0 1 2 3Non-Purposeful Motor Behaviors
Decreased Self-Control, Impulsiveness
0 1 2 3
“Puffed up,” Chest Out, Threatening Posture
0 1 2 3
Tapping, Clenching, Involuntary Movements of
Hands
0 1 2 3
Restless 0 1 2 3Interpersonal Behaviors
Confrontational 0 1 2 3Unable to Be Calmed 0 1 2 3
Inappropriate Behavior 0 1 2 3Emotionally Labile, Anxious, Nervous
0 1 2 3
Unable to Reason 0 1 2 3Disorganized Thinking 0 1 2 3
Total Score
177

Appendix F
Overt Agitation Severity Scale
178

179

Appendix G
Data Collection Sheet
180
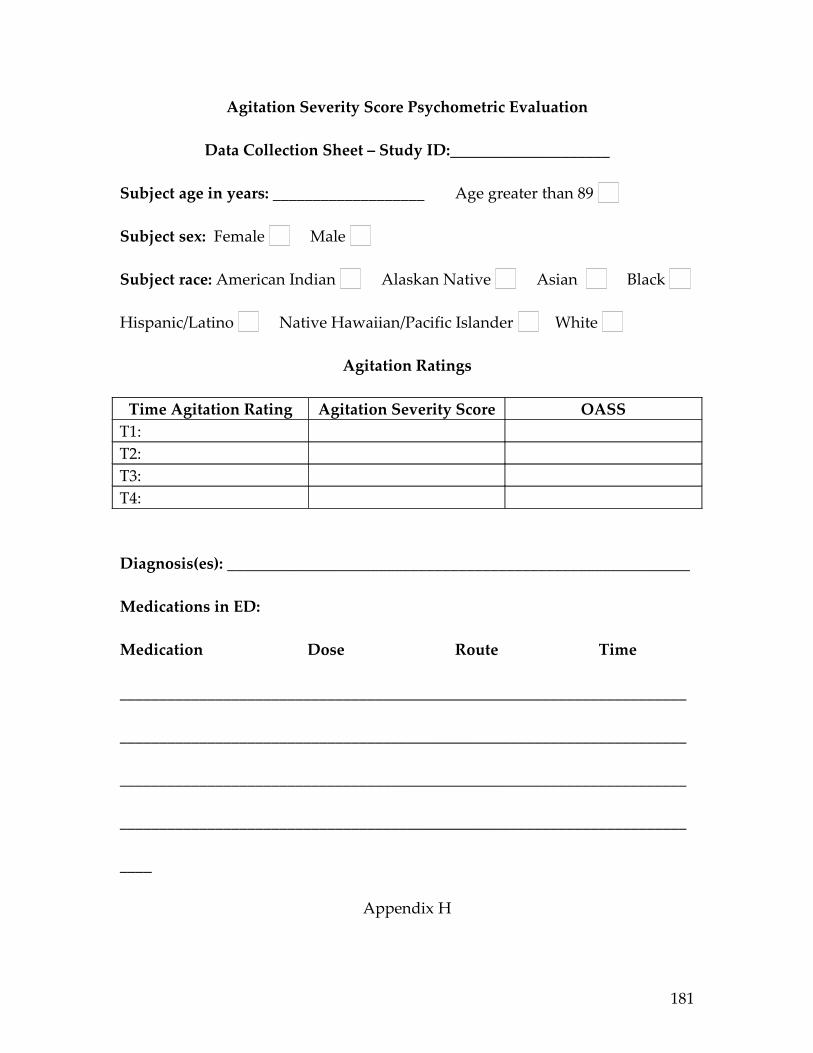
Agitation Severity Score Psychometric Evaluation
Data Collection Sheet – Study ID:____________________
Subject age in years: ___________________ Age greater than 89
Subject sex: Female Male
Subject race: American Indian Alaskan Native Asian Black
Hispanic/Latino Native Hawaiian/Pacific Islander White
Agitation Ratings
Time Agitation Rating Agitation Severity Score OASST1:T2:T3:T4:
Diagnosis(es): __________________________________________________________
Medications in ED:
Medication Dose Route Time
_______________________________________________________________________
_______________________________________________________________________
_______________________________________________________________________
_______________________________________________________________________
____
Appendix H
181

Permission to Use Roy Adaptation Model Figure
182

183