Behavioral Finance - MADOC · 2 1. Traditional and Behavioral Finance Behavioral finance as a...
29
Behavioral Finance Markus Glaser, a Markus Nöth, a Martin Weber a,b to appear in: Derek J. Koehler and Nigel Harvey (eds.), Blackwell Handbook of Judgment and Decision Making – Chapter 26 Lehrstuhl für Bankbetriebslehre Universität Mannheim L 5, 2 68131 Mannheim Germany p: +49-621-181 1532 f: +49-621-181 1534 email: [email protected], [email protected], [email protected] a Lehrstuhl für Bankbetriebslehre; Universität Mannheim; L 5,2; 68131 Mannheim; Germany b CEPR London
Transcript of Behavioral Finance - MADOC · 2 1. Traditional and Behavioral Finance Behavioral finance as a...

Behavioral Finance
Markus Glaser,a Markus Nöth,a Martin Webera,b
to appear in: Derek J. Koehler and Nigel Harvey (eds.),
Blackwell Handbook of Judgment and Decision Making – Chapter 26
Lehrstuhl für Bankbetriebslehre Universität Mannheim
L 5, 2 68131 Mannheim
Germany p: +49-621-181 1532 f: +49-621-181 1534
email: [email protected], [email protected], [email protected]
a Lehrstuhl für Bankbetriebslehre; Universität Mannheim; L 5,2; 68131 Mannheim; Germany
b CEPR London

2
1. Traditional and Behavioral Finance
Behavioral finance as a subdiscipline of behavioral economics is finance incorporating
findings from psychology and sociology into its theories. Behavioral finance models are
usually developed to explain investor behavior or market anomalies when rational models
provide no sufficient explanations. To understand the research agenda, methodology, and
contributions, it is necessary to review traditional finance theory first. Then, we will show
how modifications (e.g. incorporating market frictions) can rationally explain observed
individual or market behavior. In the second section, we will explain the behavioral finance
research methodology −how biases are modeled, incorporated into traditional finance
theories, and tested empirically and experimentally− using one specific subset of the
behavioral finance literature, the overconfidence literature.
1.1. Traditional Finance and Empirical Evidence
Traditional finance theory assumes that agents are rational and the law of one price holds.
Important aspects of agents' rationality are maximization of expected utility and Bayesian
learning (see chapter 2). This implies, for example, that choices are time-consistent (see
chapter 21). From a market perspective, traditional finance theory rests on the law of one
price which states that securities with the same payoff have the same price. Arbitrageurs
eliminate instantaneously any violations of the law of one price by simultaneously buying and
selling these securities at advantageously different prices. Consider, for example, the shares of
DaimlerChrysler AG. They are traded simultaneously on the New York Stock Exchange
(NYSE) and in Frankfurt (Xetra) between 1:30 p.m. and 6:00 p.m. UTC. During these 4.5
hours, shares should trade for the same prices on both exchanges adjusted for the current
EUR-USD exchange rate. If these adjusted prices are different from each other, an arbitrageur
would sell shares at the higher price at one exchange and would buy the same number of
shares at the other exchange and would thus realize a risk-less profit (see Shleifer and Vishny
(1997) for another example of arbitrage).
The key question is whether agents’ irrationalities affect market outcomes – otherwise,
finance researchers would not care. Even if some or even all market participants are irrational,
it may be possible that the market absorbs (at least to some degree) these individual
irrationalities and thus prevent their impact on prices and allocation. Whether the market can

3
average out irrationalities depends on the structure of the observed behavior: unsystematic
irrationalities can be absorbed more easily than systematic deviations from rational behavior.
1.1.1. Market Efficiency and Security Return Patterns
If agents are rational and the law of one price holds, market efficiency may exist. Fama
(1970) defines an efficient market as a “market in which prices always ‘fully reflect’ available
information” (Fama (1970), p. 83). Different forms of market efficiency exist due to the
amount of information which is assumed to be “available”. If the current price contains only
the information consisting of past prices, the market is “weak-form” efficient. If prices reflect
all publicly available information (historical prices and, for example, earnings
announcements), the market is “semi-strong form” efficient. Finally, if prices reflect all
private information (i.e. including all insider information), the market is “strong-form”
efficient.
It is unlikely that market prices contain all private information. One explanation for this
inefficiency is the existence of noise traders who trade randomly and not based on
information. For example, they trade to match their own liquidity requirements because of
inherited money (=buy stocks) or because they want to buy a new car or house (=sell stocks).
As a consequence, it is no longer possible to identify private information completely based on
buying or selling activity by observing market prices because noise traders' orders jam the
trading signal generated by insiders.
But even the original “weak-form” efficiency did not survive empirical tests. “Weak-form”
market efficiency in connection with the assumption of constant expected returns had long
been successful in explaining security return patterns. Studies as discussed in Fama (1970)
show that stock returns are typically unpredictable based on past returns. However, empirical
studies over the last 25 years demonstrated that future returns are predictable to some extent.
Several studies document positive autocorrelation of short-term stock returns, as well as and
negative autocorrelation of short-term returns separated by long lags. In addition, the current
dividend yield predicts subsequent returns. Fama (1991) surveys studies on the above
mentioned time-series predictability of returns.
Furthermore, trading strategies exist, which are based on past returns and which earn
statistically significant profits. One specific example is the momentum strategy in which
stocks with high returns over the last three to 12 months (“winner”) are bought and stocks

4
with low returns over the same period (“loser”) are sold. The short-selling of “losers” finances
the buying of “winners”, i.e. there is no need to invest your own money. After a holding
period of up to 12 months, the “losers” are bought back and the “winners” are sold. Jegadeesh
and Titman (1993, 2001) showed for U.S. stocks that this strategy results in significant
positive profits. This strategy has been successful in other stock markets as well (see
Rouwenhorst (1998, 1999) as well as Glaser and Weber (2003a) for international evidence on
the profitability of momentum strategies).
Closely related are the following cross-sectional return patterns. Returns of stocks with low
market capitalization have been on average higher than returns of stocks with high market
capitalization (=size effect; see, for example, Banz (1981) and Dimson and Marsh (2000)).
Returns of value stocks, i.e. stocks with a high dividend yield, a low price/earnings ratio
and/or a high book-to-market ratio have been on average higher than returns of growth stocks,
i.e. stocks with a low dividend yield, a high price/earnings ratio and/or a low book-to-market
ratio (see, for example, Fama and French (1992) and Lakonishok, Shleifer, and Vishny
(1994)). Moreover, specific events may predict subsequent security returns (event-based
return predictability). Such events are, for example, earnings announcements or stock splits
(see Daniel, Hirshleifer, and Subrahmanyam (1998) and Fama (1991, 1998)).
The question is now whether these findings are real profit opportunities and thus a violation
of market efficiency or just a proper reward for risk. Some researchers argue that the observed
security return regularities are rational and can be explained by time-varying expected returns
(Fama (1991)). Other researchers argue that securities are mispriced (see, for example,
Lakonishok, Shleifer, and Vishny (1994)). Resolving this conflict is at least difficult if not
impossible because market efficiency can only be tested using a specific asset pricing model,
i.e. a test of market efficiency is always a joint test of market efficiency and the assumed
correctness of the asset pricing model. Thus, a security market anomaly can either result from
market inefficiency or from the wrong asset pricing model. As the above presented empirical
evidence is still inconclusive due to this reason, we will show in the next subsection that some
securities are obviously mispriced.
1.1.2. Law of One Price
Recently, some puzzles have been discovered proving that the law of one price is violated.
This violation is so severe that prices are inconsistent with all valuation models. One example
are security prices of “Siamese twin” shares, such as Royal Dutch Petroleum and Shell

5
Transport and Trading. Twin shares trade at different places or in different countries and the
division of current and future cash flows is fixed to each twin. Shares of Royal Dutch are
primarily traded in the U.S. and in the Netherlands whereas Shell is primarily traded in the
UK. Future cash flows are split in the proportion of 60:40 in favor of Royal Dutch. Even if we
do not know the correct fundamental value of Royal Dutch and Shell, we know that the
market value of Royal Dutch has to be 1.5 times as large as the market value of Shell if prices
reflect fundamental value.
However, Froot and Dabora (1999) find that Royal Dutch is sometimes more than 40%
underpriced and sometimes 10% overpriced relative to the share prices of Shell. Thus, market
prices are clearly wrong and this mispricing persists for several years. Possible rational
explanations such as exchange rate risks, different liquidity due to the market microstructure,
and asynchronous trading as a result of different trading hours are not sufficient to account for
the apparent mispricing.
Another example of non-rational market prices which are not compatible with the law of one
price is presented by Lamont and Thaler (2003). They study equity carve-outs by analyzing
the spin-off of Palm which was owned by 3Com. In March 2000, 3Com sold 5% of its Palm
shares in an initial public offering and kept the remaining 95% of the shares. 3Com
announced that its shareholders would eventually receive 1.5 shares of Palm for every 3Com
share they owned. Accordingly, the stock price of 3Com has to be at least 1.5 times as high as
the stock price of Palm, as long as the value of the whole 3Com company is positive.
However, the stock price of Palm was far above the stock price of 3Com implying a value of
−22 billion U.S. dollars of 3Com's non-Palm business.
Rational explanations of why arbitrage is not sufficient to avoid violations of the law of one
price, are looked at in the next subsection.
1.1.3. Limits of Arbitrage
In addition to the evidence presented in the previous subsection, bubbles and crashes occur
from time to time and seem to reject the notion of efficient markets and the positive effect of
arbitrage, too. For example, the NASDAQ Index rose from about 1000 in late 1997 to more
than 4500 in March 2000 before declining to 1000 in March 2003. In Germany, the New
Market index (Nemax50) rose to more than 9000 (March 2000) and stands at about 310 (three
hundred and ten !) by the end of March 2003. These huge changes of market indices are

6
difficult to explain using a standard finance model. Moreover, the question arises why
arbitrage cannot dampen these swings which are, as common sense suggests, not only due to
new information.
Several models within the rational framework were developed to explain limits of arbitrage. If
the investment horizon is shorter than the time until the fundamental value of an asset is
reached with certainty, severe mispricing will not necessarily be eliminated by arbitrage (Dow
and Gorton (1994)).
Moreover, mispricing can occur because of noise traders who create additional risk by trading
randomly. This additional risk is priced by the market. If these noise traders take this
additional risk, they can earn higher returns than rational investors (DeLong, Shleifer,
Summers, and Waldmann (1990b)). In other words, irrational investors are not necessarily
eliminated from the market due to their losses.
DeLong, Shleifer, Summers, and Waldmann (1990a) and Shleifer and Vishny (1997) show
that noise trader risk can worsen the mispricing in the short run. If arbitrageurs have short
investment horizons, noise trader risk will prevent them from exploiting this mispricing.
Kogan, Ross, Wang, and Westerfield (2003) show that survival and price impact of irrational
traders are two independent concepts: They find that the price impact of irrational traders does
not rely on their survival in the long-run and that they can even influence prices when their
wealth becomes negligible.
Finally, other market frictions such as short-sale constraints or non-tradable future labor
income may limit arbitrage, too. Summing up, limits of arbitrage exist and may lead to severe
mispricing even with fully rational market participants and unsystematic irrational behavior of
noise traders.
1.1.4. Agents' Rationality
So far, we have discussed theoretical and empirical issues concerning market outcomes.
However, recently a wide range of studies deal with another central pillar of standard finance,
i.e. agents' rationality. These studies try to examine how agents in financial markets
−professional and individual investors− actually behave. This research usually demonstrates
investor behavior that is difficult to reconcile with rationality or predictions of standard
finance models. In this handbook, all kinds deviations from rationality of judgment and

7
decision making are surveyed. In this subsection we present a few examples from the finance
literature which deal with some of these problems.
One example is naïve diversification or the 1/n heuristic. Benartzi and Thaler (2001) analyze
401(k) retirement savings plans. Each savings plan offers a fixed number of investment
options that varies across firms. Benartzi and Thaler (2001) find that some individuals spread
their savings evenly across the investment alternatives and do not take into account the
riskiness of the investment options. As a consequence, the asset allocation of individuals is
influenced by the percentage of stock funds offered. The higher the number of stock funds,
the higher the allocation to equities, a finding that is difficult to reconcile with agents'
rationality.
Another aspect of non-rational behavior is that market behavior of investors is influenced by
framing. Depending on the framing of gains and losses, the behavior of market participants
changes as Weber, Keppe, and Meyer-Delius (2000) have demonstrated in an experimental
asset market. Traders are willing to pay more for assets if they have a short position at the
beginning of a trading period compared to situations with a long position even though the
expected value of both portfolios is the same. In the first case, trading is driven by loss
aversion whereas in the second case diversification is the main reason for trading.
Furthermore, agents' rationality requires that all available information is evaluated using
Bayes' Law. However, if investors use specific heuristics which put too much weight on
recent information, this systematic bias has an impact not only on the price reaction to new
information but also on the price reaction afterwards when this error becomes obvious.
Barberis, Shleifer, and Vishny (1998) model investors who make systematic errors when
evaluating public information. Investors are prone to a conservatism bias, the underweighting
of new evidence when updating probabilities, and to a particular manifestation of the
representative heuristic, the tendency of people to expect even short sequences of realizations
of a random variable to reflect the properties of the parent population from which the
realizations are drawn.
1.2. Behavioral Finance and Remaining Puzzles
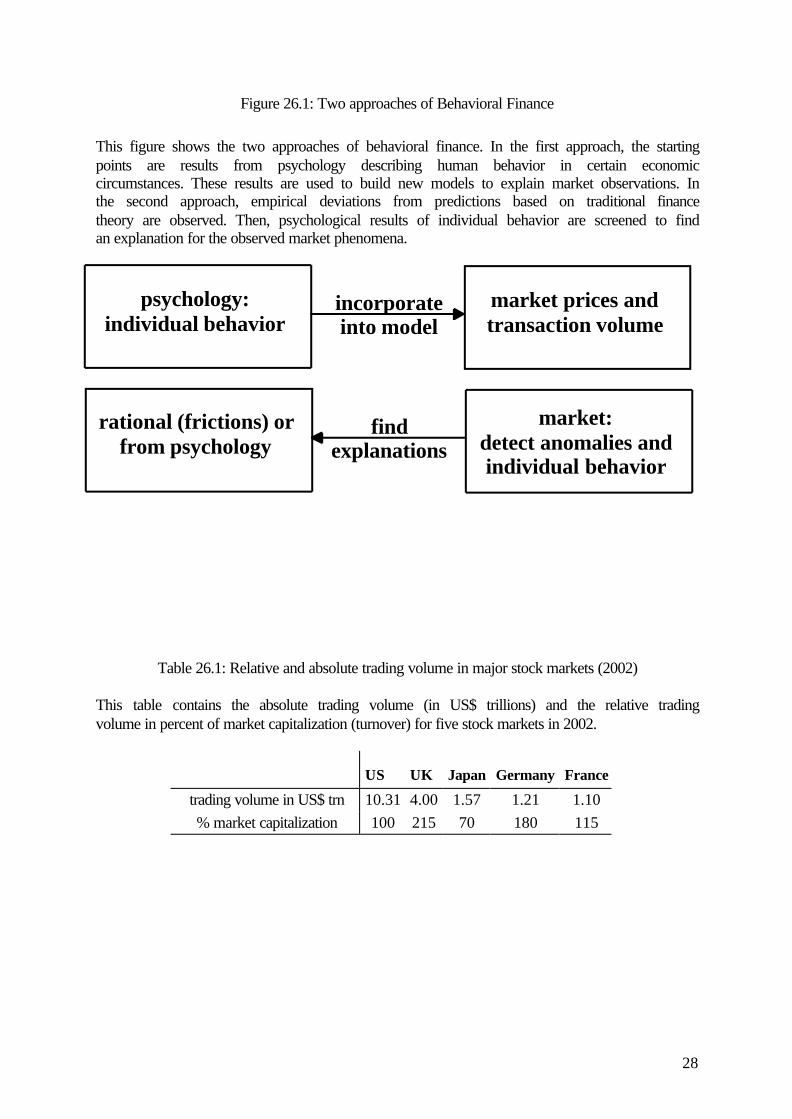
In principle, there are two different approaches towards behavioral finance. Both approaches
have the same goal, i.e. to explain observed prices, market trading volume, and individual
behavior better than traditional finance models. In the first approach, the starting points are

8
results from psychology describing human behavior in certain economic circumstances. These
results are used to build new models to explain market observations. In the second approach,
empirical deviations from predictions based on traditional finance theory are observed. Then,
psychological results of individual behavior are screened to find an explanation for the
observed market phenomena. Figure 26.1 shows the two approaches.
>>>>>>>>> Insert figure 26.1 about here <<<<<<<<<
One important puzzle is the high trading volume in all capital markets. Table 26.1 shows the
absolute trading volume and the relative trading volume in percent of market capitalization
(turnover) for some stock markets in 2002.
>>>>>>>>> Insert table 26.1 about here <<<<<<<<<
Given that a significant number of shares is owned by long-term oriented institutional
investors like pension funds, large mutual funds, or index funds, a turnover of 100%, as
observed in the U.S., implies that every available share is traded more than once per year.
This trading volume appears to be high. Why do rational investors trade at all? Rational
investors only trade when they are heterogeneous, i.e. when they differ with regard to tastes
(such as the degree of risk aversion), endowments (such as liquidity shocks due to, for
example, accidents or unexpected bequests), or information. But even differences in
information do not necessarily lead to trading. Consider investors who have common prior
beliefs about the value of an asset and the initial allocation of the risky asset is pareto-optimal,
i.e. it is not possible to make an investor better off without making another investor worse off
by changing the allocation (=trading). If these investors receive different pieces of private
information about the uncertain value of the risky asset, there is heterogeneity between
investors and thus a potential for trade. However, when an investor wants to sell us a security,
we can conclude that he has received a bad signal about the value of this security. So why
should we buy this security? Therefore, it is possible that even differences in private
information do not lead to trading volume (no trade theorem; see Milgrom and Stokey
(1982)). Pagano and Röell (1992) provide further details about rational motives for trading.
Common sense suggests that these rational motives for trade are not sufficient to explain the
high trading volume observed in financial markets. Recent theoretical work in finance
suggests that different beliefs or different opinions across people (e.g. about the value of a

9
risky asset in the future or about how to interpret public news) may explain high levels of
trading volume (see the next section and Glaser and Weber (2003b)). But why do people have
differing beliefs or opinions? Are their expectations biased? Are differences of opinion a
result of overconfidence? Insights from psychology may provide answers to these questions.
The equity premium puzzle, i.e. stocks have a higher risk-adjusted return than bonds (see
Mehra and Prescott (1985)), may be another problem requiring a behavioral explanation. Risk
aversion is not sufficient to explain the empirical findings. Benartzi and Thaler (1995) provide
a behavioral explanation based on (myopic) loss aversion: If an investor is loss averse and
evaluates his portfolio at least every year, he faces a high probability of observing losses and
thus requests a higher risk premium compared to the fully rational investor who is not
influenced by short-term fluctuations. Barberis, Huang, and Santos (2001) provide a refined
explanation for the equity premium puzzle. They study asset prices in an economy with
investors deriving utility not only from consumption but also from the value of their financial
wealth. Furthermore, they assume investors are loss averse over these changes. Barberis,
Huang, and Santos (2001) thus incorporate central ideas of prospect theory (Kahneman and
Tversky (1979)). Loss aversion is captured by a piecewise linear function that is steeper for
losses than for gains relative to a reference point. Thus, the model does not capture the feature
of the original version of prospect theory with risk aversion in the domain of gains and risk
seeking in the domain of losses. In addition, it is assumed that prior outcomes affect the
degree of loss aversion. Losses are less painful after gains whereas they are more painful after
losses. This assumption is consistent with the house money effect (Thaler and Johnson
(1990)), gamblers’ increased willingness to bet after gains. Barberis and Huang (2001) extend
this model by additionally incorporating a further form of mental accounting (besides the
house money effect): Investors either care about the value of their whole stock portfolio or
about the value of each single security in their portfolio and thus ignore correlations. Note
however that there is some doubt that the equity premium puzzle is (still) existing given the
burst of the stock market bubble in recent years and the performance of stocks in Japan over
the last 20 years.
Before we concentrate on the overconfidence literature, it is important to stress that
behavioral finance research is either focused on individual behavior (e.g. asset allocation
within a 401(k) plan) or on the implications for financial market outcomes. In the first case it
is obvious that psychological research has to be adapted to a different context. In the second
case, psychological results are needed to explain interactions between investors.

10
1.3. Behavioral Finance Models
In this subsection, we will briefly survey recent theoretical behavioral finance literature. The
goal is not to discuss every model that has been published in recent years. Rather, the aim is
to present a representative selection of recent behavioral finance theories to show which and
how findings of psychology research are incorporated into standard finance models. We
restrict our focus on the theoretical behavioral finance literature as recent behavioral finance
surveys offer an in-depth discussion of various empirical findings (see Daniel, Hirshleifer,
and Teoh (2002) and Shiller (1999)).
Table 26.2 presents a summary of recent behavioral finance models that have been published
in some of the leading finance and economics journals (Journal of Finance, Review of
Financial Studies, Journal of Financial Economics, Journal of Financial Markets, Quarterly
Journal of Economics) and lists the psychological biases that are modeled. The last column
contains empirical findings that are explained by the respective model.
>>>>>>>>> Insert table 26.2. about here <<<<<<<<<
Table 26.2 shows that the models can be classified in two ways: belief-based and preference-
based models. Belief-based models incorporate findings such as overconfidence, biased self-
attribution, conservatism, and representativeness. Preference-based models use prospect
theory, house money effect, and other forms of mental accounting.
Most of the models shown in Table 26.2 study how overconfident investors affect market
outcomes. Overconfidence is modeled as overestimation of the precision of information or,
stated equivalently, underestimation of the variance of information signals. Some dynamic
models assume that the degree of overconfidence changes over time in the way that it
increases as a function of past investment success due to biased self-attribution. As
overconfidence is the most studied bias in the theoretical and empirical behavioral finance
literature, we will focus on the overconfidence literature in finance to demonstrate the
behavioral finance research methodology. Even though we focus on one particular research
area within behavioral finance, research is not restricted to the aggregate stock market, asset
pricing, or investor behavior. Other applications are, for example, corporate finance, financial
contracting, or banking.

11
2. Overconfidence
In this section, we will discuss recent behavioral finance theories more deeply that incorporate
overconfident investors. In the first subsection, we describe the way overconfidence is
modeled and motivated in finance, especially the implicit assumptions behind the particular
way of modeling overconfidence. The discussion of the theoretical overconfidence literature
in finance in the second subsection will point out the most important results of these models.
In the last subsection, we present various endeavors to empirically and experimentally test
these theories.
We do not attempt to provide a comprehensive overview of the psychological overconfidence
literature. Chapter 9 surveys psychological literature on subjective probability calibration. We
only mention the main psychological findings that are discussed in the finance literature.
2.1. Modeling and Motivating Overconfidence in Theoretical Finance
Overconfidence is usually modeled as overestimation of the precision of private information.
In finance models, the uncertain liquidation value of a risky asset is modeled as a realization
of a random variable. Assume, the liquidation value v is a realization of a normal distribution
with mean 0 and variance 2~vσ , i.e. ),0(~~ 2
~vNv σ . Some or all investors receive private
information signals s . These signals contain information but the signals are noisy, i.e. they
contain a random error ε as well. Assuming that random variables (the distribution of the
liquidation value, v~ , and the distribution of the error term, ),(~~ 2~εσε oN are independent, the
signal s is usually written as a realization of the random variable s~ , which is the sum of the
random variables v~ and ε~ , i.e. ),0(~)~~(~ 2~
22~ εσσε ⋅+⋅+= kNkvs v . The parameter k
captures the finding of overconfidence. Psychological studies show that people are
miscalibrated in the way that their probability distributions or confidence intervals for
uncertain quantities are too tight (Lichtenstein, Fischhoff, and Phillips (1982) and chapter 9).
If the parameter k is in the interval [0,1), an investor underestimates the variance of the
signal s (or, stated equivalently, underestimates the variance of the error term). If 0=k , an
investor even believes that he knows the value of the risky asset with certainty. Thus, this way
of modeling overconfidence captures the idea that people overestimate the precision of their
knowledge, or stated equivalently, underestimate the variance of signals or the uncertain
liquidation value of an asset, i.e. their confidence intervals are too tight.

12
Although other psychological research results concerning (mis)calibration (see chapter 9) are
not ignored in the finance literature, as can be seen in several introductions of finance articles
(see, for example, Odean (1998), p. 1892), the above way of modeling overconfidence is
justified in the following way: “The foremost reason is that people usually are overconfident.
(...) Most of those who buy and sell financial assets try to choose assets that will have higher
returns than similar assets. This is a difficult task and it is precisely in such difficult tasks that
people exhibit the greatest overconfidence. (...) Learning is fastest when feedback is quick and
clear, but in securities markets the feedback is often slow and noisy.” (Odean (1998), p.
1896).
Some models assume that the degree of overconfidence, i.e. the degree of the underestimation
of the variance of signals, is a stable individual trait and is thus constant over time. However,
other models assume that overconfidence dynamically changes over time. This assumption is
motivated by psychological studies that find biased self-attribution (Wolosin, Sherman, and
Till (1973), Langer and Roth (1975), Miller and Ross (1975), Schneider, Hastorf, and
Ellsworth (1979)): People overestimate the degree to which they are responsible for their own
success. In the finance literature, overconfidence and biased self-attribution are sometimes
regarded as static and dynamic counterparts (Hirshleifer (2001)). In overconfidence models
with biased self-attribution, the degree of overconfidence, i.e. the degree of overestimation of
the precision of private information, is a function of past investment success.
Although overconfidence is almost exclusively modeled as overestimation of the precision of
private information, overconfidence models are usually motivated by a richer set of findings
that are often summarized as overconfidence in the finance literature (although psychologists
treat these as distinct concepts). Under this view, overconfidence can manifest itself, besides
various findings subsumed as miscalibration, in the following forms: People believe that their
abilities are above average (better than average effect; Svenson (1981), Taylor and Brown
(1988)), they think that they can control random tasks, and they are excessively optimistic
about the future (illusion of control and unrealistic optimism; Langer (1975), Langer and Roth
(1975), and Weinstein (1980)). In a finance journal, Kahneman and Riepe (1998, p. 54),
summarize this motivation of overconfidence as follows. “The combination of overconfidence
and optimism is a potent brew, which causes people to overestimate their knowledge,
underestimate risks, and exaggerate their ability to control events.”
However, whether the above mentioned facets of overconfidence are related, is by no means
clear. Some argue that these manifestations are related (see, for example, Taylor and Brown

13
(1988), p. 194), others argue that this need not to be the case (see, for example, Biais, Hilton,
Mazurier, and Pouget (2002), p. 9), or even deny a logical link (see, for example, Hvide
(2002), p. 19). Empirical evidence on this issue is still limited. Glaser and Weber (2003b)
correlate scores that measure individual differences in the degree of miscalibration, the better
than average effect, illusion of control, and unrealistic optimism for a group of individual
investors. They find that most of the correlations are insignificant. Some correlation
coefficients are even negative. The results of this study cast doubt on whether overconfidence,
as it is used as a motivation in the finance literature, is a stable concept or a general valid
phenomenon and that the above mentioned manifestations of overconfidence are related. But
these are preliminary results that need further investigation. Evidence on this issue is
important, as theoretical models often incorporate only one facet of overconfidence,
miscalibration, whereas the motivation of this use is based on a variety of possibly unrelated
findings and it is unclear which manifestation of overconfidence actually drives economic
behavior.
At this point of the survey, we want to stress the following explicit and implicit assumptions
of the way overconfidence is modeled in theoretical finance. Static models or models with
constant overconfidence over time assume that there are stable individual differences in the
degree of overconfidence, i.e. miscalibration. In contrast to these explicit and implicit
assumptions, there is a large debate in the psychological literature over whether
miscalibration is domain or task dependent or even a statistical illusion (see, for example,
Gigerenzer, Hoffrage, and Kleinbölting (1991), Klayman, Soll, Gonzáles-Vallejo, and Barlas
(1999), Zuslin, Winman, and Olson (2000), Erev, Wallsten, and Budescu (1994)) or if there
are stable individual differences in reasoning or decision making competence (see Parker and
Fischhoff (2001), Stanovich and West (1998), and Stanovich and West (2000)).
2.2. Important Results and Predictions of Overconfidence Models
In this subsection, we discuss the most important results of models that incorporate
overconfident market participants. Due to the page constraints in this survey, we omit a
comprehensive presentation of the precise mechanism of how overconfidence affects the
model predictions. Such a presentation would require a discussion of, for example, the
following details: market environment, number of trading periods, or number of assets traded.
Investors in a competitive market environment do not influence the price of assets whereas
other investors in a strategic market environment take into account that their trading behavior
might influence the market price. Moreover, some models are static in the way that there is

14
only one trading round whereas dynamic models analyze several periods. Furthermore,
models have either one or multiple risky assets that are traded. The interested reader will find
a presentation of various overconfidence models and other behavioral finance models in the
survey of Hirshleifer (2001).
Table 26.2 shows that most of the overconfidence models predict high trading volume in the
market in the presence of overconfident traders. Moreover, at the individual level,
overconfident investors will trade more aggressively: The higher the degree of overconfidence
of an investor, the higher her or his trading volume. Odean (1998) calls this finding “the most
robust effect of overconfidence”. DeBondt and Thaler (1995) note that the high trading
volume observed in financial markets “is perhaps the single most embarrassing fact to the
standard finance paradigm” and that “the key behavioral factor needed to understand the
trading puzzle is overconfidence”. Apart from the ability to explain high levels of trading
volume, the models of Benos (1998), Caballé and Sákovics (2003), Kyle and Wang (1997),
Odean (1998), and Wang (1998) make further predictions as well. Odean (1998) finds that
overconfident traders have lower expected utility than rational traders and hold
underdiversified portfolios. In contrast, Kyle and Wang (1997) find that overconfident traders
might earn higher expected profits or have higher expected utility than rational traders as
overconfidence works like a commitment device to aggressive trading. Benos (1998) finds
similar results. However, higher profits of overconfident investors are a result of a first mover
advantage in his model. Benos (1998), Caballé and Sákovics (2003), and Odean (1998) show
that the presence of overconfident traders helps explain excess volatility of asset prices, i.e.
the fluctuation of asset prices is higher than the fluctuation of the fundamental value. This
presentation shows that some predictions are common results of all models (the effect of
overconfidence on trading volume) whereas other predictions depend on further assumptions
(e.g. the effect of overconfidence on expected utility).
Hirshleifer and Luo (2001), Kyle and Wang (1997), Wang (2001) show that overconfident
traders may survive in security markets. Daniel, Hirshleifer, and Subrahmanyam (1998) show
that overconfidence might present an explanation for the momentum effect and for long-run
reversals of returns whereas the model of Daniel, Hirshleifer, and Subrahmanyam (2001) is
able to generate the value/growth effect and the size effect. Gervais and Odean (2001) analyze
how overconfidence dynamically changes through time as a function of past investment
success due to a self-attribution bias.

15
2.3. Empirical and Experimental Tests of Overconfidence Models
There are two points of departure to test the empirical validity of an overconfidence model:
model assumptions and model predictions. In the following two subsections we will discuss
empirical and experimental tests of model assumptions and model predictions in turn.
2.3.1. Empirical and Experimental Tests of Model Assumptions
Model assumptions can be evaluated by experiments and questionnaire studies which analyze
whether individual and institutional investors do underestimate the variance of stock returns,
overestimate the precision of their knowledge, or how they react to releases of private or
public information. In this subsection we present a few studies which show that investors are
miscalibrated in the context of financial markets.
Kirchler and Maciejovsky (2002) is an example of an experiment which analyzes whether
investors overestimate the precision of their knowledge or give too tight confidence intervals
in a market environment. They experimentally investigate individual overconfidence in the
context of an experimental asset market with several trading periods. Before each period,
overconfidence was measured via subjective confidence intervals and via the comparison of
objective accuracy and subjective certainty. Subjects' confidence intervals were too tight
indicating overconfidence whereas according to the comparison of objective accuracy and
subjective certainty the same people can sometimes even be classified as underconfident.
Hilton (2001) surveys questionnaire studies which analyze exchange rate and stock price
predictions. These studies find too narrow confidence intervals. Another example of a
questionnaire study that analyzes whether financial markets participants or financial
professionals underestimate the variance of stock returns is by Graham and Harvey (2002).
They study expectations of stock market risk premium as well as their volatility estimates in a
panel survey. On a quarterly basis, Chief Financial Officers of U.S. corporations are asked to
provide their estimates of the market risk premium as well as upper and lower bounds of 90
percent confidence intervals of this premium. Graham and Harvey (2002) find that, compared
to historical standard deviations of one-year stock returns, Chief Financial Officers
underestimate the variance of stock returns and are thus very confident in their assessments.
Summing up, the above mentioned studies show that it is a reasonable modeling assumption
that investors are miscalibrated by underestimating stock variances or equivalently by

16
overestimating the precision of their knowledge. Note that this is the way how overconfidence
is modeled in the finance literature.
2.3.2. Empirical and Experimental Tests of Model Predictions
Model predictions can be tested in several ways. We structure these various endeavors as
follows:
1 Predictions concerning trading behavior and investment performance of (individual
and institutional) investors.
2 Predictions concerning market outcomes.
Predictions Concerning Behavior and Performance of Investors
The most important prediction in category 1 is that trading volume increases with an
increasing degree of overconfidence. The above mentioned predictions can be tested by
analyzing the following data from the field or from experiments:
a) Analysis of market level data, such as returns and trading volume.
b) Analysis of trading behavior of investors.
c) Correlation of proxies or measures of overconfidence on the one hand and economic
variables such as trading volume on the other hand.
We will discuss these three possibilities in turn while focusing on the above mentioned
hypothesis concerning overconfidence and trading volume.
Statman, Thorley, and Vorkink (2003) and Kim and Nofsinger (2002) are examples of group
a). Statman, Thorley, and Vorkink (2003) use U.S. market data to test the hypothesis that
overconfidence leads to high trading volume. They test dynamic models predicting that after
high returns subsequent trading volume will be higher as investment success increases the
degree of overconfidence. They find that high current stock trading volume is associated with
high stock returns in the previous weeks. Statman, Thorley, and Vorkink (2003) argue that
this finding supports the hypothesis as high returns make investors overconfident and they
will, as a consequence, trade more subsequently. Kim and Nofsinger (2002) confirm these
findings using Japanese market level data. They identify stocks with varying degrees of
individual ownership to test the hypothesis and discover higher monthly turnover in stocks

17
held by individual investors during the bull market in Japan. Moreover, high past returns in
both studies might be interpreted as a proxy of overconfidence as stated in group c).
Odean (1999) is an example of group b). He analyzes the trades of 10,000 individuals with
discount brokerage accounts. He finds that these investors reduce their returns by trading and
thus concludes that trading volume is excessive – a finding which is consistent with
overconfidence models and thus indirect evidence in favor of the above mentioned
hypothesis.
The Barber and Odean (2001) study is a further example of group c). Their proxy for
overconfidence is gender. In the paper, they summarize psychological studies that find a
higher degree of overconfidence among men than among women. Consequently, they
partition their data set which consist of 35,000 households from a large discount brokerage
house on gender and find that men trade more than women which is consistent with
overconfidence models.
All the above mentioned studies share the shortcoming that overconfidence is never directly
observed. The evidence in favor of overconfidence models is either indirect, as in Odean
(1999), or uses only crude proxies for overconfidence (past returns, gender). A direct test of
the hypothesis that a higher degree of overconfidence leads to higher trading volume is the
correlation of measures of overconfidence and measures of trading volume as mentioned in
c). In the following, we will discuss two recent studies that use this approach
Glaser and Weber (2003b) directly test the hypothesis that overconfidence leads to high
trading volume by analyzing trades of individual investors who have online broker accounts.
These investors were asked to answer an internet questionnaire which was designed to
measure various facets of overconfidence (miscalibration, the better-than-average effect,
illusion of control, unrealistic optimism). They test the hypothesis by correlating individual
overconfidence scores with several measures of trading volume of these individual investors
(number of trades, turnover). The measures of trading volume were calculated by the trades of
215 individual investors who answered the questionnaire. Glaser and Weber (2003b) find that
investors trade more if they believe that they are above average in terms of investment skills
or past performance. When realized returns are used as a proxy for investment skills, investors
overestimate their relative position within the group of investors. Measures of miscalibration
are, contrary to theory, unrelated to measures of trading volume. This result is striking as
theoretical models that incorporate overconfident investors model overconfidence as

18
underestimation of the variance of signals, i.e. miscalibration. The results hold even when
several other determinants of trading volume are controlled for in a cross-sectional regression
analysis.
Biais, Hilton, Mazurier, and Pouget (2002) analyze experimentally if psychological traits and
cognitive biases affect trading. Based on the answers of 184 subjects (students) to a
psychological questionnaire they measured, among other psychological traits, the degree of
overconfidence via calibration tasks. The subjects also participated in an experimental asset
market afterwards. Biais, Hilton, Mazurier, and Pouget (2002) find that overconfident
subjects have a greater tendency to place unprofitable orders. However, their overconfidence
measure –the degree of miscalibration− is unrelated to trading volume. Contrary to
predictions of overconfidence models, overconfident subjects do not place more orders.
Why is miscalibration not positively related to trading volume, as predicted by
overconfidence models? One important point to remember is that the link between
miscalibration and trading volume has never been shown or even analyzed empirically or
experimentally. Overconfidence models are motivated by psychological studies which show
that people are generally miscalibrated or by empirical findings that are consistent with
miscalibrated investors, such as high trading volume. But there might be other biases that are
able to explain the same empirical findings when implemented in a theoretical model. This
shows the importance of analyzing the link or correlation between judgment biases and
economic variables such as trading volume as the only way to test which bias actually
influences economic behavior. Furthermore, there are other reasons that might explain the
failure of miscalibration scores in explaining volume. In the psychological literature, there is a
debate over whether miscalibration is domain or task dependent or even a statistical illusion
(see chapter 9). If miscalibration is not a stable individual trait or if the degree of
miscalibration depends on a specific task then it is no surprise that the above mentioned
studies are unable to empirically confirm the hypothesis that a higher degree of miscalibration
leads to higher trading volume. Glaser and Weber (2003b) contains an enlarged discussion of
these points and further possible explanations and interpretations of the result that
miscalibration scores are unrelated to measures of trading volume.
Predictions Concerning Market Outcomes
In the remainder of this section, we discuss how predictions of overconfidence models in
group 2 can be tested. For example, in the model of Daniel, Hirshleifer, and Subrahmanyam

19
(1998) the momentum effect is a result of the trading activity of overconfident traders. One
implication of their model is that momentum is strongest among stocks that are difficult to
evaluate by investors. One example for such stocks are growth stocks with hard-to-value
growth options in the future. Daniel and Titman (1999) confirm this implication. They find
that momentum is stronger for growth stocks. If disagreement of investors about the future
performance is stronger among hard-to-value stocks and if trading volume is a measure of this
disagreement then a further implication of the Daniel, Hirshleifer, and Subrahmanyam (1998)
model is a stronger momentum effect among high-volume stocks. This finding is confirmed
by Lee and Swaminathan (2000) and Glaser and Weber (2003a) using turnover, the number of
shares traded divided by the number of shares outstanding, as a measure of trading volume:
momentum is stronger among high-turnover stocks.
3. Summary and Open Questions
Behavioral finance has become widely accepted among finance academics. It is neither a
minor subdiscipline nor a new paradigm of finance. Behavioral finance tries to improve
existing models via more realistic assumptions. Thus, behavioral finance follows the
traditional way of financial modeling that incorporates real world imperfections such as
transaction costs, taxes, or asymmetric information on the one hand or observed traits of
individuals such as risk aversion on the other hand into finance models.
Naturally, behavioral finance has drawn some criticism: “My view is that any new model
should be judged (…) on how it explains the big picture. The question should be: Does the
new model produce rejectable predictions that capture the menu of anomalies better than
market efficiency? For existing behavioral models, my answer to this question (perhaps
predictably) is an emphatic no.” (Fama (1998), p. 291). In other words, behavioral finance
models are currently not able to replace traditional finance theory. One reason for this
conclusion is given by Frankfurter and McGoun (2002, pp. 375-376): “Even the supposed
proponents of behavioral finance, however, are marginalizing themselves by clinging to the
underlying tenets, forms, and methods of the dominant paradigm. (...) Although ‘behavioral
finance’ sounds as if it would be a new methodology or even a significant new paradigm for
research in financial economics, behavioral finance has never been, and looks as if it may
never be, either.”
Thaler (1999, p. 16) predicts the end of behavioral finance as all financial theorists will
sooner or later incorporate realistic assumptions: “I predict that in the not-too-distant future,

20
the term ‘behavioral finance’ will be correctly viewed as a redundant phrase. What other kind
of finance is there? In their enlightenment, economists will routinely incorporate as much
‘behavior’ into their models as they observe in the real world. After all, to do otherwise would
be irrational.”
Behavioral finance as a field is a rather young enterprise which has proved its usefulness by
first results but which still has some way to go. On the level of individual decision making in
markets, e.g. individual or professional investors' behavior, we have quite a large amount of
knowledge. A large part of this knowledge stems from psychological research which tries to
answer similar questions. On the level of aggregate variables, like market prices or trading
volume, we know less. As these variables are central for research in finance, ultimately,
behavioral finance will have to prove its usefulness here as well. To make further progress, it
will be necessary to develop financial models which are based on alternative, behavioral
assumptions of decision making. The challenge will be to show that these new models come
up with predictions different from standard financial models and that these alternative
predictions win over predictions from standard theory.
We conclude with some thoughts on how research in behavioral finance might become even
more successful. From the perspective of psychology, it would be helpful to extend the
research program beyond individual decision making by investigating problems or open
questions which are central to a financial (or economic) context. Examples are, strategic and
dynamic interaction of economic agents in markets, decision making in organizations or
principle-agents situations.
For research in finance, it would be helpful to read more carefully what psychologist have
found. As we demonstrated in the case of overconfidence, researchers in finance want truths
from psychologists which are as simple as possible. The truths have to be simple, because
otherwise financial models get too complex. By studying the psychological literature,
researchers in finance have to extract those findings which are robust as well as useful for
modeling purposes. Clearly, it would be best to join forces from both disciplines to further
enhance behavioral finance which after all is an interdisciplinary field of research.
21
4. References
Banz, Rolf, 1981, The relationship between return and market value of common stocks,
Journal of Financial Economics 9, 3-18.
Barber, Brad M., and Terrance Odean, 2001, Boys will be boys: Gender, overconfidence, and
common stock investment, Quarterly Journal of Economics 116, 261-292.
Barberis, Nicholas, and Ming Huang, 2001, Mental accounting, loss aversion, and individual
stock returns, Journal of Finance 56, 1247-1292.
Barberis, Nicholas, Ming Huang, and Tano Santos, 2001, Prospect theory and asset prices,
Quarterly Journal of Economics 116, 1-53.
Barberis, Nicholas, Andrei Shleifer, and Robert Vishny, 1998, A model of investor sentiment,
Journal of Financial Economics 49, 307-343.
Benartzi, Shlomo, and Richard Thaler, 1995, Myopic loss aversion and the equity premium
puzzle, Quarterly Journal of Economics 110, 73-92.
Benartzi, Shlomo, and Richard Thaler, 2001, Naive diversification strategies in defined
contribution saving plans, American Economic Review 91, 79-98.
Benos, Alexandros V., 1998, Aggressiveness and survival of overconfident traders, Journal of
Financial Markets 1, 353-383.
Biais, Bruno, Denis Hilton, Karine Mazurier, and Sébastien Pouget, 2002, Psychological traits
and trading strategies, CEPR Discussion paper No. 3195.
Caballé, Jordi, and József Sákovics, 2003, Speculating against an overconfident market,
Journal of Financial Markets 6, 199-225.
Daniel, Kent, David Hirshleifer, and Avanidhar Subrahmanyam, 1998, Investor psychology
and security market under- and overreactions, Journal of Finance 53, 1839-1885.
Daniel, Kent, David Hirshleifer, and Avanidhar Subrahmanyam, 2001, Overconfidence,
arbitrage, and equilibrium asset pricing, Journal of Finance 56, 921-965.

22
Daniel, Kent, David Hirshleifer, and Siew Hong Teoh, 2002, Investor psychology in capital
markets: Evidence and policy implications, Journal of Monetary Economics 49, 139-209.
Daniel, Kent, and Sheridan Titman, 1999, Market efficiency in an irrational world, Financial
Analysts Journal 55, 28-40.
DeBondt, Werner F.M., and Richard H. Thaler, 1995, Financial decision making in markets
and firms: A behavioral perspective, in R. A. Jarrow, V. Maksimovic, and W. T. Ziemba, ed.:
Handbooks in Operations Research and Management Science, Volume 9, Finance. pp. 385-
410 (Elsevier).
DeLong, J. Bradford, Andrei Shleifer, Lawrence H. Summers, and Robert J. Waldmann,
1990a, Noise trader risk in financial markets, Journal of Political Economy 98, 703-738.
DeLong, J. Bradford, Andrei Shleifer, Lawrence H. Summers, and Robert J. Waldmann,
1990b, Positive feedback investment strategies and destabilizing rational speculation, Journal
of Finance 45, 379-395.
Dimson, Elroy, and Paul Marsh, 2000, The demise of size, in Gabriel Hawawini, Donald B.
Keim, and William T. Ziemba, ed.: Security Market Imperfections in World Wide Equity
Markets. pp. 116-143 (Cambridge University Press).
Dow, James, and Gary Gorton, 1994, Arbitrage chains, Journal of Finance 49, 819-849.
Erev, Ido, Thomas S. Wallsten, and David V. Budescu, 1994, Simultaneous over- and
underconfidence: The role of error in judgment processes, Psychological Review 101, 519-
528.
Fama, Eugene F., 1970, Efficient capital markets: A review of theory and empirical evidence,
Journal of Finance 25, 383-417.
Fama, Eugene F., 1991, Efficient capital markets II, Journal of Finance 46, 1575-1617.
Fama, Eugene F., 1998, Market efficiency, long-term returns, and behavioral finance, Journal
of Financial Economics 49, 283-306.
Fama, Eugene, and Kenneth French, 1992, The cross-section of expected returns, Journal of
Finance 47, 427-466.
23
Frankfurter, George M., and Elton G. McGoun, 2002, Resistance is futile: the assimilation of
behavioral finance, Journal of Economic Behavior and Organization 48, 375-389.
Froot, Kenneth A., and Emil M. Dabora, 1999, How are stock prices affected by the location
of trade, Journal of Financial Economics 53, 189-216.
Gervais, Simon, and Terrance Odean, 2001, Learning to be overconfident, Review of
Financial Studies 14, 1-27.
Gigerenzer, Gerd, Ulrich Hoffrage, and Heinz Kleinbölting, 1991, Probabilistic mental
models: A brunswikian theory of confidence, Psychological Review 98, 506-528.
Glaser, Markus, and Martin Weber, 2003a, Momentum and turnover: Evidence from the
german stock market, Schmalenbach Business Review 55, 108-135.
Glaser, Markus, and Martin Weber, 2003b, Overconfidence and trading volume, CEPR
Discussion paper No. 3941.
Graham, John R., and Campbell R. Harvey, 2002, Expectations of equity risk premia,
volatility, and asymmetry, Working Paper, Duke University.
Hilton, Denis J., 2001, The psychology of financial decision-making: Applications to trading,
dealing, and investment analysis, Journal of Psychology and Financial Markets 2, 37-53.
Hirshleifer, David, 2001, Investor psychology and asset pricing, Journal of Finance 56, 1533-
1597.
Hirshleifer, David, and Guo Ying Luo, 2001, On the survival of overconfident traders in a
competitive securities market, Journal of Financial Markets 4, 73-84.
Hvide, Hans K., 2002, Pragmatic beliefs and overconfidence, Journal of Economic Behavior
and Organization 48, 15-28.
Jegadeesh, Narasimhan, and Sheridan Titman, 1993, Returns to buying winners and selling
losers: Implications for stock market efficiency, Journal of Finance 48, 65-91.
Jegadeesh, Narasimhan, and Sheridan Titman, 2001, Profitability of momentum strategies: An
evaluation of alternative explanations, Journal of Finance 56, 699-720.

24
Juslin, Peter, Anders Winman, and Henrik Olson, 2000, Naive empiricism and dogmatism in
confidence research: A critical examination of the hard-easy effect, Psychological Review
107, 384-396.
Kahneman, Daniel, and Mark W. Riepe, 1998, Aspects of investor psychology, Journal of
Portfolio Management, 52-65.
Kahneman, Daniel, and Amos Tversky, 1979, Prospect theory: An analysis of decision under
risk, Econometrica 47, 263-292.
Kim, Kenneth A., and John R. Nofsinger, 2002, The behavior and performance of individual
investors in Japan, Working paper.
Kirchler, Erich, and Boris Maciejovsky, 2002, Simultaneous over- and underconfidence:
Evidence from experimental asset markets, Journal of Risk and Uncertainty 25, 65-85.
Klayman, Joshua, Jack B. Soll, Claudia Gonzáles-Vallejo, and Sema Barlas, 1999,
Overconfidence: It depends on how, what, and whom you ask, Organizational Behavior and
Human Decision Processes 79, 216-247.
Kogan, Leonid, Stephen Ross, Jiang Wang, and Mark Westerfield, 2003, The price impact
and survival of irrational traders, NBER Working Paper 9434.
Kyle, Albert S., and F. Albert Wang, 1997, Speculation duopoly with agreement to disagree:
Can overconfidence survive the market test?, Journal of Finance 52, 2073-2090.
Lakonishok, Josef, Andrei Shleifer, and Robert W. Vishny, 1994, Contrarian investment,
extrapolation, and risk, Journal of Finance 49, 1541-1578.
Lamont, Owen A., and Richard~H. Thaler, 2003, Can the market add and subtract?
mispricing in tech stock carve-outs, Journal of Political Economy 111, 227-268.
Langer, Ellen J., 1975, The illusion of control, Journal of Personality and Social Psychology
32, 311-328.
Langer, Ellen J., and Jane Roth, 1975, Heads I win, tail it's chance: The illusion of control as a
function of the sequence of outcomes in a purely chance task, Journal of Personaliy and
Social Psychology 32, 951-955.

25
Lee, Charles M.C., and Bhaskaran Swaminathan, 2000, Price momentum and trading volume,
Journal of Finance 55, 2017-2069.
Lichtenstein, Sarah, Baruch Fischhoff, and Lawrence D. Phillips, 1982, Calibration of
probabilities: The state of the art to 1980, in Daniel Kahneman, Paul Slovic, and Amos
Tversky, ed.: Judgment under uncertainty: Heuristics and Biases, 306-334 (Cambridge
University Press).
Mehra, Rajnish, and Edward C. Prescott, 1985, The equity premium puzzle, Journal of
Monetary Economics 15, 145-161.
Milgrom, Paul, and Nancy Stokey, 1982, Information, trade and common knowledge, Journal
of Economic Theory 26, 17-27.
Miller, Dale T., and Michael Ross, 1975, Self-serving biases in attribution of causality: Fact
or fiction?, Psychological Bulletin 82, 213-225.
Odean, Terrance, 1998, Volume, volatility, price, and profit when all traders are above
average, Journal of Finance 53, 1887-1934.
Odean, Terrance, 1999, Do investors trade too much?, American Economic Review 89, 1279-
1298.
Pagano, Marco, and Alisa Röell, 1992, Trading volume, in Peter Newman, John Eatwell, and
Murray Milgate, ed.: The New Palgrave Dictionary of Money and Finance, 679-683
(Macmillan).
Parker, Andrew M., and Baruch Fischhoff, 2001, An individual difference measure of
decision making competence, Working paper, Carnegie Mellon University.
Rouwenhorst, K. Geert, 1998, International momentum strategies, Journal of Finance 53, 267-
284.
Rouwenhorst, K. Geert, 1999, Local return factors and turnover in emerging markets, Journal
of Finance 54, 1439-1464.
Schneider, David J., Albert H. Hastorf, and Phoebe C. Ellsworth, 1979, Person Perception
(Addison-Wesley).

26
Shiller, Robert J., 1999, Human behavior and the efficiency of the financial system, in: John
B. Taylor, and Michael Woodford (eds): Handbook of Macroeconomics, pp. 1305-1340
(Elsevier Science).
Shleifer, Andrei, and Robert W. Vishny, 1997, The limits of arbitrage, Journal of Finance 52,
35-55.
Stanovich, Keith E., and Richard F. West, 1998, Individual differences in rational thought,
Journal of Experimental Psychology 127, 161-188.
Stanovich, Keith E., and Richard F. West, 2000, Individual differences in reasoning:
Implications for the rationality debate, Behavioral and Brain Sciences 23, 645-726.
Statman, Meir, Steven Thorley, and Keith Vorkink, 2003, Investor overconfidence and
trading volume, Working paper.
Svenson, Ola, 1981, Are we all less risky and more skillful than our fellow drivers?, Acta
Psychologica 47, 143-148.
Taylor, Shelley E., and Jonathon D. Brown, 1988, Illusion and well-being: A social
psychology perspective on mental health, Psychological Bulletin 103, 193-210.
Thaler, Richard H., 1999, The end of behavioral finance, Financial Analysts Journal 55, 12-
17.
Thaler, Richard H., and Eric J. Johnson, 1990, Gambling with the house money and trying to
break even: The effects of prior outcomes on risky choices, Management Science 36, 643-
660.
Wang, F. Albert, 1998, Strategic trading, asymmetric information and heterogeneous prior
beliefs, Journal of Financial Markets 1, 321-352.
Wang, F. Albert, 2001, Overconfidence, investor sentiment, and evolution, Journal of
Financial Intermediation 10, 138-170.
Weber, Martin, Hans-Jürgen Keppe, and Gabi Meyer-Delius, 2000, Framing effects in
experimental markets, Journal of Economic Behavior and Organization 41, 159-176.

27
Weinstein, Neil D., 1980, Unrealistic optimism about future life events, Journal of Personality
and Social Psychology 39, 806-820.
Wolosin, Robert J., Steven J. Sherman, and Amnon Till, 1973, Effects of cooperation and
competition on responsibility attribution after success and failure, Journal of Experimental
Social Psychology 9, 220-235.
28
Figure 26.1: Two approaches of Behavioral Finance
This figure shows the two approaches of behavioral finance. In the first approach, the starting points are results from psychology describing human behavior in certain economic circumstances. These results are used to build new models to explain market observations. In the second approach, empirical deviations from predictions based on traditional finance theory are observed. Then, psychological results of individual behavior are screened to find an explanation for the observed market phenomena.
Table 26.1: Relative and absolute trading volume in major stock markets (2002)
This table contains the absolute trading volume (in US$ trillions) and the relative trading volume in percent of market capitalization (turnover) for five stock markets in 2002.
US UK Japan Germany France
trading volume in US$ trn 10.31 4.00 1.57 1.21 1.10 % market capitalization 100 215 70 180 115
psychology:individual behavior
market prices andtransaction volume
incorporateinto model
rational (frictions) orfrom psychology
market:detect anomalies andindividual behavior
findexplanations

29
Table 26.2: Behavioral Finance Models
Year Authors Journal Evidence from psychology Important findings and model predictions
2001 Barberis/Huang JF Mental accounting (individual stock vs. portfolio accounting), prospect theory
Equity premium, excess volatility, value/growth effect
2001 Barberis/Huang/Santos QJE Prospect theory, house money effect Equity premium, excess volatility, time-series predictability of stock returns
2001 Daniel/Hirshleifer/Subrahmanyam JF Overconfidence Cross-sectional return predictability 2001 Gervais/Odean RFS Overconfidence, biased self-attribution High trading volume, higher trading volume
after investment successes
2001 Hirshleifer/Luo JFM Overconfidence Survival of overconfident investors in competitive security markets
1998 Barberis/Shleifer/Vishney JFE Conservatism, representativeness heuristic
Positive short-lag autocorrelation, negative long-lag autocorrelation, value/growth effect, event-based return predictability
1998 Benos JFM Overconfidence High trading volume, excess volatility 1998 Daniel/Hirshleifer/Subrahmanyam JF Overconfidence, biased self-attribution Positive short-lag autocorrelation, negative
long-lag autocorrelation, excess volatility, event based return predictability
1998 Odean JF Overconfidence High trading volume 1998 Wang JFM Overconfidence High trading volume
This table presents a survey of behavioral finance models that have been published in the five years from 1998 until 2002 in some leading journals that regularly contain behavioral finance research (Journal of Finance (JF), Journal of Financial Economics (JFE), Review of Financial Studies (RFS), Journal of Financial Markets (JFM), Quarterly Journal of Economics (QJE)). The table shows the psychological finding that is incorporated into the model (column four) as well as the empirical findings that these models are able to explain (column five).