Beginners Guide to Swing Trading - WordPress.com...Beginners Guide to Swing Trading Welcome to my...
11
Beginners Guide to Swing Trading Welcome to my first document I have created on how I swing trade. This guide is not for the people who have no idea about Forex or the basics. If you are new, I would recommend you to go sign up with The Forex Family, pick up a book or go on www.babypips.com. Prior to reading this guide you need to know the basics of Forex trading, e.g. How to plot Support & Resistance (Supply & Demand Zones), Draw Trendlines, Understandings How the News Affects the Markets, and most importantly understanding Price Action (Candlestick Patterns). What I will be covering in this guide: • Simplifying Charts • Market Structure • Psychological Levels • My Favourite Set Ups • Entries + Take Profit + Stop Losses • Risk Management • Tips on What to Do When You Feel Lost Simplifying Charts There are traders out there using indicators, algorithms, or signals. Obviously, some work for some traders and institutions, but if you are a retail trader, which I am sure most of you are, then get rid of everything. Start from scratch, simplify, it will make your life easier. All you will need is to know how to identify market structure (HH, HL, LH, LL), draw your zones and price action. Trendlines work sometimes, but don’t really on them too heavily. It is that simple. The less you look at, the more appealing it is to the eye, and keeps you from overthinking. This is an example of how my charts look: I just have my zones plotted, a trendline and I just watch the overall trend and market structure (will highlight in next section). Look closely and see how it all reacted to my zones, you can see the candles being exhausted at the zones and then it went the other way. I try keep my zones as fresh (new) as
Transcript of Beginners Guide to Swing Trading - WordPress.com...Beginners Guide to Swing Trading Welcome to my...
Beginners Guide to Swing Trading
Welcome to my first document I have created on how I swing trade. This guide is not for the people
who have no idea about Forex or the basics. If you are new, I would recommend you to go sign up with The
Forex Family, pick up a book or go on www.babypips.com. Prior to reading this guide you need to know the
basics of Forex trading, e.g. How to plot Support & Resistance (Supply & Demand Zones), Draw Trendlines,
Understandings How the News Affects the Markets, and most importantly understanding Price Action
(Candlestick Patterns).
What I will be covering in this guide:
• Simplifying Charts
• Market Structure
• Psychological Levels
• My Favourite Set Ups
• Entries + Take Profit + Stop Losses
• Risk Management
• Tips on What to Do When You Feel Lost
Simplifying Charts
There are traders out there using indicators, algorithms, or signals. Obviously, some work for some
traders and institutions, but if you are a retail trader, which I am sure most of you are, then get rid of
everything. Start from scratch, simplify, it will make your life easier. All you will need is to know how to
identify market structure (HH, HL, LH, LL), draw your zones and price action. Trendlines work sometimes,
but don’t really on them too heavily. It is that simple. The less you look at, the more appealing it is to the
eye, and keeps you from overthinking.
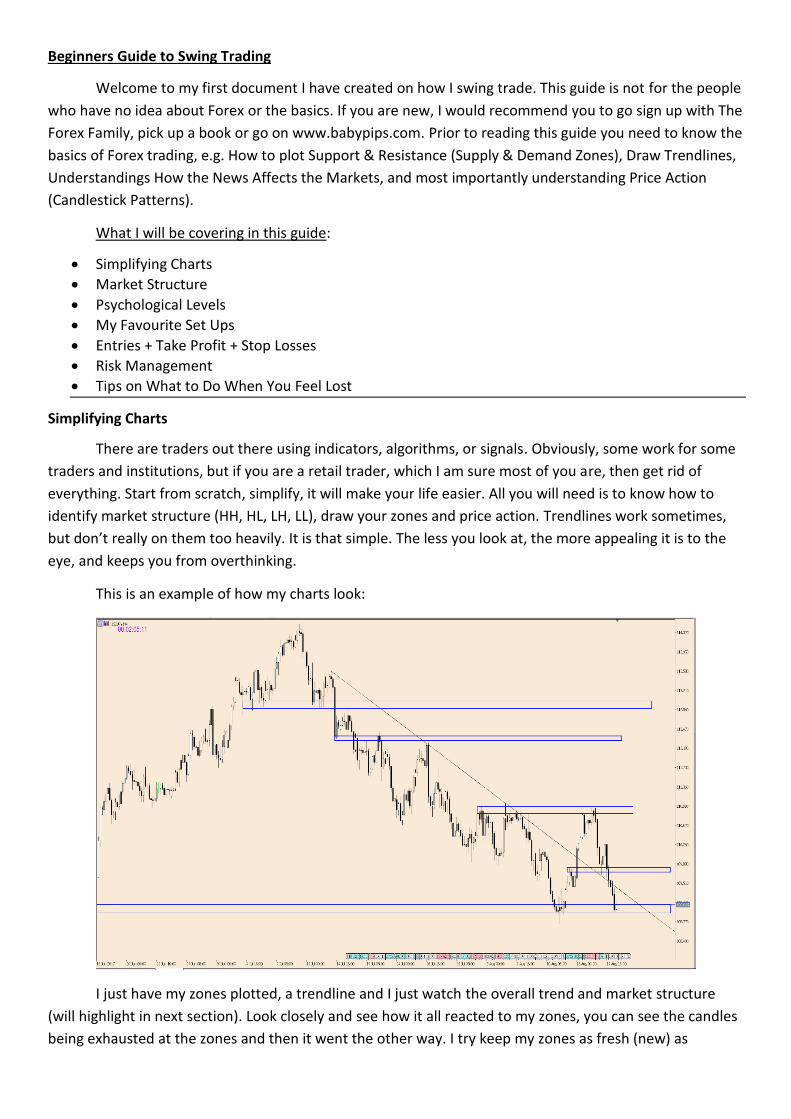
This is an example of how my charts look:
I just have my zones plotted, a trendline and I just watch the overall trend and market structure
(will highlight in next section). Look closely and see how it all reacted to my zones, you can see the candles
being exhausted at the zones and then it went the other way. I try keep my zones as fresh (new) as
possible. The fresher it is, the stronger it is, but since we are on the H4 timeframe, we only should change
it 1 or 2 times a week depending on the market structure.
Have a close look at the trendline, it was well respected, and what I noticed, but does not happen
every time is that after the 3rd touch, the 4th would usually break. It broke on the 4th touch, came for a
retest and formed a bullish pin bar. This usually signifies a higher low being created and price would
continue higher. However, price dropped back down into the trendline. Usually what I do after is remove
the trendline from my chart.
Then this is how my chart would look like. I will explain later in the PDF about why even though we
had a retest of the broken trendline, price did not continue higher.
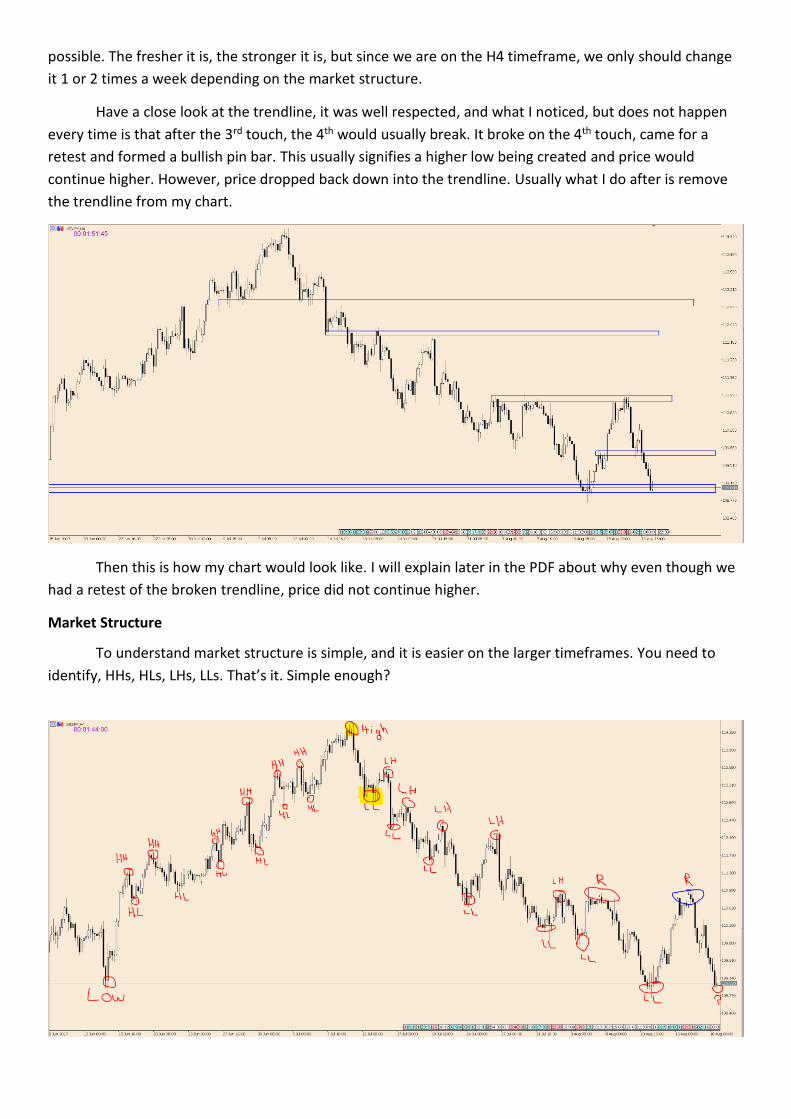
Market Structure
To understand market structure is simple, and it is easier on the larger timeframes. You need to
identify, HHs, HLs, LHs, LLs. That’s it. Simple enough?
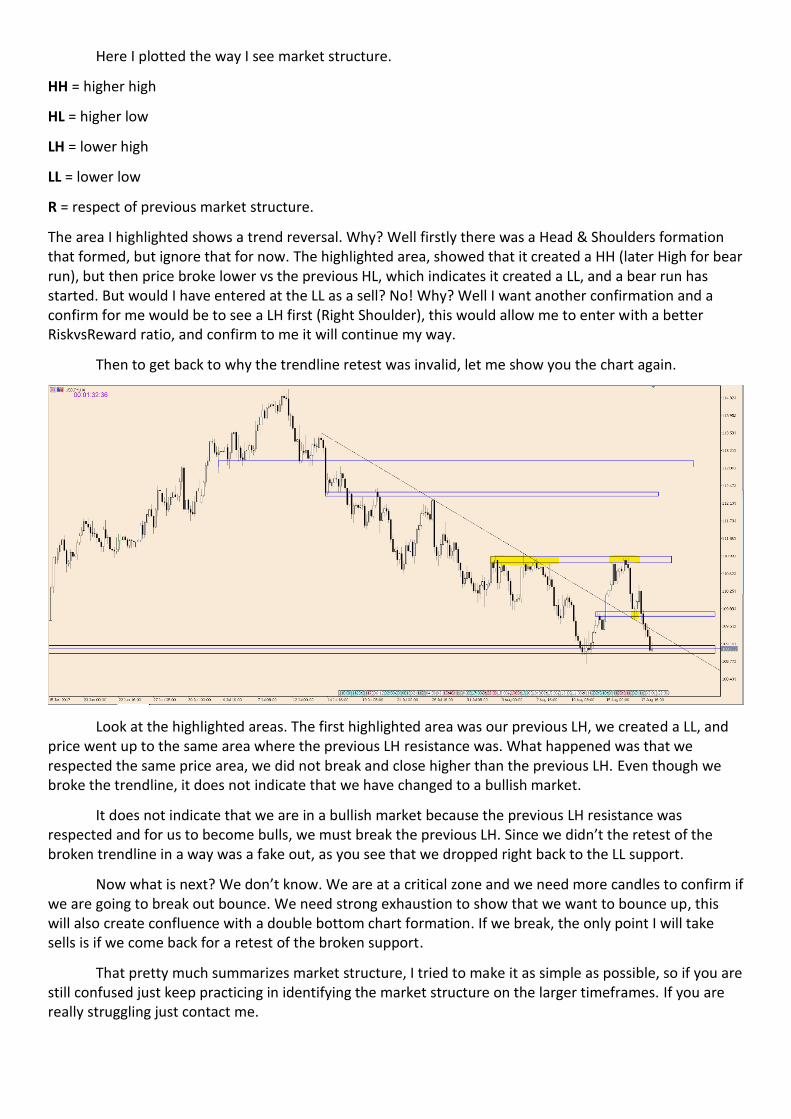
Here I plotted the way I see market structure.
HH = higher high
HL = higher low
LH = lower high
LL = lower low
R = respect of previous market structure.
The area I highlighted shows a trend reversal. Why? Well firstly there was a Head & Shoulders formation that formed, but ignore that for now. The highlighted area, showed that it created a HH (later High for bear run), but then price broke lower vs the previous HL, which indicates it created a LL, and a bear run has started. But would I have entered at the LL as a sell? No! Why? Well I want another confirmation and a confirm for me would be to see a LH first (Right Shoulder), this would allow me to enter with a better RiskvsReward ratio, and confirm to me it will continue my way.
Then to get back to why the trendline retest was invalid, let me show you the chart again.
Look at the highlighted areas. The first highlighted area was our previous LH, we created a LL, and price went up to the same area where the previous LH resistance was. What happened was that we respected the same price area, we did not break and close higher than the previous LH. Even though we broke the trendline, it does not indicate that we have changed to a bullish market.
It does not indicate that we are in a bullish market because the previous LH resistance was respected and for us to become bulls, we must break the previous LH. Since we didn’t the retest of the broken trendline in a way was a fake out, as you see that we dropped right back to the LL support.
Now what is next? We don’t know. We are at a critical zone and we need more candles to confirm if we are going to break out bounce. We need strong exhaustion to show that we want to bounce up, this will also create confluence with a double bottom chart formation. If we break, the only point I will take sells is if we come back for a retest of the broken support.
That pretty much summarizes market structure, I tried to make it as simple as possible, so if you are still confused just keep practicing in identifying the market structure on the larger timeframes. If you are really struggling just contact me.
Psychological Levels
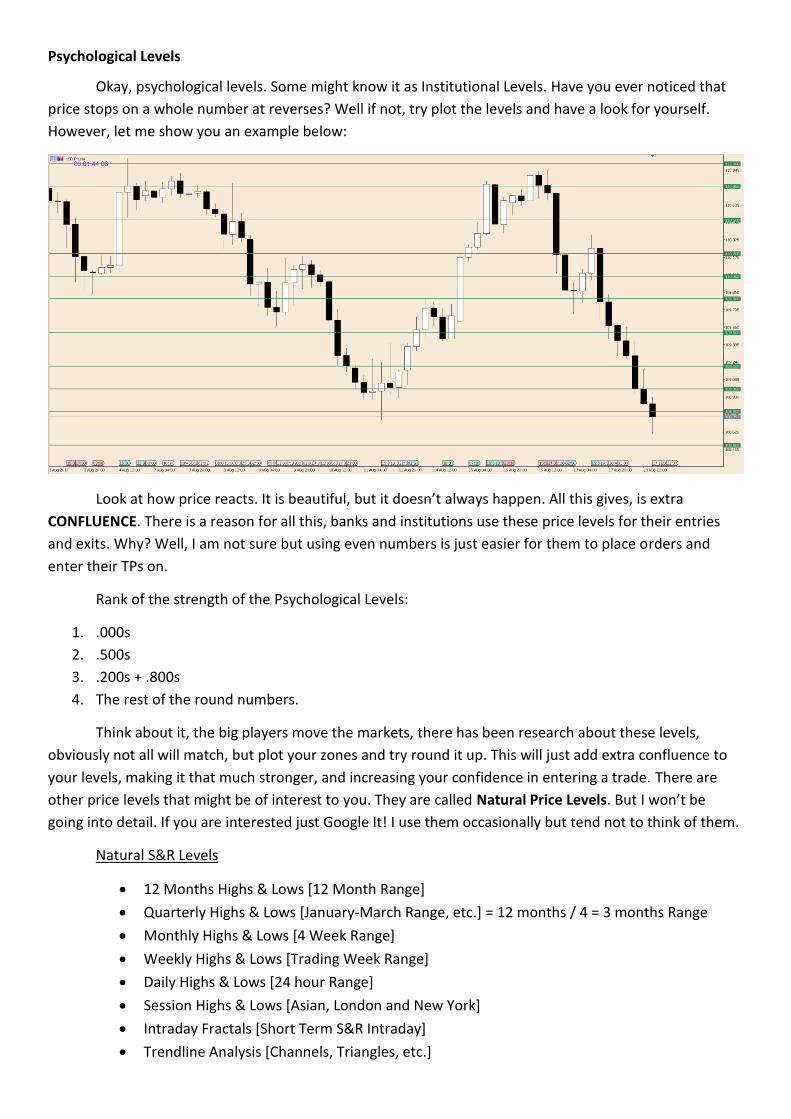
Okay, psychological levels. Some might know it as Institutional Levels. Have you ever noticed that
price stops on a whole number at reverses? Well if not, try plot the levels and have a look for yourself.
However, let me show you an example below:
Look at how price reacts. It is beautiful, but it doesn’t always happen. All this gives, is extra
CONFLUENCE. There is a reason for all this, banks and institutions use these price levels for their entries
and exits. Why? Well, I am not sure but using even numbers is just easier for them to place orders and
enter their TPs on.
Rank of the strength of the Psychological Levels:
1. .000s
2. .500s
3. .200s + .800s
4. The rest of the round numbers.
Think about it, the big players move the markets, there has been research about these levels,
obviously not all will match, but plot your zones and try round it up. This will just add extra confluence to
your levels, making it that much stronger, and increasing your confidence in entering a trade. There are
other price levels that might be of interest to you. They are called Natural Price Levels. But I won’t be
going into detail. If you are interested just Google It! I use them occasionally but tend not to think of them.
Natural S&R Levels
• 12 Months Highs & Lows [12 Month Range]
• Quarterly Highs & Lows [January-March Range, etc.] = 12 months / 4 = 3 months Range
• Monthly Highs & Lows [4 Week Range]
• Weekly Highs & Lows [Trading Week Range]
• Daily Highs & Lows [24 hour Range]
• Session Highs & Lows [Asian, London and New York]
• Intraday Fractals [Short Term S&R Intraday]
• Trendline Analysis [Channels, Triangles, etc.]
My Favorite Set Ups + Entries + SLs +TPs
I have a few favourite set ups and I will show photo examples of them. My favourite set ups are:
• Double Top / Double Bottom
• Ranging Box Breakout
• Head and Shoulders
If you don’t know any of these formations and how they are supposed to look like, Google, BabyPips, or Naked Forex it. I have a few other set ups I look for, but they are more advanced. These are my favourite and the simplest.
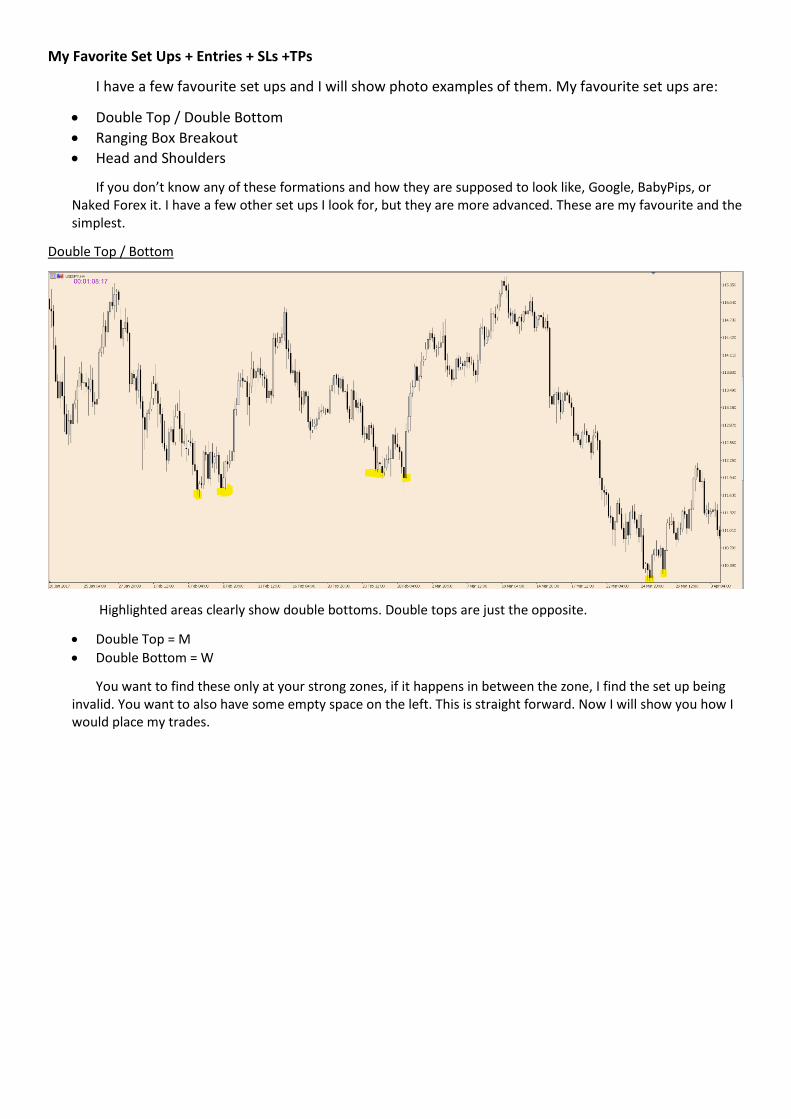
Double Top / Bottom
Highlighted areas clearly show double bottoms. Double tops are just the opposite.
• Double Top = M
• Double Bottom = W
You want to find these only at your strong zones, if it happens in between the zone, I find the set up being invalid. You want to also have some empty space on the left. This is straight forward. Now I will show you how I would place my trades.
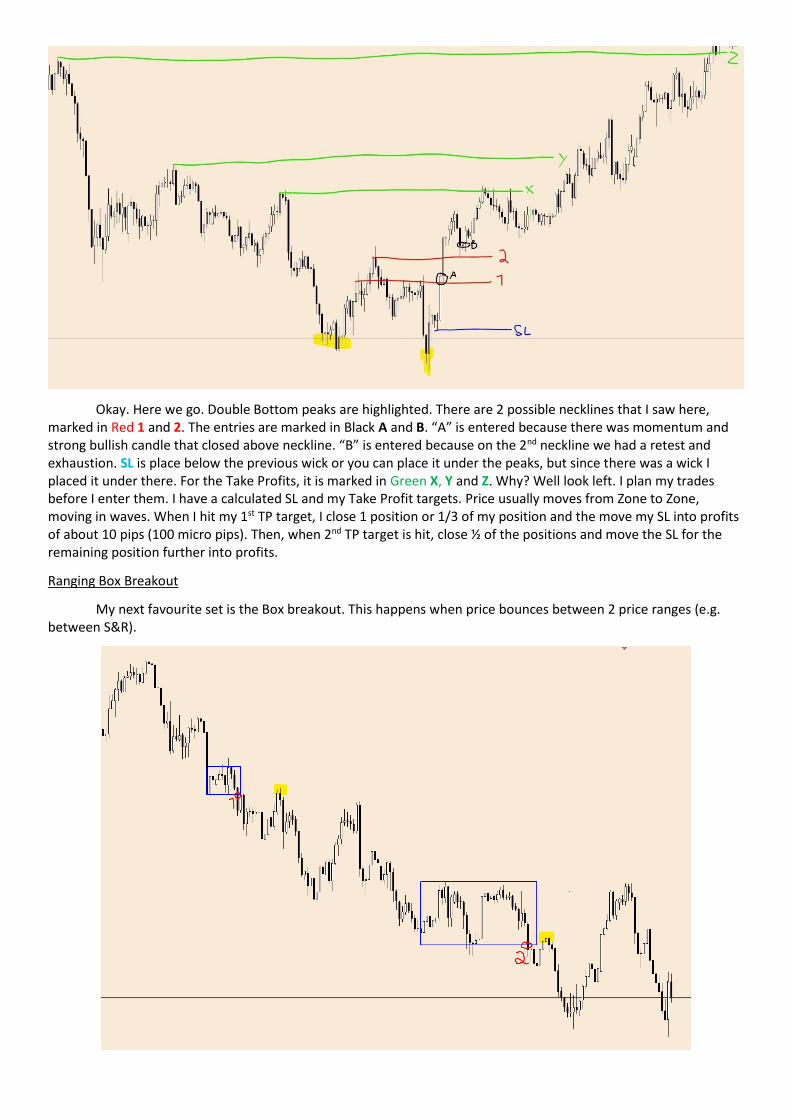
Okay. Here we go. Double Bottom peaks are highlighted. There are 2 possible necklines that I saw here, marked in Red 1 and 2. The entries are marked in Black A and B. “A” is entered because there was momentum and strong bullish candle that closed above neckline. “B” is entered because on the 2nd neckline we had a retest and exhaustion. SL is place below the previous wick or you can place it under the peaks, but since there was a wick I placed it under there. For the Take Profits, it is marked in Green X, Y and Z. Why? Well look left. I plan my trades before I enter them. I have a calculated SL and my Take Profit targets. Price usually moves from Zone to Zone, moving in waves. When I hit my 1st TP target, I close 1 position or 1/3 of my position and the move my SL into profits of about 10 pips (100 micro pips). Then, when 2nd TP target is hit, close ½ of the positions and move the SL for the remaining position further into profits.
Ranging Box Breakout
My next favourite set is the Box breakout. This happens when price bounces between 2 price ranges (e.g. between S&R).
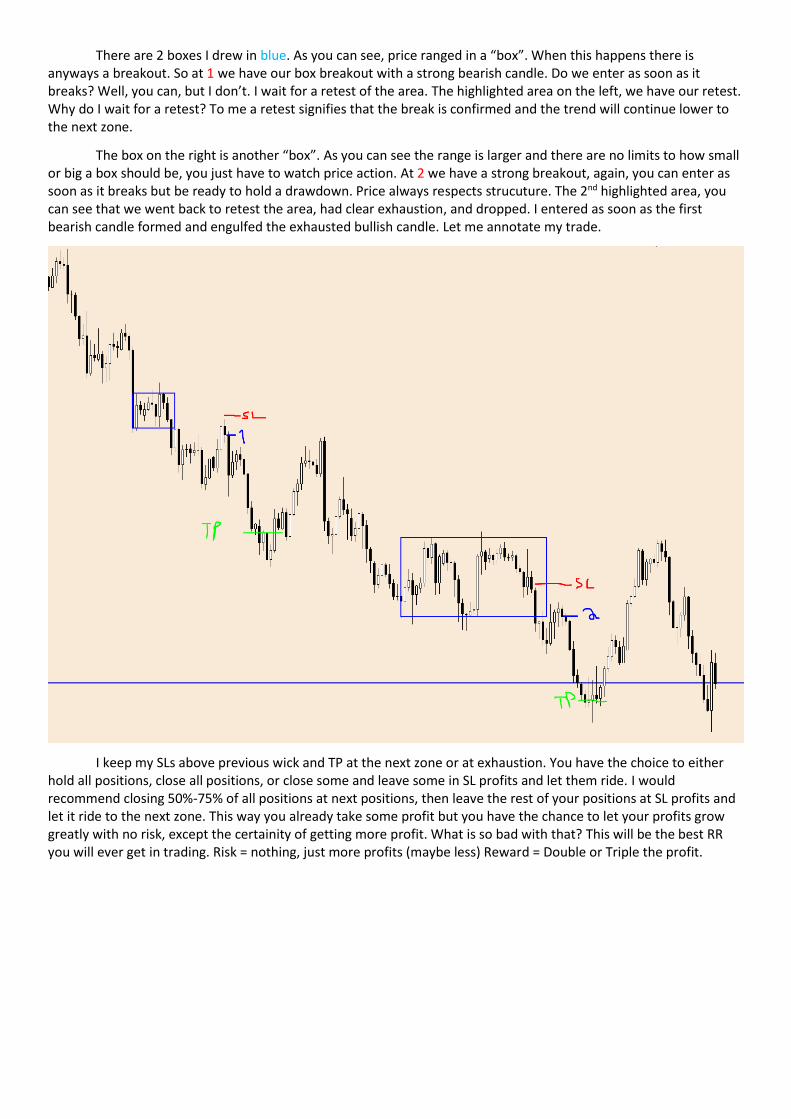
There are 2 boxes I drew in blue. As you can see, price ranged in a “box”. When this happens there is anyways a breakout. So at 1 we have our box breakout with a strong bearish candle. Do we enter as soon as it breaks? Well, you can, but I don’t. I wait for a retest of the area. The highlighted area on the left, we have our retest. Why do I wait for a retest? To me a retest signifies that the break is confirmed and the trend will continue lower to the next zone.
The box on the right is another “box”. As you can see the range is larger and there are no limits to how small or big a box should be, you just have to watch price action. At 2 we have a strong breakout, again, you can enter as soon as it breaks but be ready to hold a drawdown. Price always respects strucuture. The 2nd highlighted area, you can see that we went back to retest the area, had clear exhaustion, and dropped. I entered as soon as the first bearish candle formed and engulfed the exhausted bullish candle. Let me annotate my trade.
I keep my SLs above previous wick and TP at the next zone or at exhaustion. You have the choice to either hold all positions, close all positions, or close some and leave some in SL profits and let them ride. I would recommend closing 50%-75% of all positions at next positions, then leave the rest of your positions at SL profits and let it ride to the next zone. This way you already take some profit but you have the chance to let your profits grow greatly with no risk, except the certainity of getting more profit. What is so bad with that? This will be the best RR you will ever get in trading. Risk = nothing, just more profits (maybe less) Reward = Double or Triple the profit.
Head and Shoulders
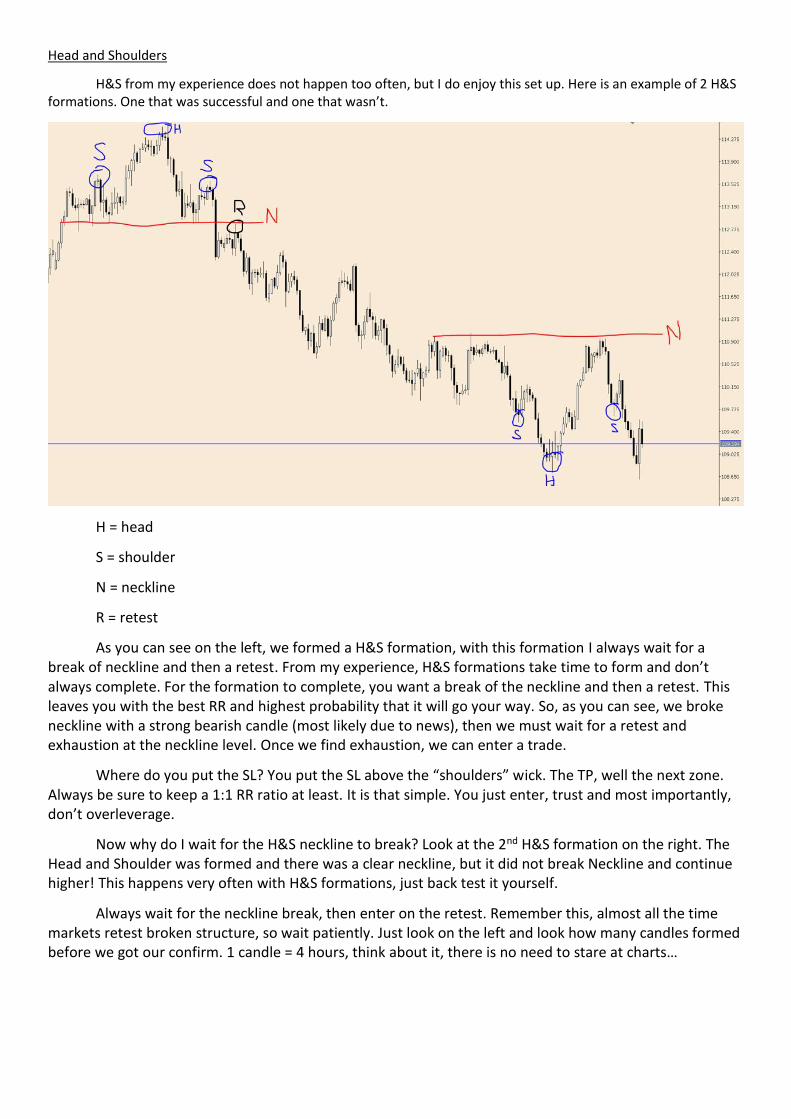
H&S from my experience does not happen too often, but I do enjoy this set up. Here is an example of 2 H&S formations. One that was successful and one that wasn’t.
H = head
S = shoulder
N = neckline
R = retest
As you can see on the left, we formed a H&S formation, with this formation I always wait for a break of neckline and then a retest. From my experience, H&S formations take time to form and don’t always complete. For the formation to complete, you want a break of the neckline and then a retest. This leaves you with the best RR and highest probability that it will go your way. So, as you can see, we broke neckline with a strong bearish candle (most likely due to news), then we must wait for a retest and exhaustion at the neckline level. Once we find exhaustion, we can enter a trade.
Where do you put the SL? You put the SL above the “shoulders” wick. The TP, well the next zone. Always be sure to keep a 1:1 RR ratio at least. It is that simple. You just enter, trust and most importantly, don’t overleverage.
Now why do I wait for the H&S neckline to break? Look at the 2nd H&S formation on the right. The Head and Shoulder was formed and there was a clear neckline, but it did not break Neckline and continue higher! This happens very often with H&S formations, just back test it yourself.
Always wait for the neckline break, then enter on the retest. Remember this, almost all the time markets retest broken structure, so wait patiently. Just look on the left and look how many candles formed before we got our confirm. 1 candle = 4 hours, think about it, there is no need to stare at charts…
Risk Management
Risk management is the most important part to Forex. Without accepting the risk before you place
a trade you will already be emotionally attached to the money $$$. Forex is a game of probabilities and
market structure and price action will help you to greatly increase your probability of having a successful
trade. What many traders go through, including me, is placing a trade that is overleveraged either for your
account or your emotions. Meaning, that you are either using lot sizes too large for your account, which
risks you blowing your account completely (has happened to me), or opening a lot size where when you
are in profits you are feeling euphoria and when you are in a drawdown you panic or are stressed out. This
can easily be fixed by calculating how much you want to risk prior to entering a trade, and I will provide a
simple formula for all of you.
Emotions are a key part of Forex, and Forex is 90% psychological and 10% technical, and taking out
the emotion aspect is the hardest thing a trader will face. I personally still struggle with this. However, how
I overcome this, is by simply using this formula.
Risk Management Formula:
• Lot Size = (Risk $$$) / (Micro pips SL)
For Example:
Account Size: $1,000
Risk Tolerance per Trade: 2%
Trade SL: 250 micro pips or 25 standard pips
Lot Size: X
X = (2% of 1,000) / 250
X = 20 / 250
X = 0.08
So, the lot size you should be using is 0.08. This means on your $1,000 account you are only risking
$20 on the trade you are planning to enter with a 0.08 lot size.
This does not mean you must risk 2% per trade, this completely depends on you. You should be
comfortable with the loss, because when I place a trade in the market, I see it as money already lost. So, if
you are comfortable with losing that money, this will allow you to trust in your analysis, instead of getting
emotionally attached to the money you will lose and cloud your judgement.
In addition, the most important part for me is moving your SL into profits. This reduce your risk to
0% of the account and allows you to enter another set up with your set designated risk. Plus, any sudden
spikes in price against you prevents any loss on your account.
Cabin, but what if it hits your SL in profits and goes your way? My reply usually is, well it hits your SL
and goes your way. Did you lose money? No. Did you make money? Yes, a small amount. What matters is
that you didn’t lose money. Blues > Reds. Plus, later you can just wait for market structure to give you
confirms and enter again.
In terms of moving your SL into profits, with practice and understanding of the full picture of what
the market wants to do, you will get better at knowing how to move your SL further into profits without
getting hit with retracement. However, there will always be those times your SL in profits gets hit and it
continues your way. If it does, close your charts, come back later in the day, see what price wants to do
and plan your next attack.
Tips of What to Do When You Feel Lost
I have a few people contact me asking me for advice on what to do when they feel lost or they just
simply have no idea what they are doing in Forex anymore. The simplest solution is to simplify and keep
simplifying until it makes sense again. However, sometimes your eyes may feel dirty (stick with me, I’ll
explain), then you will need go through some eye cleaning. Dirty eyes, mean when you just are seeing too
many things, overcomplicating everything, unsure anymore with your entries and what is happening in the
market. Eye cleaning helps you get rid of that issue, the steps are explained below.
Eye Cleaning:
1. To plot major support and resistance + trendlines, then you leave it.
2. Come back to check the charts once or twice daily (morning + evening [any time zone])
3. Analyse to see what has happened (watching reversal points and reaction to your major zones you
plotted)
4. Watch it for a week or two.
5. DON’T PLACE ANY TRADES on LIVE or DEMO!
o Any trades you put in will get you emotional attached.
o I recommend paper trading.
▪ Write down your trade details in a notebook or Microsoft Word.
▪ Then set it aside and check back when you come to check the charts for updates on
your levels.
This works if you plan to scalp as well, but you should check charts more often (usually every 4
hours), and if needed to replot S&Rs and trendlines.
However, in terms of swinging, this will allow you to understand that “good things take time!”, sometimes
hours or days or weeks! You will understand that swinging really takes patience and for market structure
to form.
For example, in the examples above, you see a double top, and you can enter early when you see
rejection at the 2nd peak, but after the neckline is broken, there will be a retest (or last kiss) or the broken
support, there always is! Well, most of the time, the market like to keep its structure and retests are very
common.
This exercise will also teach you to not have FOMO. If the double top neckline is broken, of course you
may enter if it is in momentum, but remember market structure needs to be kept, so a retest will come!
There are 2 options for a trader when any structure is broken:
1. Wait for a retest of the broken structure (you will see exhaustion through candlestick patterns).
• This allows you to have the best RR
• It will give you a strong confirm that we will continue in that direction. Usually creating a
minor HH, HL, LH, LL.
2. Enter as soon as it is broken and either take profit at next major S&R or move SL into profits.

NOTE:
Markets range 80% of the time and trend 20% of the time. Be patient and let the trade come to you.
I will be adding continuation patterns to my next PDF and create a more in detailed Swing PDF but for now
this is it.