
BEFORE THE PUBLIC UTILITIES COMMISSION OF THE … · 2017-03-24 · BEFORE THE PUBLIC UTILITIES...
52
BEFORE THE PUBLIC UTILITIES COMMISSION OF THE STATE OF CALIFORNIA Order Instituting Rulemaking to Continue Implementation and Administration of California Renewables Portfolio Standard Program. (U 39 E) Rulemaking 08-08-009 (Filed August 21, 2008) DRAFT 2010 TRANSMISSION RANKING COST REPORT OF PACIFIC GAS AND ELECTRIC COMPANY (U 39-E) FOR RENEWABLES PORTFOLIO STANDARD PROCUREMENT CHARLES R. MIDDLEKAUFF M. GRADY MATHAI-JACKSON Law Department PACIFIC GAS AND ELECTRIC COMPANY Post Office Box 7442 San Francisco, CA 94120 Telephone: (415) 973-3744 Facsimile: (415) 973-5520 E-mail: [email protected] Attorneys for PACIFIC GAS AND ELECTRIC COMPANY January 20, 2010
Transcript of BEFORE THE PUBLIC UTILITIES COMMISSION OF THE … · 2017-03-24 · BEFORE THE PUBLIC UTILITIES...

BEFORE THE PUBLIC UTILITIES COMMISSION OF THE STATE OF CALIFORNIA
Order Instituting Rulemaking to Continue Implementation and Administration of California Renewables Portfolio Standard Program.
(U 39 E)
Rulemaking 08-08-009 (Filed August 21, 2008)
DRAFT 2010 TRANSMISSION RANKING COST REPORT OF PACIFIC GAS AND ELECTRIC COMPANY (U 39-E)
FOR RENEWABLES PORTFOLIO STANDARD PROCUREMENT CHARLES R. MIDDLEKAUFF
M. GRADY MATHAI-JACKSON
Law Department PACIFIC GAS AND ELECTRIC COMPANY Post Office Box 7442 San Francisco, CA 94120 Telephone: (415) 973-3744 Facsimile: (415) 973-5520 E-mail: [email protected] Attorneys for PACIFIC GAS AND ELECTRIC COMPANY
January 20, 2010
BEFORE THE PUBLIC UTILITIES COMMISSION OF THE STATE OF CALIFORNIA
Order Instituting Rulemaking to Continue Implementation and Administration of California Renewables Portfolio Standard Program.
Rulemaking 08-08-009 (Filed August 21, 2008)
DRAFT 2010 TRANSMISSION RANKING COST REPORT OF PACIFIC GAS AND ELECTRIC COMPANY (U 39-E)
FOR RENEWABLES PORTFOLIO STANDARD PROCUREMENT
Pacific Gas and Electric Company (PG&E) files the attached report, entitled “2010 Draft
Transmission Ranking Cost Report Of Pacific Gas and Electric Company” in compliance with
the Amended Scoping Memo and Ruling of Assigned Commissioner Regarding 2010 RPS
Procurement Plans dated November 2, 2009.
Respectfully submitted,
CHARLES R. MIDDLEKAUFF M. GRADY MATHAI-JACKSON By: /s/ M. GRADY MATHAI-JACKSON Pacific Gas and Electric Company Post Office Box 7442 San Francisco, CA 94120 Telephone: (415) 973-3744 Facsimile: (415) 973-5520 E-Mail: [email protected]
Attorneys for PACIFIC GAS AND ELECTRIC COMPANY
January 20, 2010

1
DRAFT 2010 TRANSMISSION RANKING COST REPORT OF PACIFIC GAS AND ELECTRIC COMPANY
I. INTRODUCTION
In support of California’s Renewable Portfolio Standard (“RPS”) Program, PG&E has initiated its renewable resource procurement process for 2010. This effort included sending a letter on November 13, 2009, requesting initial information for its 2010 RPS solicitation process. Following the practice used and approved for prior Transmission Ranking Cost Reports (“TRCR”), PG&E used the information it received in response to this letter to guide its selection of the clusters to be studied in the development of its 2010 TRCR.
This 2010 TRCR is based on the Methodology adopted in Decision (D.)04-06-013 and further addressed in D.05-07-040 for the development and consideration of transmission costs considered in the selection of resources to meet the RPS.1/
This Methodology estimates the capital costs of upgrades to transmission facilities that would be needed to deliver power from potential renewable energy areas, and thus estimates the transmission cost for ranking bids submitted in response to PG&E’s 2010 RPS procurement solicitation.
In reviewing the latest load forecast, resources projection, and the anticipated network topology, PG&E has determined that there are no significant changes to these input parameters compared to those used in the 2009 TRCR. Therefore, changes to the power flows would not be significant. Therefore, only updates for impacted clusters were needed for the 2010 TRCR. This is further discussed in Section D below.
A. The Purpose of the TRCR is to Support the RPS Solicitation Process.
The TRCR is intended solely to provide information used in ranking RPS bids in the RPS procurement solicitation process. The TRCR estimates the cost of accepting deliveries from renewable resource projects over the utility transmission system; this cost estimate is used only as one factor in the comparison of solicited bids. The estimates in the 2010 TRCR, as with prior TRCRs, are neither intended nor calculated for any other purpose and must not be relied upon for any other purpose.
- Potential RPS bidders should use the information regarding expected transmission upgrades contained in the TRCR in developing their bids in response to the 2010 RPS procurement solicitation from PG&E.
- PG&E will use the transmission cost estimates in the 2010 TRCR as a factor in evaluating and ranking the bids it receives through the 2010 RPS solicitation.
1/ Initially, the RPS requires certain retail sellers of electricity to increase their sales of electricity from
renewable energy by at least 1% per year, so that renewable resources would serve at least 20% of retail sales by 2017 at the latest. In SB 107, enacted by the California Legislature in 2006, that goal was accelerated to 20% of retail sales from renewable energy deliveries by 2010.

2
This evaluation and ranking process will include calculation of transmission cost bid adders and the assignment of these adders to specific RPS projects, to allow PG&E to determine the combination of projects that will meet its approved renewable procurement goals in a least-cost, best-fit manner2.
B. Additional Information Is Needed to Determine Project-Specific Costs.
The estimates of transmission costs in this TRCR will not be definitive, and will not establish the ultimate cost of connecting any given renewable resource to the transmission grid. Generation developers seeking to interconnect to the PG&E transmission system must apply for interconnection with the CAISO, in accordance with the requirements of the CAISO tariff (the “CAISO Tariff”), as approved by the Federal Energy Regulatory Commission (“FERC”). These requirements currently include participation in the CAISO’s Feasibility Study, System Impact Study, and Facilities Study (“SIS/FS”) process. The SIS/FS process is intended to accurately identify transmission network upgrades needed to accommodate the added generation.
Many potential renewable resource projects submitting bids into the 2010 RPS solicitation process will not have initiated or completed the CAISO SIS/FS process, and therefore will not have the projected cost information that results from that process. In the absence of complete interconnection cost information for each bid, the TRCR provides an acceptable basis for comparing the relative interconnection costs associated with those bids. That is, although the TRCR does not provide final interconnection cost data, it does provide sufficient information to allow PG&E to consider the relative transmission cost of each resource being bid, as part of the least-cost best-fit analysis needed to rank and select renewable resources for development.
C. Inputs to the Report Are Generally A Matter of Record.
This TRCR identifies and provides estimated cost information regarding transmission upgrades needed for potential RPS projects, based on the following inputs:
• Conceptual transmission studies submitted previously pursuant to D.04-06-010 and D.05-07-040;
• Other conceptual transmission studies; and
• System Impact Studies and Facilities Studies prepared for projects that have initiated the CAISO interconnection process.
D. Methodological Parameters of the TRCR.
A mentioned earlier, the 2010 TRCR is an update of the 2009 TRCR. Accordingly, this subsection primarily describes the methodology used to develop the 2009 TRCR and concludes by noting the specific adjustments made for the 2010 TRCR.
2/ Other commercial arrangements may be used in bid evaluation, as specified in PG&E’s draft 2010 RPS
Solicitation Protocol However, such alternative arrangements are beyond the scope of the TRCR.

3
As in the 2004, 2005, 2006, 2007 and 2008 TRCRs, which were filed on June 23, 2004, August 3, 2005, March 15, 2006, November 8, 2006 and September 7, 2008, respectively, the cost estimates presented in the 2009 TRCR are the result of best efforts to estimate strategies that would be used to accommodate potential renewable resources. These strategies are based on reconnaissance-type information and rely extensively on engineering judgment, which in turn is tempered by experience and informed by limited, focused usage of the power flow program. Consistent with the earlier screening level studies3, this TRCR is based on the following considerations:
Scope.
- The assessment covers transmission Network Upgrades from the first point of interconnection of the renewable resources to PG&E’s existing transmission system towards the load. Direct Assignment Facilities4/ or “Gen-ties” are not covered.
Proxy Facilities.
- As in the previous TRCRs, transmission cost estimates are based on proxy facilities that could mitigate potential congestion due to the addition of potential renewable resources. In developing the proxy facilities, results from other studies previously published were also used where appropriate (such as PG&E’s Path 15 Rating Studies for power flows in the South to North direction, the Tehachapi Collaborative Study Group Reports filed by Southern California Edison Company (“SCE”) on March 16, 2005 and April 17, 2006, and PG&E’s 2009 Electric Grid Expansion Plan.).
Base Cases.
- For the 2009 TRCR, the 2013 Summer Peak and Summer Off Peak base cases were developed from the power flow cases that were prepared for the 2008 PG&E Area Assessment Studies to develop PG&E’s 2008 Transmission Expansion Plan and represent the transmission network (including transmission projects approved by CAISO or PG&E), load forecast (1-in-5 year adverse weather system peak load for the Summer Peak base case and the summer off peak load for the Summer Off Peak base case), and expected generation retirements for year 2013. These base cases were reviewed and approved by the CAISO. These base cases were then modified to reflect the transmission projects approved as of September 2008, new generation projects that have completed the SIS/FS process, transmission projects approved by the generation developers through completed SIS/FS processes, and the results of PG&E’s 2004, 2005, 2006, 2007 and 2008 Renewables Solicitations as of September 2008. For the 2013 Summer Off Peak
3/ In the 2003 solicitation for information, the utilities were ordered to provide screening level studies to
developers who would pay for them. No developer has requested a screening level study since the 2003 Solicitation.
4/ “Direct Assignment Facilities” are transmission facilities necessary to physically and electrically interconnect a new facility to the CAISO Controlled Grid. CAISO Tariff § 5.7.5.

4
base case, the Path 15 south-north flow was modeled at its WECC Accepted Path Rating of 5,400 MW.
- In developing the 2010 TRCR, PG&E reviewed the latest base cases (developed in 2009) used in its annual assessment studies conducted under the CAISO Planning Process. Comparison of the 2014 and the 2013 (used in the 2009 TRCR study) On-peak power flow cases are as follows:
Major Assumptions 2014 On-peak (to
be used for 2010 TRCR)
2013 On-peak case (used in the 2009
TRCR)
Difference
Loads:
Bay Area5
Non Bay Area North
Non Bay area South
9489 MW
9737 MW
8148 MW
9256 MW
9983 MW
7939 MW
233 MW
-90 MW
209 MW
Generation:
Bay Area
Non Bay Area North
Non Bay Area South
5878 MW
10131 MW
12611 MW
6317 MW
10263 MW
11218 MW
-439 MW
-117 MW
1394 MW
New renewables With completed cost estimate in addition to the 2009 TRCR
Bay Area
Non Bay Area North
Non Bay Area South
0 MW
120 MW
230 MW
--
--
--
0 MW
120 MW
230 MW
PG&E also reviewed the 2014 power flow cases for transmission upgrades expected to be operational by 2014 and compared that with the transmission upgrades expected for 2013 and found no significant changes between the two cases.
It can be seen that the only significant change is the generation and new renewables located in the non-Bay South. Therefore, only updates to the 2009 TRCR will be needed for the impacted clusters located in Non Bay Area South, specifically, the Carrizo Plains, Midway, Panoche and Gates clusters. Also,
5/ For the purpose of this TRCR, “Bay Area” comprises of East Bay, Diablo, Peninsula, Mission, De Anza,
San Jose, areas; “Non Bay North” comprises of Humboldt, North Coast, North Bay, North Valley, Sacramento and Stockton areas; and “Non Bay South” comprises of Stanislaus, Yosemite, Fresno, Kern, Central Coast, Los Padres areas.

5
because the additional renewables in Non Bay South are predominately solar resources, PG&E does not expect any changes to the 2009 off-peak TRCR.
Renewable Resource Potential.
- The potential renewable resources assumed in the study are consistent with the results of the Renewable Resources Development Report (“RRDR”) published by the California Energy Commission (“CEC”) on September 30, 2003, and augmented based on the draft result of the CEC’s Strategic Value Analysis, published in 2005. These CEC results have been further augmented based on data received by PG&E from potential renewables developers in response to PG&E’s solicitations for information conducted in 2003 through 2009.
Clusters.
- The PG&E study performed to develop the TRCR assumed that energy from the potential renewable resources would be delivered to locations close to one of the following “clusters”: Bellota, Caribou, Carrizo Plains, Cortina, Cottonwood, Delta Metering Station, Fulton, Gates, Gregg, Helm, Humboldt, Los Banos, Metcalf, Midway, Morro Bay, Newark, Panoche, Pit 1, Rio Oso, Round Mountain, Stagg, Summit Metering Station, Table Mountain, Tesla, Vaca Dixon, and Wilson Substations. Each of these clusters is depicted geographically at Exhibit 1.
Renewable Resources Scenarios.
- In accordance with D. 04-06-013, PG&E’s application of the Methodology investigated the proxy facilities needed using two scenarios: 1) assuming PG&E would be the purchaser of energy from renewable resources located within and outside PG&E’s service territory; and 2) assuming PG&E would transmit the energy from renewable resources located either in PG&E’s service territory, or north and east of PG&E’s service territory, to purchasers south of PG&E’s service territory.
Associated Clusters Assumed When PG&E is the Assumed Purchaser.
- If PG&E is the assumed purchaser of renewable resources located north of PG&E’s service territory, the associated potential cluster would be PG&E’s Round Mountain Substation. For generation projects located east of PG&E’s service territory, the associated potential cluster would be PG&E’s side of Summit Metering Station. For projects located south of PG&E’s service territory, the associated potential cluster would be PG&E’s Midway Substation.
Associated Clusters Assumed When PG&E is not the Assumed Purchaser.
- If SCE, San Diego Gas & Electric Company (“SDG&E”) or any other entity south of PG&E’s service territory is the purchaser, and the renewable resources are located north of or in PG&E’s service territory, PG&E assumes that the renewable resources will be transmitted from the associated clusters to PG&E’s Midway Substation, the point of delivery out of PG&E’s service territory.

6
PG&E’s Transmission Ranking Cost from the cluster associated with the renewable resource location should be used by SCE and SDG&E, as appropriate, for complete evaluation.
Reactive Support.
- Voltage (reactive) support is required to reliably transmit energy from generation resources to load. The reactive support needed is in addition to the reactive power produced by the generators. To be effective, voltage support devices would be installed at various strategic locations, which are generally at or near the load centers. The estimated levels of voltage support used in the TRCR are based on results of past studies, and are technology-neutral, assuming that all renewable generators are capable of producing reactive power typical of synchronous generators.
System Reliability.
- The PG&E study performed to develop the TRCR assumes that each renewable resource connected in response to PG&E’s resource solicitation would do its share to maintain existing system reliability by operating within applicable nomograms, such as the California-Oregon Interconnection (“COI”) Nomogram, and by participating in existing special protection schemes, such as the Path 15 Remedial Action Scheme.
E. Application of the Transmission Ranking Cost Study to RPS Bid Selection.
1. Use of Clusters.
The PG&E study performed to develop the TRCR uses clusters to provide a basis for grouping RPS bids solely for purposes of comparison. Any given resource may ultimately be physically connected to points near, but not necessarily at, the cluster assumed by the study. Consistent with Attachment A of D.04-06-013, PG&E has developed Transmission Ranking Costs based on potential transmission congestion, the associated proxy transmission network upgrades, and the associated capital costs that may be expected to accommodate each cluster of renewable resources. For each cluster, PG&E has identified various levels of possible additional transmission capacity and a projected estimate of related costs.6/ Level 1 reflects the available transmission capacity, taking into account all approved reliability and economic transmission projects, as well as upgrades planned for generation projects in the CAISO interconnection queue, based on completed SIS/FS processes. The next Level and subsequent Levels reflect the next most cost-effective proxy network upgrade(s). The number of Levels depends on the number of proxy network upgrades reasonably expected to be necessary to accommodate the anticipated total amount of renewable resources in each cluster.
6/ Costs are equal to the total capital cost of the proxy transmission network upgrade project and are stated in
2008 constant dollars. Net present value (“NPV”) amounts of each alternative would differ.

7
2. Overview of Tables.
The Transmission Ranking Costs (“TRC”) are summarized in Tables 1 and 2. Table 1 presents calculations using PG&E as the presumed purchaser of the renewable power. Table 2 presents calculations assuming that SCE or SDG&E (or other entities south of PG&E’s service territory) is the purchaser. In each table, the Transmission Ranking Costs have been separated into sections that would broadly correspond to system conditions in peak and off-peak periods, so they can be used in least cost-best fit bid evaluation for super-peak, peak and shoulder periods and night periods.7/ The separation of transmission costs into these periods may allow a potential bidder to take into account potential transmission congestion, and accordingly structure the optimal generation profile for its bid or reflect any potential curtailment it might want to include in its bid. Tables 5-8 are supporting information for the TRCs presented in Tables 1 and 2. Tables 5-8 show the limiting transmission facilities and the associated proxy transmission facilities that produced the TRCs in Tables 1 and 2.
As expected, a number of network facilities requiring upgrades are common to several clusters, depending on the levels of generation added. These common proxy Network Upgrades provide some opportunity for refining the bid ranking, once the bids have been received and analyzed. Some of the common network facilities that are identified as limiting facilities are:
Bellota – Gregg 230 kV lines
Westley – Los Banos 230 kV lines
Table Mountain - Vaca-Dixon 500 kV line
Los Banos – Gates – Midway 500 kV line
Some facilities, which were identified as subject to congestion in the 2007 and 2008 TRCR, are no longer so identified due to transmission upgrades that were proposed in PG&E’s 2006 and 2007 Expansion Plans and that were subsequently approved. These facilities include:
Table Mountain – Colgate – Rio Oso 230 kV lines
Vaca Dixon - Shiloh-Contra Costa 230 kV line
Vaca Dixon – Parkway 230 kV line
7/ Definitions:
Super-Peak (5x8) = HE (Hours Ending) 13 - 20, Monday - Friday (except North American Electric Reliability Corporation (“NERC”) holidays). Shoulder = HE 7 - 12, 21 and 22, Monday - Friday (except NERC holidays); and HE 7 - 22 Saturday, Sunday and all NERC holidays. Night (7x8) = HE 1 - 6, 23 and 24 all days (including NERC holidays). NERC (Additional Off-Peak) Holidays include: New Year’s Day, Memorial Day, Independence Day, Labor Day, Thanksgiving Day, and Christmas Day. Three of these days, Memorial Day, Labor Day, and Thanksgiving Day occur on the same day each year. Memorial Day is the last Monday in May; Labor Day is the first Monday in September; and Thanksgiving Day is the last Thursday in November. New Year’s Day, Independence Day, and Christmas Day, by definition, are predetermined dates each year. However, in the event they occur on a Sunday, the “NERC Additional Off-Peak Holiday” is celebrated on the Monday immediately following that Sunday. However, if any of these days occur on a Saturday, the “NERC Additional Off-Peak Holiday” remains on that Saturday.
8
Vaca Dixon – Tulucay 230 kV line
PG&E will continue to identify transmission projects that are needed for multiple purposes (e.g.,, transmission reinforcements that would be needed to maintain system reliability and to accommodate renewable resources). PG&E has submitted a number of proposed projects to the CAISO for the CAISO 2010 Expansion Plan in November 2009. As transmission projects identified in the 2010 plan have not yet been approved, they are not considered in the PG&E study used to generate this TRCR. However, if they are approved by the CAISO and PG&E Management before the 2010 RPS bids are short-listed, the added transmission capacity associated with these new transmission projects will be assumed to be available for purposes of bid evaluation.

* Static VAR Compensator (SVC) is used as a proxy for voltage support devices required. The size of the SVC at each Level assumes the capacity in each level will be fully utilized. However, since addition of voltage support devices is less “lumpy” than other transmission facilities, it is separately listed so that the size, and hence, cost can be prorated based on the size of the resource bid.
** The maximum potential generation for these levels assumes that it is cost effective to increase pumping at Helms Pump Storage Plant (PSP) during off-peak (night) periods using the new generation at these clusters. In addition, for the off peak (night) hours for the months of June through September, the maximum MW generation in each level could be increased by another 300 MW when maximum pumping at Helms PSP is likely.
*** Carrying charges in this table are for illustrative purposes only. The actual carrying charge for an individual offer will depend on specifics in the offer submitted.
9
Table 1
2010 Transmission Ranking Cost for Study Year 2014 for Potential Generation Assuming PG&E is the Purchaser
Peak and Shoulder Night
Year Round Year Round
Cost of Proxy Network Upgrades to accommodate
MW Level of Potential Generation ($ millions in
2008 dollars)
Annual Carrying Charges***
($ millions in 2008 dollars)
Cost of Proxy Network Upgrades to accommodate
MW Level of Potential Generation ($ millions in
2008 dollars)
Annual Carrying Charges***
($ millions in 2008 dollars)
Substation Associated With Cluster of Potential Generation Level8
Maximum MW of
Potential Generation
In each Level
Proxy Voltage Support
Devices*
Other Proxy Transmission
upgrades
Based on 10 year contract
life
Based on 20 year contract
life
Maximum MW of
Potential Generation
In each Level
Proxy Voltage Support
Devices*
Other Proxy Transmission
upgrades
Based on 10 year contract
life
Based on 20 year contract
life
1 1000 70 0 17 13 400 28 0 7 5 2 500 35 28 16 12
Bellota 230 kV
3 100 7 15 5 4
1 0 0 0 0 0 150 11 0 3 2 2 50 4 470 116 89 650 46 38 20 16 3 450 32 38 17 13 200 14 46 15 11
Caribou 230 kV
4 500 35 46 20 15
1 0 0 0 0 0 0 0 0 0 0 Carrizo Plains 2 310 22 156 44 33 500 35 1156 292 223
1 350 25 0 6 5 300 21 0 5 4 2 450 32 40 18 13 500 35 40 18 14
Cortina 230 kV
3 200 14 59 18 14 200 14 59 18 14
1 0 0 0 0 0 850 60 0 15 11 2 1150 81 298 93 71 250 18 46 15 12 3 350 25 46 17 13 200 14 24 9 7
Cottonwood 230 kV
4 200 14 298 76 58
1 0 0 0 0 0 0 0 0 0 0 Delta Metering Station 2 500 35 318 86 66 500 35 318 86 66
8/ See Attachment A, D.04-06-013 at page A-5, which established the methodology for the TRCR, including definitions of the Levels
used in these Tables.

* Static VAR Compensator (SVC) is used as a proxy for voltage support devices required. The size of the SVC at each Level assumes the capacity in each level will be fully utilized. However, since addition of voltage support devices is less “lumpy” than other transmission facilities, it is separately listed so that the size, and hence, cost can be prorated based on the size of the resource bid.
** The maximum potential generation for these levels assumes that it is cost effective to increase pumping at Helms Pump Storage Plant (PSP) during off-peak (night) periods using the new generation at these clusters. In addition, for the off peak (night) hours for the months of June through September, the maximum MW generation in each level could be increased by another 300 MW when maximum pumping at Helms PSP is likely.
*** Carrying charges in this table are for illustrative purposes only. The actual carrying charge for an individual offer will depend on specifics in the offer submitted.
10
Peak and Shoulder Night Year Round Year Round
Cost of Proxy Network Upgrades to accommodate
MW Level of Potential Generation ($ millions in
2008 dollars)
Annual Carrying Charges***
($ millions in 2008 dollars)
Cost of Proxy Network Upgrades to accommodate
MW Level of Potential Generation ($ millions in
2008 dollars)
Annual Carrying Charges***
($ millions in 2008 dollars)
Substation Associated With Cluster of Potential Generation Level8
Maximum MW of
Potential Generation
In each Level
Proxy Voltage Support
Devices*
Other Proxy Transmission
upgrades
Based on 10 year contract
life
Based on 20 year contract
life
Maximum MW of
Potential Generation
In each Level
Proxy Voltage Support
Devices*
Other Proxy Transmission
upgrades
Based on 10 year contract
life
Based on 20 year contract
life 115 kV
1 450 32 0 8 6 300 21 0 5 4 2 150 11 37 12 9 450 32 37 17 13 3 500 35 85 29 22 350 25 85 27 20 4 300 21 258 68 52 400 28 163 47 36
Fulton 230 kV
5 100 7 35 10 8
1 960 67 0 16 12 0 0 0 0 0 2 500 35 1000 254 194 3 300 21 98 29 22
Gates 230 kV
4 200 14 17 8 6
1 0 0 0 0 0 200** 14 0 3 3 2 275 19 4 6 4 400 28 1000 252 193 3 325 23 7 7 6 400 28 98 31 24 4 125 9 43 13 10
Gregg 230 kV
5 275 19 28 12 9
1 150 11 0 3 2 200 14 0 3 3 2 600 42 18 15 11 75 5 1000 247 188 3 150 11 22 8 6 125 9 22 8 6
Helm 230 kV
4 100 7 12 5 3 600 42 98 34 26
1 0 0 0 0 0 0 0 0 0 0 2 350 25 383 100 76 500 350 383 180 137
Humboldt 115 kV
3 150 11 298 76 58
1 550 39 0 9 7 100 7 0 2 1 2 450 32 17 12 9 475 33 98 32 25
Los Banos 230 kV
3 425 30 101 32 25
1 1000 70 0 17 13 1000 70 0 17 13 Metcalf 230 kV
1 1310 92 0 22 16 0 0 0 0 0 2 250 18 46 15 12 600 42 1000 256 195
Midway 230 kV
3 1300 91 17 26 20 175 12 98 27 21

* Static VAR Compensator (SVC) is used as a proxy for voltage support devices required. The size of the SVC at each Level assumes the capacity in each level will be fully utilized. However, since addition of voltage support devices is less “lumpy” than other transmission facilities, it is separately listed so that the size, and hence, cost can be prorated based on the size of the resource bid.
** The maximum potential generation for these levels assumes that it is cost effective to increase pumping at Helms Pump Storage Plant (PSP) during off-peak (night) periods using the new generation at these clusters. In addition, for the off peak (night) hours for the months of June through September, the maximum MW generation in each level could be increased by another 300 MW when maximum pumping at Helms PSP is likely.
*** Carrying charges in this table are for illustrative purposes only. The actual carrying charge for an individual offer will depend on specifics in the offer submitted.
11
Peak and Shoulder Night Year Round Year Round
Cost of Proxy Network Upgrades to accommodate
MW Level of Potential Generation ($ millions in
2008 dollars)
Annual Carrying Charges***
($ millions in 2008 dollars)
Cost of Proxy Network Upgrades to accommodate
MW Level of Potential Generation ($ millions in
2008 dollars)
Annual Carrying Charges***
($ millions in 2008 dollars)
Substation Associated With Cluster of Potential Generation Level8
Maximum MW of
Potential Generation
In each Level
Proxy Voltage Support
Devices*
Other Proxy Transmission
upgrades
Based on 10 year contract
life
Based on 20 year contract
life
Maximum MW of
Potential Generation
In each Level
Proxy Voltage Support
Devices*
Other Proxy Transmission
upgrades
Based on 10 year contract
life
Based on 20 year contract
life 4 1075 75 101 43 33 5 1150 81 46 31 24
1 750 53 0 13 10 0 0 0 0 0 2 250 18 98 28 22 500 35 1000 254 194 3 50 4 98 25 19 4 225 16 98 28 21
Morro 230 kV
5 725 51 101 37 28
1 1400 98 0 24 18 1500 105 0 26 20 2 50 4 49 13 10
Newark 230 kV
3 50 4 292 73 55
1 670 47 0 12 9 0 0 0 0 0 2 50 4 17 5 4 325 23 26 12 9
Panoche 230 kV
3 50 4 17 5 4 675 47 98 36 27
1 0 0 0 0 0 175 12 0 3 2 2 250 18 470 120 91 50 4 10 3 3 3 50 4 10 3 3 575 40 10 12 9
Pit 1 230 kV
4 700 49 10 15 11 200 14 46 15 11
1 0 0 0 0 0 1000 70 0 17 13 2 250 18 61 19 15 3 200 14 94 27 20
Rio Oso 230 kV
4 550 39 38 19 14
1 0 0 0 0 0 600 42 0 10 8 2 800 56 768 202 154 1400 98 46 35 27 3 350 25 46 17 13
Round Mt 230 kV
4 850 60 245 75 57
1 0 0 0 0 0 650 46 0 11 9 2 750 53 294 85 65 350 25 10 8 6
Stagg 230 kV
3 250 18 10 7 5
1 0 0 0 0 0 75 5 0 1 1 Summit Metering 2 250 18 287 75 57 425 30 287 78 59

* Static VAR Compensator (SVC) is used as a proxy for voltage support devices required. The size of the SVC at each Level assumes the capacity in each level will be fully utilized. However, since addition of voltage support devices is less “lumpy” than other transmission facilities, it is separately listed so that the size, and hence, cost can be prorated based on the size of the resource bid.
** The maximum potential generation for these levels assumes that it is cost effective to increase pumping at Helms Pump Storage Plant (PSP) during off-peak (night) periods using the new generation at these clusters. In addition, for the off peak (night) hours for the months of June through September, the maximum MW generation in each level could be increased by another 300 MW when maximum pumping at Helms PSP is likely.
*** Carrying charges in this table are for illustrative purposes only. The actual carrying charge for an individual offer will depend on specifics in the offer submitted.
12
Peak and Shoulder Night Year Round Year Round
Cost of Proxy Network Upgrades to accommodate
MW Level of Potential Generation ($ millions in
2008 dollars)
Annual Carrying Charges***
($ millions in 2008 dollars)
Cost of Proxy Network Upgrades to accommodate
MW Level of Potential Generation ($ millions in
2008 dollars)
Annual Carrying Charges***
($ millions in 2008 dollars)
Substation Associated With Cluster of Potential Generation Level8
Maximum MW of
Potential Generation
In each Level
Proxy Voltage Support
Devices*
Other Proxy Transmission
upgrades
Based on 10 year contract
life
Based on 20 year contract
life
Maximum MW of
Potential Generation
In each Level
Proxy Voltage Support
Devices*
Other Proxy Transmission
upgrades
Based on 10 year contract
life
Based on 20 year contract
life Station 115kV 3 250 18 94 27 21
1 0 0 0 0 0 800 56 0 14 10 2 900 63 470 131 100 200 14 46 15 11
Table Mt 230 kV
3 100 7 46 13 10
1 0 0 0 0 0 1000 70 0 17 13 Tesla 230 kV
2 1000 70 418 120 91
1 0 0 0 0 0 1000 70 0 17 13 Vaca Dixon 230 kV
2 1000 70 378 110 84
1 450 32 0 8 6 700** 49 0 12 9 2 500 35 28 16 12 50 4 12 4 3
Wilson 230 kV
3 50 4 35 9 7 250 18 43 15 11

* Static VAR Compensator (SVC) is used as a proxy for voltage support devices required. The size of the SVC at each Level assumes the capacity in each level will be fully utilized. However, since addition of voltage support devices is less “lumpy” than other transmission facilities, it is separately listed so that the size, and hence, cost can be prorated based on the size of the resource bid.
** The maximum potential generation for these levels assumes that it is cost effective to increase pumping at Helms Pump Storage Plant (PSP) during off-peak (night) periods using the new generation at these clusters. In addition, for the off peak (night) hours for the months of June through September, the maximum MW generation in each level could be increased by another 300 MW when maximum pumping at Helms PSP is likely.
*** Carrying charges in this table are for illustrative purposes only. The actual carrying charge for an individual offer will depend on specifics in the offer submitted.
13
Table 2
2010 Transmission Ranking Cost for Study Year 2014 for Potential Generation Located North of or in PG&E Service Territory
Assuming Delivery to PG&E’s Midway Substation
(SCE or SDG&E is the Purchaser)
Peak and Shoulder Night Year Round Year Round
Cost of Proxy Network Upgrades to accommodate
MW Level of Potential Generation ($ millions in
2008 dollars)
Annual Carrying Charges
($ millions in 2008 dollars)
Cost of Proxy Network Upgrades to accommodate
MW Level of Potential Generation ($ millions in
2008 dollars)
Annual Carrying Charges
($ millions in 2008 dollars)
Substation Associated With Cluster Of Potential Generation Level
Maximum MW of
Potential Generation
In each Level
Proxy Voltage Support
Devices*
Other Proxy Transmission
upgrades
Based on 10 year contract
life
Based on 20 year contract
life
Maximum MW of
Potential Generation
In each Level
Proxy Voltage Support
Devices*
Other Proxy Transmission
upgrades
Based on 10 year contract
life
Based on 20 year contract
life
1 1000 70 0 17 13 400 28 0 7 5 2 525 37 28 16 12
Bellota 230 kV 3 75 5 15 5 4
1 0 0 0 0 0 150 11 0 3 2 Caribou 230 kV 2 950 67 508 141 108 650 46 38 20 16
1 0 0 0 0 0 25 2 0 0 0 Carrizo Plains 2 310 22 156 44 33 475 33 156 46 35
1 350 25 0 6 5 325 23 0 6 4 2 450 32 40 18 13 125 9 35 11 8 3 200 14 59 18 14 475 33 59 23 17
Cortina 230 kV
4 75 5 40 11 8
1 0 0 0 0 0 875 61 0 15 11 2 275 19 283 74 57 225 16 46 15 11 3 725 51 298 85 65 200 14 24 9 7
Cottonwood 230 kV
4 500 35 46 20 15 200 14 298 76 58
1 0 0 0 0 0 0 0 0 0 0 Delta 115 kV 2 500 35 318 86 66 500 35 318 86 66
1 450 32 0 8 6 325 23 0 6 4 2 150 11 37 12 9 325 23 37 15 11 3 500 35 85 29 22 475 33 85 29 22 4 300 21 258 68 52 375 26 26 13 10
Fulton 230 kV
5 100 7 35 10 8
1 960 67 0 16 12 0 0 0 0 0 Gates 230 kV 2 1000 70 65 33 25
1 0 0 0 0 0 1000** 70 0 17 13 2 300 21 4 6 5 3 400 28 7 9 7
Gregg 230 kV
4 200 14 43 14 11

* Static VAR Compensator (SVC) is used as a proxy for voltage support devices required. The size of the SVC at each Level assumes the capacity in each level will be fully utilized. However, since addition of voltage support devices is less “lumpy” than other transmission facilities, it is separately listed so that the size, and hence, cost can be prorated based on the size of the resource bid.
** The maximum potential generation for these levels assumes that it is cost effective to increase pumping at Helms Pump Storage Plant (PSP) during off-peak (night) periods using the new generation at these clusters. In addition, for the off peak (night) hours for the months of June through September, the maximum MW generation in each level could be increased by another 300 MW when maximum pumping at Helms PSP is likely.
*** Carrying charges in this table are for illustrative purposes only. The actual carrying charge for an individual offer will depend on specifics in the offer submitted.
14
Peak and Shoulder Night Year Round Year Round
Cost of Proxy Network Upgrades to accommodate
MW Level of Potential Generation ($ millions in
2008 dollars)
Annual Carrying Charges
($ millions in 2008 dollars)
Cost of Proxy Network Upgrades to accommodate
MW Level of Potential Generation ($ millions in
2008 dollars)
Annual Carrying Charges
($ millions in 2008 dollars)
Substation Associated With Cluster Of Potential Generation Level
Maximum MW of
Potential Generation
In each Level
Proxy Voltage Support
Devices*
Other Proxy Transmission
upgrades
Based on 10 year contract
life
Based on 20 year contract
life
Maximum MW of
Potential Generation
In each Level
Proxy Voltage Support
Devices*
Other Proxy Transmission
upgrades
Based on 10 year contract
life
Based on 20 year contract
life 5 75 5 28 8 6 6 25 2 23 6 5
1 125 9 0 2 2 250 18 0 4 3 2 650 46 18 16 12 750 25 22 11 9
Helm 230 kV 3 225 16 22 9 7
1 0 0 0 0 0 0 0 0 0 0 2 375 26 383 100 77 500 35 383 103 78
Humboldt 115 kV 3 125 9 298 75 57
1 875 61 0 15 11 325 23 0 6 4 Los Banos 230 kV 2 125 9 98 26 20 675 47 98 36 27 Metcalf 230 kV
1
1000
70
0
17
13
1000
70
0
17
13
1 1135 79 0 19 14 1725 121 0 30 23 Midway
230 kV 2 1725 121 46 41 31 1275 89 46 33 25
1 825 58 0 14 11 500 35 0 9 7 2 200 14 98 28 21 1000 70 98 41 32
Morro 230 kV
3 475 33 114 36 28
1 1275 89 0 22 17 1500** 105 0 26 20 2 125 9 49 14 11
Newark 230 kV
3 100 7 292 73 56
1 770 54 0 13 10 0 0 0 0 0 2 700 49 84 33 25
Panoche 230 kV 3 300 21 98 29 22
1 0 0 0 0 0 175 12 0 3 2 2 325 23 283 75 57 50 4 10 3 3 3 75 5 10 4 3 575 40 10 12 9
Pit 1 230 kV
4 600 42 10 13 10 200 14 46 15 11
1 0 0 0 0 0 1000 70 0 17 13 2 250 18 61 19 15 3 200 14 94 27 20
Rio Oso 230 kV
4 550 39 38 19 14
1 0 0 0 0 0 600 42 0 10 8 2 150 11 470 118 90 1400 98 46 35 27 3 675 47 298 85 65 4 325 23 46 17 13
Round Mt 230 kV
5 850 60 245 75 57
1 750 53 0 13 10 0 0 0 0 0 Stagg 230 kV 2 250 18 10 7 5 650 46 10 14 10

* Static VAR Compensator (SVC) is used as a proxy for voltage support devices required. The size of the SVC at each Level assumes the capacity in each level will be fully utilized. However, since addition of voltage support devices is less “lumpy” than other transmission facilities, it is separately listed so that the size, and hence, cost can be prorated based on the size of the resource bid.
** The maximum potential generation for these levels assumes that it is cost effective to increase pumping at Helms Pump Storage Plant (PSP) during off-peak (night) periods using the new generation at these clusters. In addition, for the off peak (night) hours for the months of June through September, the maximum MW generation in each level could be increased by another 300 MW when maximum pumping at Helms PSP is likely.
*** Carrying charges in this table are for illustrative purposes only. The actual carrying charge for an individual offer will depend on specifics in the offer submitted.
15
Peak and Shoulder Night Year Round Year Round
Cost of Proxy Network Upgrades to accommodate
MW Level of Potential Generation ($ millions in
2008 dollars)
Annual Carrying Charges
($ millions in 2008 dollars)
Cost of Proxy Network Upgrades to accommodate
MW Level of Potential Generation ($ millions in
2008 dollars)
Annual Carrying Charges
($ millions in 2008 dollars)
Substation Associated With Cluster Of Potential Generation Level
Maximum MW of
Potential Generation
In each Level
Proxy Voltage Support
Devices*
Other Proxy Transmission
upgrades
Based on 10 year contract
life
Based on 20 year contract
life
Maximum MW of
Potential Generation
In each Level
Proxy Voltage Support
Devices*
Other Proxy Transmission
upgrades
Based on 10 year contract
life
Based on 20 year contract
life 1 0 0 0 0 0 75 5 0 1 1 2 250 18 287 75 57 425 30 287 78 59
Summit Metering Station 115 kV 3 250 18 94 27 21
1 0 0 0 0 0 800 56 0 14 10 2 900 63 470 131 100 200 14 46 15 11 3 50 4 46 12 9
Table Mt 230 kV
4 50 4 245 61 46
1 1000 70 0 17 13 1000 70 0 17 13 Tesla 230 kV
1 0 0 0 0 0 1000 70 0 17 13 Vaca Dixon 230 kV 2 1000 70 245 77 59
1 500 35 0 9 7 625** 44 0 11 8 2 500 35 28 16 12 50 4 12 4 3
Wilson 230 kV
3 0 0 0 0 0 325 23 43 16 12

16
II. DEVELOPMENT OF THE TRANSMISSION RANKING COST REPORT
A. Procedural History.
SB 1078 established the California Renewables Portfolio Standard Program and the objective that 20% of electricity sold to California customers would be procured from eligible renewable energy resources by 2017. In 2006, SB 107 was enacted, accelerating the procurement objective to 20% of retail sales from eligible renewable resources by 2010 with flexible compliance. SB 1038 required the CEC to complete a renewable resource plan and required the Commission to complete a renewable resource transmission plan. Both reports were required to be submitted to the Legislature by December 1, 2003. Accordingly, the Commission’s transmission plan was based on the CEC’s renewable resource plan.
B. PG&E’s Conceptual Transmission Studies for Renewable Resource Bidders.
A key element in PG&E’s methodology is the identification of clusters at which renewable generators may be expected to appear. This section describes the various indicia of potential renewable resource generator development that have led PG&E to identify twenty-six renewable resource clusters for the 2010 TRCR.
1. Studies Completed as of July 30, 2003
Pursuant to the January 29, 2003, Administrative Law Judge’s (“ALJ’s”) Ruling and Notice of Evidentiary Hearings on Tehachapi Transmission Project in the Commission’s Investigation (I.) 00-11-001, PG&E invited developers who might wish to interconnect eligible renewable energy projects to the PG&E-owned transmission system to apply for and fund transmission conceptual studies, including project cost estimates. PG&E’s solicitation noted that project-specific information from such studies might be included in the renewables transmission plan report that the Commission was required to submit to the Legislature by December 1, 2003. (Public Utilities Code § 383.6).
Five potential renewable resource developers responded to PG&E’s March 2003 solicitations, describing a total of twelve projects representing 2,562 MW. Of these, seven projects representing 1102 MW were located within PG&E's service territory. Three projects representing 220 MW were located in PacifiCorp’s service territory, with proposed interconnection points at Bonneville Power Administration-owned substations. Two projects representing 1240 MW were located outside California and were excluded from the Screening Level Evaluation.
2. CEC Renewable Resource Assessment Reported Dated July 1, 2003.
The February 26, 2003, ALJ’s Ruling in I.00-11-001 determined that the CEC’s Preliminary Renewable Resource Assessment (“PRRA”) would assess a level of renewable development in 2005 and 2008 sufficient to allow PG&E, SCE, SDG&E, and any other “obligated entities” to achieve the incremental RPS goals embodied in Senate Bill 1078. This CEC assessment was intended to provide the basis for a reconnaissance level analysis of current and potential transmission The CEC published its PRRA on July 1, 2003. The PRRA resource assessment identified renewable megawatt additions for the transmission plan's target years

17
(2005, 2008 and 2017) by technology type and by county where renewable resources are deemed most likely to locate. PG&E has relied on the PRRA as the basis of its reconnaissance level analysis of current and potential transmission congestion due to the interconnection of potential renewable resources. PG&E filed its Screening Level Study required by SB 1038 on August 29, 2003.
3. Administrative Law Judge Rulings Dated July 21, 2003 and August 1, 2003 - Revised Scope of Study Based on CEC PRRA.
The ALJ’s rulings of July 21, 2003, and August 1, 2003, further required utilities to develop a conceptual renewables transmission plan for 2017 (similar to the conceptual transmission plans developed for 2005 and 2008), to address the effect of accelerating realization of the 20% RPS Goal from 2017 to 2010, and to report on the transmission needs for potential renewable resources that would still exist after attainment of the RPS Goal.
4. CEC Renewable Resource Development Report Dated September 30, 2003.
The CEC’s draft Renewable Resource Development Report (“RRDR”) provided the Commission with an update to the PRRA on July 1, 2003. This RRDR expanded the scope to include the energy needs of the rest of the state (publicly owned electric utilities, other IOUs, and other electric service providers). By comparison, the original PRRA had focused on the energy needs of the investor owned utilities (“IOUs”) and electric service providers (“ESPs”) for transmission planning purposes. The RRDR also included a plausible RPS compliance scenario for the entire state, using data from existing and proposed projects.9/ Adjustments were made to the estimates of renewable energy resources needed to meet RPS obligations, the amount of proposed renewable projects, and the installed renewable capacity within California and the WECC. The CEC’s estimate of renewable resource capacity required to meet the RPS of 20% by 2010 on a statewide level and remaining potential renewable resources are summarized in Table 3:
9/ The RRDR states “The data for the proposed projects date back as far as June 1998 from the Energy
Commission's first New Account auction to as recent as projects participating in the 2003 Interim Procurement. A limited amount of projects were filtered out if they did not appear to be plausible or ‘real’ projects. Most of the proposed projects do not have contracts and are not yet under construction. Data on proposed projects were gathered from solicitations for new electric providers to IOU and/or municipal electric utilities. The following data sources were used: the Energy Commission’s New Renewable Resources Account database, California Power Authority Letters of Intent, Southern California Public Power Authority (SCPPA) Request for Proposals (RFP) and the 2003 Northern California Power Association (NCPA) RFP.” As such, there is not sufficient information in the RRDR to ascertain the amounts and number of “proposed” renewable resource projects that may have initiated the interconnection or permit application process.

18
Table 3. Plausible Renewable Energy Supply Scenario to meet Estimated Statewide 20% RPS Demand by 2010 with Resources Located in California (MW)
2005
(MW) 2008
(MW) 2010
(MW) 2017
(MW) Total (MW)
PG&E 420 355 50 200 1,025 SCE 875 2,452 1,645 1,110 6,082 IID 120 140 150 40 450 SDG&E 220 210 - - 430 TOTAL 1,635 3,157 1,845 1,350 7,987
In the PG&E service territory, compared to the PRRA, the RRDR scenario assumes that the development of renewable resources in Solano and Alameda Counties would accelerate, and the renewable resource development in Modoc and Siskiyou Counties would be slower.
5. Commission Administrative Law Judge Rulings Dated October 15, 2003—Revised Schedule and Approach of Study Based on CEC RRDR.
The ALJ Ruling of October 15, 2003, modified the schedule and approach to be used for the Commission Renewables Transmission Report. Accordingly, PG&E prepared and filed its Supplemental Screening Level Study Required by SB 1038 on October 29, 2003.
6. Commission Administrative Law Judge Rulings Dated March 18, 2004 on Renewable Resource Information to Prepare the Transmission Ranking Cost Report.
Pursuant to ALJ Ruling dated March 18, 2004, PG&E undertook a supplemental solicitation for information from developers of eligible renewable energy projects. In response to this supplemental solicitation, PG&E received information from nine developers, proposing a total of forty-one projects representing 4,313.5 MW. Of these, fourteen projects representing 736 MW were located within PG&E's service territory. Twenty-five projects representing 3477.5 MW were located in Southern California. Two projects representing 100 MW were located in PacificCorp's service territory, with proposed interconnection points at Bonneville Power Administration owned substations. PG&E used this information to supplement the information available earlier in developing the clusters for the 2004 Transmission Ranking Cost Report.
On March 18, 2005, PG&E sent another letter of solicitation for information to developers regarding eligible renewable energy projects expected to commence delivery to the PG&E-owned transmission system by January 2010. PG&E received responses from four developers by the closing date of March 28, 2005, for sixteen generation projects totaling 2,905 MW. Of these, six projects, totaling 671 MW, are expected to be in the PG&E service area, three projects, totaling 732 MW, are expected to be located north of the PG&E service area but within California, and seven projects, totaling 1,502 MW, are expected to be located in Southern California. PG&E used this information to supplement the information available earlier in

19
developing the clusters for the 2004 Transmission Ranking Cost Report.
7. Commission Decision 05-07-040 directed the utilities to apply the same Methodology, as modified by that decision, in preparing their 2005 Transmission Ranking Cost Reports.
In D.05-07-040, the Commission directed the utilities to apply the same methodology, as modified by that decision, in preparing their 2005 Transmission Ranking Cost Reports. In addition, it directed the utilities to specify and explain the carrying costs, in addition to capital costs, of transmission upgrades identified in the reports. Accordingly, PG&E calculates the carrying costs -- or costs of ownership -- for proposed capital expenditures. These costs are then discounted to a present value using a discount rate that takes into account the time value of money over the anticipated life of the project. The components used in the determination of the carrying cost typically include capital investment, operation and maintenance expenses, taxes, insurance, and depreciation.
8. CEC Strategic Value Analysis Draft Consultant Report published in July 2005.
CEC Strategic Value Analysis shows the possible locations by county and magnitudes of the economic potential of the renewable resources. Exhibit 2 is a map showing a potential distribution scenario of renewable resources. This served as another data point considered when PG&E selected the clusters investigated in the 2006 TRCR.
Table 4: RPS Requirements listed in CEC Consultant Draft Report on Strategic Value Analysis CEC-500-2005-106
2003 2004 2005
LSE
2001
estimated renewable baseline (GWh/yr)
2003 actual (GWh/yr)
% of 2003 APT
2004 actual
(GWh/yr)
% of 2004 APT
2005 IOU
expected (GWh/yr)
2005 needed to
be on course for 20% by
2010 (GWh/yr)
2010 20% of demand
forecast (GWh/yr)
2017 20% of demand
forecast (GWh/yr)
PG&E 6,719 8,828 101% 8,591 91% 9,087 9,633 15,879 17,280
SCE 11,364 12,49
7 104% 13246 104% 13,634 14,560 15,934 17,340
SDG&E 146 550 285% 678 160% 884 1,285 3,462 3,767
DA & Rest of state 7,587 4,853 4,676 13,132 20,885 22,727
Total 26,72
8 27,191 38,610 56,160 61,114

20
9. Commission Assigned Commissioner and Administrative Law Judge’s Ruling in OIR. 04-04-026, dated November 9, 2005, directed the utilities to apply the Methodology in D.04-06-010 and D.05-07-040 in preparing their 2006 Transmission Ranking Cost Reports
Pursuant to Assigned Commissioner and Administrative Law Judge’s Ruling, dated November 9, 2005, on January 31, 2006, PG&E issued a letter soliciting information from developers regarding eligible renewable energy projects expected to commence delivery to the PG&E-owned transmission system by January 2010. By the closing date of February 7, 2006, PG&E received only one response, which came from a single developer; that response representing two generation projects, totaling 70 MW. Both projects are expected to be located north of PG&E’s service area, with one of these two projects expected in California. PG&E used this information to supplement the information available earlier in developing the clusters for the 2006 TRCR.
10. Assigned Commissioner Ruling and Scoping Memo, dated August 21, 2006, as modified by the subsequent Administrative Law Judge’s Ruling on Filing of Draft 2007 RPS Procurement Plans, dated September 14, 2006, in R.06-05-027
Pursuant to Assigned Commissioner Ruling and Scoping Memo, dated August 21, 2006, as modified by the subsequent Administrative Law Judge’s Ruling on Filing of Draft 2007 RPS Procurement Plans, dated September 14, PG&E issued a letter on October 2, 2006, soliciting information from developers regarding eligible renewable energy projects expected to commence delivery to the PG&E-owned transmission system by January 2011. By the closing date of October 10, 2006, PG&E received responses from five developers, representing twenty-one generation projects totaling up to 3,039 MW. Of these, four projects, totaling 462 MW, are expected to be in the Pacific Northwest, one project representing 500 MW is expected to locate in Mexico, seven projects, totaling 1,212 MW, are expected to be in northern California, and 8 projects, totaling 865 MW, are expected to be in southern California. PG&E used this information to supplement information available earlier in developing the clusters for the 2007 Transmission Ranking Cost Report.
11. Assigned Commissioner Ruling and Scoping Memo, dated June 15, 2007, as modified by the subsequent revised schedules provided via Administrative Law Judge’s Rulings on July 16, 2007, August 7th, 2007 and August 23, 2007. and the Assigned Commissioner’s Ruling on July 31st, 2007.
Pursuant to Assigned Commissioner Ruling and Scoping Memo, dated June 15, 2007, as modified by the aforementioned rulings, PG&E issued a letter on August 1, 2007, soliciting information from developers regarding eligible renewable energy projects expected to commence delivery to the PG&E-owned transmission system by January 2012. By the closing date of August 9, 2007, PG&E received responses from three developers, representing six generation projects totaling up to 1,139 MW. Of these, two projects, totaling 499 MW, are expected to be in the Pacific Northwest, one project representing 400 MW is expected to locate in Mexico, and three projects, totaling 240 MW, are expected to be in Central and Southern California. PG&E

21
used this information to supplement information available earlier in developing the clusters for the 2008 Transmission Ranking Cost Report.
12. The Amended Scoping Memo and Ruling of Assigned Commissioner Regarding 2009 RPS Procurement Plans dated June 20, 2008
Pursuant to Assigned Commissioner Ruling and Scoping Memo, dated June 20, 2008, PG&E issued a letter on August 6, 2008, soliciting information from developers regarding eligible renewable energy projects expected to commence delivery to the PG&E-owned transmission system by January 2013. By the closing date of August 13, 2008 and subsequent late submittals, PG&E received responses from three developers, representing seventeen generation projects totaling up to 4,126 MW. Of these, two projects, totaling 40 MW, are expected to be in PG&E’s Service Area in Central California, twelve projects, totaling 2,806 MW, are expected to be outside PG&E Service Area in Central and Southern California, and three projects, totaling 1,280 MW, are expected to be located in the Desert Southwest. PG&E used this information to supplement information available earlier in developing the clusters for the 2009 Transmission Ranking Cost Report.
13. CPUC Decision 09-06-018 and the Amended Scoping Memo and Ruling of the Assigned Commissioner Regarding 2010 RPS Procurement Plans dated November 2, 2009 in CPUC rulemaking (R.) 08-08-009.
Pursuant to Assigned Commissioner Ruling and Scoping Memo, dated November 2, 2009, PG&E issued a letter on November 13, 2009 soliciting information from developers regarding eligible renewable energy projects expected to commence delivery to the PG&E-owned transmission system by January 2014. By the closing date of November 20, 2009 and subsequent late submittals, PG&E received responses from 2 developers, representing 19 generation projects totaling up to 1639 MW. Of these, 1 project, totaling 51 MW, is expected to be in PG&E’s Service Area; 15 projects, totaling 910 MW, are expected to be outside PG&E Service Area in Southern California; 4 projects, totaling 228 MW, are expected to be located in the Pacific Northwest; and 2 projects, totaling 450 MW, are expected to be located in the Desert Southwest. PG&E used this information to supplement information available earlier in developing the clusters for the 2010 Transmission Ranking Cost Report.
III. PG&E’S TRANSMISSION RANKING COST STUDY FOR USE IN THE 2010 RPS SOLICITATION
On June 9, 2004, the Commission issued D. 04-06-013, adopting the “Methodology for Development and Consideration of Transmission Costs in Initial Renewable Portfolio Standard Procurement” (the “Methodology”), which is to be undertaken pursuant to Pub. Util. Code § 399.14. This decision also ordered PG&E to prepare and file a TRCR consistent with the Methodology within 14 days of the effective date of the Decision. It states in relevant part:
In its Transmission Ranking Cost Report, each utility should identify and provide cost information regarding transmission upgrades needed for potential RPS projects, based on conceptual

22
transmission studies submitted previously in this proceeding, other conceptual transmission studies, and System Impact Studies and Facilities Studies prepared for projects that have initiated the California Independent System Operator (ISO) interconnection process.
To be consistent with D. 04-06-013, the study undertaken by PG&E investigated the
proxy facilities needed assuming, first, that PG&E would be the purchaser from renewable resources located within and outside PG&E’s service territory, and, second, that PG&E would transmit the energy from renewable resources located north of or in PG&E’s service territory to a PG&E point of delivery for purchasers south of PG&E’s service territory.
A. Limitations, Assumptions and Methodology Underlying PG&E’s 2010 Transmission Ranking Cost Study.
PG&E developed the 2010 TRCR from the 2009 TRCR, which used the same methodology as it did in the earlier Screening Level Studies, filed on August 29, 2003, and on October 29, 2003; in the 2004 TRCR, filed on June 23, 2004; the 2005 TRCR, filed on August 3, 2005; and the 2006 TRCR, filed on March 15, 2006, the 2007 TRCR, filed on November 8, 2006, and the 2008 TRCR, filed on September 7, 2008. The 2010 Transmission Ranking Costs developed herein involve the same limitations and uncertainties as the conceptual transmission plans in the earlier studies.
1. Power Flow Base Cases.
PG&E used the Summer Peak and Summer Off Peak base cases developed in PG&E’s 2007 base case series and approved by the CAISO for use` in PG&E’s Annual Assessment Studies.
These base cases were updated to reflect the current (as of December 2009) projects:
- Generation projects in the CAISO Interconnection Queue that have completed the System Impact Studies and Facilities Studies, and the associated transmission upgrades in accordance with the signed agreements.
- Approved reliability and economic transmission upgrades.
- The results of PG&E’s prior Renewables Solicitations conducted since 2004 once the RPS contracts have been executed.)
2. Substation Associated With Cluster of Potential Generation.
Based on information received from the developers and the CEC’s PRRA and RRDR, as well as the CEC’s draft Strategic Value Analysis Report, published in July 2005, PG&E has selected Bellota, Caribou, Carrizo Plains, Cortina, Cottonwood, Delta Metering Station, Fulton, Gates, Gregg, Helm, Humboldt, Los Banos, Metcalf, Midway, Morro Bay, Newark, Panoche, Pit 1, Rio Oso, Round Mountain, Stagg, Summit Metering Station, Table Mountain, Tesla, Vaca-Dixon, and Wilson Substations (see Exhibit 1) as the cluster locations from which the

23
transmission impact of the renewable resources identified are analyzed. If PG&E is assumed to be the purchaser, for renewable resources located north of PG&E’s service territory, the associated potential cluster will be PG&E’s Round Mountain Substation. For projects located south of PG&E’s service territory, the associated potential cluster will be PG&E’s Midway Substation. For projects located east of PG&E’s service territory, the associated potential cluster will be PG&E’s side of Summit Metering Station.
If SCE, SDG&E or an entity south of PG&E’s service territory is assumed to be the purchaser, and the renewable resources are located north of or in PG&E’s service territory, the point of delivery out of PG&E’s service territory will be PG&E’s Midway Substation. As in the case where PG&E is assumed to be the purchaser, the point of receipt for renewable resources located north of PG&E’s service territory is assumed to be PG&E’s Round Mountain Substation, and the point of receipt for renewable resources located east of PG&E’s service territory is assumed to be PG&E’s side of Summit Metering Station. PG&E’s Transmission Ranking Cost herein from the cluster associated with the renewable resource location should be submitted to SCE and SDG&E, as appropriate, in response to solicitation by SCE or SDG&E for complete evaluation.
3. Potential Network Upgrades and Proxy Facilities.
PG&E ran the 2013 Summer Peak and 2013 Summer Off Peak cases using the updated assumptions set forth on page 4, above. As in the earlier TRCR studies, because of the limited time and data available for this evaluation, only power flow (steady state) cases representing normal (all facilities in service) operating conditions were run. For each cluster, PG&E tested the need for network upgrades based on the same criteria used in the earlier TRCR studies. As was done earlier, transmission facilities that may experience transmission problems during single contingencies were identified by comparing the normal loadings to a loading threshold of 80% of normal facility rating. That is, if a transmission facility under normal operating conditions is loaded to 80% or more of its normal rating, then it is an indication that overload may exist during single contingency conditions, and transmission upgrades could be needed.
The proxy transmission facilities deemed needed to correct potential transmission congestion would be determined based on the lesser cost facilities similar to the congested facilities, or the following:
60 kV line for renewable resources less than 100 MW
115 kV line for renewable resources between 100 and 200 MW
230 kV line for renewable resources between 200 and 600 MW
500 kV line for renewable resources 600 MW and higher
Consideration would be given also to the existing system configuration where the potential congestion is identified, and future development expected. For example, if a large amount of renewable resources is expected beyond the present solicitation, a 500 kV line initially operated as two 230 kV circuits will be chosen over a 230 kV double circuit tower line (DCTL).
PG&E also augments the information thus developed with information from other transmission planning studies to the extent they are available. If no transmission facility in the

24
impacted area10/ would be loaded to at or above 80% of normal rating in the scenario, the renewable generation in the cluster would be increased to a point where loading on at least one transmission facility would reach 80% of normal rating or when the resource addition in a cluster would reach 1,000 MW unless other information is available. Using 1,000 MW as the cut off is reasonable, since the maximum amounts in any cluster are determined based on a simplified methodology, and thus there could be other limits that could have been reached (such as voltage stability) that have not been identified. In any case, addition of over 600 MW in a cluster would require a proxy 500 kV line, which could trigger impacts and costs beyond California; such impacts cannot be addressed using this simplified methodology.
4. Load and Resource Balance, Reactive Support and other Operational Considerations.
To maintain load and resource balance while increasing the generation in each cluster, generation outside the impacted area would be decreased based on the same principle used for incorporating the generation in the CAISO Interconnection Queue. If there is more identified renewable generation after all available gas-fired generators have been decreased or shut down (while maintaining the generation level needed for local reliability in the load centers), the power flows on transmission ties to areas outside PG&E’s service territory that are electrically farthest away from the cluster under study would be adjusted.
The study performed for the TRCR assumes that the renewable resources connecting to each cluster would exhibit the reactive capability of synchronous generators. Experience from past studies shows that voltage (reactive) support is required to reliably transmit the renewable resources to the load centers with the addition of any resources, including synchronous generators, located away from the load centers. To be effective, these voltage support devices would be assumed to have been installed at various strategic locations, which are generally at or near the load centers. The levels of voltage support are estimated based on proxy devices and the results of past studies, and are technology neutral. Because the voltage support devices are not as “lumpy” as the other transmission facilities, they can be estimated pro rata with the renewable resource bids.
Due to the lack of specific detailed information associated with all the potential renewable projects that may respond to PG&E’s RPS solicitation, this TRCR study employed very simplified methodologies. To avoid unnecessary addition of transmission network upgrades, PG&E assumes that each renewable project that is successful in winning the bid solicitation will do its share to maintain existing reliability of the system by participating in the applicable nomograms and existing special protection schemes, such as the Path 15 Remedial Action Scheme.
10/ For renewable projects where PG&E is the purchaser, an impacted area is defined by identifying all
transmission facilities in the same transmission planning area and/or adjacent neighboring Transmission Planning Areas where the cluster is located (i.e., electrically close to the cluster) . For Renewables bidding to deliver to southern California, the impacted area will include the system going to the point of delivery (in this case, PG&E’s Midway Substation).

25
B. Transmission Ranking Cost Study Results.
Based on the information gathered on the possible locations of renewable resources that could bid in response to PG&E’s upcoming RPS solicitation, PG&E has selected the following PG&E substation buses to be representative clusters from which PG&E would develop Transmission Ranking Costs:
Bellota Caribou Carrizo Plains Cortina Cottonwood Delta Metering Station Fulton Gates Gregg Helm Humboldt Los Banos Metcalf Midway Morro Bay Newark Panoche Pit 1 Rio Oso Round Mountain Summit Metering Station Stagg Table Mountain Tesla Vaca Dixon Wilson
This selection represents four more in the number of clusters than investigated in the 2009 TRCR. In addition, because of the updated network changes and the projected new resources resulting from the prior Resource Solicitations in the base cases and the new resources in the CAISO Interconnection Queue that have since completed the SIS/FS process, transmission capacity for some clusters has been decreased from their levels in the 2008 TRCR. However, this decrease is offset by transmission capacity shown to be available in other clusters. Tables 5 - 8 show the results of the analysis. Several transmission projects being proposed in the 2008 PG&E Transmission Expansion Plan may provide added transmission capacity for additional generation at some clusters. The added transmission capacity associated with these new

26
transmission projects will be included in bid evaluation if they are approved by the CAISO and PG&E management before the 2010 RFO bid evaluation.
Overall, the 2008 investigation (which resulted in the 2009 TCR) shows more congestion on the 500 kV system. This is an indication that the lower voltage system may be reaching its limit and that simple solutions, such as reconductoring, may not be enough to support development of renewable resources beyond the RPS goal of 20%, assuming renewable resources continue to locate far away from the load centers. The inclusion of information contained within this TRCR in the RPS bid evaluation process is essential to the procurement of renewable resources based on least cost, best fit principles; this TRCR should also be used as a reference for the development of major transmission projects to connect those renewable resources that meet the least cost best fit criteria.
As mentioned above, to maintain load and resource balance while increasing the generation in each cluster, generation outside the impacted area will be decreased based on the same principle used for incorporating the generation in the CAISO Interconnection Queue. That is, older gas-fired generation will be displaced first, up to the point where the generation is needed for local reliability in the load centers. If there is more identified renewable generation after all available gas-fired generators have been decreased or shut down (again while maintaining generation needed for local reliability), the power flows will be adjusted on transmission ties to areas outside PG&E service territory that are electrically farthest away from the cluster under study.
Because of the amount of renewable resources added in each cluster, there appears to be more gas-fired generators that would need to be decreased or shut down as more and more renewable resources are added. Consequently, the transmission tie line flows to areas outside PG&E service territory would need to be adjusted. Since only the ties farthest away from the impacted areas would be adjusted (so as not to influence the study results for the impacted area), the Midway -Vincent 500 kV lines between PG&E and SCE would be adjusted for the clusters in the PG&E service territory north of Tesla Substation. Midway is also the point of delivery to entities south of PG&E service territory. Because of this coincidence, the Transmission Ranking Costs for clusters north of PG&E’s Tesla Substation are the same, regardless of whether PG&E is the assumed purchaser of the renewable resources or simply providing the transmission to transmit the renewable resources to their purchaser(s) to the south of PG&E’s service territory, as expected.
Consequently, the clusters south of Tesla are the only ones that could exhibit different impacts depending on whether PG&E is the assumed purchaser of or simply providing the transmission for the renewable resources. During peak conditions, this difference stems from whether the assumed generation from the cluster in question would increase the power flowing enough to cause potential overloads on the transmission facilities between Los Banos and Tesla, which are likely the limiting elements since Path 15 Upgrades became operational. Power scheduled to flow to SCE is not expected to impact these facilities. During off-peak conditions, when the prevalent power flow is from SCE to PG&E (in the south-to-north direction), purchasing renewable resources from projects south of PG&E’s service territory during off-peak conditions will likely encounter significant transmission congestion because any such purchases will add to the prevailing power flow. On the other hand, transmitting renewable power to

27
parties south of PG&E’s service territory under such off-peak conditions is not expected to encounter much transmission congestion, because such power transfers are expected to be in the opposite direction of the prevailing power flows.
Finally, PG&E compared the major input parameters for the 2010 TRCR with those of the 2009 TRCR, and found that the changes would not significantly impact the Transmission Ranking costs determined in 2009 for the Clusters as shown in Tables 1 and 2 above. Minor updates were made to account for the changes in load, resources and transmission configuration.
IV. CONCLUSION
PG&E has developed its 2010 TRCR in accordance with the Methodology laid out in Attachment A of D. 04-06-013 and in D.05-07-040. The Transmission Ranking Costs developed in this report will allow PG&E to perform the needed least-cost best-fit analysis to rank and select renewable resources for development considering the transmission cost of the resource being bid.

Table 5: 2010 TRCR 2014 Super Peak, Peak and Shoulder Periods where PG&E is the Purchaser
28
Proxy Transmission Facility description Cost of Proxy Network Upgrades to
accommodate MW Level of Potential
Generation ($ millions in 2007 dollars)
Proxy Voltage Support Devices*
Substation Associated With Cluster of Potential Generation Level
Maximum MW of
Potential Generation
In each Level
Proxy Voltage Support Devices*
Other Proxy
Transm. upgrades Limiting elements
SVC Qmax
(MVAR)
SVC Qmin
(MVAR) Other Proxy Transmission upgrades Bellota 230 kV 1 1000 70 0 BELLOTA 230-COTTLE B 230 500 -333
1 0 0 0 TABLE MT 500-VACA-DIX 500 0 0
2 50 4 470 CARIBOU 230-BELDENTP 230 25 -17 Build new Table Mt-Vaca Dixon 230 DCTL (230 kV config)
3 450 32 38 Table Mt 500/230 kV xformer 225 -150 Reconductor Caribou-Beldon-Table Mt 230 DCTL
Caribou 230 kV
4 500 35 46 TABLE MT 500-TESLA 500 250 -167 Build new 500/230 xformer
1 0 0 0 TEMBLOR 115-BELRIDGE 115 50 -33 Carrizo Plains 115 kV 2 310 22 156 ATASCDRO 70-SN LS OB 70 200 -133 Build new Midway-Carrizo Plains 230
1 350 25 0 CORTINA 230-VACA-DIX 230 175 -117
2 450 32 40 CPVSTA 230-VACA-DIX 230 225 -150 Reconductor Cortina-Vaca Dixon 230 DCTL
Cortina 230 kV
3 200 14 59 HPLND JT 60-CLVRDLJT 60 100 -67 Reconductor CPVSta-Cortina 230 DCTL
1 0 0 0 CPVSTA 230-CORTINA 230 0 0 Cottonwood 230 kV 2 1150 81 298 OLINDA 500-OLINDAW 230 575 -383 Build new Round Mt-Table Mt 230 DCTL

Table 5: 2010 TRCR 2014 Super Peak, Peak and Shoulder Periods where PG&E is the Purchaser
29
Proxy Transmission Facility description Cost of Proxy Network Upgrades to
accommodate MW Level of Potential
Generation ($ millions in 2007 dollars)
Proxy Voltage Support Devices*
Substation Associated With Cluster of Potential Generation Level
Maximum MW of
Potential Generation
In each Level
Proxy Voltage Support Devices*
Other Proxy
Transm. upgrades Limiting elements
SVC Qmax
(MVAR)
SVC Qmin
(MVAR) Other Proxy Transmission upgrades
3 350 25 46 COTWD_F 230-COTWDWAP 230 175 -117 Build new 500/230 xformer
1 0 0 0 CASCADE 60-OREGNTRL 60 0 0 Delta Metering Station 115 kV 2 500 35 318 LOMS JCT 60-DESCHUTS 60 250 -167 Build new Delta-Cottonwood 230 DCTL
1 450 32 0 T22_93 230-LAKEVILE 230 225 -150 2 150 11 37 FULTON 230-IGNACIO 230 75 -50 Reconductor Fulton-Lakeville 230
3 500 35 85 CROCKETT 230-SOBRANTE 230 250 -167 Reconductor Fulton-Ignacio 230 4 300 21 258 FULTON 230-FULTON 115 150 -100 Build new Crocket-Sobrante 230 DCTL
Fulton 230 kV
5 100 7 35 FULTON 230-FULTON 115 50 -33 Build new 230/115 xformer Gates 230 kV 1 960 67 0 WESTLEY 230-LOSBANOS 230 500 -333
1 0 0 0 BORDEN 230-GREGG 230 0 0
2 275 19 4 STOREY 1 230-GREGG 230 138 -92 Reconductor Borden-Gregg 230 DCTL 3 325 23 7 STOREY 1 230-WILSON 230 163 -108 Reconductor Storey-Borden 230 DCTL
4 125 9 43 WARNERVL 230-WILSON 230 63 -42 Reconductor Wilson-Storey 230 DCTL
Gregg 230 kV
5 275 19 28 KEARNEY 230-HERNDON 230 138 -92 Reconductor Wilson-Warnerville 230 DCTL

Table 5: 2010 TRCR 2014 Super Peak, Peak and Shoulder Periods where PG&E is the Purchaser
30
Proxy Transmission Facility description Cost of Proxy Network Upgrades to
accommodate MW Level of Potential
Generation ($ millions in 2007 dollars)
Proxy Voltage Support Devices*
Substation Associated With Cluster of Potential Generation Level
Maximum MW of
Potential Generation
In each Level
Proxy Voltage Support Devices*
Other Proxy
Transm. upgrades Limiting elements
SVC Qmax
(MVAR)
SVC Qmin
(MVAR) Other Proxy Transmission upgrades 1 150 11 0 HELM 70-STRD JCT 70 75 -50 2 600 42 18 HELM 230-MC CALL 230 300 -200 Reconductor Panoche-Helm 230 3 150 11 22 STOREY 1 230-GREGG 230 75 -50 Reconductor Helm-McCall 230
Helm 230 kV
4 100 7 12 PANOCHE 230-DS AMIGO 230 50 -33 Reconductor Gregg-Borden-Storey 230 DCTL
1 0 0 0 Cottonwood-Humboldt 115 kV 0 0
2 350 25 383 ROUND MT 500-TABLE MT 500 175 -117 Build new Cottonwood-Humboldt 230 kV DCTL
Humboldt 115 kV
3 150 11 298 EEL RIVR 60-NEWBURG 60 75 -50 Build new Round Mt-Table Mt 230 DCTL
1 550 39 0 WESTLEY 230-LOSBANOS 230 275 -183 Los Banos 230 kV
2 450 32 17 CHEVPIPE 70-LOS BANS 70 225 -150 Reconductor Los Banos-Westley 230 DCTL
Metcalf 230 kV 1 1000 70 0 LS ESTRS 230-METCALF 230 500 -333
1 1310 92 0 MIDWAY 500-MIDWAY 230 725 -483 2 250 18 46 WESTLEY 230-LOSBANOS 230 125 -83 Build new 500/230 xformer
Midway 230 kV
3 1300 91 17 TRES VAQ 230-TESLA C 230 650 -433 Reconductor Los Banos-Westley 230 DCTL
Morro Bay 1 750 53 0 GATES 230-MORROBAY 230 375 -250

Table 5: 2010 TRCR 2014 Super Peak, Peak and Shoulder Periods where PG&E is the Purchaser
31
Proxy Transmission Facility description Cost of Proxy Network Upgrades to
accommodate MW Level of Potential
Generation ($ millions in 2007 dollars)
Proxy Voltage Support Devices*
Substation Associated With Cluster of Potential Generation Level
Maximum MW of
Potential Generation
In each Level
Proxy Voltage Support Devices*
Other Proxy
Transm. upgrades Limiting elements
SVC Qmax
(MVAR)
SVC Qmin
(MVAR) Other Proxy Transmission upgrades 230 kV
2 250 18 98 MORROBAY 230-Q239SWST 230 125 -83 Reconductor Morro Bay-Gates DCTL (Templeton in between)
1 1400 98 0 NEWARK E 230-NWK DIST 230 700 -467
2 50 4 49 NWK DIST 230-LS ESTRS 230 25 -17 Build new Newark-Newark Dist 230 DCTL
Newark 230 kV
3 50 4 292 TESLA E 230-WESTLEY 230 25 -17 Build new Newark-Los Esteros 230 DCTL
1 670 47 0 PANOCHE 230-DS AMIGO 230 450 -300
2 50 4 17 WESTLEY 230-LOSBANOS 230 25 -17 Reconductor Panoche-Dos Amigo 230 DCTL
Panoche 230 kV
3 50 4 17 LOSBANOS 230-PANOCHE 230 25 -17 Reconductor Los Banos-Westley 230 DCTL
1 0 0 0 TABLE MT 500-VACA-DIX 500 0 0
2 250 18 470 COTWD_F 230-BRNY_FST 230 125 -83 Build new Table Mt-Vaca Dixon 230 DCTL (230 kV config)
3 50 4 10 Q074SWST 230-ROUND MT 230 25 -17 Reconductor Pit 3-Round Mt 230 DCTL
Pit 1 230 kV
4 700 49 10 ROUND MT 500-RD MT 1M 500 350 -233 Reconductor Pit 1-Pit 3 230 DCTL
1 0 0 0 RIO OSO 230-ATLANTC 230 0 0 2 250 18 61 RIO OSO 230-BRIGHTON 230 125 -83 Reconductor Rio Oso-Atlantic 230 DCTL 3 200 14 94 RIO OSO 230-GOLDHILL 230 100 -67 Reconductor Rio Oso-Brighton 230 DCTL
Rio Oso 230 kV
4 550 39 38 ATLANTC 230-GOLDHILL 230 275 -183 Reconductor Atlantic-Goldhill 230 DCTL

Table 5: 2010 TRCR 2014 Super Peak, Peak and Shoulder Periods where PG&E is the Purchaser
32
Proxy Transmission Facility description Cost of Proxy Network Upgrades to
accommodate MW Level of Potential
Generation ($ millions in 2007 dollars)
Proxy Voltage Support Devices*
Substation Associated With Cluster of Potential Generation Level
Maximum MW of
Potential Generation
In each Level
Proxy Voltage Support Devices*
Other Proxy
Transm. upgrades Limiting elements
SVC Qmax
(MVAR)
SVC Qmin
(MVAR) Other Proxy Transmission upgrades 1 0 0 0 CPVSTA 230-CORTINA 230 0 0 2 800 56 768 TABLE MT 500-VACA-DIX 500 400 -267 Build new Round Mt-Table Mt 230 DCTL
3 350 25 46 RD MT 1M 500-ROUND MT 230 175 -117 Build new Table Mt-Vaca Dixon 230 DCTL (230 kV config)
Round Mt 230 kV
4 850 60 245 TABLE MT 500-TESLA 500 425 -283 Build new 500/230 xformer
1 0 0 0 TESLA E 230-NEWARK D 230 0 0 2 750 53 294 STAGG 230-EIGHT MI 230 375 -250 Build new Tesla-Newark 230 DCTL
Stagg 230 kV
3 250 18 10 STAGG-J2 230-TESLA E 230 125 -83 Reconductor Stagg-8Mile 230 DCTL
1 0 0 0 CHCGO PK 115-HIGGINS 115 0 0 2 250 18 287 RIO OSO 115-BRNSWKTP 115 125 -83 Build new Summit-Placer 230 DCTL
Summit Metering Station 115 kV 3 250 18 94 RIO OSO 115-BRNSWCKP 115 125 -83 Reconductor Rio Oso-Brighton 230 DCTL
1 0 0 0 TABLE MT 500-VACA-DIX 500 0 0
2 900 63 470 TABLE MT 500-TB MT 1M 500 450 -300 Build new Table Mt-Vaca Dixon 230 DCTL (230 kV config)
Table Mt 230 kV
3 100 7 46 TBL MT D 230-TBL MT E 230 50 -33 Build new 500/230 xformer
1 0 0 0 TESLA E 230-NEWARK D 230 0 0 Tesla 230 kV 2 1000 70 418 STOREY 2 230-WILSON 230 500 -333 Build new Sunol 500
1 0 0 0 VACA-DIX 230-PARKWAY 230 0 0 Vaca Dixon 230 kV 2 1000 70 378 STOREY 2 230-BORDEN 230 500 -333 Build new Collinsville 500

Table 5: 2010 TRCR 2014 Super Peak, Peak and Shoulder Periods where PG&E is the Purchaser
33
Proxy Transmission Facility description Cost of Proxy Network Upgrades to
accommodate MW Level of Potential
Generation ($ millions in 2007 dollars)
Proxy Voltage Support Devices*
Substation Associated With Cluster of Potential Generation Level
Maximum MW of
Potential Generation
In each Level
Proxy Voltage Support Devices*
Other Proxy
Transm. upgrades Limiting elements
SVC Qmax
(MVAR)
SVC Qmin
(MVAR) Other Proxy Transmission upgrades
1 450 32 0 WARNERVL 230-WILSON 230 225 -150 2 500 35 28 WARNERVL 230-WRNRVLLE 115 250 -167 Reconductor Wilson-Warnerville 230 DCTL
Wilson 230 kV
3 50 4 35 WARNERVL 230-COTTLE B 230 25 -17 Build new 230/115 xformer

Table 6: 2010 TRCR 2014 Night Periods where PG&E is the Purchaser
34
Proxy Transmission Facility description Cost of Proxy Network Upgrades to
accommodate MW Level of Potential
Generation ($ millions in 2007
dollars) Proxy Voltage
Support Devices* Substation Associated With Cluster of Potential Generation Level
Maximum MW of
Potential Generation
In each Level
Proxy Voltage Support Devices*
Other Proxy
Transm. upgrades Limiting elements
SVC Qmax
(MVAR)
SVC Qmin
(MVAR) Other Proxy Transmission upgrades 1 400 28 0 Wilson-Warnerville 230 DCTL 200 -133 2 500 35 28 Bellota-Cottle 230 DCTL 250 -167 Wilson-Warnerville 230 DCTL
Bellota 230 kV 3 100 7 15 50 -33 Bellota-Cottle 230 DCTL
1 150 11 0 Caribou-Beldon-Table Mt 230 DCTL 75 -50 2 650 46 38 500/230 xformer 325 -217 Caribou-Beldon-Table Mt 230 DCTL
Caribou 230 kV 3 200 14 46 500/230 xformer 100 -67 500/230 xformer
1 0 0 0 GATES 500-MIDWAY 500 0 0 Carrizo Plains 115 kV
2 500 35 1156 Midway-Temblor 230 kV 250 -167 C3ET Project
1 300 21 0 Cortina-Vaca Dixon 230 DCTL 150 -100 2 500 35 40 CPVSta-Cortina 230 DCTL 250 -167 Cortina-Vaca Dixon 230 DCTL
Cortina 230 kV 3 200 14 59 100 -67 CPVSta-Cortina 230 DCTL
1 850 60 0 Olinda 500/230 V xformer 425 -283 2 250 18 46 Cottonwood-Round Mt 230 kV DCTL 125 -83 500/230 xformer 3 200 14 24 Round Mt-Table Mt 230 DCTL 100 -67 Cottonwood-Round Mt 230 kV DCTL
Cottonwood 230 kV
4 200 14 298 Round Mt 500/230 xformer 100 -67 Round Mt-Table Mt 230 DCTL
1 0 0 0 Delta-Cascade-Cottonwood 115 kV 0 0 Delta Metering Station 115 kV
2 500 35 318 Cottonwood 230/115 kV xformer 250 -167 Delta-Cottonwood 230 DCTL
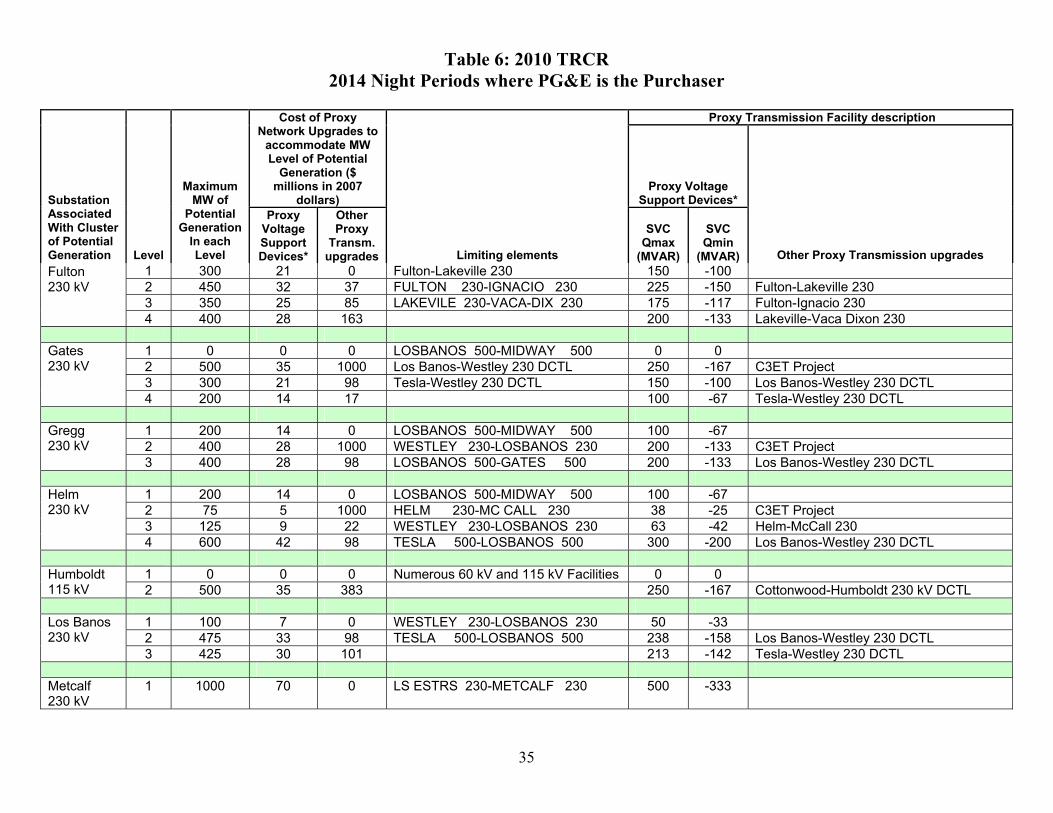
Table 6: 2010 TRCR 2014 Night Periods where PG&E is the Purchaser
35
Proxy Transmission Facility description Cost of Proxy Network Upgrades to
accommodate MW Level of Potential
Generation ($ millions in 2007
dollars) Proxy Voltage
Support Devices* Substation Associated With Cluster of Potential Generation Level
Maximum MW of
Potential Generation
In each Level
Proxy Voltage Support Devices*
Other Proxy
Transm. upgrades Limiting elements
SVC Qmax
(MVAR)
SVC Qmin
(MVAR) Other Proxy Transmission upgrades 1 300 21 0 Fulton-Lakeville 230 150 -100 2 450 32 37 FULTON 230-IGNACIO 230 225 -150 Fulton-Lakeville 230 3 350 25 85 LAKEVILE 230-VACA-DIX 230 175 -117 Fulton-Ignacio 230
Fulton 230 kV
4 400 28 163 200 -133 Lakeville-Vaca Dixon 230
1 0 0 0 LOSBANOS 500-MIDWAY 500 0 0 2 500 35 1000 Los Banos-Westley 230 DCTL 250 -167 C3ET Project 3 300 21 98 Tesla-Westley 230 DCTL 150 -100 Los Banos-Westley 230 DCTL
Gates 230 kV
4 200 14 17 100 -67 Tesla-Westley 230 DCTL
1 200 14 0 LOSBANOS 500-MIDWAY 500 100 -67 2 400 28 1000 WESTLEY 230-LOSBANOS 230 200 -133 C3ET Project
Gregg 230 kV 3 400 28 98 LOSBANOS 500-GATES 500 200 -133 Los Banos-Westley 230 DCTL
1 200 14 0 LOSBANOS 500-MIDWAY 500 100 -67 2 75 5 1000 HELM 230-MC CALL 230 38 -25 C3ET Project 3 125 9 22 WESTLEY 230-LOSBANOS 230 63 -42 Helm-McCall 230
Helm 230 kV
4 600 42 98 TESLA 500-LOSBANOS 500 300 -200 Los Banos-Westley 230 DCTL
1 0 0 0 Numerous 60 kV and 115 kV Facilities 0 0 Humboldt 115 kV 2 500 35 383 250 -167 Cottonwood-Humboldt 230 kV DCTL
1 100 7 0 WESTLEY 230-LOSBANOS 230 50 -33 2 475 33 98 TESLA 500-LOSBANOS 500 238 -158 Los Banos-Westley 230 DCTL
Los Banos 230 kV 3 425 30 101 213 -142 Tesla-Westley 230 DCTL Metcalf 230 kV
1 1000 70 0 LS ESTRS 230-METCALF 230 500 -333

Table 6: 2010 TRCR 2014 Night Periods where PG&E is the Purchaser
36
Proxy Transmission Facility description Cost of Proxy Network Upgrades to
accommodate MW Level of Potential
Generation ($ millions in 2007
dollars) Proxy Voltage
Support Devices* Substation Associated With Cluster of Potential Generation Level
Maximum MW of
Potential Generation
In each Level
Proxy Voltage Support Devices*
Other Proxy
Transm. upgrades Limiting elements
SVC Qmax
(MVAR)
SVC Qmin
(MVAR) Other Proxy Transmission upgrades
1 0 0 0 Gates-Midway 500 kV and Los Banos-Midway 500 kV
0 0
2 600 42 1000 Los Banos-Westley 230 DCTL 300 -200 C3ET Project 3 175 12 98 Tesla-Westley 230 DCTL 88 -58 Los Banos-Westley 230 DCTL 4 1075 75 101 Midway 500/230 kV xformer 538 -358 Tesla-Westley 230 DCTL
Midway 230 kV
5 1150 81 46 575 -383 500/230 xformer
1 0 0 0 Gates-Midway 500 kV and Los Banos-Midway 500 kV
0 0
2 500 35 1000 GATES 230-MORROBAY 230 250 -167 C3ET Project 3 50 4 98 WESTLEY 230-LOSBANOS 230 25 -17 Morro Bay-Gates DCTL (Templeton in
between) 4 225 16 98 TESLA 500-LOSBANOS 500 113 -75 Los Banos-Westley 230 DCTL
Morro Bay 230 kV
5 725 51 101 363 -242 Tesla-Westley 230 DCTL Newark 230 kV
1 1500 105 0 CASTROVL 230-NEWARK E 230 750 -500
1 0 0 0 Panoche-McMullin-Kearney 230 0 0 2 325 23 26 Los Banos-Westley 230 DCTL 163 -108 Panoche-McMullin-Kearney 230
Panoche 230 kV
3 675 47 98 TESLA 500-LOSBANOS 500 338 -225 Los Banos-Westley 230 DCTL
1 175 12 0 Pit 3-Round Mt 230 DCTL 88 -58 2 50 4 10 Pit 1-Pit 3 230 DCTL 25 -17 Pit 3-Round Mt 230 DCTL 3 575 40 10 Round Mt 500/230 kV xformer 288 -192 Pit 1-Pit 3 230 DCTL
Pit 1 230 kV
4 200 14 46 100 -67 500/230 xformer

Table 6: 2010 TRCR 2014 Night Periods where PG&E is the Purchaser
37
Proxy Transmission Facility description Cost of Proxy Network Upgrades to
accommodate MW Level of Potential
Generation ($ millions in 2007
dollars) Proxy Voltage
Support Devices* Substation Associated With Cluster of Potential Generation Level
Maximum MW of
Potential Generation
In each Level
Proxy Voltage Support Devices*
Other Proxy
Transm. upgrades Limiting elements
SVC Qmax
(MVAR)
SVC Qmin
(MVAR) Other Proxy Transmission upgrades Rio Oso 230 kV
1 1000 70 0 RIO OSO 230-BRIGHTON 230 500 -333
1 600 42 0 Round Mt 500/230 kV xformer 300 -200 Round Mt
230 kV 2 1400 98 46 700 -467 500/230 xformer
1 650 46 0 STAGG 230-STAGG-H 230 325 -217 Stagg 230 kV 2 350 25 10 175 -117 Stagg-8Mile 230 DCTL
1 75 5 0 CHCGO PK 115-HIGGINS 115 38 -25 Summit Metering Station 115 kV
2 425 30 287 RIO OSO 115-BRNSWKTP 115 213 -142 Summit-Placer 230 DCTL
1 800 56 0 Table Mt 500/230 kV xformer 400 -267 Table Mt
230 kV 2 200 14 46 500/230 xformer Tesla 230 kV
1 1000 70 0 500 -333
Vaca Dixon 230 kV
1 1000 70 0 500 -333
1 700 49 0 Gregg-Borden-Storey 230 DCTL 2 50 4 12 Wilson-Storey 230 DCTL Gregg-Borden-Storey 230 DCTL
Wilson 230 kV
3 250 18 43 WESTLEY 230-LOSBANOS 230 Wilson-Storey 230 DCTL

Table 7: 2010 TRCR 2014 Super Peak, Peak and Shoulder Periods where SCE or SDG&E is the Purchaser
38
Proxy Transmission Facility description Cost of Proxy Network Upgrades to
accommodate MW Level of Potential
Generation ($ millions in 2007 dollars)
Proxy Voltage Support Devices* Substation
Associated With Cluster of Potential Generation
Maximum MW of
Potential Generation
In each Level
Proxy Voltage Support Devices*
Other Proxy
Transm. upgrades Limiting elements
SVC Qmax
(MVAR)
SVC Qmin
(MVAR) Other Proxy Transmission upgrades Bellota 230 kV 1 1000 70 0 BELLOTA 230-COTTLE B 230 500 -333
1 0 0 0 Caribou-Beldon-Table Mt 230 DCTL and Table Mt - Vaca 500 kV 0 0
Caribou 230 kV
2 950 67 508 475 -317
Caribou-Beldon-Table Mt 230 DCTL and Table Mt-Vaca Dixon 230 DCTL (230 kV config)
1 0 0 0 San Louis Obispo - Carrizo 115 kV 50 -33 Carrizo
Plains 115 kV 2 310 22 156 Midway - Temblor 115 kV 200 -133 Midway-Carizo 230
1 350 25 0 CORTINA 230-VACA-DIX 230 175 -117 2 450 32 40 CPVSTA 230-VACA-DIX 230 225 -150 Cortina-Vaca Dixon 230 DCTL
Cortina 230 kV 3 200 14 59 HPLND JT 60-CLVRDLJT 60 100 -67 CPVSta-Cortina 230 DCTL
1 0 0 0 TABLE MT 500-VACA-DIX 500 0 0
2 275 19 283 ROUND MT 500-TABLE MT 500 138 -92 Table Mt-Vaca Dixon 230 SCTL (500 kV config)
3 725 51 298 OLINDA 500-OLINDAW 230 363 -242 Round Mt-Table Mt 230 DCTL
Cottonwood 230 kV
4 500 35 46 COTWD_F 230-COTWDWAP 230 250 -167 500/230 xformer
1 0 0 0 Delta-Cascade-Cottonwood 115 kV 0 0 Delta Metering Station 115 kV 2 500 35 318 250 -167 Delta-Cottonwood 230 DCTL
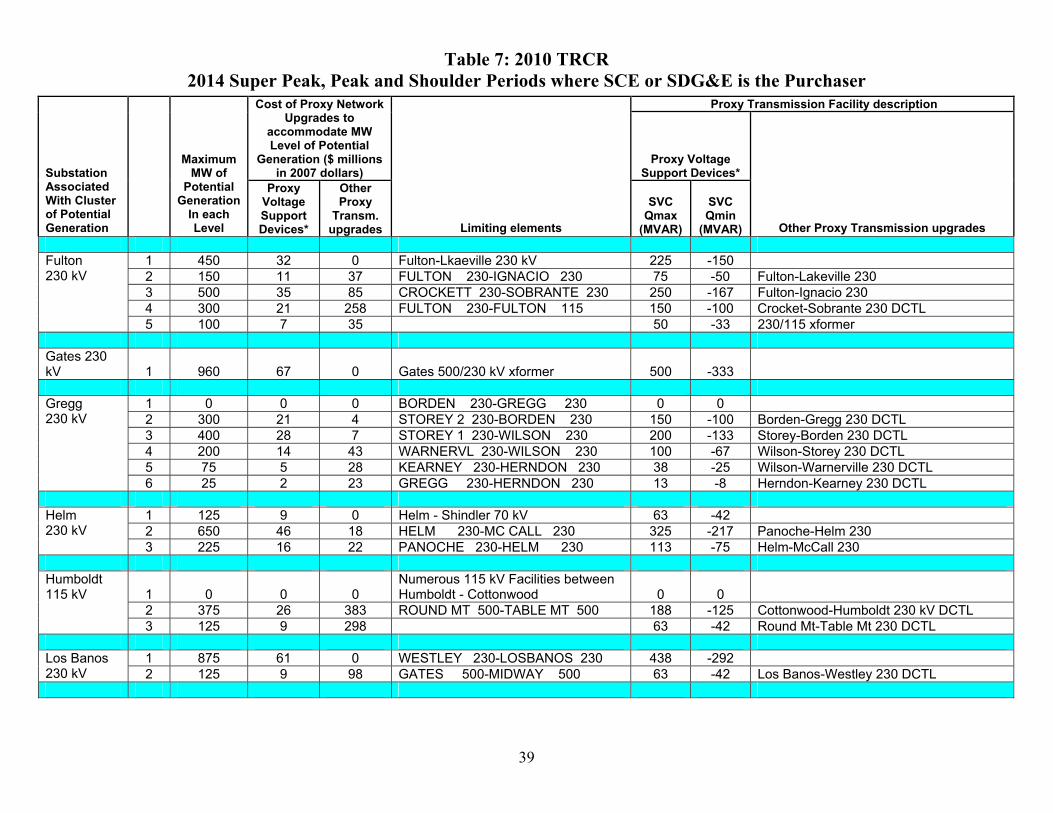
Table 7: 2010 TRCR 2014 Super Peak, Peak and Shoulder Periods where SCE or SDG&E is the Purchaser
39
Proxy Transmission Facility description Cost of Proxy Network Upgrades to
accommodate MW Level of Potential
Generation ($ millions in 2007 dollars)
Proxy Voltage Support Devices* Substation
Associated With Cluster of Potential Generation
Maximum MW of
Potential Generation
In each Level
Proxy Voltage Support Devices*
Other Proxy
Transm. upgrades Limiting elements
SVC Qmax
(MVAR)
SVC Qmin
(MVAR) Other Proxy Transmission upgrades
1 450 32 0 Fulton-Lkaeville 230 kV 225 -150 2 150 11 37 FULTON 230-IGNACIO 230 75 -50 Fulton-Lakeville 230 3 500 35 85 CROCKETT 230-SOBRANTE 230 250 -167 Fulton-Ignacio 230 4 300 21 258 FULTON 230-FULTON 115 150 -100 Crocket-Sobrante 230 DCTL
Fulton 230 kV
5 100 7 35 50 -33 230/115 xformer Gates 230 kV 1 960 67 0 Gates 500/230 kV xformer 500 -333
1 0 0 0 BORDEN 230-GREGG 230 0 0 2 300 21 4 STOREY 2 230-BORDEN 230 150 -100 Borden-Gregg 230 DCTL 3 400 28 7 STOREY 1 230-WILSON 230 200 -133 Storey-Borden 230 DCTL 4 200 14 43 WARNERVL 230-WILSON 230 100 -67 Wilson-Storey 230 DCTL 5 75 5 28 KEARNEY 230-HERNDON 230 38 -25 Wilson-Warnerville 230 DCTL
Gregg 230 kV
6 25 2 23 GREGG 230-HERNDON 230 13 -8 Herndon-Kearney 230 DCTL
1 125 9 0 Helm - Shindler 70 kV 63 -42 2 650 46 18 HELM 230-MC CALL 230 325 -217 Panoche-Helm 230
Helm 230 kV
3 225 16 22 PANOCHE 230-HELM 230 113 -75 Helm-McCall 230
1 0 0 0 Numerous 115 kV Facilities between Humboldt - Cottonwood 0 0
2 375 26 383 ROUND MT 500-TABLE MT 500 188 -125 Cottonwood-Humboldt 230 kV DCTL
Humboldt 115 kV
3 125 9 298 63 -42 Round Mt-Table Mt 230 DCTL
1 875 61 0 WESTLEY 230-LOSBANOS 230 438 -292 Los Banos 230 kV 2 125 9 98 GATES 500-MIDWAY 500 63 -42 Los Banos-Westley 230 DCTL

Table 7: 2010 TRCR 2014 Super Peak, Peak and Shoulder Periods where SCE or SDG&E is the Purchaser
40
Proxy Transmission Facility description Cost of Proxy Network Upgrades to
accommodate MW Level of Potential
Generation ($ millions in 2007 dollars)
Proxy Voltage Support Devices* Substation
Associated With Cluster of Potential Generation
Maximum MW of
Potential Generation
In each Level
Proxy Voltage Support Devices*
Other Proxy
Transm. upgrades Limiting elements
SVC Qmax
(MVAR)
SVC Qmin
(MVAR) Other Proxy Transmission upgrades Metcalf 230 kV 1 1000 70 0 GATES 500-MIDWAY 500 500 -333
1 1135 79 0 Midway 500/230 kV xformer 638 -425 Midway 230 kV 2 1725 121 46 863 -575 500/230 xformer
1 825 58 0 GATES 230-MORROBAY 230 413 -275
2 200 14 98 Morro Bay - Midway 230 kV 100 -67 Morro Bay-Gates DCTL (Templeton in between)
Morro 230 kV
3 475 33 114 238 -158 Morro Bay-Midway 230 DCTL
1 1,275 89 0 NWK DIST 230-LS ESTRS 230 638 -425 2 125 9 49 NEWARK E 230-NWK DIST 230 63 -42 Newark-Newark Dist 230 DCTL
Newark 230 kV
3 100 7 292 GATES 500-MIDWAY 500 50 -33 Newark-Los Esteros 230 DCTL Panoche 230 kV 1 770 54 0 500 -333
1 0 0 0 TABLE MT 500-VACA-DIX 500 0 0
2 325 23 283 Pit 1 - Pit 3 230 kV 163 -108 Table Mt-Vaca Dixon 230 SCTL (500 kV config)
3 75 5 10 Pit 3 - Round Mt 230 kV 38 -25 Pit 1-Pit 3 230 DCTL
Pit 1 230 kV
4 600 42 10 Round Mt 500/230 kV xformer 300 -200 Pit 3-Round Mt 230 DCTL
1 0 0 0 RIO OSO 230-ATLANTC 230 0 0 2 250 18 61 RIO OSO 230-BRIGHTON 230 125 -83 Rio Oso-Atlantic 230 DCTL 3 200 14 94 ATLANTC 230-GOLDHILL 230 100 -67 Rio Oso-Brighton 230 DCTL
Rio Oso 230 kV
4 550 39 38 275 -183 Atlantic-Goldhill 230 DCTL Round Mt 1 0 0 0 TABLE MT 500-VACA-DIX 500 0 0

Table 7: 2010 TRCR 2014 Super Peak, Peak and Shoulder Periods where SCE or SDG&E is the Purchaser
41
Proxy Transmission Facility description Cost of Proxy Network Upgrades to
accommodate MW Level of Potential
Generation ($ millions in 2007 dollars)
Proxy Voltage Support Devices* Substation
Associated With Cluster of Potential Generation
Maximum MW of
Potential Generation
In each Level
Proxy Voltage Support Devices*
Other Proxy
Transm. upgrades Limiting elements
SVC Qmax
(MVAR)
SVC Qmin
(MVAR) Other Proxy Transmission upgrades
2 150 11 470 ROUND MT 500-TABLE MT 500 75 -50 Table Mt-Vaca Dixon 230 DCTL (230 kV config)
3 675 47 298 Round Mt 500/230 kV xformer 338 -225 Round Mt-Table Mt 230 DCTL 4 325 23 46 TABLE MT 500-TESLA 500 163 -108 500/230 xformer
230 kV
5 850 60 245 425 -283 Vaca Dixon-Tesla 230 DCTL
1 750 53 0 STAGG 230-STAGG-H 230 375 -250 Stagg 230 kV 2 250 18 10 125 -83 Stagg-8Mile 230 DCTL
1 0 0 0 Summit - Drum - Placer 115 kV 0 0 2 250 18 287 RIO OSO 230-BRIGHTON 230 125 -83 Summit-Placer 230 DCTL
Summit Metering Station 115 kV 3 250 18 94 125 -83 Rio Oso-Brighton 230 DCTL
1 0 0 0 TABLE MT 500-VACA-DIX 500 0 0
2 900 63 470 Table Mt 500/230 kV xformer 450 -300 Table Mt-Vaca Dixon 230 DCTL (230 kV config)
3 50 4 46 TABLE MT 500-TESLA 500 25 -17 500/230 xformer
Table Mt 230 kV
4 50 4 245 TBL MTX1 230-TBL MT E 230 25 -17 Vaca Dixon-Tesla 230 DCTL Tesla 230 kV 1 1,000 70 0 TESLA E 230-WESTLEY 230 500 -333
1 0 0 0 VACA-DIX 230-BAHIA 230 0 0 Vaca Dixon 230 kV 2 1,000 70 245 C.COSTA 230-WND MSTR 230 500 -333 Vaca Dixon-Tesla 230 DCTL
1 500 35 0 WARNERVL 230-WILSON 230 250 -167 Wilson 230 kV 2 500 35 28 250 -167 Wilson-Warnerville 230 DCTL

Table 8: 2010 TRCR 2014 Night Periods where SCE or SDG&E is the Purchaser
42
Proxy Transmission Facility description
Cost of Proxy Network Upgrades to
accommodate MW Level of Potential
Generation ($ millions in 2007 dollars)
Proxy Voltage Support Devices*
Substation Associated With Cluster of Potential Generation Level
Maximum MW of
Potential Generation
In each Level
Proxy Voltage Support Devices*
Other Proxy
Transm. upgrades Limiting elements
SVC Qmax
(MVAR)
SVC Qmin
(MVAR) Other Proxy Transmission upgrades
1 400 28 0WARNERVL 230-WILSON 230 200 -133
2 525 37 28BELLOTA 230-COTTLE B 230 263 -175 Wilson-Warnerville 230 DCTL
Bellota 230 kV
3 75 5 15WARNERVL 230-COTTLE B 230 38 -25 Bellota-Cottle 230 DCTL
1 150 11 0 Caribou - Table Mt 230 kV 75 -50 Caribou 230 kV
2 650 46 38 TABLE MT 500-TB MT 1M 500 325 -217 Caribou-Beldon-Table Mt 230 DCTL
1 25 2 0San Louis Obispo - Carrizo 115 kV 13 -8
Carrizo Plains 115 kV 2 475 33 156 Midway - Temblor 115 kV 238 -158 Midway-Carizo 230
1 325 23 0 CORTINA 230-CORTINA 115 163 -108 2 125 9 35 CPVSTA 230-CORTINA 230 63 -42 Cortina 230/115 kV xformer 3 475 33 59 CORTINA 230-VACA-DIX 230 238 -158 CPVSta-Cortina 230 DCTL
Cortina 230 kV
4 75 5 40GYSRJCT1 60-FTCHMTNP 60 38 -25 Cortina-Vaca Dixon 230 DCTL
Cottonwood 230 kV 1 875 61 0 OLINDA 500-OLINDAW 230 438 -292
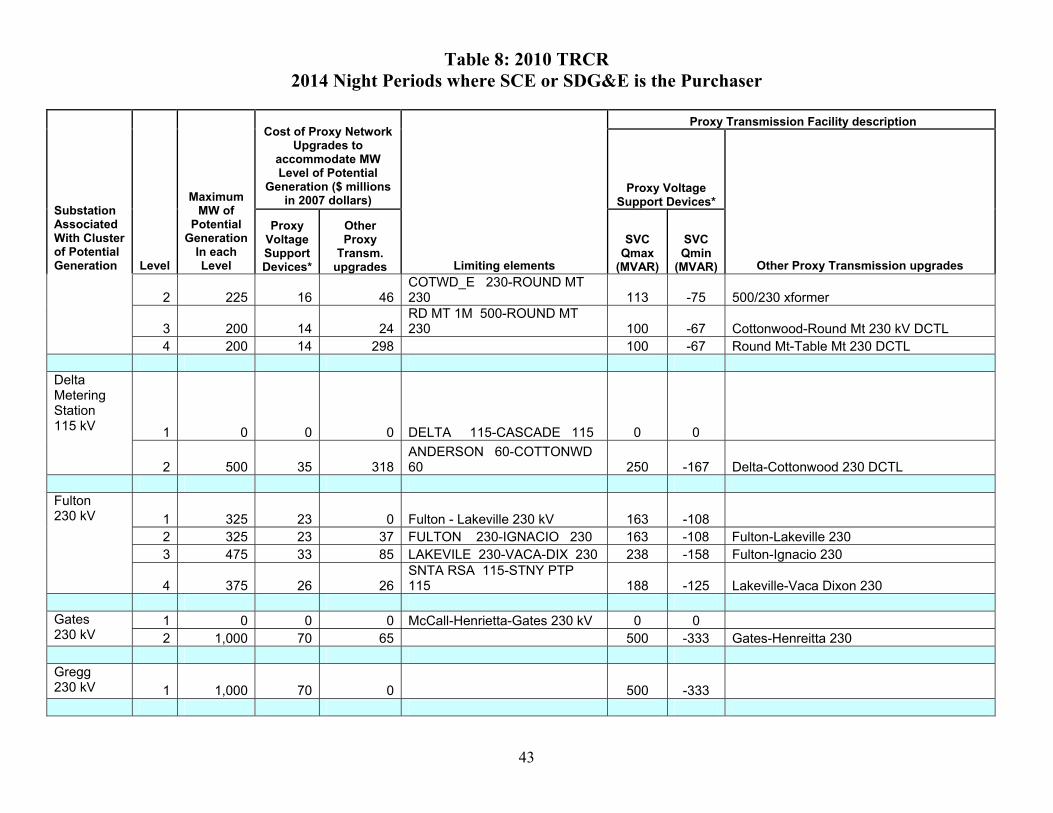
Table 8: 2010 TRCR 2014 Night Periods where SCE or SDG&E is the Purchaser
43
Proxy Transmission Facility description Cost of Proxy Network
Upgrades to accommodate MW Level of Potential
Generation ($ millions in 2007 dollars)
Proxy Voltage Support Devices*
Substation Associated With Cluster of Potential Generation Level
Maximum MW of
Potential Generation
In each Level
Proxy Voltage Support Devices*
Other Proxy
Transm. upgrades Limiting elements
SVC Qmax
(MVAR)
SVC Qmin
(MVAR) Other Proxy Transmission upgrades
2 225 16 46COTWD_E 230-ROUND MT 230 113 -75 500/230 xformer
3 200 14 24RD MT 1M 500-ROUND MT 230 100 -67 Cottonwood-Round Mt 230 kV DCTL
4 200 14 298 100 -67 Round Mt-Table Mt 230 DCTL
1 0 0 0 DELTA 115-CASCADE 115 0 0
Delta Metering Station 115 kV
2 500 35 318ANDERSON 60-COTTONWD 60 250 -167 Delta-Cottonwood 230 DCTL
1 325 23 0 Fulton - Lakeville 230 kV 163 -108 2 325 23 37 FULTON 230-IGNACIO 230 163 -108 Fulton-Lakeville 230 3 475 33 85 LAKEVILE 230-VACA-DIX 230 238 -158 Fulton-Ignacio 230
Fulton 230 kV
4 375 26 26SNTA RSA 115-STNY PTP 115 188 -125 Lakeville-Vaca Dixon 230
1 0 0 0 McCall-Henrietta-Gates 230 kV 0 0 Gates
230 kV 2 1,000 70 65 500 -333 Gates-Henreitta 230 Gregg 230 kV 1 1,000 70 0 500 -333

Table 8: 2010 TRCR 2014 Night Periods where SCE or SDG&E is the Purchaser
44
Proxy Transmission Facility description Cost of Proxy Network
Upgrades to accommodate MW Level of Potential
Generation ($ millions in 2007 dollars)
Proxy Voltage Support Devices*
Substation Associated With Cluster of Potential Generation Level
Maximum MW of
Potential Generation
In each Level
Proxy Voltage Support Devices*
Other Proxy
Transm. upgrades Limiting elements
SVC Qmax
(MVAR)
SVC Qmin
(MVAR) Other Proxy Transmission upgrades
1 250 18 0 HELM 230-MC CALL 230 125 -83 Helm 230 kV
2 750 53 22WESTLEY 230-LOSBANOS 230 375 -250 Helm-McCall 230
1 0 0 0Numerous 115 kV and 60 kV lines 0 0
Humboldt 115 kV
2 500 35 383 250 -167 Cottonwood-Humboldt 230 kV DCTL Los Banos 230 kV 1 1,000 70 0 500 -333 Metcalf 230 kV 1 1,000 70 0 500 -333
1 1,725 121 0 MIDWAY 500-MIDWAY 230 863 -575 Midway 230 kV
2 1,275 89 46 638 -425 Midway 500/230 kV xformer
1 500 35 0 Morro Bay_Gates 230 kV DCTL 250 -167 Morro 230 kV
2 1,000 70 98 500 -333 Morro Bay-Gates DCTL (Templeton in between)
Newark 230 kV 1 1,500 105 0 750 -500

Table 8: 2010 TRCR 2014 Night Periods where SCE or SDG&E is the Purchaser
45
Proxy Transmission Facility description Cost of Proxy Network
Upgrades to accommodate MW Level of Potential
Generation ($ millions in 2007 dollars)
Proxy Voltage Support Devices*
Substation Associated With Cluster of Potential Generation Level
Maximum MW of
Potential Generation
In each Level
Proxy Voltage Support Devices*
Other Proxy
Transm. upgrades Limiting elements
SVC Qmax
(MVAR)
SVC Qmin
(MVAR) Other Proxy Transmission upgrades
1 0 0 0HENRIETA 230-HENRITTA 70 0 0
2 700 49 84KEARNEY 230-HERNDON 230 350 -233 230/115 xformer
Panoche 230 kV
3 300 21 98Panoche-McMullen-Kearney 230 kV 150 -100
Herndon-Kearney and Panoche-McMullin-Kearney 230 kV DCTL
1 175 12 0 PIT 3 230-ROUND MT 230 88 -58 2 50 4 10 Pit 1 - Pit 3 230 25 -17 Pit 3-Round Mt 230 DCTL
3 575 40 10RD MT 1M 500-ROUND MT 230 288 -192 Pit 1-Pit 3 230 DCTL
Pit 1 230 kV
4 200 14 46 100 -67 500/230 xformer Rio Oso 230 kV 1 1,000 70 0
RIO OSO 230-BRIGHTON 230 500 -333
1 600 42 0RD MT 1M 500-ROUND MT 230 300 -200
Round Mt 230 kV
2 1,400 98 46 OLINDA 500-OLINDAW 230 700 -467 Round Mt 500/230 kV xformer
1 0 0 0 STAGG 230-STAGG-H 230 0 0 Stagg 230 kV 2 650 46 10 325 -217 Stagg-8Mile 230 DCTL

Table 8: 2010 TRCR 2014 Night Periods where SCE or SDG&E is the Purchaser
46
Proxy Transmission Facility description Cost of Proxy Network
Upgrades to accommodate MW Level of Potential
Generation ($ millions in 2007 dollars)
Proxy Voltage Support Devices*
Substation Associated With Cluster of Potential Generation Level
Maximum MW of
Potential Generation
In each Level
Proxy Voltage Support Devices*
Other Proxy
Transm. upgrades Limiting elements
SVC Qmax
(MVAR)
SVC Qmin
(MVAR) Other Proxy Transmission upgrades
1 75 5 0
Numerous 115 kV lines between Summit, Drum, Placer and Rio Oso 38 -25
Summit Metering Station 115 kV 2 425 30 287 213 -142 Summit-Placer 230 DCTL
1 800 56 0 TB MT 1M 500-TBL MTX1 230 400 -267 Table Mt 230 kV 2 200 14 46 100 -67 Table Mt 500/230 kV xformer Tesla 230 kV 1 1,000 70 0 TESLA E 230-TESLA D 230 500 -333 Vaca Dixon 230 kV 1 1,000 70 0
Vaca Dixen 500/2330 kV xformer 500 -333 Vaca Dixen 500/230 kV xformer
1 625 44 0 STOREY 1 230-GREGG 230 313 -208 2 50 4 12 STOREY 1 230-WILSON 230 25 -17 Gregg-Borden-Storey 230 DCTL
Wilson 230 kV
3 325 23 43 163 -108 Wilson-Storey 230 DCTL

47
Exhibit 1
PG&E Substations Associated with Renewable Resource Clusters for 2010 TRCR
OregonCalifornia
MalinCaptain Jack
Gates
Tracy
Southern California Edison (SCE) Vincent Sylmar
Tesla Newark
Vaca-Dixon
Round Mt. Olinda
Pacific Gas and Electric Co. (PG&E)
Cottonwood
Fulton
PanocheMidway
Bellota Wilson
Gregg Helm
Summit Table Mt.
Rio Oso
Los Banos
CaribouDelta Metering
Station
Pit 1
Morro Bay
Renewable resource Cluster
Stagg
Metcalf
Humbold
Carrizo Plains

48
Exhbit 2 Renewable Resource Potential based on CEC Consultant Draft Report on Strategic
Value Analysis, CEC-500-2005-106 (7/1/05 workshop)
OregonCalifornia
Malin Captain Jack
Gates
Diablo
Midway
Tracy
Southern California Edison (SCE) Vincent Sylmar
Tesla
Moss LandingLos Banos
Vaca Dixon
Round Mt
Metcalf
Olinda
Table Mt
2010, Additional: 132 MW; 428 GWH
Additional resources for 2010 is in addition to amount in 2004 Additional resources for 2017 is in addition to amount for 2010
2017, Additional: 28 MW; 61 GWH
2010, Additional: 218 MW; 1,719 GWH
2017, Additional: 41 MW; 90 GWH
2010 Additional: 275 MW, 891 GWH
2017, Additional: 3 MW; 7 GWH
General NP15 Locations - 2010, Additional:
364 MW; 1,337 GWH 2017, Additional:
476 MW; 2,191 GWH
Total S. CA - 2010, Additional:
5040 MW; 20,201 GWH 2017, Additional:
1369 MW; 6,996 GWH
PG&E RPS (20%) Requirements:
2010: 15,879 GWH 2017: 17,280 GWH 2004 Actual: 8,591 GWH
Total N. CA - 2010, Additional:
989 MW; 4,376 GWH 2017, Additional:
548 MW; 2,349 GWH Pacific Gas and Electric Co. (PG&E)

VERIFICATION
I am an employee of Pacific Gas And Electric Company, a corporation, and am
authorized to make this verification on its behalf. I have read the foregoing “Draft 2010
Transmission Ranking Cost Report of Pacific Gas and Electric Company (U 39-E) for
Renewables Portfolio Standard Procurement” dated January 20, 2010. The statements in the
foregoing document are true of my own knowledge, except as to matters which are therein stated
on information and belief, and as to those matters I believe them to be true.
I declare under penalty of perjury that the foregoing is true and correct.
Executed on this 20th day of January, 2010 at San Francisco, California
_________/s/______________________ Jon Eric Thalman Pacific Gas and Electric Company

CERTIFICATE OF SERVICE BY ELECTRONIC MAIL OR U.S. MAIL
I, the undersigned, state that I am a citizen of the United States and am employed in the City and County of San Francisco; that I am over the age of eighteen (18) years and not a party to the within cause; and that my business address is Pacific Gas and Electric Company, Law Department B30A, 77 Beale Street, San Francisco, CA 94105. I am readily familiar with the business practice of Pacific Gas and Electric Company for collection and processing of correspondence for mailing with the United States Postal Service. In the ordinary course of business, correspondence is deposited with the United States Postal Service the same day it is submitted for mailing. On the 20th day of January 2010, I served a true copy of:
DRAFT 2010 TRANSMISSION RANKING COST REPORT OF PACIFIC GAS AND ELECTRIC COMPANY (U 39-E)
FOR RENEWABLES PORTFOLIO STANDARD PROCUREMENT
[XX] By Electronic Mail – serving the enclosed via e-mail transmission to each of the parties listed on the official service list for R.08-08-009 with an e-mail address. [XX] By U.S. Mail – by placing the enclosed for collection and mailing, in the course of ordinary business practice, with other correspondence of Pacific Gas and Electric Company, enclosed in a sealed envelope, with postage fully prepaid, addressed to those parties listed on the official service list for R.08-08-009 without an e-mail address. I certify and declare under penalty of perjury under the laws of the State of California that the foregoing is true and correct. Executed on this 20th day of January 2010 at San Francisco, California.
/s/
AMY S. YU


