Beekeeping as an alternative source of livelihood in … · 5.1.2 Characteristics of the beekeepers...
76
Faculty of Bioscience Engineering Academic year 2015 – 2016 Beekeeping as an alternative source of livelihood in Uganda ELIZABETH AHIKIRIZA Promoters: Prof. dr. ir. Marijke D’Haese Dr.Wytse Vellema Tutor: Ms. Deborah Amulen Ruth Master’s dissertation submitted in partial fulfilment of the requirements for the degree of Master of Science in Nutrition and Rural Development, Main Subject: Rural Economics and Management.
-
Upload
phamkhuong -
Category
Documents
-
view
217 -
download
1
Transcript of Beekeeping as an alternative source of livelihood in … · 5.1.2 Characteristics of the beekeepers...
Faculty of Bioscience Engineering
Academic year 2015 – 2016
Beekeeping as an alternative source of livelihood in
Uganda
ELIZABETH AHIKIRIZA
Promoters: Prof. dr. ir. Marijke D’Haese
Dr.Wytse Vellema
Tutor: Ms. Deborah Amulen Ruth
Master’s dissertation submitted in partial fulfilment of the requirements for
the degree of Master of Science in Nutrition and Rural Development,
Main Subject: Rural Economics and Management.

i
DECLARATION
I, Elizabeth Ahikiriza, declare that this Master dissertation is my own original work and has never
been submitted here or in another University. Acknowledgement has been made to works of other
authors used accordingly. Permission for personal use and consultation purposes of this work is to be
given by the author, tutor and promoters. Copyrights laws apply for any other form of use.
Ghent University, June, 2016
Promoter: Co-promoter:
Prof. dr. ir. Marijke D’Haese Dr.Wytse Vellema
Email: [email protected] Email: [email protected]
Tutor: Author:
Ms. Deborah Amulen Ruth Elizabeth Ahikiriza
Email: [email protected] Email: [email protected]

ii
ACKNOWLEDGEMENT
This Master’s dissertation has been fruitful as a result of my effort, determination and focus.
However; it would never have been possible without combined support from different prudent people
to whom it is a pleasure for me to extend my gratitude.
First of all, I would like to express my sincere gratitude to Prof. dr. ir. Marijke D’Haese, my promoter
who tirelessly guided and worked with me right from the beginning of this research up to the point of
its accomplishment. Secondly, my great thanks go to my co-promoter Dr.Wytse Vellema who was
always there to correct my work at all times. I am further grateful to my tutor Ms. Deborah Amulen
Ruth for the assistance rendered to me during the course of this research work. I will forever be
grateful to your kindness, patience, hard work and the pieces of advice given.
I would like to also thank the European Commission that awarded me a fellowship through CARIBU
project with which my research work was made successful and meaningful. I do not forget other
professors and scientists whose influence will forever remain valuable. I am especially grateful to Ir.
Mie Remaut, Coordinator of the Human Nutrition and Rural Development program and Ms. Marian
Mareen for the great support through these two years spent at Ghent University. Additionally, I am
thankful for the professional and personal involvement of professors of Ghent University. I sincerely
give great thanks and gratitude to those caring and loving spirits who have been my advisors and
guides through all this academic experience.
Finally, I would like to express my gratitude to my father Rev. Mwesigye Charles Benon, my mother
Mrs. Mwesigye Ferestus, my sisters and brothers for the great contribution made to my education
without forgetting the moral and emotional support granted whenever needed. Since it is because of
them that I have achieved up to this point in life then this work is dedicated to them and may the
almighty God richly bless them.
iii
TABLE OF CONTENTS
DECLARATION ........................................................................................................................................ i
ACKNOWLEDGEMENT ........................................................................................................................ ii
ABSTRACT .............................................................................................................................................. vi
ABBREVIATIONS AND ACRONYMS ............................................................................................... vii
1. CHAPTER ONE: INTRODUCTION .................................................................................................. 1
1.1 Background ....................................................................................................................................... 1
1.2 Problem statement and rationale ....................................................................................................... 2
1.3 Objectives of the study ...................................................................................................................... 3
1.3.1 Overall objective ........................................................................................................................ 3
1.3.2 The specific objectives are: ........................................................................................................ 3
1.4 Structure of the dissertation ............................................................................................................... 3
2. CHAPTER TWO: LITERATURE REVIEW..................................................................................... 5
2.1 Beekeeping as a livelihood strategy and its contribution at household level .................................... 5
2.2 Adoption of beekeeping as an economic activity .............................................................................. 8
2.3 Factors influencing honey production in beekeeping ...................................................................... 10
2.4 The major beekeeping constraints ................................................................................................... 12
3. CHAPTER THREE: DATA ............................................................................................................... 14
3.1 Beekeeping in Uganda ..................................................................................................................... 14
3.2 Description of the study area ........................................................................................................... 15
3.2.1 Geographic relief, climate and economic activities in the area of study .................................. 15
3.2 Research design and data collection ................................................................................................ 17
3.3 Data management ............................................................................................................................ 18
4. CHAPTER FOUR: METHODS ........................................................................................................ 19
4.1 Methods of analysis ......................................................................................................................... 19
4.2 Variable construction....................................................................................................................... 22
5. CHAPTER FIVE: RESULTS ............................................................................................................ 23
5.1 Description of the farming households ............................................................................................ 23
5.1.2 Characteristics of the beekeepers ............................................................................................. 25
5.2 Economic contribution of beekeeping to the rural households ....................................................... 26
5.2.1 Bee products and their incomes ................................................................................................ 26

iv
5.2.2 Beekeeping equipment ............................................................................................................. 27
5.2.3 Beekeeping knowledge and skills ............................................................................................. 29
5.3.1 Factors likely to influence beekeeping adoption ...................................................................... 32
5.3.2 Classification of beekeepers based on the adoption cycle ........................................................ 35
5.4 Factors influencing the amount of honey produced by the adopters ............................................... 37
5.5 The major beekeeping constraints mentioned by adopters .............................................................. 39
6. CHAPTER SIX: DISCUSSION ......................................................................................................... 42
6.1 Predictors of beekeeping adoption .................................................................................................. 42
6.2 Honey production determinants and beekeeping barriers ............................................................... 44
6.3 Status of beekeeping in the area of study ........................................................................................ 45
6.4 Limitation of the study .................................................................................................................... 46
7. CHAPTER SEVEN: CONCLUSION AND RECOMMENDATIONS .......................................... 47
7.1 Conclusion ....................................................................................................................................... 47
7.2 Recommendations ........................................................................................................................... 47
REFERENCES ........................................................................................................................................ 49
APPENDICES ........................................................................................................................................ A1
Appendix 1: Household questionnaire ................................................................................................. A1
Appendix 2: Observation distributions based on to remove outliers from the data ............................. A8
Appendix 3: Models run with outliers included in the data ............................................................... A10

v
LIST OF TABLES
Table 1: Distribution of sampled respondents in the three agro-ecological zones .................................... 18
Table 2: Description of beekeeping related knowledge ............................................................................ 22
Table 3:Definition of independent variables in the binary logistic regression and first step of the
Heckman selection model ........................................................................................................... 21
Table 4: General characteristics of farming households ........................................................................... 23
Table 5: Demographic characteristics of beekeeping households in comparison with non-beekeeping
households in the study area ....................................................................................................... 25
Table 6: Comparison of the beekeepers and the non-beekeepers using Independent sample t- test ......... 26
Table 7: Bee products and their income contribution to the beekeeping households................................ 27
Table 8: Summary of tools and equipment owned by beekeeping households and their prices ............... 28
Table 9: Sources of different beekeeping equipment ................................................................................ 29
Table 10: Knowledge of beekeeping that was dependent on the experience in the activity ..................... 30
Table 11: Beekeepers access to different extension services .................................................................... 31
Table 12: Different sources of extension services ..................................................................................... 31
Table 13: Factors that drive farmers to engage in beekeeping .................................................................. 32
Table 14: Estimation results of logistic regression and probit model with adoption (0, 1) as the
dependent variable (Marginal effects are reported (n=301) ...................................................... 34
Table 15: Binary variables showing differences among the three groups of adopters .............................. 35
Table 16: Comparison of the household and farm characteristics of beekeepers according to adoption
type (One-way ANOVA test) .................................................................................................... 36
Table 17: Results of post hoc test showing differences in household and farm variables between
adoption groups ......................................................................................................................... 37
Table 18: Determinants of quantity of honey produced (dependent variable = Amount of honey
produced per year and n = 301) ................................................................................................. 39
LIST OF FIGURES
Figure 1: Outline of the dissertation ............................................................................................................ 4
Figure 2: Traditional beehives (left a log hive and right a basket) .............................................................. 5
Figure 3: Harvesting traditional beehives .................................................................................................... 5
Figure 4: Photographs showing improved movable hives and how they are harvested. ............................. 6
Figure 5: Sustainable livelihood framework ............................................................................................... 6
Figure 6: The map of Uganda and the location of the sampled areas........................................................ 15
Figure 7: Major non-farm income sources of households in the three agro-ecological zones .................. 24
Figure 8: Farmers’ engagement in different farm enterprise ..................................................................... 24
Figure 9: Production constraints of beekeeping ........................................................................................ 39
Figure 10: Marketing constraints in beekeeping ....................................................................................... 40

vi
ABSTRACT
Objective: This study aims at analysing beekeeping adoption process and production as an alternative
source of income to households in Northern Uganda.
Methods: A cross sectional study design was used to interview 166 beekeepers and 138 non-
beekeepers from the three agro-ecological zones. Collected data was analysed using descriptive
statistics, binary logistic regression model, Heckman selection model and Ordinary least squares
estimations.
Results: The results indicate that beekeeping was a male dominated activity and livelihood capitals
such as social, human and financial capital drove farmers to diversify into beekeeping. Honey
production was low compared to installed capacity of beehives. Factors such as access to market
information, access to ready markets, sources of equipment, knowledge on routine apiary
management practices, beekeeping experience and forage availability influenced honey production.
Inadequate production knowledge and skills, pests and diseases, predominant use of informal
marketing channels, poor product quality were found to be the major production and marketing
constraints.
Conclusion: The study suggests that in order to improve beekeeping adoption, farmers’ social capital
should be empowered and this will improve access to extension services and the quality of services
accessed. Farmers’ social capital can be strengthened through formation of public-private
partnerships to address the knowledge gaps. The major knowledge gaps to be addressed are lack of
production and marketing knowledge. Furthermore farmers should be sensitised on how to integrate
beekeeping in crop production and still obtain optimal production. Development partners should
therefore focus on improving beekeeping productivity and marketing if beekeeping is to be used as a
tool to reduce poverty at household level.
Key words: Beekeeping, Beekeepers, Adoption, honey and Livelihoods

vii
ABBREVIATIONS AND ACRONYMS
CBO Community Based Organisations
DRC Democratic Republic of Congo
HH Household
kg Kilogramme
km Kilometre
KTB Kenyan Top Bar hive
MAAIF Ministry of Agriculture, Animal Industry and Fisheries
NAADS National Agricultural Advisory services
NGOs Non-governmental organisations
OLS Ordinary least square estimations
PMA Plan for Modernisation of Agriculture
Qty. Quantity
Tot. Total
UEPB Uganda Export Promotion Board
UgShs Ugandan Shillings
UK United Kingdom
UNADO Uganda National Apiculture Development Organisation
USD United States dollar
VIFs Variance Inflation Factors

1
1. CHAPTER ONE: INTRODUCTION
1.1 Background
Africa’s rural poor living in isolated settlements heavily depend on subsistence agriculture for their
livelihoods (1-4); a process they achieve through utilization of natural resources such as land, water
and biotic resources (5). Uganda has 85% of its population residing in rural areas and engaged in
agriculture as a major economic activity (6). About 24% of these live below the national poverty line
(7). Northern Uganda hosts the highest number of rural poor households due to the 20year civil strife.
Many of these rural poor suffer from income poverty, lack of education, health, poor housing,
unemployment, limited empowerment and personal insecurity (8). Because of the above poverty
constraints, these communities are constantly re-organizing their livelihoods based on available
natural resources to alleviate poverty. Beekeeping has been considered as one of the livelihood
diversification alternatives by farmers and development actors (9). The government of Uganda, for
instance through the plan for modernization of agriculture, has promoted beekeeping extension
services particularly targeting the rural poor (10, 11). This program has assisted poor farmers to invest
in beekeeping through group organizations.
Beekeeping’s competitive advantage for on-farm integration is ascribed to the low start-up costs,
labour requirements, less land, user friendly technology and dependency on traditional knowledge
and skills (12-14). Additionally, it provides complementary services to other on-farm enterprises like
crop pollination. Beekeeping is also an efficacious tool in rural development as bees are omnipresent
and the required equipment and tools namely: hives, smokers and protective clothing are locally
made. Due to all these factors plus its contribution to livelihood outcomes especially the guaranteed
year-round financial protection, beekeeping is considered a vital component of poverty eradication in
rural areas (15).
Beekeeping offers direct and indirect benefits to the rural people. Directly, beekeeping substantiates
household income from hive product sales, provides food, safe medicines and raw materials for
industries (16, 17). These income benefits have been reported to have high impact among
marginalized and small income earners such as women, orphans and other vulnerable groups within
the society (18). Indirectly, beekeeping contributes to water shed-management, forest conservation
and crop pollination (19). In their studies, Morse and Calderone (20) and Chaplin-Kramer, Dombeck
(21) found that bees are responsible for one third of food crops produced for human consumption.
Honeybee pollination improves quality, quantity and market value of food crops (22). Thus
honeybees are central in ensuring food security. With all the above benefits, it is believed that
2
beekeeping can improve living standards of the rural poor. Yet productivity and beekeeping adoption
remains low among rural farmers in Uganda.
1.2 Problem statement and rationale
In spite of the existing beekeeping potential in Uganda, the opportunity remains unexploited by most
of the poor due to insufficient documentation on its profitability, performance and specific
contribution to a poor man’s needs (9). Beekeeping is still marginal with only 10-15% of the
households engaged in it (23, 24). The sub-sector is also fundamentally orthodox and subsistence in
nature and the government has done little to improve it.
Additionally, there is still scant information on the monetary value of honey output which makes it
more complex to estimate its contribution (25). This information is hardly available given poor
documentation and record keeping by farmers and statistic institutions plus little research focus on
this sector. Focus is rather accorded to other livestock enterprises and major cash crops. Furthermore,
the factors underlying adoption of beekeeping in the poorest regions in Uganda are unknown.
Research also shows that during adoption of agricultural technologies, the process tends to be slowed
and deterred by a number of challenges (26). These may be environment specific hence the
importance to understand these area specific beekeeping constraints. Moreover, if the unexploited
potential of beekeeping is to be met then these constraints must be identified and addressed.
Therefore, this necessitates studies to address these knowledge gaps yet adoption studies have only
been done in Western Uganda with no research in other regions (9). In addition, a systematic and
holistic study on livelihood assets of farmers and how these influence adoption and production in the
most vulnerable Northern Uganda is still lacking. This study therefore employed the livelihood
framework to predict the effects of various factors driving beekeeping adoption and production in
Northern Uganda along with conditions that would motivate rural farmers to take up beekeeping. The
findings from such studies are relevant to future researchers with related topics, policy makers, donor
agencies and organizations involved in seeking and designing sustainable poverty reduction strategies
in rural areas especially in developing countries. In addition, such findings create awareness and
assist extension workers to come up with more practical solutions to address the needs of the farmers.

3
1.3 Objectives of the study
1.3.1 Overall objective
The overall objective of this study is to analyse the beekeeping adoption process and production
among rural farmers in Northern Uganda.
1.3.2 The specific objectives are:
1. To discuss the contribution of beekeeping to rural livelihood outcomes in Uganda.
2. To determine factors influencing the adoption of beekeeping among the rural farmers in Uganda.
3. To analyse the factors influencing honey production among beekeepers in Uganda.
4. To identify the major beekeeping constraints faced by farmers in Uganda.
1.4 Structure of the dissertation
This dissertation is organised into seven chapters (Figure 1). Chapter one gives the background and
presents the problem statement which served as the rationale for the need to investigate the adoption
process and production of beekeeping as an alternative income source for the rural poor. Additionally,
general objective and the four specific research objectives are presented in this chapter. The second
chapter presents literature review structured based on the specific research objectives. The chapter
also gives highlights on what other studies have done and the existing knowledge gaps that have been
addressed by this dissertation. Chapter three provides more details on beekeeping in Uganda,
description of the study area, research design, data collection and management. The forth chapter
describes the methods of analysis and all the variables used to achieve the research objectives. Results
and discussion of the findings are presented in chapter five and six respectively. Lastly, conclusion
and recommendations are presented in chapter seven.

4
Figure 1: Outline of the dissertation

5
2. CHAPTER TWO: LITERATURE REVIEW
2.1 Beekeeping as a livelihood strategy and its contribution at household level
For decades, communities have depended on honeybees for food production; first through bee
hunting and now beekeeping as a process of honeybee colony maintenance (27). Beekeeping entails
wild colony capture and domestication in wooden boxes or cylinders made of clay or mud commonly
referred to as beehives (28). Honeybees thereafter build their natural combs and maintain them. Two
types of beehives exist that is fixed frame beehives (traditional) and movable frame beehives
(improved) (29). Examples of fixed frame traditional hives are log, pot and basket hives (Figure 2).
On the other hand, movable frame hives include langstroth, Kenya top bar and Johnson’s hives
(Figure 4). Under improved beekeeping, movable frame hives have been preferred over fixed comb
due to difficulty in management, inspection and product harvesting from fixed comb hives (Figure 3).
Following the development of these improved beehives and promotion of diverse livelihoods as a
major strategy to eradicate poverty, beekeeping has gained popularity (30).
Figure 2: Traditional beehives (left a log hive and right a basket) Source: Field photos taken during data collection.
Figure 3: Harvesting traditional beehives

6
In order to study the contribution of beekeeping to livelihoods, a sustainable livelihood approach is
used. The sustainable livelihood framework distinguishes strategies besides agricultural
intensification, extensification and migration (31). According to Chambers and Conway (32), a
livelihood is a set of capabilities, activities and assets; both material and social that are required for a
means of living. A livelihood is said to be sustainable, only if it can cope, recover from stresses and
shocks, maintain or enhance its capabilities and assets, while not undermining the natural resource
base (33). Peasant farmers are prone to shocks, trends, policy changes and various interventions that
claim to enhance their farming hence require sustainable livelihoods. Figure 5 shows the components
of the sustainable livelihood framework as adapted from DfID (34).
Figure 5: Sustainable livelihood framework Source: Carney, Drinkwater (35)
Figure 4: Photographs showing improved movable hives and how they are harvested.

7
Beekeeping contributes to livelihood outcomes through increasing food security more so increasing
food accessibility, availability and utilization. Beekeeping enhances food accessibility through direct
income generation which can be used for purchasing other nutritious foods that reduce the prevalence
of protein, iodine, vitamin and iron deficiencies (36). Beekeeping has additional nutritional benefits
as an extensive source of food hence its contribution to food availability. This is mainly in form of
honey which is used for several other purposes in a home including being used as a sweetener. Honey
contains antioxidants, minerals, vitamins, proteins and a high calorific value which present attractive
ingredients that do not occur in artificial sweeteners (18). Honey is also used for brewing traditional
beer in Africa primarily for cultural and religious purposes. In addition it possesses antibacterial
properties that make it a well-known remedy for colds, mouth and throat irritations. Consumption of
honey improves food assimilation, reduces infective intestinal problems such as constipation,
duodenal ulcers and liver disturbances which increase peoples’ food utilization (37). Not only is
honey used to treat infections but also promotes tissue regeneration and reduces scarring even in its
pure unprocessed form.
Apart from enhancing food security, beekeeping provides employment especially in areas where there
is population pressure on the land (38). This helps households manage economic shocks hence
reducing vulnerability among these households (39). In marginal areas with infertile land for
agricultural production like the Kenya Masai communities, beekeeping was the fifth major livelihood
diversification strategy to support their pastoral farming systems (40).
Apiculture also accelerates the accumulation of savings as a result of increased income. Beekeeping
increases cash flows because it supplements the household income especially during the dry seasons
when on-farm income is low. Hive products may be harvested two to three times a year especially at
consumption peak times, for instance, when school fees has to be paid (23). Some bee products such
as beeswax and propolis have long shelf lives which enable them to be stored for a long period as a
form of saving and sold when need arises. Additionally, the ease of asset recovery and accumulation
among beekeepers in case of insecurity was reported by Enzama (41). This makes beekeeping a very
important safety and cargo net.
Beekeeping is said to improve well-being of the beekeepers through increasing the number of tools,
equipment and access to basic infrastructure for instance access to roads and markets (39). Some of
the tools and equipment owned to enhance beekeeping production include bee suits, smokers,
beehives and other tools used in apiary management. During beekeeping production, farmers acquire
new knowledge and skills particularly those related to beekeeping (42). This may be acquired from

8
organised trainings or as a result of cumulative experience in beekeeping. These skills enhance
beekeepers capabilities. In addition, beekeeping gives an opportunity to farmers to network with other
members in the communities. This is mainly through group formation that eases access to extension
services (43).
Indirectly, beekeeping improves peoples’ quality of life through facilitation of sustainable natural
resource management. For instance, it enhances pollination which is very important for production of
most seed, cash and food crops and promoting biodiversity (22, 44). Pollination of agricultural crops
is an important agro-technical measure that increases productivity of seeds, fruits and vegetables.
Some crops such as rapeseed even require supplementary pollination that is achieved by placing one
to two beehives per hectare. It is also known that the closer the hives are to the bloomed field, the
greater the pollination effect which expedites production. Although the exact contribution of
pollination to yield is hard to measure precisely, it is likely to be much higher than the value of honey,
wax and royal jelly (5, 45).
In spite of thorough discussions on the contribution of beekeeping in many countries including some
African countries, no study previously used the sustainable livelihood framework in their explanation.
Additionally, as far as known to me, no study has been done in Uganda to determine beekeeping
contribution to the rural livelihoods.
2.2 Adoption of beekeeping as an economic activity
Adoption is taken as a variable representing behavioural changes that farmers undergo when
accepting new ideas and innovations in agriculture. Behavioural change refers to ―desirable change in
knowledge, understanding and ability to apply technological information, changes in feeling
behaviour such as changes in interest, attitudes, aspirations, values and changes in overt abilities and
skills‖ (46). According to Feder, Just (47) adoption is classified into two types namely: individual and
aggregate adoption based on coverage. Individual adoption refers to the farmer’s decisions to
integrate a new technology into the production process whereas aggregate adoption is the process of
diffusion of a new technology within a region or population. In this dissertation I focused on
individual adoption. Based on the adoption cycle, most farmers do not adopt agricultural
activities/technologies immediately as they get to know about them. Different farmers adopt
agricultural technologies at different times and these adopters can be grouped into three categories
according to Diederen, Van Meijl (48):
Innovators are the first farmers in their area to use a certain technology. In the case of
beekeeping these are the farmers that adopted the activity before anyone else.
9
Early adopters referring to the farmers who indicate to belong to the first quarter of adopters
of a certain innovation, relative to the full range of potential adopters.
Late adopters are those farmers who adopted an innovation, but did not belong to the first
quarter of potential users.
There are factors that influence the general adoption process or determinants of farmers’ uptake of the
innovation/technology and there are those that determine the speed of diffusion of the technology.
However, it is very difficult to discuss them separately in this section as very little has been done on
determining adoption in the early stages but rather focus on the completed diffusion cycle (49). In this
master dissertation, no differentiation was made.
Beekeeping adoption at household level like any other adoption process is determined by several
factors that do not influence the process individually but these factors tend to interact with each other.
First, Mujuni, Natukunda (9) reported phobia for bees as the main factor affecting beekeeping
business in Western Uganda. African honeybees have high levels of defensive behaviour hence tend
to sting everything that crosses their boundaries as their defensive mechanism (50).
Capital endowments such as human, social, natural and financial capitals have been reported to drive
agricultural technologies (51). Beekeeping as an on-farm enterprise is also driven by the same capital
endowments although there were limited studies on the drivers of beekeeping adoption particularly in
the geographic region of study. Available literature suggests that human capital influencing adoption
of beekeeping includes access to related knowledge, education levels of the farmers, labour
availability on the farm, farmer trainings and age of the farmer. In the study of Mujuni, Natukunda (9)
most of the beekeepers had attained formal education with 43% having achieved secondary and 18%
tertiary education. This showed that educated farmers were more likely to adopt beekeeping since
education stimulates their acceptance of new technologies. Education level of the farmers was found
relevant and positively influenced adoption of beekeeping too. This was attributed to increased
knowledge, access to related information such as the right time for harvesting and improved
understanding of the related best management technologies (52-54).
Age and trainee occupation positively influenced adoption decision of beekeeping training attendance
(55). Most farmers that attend these trainings are amongst the younger people (35 years and below)
that have formal education and are predominantly from rural backgrounds with agriculture as their
main occupation. Such trainings are usually organized by NGOs and government programs which

10
increasingly influence farmers’ knowledge about various practices of beekeeping and its adoption
(41).
Social capital that influences adoption of beekeeping encompasses access to extension services,
formation of associations and cooperatives. All these increase farmers’ bargaining power and their
access to markets. Additionally, availability of information and knowledge about the related skills
required for bee farming are vital in the beekeeping adoption process. The sources of information that
positively influenced adoption process comprised of fellow farmers, meetings, media and extension
officers (56). However, the appropriateness, accuracy and effective dissemination of this information
must be highly considered. Edillon (57) found that organizational membership and extension service
coverage also significantly and positively influenced adoption of agricultural technologies. Though
social capital plays a crucial role in beekeeping adoption, it was reported to be highly influenced by
programs and policies in place.
The main natural capital influencing adoption is land where the amount of land owned, quality of land
and the presence of land investments are considered during adoption process. Farm size was found to
have ambiguous relationship with adoption rates of most agricultural technologies depending on the
characteristics of the technology and the institutional setting (47). However, farm size was not yet
found to be significantly related with adoption of apiculture (9).
According to other studies, financial assets that significantly influence adoption of beekeeping are
farmers’ income, savings, access to credit, farm structures and access to beekeeping equipment/tools
(39). Access to credit eases the production and marketing processes by facilitating the purchase of
tools, equipment, packaging materials and transport to the market. Lack of start-up capital to buy
beehives and other tools negatively influences adoption by prospective beekeepers (9). Hence,
farmers’ incomes and access to credit significantly affect the uptake of such technologies. On the
contrary, Chuma, Mushuku (5) reported that financial assets were not essential for beekeeping at
subsistence level in Zimbabwe. Although, these factors have been reported to influence adoption of
beekeeping, their influence may vary across communities and agro-ecological zones yet their
influence on adoption of beekeeping in the Northern region in Uganda had not been previously
studied.
2.3 Factors influencing honey production in beekeeping
Factors that influence production in beekeeping differ from those influencing its adoption and a
number of them have been pinpointed by different studies across the globe. For instance for a study in

11
Ethiopia, Bekele (58) reported access to extension services such as market information and
beekeeping training as the most crucial factor influencing production of honey and other bee
products. His findings showed that farmers that were frequently contacted by the extension agents
produced higher quantities of bee products with better quality than those that did not. In addition,
farmers that had received beekeeping training were more likely to use improved beekeeping
equipment and produce more honey than their counterparts.
Several studies reported beekeeping equipment such as the number and type of beehives, ownership
of protective clothing, hand gloves, knives and baiting materials to influence honey yield (59-61). On
average, beekeepers produced 8-15kg/hive and 20-30kg/hive from traditional and modern beehives
respectively (60). However, varying yield within farmers using similar hive types was reported and
attributed to differences in certain apiary management practices. Routine management practices such
as hive inspection, pests and disease control and provision of water were the major practices that
influenced colony performance and honey yields (62).
Apart from the above mentioned factors, environmental factors such as bee forage availability and
weather conditions influence honey yield (58, 63, 64). Though bee forage quality and availability are
vital in honey production, these seem to continuously reduce over years due to changes in agricultural
practices (65, 66). These changes include the increased use of fertilizers that has reduced rotation of
legumes in cropping systems and extensive use of herbicides that reduces weeds within the crops and
at crop edges. Similarly, increased use of pesticides, reduced extensive grazing and harvesting of
alfalfa before blooming to maximize protein content significantly reduce bee forage available for
pollen and nectar collection by bees (67).
Weather conditions not only influence the availability of forage plants but they also affect the average
daily brood production, length of worker life and individual productivity of workers that were
identified as the three primary factors that interact together to influence the amount of honey
produced (68). Given that weather conditions vary from place to place, the geographic location of the
farmer was also found to influence honey yields (69).
Whereas those studies examined the above as the factors influencing honey production, there were no
previous studies conducted in Uganda. Additionally, the effects of the source of beekeeping
equipment and market availability on honey yield were not explored by any of the studies.

12
2.4 The major beekeeping constraints
Existing literature has emphasised the importance of biological (ecological), technical, trade and
institutional constraints in beekeeping (45). The major ecological and biological constraints
previously focused on were inadequate bee forage, limited land for expansion, pesticide poisoning,
predators, pests, diseases and death of the colony (44, 60, 70, 71). Like all organisms have been
subjected to infestation and attack from natural enemies, Honey bees are not any exception and are
attacked by pests, predators and parasites. These frequently lead to absconding and poor production
(72). Pests are easier to address since they can easily be identified, have immediate effects and their
solutions are often known to beekeepers. Studies such as that conducted by Mahaman, Harizanis (73)
reported toads, wasps, mice, braula, beetles, wax moth, ants, birds, lizards and insect eating mammals
as the main pests to honeybees. Besides pests and parasites, diseases were also a major concern in
beekeeping and more so those affecting the brood because they quickly weaken the colony (64, 74).
American foul brood, European foul brood, chalk brood and sac brood are the most common
examples of brood diseases.
Technical constraints highlighted in previous studies were lack of knowledge on suitable management
methods of tropical bee races and species, lack of skilled trainers and training opportunities, lack of
dissemination of new research information especially that related to disease control and inadequate
beekeeping equipment (45). There is a consensus in previous research that the major technical
constraints in beekeeping production are low production knowledge/skills (60, 75). Most beekeepers
lacked knowledge on the use of modern hives and how to determine the right time for harvesting (76,
77). Although beekeeping does not require high technology in practice, capacity building is required
to train beekeepers on relevant management practices (78). Capacity building is usually impended by
high illiteracy levels of beekeepers as reported in the study conducted by Illgner, Nel (38) in South
Africa. Illiterate beekeepers are also unable to keep proper records per colony while this is vital for
proper management of apiaries.
Trade/marketing constraints in beekeeping identified in Ethiopia were market inaccessibility, price
fluctuations and lack of grading systems that deny beekeepers an incentive to produce good quality
products (79). Additionally, the same study reported that bee products’ prices widely varied based on
goodwill of various buyers. Other marketing constraints reported by other studies included absence of
organised market channels, transportation problems, low involvement of the private sector in market
development and lack of appropriate technologies for processing and packaging bee products (80,
81). Lack of proper packaging materials was more common in rural and remote areas where recycled
bottles of drinking water and whisky were used as packaging materials (82). These packaging

13
materials are unsuitable for marketing such products in towns, cities and export markets. This kind of
packaging also undermines product presentation, quality and safety of the products (83).
The last category of beekeeping constraints are institutional constraints such as weak producer
organizations, lack of resources such as trained personnel and laboratories to support the enterprise,
multi-sectorial policy contradictions and conflicts within Ministry of Agriculture, Animal Industry
and Fisheries (MAAIF) (82). In addition, lack of policies to protect the industry and stress safety
precautions and lack of adequate statistical information to guide the plans and operations were
identified by Ministry of natural resources and tourism (84) as constraints. Availability of this
information would attract and give confidence to potential investors and guide preparations of
bankable beekeeping programs and projects. This would also facilitate the provision of credit to
beekeepers, processors, traders and manufacturers of beekeeping equipment and products.
Progressive beekeepers’ associations were also found to face institutional challenges that included
lack of commitment by the group members and difficulty in maintaining partnership with various
agencies (85).
Other beekeeping constraints that were rather difficult to categorise included conflicts between
beekeepers and their neighbours including beehive theft (9, 86). In some areas non-beekeepers
demonstrated phobia for bees and did not allow beehives to be sited near their fields hence
beekeepers had to look for isolated areas to keep their bees.
Although very many studies discussed challenges in the beekeeping sector, a few have been
conducted in Uganda. Furthermore, those done in Uganda were conducted in other regions but not in
the area of study for this thesis, had smaller sample sizes and did not categorise the constraints (9,
13). The current study intended to give a clear distinction of the major marketing and production
beekeeping constraints in Uganda.

14
3. CHAPTER THREE: DATA
This section gives general data about beekeeping in Uganda, describes the area of study, sampling
issues, the data collection and management process of the current study.
3.1 Beekeeping in Uganda
Honey is the major bee product produced by Ugandan beekeepers. Uganda’s annual honey production
is estimated at 100,000–200,000 metric tonnes but its position when compared to other African honey
producing countries is not documented (87). The major honey producing areas are Northern and
Western Uganda while the Central region is the least producing area (88). Most of the honey is
organically produced by small-scale beekeepers that still use rudimentary methods of production and
have failed to meet the country’s domestic demand (89). Due to the unmet honey demand on the
domestic market, Uganda has been importing more comb honey from Sudan and Democratic
Republic of Cong (DRC) (87). Additionally, more processed honey is imported from Kenya, United
Arab Emirates, Germany, Switzerland, UK and Dubia.
Although some honey is imported to meet this demand, the market is still dominated by the local
brands. There are seventy two honey brands on the Ugandan market of which 71% are local brands
(90). The most common local brands are Bee Natural Honey, Bushenyi Honey, East African Organic
Honey, Pure Natural Honey and Pearls Pure Honey. Besides importing, Uganda exports honey to
Kenya and is also among the five countries in Sub-Saharan Africa that export honey to the European
Union (91). The European Union market is however, very competitive and its prices depend on the
country of origin. Due to lack of quality standards in honey production, processing and marketing in
Uganda, only 20% of its honey qualifies for the European market (92). Poor storage and honey
adulteration are the main factors that deteriorate honey quality along the market value addition chain
(93).
Certain reports have revealed that Uganda has no central market or pricing mechanism and its honey
market is still largely informal (94). This makes access to ready good markets by the majority poor
small-scale producers almost impossible. Market information distribution is also weak with neither
efficient nor organised mechanism for its flow (95). Due to this, few beekeepers are able to sell their
honey in bulk to consolidators, packers or bottlers and benefit from collective marketing. These gaps
need to be addressed in order to meet the unmet honey demand in Uganda.

15
3.2 Description of the study area
Beekeeping data was collected from West Nile, Mid-Northern and Eastern agro-ecological zones in
Northern Uganda. The three zones were selected based on their mean annual yields of honey. West
Nile was classified as high producing region, Mid-Northern as moderate producing and Eastern as
low producing zone (96). Figure 6 gives the map of the agro-ecological zones as adapted from
Wasige (97) and Winterbottom and Eilu (98).
Figure 6: The map of Uganda and the location of the sampled areas
3.2.1 Geographic relief, climate and economic activities in the area of study
West Nile is situated at 1143 meters above sea level with average annual rainfall of 1250mm. It
follows a bimodal rainfall pattern with a rainy season from March to May and another from July to
October. It has a mean temperature of 28°C to 31°C. Dry seasons are usually experienced in June,
December and February.
The region produces over 700 tonnes of honey per annum. The beekeeping sub-sector in this region is
quite developed with an estimate of 6,300 farmers (88). Most of these farmers are involved in private-
public partnerships which try to involve them into established value chains (41). This has enhanced

16
knowledge and technology on quality and quantity improvement of these beekeepers’ products.
Besides beekeeping, farmers in the region are also involved in other agricultural activities with crop
production as their major activity. The staple crops grown are sweet potatoes and cassava, some
legumes like cowpeas and beans while the major cash crop is tobacco (99). They also rear livestock
where the main livestock reared are goats, poultry and cattle (100).
Data was also collected from the Kitgum district which belongs to the Mid-Northern agro-ecological
zone and is situated at 1100m above sea level. It receives mean annual rainfall of 1300mm and
experiences bimodal rainfall pattern with the first season from March-May and the second from July
to October. The dry-hot season is from mid-March to December with mean monthly temperature
range of 17oC to 27
oC.
Kitgum has vast land and overgrown vegetation that is suitable for beekeeping (98). It produces
around 9 tonnes of honey annually mainly from small-scale beekeepers that are stuck to their
rudimentary methods of production such as burning of bees before harvest since they lack protective
wear (101). The region has over 420 groups of small-scale beekeepers most of which lack the
necessary skills needed to produce quality honey. A weak producer organisation structure also exists
in this sector which has stunted the capacity of beekeepers in this region. Besides beekeeping, over
90% of the population is engaged in crop production as their major economic activity with a few
others engaged in rearing livestock. The major food crops grown are sesame, upland rice, green
vegetables, fruit trees (citrus and mangoes), beans, groundnuts, sorghum, maize, millet cassava, sweet
potatoes, pigeon peas and sunflower. Cotton and tobacco are the major traditional cash crops while
cattle, sheep, goats, pigs, chicken and fish are the livestock kept (102).
Lastly, data was obtained from the Soroti district which is located in the Eastern agro-ecological zone.
It receives annual rainfall between 1100mm and 1200 mm but this is often unreliable and hence lead
to droughts and floods (103). Most rain is experienced between March-May, light showers between
June-August and other heavy rains between September-November. The dry season runs from
December to February. It has average minimum and maximum temperatures of 18oC to 30
oC
respectively. Soroti is traversed by numerous swamps and other wetlands and has poor, shallow and
light-textured soils with high sandy loam content (104, 105).
The district’s exact annual honey production is not documented though most of the beekeepers in the
region are organised in associations from which they receive the required training. Regardless of their
organisation in associations, most beekeepers still operate on a small-scale and lack the required
equipment to transit into modern beekeeping. However, they seem to produce good quality honey due

17
to access to training and availability of plenty of trees that provide bees with good quality nectar and
pollen. Soroti is also a test bed for many agricultural development initiatives and has been zoned for
citrus production under the National agricultural advisory services (NAADS). This gives it a great
potential of integrating beekeeping into the fruit farms. Like other regions in the study area, a
majority (78%) of the population are subsistence farmers and produce cassava, citrus, groundnuts,
sorghum, finger millet, maize, green grams, sesame and soybeans as the major food crops (106). The
major cash crop grown is cotton while the major animals reared are cattle, goats, sheep, poultry, pigs
and a few farmers keep donkeys.
3.2 Research design and data collection
The study used secondary data that was collected by a doctoral student at the Department of Crop
Protection (Faculty of Bioscience Engineering, Ghent University). The research and sampling designs
of this data were given and described in the succeeding paragraphs.
The data was collected using a cross sectional research design over a period of five months (October
2014 to February 2015). The respondents included beekeepers and non-beekeepers in the three zones.
To select beekeepers a list was obtained from the Ugandan national apiculture development
organization (UNADO). Numbers were assigned to individuals and thereafter participants to the
survey were selected randomly. Beekeeping households were 630 at the time of data collection. The
study ended up with a sample of 166 beekeepers. This was lower than the 189 estimated using the
Neuman (107) rule of 30% sample for a village population under 1000. This was mainly due to non-
responses from some of the beekeepers initially selected as part of the sample.
In order to easily compare beekeepers with non-beekeepers, non-beekeepers from the same sub-
counties as the sampled beekeepers were selected. This was done by obtaining lists of non-beekeepers
adjacent to beekeepers from the respective district NAADS offices. Then using simple random
sampling, individual non-beekeepers were selected from the three agro-ecological zones. A total of
138 non-beekeepers were proportionally and purposively selected for comparison with beekeepers.
Table 1 presents the breakdown of the number of respondents in the different agro-ecological zones.

18
Table 1: Distribution of sampled respondents in the three agro-ecological zones
The household survey of beekeepers and non-beekeepers used a pre-tested structured questionnaire.
The questionnaire was administered to the person owning beehives for beekeepers and for non-
beekeepers it was administered to any adult male or female in the household. The questionnaire had
six sections (Appendix 1), which covered household demographics, livelihood asset endowments and
farm characteristics. The information collected referred to the time of data collection keeping in mind
that this time slightly differed among respondents.
3.3 Data management
Data collected from the household survey was entered in Microsoft excel and then exported to SPSS
and STATA for analysis. This data was cleaned to remove outliers during preliminary analysis.
During data cleaning, three beekeepers were considered outliers and omitted based on the quantity of
honey harvested and number of hives owned. Based on number of hives, two beekeepers were
removed because one had 192 beehives and the other had 150 hives yet the person following them
had only 75 beehives (Appendix 2). Then on the basis of honey produced, the respondent who said he
produced 250kg of honey was removed as his immediate follower’s production was reported at
100kg. This left the data set with a total of 301 respondents composed of 138 non-beekeepers and 163
beekeepers but rather more representative. Further analysis was done to achieve the proposed
research objectives.
Agro-ecological zone Beekeepers Non-beekeepers Total
Mid-Northern 38 30 68
Eastern 69 51 120
West Nile 59 57 116
Total 166 138 304

19
4. CHAPTER FOUR: METHODS
This section explains the details of how the research objectives were achieved, all the statistical tests
and variables used in analysis of the data collected.
4.1 Methods of analysis
First, with the use of descriptive statistics the socio-economic characteristics of the interviewed
farmers were established. Then characteristics of the beekeepers were identified using comparative
statistics in order to distinguish them from other farmers in the community. Similarly, the first and
forth objectives of the current study namely: to determine the contribution of beekeeping to rural
livelihoods and to identify the major beekeeping constraints respectively, were achieved by
generating descriptive and comparative statistics. The descriptive and comparative statistics used
were minimum, mean and maximum values, standard deviations, frequencies, percentages, Chi-
square values and t-statistics. Independent sample t-test (Levene’s test of equal variance) was used to
compare the means of the continuous variables while Chi-square test was used to analyse the binary
and categorical variables.
The second objective on adoption was answered by first generating percentages of the various reasons
for keeping and not keeping bees by beekeepers and non-beekeepers respectively. Binary logistic
regression and probit models were proposed for further analysis. Binary logistic and probit models are
normally recommended for dichotomous dependent variables which distinguishes these two models
from linear regression model (108). The two models are also commonly used in adoption studies (47,
109). Though other models such as simple correlation and linear probability function can be used to
predict adoption behaviours of farmers, these were not used because they have limitations (110, 111).
For instance their t-ratios exhibit heteroscedasticity, non-normality and their estimated probabilities
may be greater than one or less than zero since they assume probability to linearly increase with the
level of independent variables. Probit and logistic models are based on a cumulative distribution
form. Besides their ability to relate the choice probability Pi to the explanatory variables while
keeping the probability in the range of 0-1, the logistic model is also easier to work with (112). A
binary logistic regression model follows a logistic distribution function and specifies a functional
relation between the probability of adoption and the predictor variables (113, 114).
A binary logistic regression estimates the probability that a characteristic is present given the values
of explanatory variables. The model also uses maximum likelihood estimation.
Y= response variable (in this case beekeeper)

20
Yi = 1 if the respondent is a beekeeper
Yi = 0 if the respondent is not a beekeeper
X = (X1, X2, ..., Xn) is a set of explanatory variables which can be discrete, continuous, or a
combination. xi is the observed value of the explanatory variables for respondent i.
The logistic distribution for beekeeping can be specified as Gujarati (115) :
(1)
Where, Pi is the probability beekeeping adoption for the ith farmer, e is the base of natural logarithms,
zi is the function of a vector of explanatory variables which is underlying an unobservable index for
the ith farmer. If Zi exceeds the threshold level (Z*), the farmer is taken as an adopter. Otherwise he is
a non-adopter if Zi is below the threshold value and can be expressed as,
∑ (2)
Where α = intercept, βi = vector of the unknown slope of coefficients and X1, X2 …Xn represents
explanatory variables. The logit model assumes that the underlying stimulus index (Zi) is a random
variable which predicts the probability of beekeeping adoption. The slope reveals how the log-odds of
beekeeping adoption change as independent variables change. Therefore, if Pi is the probability of
adopting beekeeping, then the probability of not adopting is 1-Pi.
From Equation 2, we get the odds ratio that defines the probability of adoption relative to non-
adoption. The logit model is then obtained by taking the logarithm of Equation (2) as follows:
(
) ( ) ∑
(3)
Li is the log of the odds ratio in favor of beekeeping adoption. Li is linear in both Xj, and the
parameters. If the stochastic disturbance term (ui) is introduced, the logit model becomes:
(4)
Using the binary response on whether a farmer is a beekeeper1 or not as the dependent variable,
logistic regression models were run.
Four binary logistic models were run with different specifications to explore the determinants of
beekeeping (Table 13). The first model contained human capital variables, the second model
combined financial and natural capital variables while the third model contained variables used to
measure social capital of the farmer. The forth model combined all variables in the first three models.
A probit (first step of Heckman selection model) containing all the variables included in the final
binary logistic regression model was also run to ensure robustness and correct for selection bias if
1 Beekeeper in this study refers to a farmer owning beehives.

21
any. In addition, all these models were rerun using the dataset containing outliers to make a
comparison with results from the non-representative dataset (Appendix 3). Marginal effects of all
independent variables were generated and reported with their significance levels. The determinants
that entered into these models were those found in literature but also those that were found to stand
out in descriptive analysis.
The study went ahead to classify adopters into innovators, early and late adopters based on
beekeeping experience measured in years. The innovators consisted of adopters that had been
beekeepers for eight and above years, early adopters for four to seven years and late adopters were
those that had been beekeepers for less than four years. Then Chi-square and one-way ANOVA tests
were used to determine if there existed significant differences among the three groups. Furthermore, a
post hoc test was used to determine which groups significantly differed in terms of continuous
variables used in one-way ANOVA test.
The third objective of the study is to analyse factors influencing honey production. This was
achieved by the use of an Ordinary least squares estimation (OLS), because the dependent variable
(quantity of honey harvested per year) was a continuous variable. The OLS assumptions were tested
to ensure that the obtained results were efficient and unbiased. Using the visual test and the Breush
pagan test, heteroscedasticity was tested. In addition, multicollinearity was checked for by generating
the correlation coefficients of the independent variables. Similarly, linearity and normality of the
standard errors assumptions were tested by generating a scatter and QQ plots respectively.
Because an endogeneity problem was suspected, a Heckman selection model was used to correct it in
case it existed (116-118). The Heckman model takes into account the problem of non-random
selection and endogenous variables generated by latent variables crossing their thresholds (116, 119,
120). In this study, this model ensured that differences between beekeepers and non-beekeepers
reflected the differences in capital endowments and farm characteristics not the unique impact of
participation itself (121). The first equation of Heckman model predicted the probability of a farmer
adopting beekeeping using a probit maximum likelihood function on both beekeepers and non-
beekeepers. The second equation was an OLS estimation equation of quantity of honey harvested per
year. The inverse mills ratio term as an added variable was used to reveal whether there was selection
bias. A significant mill’s ratio (lambda) would mean sample selection biases were present and had
been corrected. The results generated from Heckman selection model were compared with those
generated from the OLS estimation. Lastly, the two models were rerun using the data set that

22
contained outliers and the results were compared with those obtained by using the representative data
set to see if the outliers had major effects on the model output (Appendix 3).
4.2 Variable construction
For objective one, the variables that are used to generate descriptive and comparative statistics are the
production quantities of all the bee products, their unit prices, use and income contribution to the
households. The prices and income from the different bee products are continuous variables reported
in Ugandan Shillings (UgShs) but were converted into US dollars (USD) using the exchange rate at
the time of data collection (1USD =UgShs2700). The quantities of bee products are also continuous
variables but measured in kilograms. In addition, the details of all the beekeeping equipment owned
by beekeepers were compiled listing their prices and sources from which they had been obtained. The
equipment is measured by recording the number of equipment a beekeeper owned and the sources are
binary responses (1= yes if the beekeeper obtained equipment from a particular source and 0= No if
the beekeeper did not obtain the equipment from that source). Then variables measuring group
membership of the beekeepers were compared with those for non-beekeepers. These included
membership to savings, burial, farmer, marketing or beekeeping groups; access to any form of
extension services, the form of extension services accessed and source of extension services. All these
had binary responses (1= yes and 0= No). Table 2 shows the description of knowledge and skills
measured related to beekeeping. These are all binary variables with 1= yes if the beekeeper possessed
that skill and 0 =No if the beekeeper did not possess the skill.
Table 2: Description of beekeeping related knowledge
Knowledge/skill Description of the knowledge, whether the beekeeper had
knowledge on:
Capturing swarms Catching swarms
Hive siting Selecting sites for beehives
Pest and disease control Controlling pests and diseases
Understanding the colony
calendar
Understanding the colony calendar
Local hive construction Constructing local hives
Honey harvesting Harvesting honey
Inspection of hives Inspecting beehives
Feeding of bees Feeding bees
Colony multiplication and
splitting
Colony multiplication and splitting
Process other products Processing other bee products apart from honey (beeswax and propolis)

21
Table 3 shows the variables that were used as independent variables to predict factors influencing beekeeping adoption (objective 2).
Table 3: Definition of independent variables in the binary logistic regression and first step of the Heckman selection model
Variable (s) Description of the variable (s) Type of measure (s) Type of response(s)
X1= Age Age of the farmer Continuous in years (12 - 91)
X2= Gender Gender of the farmer Dummy (1= Male, 0= Female)
X3= HH size The number of people living in the household Numeric (1-30 members)
X4= Primary education Whether the farmer had primary education level
as the maximum level of education
Dummy (1= Yes, 0 =No)
X5= Secondary/tertiary
Whether the farmer had received secondary/
post-secondary education
Dummy (1 =Yes, 0=N0)
X6=Tot. annual income Total annual income received by the household Continuous in USD (51.85- 8890.37)
X7= Land acres The total land owned by the household Numeric in acres (1-200)
X8= Farmer group Whether the farmer belonged to a farmer group Dummy (1= Yes, 0= No)
X9= Access to
extension services
Whether the farmer received any form of
extension services
Dummy (1= Yes, 0 = No)
X10=NGOs Whether the farmer accessed extension services
through NGOs
Dummy (1= Yes, 0=No)
X11= Government Whether the farmer accessed extension services
through the government
Dummy (1= Yes, 0= No)
X12= Distance to market The distance to the nearest market Numeric in kilometres (km) (0 - 40)
X13= Eastern Zone Whether a farmer belonged to the Eastern agro-
ecological zone
Dummy (1= Yes, 0 =No)
X14= Mid-Northern Zone Whether the farmer belonged to the Mid-
Northern agro-ecological zone
Dummy (1= Yes,0= No)

22
For the third objective, the factors hypothesized to influence honey production tested in the OLS
estimation and Heckman selection model (second equation) were market access measured by having
fellow community members as the main buyers (1: yes), access to market information (1: yes), access
to extension services, having knowledge on apiary management practices, availability of bee forage,
amount of non-farm income (USD), beekeeping experience of the adopter (years) and the source of
beekeeping equipment.
There are quite a number of variables measuring access to market. These variables included the mode
of transport used to reach the market, who bought the honey from beekeepers, the distance to the
nearest markets and whether poor roads was one of the main challenges faced by the beekeeper. The
study selected the variable concerning ―who bought honey from the beekeepers” to measure access to
ready markets. This was considered the most appropriate measurement given that it was the variable
that varied among individual beekeepers. The distance to the market was not used because generally
all beekeepers lived far away from the markets. Additionally, the variable of poor roads was not used
in the model because this was to a larger extent influenced by public decisions rather than
individuals’ decisions. Since the roads among other factors were likely to influence the mode of
transport, this variable was also not found appropriate to be used as measurement for ready market
accessibility.
The management practices used in the models were hive inspection and pest and disease control
because they were found in literature and were not correlated to beekeeping experience. Availability
of forage was measured based on whether the beekeeper grew citrus on his farm or not. The sources
of beekeeping equipment were also included in the model because the study wanted to know whether
there would be a difference in production between farmers who acquired beekeeping equipment with
their own effort and those that were given freely by the NGOs and other sources. Among the
equipment, beehives and bee suits were used because they were the most important production assets
owned by beekeepers. In addition, log beehives were used because they were the major hive type
owned by adopters. On the other hand, gumboots were not included in these models even when they
were owned by a bigger proportion of adopters because they are not solely owned for carrying out
beekeeping activities. Therefore, it would be less accurate to associate ownership of gumboots with
the quantity of honey produced. With a combination of all the listed variables, the determinants of
honey production by the adopters were established.

23
5. CHAPTER FIVE: RESULTS
In this chapter results are structured based on the study objectives which focused on; a) characteristics
of beekeepers, b) contribution of beekeeping to rural livelihoods, c) factors influencing adoption of
beekeeping, d) factors influencing honey production and e) the major beekeeping constraints.
5.1 Description of the farming households
The aim of this section is to describe the general characteristics of farmers in the study area based on
their socio-demographic features in order to understand the study population.
Findings revealed that most farming households in Northern Uganda were male headed (94%). In
addition, about 41.4% of the farmers had not received any formal education, only 34.2% had at least
attained primary education, while the others (24.4%) had secondary or tertiary education. In this
region, three different land tenure systems were observed, those that owned land under freehold were
the majority (85.7%) followed by communal land ownership (14%) with a few renting (0.3%) land
for farming. In relation to distance, most of these farming households lived far from the markets with
an average distance of 6.5km from the nearest markets (Table 4). The average annual household
income2 was 727.3 USD equating to 1.99 USD household daily income. Their average household size
was ten members.
Table 4: General characteristics of farming households
Characteristic Mean SE Minimum Maximum Standard deviation
Age of the farmer (years) 43.8 0.9 12.0 91.0 15.0
Land acres (acres) 9.3 0.8 1.0 200.0 14.0
Total land allocated for crop
production (acres) 6.3 0.3 1.0 50.0 4.8
Total land allocated to livestock
production (acres) 2.3 0.2 0.5 34.0 3.4
Distance to market (km) 6.5 0.5 0.2 40.0 6.6
Total annual income (USD) 727.0 55.4 51.9 8890.4 959.9
Total annual crop production
income (USD) 350.0 43.9 4.4 8888.9 724.2
Total annual livestock production
income (USD) 297.4 35.0 13.0 3555.6 494.6
Total annual non-farm Income
(USD) 79.8 59.6 0.9 7296.3 708.0
No. of HH members 10.4 0. 2 1.0 30.0 4.9
n = 301 1 USD =UgShs 2700 at the time of data collection HH = Household
2 Annual household income does not include own consumption.

24
Some households had diversified income generating activities mainly diversifying in on-farm (78.4%)
and non-farm activities (33%). Further analysis showed that crop production contributed the highest
proportion (48%) to the household income, followed by livestock (41%) and non-farm activities
(11%). The major crops grown were cassava (found on 90.4% of the farms), sorghum (77%),
groundnuts (74%), sweet potatoes (71.1%) and millet (70.4%). The major animals reared were
poultry (found on 98.4% of the farms), cattle (73.4%), goats (69.4%), pigs (23.7%) and sheep (22%).
While the non-farm activities engaged in by these households were retail businesses (kiosk, motor
cycle riding, tailoring and motor cycle riding), bricklaying, charcoal burning and civil services
(Figure 7).
Figure 7: Major non-farm income sources of households in the three agro-ecological zones
Reasons for diversification were consumption needs, income demands, access to knowledge about the
enterprise and market availability for the products to diversify their income generating activities
(Figure 8).
Figure 8: Farmers’ engagement in different farm enterprise
0
10
20
30
40
Small
business
Charcoal
burning
Civil servant Brick laying
25.2
9.8 12.2 6.1
30.4
19.6
11.6
4.3
Per
cen
tage o
f fa
rmer
s
Beekeepers
Non-beekeepers

25
In sum, these results revealed that the farming households interviewed were generally poor, had large
households, low education levels and were highly dependent on crop production for survival even
though their farm activities were diversified. Diversification of these activities was mainly driven by
their consumption needs and income demands.
5.1.2 Characteristics of the beekeepers
Table 5 presents demographic characteristics of beekeepers in relation to non-beekeepers. Beekeeping
was a male dominated enterprise practiced by the uneducated farmers that highly depended on on-
farm incomes for their survival. Both groups did not differ in land ownership.
Table 5: Demographic characteristics of beekeeping households in comparison with non-
beekeeping households in the study area
Characteristics of the
farmers
Beekeepers
(n= 163)
(% yes)
Non-beekeepers
(n= 138)
(% yes)
Chi-square
value
P-value
Gender of the farmer
Males 78.3 62.3 9.373 0.002***
Females 21.7 37.7
Education
No formal education 59.6 19.6
Primary education 36.1 31.9 90.479 0.000***
Secondary education 3.6 39.1
Tertiary education 0.6 9.4
Household head
Male headed 94.0 94.2 0.933 0.933
Female headed 5.8 5.8
Marital status
Single 9.0 2.9
Married 86.1 96.4 10.037 0.018**
Divorced 2.4 0.7
Widowed 2.4 0
Land ownership
Freehold 83.7 88.4 0.382
Do not own land 0.6 0.0 1.926
Communal land 15.7 11.6
Main income sources
On farm income source 85.5 71.0 9.604 0.008****
Non-farm income source 7.2 13.8 Proportions were compared using Chi-square, *** refers to significant at 1% level and **= significant at 5% level
Beekeepers and non-beekeepers did not differ in average age (Table 6). Distance to the nearest
markets was 5.4km longer for the beekeepers than the non-beekeepers a difference that was
statistically significant at (p<0.01). Beekeepers also allocated more 0.78 acres of land to livestock
production than non-beekeepers. Furthermore, beekeepers reared more small ruminants than their
counterparts. They also earned 255 USD less household income per year compared to the non-

26
beekeepers suggesting they were poorer with more household revenue emanating from crops than
livestock. On the other hand, non-beekeepers earned more income from non-farm sources than
beekeepers.
Table 6: Comparison of the beekeepers and the non-beekeepers using Independent sample t- test
Farmer attribute (s) Beekeepers (n=163)
Mean
Non-beekeepers (n=138)
Mean
t-statistic
Age of the farmer 44.9 (15.6) 42.8 (14.5) 1.18
Land acres (acres) 9.2 (16.4) 9.4 (10.3) -0.16
Total land allocated to crop
production (acres)
5.5 (6.5) 5.2 (10.0) 0.47
Total land allocated to
livestock production (acres)
2.3 (4.2) 1.5 (1.4) 1.90*
Distance to market (Km) 6.3 (7.4) 0.9 (2.5) 8.23***
No. of cattle reared 4.7 (0.8) 4.7 (5.4) -0.04
No. of goats reared 5.0 (5.2) 3.9 (4.7) 1.84*
No. of sheep reared 1.6 (4.8) 0.6 (1.9) 2.49**
Total annual income (USD) 615.5 (946.1) 870.5 (961.2) -2.32**
Total annual income from
crop production (USD)
382.0 (919.7) 245.0 (229.6) 1.71*
Total annual income from
livestock production (USD)
88.1 (124.5) 324.7 (592.2) -5.03***
Total annual income from
non-farm sources (USD)
98.8 (21.8) 320.0 (734.3) -3.69***
HH size 10.5 (5.1) 10.3 (4.6) 0.31 Standard deviations between brackets (), *** refers to significant at 1% level, ** =significant at 5% level and *=significant
at 10% level. 1USD = Ugshs 2700 at the time of data collection, HH= Household, No. = number
5.2 Economic contribution of beekeeping to the rural households
This section intends to describe the contribution of beekeeping to livelihood outcomes of the
beekeepers. The main products and their incomes are presented first, followed by beekeeping
equipment, beekeepers’ skills and lastly their access to extension services and group membership.
Beekeeping was found to economically contribute to the wellbeing of rural households as direct
income generation. Bee products also facilitated beekeepers to meet their consumption needs.
5.2.1 Bee products and their incomes
Honey (90%), beeswax (18%) and propolis 10% were the main bee products harvested by beekeepers
in the region. About 49% of the honey produced was used for both sale and home consumption, while
47% was solely produced for sale and only 4% purely for home consumption. Farmers that harvested
beeswax either sold it as pure wax (13%) or with honey as comb honey (71%) while others threw it
way (16%).

27
Most beekeepers (90%), concentrated on the production of honey as the main bee product though it
had the least market price. As the main hive product, honey contributed 75% to the total income
derived from bee products, beeswax (24%) and propolis contributed only 1.3%. Though propolis was
rarely produced by the beekeepers, it had the highest unit price followed by beeswax and then honey
(Table 7). Beekeeping generally contributed a small proportion (7%) to the annual household income
of beekeepers and 49% to their annual livestock income.
Table 7: Bee products and their income contribution to the beekeeping households
Variable (s) Mean ±SE Minimum Maximum Standard deviation
Qty. of beeswax
produced/ year (kg) 3.51±1.26 0.00 160.00 16.10
Qty. of honey
harvested /year (kg) 13.42±1.39 0.00 100.00 17.80
Qty. of propolis
produced / year (kg) 0.19±0.80 0.00 10.00 1.04
Tot. annual income
obtained from all bee
products (USD)
43.04 ±6.92 0.00 629.62 79.24
Tot. income obtained
from beeswax (USD) 10.33±4.50 0.00 592.59 57.40
Tot. income obtained
from honey (USD) 32.10±3.43 0.00 222.22 43.74
Tot. income obtained
from propolis (USD) 0.58±0.34 0.00 37.03 4.28
Unit price of beeswax
(USD/kg) a
3.01±0.36 0.55 4.44 1.13
Unit price of honey
(USD/kg) a
2.61±0.14 0.74 9.26 1.72
Unit price of propolis
(USD/kg) a
4.00 ±1.19 0.37 7.41 2.66
1 USD =UgShs 2700 at the time of data collection. Qty. = Quantity Tot. = total
Note: a = mean value was calculated for only respondents that sold the respective product.
5.2.2 Beekeeping equipment
Beekeepers owned a number of equipment used in production and processing of honey as shown in
Table 8. Beehives were the major production equipment. On average beekeepers owned 21 beehives.
Log hives (93%) and Kenyan Top Bar (KTB) hives (68%) were the most common types of beehives
owned. Pot hives (21%) and langstroth hives (21%) were the other hive types used by the beekeepers.
Pot hives and log hives were classified as traditional beehives while KTB and langstroth as improved
beehives. Other production tools owned by majority of the beekeepers were: gum boots, bee suits,
smokers and gloves. Processing equipment such as air tight buckets, honey strainers and honey
extractors were not as common as production equipment among beekeepers.

28
Table 8: Summary of tools and equipment owned by beekeeping households and their prices
Equipment owned and their unit costs Mean ±SE Minimum Maximum Std. Deviation
Number of:
Beehives (n=163) 21.00±1.22 2.00 75.00 15.60
Log hives (n=150) 14.49±1.06 1.00 70.00 12.94
Pot hives (n=35) 3.08±0.34 1.00 8.00 1.20
KTB hives (n=109) 8.71±0.81 1.00 54.00 8.44
Langstroth hives (n=34) 3.94±0.89 1.00 24.00 5.17
Pairs of gumboots (n=58) 1.30±0.07 1.00 3.00 0.59
Bee suits (n=45) 1.40±0.12 1.00 5.00 0.82
Smokers (n=41) 1.50±0.07 1.00 3.00 0.48
Pairs of gloves (n=38) 1.40±0.09 1.00 3.00 0.60
Airtight buckets (n=32) 2.10±0.33 1.00 10.00 1.84
Bee veils (n=29) 1.40±0.14 1.00 4.00 0.78
Bee brushes (n=27) 1.60±0.33 1.00 10.00 1.73
Honey strainer (n=10) 1.10±0.10 1.00 2.00 0.32
Hive tools (n=9) 1.10±0.11 1.00 2.00 0.32
Honey extractor ( n=1)
1.00±0.00 1.00 1.00 0.00
Unit cost (USD) of a:
Log beehive 3.42±0.35 1.85 11.11 2.01
Pot hive 2.03±0.19 1.85 2.22 0.26
KTB hive 36.64±7.38 3.70 92.59 27.62
Langstroth hive 43.24±8.15 27.78 166.67 33.62
Pair of gumboot pair 6.26±0.25 4.44 11.11 1.54
Bee suit 46.21±21.00 5.50 111.11 29.65
Smoker 11.44±1.79 5.55 22.20 5.41
Pair of gloves 5.00±0.36 1.11 16.67 0.46
Airtight bucket 7.84±2.58 1.48 44.40 1.11
Bee veil 16.67± 0.00 16.67 16.67 0.00
Bee brush 1.69±0.18 0.93 2.22 0.48
Honey strainer 24.07±0.75 11.11 3.70 1.50
Hive tool 3.33±2.04 1.11 7.41 3.53 1 USD =UgShs 2700 at the time of data collection. These statistics were compiled for only those beekeepers that owned the
respective equipment not for the whole sample. The unit prices are compiled for only those beekeepers that purchased the
beekeeping equipment themselves.
Beekeepers obtained their beekeeping equipment from different sources: namely through either own
purchase, co-funding, making them locally or through donation from NGOs and government
programs that were promoting beekeeping in the area (Table 9). None of the equipment was found to
be obtained on credit in this study. The major sources were donation and own purchase.
The results on beekeeping equipment implied that beekeeping in the area of study was dominated by
the use of traditional beehives that were majorly locally made by the beekeepers. It was also found
that a few of the beekeepers owned processing equipment and those who did mostly acquired them
through donations rather than own purchase.

29
Table 9: Sources of different beekeeping equipment
Equipment
owned
Number of
beekeepers
Percentage
bought
Percentage
donated
Percentage
locally made
Percentage
Co-funded
Traditional hives
Log hives
Pot hives
150
35
25
41
4
19
70
0
1
40
Improved hives
KTB hives
Langstroth hives
109
34
10
22
84
88
4
0
3
0
Gum boots 58 78 20 0 2
Bee suits 45 34 55 0 11
Smokers 41 34 64 0 2
Gloves 38 31 67 0 3
Airtight bucket 32 66 31 0 3
Bee veils 29 35 73 0 4
Bee brushes 27 43 53 0 4
Honey strainer 10 20 80 0 0
Hive tools 9 70 30 0 0
Honey extractor 1 0 0 0 100
5.2.3 Beekeeping knowledge and skills
The study revealed that beekeepers had knowledge in various beekeeping related activities such as
hive siting (mentioned by 73% of the respondents), local beehive construction (61%), honey
harvesting (52%), understanding the colony calendar (39%), feeding honey bees (33%), capturing of
swarms (27%), processing of other hive products (24%), pests and diseases control (20%), inspection
of beehives (12%) and colony multiplication and splitting (8%).
Furthermore, beekeepers had varying experience in beekeeping. A large part had 4-7years; some had
more experience and others less. A small part were newcomers with one or less than one year of
experience while only 3% had more than ten years of experience. Correlations between beekeeping
experience and knowledge on related activities are reported in Table 10. The knowledge on
processing of other hive products such as beeswax and propolis, feeding honey bees, understanding
the colony calendar, capturing of swarms, harvesting honey and local hive construction increased
with the years of experience.
Fewer of the farmers with beekeeping experience below four years had knowledge on these practices
compared to their counterparts. More farmers with over four years of experience had knowledge on
local hive construction, hive siting, feeding bees and processing of others hive products than those
with less than four years of beekeeping experience. A significantly bigger percentage of the farmers
with over 8 years of beekeeping experience had knowledge on harvesting honey and understanding
the colony calendar than the other two groups. While the number of beekeepers that had obtained

30
knowledge on the above practices differed significantly among the three groups, those that had
obtained knowledge on pests and disease control, colony multiplication and splitting and inspection
of hives did not. It needs to be noted that only few beekeepers had knowledge on such practices
across all the three categories.
Table 10: Knowledge of beekeeping that was dependent on the experience in the activity
5.2.4 Beekeepers’ access to extension services and group membership
Beekeepers had more access to extension services compared to non-beekeepers, a difference that was
significant at p<0.05 (Table 11). More beekeepers also had access to management training, training
on product processing and access to inputs as compared to non-beekeepers. The results also showed
that beekeepers’ main sources of knowledge were fellow beekeepers, extension agents and to a lesser
extent radios, newspapers, parents and relatives. Trial and error (repeated experience) was also
mentioned as a source of knowledge.
Type of knowledge
(1= yes)
≥8 years
(% yes)
4-7 years
(% yes)
<4 years
(% yes)
Chi-square
value
Capturing swarms 45.2 26.0 17.3 10.68**
Hive siting 81.0 80.0 60.0 8.83**
Pest and disease control 21.4 24.0 14.7 1.87
Understanding the colony
calender
57.1 46.0 22.7 13.71**
Local hive construction 83.0 80.0 33.3 40.04**
Honey harvesting 71.4 54.0 37.3 12.80**
Inspection of hives 16.6 10.0 10.7 1.18
Feeding of bees 47.6 38.0 20.0 10.43**
Colony multiplication &
splitting
7.1 12.0 5.3 1.89
Process other products 31.0 36.0 12.0 11.00** ** refers to significant at 5%

31
Table 11: Beekeepers access to different extension services
Extension service
accessibility (Access to :)
Beekeepers (% yes)
n= 166
Non-beekeepers (%yes)
n= 138
Chi-square
value
Any form of extension services 97.0 69.6 43.46**
Training on management 88.0 31.1 103.30**
Training on product processing 58.4 37.7 13.00**
Routine extension agent visits 46.4 37.0 2.74
Inputs 87.4 46.4 58.88**
Marketing information 59.0 63.1 0.51
**refers to significant at 5% level
Note: For the beekeepers, extension services related to beekeeping were used for comparison while access to extension
services on general agriculture was used for non-beekeepers.
The study further reveals differences in sources of extension services between beekeepers and non-
beekeepers. The main sources of extension services to beekeepers were NGOs and government
(Table 12). Some of the beekeepers also received these services from fellow farmers, media channels,
private consultation and community based services. Significantly more beekeepers accessed extension
services through NGOs compared to non-beekeepers. More of the non-beekeepers received their
extension services from the government (mentioned by 59% of the respondents), fellow farmers
(51%) and media channels.
Table 12: Different sources of extension services
5.3 Reasons for keeping bees and not keeping bees
Table 13 gives an overview of the reasons beekeepers indicated as important towards engaging in
beekeeping and factors expressed by non-beekeepers that could convince them to keep bees.
Prospects of high income from hive products, motivation from fellow farmers, personal interest and
access to beekeeping management information majorly drove farmers to diversify into beekeeping.
Non-beekeepers were deterred from beekeeping by limited knowledge about the enterprise
(mentioned by 62% of the respondents), fear of bees because of their defensive behaviour (59%), lack
of capital to buy the equipment (31%), limited space (24%), lack of interest (23%), fear that the
enterprise would not break even (16%) and lack of awareness about the market for the hive products
Source of extension services Beekeepers
(% yes)
Non-beekeepers
(% yes)
Chi-square
value
NGOs 55.06 1.45 132.05**
Government 51.81 74.64 16.70**
Private consultation and
community based services 14.45 59.42 67.70**
Fellow farmers 28.92 51.45 16.06**
Media channels 6.63 18.84 10.51** ** = Significant at 5% level

32
(15%). Non-beekeepers also reported high expected income from hive products, access to beekeeping
management training and access to capital as the major motivations that would encourage them to
keep bees although 9% reported no interest in beekeeping at all.
Table 13: Factors that drive farmers to engage in beekeeping
Pull factors that attracted beekeepers into the activity Share of beekeepers (%yes)
(n=163)
Prospects of high income from hive products 59.0
Fellow farmers keeping bees 50.6
Personal interest 50.0
Access to beekeeping management information 35.5
Parents 12.7
NGOs and government 11.4
Factors that would encourage non-beekeepers to engage in
beekeeping
Share non-beekeepers (%yes)
(n=138)
High income expected to be generated from hive products 63.8
Access to training on beekeeping management 60.9
Access to capital to buy beekeeping equipment 52.9
Reduced bee aggressiveness 44.9
Access to enough land 20.3
Awareness on the market availability 19.6
Security for the hive products so as not to be stolen from the site 16.7
Time availability to manage hives and to attend meetings 10.1
Not interested at all 8.7
5.3.1 Factors likely to influence beekeeping adoption
Table 14 presents the models that were used to ascertain variables influencing the probability of
adopting beekeeping. Several specifications were tested. Statistical tests revealed the absence of
multicollinearity among the independent variables. This was performed by generating their
correlation coefficients and there was no significant correlation found between any of the independent
variables. In addition their variance inflation factors (VIFs) were generated and were all less than 10
which is the threshold. Furthermore, absence of heteroscedasticity was confirmed using the visual
test. The distribution of the error terms was also checked and results showed that the error terms were
non-normally distributed. However, normal distribution of these error terms was assumed because of
the relatively large sample size. Therefore the results from these models are efficient and reliable.
Human capital measured by education level and gender of the farmers significantly influenced
adoption of beekeeping. The results indicated that male farmers were 13% more likely to adopt
beekeeping than female farmers. Primary, secondary and tertiary education levels significantly but
negatively influenced beekeeping adoption. This meant that educated farmers were less likely to
become adopters as opposed to those that had not received formal education. All these variables were
significant at 1% significance level.

33
Similarly, social assets measured by access to extension services, source of the extension services and
being a member of a farmer group had significant influence on adoption of beekeeping. Access to
extension services increased the likelihood of adopting beekeeping. Being a member of a farmer
group also increased the likelihood of adopting beekeeping by 5%. The statistical results also showed
that farmers that accessed extension services through NGOs were 24% more likely to participate in
beekeeping while those accessing them through the government were 9% less likely to adopt.
Lastly, financial assets in terms of distance to the nearest markets also significantly influenced
adoption of beekeeping. Farmers living far from the markets were 2% more likely to adopt as
compared to those located nearer to the markets. This showed that the likelihood of adoption
increased with increase in remoteness. While all these factors significantly influenced the likelihood
of adoption, the results show several other factors that are known to influence adoption but had no
significant influence in the current study. These included the age of the farmer, amount of land owned
by the household, household size and the total annual household income.
Much as human, social and financial assets were found to be important factors influencing
beekeeping adoption, social capital was found to play the biggest role in this process compared to the
other two assets. Natural capital measured by amount of land owned by the household was found not
to influence beekeeping adoption. Less educated farmers living far from markets who got information
and support from NGOs seemed to be targeted for beekeeping adoption. This could be linked to the
fact that the poor living in isolated areas are the main focus when promoting poverty reduction
programmes.

34
Table 14: Estimation results of logistic regression and probit model with adoption (0, 1) as the dependent variable
(Marginal effects are reported (n=301)
Variable (s) Model1 Model 2 Model 3 Model 4 Probit model
Age of the farmer (years) 0.000
(0.001)
0.000
(0.001)
0.000
(0.001)
Gender (1: man) 0.165
(0.490)***
0.130
(0.037)***
0.131
(0.033)***
Primary education (1:yes) -0.190
(0.046)***
-0.083
(0.033)***
-0.084
(0.030)***
Secondary and tertiary education
(1:yes)
-0.632
(0.048)***
-0.200
(0.045)***
-0.199
(0.044)***
HH size (number) 0.002
(0.005)
0.001
(0.003)
0.000
(0.003)
Distance to market (km) 0.080
(0.006)***
0.024
(0.004)***
0.025
(0.004)***
Land acres -0.000
(0.003)
-0.000
(0.001)
-0.000
(0.002)
Tot. annual income (USD) 0.000
(0.000)
0.000
(0.000)
0.000
(0.000)
Member of any farmer group (1:yes) 0.195
(0.048)***
0.054
(0.035)
0.057
(0.036)
Access to extension services (1:yes) 0.219
(0.052)***
0.150
(0.046)***
0.159
(0.047)***
Government (1:yes) -0.017
(0.034)***
-0.087
(0.032)***
-0.086
(0.033)***
NGOs (1:yes)
0.494
(0.065)***
0.241
(0.046)***
0.230
(0.038)***
Eastern zone(1:yes) -0.031
(0.039)
-0.023
(0.039)
Mid-Northern zone (1:yes)
-0.001
(0.040)
0.004
(0.041)
Constant
Pseudo R2 (prob>chi2 = 0.000)
0.145
(0.558)
0.000
(0.674)
0.009
(0.257)
0.001
(1.617)
0.725
0.000
(0.824)
0.725 Tot. = total, HH = Household, ***refers to significant at 1% level and standard errors are between brackets ()
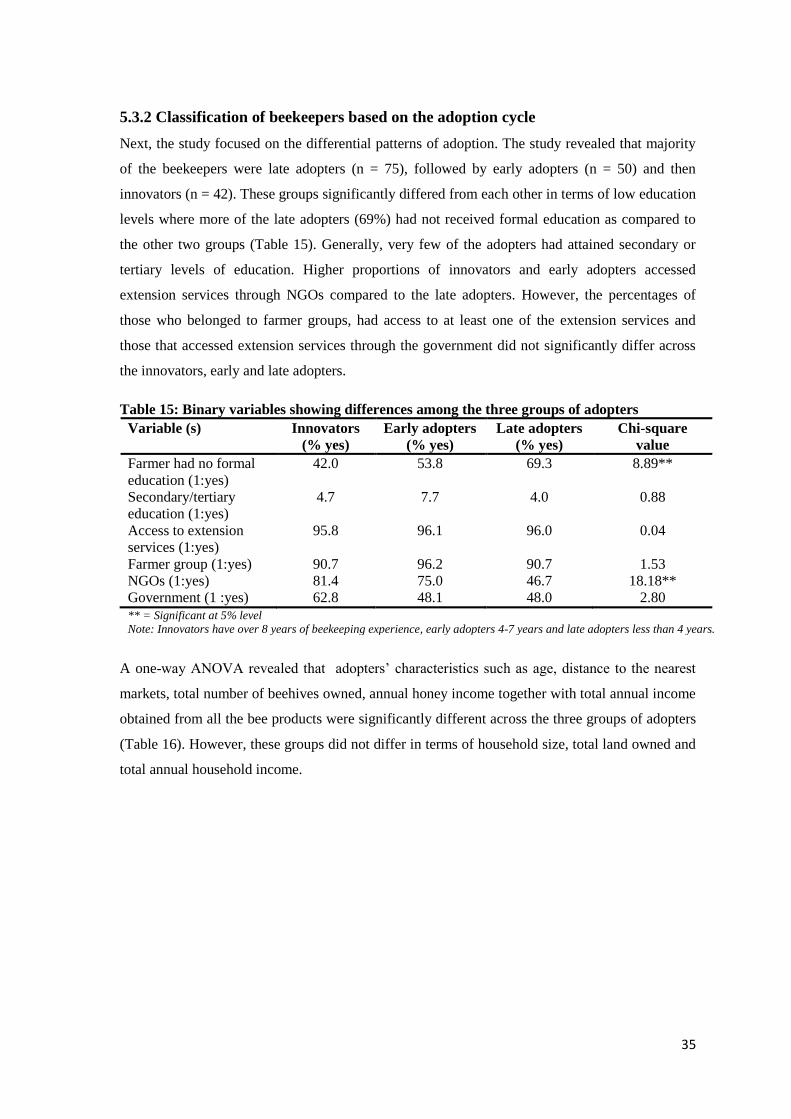
35
5.3.2 Classification of beekeepers based on the adoption cycle
Next, the study focused on the differential patterns of adoption. The study revealed that majority
of the beekeepers were late adopters (n = 75), followed by early adopters (n = 50) and then
innovators (n = 42). These groups significantly differed from each other in terms of low education
levels where more of the late adopters (69%) had not received formal education as compared to
the other two groups (Table 15). Generally, very few of the adopters had attained secondary or
tertiary levels of education. Higher proportions of innovators and early adopters accessed
extension services through NGOs compared to the late adopters. However, the percentages of
those who belonged to farmer groups, had access to at least one of the extension services and
those that accessed extension services through the government did not significantly differ across
the innovators, early and late adopters.
Table 15: Binary variables showing differences among the three groups of adopters
A one-way ANOVA revealed that adopters’ characteristics such as age, distance to the nearest
markets, total number of beehives owned, annual honey income together with total annual income
obtained from all the bee products were significantly different across the three groups of adopters
(Table 16). However, these groups did not differ in terms of household size, total land owned and
total annual household income.
Variable (s) Innovators
(% yes)
Early adopters
(% yes)
Late adopters
(% yes)
Chi-square
value
Farmer had no formal
education (1:yes)
42.0 53.8 69.3 8.89**
Secondary/tertiary
education (1:yes)
4.7 7.7 4.0 0.88
Access to extension
services (1:yes)
95.8 96.1 96.0 0.04
Farmer group (1:yes) 90.7 96.2 90.7 1.53
NGOs (1:yes) 81.4 75.0 46.7 18.18**
Government (1 :yes) 62.8 48.1 48.0 2.80
** = Significant at 5% level
Note: Innovators have over 8 years of beekeeping experience, early adopters 4-7 years and late adopters less than 4 years.
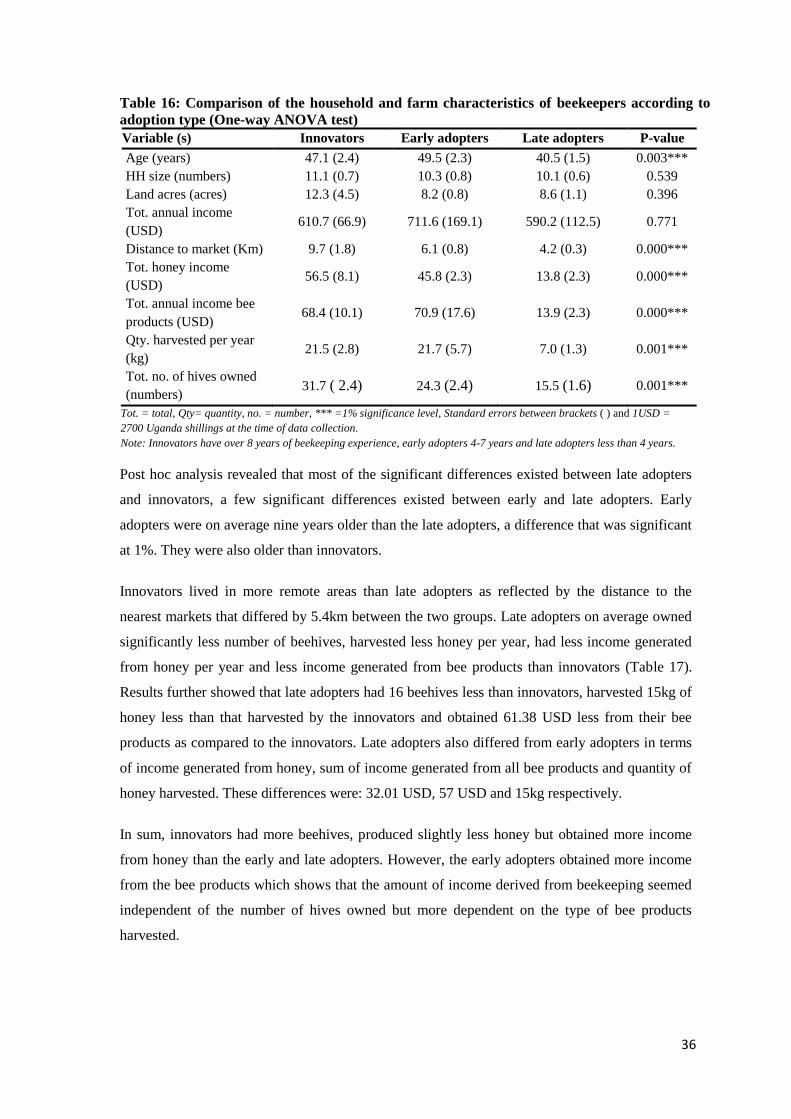
36
Table 16: Comparison of the household and farm characteristics of beekeepers according to
adoption type (One-way ANOVA test)
Post hoc analysis revealed that most of the significant differences existed between late adopters
and innovators, a few significant differences existed between early and late adopters. Early
adopters were on average nine years older than the late adopters, a difference that was significant
at 1%. They were also older than innovators.
Innovators lived in more remote areas than late adopters as reflected by the distance to the
nearest markets that differed by 5.4km between the two groups. Late adopters on average owned
significantly less number of beehives, harvested less honey per year, had less income generated
from honey per year and less income generated from bee products than innovators (Table 17).
Results further showed that late adopters had 16 beehives less than innovators, harvested 15kg of
honey less than that harvested by the innovators and obtained 61.38 USD less from their bee
products as compared to the innovators. Late adopters also differed from early adopters in terms
of income generated from honey, sum of income generated from all bee products and quantity of
honey harvested. These differences were: 32.01 USD, 57 USD and 15kg respectively.
In sum, innovators had more beehives, produced slightly less honey but obtained more income
from honey than the early and late adopters. However, the early adopters obtained more income
from the bee products which shows that the amount of income derived from beekeeping seemed
independent of the number of hives owned but more dependent on the type of bee products
harvested.
Variable (s) Innovators Early adopters Late adopters P-value
Age (years) 47.1 (2.4) 49.5 (2.3) 40.5 (1.5) 0.003***
HH size (numbers) 11.1 (0.7) 10.3 (0.8) 10.1 (0.6) 0.539
Land acres (acres) 12.3 (4.5) 8.2 (0.8) 8.6 (1.1) 0.396
Tot. annual income
(USD) 610.7 (66.9) 711.6 (169.1) 590.2 (112.5) 0.771
Distance to market (Km) 9.7 (1.8) 6.1 (0.8) 4.2 (0.3) 0.000***
Tot. honey income
(USD) 56.5 (8.1) 45.8 (2.3) 13.8 (2.3) 0.000***
Tot. annual income bee
products (USD) 68.4 (10.1) 70.9 (17.6) 13.9 (2.3) 0.000***
Qty. harvested per year
(kg) 21.5 (2.8) 21.7 (5.7) 7.0 (1.3) 0.001***
Tot. no. of hives owned
(numbers) 31.7 ( 2.4) 24.3 (2.4) 15.5 (1.6) 0.001***
Tot. = total, Qty= quantity, no. = number, *** =1% significance level, Standard errors between brackets ( ) and 1USD =
2700 Uganda shillings at the time of data collection.
Note: Innovators have over 8 years of beekeeping experience, early adopters 4-7 years and late adopters less than 4 years.

37
Table 17: Results of post hoc test showing differences in household and farm variables
between adoption groups
5.4 Factors influencing the amount of honey produced by the adopters
As mentioned above there is a large variability in the amount of honey produced between the
adoption groups. Table 18 gives the results of the two models (OLS and Heckman selection
model) that were used to analyse the determinants of honey produced. The results of the first step
of Heckman selection model (probit) are presented in Table 14.
Statistical tests revealed that there was no potential problem of multicollinearity that would cause
the OLS estimation to be inefficient. This was tested using the correlation coefficients of the
independent variables and generating their variance inflation factors (VIFs) and the tolerances.
There was no significant correlation between the explanatory variable, all the VIFs were below 10
which is the threshold and the tolerances were greater than 0.2. Furthermore, normality of the
error terms was checked and results showed that these error terms were non-normally distributed
but normal distribution was assumed because of relatively large sample size. The assumption of
linearity for OLS estimation was also tested using the scatter plot and found not to be violated. On
the other hand, endogeneity was suspected because some of the relevant variables that explain
honey production had not been included in the model and this would cause the OLS estimation to
be inefficient. Furthermore, non-random selection bias was also suspected among beekeepers.
This is due to the fact that beekeepers might have kept bees because of their unobservable
characteristics. The Heckman selection model was hence used to correct for the endogeneity and
selection bias if any. The Heckman inverse mills ratio (lambda) however ruled out the problem of
selection bias and presence of endogenous variables since it was not significant (p=0.336). In
addition, Heckman selection model and OLS estimation showed similar results which implied
robustness.
Variable (s) Innovators Early adopters Late adopters
Age (years) 47.05a,b
(2.34) 49.48a(2.31) 40.48
b(1.54)
Distance to the market (km) 9.65a (1.80) 6.07
a,b(0.81) 4.21
b(0.33)
Tot. honey income (USD) 56.49a(8.07) 45.82
a(2.33) 13.81
b(2.33)
Tot. annual income from bee
products (USD) 68.37
a(10.05) 70.89
a(17.59) 13.90
b(2.33)
Qty. of honey harvested per year
(kg) 21.53
a(2.74) 21.68
a(5.6) 6.99
b(1.28)
Tot. no. of beehives owned
(numbers) 31.72
a ( 2.36) 24.27
a,b(2.37) 15.45
b(1.57)
Qty. = quantity, Tot. = Total, no. = number, Different letters (a-b) indicate significantly different mean values using ANOVA
and post hoc tests. Standard errors are between brackets ()
Note: Innovators have over 8 years of beekeeping experience, early adopters 4-7 years and late adopters less than 4 years.

38
Factors found to significantly influence honey production in the absence of selection bias during
beekeeping adoption were access to market information, access to ready markets, source of
beekeeping equipment, apiary management practices, availability of bee forage and beekeeping
experience.
The results show that beekeepers that had access to market information on average produced 4kg
more than those that did not ceteris peribus. In addition, lack of access to ready markets measured
by selling products to fellow community members reduced the amount of honey produced by
6.5kg on average. The adopters that did not have access to ready markets sold their products to
the fellow members of the community and hence did not have an incentive to increase their
production.
Source of beekeeping equipment measured by whether the beekeeper purchased his/her own log
hives was found to influence honey production. The results showed that beekeepers that
purchased log hives on average produced 12kg more than those that did not ceteris peribus.
Apiary management practices measured by whether the beekeeper had knowledge on inspection
of beehives or not also had significant influence on honey production. A beekeeper that had this
knowledge produced approximately 6kg of honey more than those that did not have the
knowledge. Additionally, a one year increase in beekeeping experience increased honey
production by 7kg. Therefore adopters with longer beekeeping experience produced higher
amounts of honey per year than the new comers.
Furthermore, bee forage availability measured by the presence of citrus on the farm significantly
and negatively influenced honey production. The results showed that the farmers who grew citrus
would produce 7 kg of honey less than those who did not grow them. On the other hand, the study
found no significant effect of the amount of non-farm household income on the amount of honey
production though this had a negative relationship.

39
Table 18: Determinants of quantity of honey produced (dependent variable = Amount of
honey produced per year and n = 301)
Variable(s) OLS Heckman selection model (Second step)
Coefficients Marginal effects
Number of years in beekeeping
(years) 6.72 (1.15)*** 7.01 (1.15)***
Citrus (1:yes) -7.19 (2.60)*** -7.23 (2.50)***
Total non-farm income received
(USD) -3.83e-008 (0.00) -1.99e-007 (0.00)
Log hives bought (1:yes) 12.48 (3.14)*** 12.74 (3.03)***
Bee suit bought (1:yes) 2.95 (4.16) 2.94 (4.00)
Hive inspection (1:yes) 5.88 (3.75)* 6.02 (3.62)*
Pests and disease control (1:yes) 0.43 (3.13) 0.71 (3.03)
Access to extension services 1.82 (7.24) 3.66 (7.22)
Access to market information (1= yes) 4.52 (2.63)* 4.34 (2.54)*
Fellow community members
buyers(1:yes) -6.49 (2.68)** -6.65 (2.60)**
(Constant) 0.14 (8.44)
Mills ratio (lambda)
R2
Pseudo R2 (prob>chi2 = 0.000)
0.35
0.336(3.44)
0.725 For Heckman model, wald chi2 (10) = 77.33, *** refers to Significant at 1% level, **=Significant at 5% level and *
=significant at 10% level, Standard errors are between brackets ().
5.5 The major beekeeping constraints mentioned by the adopters
Now that the factors influencing adoption and honey production are known, attention is given to
constraints which may explain why some beekeepers produced more than others. The study
revealed that beekeepers were affected by production and marketing constraints. Limited
knowledge on production skills, pests and diseases, poor beekeeping group management, low hive
colonization and bush fires were mentioned as the major production constraints. These were
mentioned by more than half of the beekeepers (Figure 9). The other marketing constraints were
mentioned by a few of the beekeepers.
Figure 9: Production constraints of beekeeping

40
Meanwhile the major marketing constraints were poor quality of the hive products, being cheated
by middlemen, long distances to markets, poor roads and lack of proper packaging materials
(Figure 10). Low prices, limited market, low demand for hive products and products getting
damaged during their transportation to the market were other marketing challenges.
Figure 10: Marketing constraints in beekeeping
Given that most beekeepers lived further from the markets, they had to transport their products to
the market. Foot (mentioned by 36% of the respondents), motorcycles (11%), and vehicles (10%)
were the three main means of transporting bee products to the market. Some of the farmers (42%)
entirely sold their products from home hence did not require transport means. The main buyers of
the hive products were middlemen (mentioned by 54% of the respondents), fellow community
members (50%), processing companies (30%) and others like co-operatives (9%), shop dealers
and people with medical problems (8%). The chief places where these products were sold from
included farmers’ homes (60%), nearest markets (49%), schools and hospitals (39%), village
ceremonies (15%) and agricultural shows (8%).
Farmers that sold to co-operatives received 4.27 USD on average as their unit price of honey
while those who mainly sold to fellow community members received 3.20 USD. Additionally,
those that mainly sold to co-operatives had an average honey income per annum of 43.76 USD
while those that sold to their fellow community members had 36.11 USD as their annual honey
income.

41
These results highlighted that a substantial number of the adopters sold their bee products through
informal marketing channels and received low prices because they lived far from markets, were
not organised in cooperatives, had poor roads and did not have proper means of transport.

42
6. CHAPTER SIX: DISCUSSION
This study aimed at analysing beekeeping adoption and production process in Northern Uganda.
Data was collected from three agro-ecological zones in the region. Most households in Northern
Uganda had diversified farm activities, a typical characteristic of rural poor households as
explained by Deininger and Okidi (122). The rural poor diversify their activities so as to
supplement their income from subsistence farming because they have limited risk bearing
capacity. In line with Barrett, Reardon (123), this study found that diversification by rural
households into beekeeping is driven by the desire to meet their economic and consumption
needs. Furthermore, the results indicate that the level of awareness about the enterprise and
market availability play a big role during the selection of diversification enterprises. This finding
was in agreement with Dimara and Skuras (124) who reported that lack of producer information
especially regarding profitability of improved practices hinders peoples’ participation in certain
activities.
6.1 Predictors of beekeeping adoption
Human capital influenced beekeeping adoption. The current study found that male farmers were
more likely to adopt beekeeping compared to female farmers holding other factors constant. This
concurs with some other studies where beekeeping was reported to be a male dominated activity
(93, 125). Male’s dominance in beekeeping may be linked to several possible explanations such
as women’s household labour demands, predominant use of traditional hives and aggressive
behaviour of the bees (11, 126). The aggressive behaviour of African honey bees leaves early
morning and late evening hours as the only convenient times for carrying out routine apiary
management activities such as hive inspection and harvesting yet this is the time when women are
busy with other house chores. In addition, most Ugandan cultures forbid women from climbing
trees and this could be one of the reasons why women rarely participate in beekeeping especially
when traditional hives are used. Traditional hives tend to be hanged very high in trees and this
makes it complicated for women to carryout management practices without climbing. Females
also have limited access to tools and equipment and are less likely to receive extension services
(127-129). Thus they lack the technical know-how and means to adopt improved technologies
which may in turn influence their capacity to take on activities like beekeeping.
Another important finding was that non-educated farmers were more likely to adopt beekeeping
than those that had received formal education ceteris peribus. This may be explained by the fact
that educated farmers tend to concentrate more on non-farm income sources to supplement their
household income. Another possible explanation for large participation by the less educated may
be that beekeeping projects targeted the poorest and low educated farmers as a poverty reduction

43
intervention. However, this finding is contrary to Mwangi, Kihurani (130) who reported that
farmers with primary education were more likely to adopt than the illiterate ones while no
significant relationship between secondary and tertiary education level with adoption of new
agricultural technologies was found.
Social capital provided the largest set of significant variables that had a positive relationship with
adoption. For instance, access to extension services increased the likelihood of adopting
beekeeping. This was in agreement with Knowler and Bradshaw (56) who found knowledge
acquisition as a key driver of adoption. The results also showed that farmers that had membership
in farmer groups were more likely to adopt beekeeping. This could be linked to the assumption
that farmers in farmer groups can easily access inputs required for the start. In line with these
findings, Edillon (57) found that organizational membership and extension service coverage
significantly increased adoption of agricultural technologies in the Philippines.
Sources of extension services also significantly influenced adoption. The farmers that accessed
extension services through NGOs were more likely to adopt beekeeping. This might be linked to
the fact that NGOs tend to focus more on the poorer people while offering their services in
poverty eradication programs. Most farmers in Sub-Saharan Africa that benefit from government
programs are usually the more wealthy farmers. Furthermore, Anandajayasekeram (131) reported
that government uses top-down approach in providing extension services and lacks commitment
as reflected by their failure to allocate sufficient funds to run extension programs. The same study
reported that some government extension agents used their positions to extract rents from farmers
which discouraged the farmers from participating in government aided programs. Putting all this
together, their services are usually less efficient than those provided by NGOs and Community
Based Organisations (CBOs). NGOs and CBOs use the interactive system and are often more
committed. Most public extension services have also been condemned for lacking relevant
technologies, motivation and accountability to their clients which makes their services ineffective
(132).
Financial assets also influenced adoption of beekeeping. Access to infrastructure measured by
distance to the nearest markets had a negative relationship with beekeeping adoption. Much as it
would be thought that farmers living nearer to markets would adopt easily, this study found that
the likelihood of adopting beekeeping increased with the increase in distance to the nearest
markets ceteris peribus. This could be linked to the defensive behaviour of bees which cause
beekeeping to only be favourably done in remote and isolated areas such as forests (50).

44
6.2 Honey production determinants and beekeeping barriers
The honey production seemed to be rather variable across the farmers. The major factors affecting
production of honey in the study area are: access to market information, access to ready markets,
source of beekeeping equipment, beekeeping experience and forage availability.
Beekeepers with access to market information were found to produce significantly more honey
than those that did not have access to this information which was in agreement with the study
done in Ethiopia (58). In addition, access to ready markets was reported as an important
determinant of the amount of honey produced in the current study. Lack of access to ready market
which caused beekeepers to sell their honey to fellow community members as the main buyers
reduced honey production by about 7kg. This was in line with Abebe (133) who reported that an
efficient and integrated market with good performance is very crucial for stimulating farmers to
increase their output. Reduced production might be explained by lack of incentive to produce
since the beekeepers are not certain of who will buy their produce in case of no access to ready
markets.
Another interesting finding was that the source of the beekeeping equipment significantly
influenced production. Farmers that bought their equipment were found to produce 12kg more
than those that obtained equipment through donation. This might be linked to the fact that those
that purchase the equipment tend to value it more than when it is freely given to them and are
highly committed to honey production. In line with this, Reardon, Kelly (134) reported that a
policy priority that would be used to increase agricultural productivity in Africa during the 21st
century would be helping farmers find ways to earn income to pay for agricultural inputs and
equipment instead of giving them hand-outs.
Routine apiary management practices such as hive inspection significantly and positively
influenced honey production, a finding that is similar to that reported by Okwee-Acai, Anyanzo
(62). These practices ensure proper management of hives and reduce absconding incidences. The
knowledge on these management practices was obtained from different sources such as fellow
beekeepers, government and NGO extension programs.
Furthermore, the longer the experience in beekeeping the adopter had, the higher the amount of
honey produced holding other factors constant. A possible explanation for this may be that
farmers with longer experience had mastered the process of production and could easily
counteract certain challenges that the new comers would probably not be able to solve.
Beekeepers with longer experience also had knowledge on most of the management practices
such as hive siting, feeding bees, understanding the colony calendar and harvesting of honey.
Proper management not only increases colonisation rates but also productivity. On the contrary,

45
Kersting and Wollni (135), reported that young farmers were more innovative and likely to
produce more and good quality fruits in Thailand than the old experienced farmers.
Surprisingly, availability of forage was negatively related to honey production, a direction
opposite from what was anticipated. This study found that adopters that had citrus on their farms
produced 7kg less than those that did not grow citrus. This could be explained by the insecticidal
activity exerted on the bees by caffeine and other related substances contained in citrus pollen
(136). The toxicity from citrus caffeine is usually not a problem if it is not in synergy with the
effects of pesticides. The same study reported that these synergetic effects weaken worker bees
and they cannot go foraging in the field which weakens the colony leading to low honey
production in the long run.
While struggling to produce optimally, beekeepers encountered several challenges. The results
were in agreement with (9) who reported chief production constraints as lack of knowledge on
production skills and pests and diseases. Contrary to the current study, Michael (137) reported
theft and aggressive behaviour of the bees as the major constraints of beekeeping in Nigeria. The
current study also revealed that being cheated by middlemen, production of poor quality products
and walking long distances to look for markets were the key marketing constraints. Being cheated
by middlemen could be attributed to selling of unprocessed products and lack of proper packaging
materials. Value addition which translates into high prices and ability to exploit the export market
was hardly explored by the beekeepers. This was probably because these beekeepers rarely owned
processing equipment. As a result beekeepers were unable to produce good quality products, were
given low prices by middlemen which forced them to sometimes walk for long hours searching
for better prices for their products. This finding was in agreement with Ejigu, Gebey (79).
6.3 Status of beekeeping in the area of study
This study revealed that beekeeping is still contributing a very small percentage to beekeepers’
average household income. This is much smaller than its estimated potential and could be linked
to the neglected potential of beeswax and propolis production, marketing and production
constraints and also the low amount of honey currently produced by most farmers. For instance,
only 18% and 10% of the adopters harvested beeswax and propolis respectively. Yet beeswax and
propolis had higher unit prices than honey. Although the contribution seemed small, it could still
be of help to beekeeping households given that beekeeping was prominent in poorer households
where every coin counts. This additional income can be used to buy household items, farming
tools and pay school fees for the children (79). The current contribution of beekeeping could be
increased through creating awareness about the production, benefits and marketing of the propolis
and beeswax as well as improving production of honey through use of better hives and improved
knowledge.

46
The study also found that most of the beekeepers had not received formal education. These
findings were contrary to those of Chuma, Mushuku (5) and Matanmi, Adesiji (138) who found
that 80% of the beekeepers in Nigeria had received post-secondary education. On the other hand,
they were in agreement with Ndyomugyenyi, Odel (13) who also found beekeepers to have low
education levels. The low levels of education might have forced beekeepers to largely depend on
on-farm income since alternative sources of income are always limited for the uneducated people.
Due to over dependency on on-farm income sources the beekeepers were poorer than the non-
beekeepers. Since beekeeping participation is currently dominated by the poor and uneducated
farmers, its promotion among educated farmers should be targeted to increase its production. If
this target is achieved, then this might also translate into increased beekeeping income to
households. This will prevent the activity from getting extinct as education levels of farmers
increase in the future generations and also given that people choose their household activities
based on their ability to satisfy their economic needs.
Beekeepers were relatively older and this was in line with the findings of Mujuni, Natukunda (9)
who found most of the beekeepers to be over fifty years of age. This could be attributed to the
migration of the youth to urban areas in search for white-collar jobs leaving farming for the
ageing population in the rural areas. Study findings were on the other hand not in agreement with
those of Michael (137) who found that most of the beekeepers were below forty years of age.
Furthermore, the study revealed that currently most beekeepers sell their honey mainly to fellow
community members who offer them low prices. Co-operatives offer higher prices but very few
of the beekeepers are organised in co-operatives which deny them an opportunity to explore
collective marketing and increased market accessibility. This is in line with Hussein (139) who
found that few beekeepers in Arabian countries were organised in beekeeping associations. If
market inaccessibility problems are addressed, this could increase production because ready
markets will act as a motivation.
6.4 Limitation of the study
The major limitation is the cross sectional design used. This design only gives a snapshot of the
situation at a particular point in time. Therefore, no cause and effect relationships can be drawn
from it. With this study design, it is also difficult to predict the behavioural changes of the farmers
over time. Another limitation is that the number of women involved in beekeeping was relatively
small (22%) thus assessing gender related issues was not possible in this study. The measurement
of income was also challenging since most farmers did not have proper records of their cash flows
and were also not very open about the topic. Recall method was mainly used to answer questions
related to generated income and this is not as reliable as if they had proper records kept.

47
7. CHAPTER SEVEN: CONCLUSION AND RECOMMENDATIONS
7.1 Conclusion
The main aim of this study was to analyse the adoption and production process of beekeeping
while overcoming the limitations of previous studies. Data were collected randomly with the aid
of a structured questionnaire from 166 beekeepers and 138 non-beekeepers in Northern Uganda.
Descriptive statistical tests, OLS, binary logistic regression and Heckman selection models were
used to analyse the collected data. The analysis for the factors influencing beekeeping adoption
and honey production was mainly based on the sustainable livelihood framework.
Study findings show that human, social and financial capitals are the key drivers of adoption of
beekeeping in this setting. Social capital is however the most important of the three capitals.
Social capital in terms of access to extension services, group membership and source of extension
services greatly influenced beekeeping adoption rates. Other notable findings are that beekeeping
is predominantly a male activity engaged in by the poor that live far away from markets and are
largely dependent on crop production for their survival.
Access to market information, access to ready markets, routine apiary management practices,
sources of beekeeping equipment, forage availability and beekeeping experience are the major
determinants of honey production in this context. Concerning forage availability, the current study
shows that much as integration of crop production in beekeeping is very important, it may also
affect honey production negatively.
7.2 Recommendations
Social capital in form of access to extension services and group membership was crucial in
adoption process. To increase future beekeeping adoption rates, the study recommends that
development programs promoting beekeeping as a source of supplementary income to bridge the
existing production and marketing knowledge gaps and also ensure that farmers are organised in
groups. Private-public partnerships should be put in place to assist in bridging the gaps in
extension services. These partnerships will be useful since most NGO programs are short-lived. A
collaboration of the government with NGOs will increase sustainability in delivery of extension
services and beekeeping related knowledge even after NGO projects have ended. The government
should also put policy measures in place to reduce rent seeking behaviour of the extension
workers. This will increase the number of farmers taking up beekeeping under government aided
programs.
The study also recommends farmers to invest in the production of propolis and beeswax given
their higher prices. This is vital if beekeeping is to be considered a poverty reduction activity.

48
Higher prices for the bee products could also be achieved through organising farmers into co-
operatives. Subsidies should also be provided to beekeepers for production of properly packaged
honey to increase market access especially the export market. These interventions will lead to a
shift from the currently popular informal marketing channels of bee products to the formal ones.
To increase the current honey production, a conducive and well organised market for honey is
recommended. Additionally, beekeepers should be trained on how to produce optimally even with
farming systems that integrate crop production with beekeeping. With increased access to ready
markets and production knowledge, future honey production will be increased.
Finally, a longitudinal research is needed to explain why most beekeepers have not exploited the
production of beeswax and propolis. Yet the current study shows that these two products have
higher market prices than honey. In addition, future researchers can explore how to promote
beekeeping among educated farmers. This is because presently, it is mainly done by uneducated
farmers.
Note: Figures 3 and 4 were accessed from: http://www.ugandahoney.com/about-uganda-
honey.html

49
REFERENCES
1. Collier P, Dercon S. African Agriculture in 50Years: Smallholders in a rapidly changing
world? World development. 2014;63:92-101.
2. Linard C, Gilbert M, Snow RW, Noor AM, Tatem AJ. Population distribution, settlement
patterns and accessibility across Africa in 2010. PloS one. 2012;7(2):43-317.
3. Rodríguez-Pose A, Hardy D. Addressing poverty and inequality in the rural economy
from a global perspective. Applied Geography. 2015;61:11-23.
4. Rigg J. Land, farming, livelihoods, and poverty: rethinking the links in the rural South.
World Development. 2006;34(1):180-202.
5. Chuma M, Mushuku A, Chirenje L, Chitongo L, Mudyariwa R. Livelihood resilient
strategies through beekeeping in Chitanga village, Mwenezi district, Zimbabwe.
Sustainable Agriculture Research. 2012;2(1):124.
6. Gollin D, Rogerson R. Productivity, transport costs and subsistence agriculture. Journal
of Development Economics. 2014;107:38-48.
7. IFAD. Enabling poor rural people to overcome poverty in Uganda. International Fund for
Agricultural Development (Report), 2013.
8. Alkire S, Foster J. Understandings and misunderstandings of multidimensional poverty
measurement. The Journal of Economic Inequality. 2011;9(2):289-314.
9. Mujuni A, Natukunda K, Kugonza D. Factors affecting the adoption of beekeeping and
associated technologies in Bushenyi district, Western Uganda. Livestock Research for
Rural Development. 2012;24:08.
10. Moniruzzaman M, Rahman M. Prospects of beekeeping in Bangladesh. Journal of the
Bangladesh Agricultural University. 2009;7(1):109-16.
11. Ogaba MR, Akongo T, editors. Gender issues in Beekeeping–the Uganda case.
APIMONDIA congress Durban, South Africa; 2001.
12. Ogaba M. Household poverty reduction through beekeeping amongst Uganda rural
women. Standing commission of beekeeping for rural development, Monmouth. 2002.
13. Ndyomugyenyi E, Odel I, Okeng B. Assessing honey production value chain in Lira sub-
county, Lira district, Northern Uganda. Livestock Research for Rural Development.
2008;20(5):7.90.
14. Gupta RK, Reybroeck W, van Veen JW, Gupta A. Beekeeping for poverty alleviation and
livelihood security. New York: Springer; 2014.
15. Sacco SJ, Jones AM, Sacco RL. Incorporating global sustainability in the business
language curriculum. Global Business Languages. 2014;19(1):3.
16. Manyi-Loh CE, Clarke AM, Ndip RN. An overview of honey: therapeutic properties and
contribution in nutrition and human health. African Journal of Microbiology Research.
2011;5(8):844-52.
17. Lietaer C, editor Impact of beekeeping on forest conservation, preservation of forest
ecosystems and poverty reduction. XIII World forestry congress Buenos Aires,
Argentina; 2009.
18. Gemeda TK. Integrating improved beekeeping as economic incentive to community
watershed management: The case of sasiga and Sagure districts in Oromiya region,
Ethiopia. Agriculture, Forestry and Fisheries. 2014;3(1):52-7.
19. Gibbs DM, Muirhead IF. The economic value and environmental impact of the Australian
beekeeping industry: publisher not identified; 1998.
20. Morse RA, Calderone NW. The value of honey bees as pollinators of US crops in 2000.
Bee culture. 2000;128(3):1-15.
21. Chaplin-Kramer R, Dombeck E, Gerber J, Knuth KA, Mueller ND, Mueller M, et al.
Global malnutrition overlaps with pollinator-dependent micronutrient production.
Biological Sciences. 2014;281(1794):17-99.
22. Klatt BK, Holzschuh A, Westphal C, Clough Y, Smit I, Pawelzik E, et al. Bee pollination
improves crop quality, shelf life and commercial value. Biological Sciences.
2014;281(1775):24-40.

50
23. Kidd AD, Christoplos I, Farrington J, Beckman M. Extension, poverty and vulnerability
in Uganda: country study for the Neuchatel initiative: Overseas Development Institute;
2001.
24. SNV. Beekeeping /Honey value chain financing study report. Nairobi, Kenya: The
institute of community and organizational development (CODIT) (Report) 2009.
25. Behnke R, Nakirya M. The contribution of livestock to the Ugandan economy. IGAD
Livestock Policy Initiative Working Paper. 2012(02-12).
26. Doss CR. Analyzing technology adoption using microstudies: limitations, challenges, and
opportunities for improvement. Agricultural Economics. 2006;34(3):207-19.
27. Gupta RK, Khan M, Srivastava R, Goswami V. History of beekeeping in developing
world. Beekeeping for poverty alleviation and livelihood security. Netherlands: Springer;
2014. p. 3-62.
28. Engel MS, Hinojosa-Díaz IA, Rasnitsyn AP. A honey bee from the Miocene of Nevada
and the biogeography of Apis (Hymenoptera: Apidae: Apini). Proceedings of the
California Academy of Sciences. 2009;60(1):23.
29. Crane EE. The world history of beekeeping and honey hunting. New York: Routledge;
2013.
30. Ellis F, Bahiigwa G. Livelihoods and rural poverty reduction in Uganda. World
Development. 2003;31(6):997-1013.
31. Scoones I. Sustainable rural livelihoods: A framework for analysis, IDS working paper
72, Brighton. 1998.
32. Chambers R, Conway G. Sustainable rural livelihoods: practical concepts for the 21st
century: Institute of Development Studies (UK); 1992.
33. Carney D, editor Sustainable rural livelihoods: what contribution can we make? Papers
presented at the Department for International Development's natural resources advisers'
conference, July 1998. Department for International Development (DFID), 1998.
34. DfID U. Sustainable livelihoods guidance sheets. London: DFID. 1999.
35. Carney D, Drinkwater M, Rusinow T, Neefjes K, Wanmali S, Singh N. Brief comparison
of the livelihoods approaches of the United Kingdom for international development
(DFID), care, OXFAM and the United Nations development programme (UNDP). 2001.
36. Wilson R. Current status and possibilities for improvement of traditional apiculture in
sub-Saharan Africa. Sierra. 2006;550:77.
37. Krell R. Value-added products from beekeeping. Rome: Food & Agriculture
Organisation; 1996.
38. Illgner PM, Nel EL, Robertson MP. Beekeeping and local self‐reliance in rural Southern
Africa. Geographical Review. 1998;88(3):349-62.
39. Gebreyohannes M. Socio-economic analysis of market oriented beekeeping in Atsbi
Wemberta district of Eastern zone, Tigray Region. Unpublished: Makelle University;
2010.
40. Kipainoi SM. Diversification of livelihood strategies among Isiria maasai of lolgorien
ward, Narok county, Kenya. Unpublished: Kenyatta University; 2013.
41. Enzama W. Quest for economic development in agrarian localities: lessons from West
Nile, Uganda. ISS Working Papers-General Series, 2008 (0921-0210).
42. Carroll T, Kinsella J. Livelihood improvement and smallholder beekeeping in Kenya: the
unrealised potential. Development in Practice. 2013;23(3):332-45.
43. Benin S, Nkonya E, Okecho G, Pender J, Nahdy S, Mugarura S. Assessing the impact of
the National Agricultural Advisory Services (NAADS) in the Uganda rural livelihoods:
International Food Policy Research Institute; 2007.
44. Crane E. Bees and beekeeping: science, practice and world resources. UK: Heinemann
Newnes; 1990.
45. Bradbear N. Bees and their role in forest livelihoods: a guide to the services provided by
bees and the sustainable harvesting, processing and marketing of their products. Non-
wood Forest Products. 2009(19).

51
46. Ison R, Russell D. Agricultural extension and rural development: breaking out of
knowledge transfer traditions. United Staes of America: Cambridge University Press;
2000.
47. Feder G, Just RE, Zilberman D. Adoption of agricultural innovations in developing
countries: A survey. Economic development and cultural change. 1985;33(2):255- 98.
48. Diederen P, Van Meijl H, Wolters A, Bijak K. Innovation adoption in agriculture:
innovators, early adopters and laggards. Cahiers d’économie et sociologie rurales.
2003;67(1):30-50.
49. Feder G, Umali DL. The adoption of agricultural innovations: a review. Technological
forecasting and social change. 1993;43(3):215-39.
50. Breed MD, Guzmán-Novoa E, Hunt GJ. Defensive behavior of honey bees: organization,
genetics, and comparisons with other bees. Annual Reviews in Entomology.
2004;49(1):271-98.
51. Nkonya E, Pender J, Kaizzi C, Edward K, Mugarura S. Policy options for increasing crop
productivity and reducing soil nutrient depletion and poverty in Uganda. Washington:
International Food Policy Research Institute; 2005.
52. Adgaba N, Al-Ghamdi A, Shenkute A, Ismaiel S, Al-Kahtani S, Tadess Y, et al. Socio-
economic analysis of beekeeping and determinants of box hive technology adoption in the
Kingdom of Saudi Arabia. Journal of Animal and Plant Sciences. 2014;24(6):1876-84.
53. Kim S, Gillespie JM, Paudel KP. The effect of socioeconomic factors on the adoption of
best management practices in beef cattle production. Journal of Soil and Water
Conservation. 2005;60(3):111-20.
54. Wodajo WA. Financial benefits of box hive and the determinants of its adoption in
selected district of Ethiopia. American Journal of Economics. 2011;1(1):21-9.
55. Singh K, Peshin R, Saini SK. Evaluation of the agricultural vocational training
programmes conducted by the Krishi Vigyan Kendras (Farm Science Centres) in Indian
Punjab. Journal of Agriculture and Rural Development in the Tropics and Subtropics.
2011;111(2):65-77.
56. Knowler D, Bradshaw B. Farmers’ adoption of conservation agriculture: A review and
synthesis of recent research. Food policy. 2007;32(1):25-48.
57. Edillon RG. Social capital and the decision to adopt new technology among rice farmers
in the Philippines. Philippine Journal of Development. 2010;37(1):1-13.
58. Bekele TD. Beekeeping practices, factors affecting production, quality of honey and
beeswax in Bale zone, Oromia region. Unpublished: Haramaya University; 2015.
59. Babatunde R, Olorunsanya E, Omotesho O, Alabi B. Economics of honey production in
Nigeria: Implications for poverty reduction and rural development. Global Approaches
To Extension Practice (GAEP). 2007;3(2):23-8.
60. Yirga G, Teferi M. Participatory technology and constraints assessment to improve the
livelihood of beekeepers in Tigray region, Northern Ethiopia. Momona. Ethiopian Journal
of Science. 2010;2(1):76-92.
61. Olarinde L, Ajao A, Okunola S. Determinants of technical efficiency in beekeeping farms
in Oyo State, Nigeria: A Stochastic production frontier approach. Research Journal of
agriculture and Biological sciences. 2008;4(1):65-9.
62. Okwee-Acai J, Anyanzo T, Aroba J, Vuchiri J, Onzivua T, Okullo P. Effects of apiary
management on colonisation and colony performance of African honey bee (Apis
mellifera) in the North-Western agro-ecological zone of Uganda. Livestock Research for
Rural Development. 2010;22(5).
63. Le Conte Y, Navajas M. Climate change: impact on honey bee populations and diseases.
Revue Scientifique et Technique-Office International des Epizooties. 2008;27(2):499-
510.
64. Meixner MD. A historical review of managed honey bee populations in Europe and the
United States and the factors that may affect them. Journal of Invertebrate Pathology.
2010;103:S80-S95.
65. Benton T. Bumblebees: the natural history & identification of the species found in
Britain. London: Collins 2006.

52
66. Williams PH. Environmental change and the distributions of British bumble bees
(Bombus Latr.). Bee world. 1986;67(2):50-61.
67. Xie Z, Williams PH, Tang Y. The effect of grazing on bumblebees in the high rangelands
of the eastern Tibetan plateau of Sichuan. Journal of Insect Conservation.
2008;12(6):695-703.
68. Woyke J. Correlations and interactions between population, length of worker life and
honey production by honeybees in a temperate region. Journal of Apicultural Research.
1984;23(3):148-56.
69. Farrar C. The influence of colony populations on honey production. Journal of
Agriculture Research. 1937;54(12):945-54.
70. Pokhrel S. The ecological problems and possible solutions of beekeeping in hills and terai
of Chitwan, Nepal. Journal of Agriculture and Environment. 2009;9:23-33.
71. Qaiser T, Ali M, Taj S, Akmal N. Impact assessment of beekeeping in sustainable rural
livelihood. Journal of Social Sciences. 2013;2(2):82-90.
72. Ritter W, Akratanakul P. Honey bee diseases and pests: a practical guide. Rome: Food
and Agriculture Organization of the United Nations; 2006.
73. Mahaman B, Harizanis P, Filis I, Antonopoulou E, Yialouris C, Sideridis A. A diagnostic
expert system for honeybee pests. Journal of Computers and Electronics in Agriculture.
2002;36(1):17-31.
74. Shimanuki H, Knox D, Furgala B, Caron D, Williams J. Diseases and pests of honey
bees. Beekeeping in the United States Agriculture handbook. 1980;9(335):118-28.
75. Namwata BM, Mdundo KJ, Malila MN. Potentials and challenges of beekeeping industry
in Balang’dalalu Ward, Hanang’district in Manyara, Tanzania. Kivukoni Journal.
2013;1(2):75-93.
76. Arse G, Tesfaye K, Sebsibe Z, Tekalign G, Gurmessa U, Tesfaye L, et al. Participatory
rural appraisal investigation on beekeeping in ArsiNegelle and Shashemene districts of
West Arsi zone of Oromia, Ethiopia. Livestock Research for Rural Development.
2010;22(7):26-31.
77. Kimaro J, Liseki S, Mareale W, Mrisha C. Enhancing rural food security through
improved beekeeping in Northern Tanzania. Livestock Research for Rural Development.
2013;25(12).
78. Kulindwa K, Lokina R, Hepelwa A. Poverty-environment policy analysis (Report).
Unpublished: Ministry of finance and economic affairs 2010.
79. Ejigu K, Gebey T, Preston T. Constraints and prospects for apiculture research and
development in Amhara region, Ethiopia. Livestock Research for Rural Development.
2009;21(10):172.
80. Gichora M, Wittmann D, Odulaja A, editors. Beekeeping in baringo district, kenya:
which way forward for research and extension? Proceedings of the 37th International
Apicultural Congress, 28 October – 1 November 2001; 2001; Durban South Africa:
International Centre for Insect Physiology and Ecology, Nairobi Kenya
81. Tadesse G, editor Marketing of honey and beeswax in Ethiopia: past, present and
perspective futures. Proceedings of the 3rd national annual conference of Ethiopian
beekeepers association, held from 2001 September; 2001; Addis ababa.
82. Hilmi M, Bradbear; N, Mejia D. Beekeeping and sustainable livelihoods. second ed.
uganda: Food and Agriculture Organisation. 2012. 82 p.
83. Martha B, editor Value adding through food processing, food safety and quality
management. under coordination of Groupe d’Expertise, de Conseil et d’Appui au
Development (GECAD), October; 2004; Kigali.
84. Ministry of natural resources and tourism. Tanzania beekeeping policy. Unpublished:
Ministry of natural resources and tourism, United Republic of Tanzania (Report), 1998.
85. Singh B, Sekhon M. Economics of honey production in Punjab. Journal of Agricultural
Development and Policy. 2014;24(1):85-94.
86. Kajobe R, Agea JG, Kugonza DR, Alioni V, Otim A, Rureba T, et al. National
beekeeping calendar, honeybee pest and disease control methods for improved production
of honey and other hive products in uganda. Entebbe, Uganda: Research report submitted
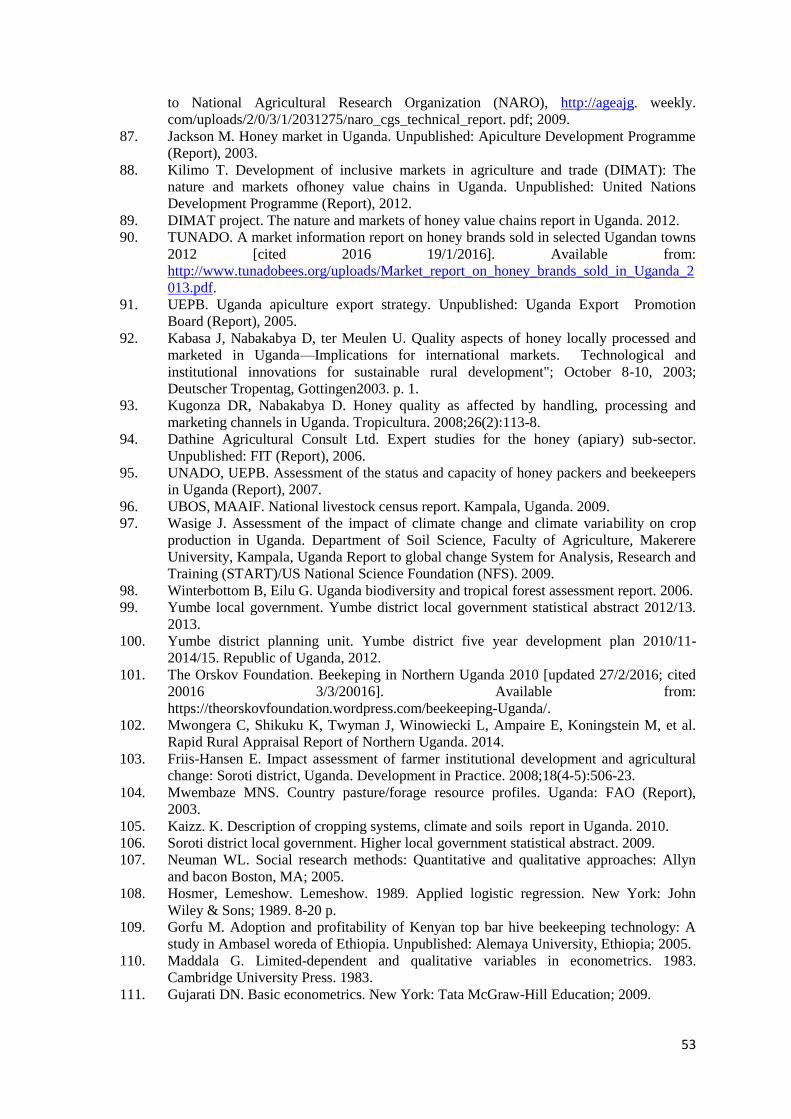
53
to National Agricultural Research Organization (NARO), http://ageajg. weekly.
com/uploads/2/0/3/1/2031275/naro_cgs_technical_report. pdf; 2009.
87. Jackson M. Honey market in Uganda. Unpublished: Apiculture Development Programme
(Report), 2003.
88. Kilimo T. Development of inclusive markets in agriculture and trade (DIMAT): The
nature and markets ofhoney value chains in Uganda. Unpublished: United Nations
Development Programme (Report), 2012.
89. DIMAT project. The nature and markets of honey value chains report in Uganda. 2012.
90. TUNADO. A market information report on honey brands sold in selected Ugandan towns
2012 [cited 2016 19/1/2016]. Available from:
http://www.tunadobees.org/uploads/Market_report_on_honey_brands_sold_in_Uganda_2
013.pdf.
91. UEPB. Uganda apiculture export strategy. Unpublished: Uganda Export Promotion
Board (Report), 2005.
92. Kabasa J, Nabakabya D, ter Meulen U. Quality aspects of honey locally processed and
marketed in Uganda—Implications for international markets. Technological and
institutional innovations for sustainable rural development"; October 8-10, 2003;
Deutscher Tropentag, Gottingen2003. p. 1.
93. Kugonza DR, Nabakabya D. Honey quality as affected by handling, processing and
marketing channels in Uganda. Tropicultura. 2008;26(2):113-8.
94. Dathine Agricultural Consult Ltd. Expert studies for the honey (apiary) sub-sector.
Unpublished: FIT (Report), 2006.
95. UNADO, UEPB. Assessment of the status and capacity of honey packers and beekeepers
in Uganda (Report), 2007.
96. UBOS, MAAIF. National livestock census report. Kampala, Uganda. 2009.
97. Wasige J. Assessment of the impact of climate change and climate variability on crop
production in Uganda. Department of Soil Science, Faculty of Agriculture, Makerere
University, Kampala, Uganda Report to global change System for Analysis, Research and
Training (START)/US National Science Foundation (NFS). 2009.
98. Winterbottom B, Eilu G. Uganda biodiversity and tropical forest assessment report. 2006.
99. Yumbe local government. Yumbe district local government statistical abstract 2012/13.
2013.
100. Yumbe district planning unit. Yumbe district five year development plan 2010/11-
2014/15. Republic of Uganda, 2012.
101. The Orskov Foundation. Beekeping in Northern Uganda 2010 [updated 27/2/2016; cited
20016 3/3/20016]. Available from:
https://theorskovfoundation.wordpress.com/beekeeping-Uganda/.
102. Mwongera C, Shikuku K, Twyman J, Winowiecki L, Ampaire E, Koningstein M, et al.
Rapid Rural Appraisal Report of Northern Uganda. 2014.
103. Friis-Hansen E. Impact assessment of farmer institutional development and agricultural
change: Soroti district, Uganda. Development in Practice. 2008;18(4-5):506-23.
104. Mwembaze MNS. Country pasture/forage resource profiles. Uganda: FAO (Report),
2003.
105. Kaizz. K. Description of cropping systems, climate and soils report in Uganda. 2010.
106. Soroti district local government. Higher local government statistical abstract. 2009.
107. Neuman WL. Social research methods: Quantitative and qualitative approaches: Allyn
and bacon Boston, MA; 2005.
108. Hosmer, Lemeshow. Lemeshow. 1989. Applied logistic regression. New York: John
Wiley & Sons; 1989. 8-20 p.
109. Gorfu M. Adoption and profitability of Kenyan top bar hive beekeeping technology: A
study in Ambasel woreda of Ethiopia. Unpublished: Alemaya University, Ethiopia; 2005.
110. Maddala G. Limited-dependent and qualitative variables in econometrics. 1983.
Cambridge University Press. 1983.
111. Gujarati DN. Basic econometrics. New York: Tata McGraw-Hill Education; 2009.
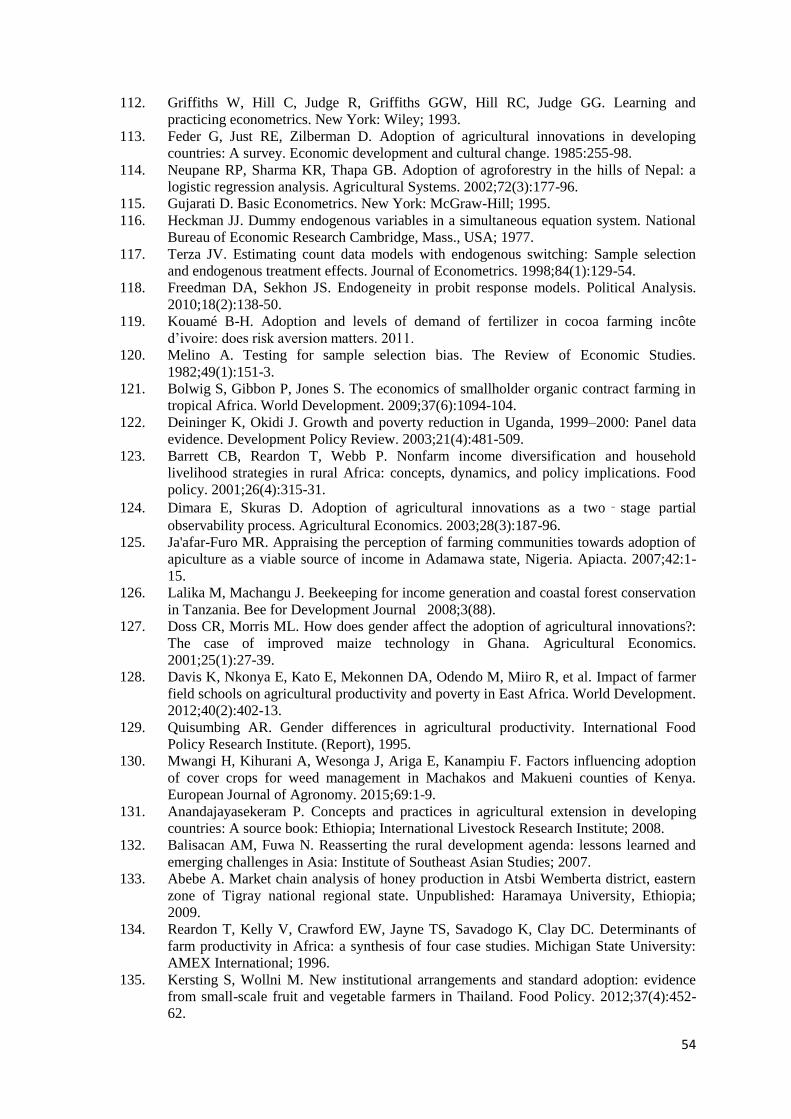
54
112. Griffiths W, Hill C, Judge R, Griffiths GGW, Hill RC, Judge GG. Learning and
practicing econometrics. New York: Wiley; 1993.
113. Feder G, Just RE, Zilberman D. Adoption of agricultural innovations in developing
countries: A survey. Economic development and cultural change. 1985:255-98.
114. Neupane RP, Sharma KR, Thapa GB. Adoption of agroforestry in the hills of Nepal: a
logistic regression analysis. Agricultural Systems. 2002;72(3):177-96.
115. Gujarati D. Basic Econometrics. New York: McGraw-Hill; 1995.
116. Heckman JJ. Dummy endogenous variables in a simultaneous equation system. National
Bureau of Economic Research Cambridge, Mass., USA; 1977.
117. Terza JV. Estimating count data models with endogenous switching: Sample selection
and endogenous treatment effects. Journal of Econometrics. 1998;84(1):129-54.
118. Freedman DA, Sekhon JS. Endogeneity in probit response models. Political Analysis.
2010;18(2):138-50.
119. Kouamé B-H. Adoption and levels of demand of fertilizer in cocoa farming incôte
d’ivoire: does risk aversion matters. 2011.
120. Melino A. Testing for sample selection bias. The Review of Economic Studies.
1982;49(1):151-3.
121. Bolwig S, Gibbon P, Jones S. The economics of smallholder organic contract farming in
tropical Africa. World Development. 2009;37(6):1094-104.
122. Deininger K, Okidi J. Growth and poverty reduction in Uganda, 1999–2000: Panel data
evidence. Development Policy Review. 2003;21(4):481-509.
123. Barrett CB, Reardon T, Webb P. Nonfarm income diversification and household
livelihood strategies in rural Africa: concepts, dynamics, and policy implications. Food
policy. 2001;26(4):315-31.
124. Dimara E, Skuras D. Adoption of agricultural innovations as a two‐stage partial
observability process. Agricultural Economics. 2003;28(3):187-96.
125. Ja'afar-Furo MR. Appraising the perception of farming communities towards adoption of
apiculture as a viable source of income in Adamawa state, Nigeria. Apiacta. 2007;42:1-
15.
126. Lalika M, Machangu J. Beekeeping for income generation and coastal forest conservation
in Tanzania. Bee for Development Journal 2008;3(88).
127. Doss CR, Morris ML. How does gender affect the adoption of agricultural innovations?:
The case of improved maize technology in Ghana. Agricultural Economics.
2001;25(1):27-39.
128. Davis K, Nkonya E, Kato E, Mekonnen DA, Odendo M, Miiro R, et al. Impact of farmer
field schools on agricultural productivity and poverty in East Africa. World Development.
2012;40(2):402-13.
129. Quisumbing AR. Gender differences in agricultural productivity. International Food
Policy Research Institute. (Report), 1995.
130. Mwangi H, Kihurani A, Wesonga J, Ariga E, Kanampiu F. Factors influencing adoption
of cover crops for weed management in Machakos and Makueni counties of Kenya.
European Journal of Agronomy. 2015;69:1-9.
131. Anandajayasekeram P. Concepts and practices in agricultural extension in developing
countries: A source book: Ethiopia; International Livestock Research Institute; 2008.
132. Balisacan AM, Fuwa N. Reasserting the rural development agenda: lessons learned and
emerging challenges in Asia: Institute of Southeast Asian Studies; 2007.
133. Abebe A. Market chain analysis of honey production in Atsbi Wemberta district, eastern
zone of Tigray national regional state. Unpublished: Haramaya University, Ethiopia;
2009.
134. Reardon T, Kelly V, Crawford EW, Jayne TS, Savadogo K, Clay DC. Determinants of
farm productivity in Africa: a synthesis of four case studies. Michigan State University:
AMEX International; 1996.
135. Kersting S, Wollni M. New institutional arrangements and standard adoption: evidence
from small-scale fruit and vegetable farmers in Thailand. Food Policy. 2012;37(4):452-
62.

55
136. Kretschmar JA, Baumann TW. Caffeine in Citrus flowers. Phytochemistry.
1999;52(1):19-23.
137. Michael OF. Costs and returns in modern beekeeping for honey production in Nigeria.
Pakistan Journal of Social Sciences. 2008;5(4):310-5.
138. Matanmi B, Adesiji G, Adegoke M. An analysis of activities of bee hunters and
beekeepers in Oyo State, Nigeria. African Journal of Livestock Extension. 2008;6:7-11.
139. Hussein MH. A review of beekeeping in Arab countries. Bee World. 2000;81(2):56-71.

A1
APPENDICES
Appendix 1: Household questionnaire
This presents the parts of the questionnaire that were used for the compilation of my thesis.
Household Questionnaire
The purpose of this questionnaire is to document the socio economic characteristics of beekeeping
and non-beekeeping households; perceptions, knowledge and attitudes of these households
towards beekeeping; examine the current livelihood options available; barriers to women
participation and their major sources of income.
Introduction:
Dear respondent this is to introduce Ms Amulen Deborah Ruth a graduate student of Makerere
University conducting research on barriers to beekeeping in your region. The information
obtained from this study will be handled with respect and confidentiality. It shall be used for
academic purposes; with your consent should I begin the interview?
Questionnaire
No. Locality GPS No:
A. Socio-Demographic Characteristics of the Respondents fill or tick in the adjacent boxes.
Code Attribute Tick Tick Tick Tick
A.1 Sex Female Male
A.2 Age
A.3
household
head Female Male
A.4
Marital
Status Single Married Divorced
A.5
Household
members
A.6
Land
ownership
Own
land Do not
Share
land
A.7
Land
acreage
A.8
Education
level
No
formal Primary Secondary Tertiary
A.9
Main
income
sources
On-
farm Off farm
A.10
Years in
beekeeping None <1year 2-3years 3-5years >5years
B. Livelihood options, land allocation and economic contribution
B.1 Does this household engage in crop farming?
Yes = No =
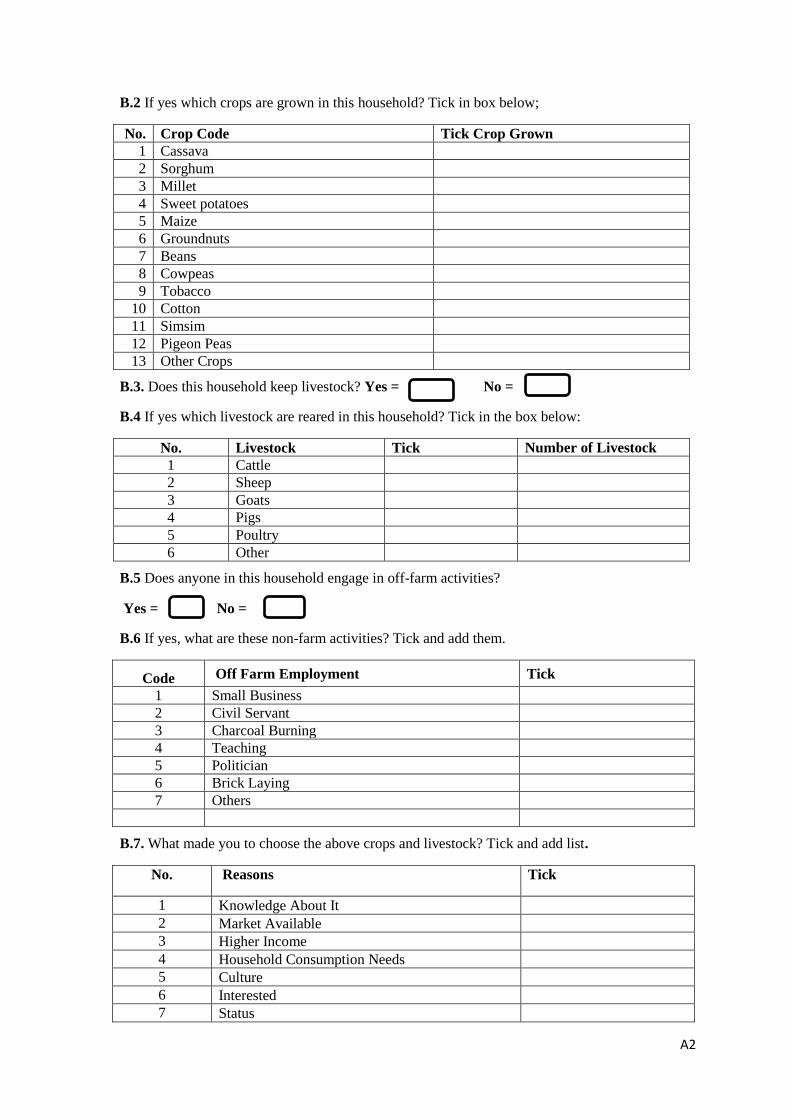
A2
B.2 If yes which crops are grown in this household? Tick in box below;
No. Crop Code Tick Crop Grown
1 Cassava
2 Sorghum
3 Millet
4 Sweet potatoes
5 Maize
6 Groundnuts
7 Beans
8 Cowpeas
9 Tobacco
10 Cotton
11 Simsim
12 Pigeon Peas
13 Other Crops
B.3. Does this household keep livestock? Yes = No =
B.4 If yes which livestock are reared in this household? Tick in the box below:
No. Livestock Tick Number of Livestock
1 Cattle
2 Sheep
3 Goats
4 Pigs
5 Poultry
6 Other
B.5 Does anyone in this household engage in off-farm activities?
Yes = No =
B.6 If yes, what are these non-farm activities? Tick and add them.
Code Off Farm Employment Tick
1 Small Business
2 Civil Servant
3 Charcoal Burning
4 Teaching
5 Politician
6 Brick Laying
7 Others
B.7. What made you to choose the above crops and livestock? Tick and add list.
No. Reasons Tick
1 Knowledge About It
2 Market Available
3 Higher Income
4 Household Consumption Needs
5 Culture
6 Interested
7 Status

A3
B.8 Comparing crops and livestock; what uses most of your land? Fill the acres
No. Enterprises Acres
1 Livestock
2 Crops
B.9 Where does money for this household come from? Fill table below;
No.
Sources of Income
Frequency of Income Amount
Monthly
Per
season
Annually
1 Crop sales
2 Livestock sales
3 Off farm employment
4
Other sources (non-farm
employment)
*fill in the frequency the farmer can remember
Reasons for not adopting Beekeeping: (Non-Beekeepers)
C.2 If you do not keep bees, what are your reasons? If you keep bees go to C.4
No. Attribute Tick
1 Limited Knowledge
2 No Interest
3 Fear Of Bees
4 No Capital
5 Limited Space For Beekeeping
6 No Market For Products
7 I Don’t Think It Can Make Money
8 Others
Total
Factors for Attraction to Beekeeping
C.3. For Non-Beekeepers: Under what conditions would you consider starting beekeeping?
No. Conditions for Beekeeping Tick
1 Training On Beekeeping
2 Market Availability
3 Land (Space)
4 Capital
5 Advisory Support
6 Not Interested At All
7 Income From Bees
8 Time Availability
9 No Need I Am Rich
10 Security
11 Others

A4
C.4 For Beekeepers: If you keep bees, what attracted you to beekeeping? Tick and add if not on
the list
No. Attribute Tick
1 My parents
2 Training
3 Personal interest
4 Income
5 NGO’s
6 Others name them
Assessing social Networks
C.7 Group Membership: For Beekeepers and Non Beekeepers are you a member of any of the
following groups
No. Group Tick
1 Farmers group
2 Marketing Group
3 Beekeepers association (for beekeepers)
4 Burial Group
5 Savings Group
Assessing the Current Knowledge Level of Beekeepers
C.8 Which aspects of beekeeping do you know? Please tick and add
No. Beekeeping Knowledge Tick
1 Local Hive Construction
2 Hive Sitting
3 Capturing Swarms
4 Pest And Disease Control
5 Honey Harvesting And Processing
6 Bee Forage Calendar
7 Other Product Processing
8 Proper Hive Inspection
9 Colony Multiplication Techniques
10 Feeding (Water)
Assessing Major Sources of the Current Knowledge and Skills
C.9 Where did you get this knowledge from? Please tick and add
No. Knowledge Source Tick
1 Fellow Beekeeper
2 From Relative
3 Extension Agent
4 Newspaper
5 Radios
6 Agricultural Shows
7 Trial and Error
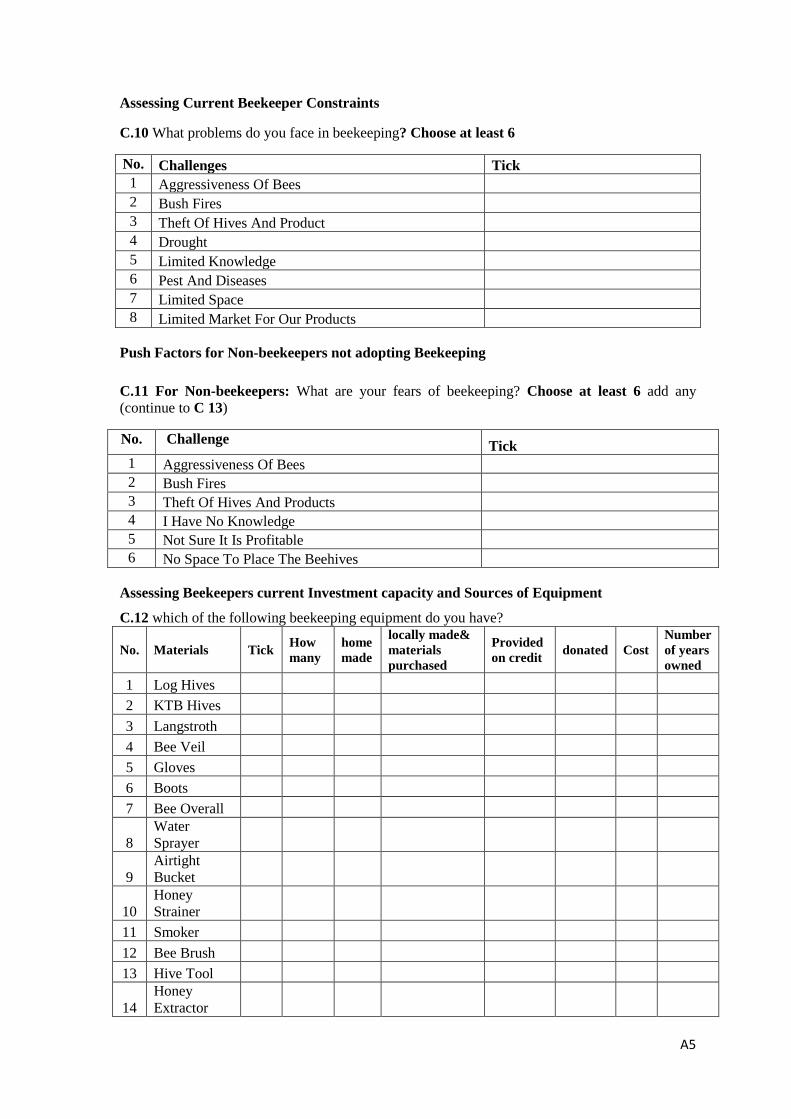
A5
Assessing Current Beekeeper Constraints
C.10 What problems do you face in beekeeping? Choose at least 6
No. Challenges Tick
1 Aggressiveness Of Bees
2 Bush Fires
3 Theft Of Hives And Product
4 Drought
5 Limited Knowledge
6 Pest And Diseases
7 Limited Space
8 Limited Market For Our Products
Push Factors for Non-beekeepers not adopting Beekeeping
C.11 For Non-beekeepers: What are your fears of beekeeping? Choose at least 6 add any
(continue to C 13)
No. Challenge Tick
1 Aggressiveness Of Bees
2 Bush Fires
3 Theft Of Hives And Products
4 I Have No Knowledge
5 Not Sure It Is Profitable
6 No Space To Place The Beehives
Assessing Beekeepers current Investment capacity and Sources of Equipment
C.12 which of the following beekeeping equipment do you have?
No. Materials Tick How
many
home
made
locally made&
materials
purchased
Provided
on credit donated Cost
Number
of years
owned
1 Log Hives
2 KTB Hives
3 Langstroth
4 Bee Veil
5 Gloves
6 Boots
7 Bee Overall
8
Water
Sprayer
9
Airtight
Bucket
10
Honey
Strainer
11 Smoker
12 Bee Brush
13 Hive Tool
14
Honey
Extractor

A6
E. Extension Service Barriers
E.1:1 Do you have Access to any form of beekeeping extension services (Tick)
Yes
No
E.2: Which form of beekeeping extension services do you access? Tick and add if missing
No. Extension services Tick
1 Training on Management
2 Training on Product Processing
3 Routine Visits By Extension Agent
4 Supply of Beehives
5 Market Information
Other
E.3: Who provides these beekeeping extension services to you? Tick
No. Source of extension service Tick
1 Government
2 NGOs
3 Private (community based)
4 Fellow Farmers
5 none
F. Bee Products Produced and Marketing
F.1 Which Products do you harvest; what is the annual yield; what do you do to them? And what
is the price per kg of each of the products?
No.
Products
Quantity/
year
Use
Home
consumption
Sale Price
/kg
1 Honey
2 Bees wax
3 Propolis
4 Pollen
5 Bees
F.4 Who buys your bee products? Tick
No. Buyer Tick
1 Middlemen
2 Processing companies
3 Beekeepers cooperatives
4 Fellow members in community
5 Others specify

A7
F.5 Which place do you sell your products from?
No. Places Tick
1 At Home
2 Nearby Market
3 Agricultural Shows
4 Village Ceremonies
5 Others Specify
F.6 What is the distance in kilometres from your home to the nearby market?
………………………………………………………………………………………………………
F.7 How do you transport your products to the market?
No. Means of Transport tick
1 Bicycle
2 Vehicle
3 Foot
4 Animal Traction
5 Others Specify
F.8 What constraints do you face in marketing your bee products? List them
No. Constraints
1 Market is Far
2 Poor Roads
3 Poor Weather
4 Low Demand
5 Product Damages

A8
Appendix 2: Observation distributions based on to remove outliers from the
data
Figure A2.1: Mean distribution of number of beehives owned with outliers
Figure A2.2: Distribution of the number of beehives owned after removing the two outliers

A9
Figure A2.3: Distribution of quantity of honey produced with the outlier
Figure A2.4: Distribution of quantity of honey harvested with one observation removed

A10
Appendix 3: Models run with outliers included in the data
Table A3.1: Estimation results of logistic regression and probit model with adoption (0, 1) as the dependent variable
(Marginal effects are reported (n=304)
Variable (s) Model1 Model 2 Model 3 Model 4 Probit model
Age (years) 0.000
(0.002)
0.001
(0.001)
0.001
(0.001)
Gender (1: man) 0.171
(0.491)***
0.135
(0.034)***
0.135
(0.034)***
Primary education (1:yes) -0.189
(0.473)***
-0.078
(0.029)***
-0.080
(0.030)***
Secondary and tertiary education (1:yes) -0.613
(0.045)***
-0.204
(0.046)***
-0.204
(0.044)***
Household members (number) 0.000
(0.005)
0.000
(0.002)
0.000
(0.002)
Land acres owned -0.001
(0.003)
-0.000
(0.002)
-0.000
(0.002)
Total annual household income (USD) 0.000
(0.000)
0.000
(0.000)
0.000
(0.000)
Member of any farmer group (1:yes) 0.198
(0.048)***
0.060
(0.035)*
0.063
(0.036)*
Distance to market (km) 0.080
(0.006)***
0.025
(0.004)***
0.025
(0.004)***
Access to extension services (1:yes) 0.221
(0.053)***
0.152
(0.046)***
0.162
(0.047)***
Government (1:yes) -0.165
(0.040)***
-0.086
(0.032)***
-0.086
(0.033)***
NGOs (1:yes) 0.495
(0.066)***
0.236
(0.046)***
0.225
(0.038)***
Eastern -0.037
(0.038)
-0.029(0.039)
Mid-northern -0.008
(0.040)
-0.002(0.041)
Constant
Pseudo R2 (prob>chi2)= 0.000
0.311
(0.553)
0.000
(0.674)
0.009
(0.258)
0.001
(1.518)
0.725
0.001
(0.873)
0.725 *** =significant at 1%,* =significant at 10 %, standard errors (), No. of observations = 304, for model 4 and probit model: LR chi2 (14) = 301.93

A11
Table A3.2: Results for the determinants of honey production among adopters with the outliers
still in the dataset (n = 304)
Variable(s) OLS Heckman selection model
(Second step)
Coefficients Marginal effects
Number of years in beekeeping
(years)
6.84 (1.66)*** 7.86 (1.65)***
Citrus(1:yes) -10.00 (3.73)*** -10.05 (3.75)***
Total non-farm income received
(USD)
9.69e-006 (0.00)*** 8.41e-006 (0.00)***
Log hives bought (1:yes) 21.50 (4.35)*** 22.09 (4.16)***
Bee Suit bought (1:yes) 11.40 (5.92)* 10.84 (5.63)*
Hive inspection (1:yes) 3.52 (3.75) 4.01 (5.11)
Pests and disease control (1:yes) 6.93 (4.46) 7.55 (4.28)*
Access to extension services -3.38 (10.49) -3.35 (10.26)
Access to Market Information
(1= yes)
4.61 (3.80) 4.09 (3.63)*
Fellow community members
buyers(1:yes)
-3.78 (3.85) -4.39 (3.69)
(Constant) 0.29 (12.22)
Mills ratio (lambda)
R2
Pseudo R2(prob>chi2) =0.000
0.35
0.015 (4.77)**
0.725 *** refers to significant at 1 % level, **=significant at 5% level,*= significant at 10 % level and Standard errors are
between brackets (). Number of observations = 304, for Heckman model, wald chi2 (10) = 97.26
The results for the predictors of honey production give relatively different results with outliers included in
the dataset because one of the outliers was removed based on the dependent variable for this model.
Therefore the dataset with the outliers is not a typical representative of the population examined.