Beef Cattle Situation and Outlook. 1.39 million tons.
32
Beef Cattle Situation and Outlook
-
Upload
zoe-mcbride -
Category
Documents
-
view
221 -
download
0
Transcript of Beef Cattle Situation and Outlook. 1.39 million tons.

Beef Cattle Situation and Outlook


1.39 million tons

Major Items to Watch this Year Price of corn Total meat production Economy Crude oil prices U.S. currency value

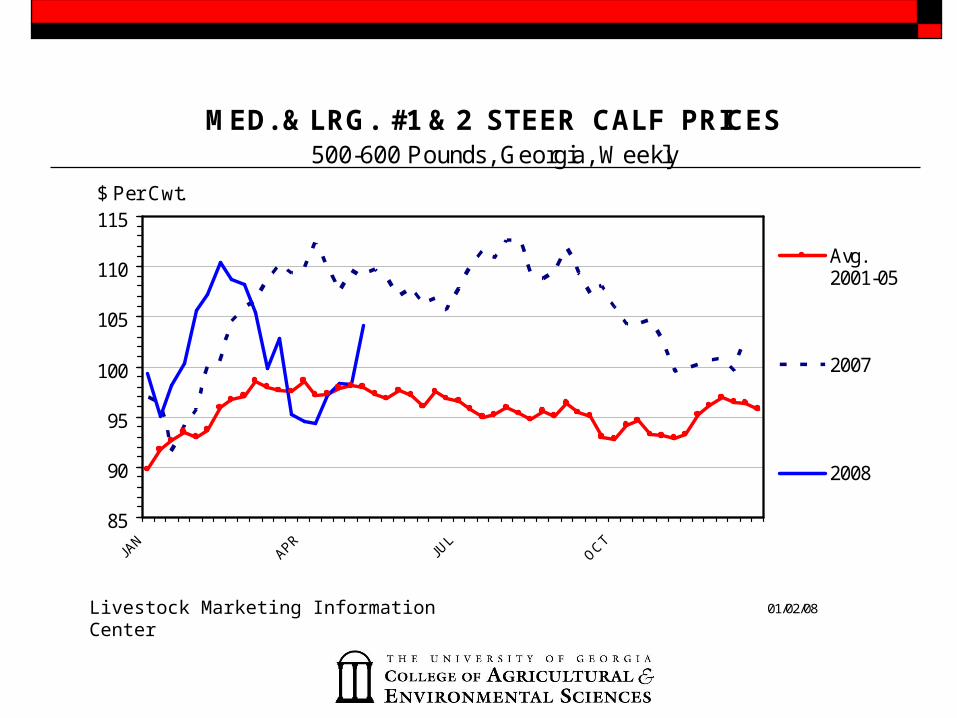
MED. & LRG. #1 & 2 STEER CALF PRICES500-600 Pounds, Georgia, Weekly
85
90
95
100
105
110
115$ Per Cwt.
Avg.2001-05
2007
2008
Livestock Marketing Information Center 01/02/08

MED. & LRG. #1 & 2 FEEDER STEER PRICES700-800 Pounds, Georgia, Weekly
75
80
85
90
95
100
105$ Per Cwt.
Avg.2001-05
2007
2008
Livestock Marketing Information Center 01/02/08

SLAUGHTER STEER PRICES5 Market Weighted Average, Weekly
75
80
85
90
95
100
105
JAN APR JUL OCT
$ Per Cwt.
Avg.2002-06
2007
2008
Livestock Marketing Information Center

2008 Outlook

Recent and Projected Beef Supply
23.5
24
24.5
25
25.5
26
26.5
2004 2005 2006 2007 2008
ActualProjected

Total Meat Supplies
0
20
40
60
80
100
2004 2005 2006 2007 2008
Beef Pork Lamb/ Mutton Broilers Turkeys
87.193.2491.0689.585.4

What is the Market Offering Today-Futures Based Price Projections
$80.00
$85.00
$90.00
$95.00
$100.00
$105.00
$110.00
$115.00
Feb Apr
J un Aug O
ctDec Feb A
pr
$/C
wt.
500# calf 650# Feeder 750# Feeder Live Cattle

What is the Market Offering Today-Futures Based Price Projections
$400.00
$450.00
$500.00
$550.00
$600.00
$650.00
$700.00
$750.00
Feb Mar Apr May J un J ul Aug Sep Oct Nov
$/h
ea
d
500# calf 650# Feeder 750# Feeder

What You Can Sell for Today-Futures Based Price Projections
$800.00
$900.00
$1,000.00
$1,100.00
$1,200.00
$1,300.00
$1,400.00
$/h
ea
d
L ive Cattle

Inputs

Fertilizer Prices 1997-2007
$100
$200
$300
$400
$500
$600
$700
$800
$900
$1,000
$1,100
1997
1998
1999
2000
2001
2002
2003
2004
2005
2006
2007
Apr-0
8
May
-08
$/
ton
Nitrogen (AN) Phosphorous (DAP) Potash (Muriate)
Nitrogen prices have increased 91% since 2002

Fuel Prices 1997-2007
$0.00$0.50$1.00$1.50$2.00$2.50$3.00$3.50$4.00$4.50
$/
Gallo
n
Diesel (bulk)
Diesel prices are up 300% since 2002
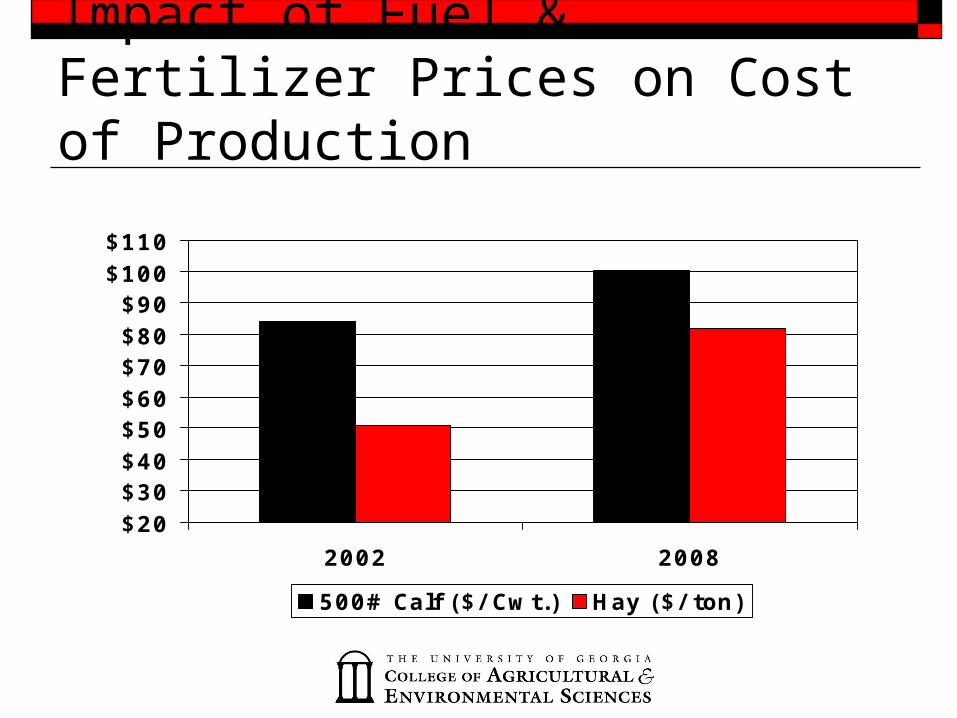
Impact of Fuel & Fertilizer Prices on Cost of Production
$20$30$40$50$60$70$80$90
$100$110
2002 2008
500# Calf ($/ Cwt.) Hay ($/ ton)

Projected Profits for 2008Item South
GeorgiaNorth
Georgia
Expected Returns Over Variable Costs ($/cow)
($3.13) ($30.58)
Chance for positive returns 48% 30%
Returns to Land, Labor, Capital and Management ($/cow)
$56.87 ($2.80)
Breakeven Price ($/cwt.) $100.32 $101.73

BEEF COWS THAT HAVE CALVEDJANUARY 1, 2008(1000 Head)
1,020 to 5,240 (9)520 to 1,020 (11)290 to 520 (9)
80 to 290 (11)0 to 80 (10)
C-N-1502/01/08
677Alaska
Hawaii
US Total
5.9
165 943
655730
CT 6
DE 4
936
553
82.7
460
427234
1015
1511 1159
513
12
MD 44
MA 9106
397
519
2080
1523
1883218
NJ 9
460
104
372
922
292
2053
605
158RI 1.4
197
1644
1079
5240
365
VT 10
692
272
202
270
733
32553
Livestock Marketing Information Center
Data Source: USDA/NASS
NH 5

CHANGE IN BEEF COW NUMBERSJANUARY 1, 2007 TO JANUARY 1, 2008(1000 Head)
2 to 141 (13)1 to 2 (3)
-6 to 1 (13)-25 to -6 (11)-74 to -25 (10)
Alaska
Hawaii
US Total
C-N-2802/01/08
-40-1
-10 22
-455
CT -1
DE 0
-14
-32
-3
-13
0 0-55
11 -48
23
1
MD -6
MA 2
-2
-8
1
-66
141
-57-15
1
NJ 1
20
-8
-20
-17
-4
30
8RI -0
-6
-25
-74
-63
21
0
-18
7
-10
5
-30
-339
Livestock Marketing Information Center
Data Source: USDA/NASS
53

JANUARY 1 COW INVENTORYU.S., Annual
5
10
15
20
25
30
35
40
45
1978 1981 1984 1987 1990 1993 1996 1999 2002 2005 2008
Mil. Head
Beef
Dairy
C-N-0202/07/08
-1 Percent
2008 = 32.6 Million Head
+1 Percent2008 = 9.2 Million Head
Livestock Marketing Information Center
Data Source: USDA/NASS

Beef Cow FactoryJanuary 1, U.S.
3
13
23
33
43
53
63
1976 1979 1982 1985 1988 1991 1994 1997 2000 2003 2006
Mil. Head
Heifers Cows
C-N-3801/28/05
Livestock Marketing Information Center
Data Source: USDA/NASS
-1.0%

DEMAND FOR FEEDERSRelationship Between GA Steer Prices and Omaha, NE
Corn Prices
$-
$20.00
$40.00
$60.00
$80.00
$100.00
$120.00
$140.00
Fedd
er P
rice
$/C
wt.
$-
$1.00
$2.00
$3.00
$4.00
$5.00
$6.00
Cor
n Pr
ice
$/B
u.
500-600# GA Steer Price 700-800# GA Steer Price Omaha Corn Price

Price Differences between classes
65
75
85
95
105
115
125
1/8/
2005
4/8/
2005
7/8/
2005
10/8
/200
5
1/8/
2006
4/8/
2006
7/8/
2006
10/8
/200
6
1/8/
2007
4/8/
2007
7/8/
2007
10/8
/200
7
1/8/
2008
4/8/
2008
500-600 600-700 700-800 800-900

Energy Bill 36 billion gallons of ethanol used by blenders by
2022. 15 billion gallons required to come from corn by
2015. 15 billion gallons ethanol ≈5.4 billion bushels of
corn. 2007 U.S. corn crop = 13.05 billion bushels. At 2007 yield of 151 bushels, need 35.76 million
acres just for ethanol.

Longer Term Trends Continued pressure from input prices. Continued consolidation in the beef industry. Continuing favorable beef demand. Expanding growth in grass-fed and natural
beef segments. Animal traceability/mandatory animal ID.

Summary & Implications Supply
The herd has expanded some but the drought has halted growth for this year. Feeder cattle supplies are tight, … and will be for a while.
Demand Demand for beef remains good but,…economy is a big question!! Higher corn prices will reduce demand for feeders Exports will help.
Profits Most cow-calf producers will be hard pressed to cover out of pocket expenses for
next 2-4 years. Higher feed, fuel and fertilizer costs will continue to squeeze profits. We are probably going to have to change our way of doing business. High-quality, source-verified, preconditioned cattle will always top the market.