Becoming the chosen partner smartphones gives you the latest investor and financial media...
156
Becoming the chosen partner QineQ Group plc Annual Report and Accounts 2016
Transcript of Becoming the chosen partner smartphones gives you the latest investor and financial media...
Becoming the chosen partnerQinetiQ Group plc Annual Report and Accounts 2016

QinetiQ is a leading science and engineering company operating primarily in the defence, security and aerospace markets. We work in partnership with our customers to solve real world problems through innovative solutions, delivering operational and competitive advantage.
VISIONAND
STRATEGY
page 10
WAY OF WORKING
page 12
TRANSFORMATION PROGRAMME
page 14
The world around us is changing. We are responding decisively by establishing a vision and strategy for QinetiQ to ensure we continue to meet customer needs. Our vision is: “to be the chosen partner around the world for mission-critical solutions, innovating for our customers’ advantage.”
We have reorganised the Group, introducing a new way of working which aligns the organisation with our strategy, and launched a transformation programme to deliver the changes we need to make as a company.
The model below sets out our plan to adapt and deliver in a changing world. Further detail can be found on the following pages. Steve Wadey Chief Executive Officer
CREATING THE CONDITIONS FOR
GROWTH
Page 06
MARKET OVERVIEW
Page 08

STRATEGIC REPORTOverviewKey highlights 02Our business model 03Chairman’s statement 04Chief Executive Officer’s statement 06Market overview 08Our vision and strategy 10Our way of working 12Our transformation programme 14Strategy in action 16Key performance indicators 22Corporate responsibility 26
PerformanceOperating review 34– EMEA Services 34– Global Products 35Chief Financial Officer’s review 38Principal risks and uncertainties 42
GOVERNANCECorporate governance statement 50– Leadership 54– Board of Directors 58– Effectiveness 60– Accountability 64– Relations with shareholders 78 Directors’ remuneration report 80Directors’ report 96Independent auditor’s report 100
FINANCIAL STATEMENTSConsolidated income statement 103Consolidated comprehensive income statement 104Consolidated statement of changes in equity 104Consolidated balance sheet 105Consolidated cash flow statement 106Reconciliation of movement in net cash 106Notes to the financial statements 107Company balance sheet 145Company statement of changes in equity 146Notes to the company financial statements 146Five-year record 148
ADDITIONAL INFORMATIONGlossary 149Shareholder information 150Additional information 152
You can view this Annual Report and Accounts, and all other results materials at www.QinetiQ.com. In addition, the QinetiQ investor relations app for tablets and smartphones gives you the latest investor and financial media information. The app allows you to get the latest share price information and corporate news, as well as view our financial reports.
Through their technical expertise, domain know-how and innovative thinking, our engineers and scientists are uniquely placed to help customers meet challenges that define the modern world.
We inspire confidence by working in partnership with our customers to ensure that they meet their goals, first time, every time.
Markets: defence, security and aerospace, with a growing position in select adjacent markets.
Customers: predominantly government organisations, including defence departments, as well as international customers in other targeted sectors.
Home markets: UK, US and Australia, with projects delivered in more than 10 other countries.
Divisions: EMEA Services and Global Products.
People:
6,207 worldwide
ar2016.QinetiQ.com
QinetiQ app for tablets and smartphones
QinetiQ Group plc Annual Report and Accounts 2016 01

782.6 763.8 755.7
2014 2015 2016
13.815.2
16.3
2014 2015 2016
4.65.4 5.7
2014 2015 2016
113.7 111.3 108.9
2014 2015 2016
170.5195.5
274.5
2014 2015 2016
(12.7)
104.7 106.1
2014 2015 2016
A solid operational performance in challenging markets
Key highlights
Financial highlights
Year end references (2016, 2015, 2014) relate to the years ending 31 March.
* Definitions of specific adjusting items and underlying measures of performance can be found in the glossary on page 149.
Operational highlightsRevenue
£755.7m2015: £763.8m
Underlying EPS*
16.3p2015: 15.2p
Dividend per share
5.7p2015: 5.4p
Underlying operating profit*
£108.9m2015: £111.3m
Net cash
£274.5m2015: £195.5m
Profit/(loss) after tax
£106.1m2015: £104.7m
Awarded five-year renewal which represents a new way of doing business with the Ministry of Defence (MOD) where QinetiQ is measured and paid on results and outputs, not inputs.
Contract value
£153m
Coordinated three weeks of allied at-sea operations and live weapons firing, at Europe’s largest range: the QinetiQ-operated Hebrides range.
Multiple world firsts
The first ever UK launch, and subsequent engagement of a ballistic missile in space
Aircraft engineering services contract delivers more for less
Won a multi-year production contract to update, procure, assemble and test launch and arresting control hardware and software for the CVN-79 John F. Kennedy.
Contract value
$16m
Supporting delivery of launch systems and arresting gear on the US Navy’s next-generation aircraft carrier
QinetiQ Group plc Annual Report and Accounts 201602

OUR CORE Science & Engineering Capability
GenerationAfter Next
NextGeneration
Current GenerationLIFECYCLE
Experimentation & Research
Test& Evaluation
Training& Rehearsal
OUR ROLE Advice
Services
Products
UnderstandingFuture Needs
DELIVERING CUSTOMER ADVANTAGE
Our business model
QinetiQ is a company of scientists and engineers essential to sovereign capability. The technical expertise and domain know-how of our people are our principal sources of competitive advantage and are well matched to the emerging themes in our markets. By leveraging our distinctive facilities and integrating our core capabilities, we play a critical role in helping customers meet current and future challenges.
QinetiQ’s customer relationships and know-how about customer domains have been developed over many years of working in partnership. We also work collaboratively with prime contractors and a broad-based supply chain that includes small and medium-sized companies, as well as academic institutions.
Our principal revenue streams are advice, services (particularly test and evaluation) and technology-based products.
We work across the equipment lifecycle from initial concept through to final disposal. At the start of the lifecycle, our focus is on research and experimentation. We then test and evaluate next generation equipment to help customers to control risks and determine the best options. Once a new capability has been adopted, we train users and facilitate the rehearsal of how equipment will be used most effectively in an operational environment.
By providing mission-critical solutions, we deliver operational and competitive advantage to our customers, ensuring they meet their goals faster, more cost effectively and with greater confidence.
Our business model is robust and sustainable because our knowledge base is constantly refreshed as we learn from experience, understand emerging customer needs and invest in our future. This enables us to both sustain existing capabilities and create new ones to ensure we respond to customer needs and stay ahead of the competition.
As a business whose reputation and achievements are centred on our people, QinetiQ has relatively low capital and resource requirements. Our future success is primarily dependent on our ability to recruit, develop, engage and retain exceptional employees, including subject matter experts and specialists of international standing.
How we create customer value
QinetiQ Group plc Annual Report and Accounts 2016 03
Strategic report Governance Financial statements Additional information

Chairman’s statement
The next chapter for QinetiQ
Results In a year that marked the tenth anniversary of QinetiQ’s listing on the London Stock Exchange, it was appropriate that we embarked on the next chapter as a publicly-listed company. During the year, we appointed Steve Wadey as our new Chief Executive Officer (CEO), set out a vision and strategy for QinetiQ and delivered a solid operating performance in challenging markets.
In the year to 31 March 2016, orders grew 8% to £659.8m (2015: £613.6m), Group revenue was £755.7m (2015: £763.8m), and underlying operating profit* was £108.9m (2015: £111.3m). Full year underlying earnings per share* were 16.3p (2015: 15.2p). Total Group profit after tax was £106.1m (2015: £104.7m). Underlying operating cash conversion remained strong at 96% (2015: 103%) with net cash increasing to £274.5m (2015: £195.5m).
FY17 outlookThe UK Government’s Strategic Defence and Security Review has brought clarity to key defence programmes but will require further savings to be delivered from ongoing defence transformation. This will provide future opportunities for EMEA Services to build on its strong record of delivering more for less, whilst recognising that in the short term there will continue to be uncertainty and the potential for interruptions to order flow. Although revenue under contract for FY17 is slightly below that of a year ago, the division’s performance as a whole is expected to remain steady this year.
The Group’s Global Products division has shorter order cycles than EMEA Services. At the beginning of the financial year, FY17 revenue under contract was slightly above that of a year ago, but the performance of Global Products remains dependent on the timing and shipment of key orders.
Overall, the Board’s expectations for Group performance this financial year remain unchanged.
Key highlights
FY16* Performance• Solid operating performance
in challenging markets
Board appointments• Steve Wadey appointed as CEO• Lynn Brubaker appointed as
Non-executive Director
Defining QinetiQ’s future direction• Set out a vision and strategy• Capital allocation policy published
Shareholder returns• 6% increase in full year dividend• £150m capital return completed• £50m buyback announced in November
2015, £47m remains to be completed
* FY = Financial year to 31 March.
Employees and leadership On 27 April 2015, the Board was delighted to appoint Steve Wadey as CEO. We were looking for an outstanding leader with a track record of driving growth, a deep understanding of the defence sector and the technological know-how to lead our people; Steve met all these criteria.
Steve was attracted to the role by the expertise of our employees who are held in high regard across industry. In an environment where we are witnessing increasing security threats, many of which can only be met through innovative thinking, there is strong demand for this expertise; we would like to thank employees across QinetiQ for their hard work and dedication this year.
Steve’s first move as CEO was to establish a Leadership Community QinetiQ, bringing together the top 100 leaders every month for the first time. I have seen first-hand how this community is contributing to the future direction of the company and would like to put on record my appreciation for this step-change in leadership.
QinetiQ Group plc Annual Report and Accounts 201604

Not only are our leaders accountable for driving business performance, they also ensure that we are behaving responsibly to the benefit of all our stakeholders – so that we operate safely, uphold strong governance, support environmental stewardship of the sites which we operate, and invest in our local communities.
CustomersOver the last year, this new leadership team has injected great energy and fresh thinking to accelerate our transformation to a more customer-focused company. Achieving our ambition of becoming the chosen partner will require a relentless focus on continuing to meet our customers’ needs in both defence and commercial markets. There is much more to do, but QinetiQ’s customer satisfaction scores remain strong, so we have a good foundation to build on.
ShareholdersAlong with customers and employees, shareholders are key stakeholders in QinetiQ as the owners of the company. We would like to thank our investors for their continued support this year and for their constructive dialogue, particularly during the CEO transition.
We are clear that continued capital discipline underpins growing, sustainable returns and that unlocking QinetiQ’s unrealised potential requires focused investment in growth. In recognition of this, our priorities for capital allocation are: organic investment complemented by bolt-on acquisitions where there is a strong strategic fit, the maintenance of balance sheet strength, a progressive dividend, and the return of excess cash to shareholders.
The Board proposes a final dividend of 3.8p per share for the year ended 31 March 2016 (2015: 3.6p), making the full year dividend 5.7p (2015: 5.4p). Subject to approval at the Annual General Meeting, the final dividend will be paid on 2 September 2016 to shareholders on the register at 5 August 2016. The full year dividend represents an increase of 6%, reflecting our commitment to a progressive dividend.
Audit Committee
Paul Murray, Committee ChairmanLynn BrubakerAdmiral Sir James Burnell-NugentMichael HarperIan MasonSusan Searle
Nominations Committee
Mark Elliott, Committee ChairmanLynn BrubakerAdmiral Sir James Burnell-NugentMichael Harper Ian Mason Paul Murray Susan Searle Steve Wadey
Remuneration Committee
Michael Harper, Committee ChairmanLynn BrubakerAdmiral Sir James Burnell-NugentMark Elliott Ian Mason Paul Murray Susan Searle
Risk & CSR Committee
Admiral Sir James Burnell-Nugent, Committee ChairmanLynn BrubakerMark Elliott Michael Harper Ian Mason David Mellors Paul Murray Susan Searle Steve Wadey
Security Committee
Admiral Sir James Burnell-Nugent, Committee ChairmanMichael Harper Ian Mason David Mellors Paul Murray Susan Searle Steve Wadey
A £150m share buyback, which commenced on 28 May 2014, following the disposal of US Services, was completed by 30 September 2015 with 72.5m shares purchased in total. In November 2015, we were pleased to be able to announce a further £50m share repurchase, of which £47m remains to be completed.
StrategyStrategic growth, balanced with capital discipline, is the top priority we have set as a Board this year and the mandate we gave to Steve on his appointment. The Board has been actively engaged in the development of a revised strategy for QinetiQ and fully endorses the future direction. We are encouraged by the progress that has been made this year and will continue to support the leadership team with the successful delivery and implementation of strategic priorities.
The BoardThe other priorities we have set as a Board are succession planning and ensuring the effective stewardship of QinetiQ through appropriate governance processes and systems of control. The Board recognises that good governance is fundamental to the successful delivery of our strategy as it ensures the continued support of customers, employees and other key stakeholders. This year has seen an external evaluation of the effectiveness of the Board and details can be found on page 61.
In January 2016 we announced the appointment of Lynn Brubaker as a Non-executive Director. Lynn has spent her career in the aerospace industry, culminating in her appointment as Vice President and General Manager of Commercial Aerospace at Honeywell International. Her international experience is particularly relevant to QinetiQ and we were pleased to welcome her to the Board.
I would like to thank Board members for the support they have given me this year.
Mark Elliott Non-executive Chairman 26 May 2016
* Definitions of underlying measures of performance can be found in the glossary on page 149.
Current Board Committee members
Page 58
QinetiQ Group plc Annual Report and Accounts 2016 05
Strategic report Governance Financial statements Additional information

Creating the conditions for growth
Chief Executive Officer’s statement
Responding decisively to a changing market environmentThe world around us is changing. Day by day we witness increasing global security threats both at home and abroad. We also see government budgets continuing to be under pressure. Customers are looking to achieve more with less and demanding better value for money. This requires greater efficiency, innovation and collaboration both domestically and with international partners. We recognise that staying the same will not be good enough in a changing world.
As a company we have a solid foundation to build on, because our core competences are well matched to emerging themes in our markets. We have considerable breadth and depth of knowledge and capability that we can deliver for our customers, particularly in test and evaluation, and science and technology. Not only are our people critical to sovereign capability, we are also experienced in delivering more for less and responding to new challenges through innovation in services, products and business models. Last year our customer satisfaction scores remained strong at more than eight out of ten. Customers have requirements we can meet if we remain sufficiently agile and responsive to connect their requirements with the strength and depth of our core technical and engineering competences.
As a leading science and engineering company operating primarily in the defence, security and aerospace markets, QinetiQ analyses and anticipates how global security threats are evolving. QinetiQ will innovate and invest carefully to grow its market share and sources of revenue.
Our vision and strategyWe have established an ambitious vision that defines where we want to be in five to ten years’ time, building on our strengths.
Our vision is: “to be the chosen partner around the world for mission-critical solutions, innovating for our customers’ advantage”.
To realise our vision, we are implementing strategic priorities designed to grow the company by focusing on our primary UK customer, on international customers and on innovation.
Transforming our way of workingWe are embedding a new way of working to align the organisation with our strategy and ensure we are agile and responsive in meeting customer needs. We have also launched a transformation programme to deliver the key changes that we need to put in place as a company to achieve growth, in particular the dynamic resourcing of people and assets from across QinetiQ to deliver better value for money and a more efficient service for our customers.
Improving customer focus and competitiveness are our immediate priorities. The savings we deliver through improved efficiencies and greater agility will ensure we remain one step ahead of the competition and also create the headroom so that we can invest in our future. This will allow us to invest carefully in research and development, improve skills and processes, take and manage risk more effectively on our customers’ behalf, and pursue campaigns to grow the company.
Delivering benefits to our key stakeholdersAlthough market headwinds are strong, by working together and encouraging our people’s entrepreneurial spirit, we are creating a customer-focused, collaborative and competitive environment in order to deliver growth. Our customers will benefit through better products and services, increased responsiveness and improved value for money. Our employees will benefit through greater opportunities to work in integrated teams, utilising their expertise across multiple domains throughout QinetiQ. Over the medium term we expect our shareholders to benefit through growth in quality earnings as we realise our vision and deliver our full potential.
Steve Wadey Chief Executive Officer 26 May 2016
QinetiQ Group plc Annual Report and Accounts 201606

Further detail around each specific area can be found on the relevant pages.
VISIONAND
STRATEGY
page 10
Our vision defines where we want to be
as a company. To realise our vision we are implementing strategic priorities designed
to create the conditionsfor growth.
page 12
Our new way of working ensures we are responsive in meeting customer needs. In particular, dynamic resourcing
of people and resources from across QinetiQ delivers better value for money and a more efficient service
for our customers.
BUSINESS WINNING
TRANSFORMATION PROGRAMME
INVESTING IN OUR FUTURE
We are improving our business winning skills to evolve in an
increasingly competitive market.
OPERATIONAL EXCELLENCE
Our future success will be built on operational excellence and
underpinned by continued operational and financial discipline.
The savings we deliver through improved efficiencies and greater agility will create
the capacity we need to invest in key campaigns to grow the company.
page 14
WAY OF WORKING
Common themes across our markets • Increasing security threats• Government budgets under pressure• Drive for greater efficiency
• International partnerships• Need for innovation
The world around us is changing. We are responding decisively by establishing a vision and strategy for QinetiQ to ensure we continue to meet customer needs. We have reorganised the Group, introducing a way of working which aligns the organisation with our strategy, and launched a transformation programme to deliver the changes we need to make as a company. The model below sets out our plan to adapt and deliver in a changing world.
Delivering benefits to our customers and other key stakeholders
Page 08 – Market overview
Shareholders• Growth in quality earnings
Employees • Work in integrated teams• Utilise experience across QinetiQ
Customers• Better products and services• Increased responsiveness• Improved value for money
QinetiQ Group plc Annual Report and Accounts 2016 07
Strategic report Governance Financial statements Additional information

34.3 35.1 36.1 37.0 38.1 39.6
FY16 FY17 FY19 FY20 FY21FY18
Source: UK Government Comprehensive Spending Review 2015.
UK Ministry of Defence budget (£bn)
QinetiQ has a track record of delivering more for less and meeting new challenges through innovation. We are well positioned to help customers meet the dual challenges of budget pressures and increasing global security threats.
Market overview
Increasing security threats; budget pressures
UKAlignment with UK defence customersIn the financial year to 31 March 2016, 67% (2015: 67%) of QinetiQ Group revenue was generated from the UK Ministry of Defence (MOD) in addition to 3% (2015: 3%) from other UK Government Departments. We are the UK’s leading provider of test and evaluation (T&E) services across all military domains and the majority of equipment programmes. We generate more than £300m per year from T&E, underpinned by the Long Term Partnering Agreement (LTPA), which has delivered an improved service and significant savings for the MOD over the last 13 years. We estimate the UK T&E market is double this size and the addressable market worldwide is much greater. Leading the UK T&E enterprise by working in partnership with Government and prime contractors is one of the key pillars of QinetiQ’s strategy. In addition, we remain a market leader in research and advice in specialist areas such as C4ISR*, weapons and energetics, cyber security and procurement advisory services.
Within the MOD, the main customers for our services are the MOD’s procurement function DE&S (Defence Equipment and Support), the Defence Science and Technology Laboratory (Dstl) and the Front Line Commands (Navy, Army, Air and Joint Forces), whose influence on future capabilities has increased in recent years. Our businesses are aligned closely to these Commands and are well placed to help them with their growing procurement responsibilities. In particular, Joint Forces Command, with its own procurement arm and multi-billion pound budget, provides a focused channel for our Cyber, Information & Training business.
The UK Government’s Strategic Defence and Security Review (SDSR) was published on 23 November 2015. Its publication has helped to clarify the UK’s capability priorities, but it will take time before its impact on the associated allocation of the UK defence budget is clear.
Delivering ‘more for less’As part of the SDSR, the MOD has declared plans to address important capability gaps such as maritime surveillance (through the purchase of nine new aircraft) and combat air numbers (by extending the life of Typhoon aircraft that have been in service for some time). These plans will require immediate savings to be made elsewhere in the defence enterprise to fund them, with the UK Government looking to achieve a 30% reduction in MOD civilian staff and in ‘built’ estate to deliver £11bn of savings from defence and security budgets over the next four years.
The introduction of new capabilities, and in particular extending the life of existing capabilities, provides QinetiQ with opportunities to deliver engineering, test and evaluation services. The savings programmes could also provide further opportunities for outsourcing, along with increased MOD presence on our sites. There is likely to be increasing competition, but QinetiQ is well positioned due to its strong record in delivering improved services combined with significant savings (ie more for less) for customers.
MOD spending on science and technology will continue to be protected at 1.2% of the defence budget with an increased emphasis on disruptive technologies and innovation, and a move away from some more traditional research programmes. Space, cyber security and cryptography are among the priorities, areas in which QinetiQ has recognised expertise.
The Single Source Regulations Office (SSRO) is now fully established as the independent regulator for single source defence contracts, driving greater transparency that will help demonstrate the value for money the Government derives from Qualifying Defence Contracts (QDCs). The SSRO has confirmed the baseline profit rate for new single source defence contracts is 8.95% for FY17 (10.6% in FY16) and that over the course of FY17 it will consult again and develop the methodology for calculating the baseline profit rate in future years, potentially introducing multiple profit rates. This baseline
rate acts as the starting point for agreeing the profit rates of new and renewed contracts, and suppliers can both under and over-perform the contracted rate depending on, for example, risk, capital servicing and project execution. Further updates and clarifications are expected to be published by the SSRO on other topics affecting QDCs, eg allowable costs.
Our combination of capabilities is unique in the UK and, consequently, approximately 70% of total EMEA Services revenue is derived from single source contracts, including the non-tasking element of the Long Term Partnering Agreement (LTPA). As we have said before, we anticipate that the majority of our single source revenue will fall under the regulations within approximately three years.
* C4ISR is command, control, communications, computers, intelligence, surveillance and reconnaissance.
QinetiQ Group plc Annual Report and Accounts 201608

Breakdown of revenue by customer
UK Ministry of Defence (MOD) 67%US Department of Defence (DoD) 6%Government agencies 10%Commercial defence 6%Commercial 11%
Breakdown of revenue by key domain
Air & Space 25%Maritime, Land & Weapons 36%Cyber Information & Training 14%International 6%Global Products – US 8%Global Products – EMEA 11%
Emerging themes in our marketsIncreasing threats; budget pressuresLooking across our home and overseas markets we see a number of key themes. Governments are having to respond to increasing security threats with reducing budgets. They need to deliver more with less. So not only are government customers seeking greater value for money from their suppliers, they are also looking for assistance in meeting their own ‘efficiency’ challenges. Companies like QinetiQ, with a track record of delivering improved productivity and innovation in products and services, are strongly positioned to help.
Innovation in equipment, processes and approachMost governments recognise that being efficient is not enough and they also need to innovate to respond to these fast evolving threats. They are seeking new approaches to innovation in both equipment and processes so that they can rapidly integrate new technologies into existing capabilities. Investing and applying our core competence for customer advantage in defence and commercial markets is a strategic priority for QinetiQ. Many customers are keen to capture the innovation that comes from universities and small and medium sized enterprises (SMEs), and are looking for assistance from organisations that can help them connect their supply chains. Similarly, governments are promoting multilateral approaches to developing new capabilities, encouraging suppliers to cooperate internationally.
QinetiQ already delivers an ‘innovation integrator’ role, building networks of suppliers to bring together Government, industry, SMEs and academia in collaborating teams and thereby facilitating innovation at every stage of the procurement process. Our Cyber Information & Training (CIT) business, for example, is the MOD’s leading supplier of C4ISR research, managing framework contracts for the MOD that involve more than 100 UK SMEs.
Global marketsOur Global Products division has a significant US footprint, providing a route to the world’s largest defence market and, in the financial year to 31 March 2016, 6% (2015: 6%) of QinetiQ Group revenue was generated from the US Department of Defense (DoD).
US defence market: a greater focus on innovationIn the US, the defence downturn is reaching the bottom of the cycle, with the President requesting continued increases to the defence budget and the budget for overseas contingency operations. A renewed commitment by US military customers to unmanned systems products is reflected in plans to award new competitive Programs of Record over the next two years to enhance and sustain the US unmanned systems capability as a funded capability in the DoD budget.
The President has requested an increased research and development (R&D) budget for defence which includes the Defense Innovation Initiative, also known as the Third Offset Strategy, “an ambitious effort to identify and invest in innovative ways to sustain and advance America’s military dominance for the 21st Century”. This initiative is expected to put new resources behind innovation and, in particular, research and development in technology to support and optimise the interaction between humans and machines. These initiatives align with a number of areas in which QinetiQ has distinctive strengths including sensor fusion, man-machine interfaces, autonomy, and unmanned vehicles.
Supporting defence modernisation in AustraliaQinetiQ’s third home market is Australia. The Australian Government is responding to the need to modernise its defence equipment and now plans to replace the majority of its platforms over the next 15 years, supported by an increase in defence expenditure to 2% of GDP. In line with the recommendations of its First Principles Review, in which our Australian business played a role, the Government is also pursuing a defence transformation programme similar to that which has been underway in the UK since the beginning of the decade.
Global investment in defenceMany of our unique capabilities are attractive to customers beyond the UK, US and Australia, and we have made it a strategic priority to develop new home markets through partnerships, and grow sales by exporting our products and services. For example, as the Canadian Government pursues similar defence transformation programmes to the UK, it values the advice, test and evaluation that we can provide in support of better procurement.
In Sweden, where QinetiQ operates the Flight Physiological Test Centre for the Swedish defence department, the defence environment is similar, with budget pressures evident against a background of heightened security threats. Such pressures, on Sweden and other Northern European nations, can drive greater cooperation on specific programme opportunities and greater interdependency between allies in capability provision.
Further afield, in Turkey and the Middle East, budgets remain more robust, offering increased export opportunities for defence products and services, albeit these and other nations are determined to develop indigenous capability for both economic and sovereignty motives. This can provide seams of growth potential for QinetiQ’s most distinctive capabilities but accessing these markets will require thoughtful partnering approaches and alignment with UK Government export initiatives.
QinetiQ Group plc Annual Report and Accounts 2016 09
Strategic report Governance Financial statements Additional information

By prioritising customer focus and competitiveness
today, we will deliver
customer advantagenow and in the future
to become the chosen partner for our
customers.
Our vision is:To be the chosen partner
around the world for mission-critical solutions,
innovating for our customers’ advantage.
Becoming the chosen partner
VisionOur vision is our aspiration for the company that has been tested with customers and has been communicated to employees across the company. It sets out our future path and provides the catalyst for change.
Each word has specific meaning:• A company our customers want to work with –
chosen partner.• A company operating beyond the UK – around the world.• A company solving difficult problems – mission-critical
solutions.• A company delivering state-of-the-art technology,
services, products and business solutions – innovating.• A company focused outwardly – for our customers’
advantage.
StrategyTo realise our vision, we have developed a strategy designed to grow the company:
UK – We will lead and modernise the UK defence test and evaluation enterprise by working in partnership with Government and prime contractors.
We intend to modernise the approach to test and evaluation in the UK, focused on introducing a more agile capability. By working in partnership with Government and other companies, we will help our customers save money. As threats change, we need to ensure that our test and evaluation capabilities continue to enable next generation military equipment. For example, in October 2016, we will host a world-first Royal Navy trial which will demonstrate how autonomous systems can operate together as part of a naval fleet.
International – We will build an international company that delivers additional value to our customers by developing our home markets, creating new home markets and exporting.
QinetiQ will become an international company, operating around the world. We will maintain a focus on our home markets (the US and Australia as well as the UK) where we already have a presence and market share, develop new home markets through partnerships, and grow sales by exporting our products and services. For example, to win in an export market, rather than compete independently, we have chosen to partner with BAE Systems, with the backing of the UK Government, for a competition in Chile to upgrade their Type 23 frigates. A ‘Team UK’ approach.
Innovation – We will invest in and apply our core competences for customer advantage in defence and commercial markets.
QinetiQ will continue to innovate, focusing on markets where customers have a clear need for our skills, investing in and applying our competences to meet their needs. For example, as part of our new Internal Research and Development (IRAD) programme, we are funding projects to develop next generation approaches to test and evaluation services, robotics and OptaSense applications in the rail industry.
Our vision and strategy
QinetiQ Group plc Annual Report and Accounts 201610

Our strategic pillarsINTERNATIONALWe will build an international company that delivers additional value to our customers by developing our home markets, creating new home markets and exporting.
INNOVATIONWe will invest in and apply our core competences for customer advantage in defence and commercial markets.
UKWe will lead and modernise the UK defence test and evaluation enterprise by working in partnership with Government and prime contractors.
To become the chosen partner, we have reorganised the company, establishing a new way of working, and launched a
transformation programme to improve our customer focus
and competitiveness.
Our strategy
Page 16 Page 18 Page 20
IN
TERNATIONAL
IN
NOVATI
ON
UK
Page 12
Page 14
Read more about our way of working
Read more about our transformation programme
Operational excellence
Investing in our future
Business winning
QinetiQ Group plc Annual Report and Accounts 2016 11
Strategic report Governance Financial statements Additional information

Air & Space Maritime, Land & Weapons Cyber, Information & Training International £616.4mFY16 Annual revenue
5,514FY16 total employees
What we do: De-risks complex aerospace programmes by testing systems and equipment, evaluating the risks and assuring safety.
What we do: Delivers operational advantage to customers by providing independent research, evaluation and training services.
What we do: Helps government and commercial customers respond to ever-evolving threats based on its expertise in training, secure communication networks and devices, intelligence gathering and surveillance sensors, and cyber security.
What we do: Delivers our products and services in international markets.
Why bring together Air & Space? Technology developments are increasingly blurring boundaries between air and space systems which allows us to increase collaboration in our engineering capabilities.
Why bring together Maritime, Land & Weapons? The business has a strong focus on test and evaluation, and customers are increasingly undertaking more complex multi-domain trials.
Why create an international business?It incorporates businesses with a significant international footprint and those with international growth potential as well as our other international offices. The business includes QinetiQ Australia as well as Advisory Services.
Approximate revenue: £190m. Approximate revenue: £275m. Approximate revenue: £100m. Approximate revenue: £40m.
Key Sites: Farnborough and Boscombe Down, UK.
Key Sites: Farnborough, Boscombe Down, Shoeburyness, Fort Halstead, Hebrides, Aberporth, Pendine, West Freugh, Portsdown Technology Park and Haslar, UK.
Key Sites: Farnborough, Malvern and Crewe, UK.
Key Sites: Australia, Sweden, Canada and Dubai, UAE.
QinetiQ North America OptaSense Space Products EMEA Products £139.3mFY16 Annual revenue
693FY16 total employees
What we do: Develops and produces innovative military protection products specialising in unmanned systems, survivability and maritime systems, along with products in related commercial markets.
What we do: Provides innovative fibre sensing solutions to deliver decision ready data in multiple vertical markets.
What we do: Provides satellites, payload instruments, sub-systems and ground station services.
What we do: Provides research services and bespoke technological solutions developed from intellectual property spun out from EMEA Services.
Approximate revenue: £60m. Approximate revenue: under £25m. Approximate revenue: under £25m. Approximate revenue: £40m.
Key Sites: Waltham, Massachusetts; Pittsburgh, Pennsylvania; and Virginia, USA.
Key Sites: Farnborough, Winfrith, Portishead, UK; Houston, USA; Calgary, Canada and Dubai, UAE.
Key Sites: Farnborough, UK and Antwerp, Belgium.
Key Sites: Farnborough, Malvern and Haslar, UK.
Aligning the company with our strategy
Our way of working
We are embedding a new way of working to align the company with our strategy and ensure we are agile and responsive in meeting customer needs.
Responding to a changing market environment, we have reorganised the company, to deliver better value for money and a more efficient service for our customers.
The leadership team has been strengthened with the appointment of a new Managing Director International, a new CEO for OptaSense and Group Directors of Business Development and Human Resources, all from outside QinetiQ.
EMEA ServicesCombining world-leading expertise with unique facilities to provide technical assurance, test and evaluation and training services, underpinned by long-term contracts.
Page 34 – Operating review
Global ProductsDelivers innovative solutions to meet customer requirements and undertakes contract-funded research and development, developing intellectual property in partnership with key customers and through internal funding with potential for new revenue streams.
Page 35 – Operating review
QinetiQ Group plc Annual Report and Accounts 201612

13
Air & Space Maritime, Land & Weapons Cyber, Information & Training International £616.4mFY16 Annual revenue
5,514FY16 total employees
What we do: De-risks complex aerospace programmes by testing systems and equipment, evaluating the risks and assuring safety.
What we do: Delivers operational advantage to customers by providing independent research, evaluation and training services.
What we do: Helps government and commercial customers respond to ever-evolving threats based on its expertise in training, secure communication networks and devices, intelligence gathering and surveillance sensors, and cyber security.
What we do: Delivers our products and services in international markets.
Why bring together Air & Space? Technology developments are increasingly blurring boundaries between air and space systems which allows us to increase collaboration in our engineering capabilities.
Why bring together Maritime, Land & Weapons? The business has a strong focus on test and evaluation, and customers are increasingly undertaking more complex multi-domain trials.
Why create an international business?It incorporates businesses with a significant international footprint and those with international growth potential as well as our other international offices. The business includes QinetiQ Australia as well as Advisory Services.
Approximate revenue: £190m. Approximate revenue: £275m. Approximate revenue: £100m. Approximate revenue: £40m.
Key Sites: Farnborough and Boscombe Down, UK.
Key Sites: Farnborough, Boscombe Down, Shoeburyness, Fort Halstead, Hebrides, Aberporth, Pendine, West Freugh, Portsdown Technology Park and Haslar, UK.
Key Sites: Farnborough, Malvern and Crewe, UK.
Key Sites: Australia, Sweden, Canada and Dubai, UAE.
QinetiQ North America OptaSense Space Products EMEA Products £139.3mFY16 Annual revenue
693FY16 total employees
What we do: Develops and produces innovative military protection products specialising in unmanned systems, survivability and maritime systems, along with products in related commercial markets.
What we do: Provides innovative fibre sensing solutions to deliver decision ready data in multiple vertical markets.
What we do: Provides satellites, payload instruments, sub-systems and ground station services.
What we do: Provides research services and bespoke technological solutions developed from intellectual property spun out from EMEA Services.
Approximate revenue: £60m. Approximate revenue: under £25m. Approximate revenue: under £25m. Approximate revenue: £40m.
Key Sites: Waltham, Massachusetts; Pittsburgh, Pennsylvania; and Virginia, USA.
Key Sites: Farnborough, Winfrith, Portishead, UK; Houston, USA; Calgary, Canada and Dubai, UAE.
Key Sites: Farnborough, UK and Antwerp, Belgium.
Key Sites: Farnborough, Malvern and Haslar, UK.
Global locations• Australia• Belgium• Canada• Sweden• UAE• USA
QinetiQ Group plc Annual Report and Accounts 2016 13
Strategic report Governance Financial statements Additional information

Our transformation programme
Plan for changeWe have launched a transformation programme to enhance customer focus, improve competitiveness and drive investment in sustainable growth.
Business winning• Created an International business• Focusing on campaigns • Upskilling teams
Investing in our future• Increased Internal Research and Development• Delivering savings to reinvest• Focusing on organic and inorganic growth
Operational excellence• Driving integrated business planning• Dynamic resource management • Streamlining processes
QinetiQ Group plc Annual Report and Accounts 201614

Our future success will be built on operational excellence – doing what we say we are going to do, and underpinned by continued operational and financial discipline.
To respond to a changing market environment, we have reorganised the company, establishing new businesses responsible for our customer relationships, contract delivery and securing orders jointly with Business Development. Enabling functions provide support, in particular the dynamic resourcing of people and assets from across QinetiQ.
Customer requirements are not only changing, they are also getting more demanding. There is a need to improve our business winning skills in order to thrive in an increasingly challenging market, so we have instigated a programme to develop the skills of our sales teams, bringing in experienced hires where required. We also need to improve our knowledge of home and international markets; for example in August we appointed a new CEO for OptaSense who brings more than 20 years experience of working in the oil and gas sector.
We are driving savings through improved efficiencies and greater agility which will ensure we remain one step ahead of the competition and also create headroom so that we can invest in our future. This will allow us to invest carefully in research and development, improve skills and processes, take and manage risk more effectively on our customers’ behalf, and pursue campaigns to grow the company.
The key enabler to the themes across our markets is innovation, not just novel technologies but also innovation in products, services and business models. By working in partnership with our customers we can
Our scientists, engineers and operations community will be transferred to the new structure during the year, supported by an effective sales and operational planning process, enabling us to resource as one company. By improving productivity there is potential to deliver efficiencies that will provide better value for money for customers and headroom for careful investment.
In addition to driving efficiency and productivity, we have established a technical excellence function to improve project delivery.
We have launched a new process for bidding and winning strategically important corporate campaigns, making the best use of the skills that are available across the company.
As part of the reorganisation of the company, we have created an International business to deliver our products and services in international markets. It incorporates businesses with a significant international footprint and those with international growth potential.
propose innovative solutions to meet their emerging needs. For example, the £153m contract renewal for aircraft engineering services represents a new way of doing business with the MOD under which we are measured and paid on results and outputs rather than inputs. Last summer, we launched a new Internal Research and Development (IRAD) programme for QinetiQ led by our Chief Technology Officer and guided by an Innovation Steering Board to ensure that projects are customer-driven and properly controlled. This programme will develop future services and products using investment funded through cost savings across the company.
We are positioning QinetiQ for the future through an integrated business planning process, the output of which will be a robust plan. This is supported by a new approach to performance management which will ensure every employee across the company has clear objectives aligned to our strategy that support the effective delivery of our plan. We have also established a Leadership Community at QinetiQ for the first time, bringing together the top 100 leaders every month to ensure we are focused on our business performance.
Customers outside our UK, US and Australian home markets are unlikely to know QinetiQ, so we are also improving the visibility of our brand through targeted, cost effective marketing – particularly in European countries such as Belgium and Sweden where we already have a presence.
Current projects include OptaSense applications in the rail industry, next-generation robotics and test and evaluation services.
QinetiQ has considerable breadth and depth of technical expertise; we are working to integrate these core competences and connect them with customer needs to win market share. The strength of our balance sheet enables us to invest in our core competences such as test and evaluation, with capital expenditure likely to increase further as we continue to invest in the Long Term Partnering Agreement (LTPA) and other long-term contracts.
Pages 16 to 21 – for examples of how we are implementing our plan for change
QinetiQ Group plc Annual Report and Accounts 2016 15
Strategic report Governance Financial statements Additional information

UK
Opportunities to deliver more for less
Strategy in action
The UK MOD benefits from our ability to innovate to deliver more for less
QinetiQ already has a strong working relationship with Defence Equipment and Support (DE&S), the UK Ministry of Defence’s (MOD) procurement function, through contracts such as the 25-year Long Term Partnering Agreement. DE&S manages the huge range of complex projects that are required to buy and support all equipment and services for the front line. In 2015, this relationship entered a new phase with the setting up of the QinetiQ Strategic Enterprise: an overarching framework that will improve the timeliness and value for money for the delivery of technical services to DE&S Air Environment project teams. Two project teams, FAST (covering Typhoon, Tornado and the Battle of Britain Memorial Flight) and A400M, have placed tasks within the QinetiQ Strategic Enterprise framework valued at £153m over five years.
Deliver more for less “Strategic Enterprise is a more effective way to deliver multiple technical services to the customer, bringing individual platform projects under the same framework to enable major efficiencies and cost savings,” says Gordon Barr, Group Corporate Campaign
Director, QinetiQ. This is how it works: the customer identifies required outputs from their project delivery plans and selects the required outputs from a standardised list, for example, airworthiness certification for a fighter jet or Airbus A400M military transport aircraft, rather than developing and agreeing a bespoke set of tasks for every new project. “This means our technical experts can really focus on the outcomes the customer needs, saving time and bringing QinetiQ innovation into the process even earlier. For DE&S project teams, it eases the entire process and brings down costs, while giving an assurance of consistent timely, high quality services over several years.”
Streamlining processes, reducing costs With multiple projects managed under this single delivery approach, QinetiQ Strategic Enterprise delivers greater customer value by streamlining administrative processes, optimising the use of resources, driving down costs and better supporting longer-term planning. All activity is managed by the centralised Strategic Enterprise Management Office (SEMO), which is jointly staffed by QinetiQ and DE&S. “Having a clear set of requirements along with pre-defined outputs and delivery processes will reduce cost and enable more focus on quality,” says Ron Finlayson, QinetiQ Strategic Business Director, Defence. “The Strategic Enterprise delivery framework will also allow us to forecast future workloads with greater accuracy, helping the MOD to prioritise work and QinetiQ to plan our resources better so we can ensure the right skills are available when they are needed.”
Air Marshal Sir Simon Bollom, Chief of Materiel, Air said, “This new approach transforms the provision of QinetiQ-provided technical services for our aircraft. The Strategic Enterprise will deliver considerable savings and improve long-term planning through further improving our joint working.”
Our plan for change
This innovative approach to contracting, where QinetiQ is measured and paid on results and outputs, not inputs, was delivered by a pan-QinetiQ team that comprised business development, delivery, commercial and finance experts making use of the best skills available across the company.
QinetiQ Group plc Annual Report and Accounts 201616

A remarkable QinetiQ exercise showcases maritime missile defences
Countering maritime threatsThe proliferation of short, medium and long-range ballistic missiles and increasingly advanced anti-ship cruise missiles is a significant threat to navies worldwide. A multinational coalition, the Maritime Theatre Missile Defense (MTMD) forum aims to improve protection against these threats. Comprising Australia, Canada, France, Germany, Italy, The Netherlands, Norway, Spain, the UK and the USA, the forum’s activity includes major events such as the At Sea Demonstration 2015 (ASD15) – a ground-breaking opportunity to conduct numerous naval interoperability tests.
‘Raising the bar’Comprising three weeks of allied at-sea operations and live weapons firing, planned and coordinated by QinetiQ, ASD15 was hosted by the UK around Europe’s largest range: the QinetiQ-operated Hebrides range. A critical aspect was delivering the most sophisticated information architecture ever established for a maritime task group, enabling new levels of interoperability between some of the world’s leading navies. Information was shared almost simultaneously from ships in the Hebrides to stations in the UK, USA, Germany, Italy and Spain, across 14.7 million sq km of tactical data link network.
Notable firstsHighlights included four ballistic missile targets launched, 11 cruise missile targets flown, and nine surface-to-air missiles fired and launched with exo-atmospheric intercept. The demonstration culminated in the first ever launch of a ballistic rocket into space from the UK and its subsequent engagement by a US guided missile destroyer. “We raised the bar with the international community, showcasing QinetiQ capabilities,” says Sarah Kenny, Managing Director Maritime, Land & Weapons. Planning ASD15 meant overcoming numerous challenges, from installing a new Trials Control System to rebuilding damage on St Kilda following a storm: “Our people rose to these challenges with determination and perseverance.”
Commander Mark Williams, Royal Navy said, “ASD15 had a real operational edge that wasn’t fully expected. We set a pathway for greater cooperation in the future.”
Our plan for change
This ground-breaking trial for the At Sea Demonstration 2015 was made possible by capital expenditure in the LTPA contract that enabled major improvements at the Hebrides range including a new communications infrastructure.
Strategic report Governance Financial statements Additional information
QinetiQ Group plc Annual Report and Accounts 2016 17

INTERNATIONAL
Our plan for change
By integrating our expertise in multiple disciplines, including stealth technology, we are able to help customers solve complex problems in civil markets.
Delivering value to customers for growth outside the UK
Strategy in action continued
Helping the French Government plan new wind farms with confidence
When it came to building wind farms as part of its renewable energy plans, France faced a dilemma. New sites couldn’t be approved until their impact on nearby weather radar systems had been explored yet no satisfactory method existed to predict those impacts – until we brought our world-class expertise across multiple disciplines.
Breaking the deadlock“Planning applications for wind farms were often rejected due to concerns by France’s national meteorological service Météo-France about their effects on radar,” says Dr Thierry Le Gall, Technology Exploitation Manager, Research Services. As a result, the Government passed a law allowing private companies to conduct independent impact assessments. Crucially, a contractor can only be validated once it has proven the accuracy of its predictions, so that
any recommendations can be legally recognised during planning applications. QinetiQ successfully modelled interference caused by an existing wind farm in a blind test. Accurately predicting if wind turbines would interfere with weather radars, we became the first company authorised to help the French Government cut planning red tape for new sites.
Helping France deliver renewables The Radar Impact Assessment method was developed through close collaboration between teams across QinetiQ, combining expertise and experience of stealth technology, air traffic management and radar development. Using a classified code
to generate predictive data, test results were compared with real-life measurements taken by Météo-France from two existing wind farms in Normandy. Results confirmed that our method predicted the interference caused by the turbines to the high degree of accuracy demanded by the Government. Dr Le Gall says, “This is an example of using technologies we originally developed for military use in civilian and commercial applications. This work is a big step forward in helping France to increase adoption of renewable energy, while offering Météo-France an assurance this will not harm its ability to make forecasts. We’re already talking about applying the same technology for other countries.”
QinetiQ Group plc Annual Report and Accounts 201618

Aircraft structural integrity in Australia
To operate effectively, Australia’s military aviation depends on impartial airworthiness advice and an assurance of the structural integrity of fixed and rotary wing aircraft. To ensure continued access to world-leading Aircraft Structural Integrity (ASI) capabilities, the Australia Defence Force (ADF) has extended its successful long-term partnership with QinetiQ Australia. QinetiQ already employs the largest concentration of ASI engineers in Australia and delivered more than 3,500 tasks focused on safer operations, enhanced capability and lower cost of ownership.
A unique capability “We’ve been a single channel for ASI expertise for 15 years, and look forward to further strengthening what the Australian Department of Defence describes as a priority industry capability,” says Greg Barsby, MD, QinetiQ Australia. “It’s important this highly specialised capability doesn’t get fragmented – and no other provider comes close to matching our resources and know-how.” He says this work “is critical
to delivering safe, cost-effective and capable outcomes to the current and future fleet. This contract is about maintaining the capability and assuring safety.”
Value for moneyThe long-term performance-based contract will enable even greater collaborative working between the ADF, QinetiQ and Defence Science and Technology (DST) Group, keeping Australian military aviation at the forefront of ASI management. The flexible contractual arrangements are designed around the needs of the customer, with any Australian Defence agency able to access QinetiQ expertise directly.
Greg Barsby adds, “We hold a unique status: QinetiQ is the ADF’s only commercial Authorised Engineering Organisation in ASI for all military aircraft types. Under the latest Defence Aviation Safety Regulations, we’ll be able to deliver certified designs across all ASI platforms. We always strive to offer our customers more while delivering measurable value for money.”
Our plan for change
By reinforcing partnerships with Government and industry, and improving commercial and business development capabilities, QinetiQ Australia is focusing on longer-term, strategic support style contracts with the Australian Government.
Strategic report Governance Financial statements Additional information
QinetiQ Group plc Annual Report and Accounts 2016 19

INNOVATION
Strategy in action continued
Enabling the UK military to retain its tactical edge in advanced materials technology
Partnering with our customers to solve real world challenges
Our plan for change
An Advanced Services and Products team has been established in the Business Development function, to develop a pipeline of innovation ready for exploitation in the domain-focused businesses.
‘Protect above all’ In March 2016, the UK Defence Science and Technology Laboratory (Dstl) renewed a contract with QinetiQ that supports the UK military in maintaining its tactical advantage in advanced materials technology. The new £10m five-year contract will see QinetiQ experts develop and test materials to further protect land, air, maritime and subsea vehicles from next-generation threats. Performed in line with the UK Ministry of Defence’s mandate to ‘protect above all’, QinetiQ’s capability is the only one of its kind in the country.
A strategic national capability The contract, part of the Materials and Structures Technology (MAST) Science and Technology Centre, is being delivered by QinetiQ’s world-class team of experts. The team comprises a unique mix of physicists, chemists, materials scientists and vision scientists that has been delivering innovative solutions to protect the UK’s armed forces for more than 20 years. “The MAST programme has to be extremely agile, with our team almost exclusively and continuously innovating,” says Dr David Moore, Director of Research Services, QinetiQ. “Recognised as a strategic national capability, the most important factor is the people. And this is a true growth story: born out of a fragile capability some years ago, MAST has
developed in line with customer demands, in particular being able to do more for less and honing world-leading experts in this field. The team is now producing cutting-edge technology that recognises the ever-growing threat of more connected technology like never before.”
Dstl Programme Manager John Pearson, said: “As technology advances at an unprecedented rate and becomes more accessible to hostile states and groups, it is vital that the UK stays one step ahead. Our investment will preserve a unique capability of critical national importance, enabling the British armed forces to maintain their battle-winning edge.”
QinetiQ Group plc Annual Report and Accounts 201620

Next-generation hub motors aim to improve mobility for US military vehicles
The US Defense Advanced Research Projects Agency (DARPA) has awarded QinetiQ a contract worth $2m (with an option for a further $3m) to develop a new electric hub motor that aims to revolutionise the mobility and performance of military vehicles. This R&D project, part of the Ground X-Vehicle Technologies (GXV-T) program, reflects DARPA’s mission to develop breakthrough technologies that could enable fundamental change – radical improvements – in military capability.
Breaking the mould “We want to stretch the limits of performance and enable a fundamentally new approach to vehicle design, that breaks the cycle of vehicles becoming heavier and less mobile, due to the increasing armour and weaponry required to meet the demands of modern warfare,” says Steven Goldsack, Programme manager. Until now, no design team has succeeded in packing such a
leading-edge capability into a standard wheel size: “The goal is to achieve a high-power unit at an acceptable weight and cost, making it viable for in-service deployment.” QinetiQ was the only non-US partner selected in an open tender; our novel approach builds on highly integrated motor and gearbox technologies pioneered in previous research.
Striking a unique balance This new approach is specifically designed to deliver unparalleled performance and durability for a unit of this size and mass. “The hub is the key to unlocking vehicle system benefits,” explains Steven Goldsack. “DARPA has given us a huge amount of freedom to innovate, drawing on our deep technical expertise in electromechanical transmissions and the design of high-mobility vehicles.” The QinetiQ team, he says, is striking a remarkable balance between mechanical and electrical engineering, creating designs that “combine a high-performance motor with an integral multi-speed gearbox and friction brake. We are meeting the customer brief and more, through an entirely new approach” – an approach that could provide major benefits for future armoured fighting vehicles. “The hub drive also offers huge potential for significantly improved suspension travel and better protecting vehicles and personnel by removing conventional drive systems.”
Our plan for change
The development of new intellectual property through both contract-funded research and development and targeted internal funding will provide the potential for new revenue streams.
QinetiQ Group plc Annual Report and Accounts 2016 21
Strategic report Governance Financial statements Additional information

7.9 8.1 8.1
2014 2015 2016
5.8 5.65.0
2014 2015 2016
Customer satisfaction (Score out of 10)
8.12015: 8.1
Health and safety (LTI)
5.02015: 5.6
Non-financial KPIsKey performance indicators
Page 80 – Directors’ remuneration report Page 28 – Corporate responsibility
DescriptionQinetiQ’s customer satisfaction survey asks all UK customers with contracts over £200,000 about QinetiQ’s delivery, and engagement. This year, on the recommendation of our independent supplier, we moved from last year’s “top three supplier” score to a measure out of 10 which improves comparability. In the US, customer satisfaction metrics are reviewed on a contract-by-contract basis.
DescriptionThe Lost Time Incident (LTI) rate is calculated using the total number of accidents resulting in at least one day taken off work, multiplied by 1,000 divided by the average number of employees in that year.
DescriptionThe number shown is the total number of apprentices, graduates and sponsored students as a percentage of our UK workforce.
DescriptionA measure of employee engagement (in the UK) on a scale of 0–1,000, based on the Best Companies Employee Survey.
Through this survey, employees share their views about working at QinetiQ under the headings of management, leadership, company, personal growth, my team, giving something back, fair deal and wellbeing.
DescriptionThis is a measure of the number of employees leaving the company not at QinetiQ’s instigation.
RationaleUsing an independent third party we annually survey around 100 of our largest projects to help us understand our performance and what we need to be doing to continuously improve. We also gather qualitative feedback through structured interviews.
RationaleHealth and safety performance is monitored to drive continual improvement in minimising risks to employees and reducing harm.
RationaleProvides a measure of QinetiQ’s ability to attract and develop new employees. It is also a measure of our commitment to The 5% Club, an industry-led initiative of which we are a founding member, to grow the number of young people on apprenticeships, graduate programmes and student sponsorships.
RationaleThe annual survey enables comparison between QinetiQ and other UK companies.
RationaleProvides a measure of the Group’s ability to retain employees.
Performance this yearOf those surveyed, we received an average rating for our performance overall of 8.1 out of 10, consistent with 2015. Our top three supplier score, used previously, was 77% in 2016 compared to 85% in 2015 and 77% in 2014.
Performance this yearThe reduction in LTI rate has continued from the previous year. The absolute number of lost time incidents resulting in at least one day off work has also reduced slightly on last year.
Performance this yearWe continue to provide opportunities for young people through our apprenticeship and graduate programmes. Including sponsored students, this equals 5.7% of our UK workforce.
Performance this yearWe have again seen an improvement in our overall engagement score, retaining our position in the Best Companies ‘ones to watch’ category, which recognises companies with good employee engagement that are progressing towards best practice.
Performance this yearVoluntary employee turnover has increased slightly to 9.2% reflecting a more competitive market place.
Link to strategyAchieving our ambition of becoming the chosen partner will require a relentless focus on continuing to meet our customers’ needs.
Link to strategyThe safety, health and wellbeing of our people are intrinsically linked to our strategic success.
Link to strategyAs a business whose reputation and achievements are centred on our people, our future success is primarily dependent on our ability to recruit, develop, engage and retain exceptional employees.
Key performance indicators (KPIs)The objective of our strategy is to grow QinetiQ, delivering a sustainable increase in quality earnings to our shareholders. Progress is measured through a range of financial and non-financial key performance indicators. Measurements of customer satisfaction, health and safety and employee engagement underpin sustainability.
Measures such as order intake, organic revenue growth, profitability and cash flow track financial performance.
Similar indicators are used to review performance in each of the Group’s businesses.
Continuing operationsAll KPIs have been restated to reflect the continuing operations only.
Page 26 – Corporate responsibility
QinetiQ Group plc Annual Report and Accounts 201622
593 613 623
2014 2015 2016
4.8
5.9 5.7
2014 2015 2016
9.1 8.9 9.2
2014 2015 2016
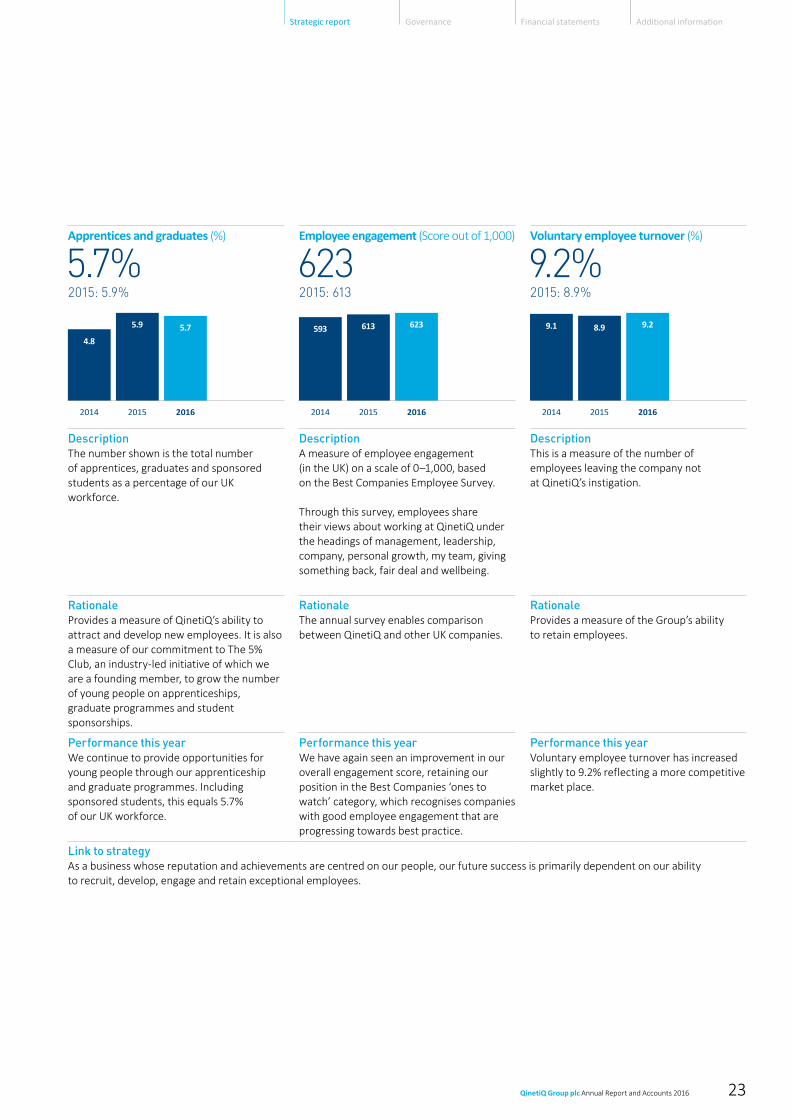
Employee engagement (Score out of 1,000)
6232015: 613
Apprentices and graduates (%)
5.7%2015: 5.9%
Voluntary employee turnover (%)
9.2%2015: 8.9%
DescriptionQinetiQ’s customer satisfaction survey asks all UK customers with contracts over £200,000 about QinetiQ’s delivery, and engagement. This year, on the recommendation of our independent supplier, we moved from last year’s “top three supplier” score to a measure out of 10 which improves comparability. In the US, customer satisfaction metrics are reviewed on a contract-by-contract basis.
DescriptionThe Lost Time Incident (LTI) rate is calculated using the total number of accidents resulting in at least one day taken off work, multiplied by 1,000 divided by the average number of employees in that year.
DescriptionThe number shown is the total number of apprentices, graduates and sponsored students as a percentage of our UK workforce.
DescriptionA measure of employee engagement (in the UK) on a scale of 0–1,000, based on the Best Companies Employee Survey.
Through this survey, employees share their views about working at QinetiQ under the headings of management, leadership, company, personal growth, my team, giving something back, fair deal and wellbeing.
DescriptionThis is a measure of the number of employees leaving the company not at QinetiQ’s instigation.
RationaleUsing an independent third party we annually survey around 100 of our largest projects to help us understand our performance and what we need to be doing to continuously improve. We also gather qualitative feedback through structured interviews.
RationaleHealth and safety performance is monitored to drive continual improvement in minimising risks to employees and reducing harm.
RationaleProvides a measure of QinetiQ’s ability to attract and develop new employees. It is also a measure of our commitment to The 5% Club, an industry-led initiative of which we are a founding member, to grow the number of young people on apprenticeships, graduate programmes and student sponsorships.
RationaleThe annual survey enables comparison between QinetiQ and other UK companies.
RationaleProvides a measure of the Group’s ability to retain employees.
Performance this yearOf those surveyed, we received an average rating for our performance overall of 8.1 out of 10, consistent with 2015. Our top three supplier score, used previously, was 77% in 2016 compared to 85% in 2015 and 77% in 2014.
Performance this yearThe reduction in LTI rate has continued from the previous year. The absolute number of lost time incidents resulting in at least one day off work has also reduced slightly on last year.
Performance this yearWe continue to provide opportunities for young people through our apprenticeship and graduate programmes. Including sponsored students, this equals 5.7% of our UK workforce.
Performance this yearWe have again seen an improvement in our overall engagement score, retaining our position in the Best Companies ‘ones to watch’ category, which recognises companies with good employee engagement that are progressing towards best practice.
Performance this yearVoluntary employee turnover has increased slightly to 9.2% reflecting a more competitive market place.
Link to strategyAchieving our ambition of becoming the chosen partner will require a relentless focus on continuing to meet our customers’ needs.
Link to strategyThe safety, health and wellbeing of our people are intrinsically linked to our strategic success.
Link to strategyAs a business whose reputation and achievements are centred on our people, our future success is primarily dependent on our ability to recruit, develop, engage and retain exceptional employees.
QinetiQ Group plc Annual Report and Accounts 2016 23
Strategic report Governance Financial statements Additional information

(4) (2) (1)
2014 2015 2016
596.9 613.6659.8
2014 2015 2016
113.7 111.3 108.9
2014 2015 2016
Organic revenue growth/decline (%)
(1)%2015: (2)%
Orders (£m)
£659.8m2015: £613.6m
Underlying operating profit* (£m)
£108.9m2015: £111.3m
Financial KPIsKey performance indicators continued
Page 80 – Directors’ remuneration report
DescriptionThe level of new orders (and amendments to existing orders) booked in the year.
DescriptionThe Group’s organic revenue growth is calculated by taking the increase in revenue over prior year pro-forma revenue, at constant exchange rates. Prior year pro-forma revenue excludes the impact of acquisitions and disposals.
DescriptionThe earnings before interest and tax, excluding all specific adjusting items*.
DescriptionThe underlying earnings, net of interest and tax, expressed in pence per share.
DescriptionThis is the total Group profit/(loss), net of interest and tax, including all specific adjusting items and including discontinued items*.
DescriptionThis represents net cash flow from operations before cash flows of specific adjusting items, less net cash outflows on the purchase/sale of intangible assets and property, plant and equipment.
RationaleThis provides a measure of the Group’s ability to replace completed contracts/business with new contracts/business.
RationaleOrganic revenue growth demonstrates the Group’s capability to grow market share and sources of revenue within its chosen markets before the effect of acquisitions, disposals and currency translation.
RationaleUnderlying operating profit is used by the Group for performance analysis as a measure of operating profitability that is tracked over time. Specific adjusting items are excluded because their size and nature mask the true underlying performance year on year.
RationaleUnderlying EPS provides a measure of the earnings generated by the Group after deducting tax and interest. Specific adjusting items are excluded because their size and nature mask the true underlying performance year on year.
RationaleThis shows the overall financial performance of the Group reflecting both underlying and specific adjusting items of income and expenditure. A key financial measure used to reflect overall financial performance for the year.
RationaleThis provides a measure of the Group’s ability to generate cash from its operations and gives an indication of its ability to make discretionary investments and pay dividends to shareholders.
Performance this yearOrders grew 8% due to the award of a £153m five-year renewal from the UK MOD in an otherwise challenging market.
Performance this yearContinuing operations recorded a 1% decline in revenue, after adjusting for foreign exchange and the divestment of the non-core Cyveillance business.
Performance this yearGrowth in EMEA Services was offset by a reduction in Global Products. See Operating review on page 34.
Performance this yearUnderlying EPS grew by 7%, benefiting from a reduction in net finance expense (following repayment of private placement debt in the prior year) and a reduced share count as a result of the Group buying back shares.
Performance this yearThe increase in the total Group profit after tax primarily results from business divestments and a net tax credit following election into the RDEC regime, partially offset by an impairment of goodwill in Global Products.
Performance this yearUnderlying operating cash flow decreased marginally from the prior year but remains strong, representing a cash conversion ratio of 96%.
Link to strategyOrder intake is an important measure of progress of the implementation of our strategy, the objective of which is to grow the Group.
Link to strategyOrganic revenue growth is an important measure of progress of the implementation of our strategy, the objective of which is to grow the Group.
Link to strategyThis measure is a reflection of the productivity of the Group’s activities and is used for executive remuneration.
Link to strategyThis is a measure of growth in quality earnings for our shareholders and is used for executive remuneration, determining the level of pay-out for certain of the Group’s long-term incentive plans.
Link to strategyThis is a key financial measure of overall financial performance for the year.
Link to strategyThis is a measure of the cash-generative characteristics of the Group and is used for executive remuneration.
QinetiQ Group plc Annual Report and Accounts 201624

13.815.2
16.3
2014 2015 2016
(12.7)
104.7 106.1
2014 2015 2016
106.2114.9
103.6
2014 2015 2016
Underlying earnings per share (EPS)* (p)
16.3p2015: 15.2p
Total Group profit after tax (£m)
£106.1m2015: £104.7m
Underlying operating cash flow* (£m)
£103.6m2015: £114.9m
* Definitions of underlying measures of performance and specific adjusting items can be found in the glossary on page 149.
Page 80 – Directors’ remuneration report
Page 115 – Note 4: Specific adjusting items
Page 80 – Directors’ remuneration report
DescriptionThe level of new orders (and amendments to existing orders) booked in the year.
DescriptionThe Group’s organic revenue growth is calculated by taking the increase in revenue over prior year pro-forma revenue, at constant exchange rates. Prior year pro-forma revenue excludes the impact of acquisitions and disposals.
DescriptionThe earnings before interest and tax, excluding all specific adjusting items*.
DescriptionThe underlying earnings, net of interest and tax, expressed in pence per share.
DescriptionThis is the total Group profit/(loss), net of interest and tax, including all specific adjusting items and including discontinued items*.
DescriptionThis represents net cash flow from operations before cash flows of specific adjusting items, less net cash outflows on the purchase/sale of intangible assets and property, plant and equipment.
RationaleThis provides a measure of the Group’s ability to replace completed contracts/business with new contracts/business.
RationaleOrganic revenue growth demonstrates the Group’s capability to grow market share and sources of revenue within its chosen markets before the effect of acquisitions, disposals and currency translation.
RationaleUnderlying operating profit is used by the Group for performance analysis as a measure of operating profitability that is tracked over time. Specific adjusting items are excluded because their size and nature mask the true underlying performance year on year.
RationaleUnderlying EPS provides a measure of the earnings generated by the Group after deducting tax and interest. Specific adjusting items are excluded because their size and nature mask the true underlying performance year on year.
RationaleThis shows the overall financial performance of the Group reflecting both underlying and specific adjusting items of income and expenditure. A key financial measure used to reflect overall financial performance for the year.
RationaleThis provides a measure of the Group’s ability to generate cash from its operations and gives an indication of its ability to make discretionary investments and pay dividends to shareholders.
Performance this yearOrders grew 8% due to the award of a £153m five-year renewal from the UK MOD in an otherwise challenging market.
Performance this yearContinuing operations recorded a 1% decline in revenue, after adjusting for foreign exchange and the divestment of the non-core Cyveillance business.
Performance this yearGrowth in EMEA Services was offset by a reduction in Global Products. See Operating review on page 34.
Performance this yearUnderlying EPS grew by 7%, benefiting from a reduction in net finance expense (following repayment of private placement debt in the prior year) and a reduced share count as a result of the Group buying back shares.
Performance this yearThe increase in the total Group profit after tax primarily results from business divestments and a net tax credit following election into the RDEC regime, partially offset by an impairment of goodwill in Global Products.
Performance this yearUnderlying operating cash flow decreased marginally from the prior year but remains strong, representing a cash conversion ratio of 96%.
Link to strategyOrder intake is an important measure of progress of the implementation of our strategy, the objective of which is to grow the Group.
Link to strategyOrganic revenue growth is an important measure of progress of the implementation of our strategy, the objective of which is to grow the Group.
Link to strategyThis measure is a reflection of the productivity of the Group’s activities and is used for executive remuneration.
Link to strategyThis is a measure of growth in quality earnings for our shareholders and is used for executive remuneration, determining the level of pay-out for certain of the Group’s long-term incentive plans.
Link to strategyThis is a key financial measure of overall financial performance for the year.
Link to strategyThis is a measure of the cash-generative characteristics of the Group and is used for executive remuneration.
QinetiQ Group plc Annual Report and Accounts 2016 25
Strategic report Governance Financial statements Additional information

3
4
Business Ethics
Our People Page 27
SustainableSolutions
Page 29
Environment Page 30
CommunityInvestment
Page 32
Managing Corporate Responsibility Page 33
Page 33
2
Our framework
There are some elements which will always be business priorities, such as the safety of our people and our approach to governance. However, we also recognise that we need to anticipate and understand emerging issues and trends.
The skills agenda, with an emphasis on apprenticeships, new energy management regulations and the introduction of the Modern Slavery Act all have an impact on our business. Addressing them is integrated into our programmes, ensuring our approach to corporate responsibility does not stand still and fully supports the success of our business.
Trust is the foundation of how we do business and manifests itself in everything we do; our relationships with our customers and stakeholders, industry partners, and shareholders. It also drives how our people work with each other. We know that we can contribute to our future success and provide wider value to society through focusing on the skills and competences of our people and the next generation, supporting our customers’ sustainability agendas, our commitment to environmental stewardship and having a positive impact in the communities where we work.
Corporate responsibility
Committed to our stakeholders
2016 highlightsSkills development• Launch of the QinetiQ Academy
(page 27)• The 5% Club grows to over 160
members (page 27)
Health and safety• ‘Safe for Life’ rolling out
across the UK (page 28)
Environmental stewardship• ISO 50001 certification of our energy
management system (page 31)
2017 prioritiesSkills development• Developing our people to support
our growth agenda
Engagement of our people• Improving the way we engage with
our people
Health and safety• Further roll out of ‘Safe for Life’
Environmental stewardship• Continual improvement of our
energy management system
QinetiQ Group plc Annual Report and Accounts 201626

Our people By having the right people, ensuring they are engaged, creating a positive working environment and supporting their development, we can deliver to our customers. There is a recognised shortfall of engineering skills so focusing on the skills of our people as well as the future pipeline is vital (also see community investment section, page 32).
The 5% Club – Investing in a GenerationThe skills of the next generation are the foundation of the future of QinetiQ.
The 5% Club, launched in 2013 and spearheaded by QinetiQ, has gone from strength to strength, with membership at over 160 (at 31 March 2016) including large and small companies from a range of sectors. Members that sign up to The 5% Club pledge to have 5% of their UK workforce on apprenticeships, formal graduate schemes or as student sponsorships. By encouraging employers to offer great ‘earn and learn’ opportunities for young people, we see this as a key step in developing the future skills, knowledge and experience needed across the UK.
As part of QinetiQ’s commitment to the development of the next generation, we reviewed our UK graduate scheme and the People Faculty launched a new two-year corporate graduate development framework, bringing graduates together where previously separate schemes were run by each business.
Page 23 – Apprentices and graduates KPI
Assumption 2016 2015 2014
Number of apprentices 150 208 121
Number of graduates on formal programmes 135 102 106
Number of sponsored students 26 8 17
Percentage of UK workforce 5.7% 5.9% 4.8%
Learning and developmentWe have been focusing on how we provide opportunities for developing skills.
The breadth and depth of knowledge and capability of our people is key to delivering for our customers.
Page 03 – Our business model
The QinetiQ Academy was established in April 2015, addressing the business need to drive effectiveness (quality, consistency and standards) and in response to our people’s appetite to learn, develop and give more to our company (articulated in our Engagement Surveys). There are three faculties:
• The People Faculty delivers management and leadership development from early careers to executive level.
• The Engineering, Science and Technical (EST) Faculty delivers training to sustain and develop the highly specialised skills essential to meet our customers’ challenges.
• The Business Faculty delivers skills and competences such as marketing, business development, negotiation and sales through to project management, assurance and health and safety.
Underpinning the Academy is the QinetiQ Learning Zone (QLZ) which provides one-stop online access for our people’s learning needs. The full functionality has been developed for QinetiQ UK and accessibility to the QLZ will be increased across the Group. The EST Faculty has facilitated our first cohort of ten delegates on the Systems Engineering Masters Apprenticeship Programme (SEMAP). This is a three to five-year programme of blended vocational and academic learning at Masters level developed by the Defence Growth Partnership to address an enterprise wide skills gap in systems engineering.
Learning and development highlights in FY16 include: • The course catalogue has grown from 70 to over 140 courses.• Accreditation obtained for a further three years from the
Association for Project Management.• Launch of refreshed coaching and mentoring capabilities.• Innovation of course delivery through ‘gamification’.
QinetiQ Group plc Annual Report and Accounts 2016 27
Strategic report Governance Financial statements Additional information

Safety, health and wellbeingHealth and wellbeing of our people sits at the heart of operations and underpins our strategic goals.
We continue to focus on reducing accidents and work-related ill health as part of our continuous improvement activity. We measure overall Lost Time Incident (LTI) Rate as a lagging indicator for the Group.
Page 22 – Health and safety KPI
LTI Rate is highly dependent on the number of employees (calculated as the number of lost time incidents, where the employee is away from work for one or more days, times 1,000 divided by the total number of employees). The LTIR has reduced from 5.6 to 5.0.
Lost Time Incident Rate 2016 2015 2014
QinetiQ Group 5.0 5.6 5.8
In 2014 we introduced ‘Safe for Life’ into our UK Weapons business. ‘Safe for Life’ focuses on behavioural safety including safety leadership, human factors, error management and everyday behaviours of our people. The programme is underpinned by a Safety Culture Climate Survey and supported by local champions. The pilot programme has been completed successfully and we are rolling ‘Safe for Life’ out into other UK business areas.
There were no safety prosecutions or prohibition notices issued by regulators in the UK in FY16. A single improvement notice was issued to the company during the UK Health and Safety Executive’s ongoing investigation of an incident at one of the sites we manage on behalf of the MOD. The improvement actions identified required the review of schematics for the high voltage electrical system on the site. The required actions have been completed, the Improvement Notice formally closed and lessons shared across the organisation.
We continue to develop our health and wellbeing programmes. The UK Wellbeing programme and QinetiQ Benefits+ scheme in the UK are offering more services, with good uptake by our people. Health assessments (measuring BMI, blood pressure and cholesterol) and flu vaccinations continue to be popular.
Diversity and inclusion The inclusion, diversity and equality of all our people is critical to our strategy.
In order to support our approach, we value working with specialist networks in each of our home markets. QNA is a member of the Direct Employers Association which provides recruiting solutions with a strong focus on diversity and inclusion. QinetiQ Australia is a member of the Diversity Council Australia and has established a diversity and inclusion strategy which has been endorsed by the Australian Board and Australian Leadership Team. The UK continues to be a core member of, and work with, the Employers Network of Equality and Inclusion, using their tools to support our agenda. The Group is committed to the fair treatment of people with disabilities in relation to applications, training, promotion and career development. If an existing employee becomes disabled, we make every effort to enable them to continue their employment and career development, and to arrange appropriate training, wherever practicable. The breakdown of the number of employees by gender at the end of March 2016 is shown in the table below.
Female Male
Board Directors 2 7
Senior Managers(1) 28 170
All employees(2) 1,190 4,817
(1) Excluding Board Directors.(2) Excluding Senior Managers and Board Directors.
Engaging our peopleEngaged employees are motivated to reach their full potential. Improving employee engagement forms an important part of our strategy and is one of our non-financial KPIs.
Page 23 – Employee engagement KPI
We regularly communicate with employees to ensure they understand QinetiQ strategy, performance and business priorities. In 2015 ‘Q-Talk’ was introduced as a monthly briefing and discussion session. Through Q-Talk (and numerous other channels such as the intranet, campaigns and roadshows) we can ensure that our people across the Group understand how what they do contributes to our strategy and they are knowledgeable about our business. Our UK Employee Engagement Group (EEG) is an independent consultative forum. The EEG listens, gathers feedback and represents our people on all key employee related matters (local or company-wide) and through times of change. The representatives are the employee voice to constructively challenge policy decisions and actions that have an effect on employees’ working lives or wellbeing.
We undertake an annual independent survey for all employees across the Group, excluding QinetiQ North America (QNA), run by Best Companies. This survey allows us to gain feedback and an accurate picture of how our people feel about a number of aspects of our business. The response rate in FY16 was 68% and we scored 623 (compared to 613 in FY15), putting us in the ‘ones to watch’ category. The survey identifies specific areas where we can work to improve performance and engagement and leaders respond through action plans on priority areas.
QNA use Workplace Dynamics to administer the Top Work Places survey and will be conducting it for the second year in FY17.
Page 88 – Directors’ remuneration report
Corporate responsibility continued
QinetiQ Group plc Annual Report and Accounts 201628

Customers recognise the importance of sustainable products and services to enable greater efficiency and resilience. While it is not core business, we regularly provide solutions for our customers, across a breadth of technology areas including:
• Training and simulation: allowing troops and aircrew to train in sophisticated simulated environments, reducing the need for costly and energy intensive activities.
• Unmanned Aerial Vehicles (UAVs): QinetiQ, in partnership with the Welsh Government and Snowdonia Aerospace LLP, ran an event at the Snowdonia Aerospace Centre in Llanbedr to demonstrate how UAVs flown from the airfield can help to tackle environmental issues and other commercial challenges.
• Maritime: improved propulsion efficiency resulting in reduced fuel consumption and noise/vibration pollution. QinetiQ has also completed work to ensure ships comply with the Energy Efficiency Design Index which is unique to the maritime industry.
• Batteries: QinetiQ is part of a project called ‘3CCAR’ targeting Integrated Components for Complexity Control in affordable electrified cars, focusing particularly on smart battery cells, which will help improve effectiveness of electric cars.
• Engine efficiency: the hub drive provides an entirely new approach.
Page 21 – next-generation hub motors
• Modelling of wind turbine interactions with radars which assists the planning processes to support the renewable energy industry.
Page 18 – Radar impact assessment
Product safetyDelivering products and services safely fundamentally underpins our offering to customers.
We invest in attracting and developing our engineers and scientists with specialist safety expertise. In the UK, technical assurance, governance and Independent Design Review have been fully integrated into our day-to-day business delivery processes and are underpinned by our Through-Life Engineering principles. These principles are applied to all our customer and internal projects. High Integrity Systems are delivered using our specifically developed principles and independently assured throughout their lifecycle. Continuous improvement is driven by our Engineering, Science and Technical Leadership Team, supported by independent assurance and specialist safety expertise.
We have significantly enhanced our approach to independent assurance and risk assessment. QinetiQ actively supports collaboration with the MOD and specialist organisations to develop and implement common safety standards and practices.
Our US business continues to use technical excellence to improve and develop the safety and usability of their products.
Sustainable solutions Providing customers with solutions to reduce fuel use can help with cost efficiencies but also meet their sustainability agenda.
Supply chain management and sustainable procurementAt QinetiQ, we believe that our supply chain is an extension of our own organisation, and so we take care in ensuring that it is as committed to the same standards of safety, security and governance as we are.
The goods and services that we procure are largely high-end technology or Commercial Off the Shelf (COTS) products, or high end consultancy and research services. Most of our spend is within our home territories (UK, US and Australia) where instances of bribery, corruption and modern slavery practices are lower than other parts of the world. However, this does not mean that we are complacent. In the UK, we have a very robust approach to supply chain risk, which is now being rolled out across the Group, where appropriate. This includes:
• Supplier vetting for all suppliers for infringement of UN Sanctions
• Robust prequalification of suppliers to an industry set level through a third party
• Risk assessment and third party vetting of high risk spend categories for modern slavery (UK) and human trafficking under US Federal Acquisition Regulations (FAR);
• Robust Terms and Conditions enabling us to take corrective action against suppliers not acting in an ethical manner.
QinetiQ Group plc Annual Report and Accounts 2016 29
Strategic report Governance Financial statements Additional information

Environmental stewardship The challenges of protecting the environment and wildlife, in locations used in the conduct of defence and security related test and evaluation trials, can appear daunting. Our own QinetiQ estate and MOD LTPA sites are located across the UK, with significant marine and land environmental considerations, encompassing European and UK protected areas. The use of structured planning processes, in combination with innovative solutions, robust technology and skilled employees, has enabled the elimination or minimisation of environmental risks from diverse trial activities. The introduction and application of sustainability appraisals (SA) from early in the trial planning phase continues to support prompt identification of potential impacts and careful selection of mitigation measures. Examples include:
• Aberporth: Use of remote visual and acoustic marine monitoring systems for protection of mammals. These measures, together with acoustic deterrent devices (ADD) and physical checks, have provided protection for species including bottlenose dolphins, harbour porpoise and grey seals.
• West Freugh: Trials timed to avoid disturbance of breeding birds and to protect great crested newts.
• Hebrides RAF trial: SA process resulted in agreement for missile airburst detonation instead of at sea surface to reduce any potential sea mammal impacts.
• Hebrides ASD15 trial (page 17): modified existing concrete platform to shelter rocket and launch infrastructure to prevent the risk of damage to the Site of Special Scientific Interest (SSSI) habitat.
The drive and enthusiasm with which our people, guided by a team of skilled environmental professionals, embrace sound environmental practice have contributed to our performance across the year:
• Our waste recycling arrangements and levels have been further enhanced; 84% compared with 76% for FY15.
• Work has been conducted to collect, understand and interrogate water consumption and travel information, with a view to identifying additional improvement programmes.
• We have initiated transition to the new ISO 14001 Environmental Management standard.
• We have made considerable progress in energy management (see page 31).
QinetiQ’s head office site in Farnborough, UK, includes Eelmoor Marsh which was designated a national Site of Special Scientific Interest in 1978 and is a hotspot for biodiversity. Covering more than 79 hectares, Eelmoor Marsh supports more than 400 species of conservation concern across grassland, lowland heath, bog and mire, including six species of insectivorous plants, 11 species of orchid, the rare nail fungus, over a third of Britain’s dragonfly and damselfly species, around 60% of Britain’s butterfly species, four out of six native species of reptile, and bird species including woodlark, nightjar and lapwing. The site forms part of the Thames Basin Heaths Special Protection Area (SPA), notified in 2005 following the arrival of the Dartford Warbler and provides excellent undisturbed habitat for specialist heathland birds. In partnership with British conservation charity Marwell Wildlife we have managed this ecologically sensitive location for over 20 years.
“Our relationship with Marwell Wildlife began in 1995 with the need for conservation grazing but over the 20 years has become much broader and is vital to the success of the project,” says Dr Sam Healy, Group Corporate Responsibility Director, QinetiQ. Highland cattle and endangered Przewalski’s horses are employed to help control scrub and grass encroachment and have become an integral part of long-term restoration of the lowland heath system. One-third of Eelmoor Marsh has already been restored from pine woodland, and 157 survey reports and 17 student projects have been produced creating a wealth of valuable information about this special site. Natural England has confirmed ‘favourable’ condition status across all three units on site.
Employees can also access and enjoy this special place during the week, and experts from Marwell regularly provide guided tours for employees. Employees have volunteered their time to support the project.
Celebrating our 20-year partnership with Marwell WildlifeProtecting and restoring Eelmoor Marsh
© Paul Drane.
Corporate responsibility continued
Environment We integrate care of the environment into our business operations and our delivery of test and evaluation.
QinetiQ Group plc Annual Report and Accounts 201630

Example employee communication as part of Energy Matters
Greenhouse gas emissions and energy managementSaving energy reduces our impact on the environment and makes us more efficient.
The highlight for FY16 was our certification to ISO 50001 (BS EN ISO 50001:2011 Energy Management System) which recognises the systems and processes put in place by the UK organisation to enable us to effectively manage our energy consumption. We will now use the framework established by the introduction of ISO 50001 to continually improve our approach to energy management and strive to embed energy efficiency best practice across the UK business.
As part of this continual improvement, we will be reviewing our energy performance indicators and targets to provide an improvement in the way we measure the success of our energy management activities and projects.
In 2015 we continued our Energy Matters programme, communicating with our people (see below), growing our network of Energy Champions and empowering our Energy Engineers to identify and implement energy saving projects. We continue to submit voluntarily to the Carbon Disclosure Project Climate Change Programme, and are registered for the Carbon Reduction Commitment (CRC) scheme. In 2015 we met the requirements of ESOS (the Energy Savings Opportunity Scheme) through a combination of ISO 50001 Certification and an energy audit report produced by our appointed ESOS Lead Assessor.
Our Group greenhouse gas (GHG) emissions are captured to meet the requirements of the Companies Act 2006 (Strategic report and Directors’ report) Regulations 2013.
2016 2015 2014
Total Scope 1 emissions (tCO2e) 23,183 26,534 27,590
Total Scope 2 emissions (tCO2e) 36,722 39,668 38,371
Total Scope 1 and 2 emissions (tCO2e) 59,905 66,202 65,960
Intensity ratio (tCO2e per £m of revenue) 79 87 55
The table below provides a summary of the Group’s GHG emissions from 1 April 2015 to 31 March 2016, giving a summary of Scope 1 (fuel combustion and operation of facilities) and Scope 2 (purchased electricity) emissions and an intensity ratio (per £m of revenue). We have adopted a financial control approach and have used the Defra 2015 emissions factors.
Our emissions have reduced overall due to more efficient use of our estate. We are on track to meet our target of reducing GHG emissions due to UK energy use by 17% by 2020 from a 2013 baseline. Our GHG data were independently reviewed and next year will be independently verified.
QinetiQ Group plc Annual Report and Accounts 2016 31
Strategic report Governance Financial statements Additional information

Across the Group we have various ways that our people can volunteer and use their skills to make a positive difference to their communities. In the UK and within OptaSense we provide our people with time and access to a bursary. In Australia, a programme called ‘Operation Give Back’ enables employees to volunteer as individuals or in teams for one day a year, and employees in Belgium also volunteer during work time. Because the majority of our people are technical professionals, our focus is our STEM outreach programme with the aim of inspiring the next generation of scientists and engineers. We value our relationships with organisations such as STEMNET, the Arkwright Scholarship Trust, Primary Engineer and the Social Mobility Foundation in the UK and various robotics education programmes in the US.
With a variety of STEM expertise amongst our people, our UK STEM Ambassadors have organised a wide range of outreach events for school children; such as the annual Powerboat Challenge, activities at a number
of our sites for school groups on National Women in Engineering Day, a space themed day to celebrate the launch of Principia: British ESA (European Space Agency) astronaut Tim Peake’s six-month mission to the International Space Station (see case study below), and we have hosted the UK Cyber Security Challenge. QinetiQ’s Space business in Belgium participates in STEM outreach programmes such as Technoteens. QinetiQ is a signatory of the ‘Your Life’ campaign, and our priorities are to encourage our people to take part in STEM outreach programmes, and to ensure that we are reaching more girls. Our non-STEM employees also use their professional skills in the communities where we operate through programmes such as Young Enterprise and they offer mentoring through the Social Mobility Foundation.
Being a good neighbour is an important part of our approach to our communities. Where necessary we have dedicated Community Liaison Officers who engage with local communities on issues such as noise and
public access. The officers have created a number of information channels including web and text services.
In the UK we continue to support our three corporate charities (Cancer Research UK, Help for Heroes and RNLI) by providing matched funding for employee fundraising activities. These charities were voted for by employees and form a five-year partnership with QinetiQ. In the US, employees focus on supporting wounded military and their families by contributions to a range of specialist organisations such as Home Base, a Red Sox (baseball) Foundation and Massachusetts General Hospital program dedicated to healing the invisible wounds of war for Service Members. In Australia, we have agreed a two-year partnership with the Australian War Memorial in Canberra to provide in-kind advisory services and engineering support for aircraft installation projects. Our people can also choose to give to their chosen charity pre-tax through payroll giving in the UK.
Community investmentQinetiQ is committed to having a positive impact in the communities where we operate. A particular focus is contributing our professional skills through employee volunteering. We believe it’s the right thing to do and is one way that we play our part in tackling issues such as youth unemployment and skills shortages, particularly in the area of STEM (Science, Technology, Engineering and Maths).
STEM OutreachInspiring the next generation
Engineers from our Farnborough site welcomed more than 90 pupils from 12 Hampshire and Surrey schools for a special STEM (Science, Technology, Engineering and Maths) event to celebrate the launch of Principia: British ESA (European Space Agency) astronaut Tim Peake’s six month mission to the ISS (International Space Station). The pupils and their teachers were invited to join some of our colleagues and STEM Ambassadors to watch the live launch of Tim Peake and his colleagues in the Soyuz rocket to the ISS. With a team of QinetiQ experts on hand to answer questions about human spaceflight, the pupils learned about the mission and about potential careers in the space industry. The pupils then completed their own challenge to design, build and launch bottle rockets with mentoring from QinetiQ STEM Ambassadors. The teams were judged on their rocket design, teamwork, highest flight and
engineering. Following this, the pupils received a tour of QinetiQ’s space testing facilities.
In addition to hosting this event, as a technology partner with the Raspberry Pi Foundation, our graduates have developed hardware and software for AstroPi. AstroPi is a Raspberry Pi mini-computer loaded with experiments written by UK school children;
the experiments will be performed by Tim Peake while he is on board the ISS and will transmit live data back to Earth. By learning about the real-world applications of STEM subjects with our STEM Ambassadors at outreach activities such as the Principia launch party at Farnborough, and by participating in projects such as AstroPi, our aim is to inspire the next generation of scientists and engineers.
Corporate responsibility continued
QinetiQ Group plc Annual Report and Accounts 201632

Managing corporate responsibility
Our Code of Conduct lays out our ethical standards, providing employees with clear direction and guidance on how we do business across the Group. There are details on ethical decision-making and also how to get help. We regularly update the Code of Conduct and we plan to review it in FY17.
QinetiQ.com/code-of-conduct
Our annual business ethics training is a mandatory requirement for all of our people and supports them in understanding and using the Code of Conduct. The training is also undertaken by our Board and is available for our suppliers and customers. As well as explaining the Code of Conduct, our approach is to provide a number of challenging scenarios to help our people know what to do if they were to come across issues such as bribery, fraud, discrimination, conflict of interest and modern slavery.
Employees are provided with a number of routes to seek help or raise concerns. They are encouraged to talk to a manager if they have a concern and are provided with contact details for our ethics email advice services and our independently run, 24/7 confidential reporting line. We have also communicated with managers to remind them of the need to act if employees come to them with issues. We have provided help and advice in response to all queries received via our ethics email advice services and all communication through the confidential reporting line is appropriately investigated.
Anti-bribery and corruptionBribery is a serious issue across the world and we recognise this is a potential risk to our business. We have a zero-tolerance approach to bribery and corruption and have put in place a range of governance measures. Anti-bribery risk management is embedded in our business processes; we have a process for undertaking due diligence, monitoring and auditing of our use of commercial intermediaries, and we use expert third-party providers of due diligence where appropriate.
We provide more in-depth anti-bribery training for those in higher risk roles, for example those who carry out overseas business. Our anti-bribery programmes are overseen by our Chief Ethics Officers, who are senior executives. We embed the risk of bribery into our international business risk management process. This year we have undertaken a review and update of our procedures associated with commercial intermediaries.
Page 42 – Principal risks and uncertainties
Human rightsQinetiQ recognises that the UN Guiding Principles on Business and Human Rights set a standard of conduct expected of companies. We seek to anticipate, prevent and mitigate potential negative human rights impacts through our policy and process, and through our Code of Conduct and business ethics training for employees, all of which underpin our commitment to responsible business conduct. QinetiQ has policies in place, among others, to support adherence to export controls, health and safety, non-discrimination, anti-bribery and environmental laws and guidance. This is further supported by our procedures on product safety, sustainable procurement, due diligence and risk management. We monitor the application of these policies and procedures through our business assurance processes. We believe that this embedded approach is effective. We have recently implemented a more structured approach to understanding human rights risk within our international business risk management process. We have also been working to improve our approach to human rights risk in the supply chain. We have set up a working group to look at the particular issue of modern slavery and have updated policies and introduced new training and KPIs. Our statement on modern slavery and human trafficking is published on our website.
QinetiQ.com
GovernanceWe have Board and executive level commitment to corporate responsibility through the Group Risk & CSR Committee and this ensures successful delivery of responsible business practice, driven by strong leadership and governance. The Committee receives reports and briefings on all material corporate responsibility issues including business ethics, health and safety, environment, reputational risk and human rights. In QNA, the Proxy Board oversees these activities, obtaining independent assurance on the adequacy of its compliance programmes on an ongoing basis. In FY17 we will be introducing a Business Ethics Committee, chaired by the Chief Ethics Officer and including members of the Executive and the Group Corporate Responsibility Director.
The Group’s policies and management systems underpin our corporate responsibility programmes. In the UK, the business assurance tool provides internal assurance and we have the external certification ISO 14001 for our environmental management system, ISO 50001 for energy management (see page 31), ISO 9001 for our quality management system and OHSAS 18001 for our health and safety management system. Additionally, QNA’s Quality Management System is certified to AS9100C and ISO 9001:2008.
Materiality and engaging with our stakeholdersOur corporate responsibility strategy reflects the material issues for our business – defined by our overall business strategy and taking into account stakeholder priorities. In line with our new vision, strategy and way of working, in FY17 we will be reviewing our priorities. Part of our materiality assessment is understanding the priorities of our stakeholders – primarily customers, investors and employees. This is achieved through regular dialogue such as investor meetings, involvement in the MOD-Industry Sustainable Procurement Working Group and our employee engagement programmes (see page 28). We are actively engaged with industry and trade body working groups on topics such as skills, environment and ethics. We are a Patron Member of the Institute of Corporate Responsibility and Sustainability (ICRS) and have been actively involved in the development of the Institute, in recognition of the importance of supporting and developing the CR profession.
Business ethicsA critical element of winning business, in our home markets and internationally, is that our customers trust us to work in an ethical manner.
QinetiQ Group plc Annual Report and Accounts 2016 33
Strategic report Governance Financial statements Additional information

EMEA ServicesEMEA Services combines world-leading expertise with unique facilities to provide technical assurance, test and evaluation and training services, underpinned by long-term contracts. The most significant of these is the Long Term Partnering Agreement (LTPA) for test, evaluation and training services which has delivered an improved service and significant savings for the MOD over the last 13 years. EMEA Services is also a market leader in research and advice in specialist areas such as C4ISR, weapons and energetics, cyber security and procurement advisory services.
Financial performance Each of the core Air & Space, Maritime, Land & Weapons and Cyber, Information & Training businesses delivered a solid performance in 2016, despite the uncertainty resulting principally from the UK Strategic Defence and Security Review (SDSR) published in November 2015 and budgetary pressures.
Orders grew 7% to £495.4m (2015: £461.6m) driven by the timing of multi-year contract awards (including the £153m five-year UK MOD renewal for aircraft engineering services) with some continued de-scoping and delay to other orders in a challenging market environment.
Revenue was flat on an organic basis at a constant exchange rate, after adjusting for the divestment of Cyveillance Inc, which was sold in December 2015 for net disposal proceeds of £22m. Cyveillance, which had revenues of $18m in FY15, is a former business unit of the US Services division, sold in May 2014, and more recently has been reported in EMEA Services. At the beginning of the new financial year, 77% of EMEA Services’ FY17 revenue was under contract, compared with 80% at the beginning of the prior year.
Underlying operating profit* increased 1% to £93.8m (2015: £93.0m) assisted by a credit of approximately £3m due to the resolution of a historical overseas exposure.
Year in reviewAir & SpaceWith technology developments increasingly blurring boundaries between air and space systems, our Air & Space businesses were combined on 1 April 2016 to increase collaboration in our engineering capabilities to de-risk complex aerospace programmes.
The business is working in partnership with the MOD and the supply chain to implement a new model to transform the provision of aircraft test and evaluation. During the year, it was awarded two single source contract renewals under this new model, worth a combined £153m over five years, to deliver technical services to fast jets and heavy lift aircraft. This represents a new way of working under which we are measured and paid on results and outputs, not inputs, improving long-term planning, providing better visibility, and delivering considerable savings to the MOD. This award complements a £13m contract to assist the MOD in bringing the Delta Test variant of the A400M Atlas into UK service, and a £5m contract to evaluate flight control system upgrades to Boeing’s Chinook helicopter.
In international markets, the Air & Space business was awarded a five-year extension to the contract under which it manages and assists in the delivery of training at the Swedish Flight Physiological Centre. It is also developing the gridded ion engine electric propulsion systems for the flight module to be used on the European Space Agency’s BepiColombo mission to Mercury. Significant resources are being deployed by all parties to ensure the mission meets the planned launch date which has been deferred to 2018. The business delivers turnkey services for customers using Remotely Piloted Air Systems
(RPAS) to meet growing demand particularly from international organisations such as the United Nations.
Following the opening of the Snowdonia Aerospace Centre at Llanbedr in Wales, it successfully demonstrated the use of RPAS in tackling environmental issues in a project for the Welsh Government.
Maritime, Land & Weapons The Maritime, Land & Weapons business was created on 1 April 2016 combining businesses with a strong focus on test and evaluation at a time when customers are increasingly undertaking more complex, multi-domain trials. The new business will deliver operational advantage to customers by providing independent research, evaluation and training services.
In the weapons domain, the business is a leading provider of independent research on weapons and energetics, coordinating the MOD’s conventional weapons research programme through its leadership of the Weapons Science and Technology Centre. During the year it was also awarded a new research framework contract for trials, testing and analysis in cyber and electronic warfare, a five-year contract to provide advice to the MOD on military batteries and a four-year contract to provide advice to NATO, contracts which all demonstrate confidence in QinetiQ as a long-term partner. In addition to research and advice, core capabilities include test and evaluation, delivered mainly under the LTPA, and targets services. In October 2015, the business led a team from across QinetiQ to deliver an international at sea demonstration at the Hebrides range, the largest in Europe.
Assumption2016
£m2015
£m
Orders(1) 495.4 461.6
Revenue 616.4 625.6
Underlying operating profit* 93.8 93.0
Underlying operating margin* 15.2% 14.9%
Book to bill ratio(1) 1.2x 1.1x
Funded backlog(1) 719.1 678.6
* Definitions of underlying measures of performance can be found in the glossary on page 149.(1) Excludes the £998m third term of the LTPA contract. B2B ratio is orders won divided by revenue recognised,
excluding the LTPA contract.
QinetiQ Group plc Annual Report and Accounts 201634
Operating review

Global ProductsGlobal Products delivers innovative solutions to meet customer requirements and undertakes contract-funded research and development, developing intellectual property in partnership with key customers and through internal funding with potential for new revenue streams.
Financial performance Orders grew 8% to £164.4m (2015: £152.0m) as a result of a new pipeline contract for OptaSense and due to improved order flow in QinetiQ North America. As a result, the Global Products division had 64% of its FY17 revenue already under contract at the beginning of the new financial year compared with 61% at the same time last year.
Revenue was up slightly to £139.3m (2015: £138.2m) as a result of currency movements but underlying operating profit* fell to £15.1m (2015: £18.3m), impacted by a reduction in income from the oil and gas sector and the completion of certain programmes in the prior year. The underlying operating profit margin* was 10.8% (2015: 13.2%).
The exercise attracted nine ships from eight nations, culminating in the first ever launch of a ballistic rocket into space from the UK and its subsequent engagement by an SM3 missile launched by a US guided missile destroyer. As a result, the business is now pursuing opportunities for further combat scenario training and inter-operability testing involving customers from many nations. It also undertook testing of the latest helicopter-borne Infra-Red Threat Warning System in live rocket and gunfire scenarios.
Sustaining and growing its core technical advice and design support services to the UK Royal Navy is a strategic priority for the Maritime, Land & Weapons business, and during the year it was awarded a new contract to deliver acceptance trials for the four new MARS class tankers. The business also resolved urgent operational issues to enable ships to deploy and be effective in theatre including improving the hydrodynamic efficiency of Type 23 frigates by optimising the design of the propeller and hull, enabling the Royal Navy to realise potential fuel savings across its fleet. It also delivered a container-based combat system for close-in defence against Fast Inshore Attack Craft offering a new, flexible solution for the self-protection of support ships. The business is pursuing selected growth campaigns with a focus on emerging technologies such as autonomous systems. During the year, it won a number of autonomy-related contracts, including support to the Royal Navy to deliver the Unmanned Warrior exercise in October 2016 which will demonstrate the use of autonomous systems in a wide range of scenarios. QinetiQ’s role also includes the delivery of a containerised command system to control multiple unmanned systems.
Cyber, Information & TrainingThe CIT business helps government and commercial customers respond to ever-evolving threats based on its expertise in training, secure communication networks and devices, intelligence gathering and surveillance sensors, and cyber security.
Although competition is fierce, the UK SDSR and the focus on counter-terrorism are likely to drive increases in budgets for C4ISR and cyber security. The CIT business is the MOD’s leading supplier of C4ISR research, maintaining its research revenues during the year and winning new work to improve information systems for deployed headquarters. The business manages a network of more than 100 UK SMEs through these research framework contracts, fulfilling an ‘innovation integrator’ role that is becoming more and more important in defence and other sectors. Large framework contracts are being used increasingly for the delivery of technology services and during the year the business was awarded a position with Northrop Grumman on a seven-year framework contract to deliver cyber security support to the UK Government. It also won a contract with Motorola Solutions to provide monitoring, assessment and assurance services in support of the delivery of the UK Emergency Services Network.
Outside its traditional markets, CIT is providing advice to regional and local government customers on innovation initiatives to support local business growth, and is delivering training and simulation services to customers in North America, Europe and the Middle East. Finally, the business is providing secure receiver processing for the encrypted Public Regulated Service (PRS) on the Galileo
constellation of satellites – the European Union version of GPS which goes live in 2017. During the year it launched a new receiver that will utilise the PRS service for use by governments, the military and emergency services across Europe.
InternationalOn 1 April 2016, a new International business was established incorporating businesses with a significant international footprint and those with international potential, as well as to manage other opportunities via our international offices. The business includes QinetiQ Australia as well as Advisory Services (previously known as Procurement Advisory Services).
The Australian business provides impartial advice and services predominately to government customers. This year, the business successfully agreed with the Australian Department of Defence, the renewal for up to 15 years of the Aircraft Structural Integrity (ASI) services contract for a minimum value of A$21m, which supports the airworthiness of military aircraft. This is one of two underpinning contracts for the Australian business, which position it well for ‘strategic partner’ style contracts that the Australian Government is using increasingly as it implements its recapitalisation and defence acquisition reform programmes.
Advisory Services helps customers deliver complex programmes by providing analytical services and the evidence required to make complex decisions. Building on its strong record in the UK, the business won a major contract to provide early stage advice and business case support to a Middle Eastern client for a complex engineering project.
Assumption2016
£m2015
£m
Orders 164.4 152.0
Revenue 139.3 138.2
Underlying operating profit* 15.1 18.3
Underlying operating margin* 10.8% 13.2%
Book to bill ratio 1.2x 1.1x
Funded backlog 139.1 116.7
* Definitions of underlying measures of performance can be found in the glossary on page 149.
QinetiQ Group plc Annual Report and Accounts 2016 35
Strategic report Governance Financial statements Additional information

Year in reviewQinetiQ North America QinetiQ North America develops and produces innovative military protection products, specialising in unmanned systems, survivability and maritime systems, along with products in related commercial markets. The performance of this business improved in year as it continued to adapt to a defence funding environment that has shifted markedly from the overseas contingency operations associated with Iraq and Afghanistan. QinetiQ North America is the world’s leading provider of military robots with employees centred in Massachusetts, Pennsylvania and Virginia. Activity in year focused on the reset and recapitalisation of robots previously used on operations and the upgrade of systems with new capabilities such as the detection of CBRNE (chemical, biological, radiological, nuclear, and explosives). At the same time, the business is preparing for multi-year Programs of Record which will be funded out of the Department of Defense’s base budget.
During the year the business announced a contract win valued at $16m from General Atomics in San Diego, California to deliver control hardware and software for the Electromagnetic Aircraft Launch System (EMALS) and the Advanced Arresting Gear (AAG) to be installed on the Navy’s next aircraft carrier, the future John F. Kennedy (CVN 79). It was also awarded orders for survivability products for both US and international customers, with demand for air and ground armour increasing in year. In addition to product sales, QinetiQ North America is building on its base of contract-funded R&D projects to drive technology development, explore new customer problems and expand its competitive offerings.
OptaSenseOptaSense is a Distributed Acoustic Sensing (DAS) business operating in multiple vertical markets. During the year, Jamie Pollard was appointed to be its CEO after more than 20 years running large global businesses at oilfield services company Schlumberger. An OptaSense advisory board has also been established, comprising senior industry specialists to provide domain expertise in key target markets including Hansjorg Hess, a former Executive Director of Deutsche Bahn Netze. Although growth in the upstream oil and gas market has been constrained by the low oil price, the product development agreement with Shell continues to deliver significant technical progress and a fourth generation OptaSense system was launched in year. The business also signed a strategic marketing agreement with Weatherford, an oil and gas service company with a presence in every major oil and gas region of the world. The partnership will deliver enhanced data acquisition and monitoring of seismic activity, well construction, completion and fracture operations, and production flow.
OptaSense continues to make progress in infrastructure security, winning a contract with a partner to deliver the world’s largest distributed fibre sensing project for the Trans-Anatolian Natural Gas Pipeline (TANAP) that runs from Azerbaijan, through Georgia and Turkey, to Europe. The total contract value is more than $30m, of which approximately half has been contracted with OptaSense, and will cover the protection of over 1,850km of pipeline. The business also won a contract to monitor a further 500km of gas pipeline in India. At the end of September, OptaSense successfully completed an 18-month development project with Deutsche Bahn, which concluded that DAS technology has the potential to significantly reduce the cost of sensing in the rail industry. It also won a contract with a Class 1 US Railroad operator to deliver a software platform in preparation for a wider rollout of DAS technology.
Space Products QinetiQ’s Space Products business, which provides satellites, payload instruments, sub-systems and ground station services, delivered several innovative projects during the year. In March, the European Space Agency’s (ESA’s) ExoMars mission was launched, containing QinetiQ’s UHF transceiver which will transmit data from the lander on the planet’s surface back to Earth via a satellite orbiting Mars.
The project will pave the way for a second mission, recently rescheduled to 2020, in which a rover will spend six months analysing Mars’s environment for signs of life. The business is currently developing the computer and avionics for ESA’s Proba 3 satellites, to be launched in 2019 to study the Sun.
EMEA Products EMEA Products provides research services and bespoke technological solutions developed from intellectual property spun out from EMEA Services. QinetiQ makes an important contribution to sovereign UK capability in advanced materials technology, and during the year it renewed a five-year, £10m contract to provide materials research and advice to the UK MOD. This capability underpins ongoing commercial relationships with EDF Energy for the development of stealth wind turbines. QinetiQ also became the first company accredited and authorised by the French Government to assess proposed wind farm impact on meteorological radars, in order to speed up planning applications. Other orders received in year included a contract with the US Defense Advanced Research Projects Agency (DARPA) to develop an electric hub-drive that will improve survivability and mobility of future military ground vehicles. The contract, worth $2m with an option for a further $3m, is part of DARPA’s Ground X-Vehicle Technologies (GXV-T) programme.
Subsidiaries Boldon James and Commerce Decisions are reported in EMEA Products. Boldon James, which provides data classification solutions to large military and commercial organisations, had a strong year and should see further opportunities following changes to European Union regulations that introduce significant penalties for data classification leaks. Commerce Decisions renewed its agreement with the MOD for the provision of tender assessment and procurement support software. It also won the first contract through its Australian arm and was selected to deliver bid evaluation criteria for the Canadian Surface Combatant programme which will be used to assess warship designers and combat system integrators.
QinetiQ Group plc Annual Report and Accounts 201636
Operating review continued

UK
Unmanned WarriorThe UK Defence Science and Technology Laboratory (Dstl) has awarded QinetiQ a £4.2m contract to deliver a command and control demonstration of coordinating multiple unmanned vehicles. This will see landmark new systems deployed during the Royal Navy’s Unmanned Warrior showcase in October 2016, with demonstrations including a comparison of mine countermeasures by manned and unmanned craft. This showcase takes place alongside the Joint Warrior exercise, with QinetiQ facilities and expertise supporting a wide range of activities.
Leading the way in maritime autonomy Anticipating the critical role of autonomy in future maritime operations, QinetiQ established its Maritime Autonomy Centre two years ago to support customers in the design, integration, test and evaluation of these emerging systems. “We deliver the innovation, expertise and facilities that help our customers to lead the way in this increasingly important sector,” says Bill Biggs, Campaign Leader Maritime Management. The centre won new business valued at more than £6.5m in its first year of full operation.
Groundbreaking technology Unmanned Warrior will involve more than 60 unmanned vehicles from 40 organisations operating in the challenging waters and airspace of northwest Scotland. Leading a team that comprises BAE Systems, Thales Group and SeeByte, our experts are developing a solution to integrate unmanned systems from multiple suppliers. “The objective is to minimise the number of screens and controls needed to conduct missions, so improving efficiency and mitigating the risk of human error by reducing the burden on operators,” Biggs adds. Using QinetiQ facilities near the Isle of Skye and Hebrides, this groundbreaking work will provide two systems for Defence Equipment and Support (DE&S) and Dstl: one in a surveillance role and the other supporting underwater mine countermeasures.
Commander Peter Pipkin, Royal Navy – “This is an important part of showing the true potential of unmanned systems. Being able to demonstrate the end-to-end flow of information to enable better decision-making is key and an important enabler for our demonstrations.”
Leading the way in maritime autonomy
Strategic report Governance Financial statements Additional information
QinetiQ Group plc Annual Report and Accounts 2016 37

“Another strong year of operational cash flow has enabled us to announce the return of a further £50m to shareholders, whilst retaining a strong balance sheet in line with our capital allocation policy.”
Financial highlights
• Stable performance from EMEA Services in challenging markets, with flat revenue on an organic basis
• EMEA Services orders growth driven by the timing of multi-year contract awards (including the £153m five-year UK MOD renewal for aircraft engineering services awarded in H2 FY16), with some continued de-scoping and delay to other orders
• Global Products performance stabilising despite the reduction in demand for US conflict-related products
• Further strengthening of the balance sheet with net cash of £274.5m at 31 March 2016 (2015: £195.5m) and continued strong operating cash conversion performance
• Full year dividend of 5.7p, 6% growth on prior year
• Completed the £150m share buyback programme and announced a new £50m programme in November 2015
• Disposal of non-core Cyveillance business for net cash proceeds of £22m
• Published clear capital allocation policy
Revenue
£755.7m2015: £763.8m
Underlying operating profit*
£108.9m2015: £111.3m
Underlying earnings per share*
16.3p2015: 15.2p
Organic change in revenue
( 1%)2015: (2%)
Underlying operating margin*
14.4%2015: 14.6%
* Definitions of specific adjusting items and underlying measures of performance can be found in the glossary on page 149.
Dividend per share
5.7p 2015: 5.4p
A strong balance sheet and a clear capital allocation policy
Chief Financial Officer’s review
QinetiQ Group plc Annual Report and Accounts 201638
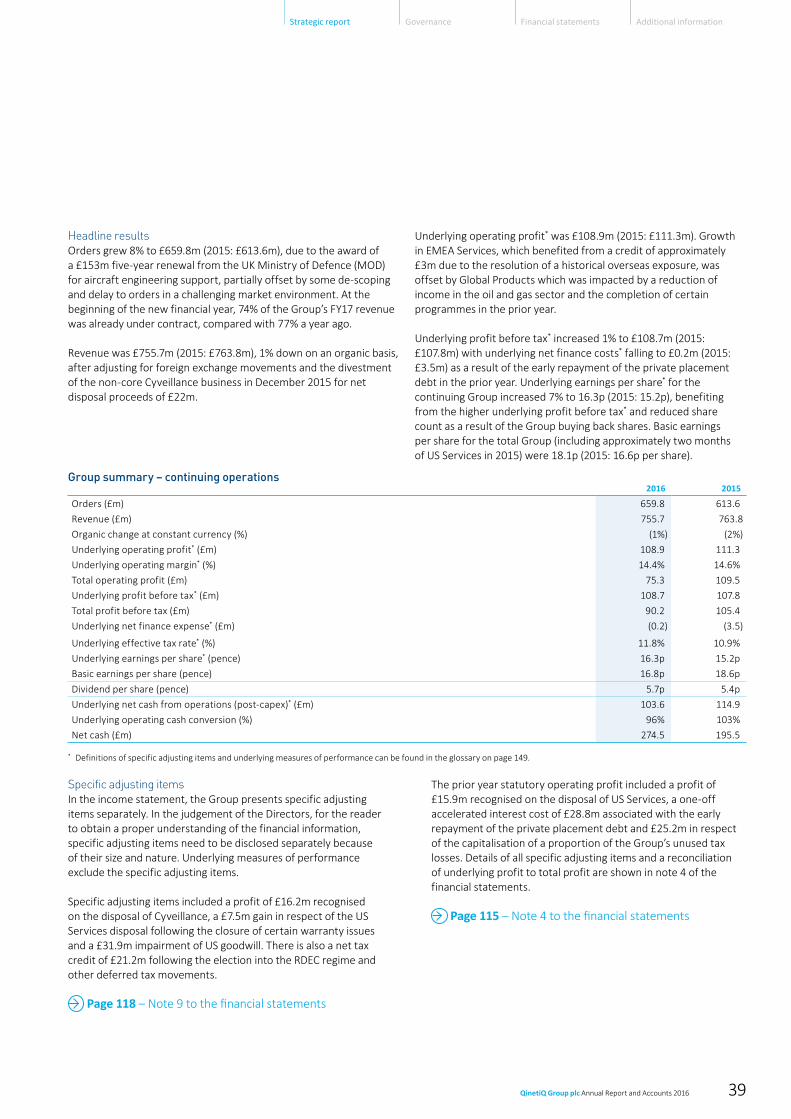
Group summary – continuing operations2016 2015
Orders (£m) 659.8 613.6
Revenue (£m) 755.7 763.8
Organic change at constant currency (%) (1%) (2%)
Underlying operating profit* (£m) 108.9 111.3
Underlying operating margin* (%) 14.4% 14.6%
Total operating profit (£m) 75.3 109.5
Underlying profit before tax* (£m) 108.7 107.8
Total profit before tax (£m) 90.2 105.4
Underlying net finance expense* (£m) (0.2) (3.5)
Underlying effective tax rate* (%) 11.8% 10.9%
Underlying earnings per share* (pence) 16.3p 15.2p
Basic earnings per share (pence) 16.8p 18.6p
Dividend per share (pence) 5.7p 5.4p
Underlying net cash from operations (post-capex)* (£m) 103.6 114.9
Underlying operating cash conversion (%) 96% 103%
Net cash (£m) 274.5 195.5
* Definitions of specific adjusting items and underlying measures of performance can be found in the glossary on page 149.
Specific adjusting itemsIn the income statement, the Group presents specific adjusting items separately. In the judgement of the Directors, for the reader to obtain a proper understanding of the financial information, specific adjusting items need to be disclosed separately because of their size and nature. Underlying measures of performance exclude the specific adjusting items.
Specific adjusting items included a profit of £16.2m recognised on the disposal of Cyveillance, a £7.5m gain in respect of the US Services disposal following the closure of certain warranty issues and a £31.9m impairment of US goodwill. There is also a net tax credit of £21.2m following the election into the RDEC regime and other deferred tax movements.
Page 118 – Note 9 to the financial statements
The prior year statutory operating profit included a profit of £15.9m recognised on the disposal of US Services, a one-off accelerated interest cost of £28.8m associated with the early repayment of the private placement debt and £25.2m in respect of the capitalisation of a proportion of the Group’s unused tax losses. Details of all specific adjusting items and a reconciliation of underlying profit to total profit are shown in note 4 of the financial statements.
Page 115 – Note 4 to the financial statements
Headline resultsOrders grew 8% to £659.8m (2015: £613.6m), due to the award of a £153m five-year renewal from the UK Ministry of Defence (MOD) for aircraft engineering support, partially offset by some de-scoping and delay to orders in a challenging market environment. At the beginning of the new financial year, 74% of the Group’s FY17 revenue was already under contract, compared with 77% a year ago.
Revenue was £755.7m (2015: £763.8m), 1% down on an organic basis, after adjusting for foreign exchange movements and the divestment of the non-core Cyveillance business in December 2015 for net disposal proceeds of £22m.
Underlying operating profit* was £108.9m (2015: £111.3m). Growth in EMEA Services, which benefited from a credit of approximately £3m due to the resolution of a historical overseas exposure, was offset by Global Products which was impacted by a reduction of income in the oil and gas sector and the completion of certain programmes in the prior year.
Underlying profit before tax* increased 1% to £108.7m (2015: £107.8m) with underlying net finance costs* falling to £0.2m (2015: £3.5m) as a result of the early repayment of the private placement debt in the prior year. Underlying earnings per share* for the continuing Group increased 7% to 16.3p (2015: 15.2p), benefiting from the higher underlying profit before tax* and reduced share count as a result of the Group buying back shares. Basic earnings per share for the total Group (including approximately two months of US Services in 2015) were 18.1p (2015: 16.6p per share).
QinetiQ Group plc Annual Report and Accounts 2016 39
Strategic report Governance Financial statements Additional information
Chief Financial Officer’s review continued
Finance costsNet finance costs were £1.3m (2015: £4.1m) following the pay down of the US private placement debt in the prior year. The underlying net finance costs* were £0.2m (2015: £3.5m), with an additional £1.1m (2015: £0.6m) in respect of the pension net finance expense reported within specific adjusting items.
TaxationUK Group companies have now elected to obtain tax benefits in respect of allowable R&D expenditure through the R&D Expenditure Credit (‘RDEC’) process rather than through the previous treatment as a super-deduction in the tax computations. This election was made retrospectively back to 1 April 2013 and the incremental impact on the tax expense for the years ending 31 March 2014 and 31 March 2015 has been reported in the current year as a specific adjusting item. The change of regime results in the utilisation of previously capitalised UK trading losses and the associated deferred tax asset has been charged to the income statement.
Page 118 – Note 9 to the financial statements
Deferred tax has been calculated using the enacted future statutory tax rates.
At 31 March 2016, the Group had unused tax losses of £154.8m (2015: £291.6m) which are potentially available for offset against future profits. £26.1m of these losses are time limited of which £6.3m will expire in 2034 and £19.8m will expire in 2035. Certain UK tax losses had been recognised on the balance sheet as at 31 March 2015 as a deferred tax asset of £25.2m. As noted above, those tax losses have now been utilised following the election into the RDEC regime. No deferred tax asset is recognised in respect of the remaining tax losses due to uncertainty over the timing and extent of their utilisation.
Factors affecting future tax chargesThe effective tax rate continues to be below the UK statutory rate, primarily as a result of the benefit of research and development expenditure credits in the UK. The effective tax rate is expected to remain below the UK statutory rate in the medium term, subject to the impact of any tax legislation changes, the geographic mix of profits and the assumption that the benefit of net R&D tax relief retained by the Group remains in the tax line.
Earnings per shareUnderlying basic earnings per share* for the continuing Group were 16.3p (2015: 15.2p), benefiting from the higher profit before tax and the reduced share count, as a result of the Group buying back shares. Basic earnings per share for the total Group were 18.1p (2015: 16.6p per share). The average number of shares in issue during the year, as used in the basic earnings per share calculations, net of treasury shares, was 587.0m (2015: 630.9m), and there were 586.7m shares in issue at the year end.
Cash flowThe Group’s cash flow from operations before cash flows in respect of specific adjusting items but after capital expenditure was £103.6m (2015: £114.9m). Underlying operating cash conversion* remained strong at 96% (2015: 103%).
At 31 March 2016, net cash was £274.5m (2015: £195.5m), reflecting continued strong operating cash performance, the £22m proceeds from the disposal of Cyveillance and non-recurring net tax receipts totalling £28m relating to the impact of the regime change to R&D tax credits and the associated surrender of UK trading losses. Total committed facilities available to the Group at year end amounted to £235.6m (2015: £233.3m). This is made up of a revolving credit facility of £235.6m (2015: £233.3m), which is currently undrawn.
Capital allocation Priorities for capital allocation are: 1. Organic investment complemented by bolt-on acquisitions where
there is a strong strategic fit, 2. The maintenance of balance sheet strength, 3. A progressive dividend, and 4. The return of excess cash to shareholders. DividendThe Board proposes a final dividend of 3.8p (2015: 3.6p) making the full year dividend 5.7p (2015: 5.4p). Subject to approval at the Annual General Meeting, the final dividend will be paid on 2 September 2016 to shareholders on the register at 5 August 2016. The full year dividend represents an increase of 6% reflecting the Group’s progressive dividend policy.
* Definitions of specific adjusting items and underlying measures of performance can be found in the glossary on page 149.
QinetiQ Group plc Annual Report and Accounts 201640

Treasury policyThe Group treasury department works within a framework of policies and procedures approved by the Audit Committee. As part of these policies and procedures, there is strict control on the use of financial instruments. Speculative trading in financial instruments is not permitted. The policies are established to manage and control risk in the treasury environment and to align the treasury goals, objectives and philosophy of the Group.
PensionsThe net pension deficit under IAS19 (revised), before deducting deferred tax, was £37.7m (2015: £39.4m). The decrease in the net pension deficit is primarily driven by cash contributions into the scheme, partially offset by a net actuarial loss arising from changes to financial assumptions.
The market value of the assets at 31 March 2016 was £1,410.4m (2015: £1,454.6m) and the present value of scheme liabilities was £1,448.1m (2015: £1,494.0m).
The key assumptions used in the IAS19 valuation of the scheme were:
Assumption 2016 2015
Discount rate 3.4% 3.2%
Inflation – CPI 2.1% 2.1%
Life expectancy – male (currently aged 40) 91 91
Life expectancy – female (currently aged 40) 93 93
Each assumption is selected by the Group in consultation with the company actuary and takes account of industry practice amongst comparator listed companies. The sensitivity of each of the key assumptions is shown in the table below.
Assumption Change in assumption
Indicative effect on scheme liabilities
(before deferred tax)
Discount rate Increase/decrease by 0.1%
Decrease/increase by £27m
Inflation Increase/decrease by 0.1%
Increase/decrease by £25m
Life expectancy Increase by 1 year Increase by £36m
The latest triennial valuation of the scheme was a net surplus of £31.0m as at 30 June 2014. The triennial valuations are calculated on a funding basis and use a different set of assumptions, as agreed with the pension Trustees. Given the extremely low gilt yields, a funding valuation of the scheme would probably have resulted in a bigger net deficit than the IAS19 methodology if one had been performed at the year end.
There has been no change to the cash contributions required under the recovery plan, which continues to require £13m of company contributions per annum until 31 March 2018.
Foreign exchange risk managementThe principal exchange rates affecting the Group were the sterling to US dollar exchange rate and the sterling to Australian dollar exchange rate.
Assumption 2016 2015
£/US$ – opening rate 1.49 1.67
£/US$ – average rate 1.50 1.63
£/US$ – closing rate 1.44 1.49
£/A$ – opening rate 1.95 1.80
£/A$ – average rate 2.05 1.85
£/A$ – closing rate 1.87 1.95
The Group’s income and expenditure is largely settled in the functional currency of the relevant Group entity, mainly sterling or US dollar. The Group has a policy in place to hedge all material transaction exposure at the point of commitment to the underlying transaction. Uncommitted future transactions are not routinely hedged. The Group continues its practice of not hedging income statement translation exposure.
Tax risk managementQinetiQ’s tax strategy is to ensure compliance with all relevant tax legislation, wherever we do business, whilst managing our effective and cash tax rates. Tax is managed in alignment with our corporate responsibility strategy in that we strive to be responsible in all our business dealings. These principles are applied in a consistent and transparent manner in pursuing the Group’s tax strategy and in all dealings with tax authorities around the world.
Accounting standardsAs a UK-listed company, the Group is required to adopt EU endorsed IFRSs and comply with the Companies Act 2006. The effect of changes to financial reporting standards in the year is disclosed in note 1 to the financial statements.
Critical accounting estimates and judgements A description and consideration of the critical accounting estimates and judgements made in preparing these financial statements is set out in note 1 to the financial statements.
David Mellors Chief Financial Officer 26 May 2016
QinetiQ Group plc Annual Report and Accounts 2016 41
Strategic report Governance Financial statements Additional information

Principal risks and uncertainties
Understanding and managing our risks
The Board recognises that QinetiQ operates in varied business environments and that risk management must reflect both the need to take risk and to avoid harm. The Board is accountable for effective risk management across the Group and Board level oversight is discharged through two committees, the Audit Committee, which focuses on risks where the primary impact is financial, and the Risk & CSR Committee, which focuses on risks where the primary impact is non- financial; both committees retain visibility of both the financial and non-financial risks. The reports of the Audit Committee and Risk & CSR Committee can be found on pages 70 to 77. Details of the Group’s system of risk management and internal control can be found in the Corporate governance statement on pages 64 to 77.
The Board agrees and reviews its tolerance of risk through establishing a clear risk appetite and setting appropriate delegations of authority to the executive and senior leaders. The Board’s risk appetite is set to provide boundaries and guidance to support executives and senior leaders in their decision-making and allow operational flexibility.
Establishing the context
Mon
itor
and
revi
ew
Risk treatment
Risk assessment
Risk analysis
Com
mun
icat
ion
and
cons
ulta
tion
Risk identification
Risk evaluation
Managing our risks
QinetiQ Group plc Annual Report and Accounts 201642

Our areas of risk Local decision-making is supported within defined delegation of authority and the Board requires all employees to abide by relevant legal requirements as a minimum. The Board recognises that some risks may be affected by factors outside the control of the company.
Risk appetite within QinetiQ focuses on those critical risk areas necessary to achieve our strategic goals. The risk appetite is articulated by defining three categories of appetite which describe the balance of scrutiny and mitigation activity against likely benefit or reward.
The three categories are:
• Eager: Willing to consider all delivery options and eager to be innovative and to choose options offering potentially higher business rewards, with a mature understanding of inherent risk, less investment in mitigation and control is accepted.
• Balanced: Preference for delivery options that have a low or moderate degree of residual risk and where successful delivery also provides an acceptable level of reward and value for money.
• Cautious: Avoidance of risk and uncertainty is the key objective, a greater level of control and mitigation may be required. Significantly greater returns expected for commercial opportunities to offset risk.
These three categories are then used within the context of the business strategy to define the Board’s commercial appetite as:
• Eager for opportunities relating to increased market share where we have proven delivery, existing and potential new customers.
• Balanced for opportunities that translate proven delivery into new markets or new capability/delivery into existing customers.
• Cautious for opportunities that involve new capability or delivery into new markets and any opportunity into a new country outside the US and UK.
The Board agrees and reviews its tolerance of risk through appropriate delegations of authority to the Executive and senior leaders.
The management of risk is key to ensuring QinetiQ is successful in delivering its objectives, whilst protecting the interests of its stakeholders. QinetiQ’s risk management methods and processes provide a framework which allows:
• Risk identification: identification of risks and opportunities relevant to the Group’s objectives.
• Risk analysis: assessment of risks in terms of likelihood and impact.
• Risk evaluation: determine and prioritise which risks need treatment.
• Risk treatment: appropriate management strategies put in place.
• Monitor and review: monitoring and oversight of risk management.
The Group Risk Register consists of material risks relating to effective delivery of our strategy. These risks may emerge as standalone risks or be present through the aggregation or interlinking of risks. Our reputation is a highly valuable asset and reputational impact is considered as a factor in assessing overall risk impact. The Group Risk Register is reviewed by the Executive and the Board. In addition, the risk owners present to them an update of current status and mitigating actions by rotation throughout the year. The Board recognises that however good the risk management processes are they cannot provide absolute assurance and unknown risks may manifest without warning; the company has processes in place to deploy appropriate management to such risks.
Risks relatingto strategy:
• Defence and security spending
• Complex market characteristics and contract profile
• Trading in a global market
• Business transformation
Risks relatingto people:
• Recruitment and retention
• Breaches of security and IT systems failure
• Significant breach of relevant
laws and regulations
Risks relating to financialmanagement and markets:• Defined benefit pension obligations
• Changes in tax legislation
• Defined benefit pension obligations
1
2
3
QinetiQ Group plc Annual Report and Accounts 2016 43
Strategic report Governance Financial statements Additional information

Principal risks and uncertainties continued
Key risk Description, link to strategy and impact Mitigation Associated KPIs
Responsibility Risk appetite
Likelihood/ impact
Defence spending
• Any reduction in government defence and security spending in either the UK or the US could have an adverse impact on the Group’s financial performance. 70% of the Group’s revenue comes directly from contracts held with the UK Government and 7% directly from contracts with the US Government.
• The financial burden on both UK and US Government budgets from economic downturn may lead to reduced spending in the markets in which the Group operates.
• However, the 2015 Strategic Defence and Security Review confirmed that defence spending (which may include some spending from Departments other than the MOD) would remain at least 2% of GDP, and that the MOD Budget would rise slightly in real terms over the next ten years. The MOD has ambitious plans to plug capability gaps which require significant budget cuts elsewhere, including a reduction in civilian posts of up to 30% and a reduction in MOD estate of 30%. These cuts could impact QinetiQ’s core support contracts. The Group’s main contracts are exposed to spend on test and evaluation, and research and technology.
• QinetiQ North America (approximately £60m annual revenue) has been largely funded through overseas contingency budgets which have declined in recent years.
• Our focus on a range of markets in aerospace, defence and security as well as adjacent sectors provides a degree of portfolio diversification. The Group will continue to monitor expenditure changes in its traditional markets and will adjust business activities where appropriate.
• The MOD has made considerable progress in balancing its budget. In defence research, where QinetiQ is the private sector market leader, spending appears to have stabilised at 1.2% of the UK defence budget.
• QinetiQ monitors and responds to potential opportunities arising from the MOD’s actions to deliver improved value for money by making proactive proposals that deliver the desired outcome.
• Further investment in the pursuit of international opportunities assists in the diversification away from the dependency on UK and US Government spending.
• US Products (such as unmanned systems) are targeted to be funded though Programs of Record (ie in the US Base budget) over the next two years.
• Customer satisfaction
• Underlying operating profit
• Underlying operating cash flow
• Group Director Business Development
Eager Medium/High
Complex Market Characteristics
• The aerospace, defence and security markets are highly competitive. The Group’s performance may be adversely affected should it not be able to compete in the markets in which it aims to operate.
• The Single Source Regulations Office (SSRO) has confirmed the baseline profit rate for new single source defence contracts is 8.95% for FY17 (FY16: 10.6%) and that over the course of FY17 it will consult again and develop the methodology for calculating the baseline profit rate in future years, potentially introducing multiple profit rates. This baseline rate acts as the starting point for agreeing the profit rates of new and renewed contracts, and suppliers can both under and over-perform the contracted rate depending on, for example, risk, capital servicing and project execution. Further updates and clarifications are expected to be published by the SSRO on other topics affecting QDCs, eg allowable cost. Our combination of capabilities is unique in the UK and, consequently, approximately 70% of total EMEA Services revenue is derived from single source contracts, including the non-tasking element of the Long Term Partnering Agreement (LTPA). We anticipate that the majority of our single source revenue will fall under the regulations within approximately three years.
• The timing of the orders receipt could have a material impact on the Group’s performance in a given reporting period as the amounts payable under some government contracts can be significant.
• Some of the Group’s revenue is derived from contracts that have a fixed price. There is a risk that the costs required for the delivery of a contract could be higher than those agreed in the contract as a result of the performance of new or developed products, operational over-runs or external factors. Any significant increase in costs which cannot be passed on to a customer may reduce the profitability of a contract or even result in a contract becoming loss making.
• Some of the Group’s contracts have terms, not unusual in defence, that provide for unlimited liabilities for the Group, or termination rights for the customer.
• QinetiQ seeks to focus on areas within these markets in which its deep customer understanding, domain knowledge, technical expertise and platform independence provide a strong proposition and a significant advantage in competitive bidding.
• QinetiQ and defence industry partners have been fully engaged with the MOD in the development of the new framework and its practical application. QinetiQ and defence industry partners expect to be consulted by the SSRO on the Statutory Guidance.
• QinetiQ is supporting an industry review of the profit rate methodology prior to the consultation on the changes for 2017. The baseline profit rate is the starting point for profitability on single source contracts – other factors include capital servicing, risk and project execution.
• The contracts and orders pipeline is regularly reviewed by senior operational management.
• The nature of many of the services provided under fixed-price arrangements is often for a defined amount of effort or resource rather than firm deliverables and, as a result, mitigates the risk of costs escalating. The Group ensures that its fixed-price bids and projects are reviewed for early detection and management of issues which may result in cost over-run or excessive delivery risk.
• Underlying operating profit
• Underlying operating cash flow
• Customer satisfaction
• Group Director Business Development
Balanced Medium/High
• Organisational Conflicts of Interest (OCI) may occur where the Group provides services to both a defence end-user customer as well as those within the defence supply chain.
• QinetiQ takes proactive steps to manage any potential OCI and maintain its ability to provide independent advice. QinetiQ operates under the generic formal compliance regime and applies a rigorous compliance process.
• Where QinetiQ wishes to operate on both the advice and supply chain side of an opportunity we do so only after receiving approval from the MOD.
• Customer satisfaction
• Group General Counsel & Company Secretary
• Compliance Implementation Director
Balanced Low/Medium
• The Group is reliant on a limited number of major customers.
• A material element of the Group’s revenue is derived from one contract. The LTPA is a 25-year contract to provide test, evaluation, and training services to the MOD. The original contract was signed in 2003. The LTPA operates under five-year periods with specific programmes, targets and performance measures set for each period. The LTPA directly contributed 27% of the Group’s revenue and supported a further 16% through tasking services using LTPA managed facilities.
• In February 2013 the Group signed the LTPA for a third five-year period with the MOD. The next scheduled ‘re-pricing’ point is March 2018.
• The Group continues to achieve strong customer performance and satisfaction levels, and significantly exceeded the agreed minimum performance rating of 80% in 2016.
• The Group has achieved significant cost savings for the MOD on delivered services, and is on track to deliver £700m of additional savings originally projected over the life of the contract.
• The Group is proactively engaging with the MOD regarding future plans for test and evaluation services as a result of SDSR.
• Underlying operating profit
• Underlying operating cash flow
• Customer satisfaction
• Group Director Business Group
• Group Director Test & Evaluation
Balanced Medium/High
QinetiQ Group plc Annual Report and Accounts 201644

Key risk Description, link to strategy and impact Mitigation Associated KPIs
Responsibility Risk appetite
Likelihood/ impact
Defence spending
• Any reduction in government defence and security spending in either the UK or the US could have an adverse impact on the Group’s financial performance. 70% of the Group’s revenue comes directly from contracts held with the UK Government and 7% directly from contracts with the US Government.
• The financial burden on both UK and US Government budgets from economic downturn may lead to reduced spending in the markets in which the Group operates.
• However, the 2015 Strategic Defence and Security Review confirmed that defence spending (which may include some spending from Departments other than the MOD) would remain at least 2% of GDP, and that the MOD Budget would rise slightly in real terms over the next ten years. The MOD has ambitious plans to plug capability gaps which require significant budget cuts elsewhere, including a reduction in civilian posts of up to 30% and a reduction in MOD estate of 30%. These cuts could impact QinetiQ’s core support contracts. The Group’s main contracts are exposed to spend on test and evaluation, and research and technology.
• QinetiQ North America (approximately £60m annual revenue) has been largely funded through overseas contingency budgets which have declined in recent years.
• Our focus on a range of markets in aerospace, defence and security as well as adjacent sectors provides a degree of portfolio diversification. The Group will continue to monitor expenditure changes in its traditional markets and will adjust business activities where appropriate.
• The MOD has made considerable progress in balancing its budget. In defence research, where QinetiQ is the private sector market leader, spending appears to have stabilised at 1.2% of the UK defence budget.
• QinetiQ monitors and responds to potential opportunities arising from the MOD’s actions to deliver improved value for money by making proactive proposals that deliver the desired outcome.
• Further investment in the pursuit of international opportunities assists in the diversification away from the dependency on UK and US Government spending.
• US Products (such as unmanned systems) are targeted to be funded though Programs of Record (ie in the US Base budget) over the next two years.
• Customer satisfaction
• Underlying operating profit
• Underlying operating cash flow
• Group Director Business Development
Eager Medium/High
Complex Market Characteristics
• The aerospace, defence and security markets are highly competitive. The Group’s performance may be adversely affected should it not be able to compete in the markets in which it aims to operate.
• The Single Source Regulations Office (SSRO) has confirmed the baseline profit rate for new single source defence contracts is 8.95% for FY17 (FY16: 10.6%) and that over the course of FY17 it will consult again and develop the methodology for calculating the baseline profit rate in future years, potentially introducing multiple profit rates. This baseline rate acts as the starting point for agreeing the profit rates of new and renewed contracts, and suppliers can both under and over-perform the contracted rate depending on, for example, risk, capital servicing and project execution. Further updates and clarifications are expected to be published by the SSRO on other topics affecting QDCs, eg allowable cost. Our combination of capabilities is unique in the UK and, consequently, approximately 70% of total EMEA Services revenue is derived from single source contracts, including the non-tasking element of the Long Term Partnering Agreement (LTPA). We anticipate that the majority of our single source revenue will fall under the regulations within approximately three years.
• The timing of the orders receipt could have a material impact on the Group’s performance in a given reporting period as the amounts payable under some government contracts can be significant.
• Some of the Group’s revenue is derived from contracts that have a fixed price. There is a risk that the costs required for the delivery of a contract could be higher than those agreed in the contract as a result of the performance of new or developed products, operational over-runs or external factors. Any significant increase in costs which cannot be passed on to a customer may reduce the profitability of a contract or even result in a contract becoming loss making.
• Some of the Group’s contracts have terms, not unusual in defence, that provide for unlimited liabilities for the Group, or termination rights for the customer.
• QinetiQ seeks to focus on areas within these markets in which its deep customer understanding, domain knowledge, technical expertise and platform independence provide a strong proposition and a significant advantage in competitive bidding.
• QinetiQ and defence industry partners have been fully engaged with the MOD in the development of the new framework and its practical application. QinetiQ and defence industry partners expect to be consulted by the SSRO on the Statutory Guidance.
• QinetiQ is supporting an industry review of the profit rate methodology prior to the consultation on the changes for 2017. The baseline profit rate is the starting point for profitability on single source contracts – other factors include capital servicing, risk and project execution.
• The contracts and orders pipeline is regularly reviewed by senior operational management.
• The nature of many of the services provided under fixed-price arrangements is often for a defined amount of effort or resource rather than firm deliverables and, as a result, mitigates the risk of costs escalating. The Group ensures that its fixed-price bids and projects are reviewed for early detection and management of issues which may result in cost over-run or excessive delivery risk.
• Underlying operating profit
• Underlying operating cash flow
• Customer satisfaction
• Group Director Business Development
Balanced Medium/High
• Organisational Conflicts of Interest (OCI) may occur where the Group provides services to both a defence end-user customer as well as those within the defence supply chain.
• QinetiQ takes proactive steps to manage any potential OCI and maintain its ability to provide independent advice. QinetiQ operates under the generic formal compliance regime and applies a rigorous compliance process.
• Where QinetiQ wishes to operate on both the advice and supply chain side of an opportunity we do so only after receiving approval from the MOD.
• Customer satisfaction
• Group General Counsel & Company Secretary
• Compliance Implementation Director
Balanced Low/Medium
• The Group is reliant on a limited number of major customers.
• A material element of the Group’s revenue is derived from one contract. The LTPA is a 25-year contract to provide test, evaluation, and training services to the MOD. The original contract was signed in 2003. The LTPA operates under five-year periods with specific programmes, targets and performance measures set for each period. The LTPA directly contributed 27% of the Group’s revenue and supported a further 16% through tasking services using LTPA managed facilities.
• In February 2013 the Group signed the LTPA for a third five-year period with the MOD. The next scheduled ‘re-pricing’ point is March 2018.
• The Group continues to achieve strong customer performance and satisfaction levels, and significantly exceeded the agreed minimum performance rating of 80% in 2016.
• The Group has achieved significant cost savings for the MOD on delivered services, and is on track to deliver £700m of additional savings originally projected over the life of the contract.
• The Group is proactively engaging with the MOD regarding future plans for test and evaluation services as a result of SDSR.
• Underlying operating profit
• Underlying operating cash flow
• Customer satisfaction
• Group Director Business Group
• Group Director Test & Evaluation
Balanced Medium/High
QinetiQ Group plc Annual Report and Accounts 2016 45
Strategic report Governance Financial statements Additional information

Principal risks and uncertainties continued
Key risk Description, link to strategy and impact Mitigation Associated KPIs
Responsibility Risk appetite
Likelihood/ impact
Recruitment and retention
• The Group operates in many specialised engineering, technical and scientific domains.
• The lack of graduates in the science, technology, engineering and mathematics (STEM) domains leads to future skills shortage.
• Key capabilities and competences may be lost through failure to recruit and retain employees due to internal factors, as well as macro factors across the sector affecting the desirability, intake and training of engineers, scientists and technologists.
• The regulatory framework in some countries where the Group operates reduces the candidate pool for recruitment and deployment.
• The UK workforce has a skewed age distribution which creates risk on future skills shortage.
• The Group conducts regular activities to identify key roles and personnel. Some succession planning is undertaken looking internally at candidates ready now or in need of development to fill particular roles and externally to identify people QinetiQ may wish to attract.
• QinetiQ has made improvements in employee engagement and conducts an annual satisfaction survey.
• STEM outreach from primary school age through to work experience and graduate opportunities.
• QinetiQ is leading industry in The 5% Club, a campaign to increase the recruitment of graduates and apprentices.
• Employee engagement
• % of apprentices and graduates
• Voluntary employee turnover
• Group Director Human Resources
Balanced Medium/High
Breaches of security and IT systems failure
• The Group operates in a highly regulated IT environment.
• The data held by QinetiQ is confidential and needs to be secure, against a background of increasing cyber threat.
• A breach of data security or IT systems failure could have an adverse impact on our customers’ operations, resulting in significant reputational damage, as well as the possibility of exclusion from some types of government contracts.
• The Group’s financial systems are required to be adequate to support US and UK Government contracting regulations.
• Data security is assured through a multi-layered approach that provides a hardened environment, including robust physical security arrangements and data resilience strategies.
• Comprehensive internal and external testing of potential vulnerabilities is conducted along with 24/7 monitoring.
• The Group engages with US and UK Government contracting audit agencies, to enable them to test relevant financial systems and data, and implements any recommended improvement plans.
• Information systems are designed with consideration to single points of failure and the removal of risk of minor and major system failures.
• The Group maintains business continuity plans that cover geographical assets as well as the technical capability of employees. These plans cover a range of scenarios (including loss of access to IT) and are regularly tested.
• Underlying operating profit
• Profit after tax
• Underlying EPS
• Underlying operating cash flow
• Executive Committee
Cautious High/High
Business transformation
• A strategic priority is to innovate for value, focusing on markets where customers have a clear need for our skills.
• Failure to create a culture of innovation or invest adequately in, or create value from, our innovation investment will impact negatively on the Group’s market position.
• Innovation will be driven through cultural change, investment in, and application of, our core competences for our customers’ advantage in defence and commercial markets.
• The Internal R&D investment process is in place.
• Customer satisfaction
• Employee engagement
• Group Director Engineering & Operations
• Group Director Human Resources
Eager Medium/High
• Resources have historically been deployed within divisional teams. This encourages an internal culture which makes it difficult to use resource flexibly across the company to meet customer demands.
• Our way of working has been designed to support the delivery of our strategy, increase customer focus, improve our competitiveness and deliver collaboration across the company.
• Customer satisfaction
• Employee engagement
• Group Director Human Resources
Eager High/High
Trading in a global market
• A strategic priority is to build an International business that delivers additional value to our customers.
• Failure to execute this strategy soundly would negatively impact future growth.
• The Group’s Integrated Strategic Business Planning process is used to clearly articulate strategy, appropriate objectives and metrics.
• The Group has established and is investing in a new International business.
• The Group has been reorganised to enhance customer focus and collaboration, aligning it with the strategy.
• Orders
• Organic revenue growth
• CEO Cautious Medium/High
• QinetiQ operates internationally. Risks include: regulation and administration changes, taxation policy, political instability, civil unrest and differences in culture.
• Negative events could disrupt some of the Group’s operations and have a material impact on its future financial performance.
• The UK EU referendum scheduled for 23 June may create uncertainty.
• While the Group has a growing geographical footprint, its traditional activities are confined to the UK and the US.
• Relationships or contracts in new markets are assessed for their inherent risks, using our International Business Risk Assessment process, before being formally agreed. This allows opportunities to be reviewed at different levels of management according to their inherent risk.
• Regular review within the Group’s Integrated Strategic Business Planning process.
• Orders
• Organic revenue growth
• CEO Cautious Medium/High
QinetiQ Group plc Annual Report and Accounts 201646

Key risk Description, link to strategy and impact Mitigation Associated KPIs
Responsibility Risk appetite
Likelihood/ impact
Recruitment and retention
• The Group operates in many specialised engineering, technical and scientific domains.
• The lack of graduates in the science, technology, engineering and mathematics (STEM) domains leads to future skills shortage.
• Key capabilities and competences may be lost through failure to recruit and retain employees due to internal factors, as well as macro factors across the sector affecting the desirability, intake and training of engineers, scientists and technologists.
• The regulatory framework in some countries where the Group operates reduces the candidate pool for recruitment and deployment.
• The UK workforce has a skewed age distribution which creates risk on future skills shortage.
• The Group conducts regular activities to identify key roles and personnel. Some succession planning is undertaken looking internally at candidates ready now or in need of development to fill particular roles and externally to identify people QinetiQ may wish to attract.
• QinetiQ has made improvements in employee engagement and conducts an annual satisfaction survey.
• STEM outreach from primary school age through to work experience and graduate opportunities.
• QinetiQ is leading industry in The 5% Club, a campaign to increase the recruitment of graduates and apprentices.
• Employee engagement
• % of apprentices and graduates
• Voluntary employee turnover
• Group Director Human Resources
Balanced Medium/High
Breaches of security and IT systems failure
• The Group operates in a highly regulated IT environment.
• The data held by QinetiQ is confidential and needs to be secure, against a background of increasing cyber threat.
• A breach of data security or IT systems failure could have an adverse impact on our customers’ operations, resulting in significant reputational damage, as well as the possibility of exclusion from some types of government contracts.
• The Group’s financial systems are required to be adequate to support US and UK Government contracting regulations.
• Data security is assured through a multi-layered approach that provides a hardened environment, including robust physical security arrangements and data resilience strategies.
• Comprehensive internal and external testing of potential vulnerabilities is conducted along with 24/7 monitoring.
• The Group engages with US and UK Government contracting audit agencies, to enable them to test relevant financial systems and data, and implements any recommended improvement plans.
• Information systems are designed with consideration to single points of failure and the removal of risk of minor and major system failures.
• The Group maintains business continuity plans that cover geographical assets as well as the technical capability of employees. These plans cover a range of scenarios (including loss of access to IT) and are regularly tested.
• Underlying operating profit
• Profit after tax
• Underlying EPS
• Underlying operating cash flow
• Executive Committee
Cautious High/High
Business transformation
• A strategic priority is to innovate for value, focusing on markets where customers have a clear need for our skills.
• Failure to create a culture of innovation or invest adequately in, or create value from, our innovation investment will impact negatively on the Group’s market position.
• Innovation will be driven through cultural change, investment in, and application of, our core competences for our customers’ advantage in defence and commercial markets.
• The Internal R&D investment process is in place.
• Customer satisfaction
• Employee engagement
• Group Director Engineering & Operations
• Group Director Human Resources
Eager Medium/High
• Resources have historically been deployed within divisional teams. This encourages an internal culture which makes it difficult to use resource flexibly across the company to meet customer demands.
• Our way of working has been designed to support the delivery of our strategy, increase customer focus, improve our competitiveness and deliver collaboration across the company.
• Customer satisfaction
• Employee engagement
• Group Director Human Resources
Eager High/High
Trading in a global market
• A strategic priority is to build an International business that delivers additional value to our customers.
• Failure to execute this strategy soundly would negatively impact future growth.
• The Group’s Integrated Strategic Business Planning process is used to clearly articulate strategy, appropriate objectives and metrics.
• The Group has established and is investing in a new International business.
• The Group has been reorganised to enhance customer focus and collaboration, aligning it with the strategy.
• Orders
• Organic revenue growth
• CEO Cautious Medium/High
• QinetiQ operates internationally. Risks include: regulation and administration changes, taxation policy, political instability, civil unrest and differences in culture.
• Negative events could disrupt some of the Group’s operations and have a material impact on its future financial performance.
• The UK EU referendum scheduled for 23 June may create uncertainty.
• While the Group has a growing geographical footprint, its traditional activities are confined to the UK and the US.
• Relationships or contracts in new markets are assessed for their inherent risks, using our International Business Risk Assessment process, before being formally agreed. This allows opportunities to be reviewed at different levels of management according to their inherent risk.
• Regular review within the Group’s Integrated Strategic Business Planning process.
• Orders
• Organic revenue growth
• CEO Cautious Medium/High
QinetiQ Group plc Annual Report and Accounts 2016 47
Strategic report Governance Financial statements Additional information

Principal risks and uncertainties continued
Key risk Description, link to strategy and impact Mitigation Associated KPIs
Responsibility Risk appetite
Likelihood/ impact
Significant breach of relevant laws and regulations
• The Group operates in highly regulated environments and recognises that its operations have the potential to have an impact on a variety of stakeholders.
• Failure to comply with particular regulations could result in a combination of fines, penalties, civil or criminal action.
• In addition, failure may also lead to suspension or debarment from government contracts, as well as reputational damage to the QinetiQ brand.
• Key areas of focus for the Group include the following:
– Safety liability of products, services and advice.
– Workplace and occupational health, safety and environmental matters.
– Bribery and ethics.
– International trade controls.
• The Group has robust policy, procedures and training in place to ensure that it meets all current regulations; for example, annual business ethics training is mandatory for all employees across the Group and the Board; role specific safety training.
• The QinetiQ Code of Conduct defines clear expectations for the Group and its employees; for example, it states that the Group does not tolerate bribery and corruption and will comply with relevant international trade regulations.
• The Group manages the effective identification, measurement and control of regulatory risk.
• Local management continuously monitor local laws. Professional advice is sought when engaging in new territories to ensure that the Group complies with local and international regulations.
• Accreditation to external standards; for example, safety and environmental systems continue to be accredited to international standards; external authorisation for regulated design and maintenance services in the aviation sector.
• Underlying operating profit
• Profit after tax
• Underlying EPS
• Underlying operating cash flow
• Executive Committee
Cautious Medium/High
Changes in tax legislation
• QinetiQ is liable to pay tax in the countries in which it operates, principally the UK, the US, Australia and Belgium. Changes in tax legislation in these countries could have an adverse impact on the level of tax paid on profits generated by the Group. The majority of the trading losses in the UK were utilised during the year to 31 March 2016 on transition to the RDEC scheme and are no longer available to offset future taxable profits.
• In the UK, QinetiQ claims significant levels of tax relief in respect of its R&D activities. This is claimed via the Government’s R&D Expenditure Credits (RDEC) scheme, which currently provides a rebate of 11% of allowable R&D expenditure. Hence, in addition to the risk of changes to the headline level of corporation tax, the Group is exposed to changes to the level of this R&D rebate percentage and the level of R&D expenditure deemed to be allowable for tax purposes. The SSRO has stated that any tax reliefs or credits claimed by a contractor in respect of single-source qualifying defence contracts should be reimbursed to the MOD. As new customer contracts are entered into and as the mix of single-source, non-competed MOD contracts to other contracts changes, the value of the R&D tax benefit passed back to the customer will also change.
• External advice and consultation are sought on potential changes in tax legislation in the UK, the US and elsewhere as necessary enabling the Group to plan for and mitigate potential changes.
• The Group does not have a significant level of cross-border activity but where it does have such transactions controls are in place to ensure pricing reflects ‘arm’s length’ principles. The Group does not, therefore, have a significant exposure to transfer-pricing legislation.
• The Group does not make use of ‘off-shore’ entities or tax structures to focus taxable profits in jurisdictions that legislate for low tax rates.
• Opportunities continue to be explored to manage both effective tax rate (ETR) and cash tax impacts in line with the Board endorsed tax strategy.
• QinetiQ seeks to be open and transparent in its engagement with the UK tax authorities by sharing with HMRC the methodologies adopted in its tax returns.
• The Group has £154.8m of tax losses carried forward as at 31 March 2016 (2015: £291.6m).
• Profit after tax
• Underlying EPS
• Chief Finance Officer
Cautious Medium/High
Defined benefit pension obligations
• The Group operates a defined benefit pension scheme closed to future accrual.
• At the year end the DB pension scheme was in deficit under an IAS19 basis. The deficit was £37.7m
• The size of the deficit may be materially affected by a number of factors, including investment returns, changes in interest rates and inflation and improvements in life expectancy of members.
• Any change to the deficit may require the Group to increase the cash contributions to the scheme, which would reduce the Group’s cash available for other purposes.
• At the last triennial valuation as at 30 June 2014 the scheme funding (on a technical provisions basis) was a surplus of £31.0m.
• Scheme performance is reviewed regularly by the Trustee in conjunction with Group management.
• External actuarial and investment advice is regularly taken to ensure the best interests of both the Group and the scheme members.
• The Group works in collaboration with the Trustee to agree an investment strategy that progressively de-risks the scheme as the funding level improves.
• The company continues to pay the deficit recovery payments outstanding from the 2011 valuation. This will require £10.5m pa until 2018.
• The Group and Trustee reduced future liabilities by switching from RPI to CPI for indexation and revaluation purposes as part of the 2012 Strategy Agreement.
• The scheme was closed to future accrual on 31 October 2013.
• At the year end 100% of the inflation risk (CPI basis) is hedged and 44% of interest rate risk hedged, measured on a gilts basis.
• A contingent asset in the form of an asset backed funding structure provides the Scheme with an additional £2.5m per annum (indexed by CPI) for 20 years to 2032.
• Profit after tax
• Underlying EPS
• Underlying operating cash flow
• Chief Finance Officer
• Group Treasurer
Balanced High/High
QinetiQ Group plc Annual Report and Accounts 201648

Key risk Description, link to strategy and impact Mitigation Associated KPIs
Responsibility Risk appetite
Likelihood/ impact
Significant breach of relevant laws and regulations
• The Group operates in highly regulated environments and recognises that its operations have the potential to have an impact on a variety of stakeholders.
• Failure to comply with particular regulations could result in a combination of fines, penalties, civil or criminal action.
• In addition, failure may also lead to suspension or debarment from government contracts, as well as reputational damage to the QinetiQ brand.
• Key areas of focus for the Group include the following:
– Safety liability of products, services and advice.
– Workplace and occupational health, safety and environmental matters.
– Bribery and ethics.
– International trade controls.
• The Group has robust policy, procedures and training in place to ensure that it meets all current regulations; for example, annual business ethics training is mandatory for all employees across the Group and the Board; role specific safety training.
• The QinetiQ Code of Conduct defines clear expectations for the Group and its employees; for example, it states that the Group does not tolerate bribery and corruption and will comply with relevant international trade regulations.
• The Group manages the effective identification, measurement and control of regulatory risk.
• Local management continuously monitor local laws. Professional advice is sought when engaging in new territories to ensure that the Group complies with local and international regulations.
• Accreditation to external standards; for example, safety and environmental systems continue to be accredited to international standards; external authorisation for regulated design and maintenance services in the aviation sector.
• Underlying operating profit
• Profit after tax
• Underlying EPS
• Underlying operating cash flow
• Executive Committee
Cautious Medium/High
Changes in tax legislation
• QinetiQ is liable to pay tax in the countries in which it operates, principally the UK, the US, Australia and Belgium. Changes in tax legislation in these countries could have an adverse impact on the level of tax paid on profits generated by the Group. The majority of the trading losses in the UK were utilised during the year to 31 March 2016 on transition to the RDEC scheme and are no longer available to offset future taxable profits.
• In the UK, QinetiQ claims significant levels of tax relief in respect of its R&D activities. This is claimed via the Government’s R&D Expenditure Credits (RDEC) scheme, which currently provides a rebate of 11% of allowable R&D expenditure. Hence, in addition to the risk of changes to the headline level of corporation tax, the Group is exposed to changes to the level of this R&D rebate percentage and the level of R&D expenditure deemed to be allowable for tax purposes. The SSRO has stated that any tax reliefs or credits claimed by a contractor in respect of single-source qualifying defence contracts should be reimbursed to the MOD. As new customer contracts are entered into and as the mix of single-source, non-competed MOD contracts to other contracts changes, the value of the R&D tax benefit passed back to the customer will also change.
• External advice and consultation are sought on potential changes in tax legislation in the UK, the US and elsewhere as necessary enabling the Group to plan for and mitigate potential changes.
• The Group does not have a significant level of cross-border activity but where it does have such transactions controls are in place to ensure pricing reflects ‘arm’s length’ principles. The Group does not, therefore, have a significant exposure to transfer-pricing legislation.
• The Group does not make use of ‘off-shore’ entities or tax structures to focus taxable profits in jurisdictions that legislate for low tax rates.
• Opportunities continue to be explored to manage both effective tax rate (ETR) and cash tax impacts in line with the Board endorsed tax strategy.
• QinetiQ seeks to be open and transparent in its engagement with the UK tax authorities by sharing with HMRC the methodologies adopted in its tax returns.
• The Group has £154.8m of tax losses carried forward as at 31 March 2016 (2015: £291.6m).
• Profit after tax
• Underlying EPS
• Chief Finance Officer
Cautious Medium/High
Defined benefit pension obligations
• The Group operates a defined benefit pension scheme closed to future accrual.
• At the year end the DB pension scheme was in deficit under an IAS19 basis. The deficit was £37.7m
• The size of the deficit may be materially affected by a number of factors, including investment returns, changes in interest rates and inflation and improvements in life expectancy of members.
• Any change to the deficit may require the Group to increase the cash contributions to the scheme, which would reduce the Group’s cash available for other purposes.
• At the last triennial valuation as at 30 June 2014 the scheme funding (on a technical provisions basis) was a surplus of £31.0m.
• Scheme performance is reviewed regularly by the Trustee in conjunction with Group management.
• External actuarial and investment advice is regularly taken to ensure the best interests of both the Group and the scheme members.
• The Group works in collaboration with the Trustee to agree an investment strategy that progressively de-risks the scheme as the funding level improves.
• The company continues to pay the deficit recovery payments outstanding from the 2011 valuation. This will require £10.5m pa until 2018.
• The Group and Trustee reduced future liabilities by switching from RPI to CPI for indexation and revaluation purposes as part of the 2012 Strategy Agreement.
• The scheme was closed to future accrual on 31 October 2013.
• At the year end 100% of the inflation risk (CPI basis) is hedged and 44% of interest rate risk hedged, measured on a gilts basis.
• A contingent asset in the form of an asset backed funding structure provides the Scheme with an additional £2.5m per annum (indexed by CPI) for 20 years to 2032.
• Profit after tax
• Underlying EPS
• Underlying operating cash flow
• Chief Finance Officer
• Group Treasurer
Balanced High/High
This Strategic report was approved by the Board of Directors on 26 May 2016 and signed on its behalf by:
David Mellors Chief Financial Officer 26 May 2016
QinetiQ Group plc Annual Report and Accounts 2016 49
Strategic report Governance Financial statements Additional information

Board skills
Defence 6Engineering 4Financial 9Science 5
2016 Number of Directors
Director’s length of tenure
Up to 3 years 44.54-6 years 44.57-9 years 11.0
2016 %
Board composition
Chairman 11.0Non-executive 67.0Non-independent 22.0
2016 %
Corporate governance statement
An introduction from our Chairman
Dear shareholder,We believe that it is imperative that a company operates a sound system of corporate governance and internal control as it seeks to evolve and grow its business. As QinetiQ develops its vision and strategy for the coming years, good governance is critical for effective stewardship and risk management.
The Board has overseen a year of intense activity as the new Group Chief Executive Officer, Steve Wadey, carried out his familiarisation with and evaluation of QinetiQ, and then developed and rolled out his strategy to take the Group forwards.
Succession planning has remained an area of focus for the Board. Lynn Brubaker was appointed as an additional Non-executive Director in January 2016. Lynn enjoyed a long career in the US commercial aviation sector and I am delighted that she has joined the Board.
In the US, Tom Mills and Scott Webster were appointed as Proxy holders of Foster-Miller, Inc. in 2015. I was saddened by the death of Len Moodispaw in 2015. Len was an excellent Proxy Board Chairman, having been appointed to that role in 2014 following the disposal of the US Services business, and he was instrumental in setting out the processes for the new Proxy Board and its relationship with the UK Board of Directors. Dave Carey has replaced Len as Proxy Board Chairman and the Executive Directors have met with and joined the new Proxy Board at a number of its meetings. Details of the role of the Proxy Board can be found on page 66.
There have been a number of changes in the company’s senior executive management team and its structure, to enhance and complement the existing range of skills. Details of the new governance structure can be found on page 56.
This year has seen an external evaluation of the effectiveness of the Board and details can be found on page 61.
As QinetiQ begins the new financial year with a new vision and strategy, and a new Executive Committee to lead the way, the Board, through its decisions and leadership, will maintain a guiding hand on the work of the CEO and his team to ensure a balanced and measured way forwards.
Mark Elliott Non-executive Chairman 26 May 2016
Effective governanceCorporate governance is about what the Board of a company does and how it sets the values of the company. The purpose of corporate governance is to facilitate effective, entrepreneurial and prudent management that can deliver the long-term success of the company. The Board of Directors therefore should comprise experienced individuals with a variety of backgrounds and experience, who are independent in character and judgement.
QinetiQ Group plc Annual Report and Accounts 201650

“ Corporate governance is about what the Board of a company does and how it sets the values of the company. The purpose of corporate governance is to facilitate effective, entrepreneurial and prudent management that can deliver the long-term success of the company.”
Compliance statementQinetiQ is subject to the Financial Reporting Council’s UK Corporate Governance Code (the Code) as currently in effect. The Code and associated guidance are publicly available on the Corporate Governance page of the Financial Reporting Council’s website, www.frc.org.uk.
The Board considers that QinetiQ has complied with all relevant Provisions of the Code throughout the last financial year. With regard to the Code requirements on audit tendering, as set out on page 74, the company intends to tender the audit during 2016, with the selected auditor being proposed for appointment at the Annual General Meeting in 2017.
This statement provides details of the way in which the Main Principles of the Code have been applied during that year.
An overview of the Group’s corporate governance arrangements can be found on the QinetiQ website at www.QinetiQ.com/about-us/corporate-governance.
In this section:• Compliance 51• Overview of the application of the main principles of the Code 52
Leadership 54• Composition of the Board 54• Roles and responsibilities 54• Board objectives 54• Board operation 54• Board meetings and attendance 56• Committees 56
• Directors’ biographies 58
Effectiveness 60• Director training and development 60• Independence of Non-executive Directors 60• Performance of the Board 61
• Report of the Nominations Committee 62
Accountability 64• Identification and review of risks 64• Internal control 65• Management and control of US subsidiaries 66
Board statements relating to risk management 68• Directors’ statement of ‘fair, balanced and understandable’ assessment 68• Board assessment of principal risks 68• Board review of effectiveness of risk management and internal controls 68• Going concern statement 68• Directors’ confirmation of longer-term viability 69
• Report of the Audit Committee 70
• Report of the Risk & CSR Committee 75
• Report of the Security Committee 77
Relations with shareholders 78
Remuneration 80• Annual statement on remuneration 80• Remuneration Policy Summary 82• Annual Report on Remuneration 86
• Directors’ report 96
• Directors’ responsibility statement 99
• Independent auditor’s report 100
QinetiQ Group plc Annual Report and Accounts 2016 51
Strategic report Governance Financial statements Additional information

Corporate governance statement continued
Overview of the application of the Main Principles of the Code
Code Principle A Leadership(pages 54 to 59)
A1 The Role of the BoardThe Board met seven times during the year. There is a schedule of matters reserved to the Board and the Board has a set of objectives and responsibilities. This report contains a statement of how the Board operates, including which types of decisions are taken by the Board and which are delegated to management. Details of the Board and Committee membership and Directors’ attendance at Board and Committee meetings are included in this Annual Report on page 56.
A2 Division of ResponsibilitiesThe roles of Chairman and Chief Executive are not exercised by the same individual and their separate responsibilities are established, set out in writing and approved by the Board.
A3 The ChairmanThe Chairman, working with the Company Secretary, sets the agenda for Board meetings and encourages an open and constructive debate.
A4 Non-executive DirectorsThe Non-executive Directors provide constructive challenge to management and help develop proposals on strategy. The Board has appointed a Senior Independent Non-executive Director. Regular meetings are held with the Chairman and Non-executive Directors without the executives present.
Code Principle B Effectiveness (pages 60 to 63)
B1 The Composition of the BoardAt least half the Board (excluding the Chairman) comprises independent Non-executive Directors. The Board considers the overall size and composition to be appropriate, having regard to the experience and skills the Directors bring to their duties.
B2 Appointments to the BoardThe Nominations Committee oversees appointments to the Board, its balance of skills and experience and the succession planning process. The report of the Nominations Committee can be found on page 62.
B3 Time CommitmentThe anticipated time commitment required in respect of the non-executive role is communicated in the appointment process. The Board is notified of changes to other significant commitments and the Chairman consulted where appropriate.
B4 Director Training and DevelopmentAll Directors receive a tailored induction on joining the Board. Site visits and training are made available to enable Directors to develop and update their knowledge and capabilities.
B5 Information and Support for DirectorsThe Chairman, working in conjunction with the Company Secretary, ensures that the Board receives accurate, timely and clear information.
B6Performance evaluationAn evaluation of the performance of the Board, its Committees and individual Directors, is carried out annually. Details can be found on page 61.
B7 Re-election of DirectorsThe company requires each serving member of the Board to be put forward for election or re-election on an annual basis at each Annual General Meeting.
QinetiQ Group plc Annual Report and Accounts 201652

Code Principle C Accountability (pages 64 to 77)
C1 Financial and Business ReportingThe Board presents its results at the full year and the half year and provides quarterly updates to the market. The Annual Report and Accounts contains a Strategic report which provides an explanation of how the company generates or preserves value over the longer term (the business model) and the strategy for delivering the objectives of the company. A going concern statement and longer-term viability statement are included on pages 68 and 69 respectively, responsibility statements can be found on page 99, and details of the process for ensuring that the Annual Report is fair, balanced and understandable can be found on page 68. There is also a statement in the auditor’s report on page 102 about their reporting responsibilities.
C2 Risk Management and Internal Control The risk management process and the system of internal control necessary to manage risks are assessed and monitored by the Audit Committee (financial risks) and the Risk & CSR Committee (non-financial risks). A report on specific risk review activity undertaken during the year by those committees, together with the current risk registers, is presented by the CEO to the Board annually. The Strategic report contains on pages 42 to 49 details of risk management and the company’s principal risks and uncertainties, their impact and how they are managed. Details of risk management and internal control processes can be found on pages 64 to 67.
An explanation of how the Directors have assessed the prospects of the company and a statement in respect of the Board’s assessment of the company’s longer-term viability are set out on page 69.
C3 Audit Committee and AuditorsThe Board has established an Audit Committee comprising at least three independent Non-executive Directors, with formal terms of reference. It oversees the financial risk management and internal controls process, the effectiveness of internal audit activities, the external auditor’s independence and objectivity and makes recommendations to the Board in respect of the reappointment of the external auditor and their remuneration. The report of the Audit Committee can be found on pages 70 to 74.
Code Principle D Remuneration (pages 80 to 95)
D1 Level and Components of RemunerationThe Board has established a Remuneration Committee with formal terms of reference. It is responsible for ensuring that levels of remuneration are of sufficient quality and that any performance related elements are relevant, stretching and designed to promote the long-term success of the company.
D2 Developing Remuneration Policy and PackagesThe report of the Remuneration Committee can be found in the Directors’ remuneration report on pages 80 to 81. It provides details of, or links to, the Group’s reward and remuneration policies and payments, and also the procedure for setting policy on Executive Director remuneration.
The Committee also recommends and monitors the level and structure of remuneration for senior management. The Directors’ remuneration report is incorporated into this corporate governance statement by reference.
Code Principle E Relations with Shareholders (pages 78 to 79)
E1 Dialogue with ShareholdersThe Chairman ensures that all Directors are made aware of major shareholder issues and concerns, by way of reports from the Executive Directors at Board meetings, attendance at key financial calendar events and by making themselves available to meet shareholders as required. As noted on page 78, meetings with investors during the year were led by the Executive Directors. The Chairman and Senior Independent Director were available to attend meetings with investors as appropriate and on request.
E2 Constructive Use of the Annual General MeetingAll shareholders are invited to attend the Annual General Meeting and to ask questions. The Chairs of the Audit, Nominations, Remuneration, Risk & CSR and Security Committees attend the meeting and are available to answer any questions on the work of the committees.
QinetiQ Group plc Annual Report and Accounts 2016 53
Strategic report Governance Financial statements Additional information

Corporate governance statement continued
A Leadership The BoardThe Board represents the interests of both QinetiQ and its shareholders. It comprises a range of experience and expertise required to meet the challenges facing the Group. The Non-executive Directors bring independent judgement on key issues affecting the Group and its business operations, including strategy, performance, resources (including key appointments) and standards of conduct.
Composition of the BoardAt the date of this report, the Board has nine members: the Non-executive Chairman; six other Non-executive Directors; and two Executive Directors – the Chief Executive Officer (CEO) and the Chief Financial Officer (CFO). Their names and skills and experience are set out on pages 58 to 59.
The following changes in Board membership took place during the year:• Steve Wadey was appointed as an Executive Director and CEO
on 27 April 2015.• Lynn Brubaker was appointed as a Non-executive Director
on 27 January 2016.
Roles and responsibilitiesThe Board of Directors is responsible for overseeing the Group’s strategy and ensuring the implementation of operational activity which supports that strategy. It has mandated the organisation’s standards of behaviour and its risk appetite, along with key policies and processes, and enables the business to implement strategy and monitor operational performance through its direction and advice. The Directors are responsible for overseeing the performance of the Group, and their powers are subject to the Articles of Association and any applicable legislation. The Board has delegated the day-to-day operational management of the company to the Executive Directors and members of the senior management team, but certain matters are reserved to it for its decision, as detailed on this page. The Board monitors the performance of the senior management team and organises its business to have regular interaction with key members of senior management.
Individual Board members bring significant skills and experience to bear on their contribution to the Board. They are able to operate at a high level independently of each other but also work together as a team.
Board objectivesThe overarching remit of the Board is to demonstrate the highest standards of corporate governance in accordance with the Code and to carry out the Directors’ fiduciary duties:• to demonstrate strategic leadership and oversight;• to agree the strategy and to ensure the continuing evolution
and implementation of the Group’s strategy to deliver value to all stakeholders: customers, employees and shareholders;
• to develop challenging objectives for the business and monitor management performance against those goals;
• to provide a framework of effective controls to assess and manage risks, with clear expectations of conduct to the highest standards of ethics;
• to provide support and constructive challenges to the CEO to promote the Group’s success;
• to demonstrate leadership in management systems around health, safety and environment; and
• to manage succession planning for the Board and the Group’s executive management.
Matters reserved to the BoardThe Board has a clearly articulated set of matters which are specifically reserved to it for consideration, in addition to those specified in the company’s Articles of Association.
These include (but are not limited to):• reviewing and approving the annual budgets;• raising indebtedness;• granting security over Group assets;• approving Group strategy and the corporate plan;• approving the Annual and Interim Report and Accounts;• approving significant investment, bid, acquisition and divestment
transactions;• approving HR policies (including pension arrangements);• reviewing material litigation; and• monitoring the overall system of internal control, including risk
management.
OperationThe Board has an annual calendar of meetings and operates through a comprehensive set of processes which define the schedule of matters to be considered by the Board and its Committees during the annual business cycle. This includes the level of delegated authorities (both financial and non-financial) available to Executive Directors and other layers of management in the business, QinetiQ’s business ethics, risk management, and health, safety and environmental processes. The Board devotes one entire meeting each year to consider strategy and planning issues that have an impact on the Group, from which the corporate plan is generated. It is also regularly kept up to date on strategic issues throughout the year. Details of the Board’s review of strategy during the year can be found on the next page.
For each meeting, as standing items, the Board receives a written report from the CEO and CFO and a report produced by the Company Secretary on key legal and regulatory issues that affect the Group. The CEO’s and CFO’s report addresses the key strategic initiatives which have had an impact on the Group since the previous Board meeting, with particular focus on the progress of each of the businesses, and also contains a report on investor relations which is prepared in consultation with QinetiQ’s brokers. Other key areas of focus include health, safety and environmental matters; employee and organisational issues; corporate responsibility; the status of key account management/customer relationship initiatives; the pipeline of potential bids, acquisitions, disposals and investments; and the post-acquisition performance of recently acquired businesses.
The Board also receives updates from key functional areas on an ‘as needed’ basis, on issues such as human resources, treasury, corporate responsibility, real estate, security, trade controls and pensions.
Following the changes in the Board membership in 2015, and with the arrival of the new CEO, it had been agreed as part of the Board effectiveness review in 2015 that steps would be taken to integrate all members of the Board and also to facilitate further attendance at Board meetings by members of the senior management team to enhance the Board–business relationship.
QinetiQ Group plc Annual Report and Accounts 201654

During the year under review, members of the senior management team presented to the Board and its Committees on specific areas, including reputational risk, corporate responsibility, cyber risk, pensions and strategy. Going forwards, arrangements have been made for Non-executive Directors to attend each of the quarterly extended leadership meetings run by the Executive Committee and which are attended by approximately 100 senior leaders within the Group.
Board and Committee meetings are generally spread over a two-day period, to allow sufficient time for the Board to deal with the various items of business. The Chairman meets with the Non-executive Directors, without executives present, after each Board meeting.
The Board also meets informally, to facilitate Board integration and working together as a team, and to allow time for the Directors to consider other matters outside of the formal agenda.
Development of Group StrategyThe Board has had full oversight of the development of the Group strategy and transformation programme during the year.
At its May and July meetings, the Board received updates from the CEO in respect of his progress with his Group familiarisation programme and how that was beginning to crystallise the focus for the Group strategy. Strategy planning was a separate agenda item at both the July and September meetings, when the Group Strategy Director presented on progress against milestones in respect of the current strategy, together with updates on progress with the development of the new integrated strategic business plan which would be presented at the two day Board strategy meeting in early November.
The November Board Strategy meeting was a two-day meeting held at an off-site location where the strategy for the Group as a whole was reviewed by the Board, with presentations by key members of the senior management team. The pre-reading materials had detailed the broad structure of discussions on the strategic environment, a vision-led strategy that responded to that environment and a transformation programme that would drive growth. A review of each business was presented and the market
factors which drove the case for change were considered. The second day looked at the proposed vision, success criteria and strategy, and the critical enablers of integration, excellence, investment, international growth and innovation were considered. The transformation programme, leadership and organisational structures and performance trajectory were also considered. It was noted that further research, analysis and iteration were required to refine the strategy and establish the detail of the new structures, and would take place over the ensuing three to four months.
Following the November strategy meeting, the Group strategy was further refined and established, and reported on by the Group Strategy Director at the January Board meeting. The new vision and strategy and related transformation programme were rolled out to the company in early March, with a further update on progress from the Group Strategy Director at the Board’s March meeting.
The progress of the integrated strategic business plan and transformation programme will continue to be on the Board agenda for consideration and measurement over the coming year. Details of the Group strategy can be found in the Strategic report on pages 10 to 15.
Monitoring developments in the MOD spending reviewThe UK Government’s Strategic Defence and Security Review (SDSR) was published in November 2015, in respect of the UK’s capability priorities and UK defence budget, and the revised baseline profit rates for single source contracts as set by the Single Source Regulations Office were announced in 2016. These were key matters for the company and it was important for the Board to be kept informed of developments and mitigating actions.
Consequently, as part of the Executive Report tabled at each Board meeting, the CEO and CFO kept the Board up to date on developments with the consultations in respect of both matters, and of the actions being taken within the company to mitigate the potential impact of the reviews and to address the related opportunities and threats.
Efficiency and innovation were identified early on in the process as key themes. The company set up a Test and Evaluation working group and engaged directly with MOD personnel to identify how the company could work with the MOD to strengthen the company’s offering from the Long Term Partnering Agreement in order to achieve the efficiencies that were needed to meet the government’s requirements.
By keeping the Board informed of developments as the reviews progressed, the Board was able to provide the executive with guidance and oversight throughout the review periods.
Financial ReportingFinancial oversight is a key responsibility of the Directors and the Board routinely reviews, with input from the Audit Committee, the results at the half year and the full year in November and May respectively.
At the May Board meeting, the draft annual report and financial results announcement were considered. The Board received a report from the CFO and considered the recommendation from the Audit Committee in respect of the work undertaken to satisfy the ‘fair, balanced and understandable’ requirement. The Board received a summary of the principal controls put in place by the executive to ensure the integrity of the audit process, including the provision of information to the auditor, the self-certification process and internal management representations, a going concern review and a paper to discuss any dividend considerations. The company’s brokers attended relevant parts of the meeting.
At the November Board meeting, the half year announcement and draft results presentation were presented by the CEO and CFO to the Board for their consideration, together with a paper to discuss any dividend considerations. The company’s auditor and brokers attended relevant parts of the meeting.
At the intervening Board meetings, financial updates were presented by the CFO as part of the routine Executive Report.
Key issues considered by the Board in the past year include:
QinetiQ Group plc Annual Report and Accounts 2016 55
Strategic report Governance Financial statements Additional information

Board and Committee structure
Board
Audit Committee
NominationsCommittee
RemunerationCommittee
Risk & CSRCommittee
ExecutiveCommittee
SecurityCommittee
Corporate governance statement continued
Attendance at meetings of the Board and its Committees: 1 April 2015 to 31 March 2016
Members BoardAudit
CommitteeNominations
CommitteeRemuneration
CommitteeRisk & CSR
Committee
Mark Elliott 7/7 – 4/4 5/5 4/4
Lynn Brubaker(1) 2/2 1/1 – 1/1 –
Admiral Sir James Burnell-Nugent
7/7 5/5 4/4 5/5 4/4
Michael Harper 7/7 5/5 4/4 5/5 4/4
Ian Mason 7/7 5/5 4/4 5/5 4/4
David Mellors(2) 7/7 – – – 4/4
Paul Murray 7/7 5/5 4/4 5/5 4/4
Susan Searle 7/7 5/5 4/4 5/5 4/4
Steve Wadey(3) 7/7 – 4/4 – 4/4
(1) Lynn Brubaker joined the Board on 27 January 2016. (2) David Mellors was interim CEO during the period from 1 January 2015 to 26 April 2015.(3) Steve Wadey joined the Board on 27 April 2015.There was no requirement for the Security Committee to meet during the year.
CommitteesDuring the year, QinetiQ operated by way of two key executive committees, the Operating Committee and the Executive Committee, and five principal Board committees. Further details are set out on the next page.
Since the end of the period under review, the Operating Committee has been replaced by a new Executive Committee and the Group’s businesses have been re-aligned to reflect the new vision and strategy, as detailed on pages 10 to 15. The Executive Committee comprises the CEO, CFO, the MDs of the new business groups and functional heads.
As part of this change, the work of the Governance Committee has been included in the business of the Executive Committee with specific agenda items for governance matters. Going forwards, a number of sub-committees have been set up to drive integration, alignment and monitoring of policies. Each sub-committee is led by a member of the Executive Committee and comprises representatives from relevant businesses and functions.
Communication between the Board and the Executive CommitteeThe Executive Directors and Company Secretary are members of the Executive Committee and are involved in the day-to-day management of the Group’s business, operations and underlying committees. Other Executive Committee members and members of the senior management team present to the Board and the Board Committees on key matters. This interaction enables the Board to receive information first-hand about the company and its operations and to give guidance on strategy and oversight of the business direct to senior management.
QinetiQ Group plc Annual Report and Accounts 201656

Board CommitteesThe Board has established five principal Committees: the Audit Committee, the Nominations Committee, the Remuneration Committee, the Risk & CSR Committee and the Security Committee. Each operates within written terms of reference approved by the Board. The full terms of reference can be found in the Governance section of the QinetiQ website at www.QinetiQ.com/about-us/corporate-governance.
Given the size of the Board, and in the interests of full Board participation and transparency, the Board maintains a policy of all of the Directors being members of all of the Committees, other than where prohibited by the Code, statutory or Security Committee requirements. As a result, both the Executive and Non-executive Directors are members of the Risk & CSR Committee, which facilitates full consideration of the oversight of internal controls and non-financial risk management, with the Non-executive Directors being members of the Audit Committee and focusing on financial controls and financial risk management.
Where a Committee is not attended by the full Board, details of the key issues discussed, and decisions taken, are circulated to all members of the Board after the relevant Committee meeting.
A report in respect of each of these Committees is set out in this report on the pages noted in the index on page 51. The details of attendance at Committee meetings are set out in the table on the previous page and also in separate tables contained within each Committee report.
The relevant Code disclosures in respect of the Remuneration Committee are set out in the Directors’ Remuneration Report on pages 80 to 95 and are incorporated into this Corporate governance statement by reference.
Executive CommitteesDuring the year, the company operated via two executive committees, the Operating Committee and the Governance Committee. Membership of the two committees comprised the CEO and CFO, business MDs and functional heads. With effect from 1 April 2016, following the company’s strategic review, the Operating and Governance Committees were replaced by an Executive Committee, as detailed on the previous page.
During the year under review, the Operating Committee was responsible for the day-to-day management of the Group’s activities, with the exception of QinetiQ North America (which is managed through the Proxy Board, as described on page 66 in the section headed ‘Management and control of US subsidiaries’). It met on a monthly basis, and received weekly updates on key operational issues by way of pre-scheduled conference calls. It reported via the Chief Executive Officer to the Board. Its specific focus continued to be on the achievement of the Group’s strategic goals in respect of growth and operational excellence.
During the year under review, the Governance Committee was responsible for the oversight of the risk management process and its implementation by the divisions. It met on a quarterly basis and reported via the Chief Executive Officer to the Risk & CSR Committee.
Matters covered during the year included non-financial corporate objectives, targets and key performance indicators, approval of Operating Framework policy documents and the review of business risk registers and the Group Risk Register.
QinetiQ Group plc Annual Report and Accounts 2016 57
Strategic report Governance Financial statements Additional information

Board of Directors
Mark ElliottNon-executive Chairman
Steve Wadey Chief Executive Officer
David Mellors Chief Financial Officer
Michael Harper Deputy Chairman and Senior Independent Non-executive Director
Lynn Brubaker Non-executive Director
Admiral Sir James Burnell-NugentNon-executive Director
Ian MasonNon-executive Director
Paul Murray Non-executive Director
Susan SearleNon-executive Director
Jon Messent Company Secretary and Group General Counsel
Appointment to the Board
Appointed Non-executive Chairman in March 2010. Appointed Non-executive Director between June 2009 and February 2010.
Appointed Chief Executive Officer in April 2015.
Appointed Chief Financial Officer in August 2008. Appointed Interim Chief Executive Officer from 1 January 2015 until 26 April 2015.
Appointed Non-executive Director in November 2011. Appointed Deputy Chairman and Senior Independent Non-executive Director in February 2012.
Appointed Non-executive Director in January 2016
Appointed Non-executive Director in April 2010.
Appointed Non-executive Director in June 2014.
Appointed Non-executive Director in October 2010.
Appointed Non-executive Director in March 2014.
Appointed as Company Secretary and Group General Counsel in January 2011.
Independence Independent on appointment Not applicable Not applicable Independent Independent Independent Independent Independent Independent Not applicable
Committee memberships
Nominations Committee (Chairman)Remuneration CommitteeRisk & CSR Committee
Nominations CommitteeRisk & CSR CommitteeSecurity Committee
Risk & CSR CommitteeSecurity Committee
Audit CommitteeNominations CommitteeRemuneration Committee (Chairman)Risk & CSR CommitteeSecurity Committee
Audit CommitteeNominations CommitteeRemuneration CommitteeRisk & CSR Committee
Audit CommitteeNominations CommitteeRemuneration Committee Risk & CSR Committee (Chairman)Security Committee (Chairman)
Audit CommitteeNominations CommitteeRemuneration CommitteeRisk & CSR Committee Security Committee
Audit Committee (Chairman)Nominations CommitteeRemuneration Committee Risk & CSR CommitteeSecurity Committee
Audit CommitteeRemuneration Committee Risk & CSR CommitteeNominations CommitteeSecurity Committee
Skills and experience
• Mark has experience of a variety of industry sectors from membership of the boards of FTSE listed companies.
• Mark is a Non-executive Director of G4S plc, where he is the Senior Independent Director and Chairman of the Remuneration Committee, and Chairman of Kodak Alaris Holdings Limited.
• He was a Non-executive Director of Reed Elsevier Group plc (and also Chairman of its Remuneration Committee) and Reed Elsevier NV from April 2003 until April 2013. He worked for IBM for over 30 years where he occupied a number of senior management positions, including General Manager of IBM Europe, Middle East and Africa and was a member of IBM’s worldwide Management Council.
• Steve has in-depth experience of the defence industry and technology and extensive operational and corporate experience and stewardship. He is a Fellow of the Royal Academy of Engineering, a Fellow of the Institution of Engineering and Technology and a Fellow of the Royal Aeronautical Society.
• During the year under review, Steve ceased to be Co-Chair of the Defence Growth Partnership (DGP) but retained his involvement in the DGP by taking up the role as Chair of the Industry Liaison Board of the UK Trade & Investment Defence & Security Organisation. Steve was also appointed as a member of the Prime Minister’s Business Advisory Group. Also during the year under review, Steve ceased to be a Non-executive director of the UK MOD Research and Development Board. Previously, Steve held various roles with MBDA from 2001 to 2014, most recently as Managing Director, MBDA UK and Technical Director for the MBDA Group. Before that, he held various roles in engineering with Matra BAe Dynamics from 1996 to 2001, and various roles with British Aerospace held from 1989 to 1996. He was also Co-Chair of the National Defence Industries Research & Development Group.
• David has extensive experience of working in a listed company environment and of the defence, technology and services sectors. He is a member of the Institute of Chartered Accountants in England and Wales.
• David was previously Deputy Chief Financial Officer of Logica plc, Chief Financial Officer of Logica’s international division, covering operations in North America, Australia, the Middle East and Asia and, before that, he was the Group Financial Controller. Earlier experience included various roles with CMG plc, Rio Tinto plc and Price Waterhouse.
• Michael has a wealth of operational and corporate experience and stewardship, including in the engineering sector.
• He is a Non-executive Director of the Aerospace Technology Institute. Michael was Chairman of Ricardo plc from November 2009 until November 2014, having joined that Board in 2003, Chairman of BBA Aviation plc from June 2007 until May 2014, having joined that Board in 2005 and Chairman of Vitec Group plc from 2004 to 2012. He was Senior Independent Director of Catlin Group Limited from 2005 to 2011. Michael was previously a Director of Williams plc where, at the time of the demerger in 2000, he became CEO of Kidde plc.
• Lynn has considerable experience in the international aerospace industry, including responsibility for business development, strategy, operational and manufacturing issues. She has a strong track record of running international operations, as well as experience of businesses in which technology and intellectual property are important.
• She is a Non-executive Director of FARO Technologies Inc., Hexcel Corp. and The Nordam Group. Previously, Lynn was a Non-executive Director of Force Protection, Inc., Seabury Group, Graham Partners, Cordiem, Chairman of the Flight Safety Foundation, and a member of the Management Advisory Council of the Federal Aviation Administration. Lynn retired from Honeywell International in 2005, where she was Vice President and General Manager of Commercial Aerospace. Prior to that, she held a variety of roles in the commercial aerospace sector working for Allied Signal (which acquired Honeywell in 1999), the McDonnell Douglas Corporation, Republic Airlines and ComAir Airlines.
• Sir James has significant experience of the defence industry, contracting with government and management. He is Non-executive Chairman of Witt Limited and was High Sheriff of Devon during 2015. During a 37-year career in the Royal Navy, which culminated in his appointment as Commander-in-Chief Fleet, he commanded the aircraft carrier HMS Invincible and three other ships and submarines. Between operational duties, Sir James held several positions at the MOD and gained cross-Whitehall experience while on secondment to HM Treasury.
• Ian has considerable experience in strategy, business transformation, eCommerce and international development.
• He was Group Chief Executive of Electrocomponents plc from 2001 until 31 March 2015, having joined that company in 1995. Previously he worked for The Boston Consulting Group and was a Non-executive Director of the Sage Group plc from 2007 to 2013.
• Paul has a broad range of experience in finance and corporate governance from a cross-section of industries, all of which leverage technology.
• He is a Non-executive Director and Chair of the Audit & Risk Committee at Royal Mail Group plc. Paul is also a Director of Independent Oil and Gas plc, Ventive Ltd and Naked Energy Ltd. Previously, Paul was a Director of Knowledge Peers plc, Senior Independent Director of Taylor Nelson Sofres plc, a Non-executive Director of Thomson SA and Tangent Communications plc, and has also been Group Finance Director of Carlton Communications plc, Group Finance Director of LASMO plc and a Trustee of Pilotlight.
• Susan has extensive experience of investing in growing technology businesses, acquisitions, intellectual property and exploitation of new technologies.
• Susan is a Non-executive Director and Chair of the Remuneration Committee of both Benchmark Holdings plc and Horizon Discovery Group plc. She is Chair of Woodford Patient Capital Trust plc and Chair of Mercia Technologies plc (and Chair of its Nominations Committee), having been previously Deputy Chair and Chair of the Audit Committee. She is also a member of the international advisory board of PTT.
• She was a founder of Imperial Innovations Group plc, leading it as CEO from 2002 to July 2013, and previously has served on a variety of private company boards in engineering, healthcare and materials. Susan was a Trustee of Fight for Sight from 2013 to 2016.
• Jon Joined QinetiQ from Chloride Group plc where he held a similar role. He has a background in legal private practice as well as general counsel and company secretarial experience in other FTSE250 companies.
QinetiQ Group plc Annual Report and Accounts 201658

Mark ElliottNon-executive Chairman
Steve Wadey Chief Executive Officer
David Mellors Chief Financial Officer
Michael Harper Deputy Chairman and Senior Independent Non-executive Director
Lynn Brubaker Non-executive Director
Admiral Sir James Burnell-NugentNon-executive Director
Ian MasonNon-executive Director
Paul Murray Non-executive Director
Susan SearleNon-executive Director
Jon Messent Company Secretary and Group General Counsel
Appointment to the Board
Appointed Non-executive Chairman in March 2010. Appointed Non-executive Director between June 2009 and February 2010.
Appointed Chief Executive Officer in April 2015.
Appointed Chief Financial Officer in August 2008. Appointed Interim Chief Executive Officer from 1 January 2015 until 26 April 2015.
Appointed Non-executive Director in November 2011. Appointed Deputy Chairman and Senior Independent Non-executive Director in February 2012.
Appointed Non-executive Director in January 2016
Appointed Non-executive Director in April 2010.
Appointed Non-executive Director in June 2014.
Appointed Non-executive Director in October 2010.
Appointed Non-executive Director in March 2014.
Appointed as Company Secretary and Group General Counsel in January 2011.
Independence Independent on appointment Not applicable Not applicable Independent Independent Independent Independent Independent Independent Not applicable
Committee memberships
Nominations Committee (Chairman)Remuneration CommitteeRisk & CSR Committee
Nominations CommitteeRisk & CSR CommitteeSecurity Committee
Risk & CSR CommitteeSecurity Committee
Audit CommitteeNominations CommitteeRemuneration Committee (Chairman)Risk & CSR CommitteeSecurity Committee
Audit CommitteeNominations CommitteeRemuneration CommitteeRisk & CSR Committee
Audit CommitteeNominations CommitteeRemuneration Committee Risk & CSR Committee (Chairman)Security Committee (Chairman)
Audit CommitteeNominations CommitteeRemuneration CommitteeRisk & CSR Committee Security Committee
Audit Committee (Chairman)Nominations CommitteeRemuneration Committee Risk & CSR CommitteeSecurity Committee
Audit CommitteeRemuneration Committee Risk & CSR CommitteeNominations CommitteeSecurity Committee
Skills and experience
• Mark has experience of a variety of industry sectors from membership of the boards of FTSE listed companies.
• Mark is a Non-executive Director of G4S plc, where he is the Senior Independent Director and Chairman of the Remuneration Committee, and Chairman of Kodak Alaris Holdings Limited.
• He was a Non-executive Director of Reed Elsevier Group plc (and also Chairman of its Remuneration Committee) and Reed Elsevier NV from April 2003 until April 2013. He worked for IBM for over 30 years where he occupied a number of senior management positions, including General Manager of IBM Europe, Middle East and Africa and was a member of IBM’s worldwide Management Council.
• Steve has in-depth experience of the defence industry and technology and extensive operational and corporate experience and stewardship. He is a Fellow of the Royal Academy of Engineering, a Fellow of the Institution of Engineering and Technology and a Fellow of the Royal Aeronautical Society.
• During the year under review, Steve ceased to be Co-Chair of the Defence Growth Partnership (DGP) but retained his involvement in the DGP by taking up the role as Chair of the Industry Liaison Board of the UK Trade & Investment Defence & Security Organisation. Steve was also appointed as a member of the Prime Minister’s Business Advisory Group. Also during the year under review, Steve ceased to be a Non-executive director of the UK MOD Research and Development Board. Previously, Steve held various roles with MBDA from 2001 to 2014, most recently as Managing Director, MBDA UK and Technical Director for the MBDA Group. Before that, he held various roles in engineering with Matra BAe Dynamics from 1996 to 2001, and various roles with British Aerospace held from 1989 to 1996. He was also Co-Chair of the National Defence Industries Research & Development Group.
• David has extensive experience of working in a listed company environment and of the defence, technology and services sectors. He is a member of the Institute of Chartered Accountants in England and Wales.
• David was previously Deputy Chief Financial Officer of Logica plc, Chief Financial Officer of Logica’s international division, covering operations in North America, Australia, the Middle East and Asia and, before that, he was the Group Financial Controller. Earlier experience included various roles with CMG plc, Rio Tinto plc and Price Waterhouse.
• Michael has a wealth of operational and corporate experience and stewardship, including in the engineering sector.
• He is a Non-executive Director of the Aerospace Technology Institute. Michael was Chairman of Ricardo plc from November 2009 until November 2014, having joined that Board in 2003, Chairman of BBA Aviation plc from June 2007 until May 2014, having joined that Board in 2005 and Chairman of Vitec Group plc from 2004 to 2012. He was Senior Independent Director of Catlin Group Limited from 2005 to 2011. Michael was previously a Director of Williams plc where, at the time of the demerger in 2000, he became CEO of Kidde plc.
• Lynn has considerable experience in the international aerospace industry, including responsibility for business development, strategy, operational and manufacturing issues. She has a strong track record of running international operations, as well as experience of businesses in which technology and intellectual property are important.
• She is a Non-executive Director of FARO Technologies Inc., Hexcel Corp. and The Nordam Group. Previously, Lynn was a Non-executive Director of Force Protection, Inc., Seabury Group, Graham Partners, Cordiem, Chairman of the Flight Safety Foundation, and a member of the Management Advisory Council of the Federal Aviation Administration. Lynn retired from Honeywell International in 2005, where she was Vice President and General Manager of Commercial Aerospace. Prior to that, she held a variety of roles in the commercial aerospace sector working for Allied Signal (which acquired Honeywell in 1999), the McDonnell Douglas Corporation, Republic Airlines and ComAir Airlines.
• Sir James has significant experience of the defence industry, contracting with government and management. He is Non-executive Chairman of Witt Limited and was High Sheriff of Devon during 2015. During a 37-year career in the Royal Navy, which culminated in his appointment as Commander-in-Chief Fleet, he commanded the aircraft carrier HMS Invincible and three other ships and submarines. Between operational duties, Sir James held several positions at the MOD and gained cross-Whitehall experience while on secondment to HM Treasury.
• Ian has considerable experience in strategy, business transformation, eCommerce and international development.
• He was Group Chief Executive of Electrocomponents plc from 2001 until 31 March 2015, having joined that company in 1995. Previously he worked for The Boston Consulting Group and was a Non-executive Director of the Sage Group plc from 2007 to 2013.
• Paul has a broad range of experience in finance and corporate governance from a cross-section of industries, all of which leverage technology.
• He is a Non-executive Director and Chair of the Audit & Risk Committee at Royal Mail Group plc. Paul is also a Director of Independent Oil and Gas plc, Ventive Ltd and Naked Energy Ltd. Previously, Paul was a Director of Knowledge Peers plc, Senior Independent Director of Taylor Nelson Sofres plc, a Non-executive Director of Thomson SA and Tangent Communications plc, and has also been Group Finance Director of Carlton Communications plc, Group Finance Director of LASMO plc and a Trustee of Pilotlight.
• Susan has extensive experience of investing in growing technology businesses, acquisitions, intellectual property and exploitation of new technologies.
• Susan is a Non-executive Director and Chair of the Remuneration Committee of both Benchmark Holdings plc and Horizon Discovery Group plc. She is Chair of Woodford Patient Capital Trust plc and Chair of Mercia Technologies plc (and Chair of its Nominations Committee), having been previously Deputy Chair and Chair of the Audit Committee. She is also a member of the international advisory board of PTT.
• She was a founder of Imperial Innovations Group plc, leading it as CEO from 2002 to July 2013, and previously has served on a variety of private company boards in engineering, healthcare and materials. Susan was a Trustee of Fight for Sight from 2013 to 2016.
• Jon Joined QinetiQ from Chloride Group plc where he held a similar role. He has a background in legal private practice as well as general counsel and company secretarial experience in other FTSE250 companies.
QinetiQ Group plc Annual Report and Accounts 2016 59
Strategic report Governance Financial statements Additional information

B Effectiveness The Board considers that the skills and experience of its individual members, particularly in the areas of UK defence and security, the commercialisation of innovative technologies, corporate finance and governance, international markets and risk management, have provided both support and challenge to the CEO, CFO and the executive management team during the year, in terms of both the formulation of the new strategy and transformation programme and also in respect of ‘business as usual’ items which require Board oversight, such as financial and trading matters and significant commercial projects.
Director training and developmentOn appointment, Directors receive a tailored induction programme, comprising site visits, meetings with management, and training where required. Lynn Brubaker, who joined the Board in January 2016, has visited facilities at QinetiQ’s Farnborough site where she met with senior management and has received a technical briefing in respect of Directors’ responsibilities and listed company obligations from the company’s legal advisor, Ashurst LLP. Further site visits are being arranged.
On an ongoing basis, Directors receive appropriate training about the company and their duties. The Directors are also required to complete the annual business ethics training, as noted on page 65. The Company Secretariat organises site visits and training to suit individual requirements. During the year, individual Non-executive Directors visited the Boscombe Down and Fort Halstead sites as a result of specific requests and the Board received collective training in the form of technical briefings from KPMG on accounting changes and from Ashurst on the Model Code and changes being brought in by the Market Abuse Regulation. Non-executive Directors also personally arrange and attend external updates and training courses.
Succession planningThe Nominations Committee oversees succession planning for the Board and senior management to ensure the optimum balance of skills and experience and to ensure that the requirements for updating Board membership are met on a timely basis. The report of the Nominations Committee can be found on page 62.
Independence of Non-executive DirectorsOf the current Directors of the company, the Board considers all the Non-executive Directors to be independent of QinetiQ’s executive management and free from any business or other relationships that could materially interfere with the exercise of their independent judgement. The Board considers that more than half its members were independent Non-executive Directors throughout the last financial year.
The Non-executive Directors bring independent judgement on key issues affecting the Group and its business operations including strategy, performance, resources (including key appointments) and standards of conduct. Their independence of character and integrity, together with the experience and skills that they bring to their duties, prevent any individual or small group from dominating the decision-making of the Board as a whole.
The Nominations Committee’s role is to ensure that the composition of the Board and its Committees provides the optimum balance of skills, knowledge and experience, and to oversee succession planning for the Board and senior management. The report of the Nominations Committee can be found on page 62.
QinetiQ Group plc Annual Report and Accounts 201660
Corporate governance statement continued

Performance of the BoardQinetiQ continues each year to evaluate the performance of the Board and its Committees. During the year, an external evaluation of the effectiveness of the Board and its Committees was carried out. The previous external evaluation had taken place in 2012 and the current evaluation had been deferred from 2015 owing to the change of Chief Executive Officer during the year. In the intervening years, the Board’s effectiveness was assessed internally by way of a questionnaire completed by Board members and individual performance reviews carried out by the Chairman and the Senior Independent Director.
Timing and appointment of external reviewerDuring the year, the Board agreed the timings and process for the external evaluation. A shortlist of potential external reviewers was drawn up by the Company Secretary and the Chairman. Following a selection process, Lintstock were appointed to carry out the effectiveness reviews. Lintstock had no other connection with the company. The review took place in the final quarter of the year so that it could be fully focused on outside the financial reporting cycle and strategy meetings.
Review processThe review consisted of a series of questionnaires in respect of each of the Board and its Committees and the Chairman, which were completed by each director and the Company Secretary, and then the feedback from these questionnaires was used to facilitate one-to-one interviews. In order to obtain a complete overview of the workings of the Board and its Committees, the Committee questionnaires covered time management and composition, process and support, and the work of the Committee; and the Board questionnaire covered composition, expertise, dynamics, time management, support, Board Committees, strategic oversight, risk management and internal control, succession planning and HR management, and priorities for change. The questionnaire in respect of the Chairman covered relationships and communications with members of the Board, availability, management of Board meetings and areas for improvement.
Key findingsThe results of the review were presented by the Chairman at the Board’s March meeting. In terms of the fulfilment of its governance responsibilities, the overall conclusion of the 2016 review was that the Board was satisfied that it continued to be effective in executing its duties. The following were noted:
The composition of the Board was rated highly. It was noted that a greater understanding of wider, international markets would be required as the company’s strategic priorities develop. The Board’s understanding of the views of shareholders and customers was considered to be appropriate, and it was considered that the Committees supported the Board effectively.
Relationships between individual Board members and with senior management, including the US Proxy Board, were highly rated, and it was noted that it was intended to further develop the relationship with the Proxy Board, subject to the requirements of the Proxy regime.
Going forwards, to maintain the Board’s understanding and oversight of group strategy and the areas in which the company operates, the Board’s agenda would specify items covering strategic topics and deep dives into key challenges, businesses, issues or geographies. These items would include presentations by the leadership involved, and would serve to facilitate the Board’s focus on the development and composition of the executive management team.
Priorities for the coming yearPriorities for the coming year were identified as: i) a review of the Board’s annual agenda, to focus on issues of strategy while maintaining the reporting rigour on operational and governance activity, and fulfilling the company’s governance responsibilities; ii) oversight of HR policy and the development of a more in-depth understanding of the management of employee engagement, performance management, diversity and succession planning; iii) reviewing Executive Committee succession planning; iv) reviewing the Board’s composition and skills; v) reviewing risk management and reporting processes; and vi) ensuring further interaction with the leadership community and senior executives during the year.
An Audit Committee effectiveness review, which was undertaken independently of the Board effectiveness review, was also undertaken by Lintstock and followed the same process. Details can be found in the Audit Committee report on page 73.
QinetiQ Group plc Annual Report and Accounts 2016 61
Strategic report Governance Financial statements Additional information

Corporate governance statement continued
Report of the Nominations Committee
Dear shareholder,During the year under review, the Nominations Committee continued the work which had begun in 2015 in respect of Board refreshment and diversity. This process began in 2015 with the appointments of Ian Mason as a Non-executive Director and Steve Wadey as the new CEO. It continued during the year with the appointment of Lynn Brubaker as an additional Non-executive Director and a number of senior appointments within the executive management team.
Going forwards, succession planning and a review of the balance of skills and experience will be key priorities.
Mark Elliott Nominations Committee Chairman
Membership and attendance during the year Member Attendance
Mark Elliott (Committee Chair) 4/4
Lynn Brubaker* –
Admiral Sir James Burnell-Nugent 4/4
Ian Mason 4/4
Michael Harper 4/4
Paul Murray 4/4
Susan Searle 4/4
Steve Wadey 4/4
* Lynn Brubaker joined the Board on 27 January 2016.
Nominations Committee allocation of time
Governance 10.0NED succession, skills and development 50.0ED succession, skills and development 25.0Senior Executive succession, skills and development 15.0
2016 %
Main responsibilitiesThe role of the Committee is to ensure that the composition of the Board and Committees comprises the optimum balance of skills, knowledge and experience, and to oversee succession planning for the Board and senior management. It considers diversity, including skills mix, international industry experience and gender, when seeking to appoint a new Director to the Board. The Committee’s full terms of reference can be found in the Governance section of the QinetiQ website at www.QinetiQ.com/about-us/corporate-governance.
The Committee meets as necessary and when called by its Chair. During the financial year ended 31 March 2016, the Committee met on four occasions.
OverviewKey areas of focus during the year were:
(a) Succession planning at Non-executive Director level; and
(b) Succession planning at senior management level.
The work of the Committee during the year built on: (i) the considerable work that had been carried out in the previous year to identify the requirements for updating the Board membership, and this was followed through; and (ii) overseeing the work being undertaken at the executive level to align executive succession planning with the overall business transformation and strategy, which was then presented to the Board as part of the overall strategy plan.
(a) Succession planning at Non-executive Director levelSince 2014, to ensure the alignment of Board skills with the needs of the Group’s strategy, the Committee has been focusing on the search for potential Non-executive Director candidates. The Zygos Partnership has undertaken this search on the company’s behalf. The firm is a signatory to the Voluntary Code of Conduct for Executive Search Firms, which requires them to ensure that at least 30% of the candidates are women, and it has no other connections with the company. Following a short-list review, potential candidates meet with the Chairman and Directors on an individual basis prior to selection. This search led to the appointment of Susan Searle in March 2014 and Ian Mason as an additional Non-executive Director in June 2014. In continuation of this process, Lynn Brubaker was appointed as an additional Non-executive Director in January 2016. Details of all three Directors’ background and experience can be found on pages 58 to 59. Lynn brings a US perspective to the Board and has in-depth experience of management in large corporations, the commercial aviation industry and international commerce.
As noted on page 61, an action arising from the Board’s annual effectiveness review is to review the Board’s composition and skills to ensure the right balance of skills and experience as the company evolves in pursuit of its strategic objectives. The Chairman and the CEO will begin this process with the formulation of a skills matrix for consideration by the Board.
QinetiQ Group plc Annual Report and Accounts 201662

1
2
3
Succession PlanningBoard
• Building on prior year activity
• Appointment of new directors
• Ensuring balance of skills and experience
• Review of skills to meet needs of new strategy
Succession PlanningSenior Management
• Oversight of processes for ensuring succession plans in place
• Focus on improving talentpipeline and diversity
• Meetings with senior management
• New executive appointments during year
DiversityBoard/Company-wide
• Board diversity policy
• Women represent 22% of Board
• Diversity includes gender, skills and experience
• Company-wide diversity activity
(b) Succession planning at senior management levelThe Committee continues to maintain oversight of the processes for ensuring that succession plans are in place for the top layer of management, with a focus on improving the talent pipeline and diversity. This process includes ensuring that the Board as a whole meets with senior management, that remuneration policy and long-term incentives for senior management are reviewed by the Remuneration Committee and that the Chairman works with the CEO to review succession planning and to ensure the right mix of skills and experience at the executive level. As part of the review of strategy during the year, the Capability Director and the CEO presented to the Board on succession plans for the top layer of management. New appointments have been made, including a new Human Resources Director and a new Sales and Business Development Director, and adjustments made to the executive leadership team, to have in place the appropriate level of management to take QinetiQ forwards with its new vision and strategy.
Board Diversity PolicyThe Board Diversity Policy was approved by the Board in 2013. The key statement and objectives of that policy (the full text of which is available on the QinetiQ website www.QinetiQ.com/about-us/corporate-governance) are as follows:
Statement: The QinetiQ Board recognises the benefits of diversity. Diversity of skills, background, knowledge, international and industry experience, and gender, amongst many other factors, will be taken into consideration when seeking to appoint a new Director to the Board. Notwithstanding the foregoing, all Board appointments will always be made on merit.
Objectives: The Board should ensure an appropriate mix of skills and experience to ensure an optimum Board and efficient stewardship.
The Board should ensure that it comprises Directors who are sufficiently experienced and independent in character and judgement.
The Board aimed to increase the proportion of women on the Board to 25% by 2015. Thereafter, the Board aimed to maintain a minimum Board composition of 25% women, such percentage to be reviewed annually.
Progress against the policy: Having previously met the 2015 target of 25% of the Board comprising women, changes since then led to a reduction in this proportion. Following the appointment of Lynn Brubaker in January 2016, the proportion of women members of the Board increased to 22%, which is working towards our original objective of 25%. The Committee notes the recommendation in the five-year review of the Davies report published in late 2015 to achieve a minimum representation of 33% by 2020.
Gender diversity will be taken into consideration in the review of Board composition and skills which is planned for the coming year. Any future appointments will be made on merit, however, and will continue to take into account diversity, not only in terms of gender, but also in terms of the appropriate mix of skills and experience.
Details of company-wide diversity and inclusion activity can be found in the Corporate responsibility section on page 28.
Our areas of focus
QinetiQ Group plc Annual Report and Accounts 2016 63
Strategic report Governance Financial statements Additional information

Corporate governance statement continued
C Accountability Board responsibility for risk management and internal controlThe Board is ultimately responsible for the Group’s system of internal control and for reviewing its effectiveness in safeguarding shareholders’ interests and the company’s assets. The system is designed to manage and mitigate, rather than eliminate, the risk of failure to achieve business objectives, and, like any appropriate or proportionate system of corporate internal control, cannot provide absolute assurance against material misstatement or loss.
How we manage risk
• Risk management – page 64 – managers identify and evaluaterisks; design and operation of internal controls to mitigate risks.
• Risk assurance – page 64 – oversight by operations and assurance managers, oversight functions and the Board and its Committees.
• Self-certification process – page 64 – annual process ofhierarchical self-certification.
• Internal control – page 65 – delegated authorities; policies, procedures and codes of practice.
• Internal audit function – page 67 – provides assuranceof the effectiveness of the control environment.
• Committee oversight of risk management – page 67
• Board oversight of risk management – page 67
• Board statements relating to risk management – page 68
Risk managementQinetiQ’s managers are responsible for the identification and evaluation of significant risks, both financial and non-financial, applicable to their areas of business, together with the design and operation of suitable internal controls to ensure effective mitigation. These risks, which are related to the achievement of business objectives, are assessed on a continual basis and may be associated with a variety of internal and external events, including control breakdowns, competition, disruption, regulatory requirements, and natural and other catastrophes. The Board, the Audit Committee and the Risk & CSR Committee regularly review significant risks to the business.
QinetiQ’s risk management processes are defined in the Group’s Operating Framework and business management systems and mirror the Institute of Risk Management’s guidance as detailed in the figure on page 42.
Risk reporting is embedded in the management of the business through the Governance Committee (which was merged into the Executive Committee on 1 April 2016) and Quarterly Business Reviews (which changed to monthly Business Performance Reviews on 1 April 2016) and feeds into Group strategy at the executive and Board level.
Risk assuranceRisk assurance activity conforms to the three lines of defence model and is performed by (1) the businesses, through operations and assurance managers, (2) oversight functions, including the Safety and Operational Assurance team, and (3) Internal Audit, reporting to the Governance Committee (whose activities were merged into the Executive Committee from 1 April 2016) and the Board’s Audit Committee in respect of financial risks, and the Board’s Risk & CSR Committee in respect of non-financial risks. Further details can be found on page 65 in the ‘Internal control’ section.
The reports of the Audit Committee and of the Risk & CSR Committee can be found on pages 70 and 75 respectively.
Details of key risks can be found in the ‘Principal risks and uncertainties’ section of this Annual Report on pages 42 to 49.
Risk assurance activity was ongoing during the year under review. The following areas were covered bi-monthly by the Governance Committee and then key issues reported four times a year to the Risk & CSR Committee:
• Updates in respect of general risk governance from the Group Director: Safety and Governance.
• Reviews of divisional risk registers and moderation to form theGroup Risk Register.
• Quarterly reports from the Internal Audit function in respect of the effective management of Group risks and the risk management process.
• Challenge to risk identification by business divisions and functions.
• Use of the Business Assurance Tool to manage effective internal control against regulatory and operational risks.
• Regularly requiring risk owners to report their activity to the Risk & CSR Committee (further details can be found on page 43).
Self-certification processAn annual process of hierarchical self-certification, which provides a documented and auditable trail of accountability for the operation of the system of internal control, is in operation. This self-certification process is informed by a rigorous and structured self-assessment that addresses compliance with Group policy. It provides for successive assurances to be given at increasingly higher levels of management and, finally, to the Board.
QinetiQ Group plc Annual Report and Accounts 201664

Internal controlQinetiQ’s businesses are responsible for ensuring that a robust risk and control environment is in place as part of their day-to-day operations. Business assurance and operations managers oversee this process and a clear set of delegated authorities is in place, covering financial and non-financial activities, and is consistent with effective operational control and risk management and the Board’s risk appetite. During the year under review, the business was guided by two key resources managed by the Safety and Operational Assurance team:
• ‘The Way We Work’ was applicable to all staff and covered three key pillars of the way the company operates: Organisation, Risk Management and Assurance, and Key Business Processes. It was underpinned by key business policies, the Operating Framework (referred to below) and our culture, values and brand; and
• The ‘Operating Framework (Business Management System)’, which contains the policies, procedures and codes of practice which are expected to be complied with across the business, either as specifically set out in the ‘Operating Framework’ or by adopting similar policies and processes to fit with local structures and requirements.
With effect from 1 April 2016, ‘The Way We Work’ was replaced by a new framework of ‘Operating Principles’ and associated ‘Organisational Notes’ to support the new operating model and organisation. The new framework applies to every employee within the QinetiQ Group, including all subsidiaries, with the exception of Foster-Miller, Inc., due to the proxy arrangement as detailed on page 66. Foster-Miller, Inc. is, however, an active and supportive participant in this overall framework and their President is a member of the new Executive Committee.
Confidential reporting processThe company has in place a confidential reporting process which is detailed on the company’s intranet. If an individual does not feel that they can resolve any concerns with the company directly, either through discussions with their line manager or directly with the Company Secretary or Group Internal Audit Manager, they can use an externally provided confidential internet and telephone reporting system, further details can be found in the Corporate responsibility section on page 33. All concerns are passed by the external third party to the Group Internal Audit Manager who will ensure that they are held in strict confidence and are properly investigated. Reports on confidential reporting activity and the outcome of investigations are regularly reported to the Audit Committee. The Audit Committee reviewed the effectiveness of the Group’s confidential reporting process during the year, as detailed on page 72.
Anti-bribery and the prevention of corruptionQinetiQ has internal procedures in place that are designed to ensure compliance with the UK Bribery Act 2010, and other international regulations and best practice relating to the prevention of corruption, which are applicable to its business.
EthicsThe company provides employees with guidance to assist them in making informed ethical decisions on a day-to-day basis, including the company’s Code of Conduct, mandatory annual ethics training for all employees and the company’s Directors, and links to the country risk table and review panel processes for doing business in high risk countries.
Further details regarding activity in respect of corporate responsibility, including in respect of business ethics and anti-bribery risk management, can be found in the Corporate responsibility section on pages 26 to 33.
Risk management and internal control: financial reporting processThe following elements provide assurance in respect of the financial reporting process and preparation of consolidated accounts:
• the financial management and control framework;
• the company’s finance function;
• the internal control and risk management systems;
• the internal audit function;
• the external audit function; and
• oversight by the Audit Committee and the Board.
The company operates a financial management and control framework, comprising a system of targets, reporting (external and internal) and controls, that is embedded throughout the businesses and on which progress is reported to the Audit Committee and to the Board. The finance function consists of different financial reporting teams who report to the CFO. The Group Finance team comprises suitably qualified and experienced professionals, including accountants. It is responsible for the preparation of the interim and annual reports and for internal financial reporting to senior management and the Board. To ensure a consistency of approach and accuracy in financial reporting, the team provides advice on accounting and financial reporting issues to QinetiQ’s businesses and sets the Group’s accounting policies which are contained in the Finance Accounting Manual. The team liaises with the external auditor.
The internal control and risk management systems described on pages 64 and 77 apply to the company’s process of financial reporting and the preparation of consolidated accounts. The internal audit and external audit functions, and the reviews by the Audit Committee and the Board, provide a structured approach to the review and challenge of financial information and financial reporting. The report of the Audit Committee can be found on page 70 and the work of the Board in respect of financial oversight can be found on pages 55 and 67.
QinetiQ Group plc Annual Report and Accounts 2016 65
Strategic report Governance Financial statements Additional information

Corporate governance statement continued
Management and control of US subsidiariesThe US Global Products division, trading as QinetiQ North America and comprising approximately 92% of the total US revenue (excluding Cyveillance, Inc.) in 2016, operates under a Proxy arrangement, as detailed below, with the remainder of the US business operating outside the Proxy regime and therefore following the same reporting lines and processes as the Group’s other, non-regulated businesses.
US Global Products division and the Proxy arrangementThe US Global Products division, trading as QinetiQ North America, is managed via Foster-Miller, Inc. (FMI), a wholly-owned subsidiary of QinetiQ in the US. It has been placed under a Proxy arrangement as it is required by the US National Industrial Security Program to maintain facility security clearances and to be insulated from foreign ownership, control or influence. Under the new Proxy arrangement (put in place in 2014, following the sale of the US Services business), FMI and the US Department of Defense (DoD) are parties to a Proxy agreement that regulates the management and operation of FMI. Pursuant to this Proxy agreement, QinetiQ has appointed four US citizens who hold the requisite US security clearances as Proxy holders to exercise the voting rights in FMI.
During the year there was a change in Proxy holders following the death of Len Moodispaw. Len made a significant contribution to the Group and will be sadly missed. The current Proxy holders comprise David Carey, John Currier, Tom Mills and Scott Webster. The Proxy holders are also Directors of FMI, with David Carey as Chairman. In addition to their powers as Directors, the Proxy holders have power under the Proxy arrangements to exercise all prerogatives of share ownership of FMI. The Proxy holders have a fiduciary duty, and agree, to perform their role in the best interests of QinetiQ as shareholder (including the legitimate economic interest), and in a manner consistent with the national security interests of the US. QinetiQ Group plc does not have any representation on the Board of FMI. QinetiQ Group plc may not remove the Proxy holders other than for acts of gross negligence or wilful misconduct or for breach of the Proxy agreement (and always only with the consent of the US Defense Security Service).
In terms of the power to govern, the Proxy agreement vests certain powers solely with the Proxy holders and certain powers solely with QinetiQ. For example, the Proxy holders cannot carry out any of the below without QinetiQ’s express approval:
• sell or dispose of, in any manner, capital assets or the business of FMI;
• pledge, mortgage or encumber assets of FMI for purposes other than obtaining working capital or funds for capital improvements;
• merge, consolidate, reorganise or dissolve FMI; and
• file or make any petition under the federal bankruptcy laws or similar law or statute of any state or any foreign country.
Unlike minority interest holders with protective veto rights, QinetiQ can unilaterally require the above to be carried out and these are, therefore, considered to be significant participative features. In addition, QinetiQ can require the payment of dividends, and the pay-down of parent company loans, from FMI.
The company maintains its involvement in FMI’s activities through normal business activity and liaison with the Chair of the Proxy Board. QinetiQ’s CEO and CFO attended two meetings of the Proxy Board during the year under review. The President of FMI is a member of the new Executive Committee (as detailed on page 56). FMI commercial and governance activity is included in the business update provided in the regular executive report to the Board. As detailed in the Audit Committee report on page 70, a local accountancy firm was engaged during 2015 to undertake an internal audit of FMI key processes and further internal audit work is planned for 2016. This activity is subject always to the confines of the Proxy regime to ensure that it meets the requirement that FMI must conduct its business affairs without external control or influence, and the requirements necessary to protect the US national security interest.
QinetiQ Group plc Annual Report and Accounts 201666

Internal audit functionThe internal audit function, which is independent of the business and has a direct reporting line to the Audit Committee, provides assurance to the Board and its Committees over the effectiveness of the internal control environment. The programme of work undertaken by the internal audit function is approved in advance by the Audit Committee. It is prioritised according to risks identified by the Group through its risk management processes. Additionally, regular discussions are held between the internal audit function and the external auditor regarding internal audit reports, risks, internal audit plans and the wider control environment.
Committee oversight of risk management The risk management process and the system of internal control necessary to manage risks are managed by the Audit Committee (financial risks) and the Risk & CSR Committee (non-financial risks). The full Board attends these Committee meetings, either as a Committee member or as a guest so as to receive at first-hand the findings of the Committee. Details of the Committee memberships are set out on page 5. The internal audit function independently reviews the risk identification and control processes implemented by management and reports to the respective Committee.
The Audit Committee and the Risk & CSR Committee also review the assurance process, ensuring that an appropriate mix of techniques is used to obtain the level of assurance required by the Board. The reports of both Committees can be found on pages 70 and 75 respectively.
Board oversight of risk managementThe Board oversees the system of risk management and internal control by means of the Audit Committee and the Risk & CSR Committee in conjunction with the risk management and assurance processes details in this section. Any matters of particular concern are escalated for presentation at a Board meeting by the relevant personnel. Examples of such escalation are consideration of cyber risk and strategic risk. The Board routinely challenges management to ensure that the systems of internal control are constantly improving to maintain their effectiveness. Once a year, the CEO presents to the Board on the system of internal control in operation during the year.
At its meeting in March 2016, the Board reviewed the effectiveness of the system of internal control that was in operation during the financial year ended 31 March 2016. Details of specific risk review activity undertaken during the year by the Audit and Risk & CSR Committees, together with the current risk registers, were presented by the CEO.
In the light of the new strategic priorities and organisational structure, the Board has requested the Risk & CSR Committee to undertake a review of risk management and its reporting for the coming year.
QinetiQ Group plc Annual Report and Accounts 2016 67
Strategic report Governance Financial statements Additional information

Corporate governance statement continued
Directors’ statement in respect of ‘fair, balanced and understandable’ assessmentAll of the Directors consider that the Annual Report, taken as a whole, is fair, balanced and understandable and provides the information necessary for shareholders to assess the company’s position and performance, business model and strategy. In this context, the coordination and review of the Group-wide input into the Annual Report is a vital part of the control process upon which the Directors rely and is an exercise which spans a period wider than the timetable for compiling the Annual Report itself. Critically these processes include the controls the business operates throughout the year to identify key financial and operational issues. Further details can be found in the report of the Audit Committee on page 70.
Board assessment of principal risksThe Board confirms that it has carried out a robust assessment of the principal risks facing the company, including those that would threaten its business model, future performance, solvency or liquidity. The way in which the Board understands and manages risk is set out on pages 64 to 77 and details of key risks and their management and mitigation can be found on pages 42 to 49. Board level oversight is carried out by the Audit Committee and the Risk & CSR Committee. As noted in the previous paragraph, at its meeting in March, the CEO presented details of the risk review activities that had taken place during the year.
Board review of the effectiveness of risk management and internal control processesThe Board confirms that it has conducted a review of the effectiveness of the company’s risk management and internal control systems in operation during the year, as required by the Code. The Board considers that the risk review activities undertaken during the year under review, as presented by the CEO at the Board’s March meeting, amounted to an effective system being in place to ensure that all aspects of risk management and internal control had been considered for the year under review. Details of the company’s principal risks and uncertainties and how they are managed and mitigated can be found on pages 42 to 49. Details of the company’s risk management and internal control systems are set out in this Corporate governance statement on pages 64 to 77, and the reports of the Audit Committee and Risk & CSR Committee in respect of the oversight of risk management can be found on pages 70 and 75 respectively.
Going concernThe Group’s activities, combined with the factors that are likely to affect its future development and performance, are set out on pages 2 to 49. The Chief Financial Officer’s review on pages 38 to 41 sets out details of the financial position of the Group, the cash flows, committed borrowing facilities, liquidity, and the Group’s policies and processes for managing its capital and financial risks. Note 27 on page 129 to the financial statements also provides details of the Group’s hedging activities, financial instruments, and its exposure to liquidity and credit risk.
The Group meets its day-to-day working capital requirements through its available cash funds and its bank facilities. The market conditions in which the Group operates have been, and are expected to continue to be, challenging as spending from the Group’s key customers in its primary markets in the UK and US remains under pressure. Despite these challenges, the Directors believe that the Group is well positioned to manage its overall business risks successfully. After making enquiries, the Directors have a reasonable expectation that the Group has adequate resources to continue in operational existence for the foreseeable future. The Group therefore continues to adopt the going-concern basis in preparing its financial statements.
The Group is exposed to various risks and uncertainties, the principal ones being summarised in the ‘Principal risks and uncertainties’ section on pages 42 to 49. Crystallisation of such risks, to the extent not fully mitigated, would lead to a negative impact on the Group’s financial results but none are deemed sufficiently material to prevent the Group from continuing as a going concern for the next 12 months.
Board statements relating to risk management
QinetiQ Group plc Annual Report and Accounts 201668

Viability statementLonger-term viability assessment: assessing the prospects of the GroupThe Group’s corporate planning processes involve the following individual processes covering differing time frames:
1. An annual Strategic Plan (or Strategic Plan update) process that looks at the detailed financials for the subsequent three years, together with an overview of one additional year, to 31 March 2020.
2. An annual budget process that covers the subsequent two years.
3. A bi-annual detailed forecast process to update the view of the first budget year (the year now in progress).
4. A rolling monthly ‘latest best estimate’ process to assess significant changes to the budget/forecast for the year in progress.
The corporate planning process is underpinned by assessing scenarios and risks that encompass a wide spectrum of potential outcomes, both favourable and adverse. The downside risk scenarios are designed to explore the resilience of the Group to the potential impact of all the significant risks set out on pages 44 to 49, or a combination of those risks.
The scenarios are designed to be severe but plausible, and take full account of the availability and likely effectiveness of the mitigating actions that could be taken to avoid or reduce the impact or occurrence of the underlying risks, and that realistically would be open to them in the circumstances. In considering the likely effectiveness of such actions, the conclusions of the Board’s regular monitoring and review of risk and internal control systems, as discussed on page 67, is taken into account.
Alongside the annual review of risk scenarios applied to the strategic plan, performance is rigorously monitored to alert the Board and Operating Committee to the potential crystallisation of a key risk.
We consider that this stress-testing based assessment of the Group’s prospects is reasonable in the circumstances of the inherent uncertainty involved.
The period over which we confirm longer-term viabilityWhilst the Directors have no reason to believe the Group will not be viable over a longer period than three years, given the inherent uncertainty involved, the period over which the Directors consider it possible to form a reasonable expectation as to the Group’s longer-term viability is the three-year period to 31 March 2019. This period, essentially the period used for our mid-term business plans that are subject to stress-testing and scenario planning, has been selected because it presents the Board and readers of the annual report with a reasonable degree of confidence whilst still providing an appropriate longer-term outlook.
Confirmation of longer-term viabilityAs noted on the previous page, the Directors confirm that their assessment of the principal risks facing the Group was robust. Based upon the robust assessment of the principal risks facing the Group and their stress-testing based assessment of the Group’s prospects, all of which are described in this statement, the Directors have a reasonable expectation that the Group will be able to continue in operation and meet its liabilities as they fall due over the period to 31 March 2019.
QinetiQ Group plc Annual Report and Accounts 2016 69
Strategic report Governance Financial statements Additional information

Corporate governance statement continued
Report of the Audit Committee
Dear shareholder,I am pleased to present the report of the Audit Committee on the work carried out during the last financial year. I continue to foster an open but challenging dialogue between the Committee, management, and internal and external auditors. This way of working continues, with reports from the executive and internal and external auditors being scrutinised and challenged where appropriate, and I intend to continue with this robust approach, in line with the requirements of the UK Corporate Governance Code.
The main responsibilities of the Committee are set out in this report. In addition to reviewing the Group’s financial reporting processes and external audit effectiveness, other matters that we considered during the year were the process for the forthcoming external audit tender and a review of the process and requirements for the longer-term viability statement. Further details are set out in this report.
As noted on page 61, an external review of the effectiveness of the Board and its Committees was carried out during the year. The outcome of the review in respect of the Audit Committee is set out on page 73 and I look forward to working with the Chair of the Risk & CSR Committee in the coming months to review the processes for risk management and reporting.
Paul Murray Audit Committee Chairman
Membership and attendance during the year Member Attendance
Paul Murray (Committee Chair) 5/5
Lynn Brubaker* 1/1
Admiral Sir James Burnell-Nugent 5/5
Michael Harper 5/5
Ian Mason 5/5
Susan Searle 5/5
* Lynn Brubaker joined the Board on 27 January 2016.
Audit Committee allocation of time
2016 %Governance 13.0Financial Reporting 47.0Audit 25.0Risk management and internal controls 15.0
The Audit Committee is chaired by Paul Murray. The Board considers him to have recent and relevant financial experience. He was formerly Group Finance Director of Carlton Communications plc and LASMO plc, and he is currently Audit & Risk Committee Chairman at Royal Mail Group plc. The Board considers the members of the Committee to be independent. They bring extensive experience of corporate management in senior executive positions to the company. Details of their background and experience can be found on pages 58 and 59. The CEO, CFO, Group Financial Controller, Group Internal Audit Manager and representatives of the external auditor normally attend Audit Committee meetings.
Main responsibilitiesThe Audit Committee monitors the Group’s integrity in financial reporting and reviews the effectiveness of the financial risk management framework. The Committee has an annual calendar of activities, in addition to which it identifies particular areas of focus during the year. The Committee’s full terms of reference can be found in the Governance section of the QinetiQ website at www.QinetiQ.com/about-us/corporate-governance.
The Audit Committee meets as necessary and at least four times a year. During the financial year ended 31 March 2016, the Committee met on five occasions.
The external auditor has the right to request that a meeting of the Audit Committee be convened. During the past financial year, and in accordance with its terms of reference, the Committee met with each of QinetiQ’s external auditor and the Group Internal Audit Manager on two separate occasions, without Executive Directors present, to discuss the audit process and assure itself regarding resourcing, auditor independence and objectivity.
OverviewThis report describes the work of the Committee in discharging its responsibilities, including:
a) the significant issues considered by the Committee in relation to the preparation and reporting of the full and half-year financialstatements, and how these issues were addressed;
b) assessment of the ‘fair, balanced and understandable’ requirement;
c) the review of internal controls;
d) the review of various individual matters during the year;
e) annual effectiveness reviews; and
f) external audit: the provision of non-audit services, auditor re-appointment and the re-tender of the external audit.
The Committee received presentations, reports and analyses from the CFO, the Group Financial Controller, the Group Internal Audit Manager and the external auditor during the course of its meetings.
QinetiQ Group plc Annual Report and Accounts 201670

a) The significant issues considered by the Committee in relation to the preparation and reporting of the full and half-year financial statements, and how these issues were addressed:The Committee reviewed whether suitable accounting policies had been adopted, whether management had made the appropriate estimates and judgements, and sought support from the external auditor to assess them. To facilitate this process, the Committee received presentations from the CFO and the Group Financial Controller in respect of goodwill, accounting provisions for key contracts, litigation, trade controls and the treatment for taxation. It also received a report from the external auditor on the outcome of the audit.
The Committee reviewed the following main issues for the periods ended 30 September 2015 and 31 March 2016:
• the basis for, and judgements made by management in determining, the liabilities recorded for litigation, onerous contracts, potential claims and other disputes;
• the provisions for income tax and deferred tax, and the disclosures associated with the election into the research and development expenditure credit (RDEC) regime, specifically the treatment of both the £36.8m RDEC receipt and the write-off ofthe previously capitalised £25.2m deferred tax asset as ‘specific adjusting items’;
• the carrying values of the Group’s cash generating units (CGUs),specifically the impairment of goodwill associated with the US Global Products CGU. The major assumptions impacting on the NPV of future expected cash flows were also discussed. Certain discount rate assumptions and market growth forecasts are advised by external consultants;
• assumptions used to value the net pension liability of £37.7m(as advised by the company’s external actuaries);
• the disclosures in the preliminary announcement and annual report and accounts, in particular those relating to risk, goodwilland tax; and
• the process for making the longer-term viability statement and the assessment of different scenarios that could arise, to enablethe Committee to make a recommendation to the Board at its May meeting. Further details can be found on page 69.
The reviews were carried out by way of papers presented by the CFO, the Group Financial Controller, the external auditor and the internal auditor, and through discussions with management. Based upon the business assurance process and discussions with management and the external auditor, the Committee was satisfied that the accounting disclosures and assumptions were reasonable and appropriate for a business of the Group’s size and complexity, that the external auditor had fulfilled its responsibilities in scrutinising the financial statements for any material misstatements and that the disclosures were satisfactory.
b) Assessment of the ‘fair, balanced and understandable’ requirement:The Committee was required to provide advice to the Board to meet with the requirements of the Code on whether the annual report and accounts, taken as a whole, provide a fair, balanced and understandable assessment of the company’s financial position and future prospects and provide all information necessary to a shareholder to assess the Group’s performance, business model and strategy. To enable it to do so, the CFO and members of managementpresented to the Committee details of the processes followed by management in preparing the accounts. In particular, the Committee noted:
• the Group has developed a clear strategy, which has been presented to the Board for review during the year by businessleaders, with updates on progress at each Board meeting;
• quarterly business reviews are undertaken by senior management which include monitoring business progress against budget;
• business performance is monitored by the Board as detailed on page 54;
• key individuals from appropriate business divisions and functionscontribute to, or are involved in the verification of, the content of the Annual Report;
• the company has an Annual Report working group, comprising individuals from the Finance, Investor Relations, Assurance, HR, Group Strategy, Company Secretariat and Communications functions, which adheres to a timetable of actions for the production and review of the Annual Report;
• the Annual Report working group is aware of the fair, balanced and understandable requirements and is tasked with ensuring that the Annual Report takes account of those requirements; and
• a checklist of considerations to ensure the requirements were met was completed by the working group and presented to the Committee in order to provide assurance to the Committee (and to the Board). The checklist includes areas such as ensuring what must be included to satisfy regulatory requirements, consulting with relevant experienced people to contribute and review each section, avoiding where possible the use of boiler-plate language and jargon, ensuring that all matters are discussed and all issues reported at an appropriate level of aggregation, with tables of reconciliations supported by and consistent with the accompanying narrative. There is an opportunity for contributors to provide comments on areas where there were difficulties or details of specific issues that have been considered.
The external auditor confirmed their satisfaction with the standard achieved. The Board’s statement in this respect can be found on page 68.
QinetiQ Group plc Annual Report and Accounts 2016 71
Strategic report Governance Financial statements Additional information

Corporate governance statement continued
c) Review of internal controls:The Committee monitors the effectiveness of the systems of internal control to gain assurance that an effective control framework is maintained. Reports on the effective operation of the control framework are received from management and reviewed by the Committee along with key policies and processes.
At four meetings during the year, reports on the operation of internal controls and risk management processes are also received from the internal audit function, including the confidential reporting process.
Particular attention is given to the timely and effective implementation of remedial actions, either identified by the business directly, or by the internal audit function. The internal audit function’s risk based strategic and annual plan is presented to, and scrutinised twice a year by, the Committee to provide assurance that resources are adequate and directed towards key risk areas. The annual plan is structured to ensure that all significant financial and non-financial risks are reviewed within a rolling three-year strategic plan. The audits include the review of financial systems, programmes and projects, as well as the management of specific risks identified through the Group’s risk management processes. Internal audit activity in the year continued to indicate that, overall, an effective control environment was in place, with an open culture of continuous improvement being demonstrated by regular management requests for internal audits to be undertaken.
The Committee also regularly reviews the effectiveness of the financial risk management framework, including reviewing key financial risks and assessing the effectiveness of management’s remedial action plans. The financial risk register is presented by management to the Committee at four meetings each year, noting (i) risks being actively managed through internal mitigation activity, including the timeframe for current mitigation to improve the risk position, (ii) risks managed at post-mitigation levels but heavily influenced by external factors and/or that require ongoing monitoring, and (iii) retired risks.
The process in respect of QinetiQ North America is adjusted to take into account the Proxy arrangements referred to on page 66. The executive management function has regular contact with the Chair of the Proxy Board and with US executive management, and the Group’s internal controls have been applied as far as possible within the requirements of the Proxy regime.
The internal audit function continues to work closely with US management to gain assurance that an effective control environment is in place. An internal audit of key control processes was undertaken during the year utilising a US-based accountancy firm, and their report summarising findings and recommendations was provided to the Committee. In addition, the Executive Directors attended meetings of the US Board during the year and further such meetings are planned.
The Committee confirms its view that it has received sufficient, reliable and timely information from management in the last financial year to enable it to fulfil its responsibilities.
d) Review of various individual matters during the year:The Committee has an annual calendar of matters which it considers. The following matters are examples of such items which the Committee considers as part of its annual cycle:
Group Tax policies and issues: The CFO presented a paper to update the Committee on the Group’s tax priorities and issues. The Committee considered these in the light of regulatory requirements and the Group’s profit mix. Among more general matters, procurement rules, R&D tax relief, the use of tax losses and the effective tax rate were discussed.
Annual review of the Committee’s Terms of Reference and Annual Schedule of Activities: The views of the Committee were sought on the Committee’s Terms of Reference and annual schedule of activities. As a result of the review, changes were made to the Terms of Reference to include a reference to the Committee’s obligation to run audit tenders and to procure the production of the longer-term viability statement. The annual schedule of activities was updated to include a ‘quality of earnings’ report for the May meeting.
QinetiQ Group plc Annual Report and Accounts 201672
e) Annual effectiveness reviews:The Committee’s September meeting considered the processes to be followed for the various governance reviews.
It agreed that the review of the effectiveness of the Committee itself and of the internal audit function would be taken alongside the Board effectiveness review to be carried out externally. The approach for the review of the external audit would follow the same, questionnaire-based process as for the previous year.
Audit Committee effectiveness reviewAs reported on page 61, the external effectiveness evaluation of the Board and its Committees had been deferred from 2015 owing to the change of Chief Executive Officer during the year. An evaluation had been carried out instead by way of an externally provided online questionnaire tool.
The following key actions had been noted from the 2015 Audit Committee effectiveness review:
• the Committee members would seek to undertake routine, externally sourced training to keep up to date with changes in regulation and guidance;
• the Committee would review the annual calendar of activities to ensure the most efficient and effective way to complete its oversight activities; and
• the Committee would continue to support the Remuneration Committee in assessing ‘quality of earnings’ decisions that drove long-term incentive and bonus outcomes.
All three items had been covered in the following year. Externally sourced training is made available to all Directors, either as a Board in the form of a technical briefing, or individually on request; there is a standing item for the review of the annual calendar of activities during the year; and an additional action has been added to the annual calendar in respect of the ‘quality of earnings’ review.
As detailed on page 61, the 2016 external review was carried out by Lintstock by way of an initial questionnaire which was then supported by individual interviews. The Audit Committee questionnaire covered the following areas: time management and composition, processes and support, the work of the Committee and priorities for change.
The outcome of the review was considered at the Committee’s March meeting. The effectiveness of the Committee was rated highly. As noted in the Board’s priorities for the coming year on page 61, one of the priorities is to review risk management and reporting processes, with the review being led by the Chairs of the Audit Committee and the Risk & CSR Committee.
Other recommendations to improve the performance of the Audit Committee over the coming year included receiving an update on the processes for the risk management and controls of the US business and to continue with Committee training to keep appraised of legislative evolution and best practice.
Review of the effectiveness of the external audit processThe Committee’s September meeting considered the approach for monitoring the effectiveness and independence of the external audit process in the light of the requirements of the Code and Financial Reporting Council (FRC) guidance. At this meeting, it was agreed that an effectiveness review would follow the same format as used in the previous year and be undertaken by way of questionnaire and would include collecting the views of management and employees who are specifically involved in supporting the external audit work, feedback from the CFO and Group Financial Controller and an open Committee discussion without external auditor being present.
The review covered a range of topics, some of which are set out below, with a summary of their outcomes:
• Audit scope: The audit scope adequately addresses the key financial risks of the Group and is discussed with management in a timely manner.
• Audit quality and approach: The audit approach demonstrates a good understanding of the business and provides adequate engagement with, and challenge to, management.
• Communication: The interaction between the auditor and management is effective, timely and allows for accounting treatment to be agreed and issues highlighted and resolved promptly.
• Governance and independence: There are appropriate structures in place to ensure the independence of the auditor and to provide adequate challenge to management.
The auditor was provided with details of the review and its results, and provided their comments on each of the topics covered. In particular, the auditor noted that there was scope to improve further the advance planning process, that the use of data analytics would be beneficial in respect of certain parts of the audit, and that they perceived a strong working relationship between management and the finance function.
The outcome of the review was considered at the May 2016 Committee meeting. The Committee noted the following matters which were reported to the Board: • There had been an improvement in all areas when comparing the
results to those for FY15, and the initiatives taken by the auditor following the previous review had had a positive impact.
• These initiatives had included ensuring that audit plans and data requests were sent as early as possible prior to, and during, the audit, dealing with any issues with businesses as they arise and ensuring that the audit team are fully briefed on key issues before the start of the audit.
• The auditor had confirmed that meetings between executive management and the auditor outside of the ongoing interaction with finance led to a better understanding of the business issues, performance and key challenges going forward.
QinetiQ Group plc Annual Report and Accounts 2016 73
Strategic report Governance Financial statements Additional information

Corporate governance statement continued
f) External audit: the provision of non-audit services, auditor re-appointment and the re-tender of the external audit
External auditor independence: non-audit services:
Policy on the regulation of non-audit work and safeguarding auditor independenceThe company views it as essential that the external auditor is both independent of any conflict of interest and perceived to be so. To safeguard auditor independence and objectivity, the following process is operated by the company:
The company has embedded a Code of Practice which sets out the principles for regulating the award of non-audit work to the external auditor within its Operating Framework. The policy clearly articulates the non-audit services which are prohibited, the non-audit services which can be purchased and the key approvals that are necessary prior to the provision of non-audit work. Any non-audit services conducted by the auditor require the consent of the CFO or the Chairman of the Audit Committee before being initiated; any services exceeding £50,000 in value require the consent of the Audit Committee as a whole.
In line with this policy, the Committee ensures that any other advisory and/or consulting services provided by the external auditor do not conflict with its statutory audit responsibilities and are conducted through entirely separate working teams; such advisory and/or consulting services generally only cover regulatory reporting, tax, and mergers and acquisitions work.
The Code of Practice enables the Committee to take corrective action if it believes that there is a risk of the external auditor’s independence being undermined through the award of such work.
It is also QinetiQ’s policy that no KPMG employee may be appointed to a senior position within the QinetiQ Group without the prior approval of the CFO.
Review of non-audit work during the yearThe Committee regularly reviews the cost and nature of non-audit work undertaken by the external auditor during the financial year. It is included at regular intervals in the Committee’s annual schedule as a standing item. An update on non-audit fees was tabled at three Committee meetings during the year.
In the last financial year, the fees relating to non-audit services amounted to £199,000 (2015: £99,000), being approximately 33% of the audit fee and 25% of the total fees. The fees related predominantly to the review of US Services business closing working capital, following the sale of that business in May 2014. The Committee had concluded, prior to engaging KPMG for the provision of these services, that there had not been any conflict of interest that might compromise the independence of KPMG’s audit work. Details of the external auditor’s remuneration can be found in note 4 on page 115.
Auditor re-appointment and re-tender process At its May meeting, the Committee reviewed the effectiveness and the independence of the external auditor during the year. The members of the Committee have declared themselves satisfied with the performance of KPMG as the company’s auditor in the last financial year and therefore the Committee has recommended to the Board that KPMG be reappointed for the financial year ending 31 March 2017.
At its meeting in March, the Committee considered the timings for the tender of the external audit. The Committee notes the provision in the UK Corporate Governance Code that FTSE 350 companies should put the external audit out to tender at least every 10 years and the requirements of the new EU audit regulation which takes effect in member states from June 2016.
KPMG has been the auditor of the QinetiQ Group since its formation in 2001 as the result of a competitive tender, and the company’s auditor since its incorporation in 2002. During that time, there have been periodic changes in audit partners in accordance with professional and regulatory standards to protect independence and objectivity. A rotation of KPMG’s lead audit partner was last undertaken during 2012, at which time the second audit partner was appointed since the company’s flotation in 2006.
The company stated in the previous annual report and accounts that it was its intention to align the process for putting the external audit contract out to tender with the conclusion in 2017 of the five-year tenure of the audit partner. The Committee maintains this view and it has recommended to the Board that a tender of the audit be carried out during 2016, with the selected auditor being proposed for appointment at the 2017 Annual General Meeting in respect of the financial year ending on 31 March 2018. There is no restriction on the choice of auditor. The process will include the appointment of a sub-committee to carry out preliminary discussions, face-to-face meetings, followed by the submission of proposals, presentations from short-listed firms and, following consideration by the Audit Committee, a recommendation from the Audit Committee to the Board for its consideration, in readiness for a 2017/2018 accounting year start date.
QinetiQ Group plc Annual Report and Accounts 201674

Report of the Risk & CSR Committee
Dear shareholder,I am pleased to report that, during the year, the Committee continued to carry out its core functions with the support of the executive Governance Committee in respect of non-financial risk management and oversight. The annual calendar of activity, together with the in-depth review of red risks and ‘deep dives’ into key risk areas, has continued to provide a firm basis on which the Committee is able to oversee the operation of the non-financial risk management processes within the Group. At each meeting an introductory note of the key issues for that particular meeting ensured that all relevant matters were considered and dealt with appropriately. In addition, a separate section of the Committee papers contained supplementary materials to ensure that there was sufficient detail for those Committee members who wished to have more in-depth information on a particular matter. Regular updates from management responsible for specific areas such as corporate responsibility or international trade served to further the Committee’s understanding of risks and how they are mitigated.
Admiral Sir James Burnell-Nugent Risk & CSR Committee Chairman
Membership and attendance during the year Member Attendance
Admiral Sir James Burnell-Nugent (Committee Chair)
4/4
Lynn Brubaker* –
Mark Elliott 4/4
Michael Harper 4/4
Ian Mason 4/4
David Mellors 4/4
Paul Murray 4/4
Susan Searle 4/4
Steve Wadey 4/4
* Lynn Brubaker joined the Board on 27 January 2016.
Risk & CSR Committee allocation of time
Governance 14.0Safety and Governance Director’s updates 19.0Corporate Social Responsibility 21.0Internal Audit 13.0Specific risk reviews/deep dives 33.0
2016 %
Main responsibilitiesThe Committee has three primary functions:
• to oversee the sound operation of the company’s risk management systems;
• to monitor non-financial risk exposures, including security, trade controls, ethics, corporate responsibility and health, safety and environment; and
• to monitor adherence to the generic MOD compliance system.
The Committee’s full terms of reference can be found in the Governance section of the QinetiQ website at www.QinetiQ.com/about-us/corporate-governance.
The Committee has an annual calendar of activities and meets as necessary, although normally not less than four times a year. During the financial year ended 31 March 2016, the Committee met on four occasions.
The Governance Committee continued to report, via the CEO, to the Risk & CSR Committee and covered areas such as the status of non-financial risks identified on the Group risk register, assurance around regulatory compliance and emerging risks.
OverviewDuring the year, the Committee continued to carry out its core functions by way of regular reporting in accordance with its annual calendar. The Committee continued to oversee health, safety and environment, trade controls, corporate responsibility, ethics and security through quarterly reports from the heads of those functions in the business. Details of key activities in respect of health, safety and environment and business ethics are set out in the Corporate responsibility section on pages 26 to 33.
Key areas of focus of the Committee during the year were:
a) a review of the Group’s risk management processes
b) generic MOD compliance system;
c) a review of the risk register in accordance with FRC recommendations; and
d) effectiveness review.
Further details are set out overleaf. Details of the principal risks and uncertainties can be found on pages 42 to 49 of the Strategic report.
QinetiQ Group plc Annual Report and Accounts 2016 75
Strategic report Governance Financial statements Additional information

Corporate governance statement continued
a) A review of the Group’s risk management processes:Each Committee meeting during the year was structured so that it received the following regular reports: a report from the Group Director-Safety and Governance, a report from the Group Director-Corporate Responsibility and an update from the Group Head of Internal Audit. The report from the Group Director – Safety and Governance covered key areas of risk management activity, including health and safety, international trade controls and Proxy regime compliance. It included a high level summary of changes to non-financial risks, an overview of assurance activity, and any other items to bring to the Committee’s attention. The report from the Group Director-Corporate Responsibility covered areas such as business ethics training, emerging reputational risks, anti-bribery and corruption, trading policy and Modern Slavery Act reporting. The report from the Group Head of Internal Audit provided an update on internal audit activity since the last meeting, details of progress with audit recommendations and details of any overdue recommended actions from internal audits.
In addition to the standing reports detailed above, a series of ‘deep dives’ are scheduled for the course of each year, to facilitate an in-depth review and discussion of key risks. The following are examples of deep dive reviews carried out by the Committee during the year:
• Cyber Security – Protecting Data
• Engineering and Product Safety
• Business Strategy
• International Business Governance
For each deep dive, the relevant senior manager for the business area presented to the Committee and Committee members were able to challenge the details provided and receive further details or give guidance as necessary.
The Business Strategy deep dive was considered at the Committee’s September meeting. The Group Strategy Director presented to the Committee in respect of a paper circulated prior to the meeting. He was able to give further details on the approach to the strategy planning process and what the strategy output would look like, in terms of an integrated strategic business plan that would articulate the Group’s vision and strategy, and tactical inputs. The Group Strategy Director reported on how the Group Risk Register would be reviewed as part of the strategy planning process to ensure it remained aligned to the Group strategy. It was noted that a re-evaluation of the Group’s risk appetite in the context of the new business plan would be considered at the Board strategy meeting in November. The approach was endorsed by the Committee.
The Cyber Security deep dive was considered at the Committee’s November meeting. The Director of Capability and the Capability Programme Director had presented to the Committee in respect of a paper which had been circulated previously.
The presentation had detailed an action plan which covered areas such as a security improvement programme, a risk chart, how to manage the insider threat and the expected outputs from that process, which would include a code of practice developed in conjunction with the HR, Legal and Security functions, and implementation of higher level controls for the I.T. networks which would be measured against a widely recognised industry standard. The Committee had endorsed the plan and requested that the Governance Committee review the Risk Map categories relating to loss of data and that it receive an update on progress at its May 2016 meeting. Further to the presentation, the Group Communications and Investor Relations Director presented to the Committee’s January meeting on the communications response to a security breach.
b) Generic MOD compliance system:A key aspect of the Committee’s work is the oversight of the MOD’s generic compliance system. This is integral to the work of QinetiQ in its relationship with the UK Government.
The generic compliance system is designed to give the MOD customer confidence that QinetiQ is able to provide impartial advice during any competitive evaluation of a procurement where the Group wishes to operate on both the ‘buy’ and the ‘supply’ sides. The aim is to achieve a balance between meeting the needs of the procurement customers in the MOD (principally Defence Equipment & Support) and the need to allow QinetiQ the flexibility to exploit research into the supply chain and pursue its planned commercial activities, without compromising the defence or security interests of the UK. The Board nominates two senior executives to act as Compliance Implementation Director and Compliance Audit Director.
During the year the Committee approved the appointment of the Group Director-Safety and Governance as Compliance Implementation Director in place of the Strategic Business Director – Defence, following a review of the oversight process and approval by the CEO.
Oversight of the operation of the compliance system is provided by the Committee. During the year under review, the Committee received a bi-annual report from the Group Director-Safety and Governance and the internal audit function on the compliance areas that it monitored. The report was tabled at the July and January meetings. A typical report includes a summary of the scope and an executive summary of the findings with an audit opinion. The report includes specific findings with agreed associated time-bound action plans. It was agreed at the January meeting that in future the Committee would receive annual reports.
Recent activity included consideration of improvements in action tracking following firewall reviews and seeking clarification in respect of MOD policy in dealing with conflict of interest mitigations in the process for bid submissions.
The Committee addresses any issues that would arise if QinetiQ were to fail to comply with the requirements of the generic compliance system. No breaches were noted during the year.
QinetiQ Group plc Annual Report and Accounts 201676

c) A review of the risk register in accordance with FRC recommendations:The review of the Risk Register is a standing item on the Committee’s agenda, with amendments being made to reflect changes in the Group’s business and strategy. Further details can be found in the Principal risks and uncertainties section on pages 42 to 49 of the Strategic report. ‘Red’ risks are made the subject of a report to the Committee or become the subject of a ‘deep dive’ review as part of the company’s risk management processes.
d) Effectiveness review:As reported on page 61, the external effectiveness evaluation of the Board and its Committees had been deferred from 2015 owing to the change of Chief Executive Officer during the year. An evaluation had been carried out instead by way of an externally provided online questionnaire tool.
The following areas had been noted for improvement from the 2015 Committee effectiveness review:
• improved clarity and brevity in reporting to allow the Committee to focus on key issues;
• increased liaison with the US business; and
• considering risk appetite in relation to risk areas, such as cyber risk.
All three items had been dealt with during the year under review. The format and content of Committee papers have been adjusted, as noted on page 75; there has been regular contact with the US Proxy Board and US executive management, and an internal audit of key control processes undertaken by a US-based accountancy firm (as noted on page 72); and the approach to assessing risk appetite in respect of risk areas has been improved by way of the deep dive process.
As detailed on page 61, the 2016 external review was carried out by Lintstock by way of an initial questionnaire supported by individual interviews. The Risk & CSR Committee questionnaire covered the following areas: time management and composition, processes and support, the work of the Committee and priorities for change.
The outcome of the review was considered at the Committee’s May meeting and was as follows:
The Risk & CSR Committee was rated highly and the continued separation of financial and non-financial risk into the Audit Committee and Risk & CSR Committee respectively was considered to be working well and created appropriate time to focus on key issues.
As noted on page 61, one of the Board’s priorities for the coming year is to review risk management and reporting processes, with such review being led by the Chairs of the Audit Committee and the Risk & CSR Committee.
The following actions were also agreed for the coming year:• To continue to focus on the big risk areas.• To continue with the practice of having a more focused discussion
on fewer items, aided by executive summaries.• To work closely with the Executive Committee and management
in respect of risk management activity.• To continue the practice of deep dives into subject risk areas • To review the Committee’s focus on Corporate Responsibility
in the light of best practice.
Membership and attendance during the yearThe Security Committee is chaired by Admiral Sir James Burnell-Nugent and the other Committee members during the year were Michael Harper, Ian Mason , David Mellors, Paul Murray, Susan Searle and Steve Wadey (from 27 April 2015).
Main responsibilitiesThe Committee was established in June 2009 to enable UK nationals on the Board to consider matters of a UK national security dimension that have an impact on QinetiQ’s UK business. The Committee’s full terms of reference can be found in the Governance section of the QinetiQ website at www.QinetiQ.com/about-us/corporate-governance.
There was no requirement for the Committee to meet during the year.
Admiral Sir James Burnell-Nugent Security Committee Chairman
Report of the Security Committee
QinetiQ Group plc Annual Report and Accounts 2016 77
Strategic report Governance Financial statements Additional information

Corporate governance statement continued
E Relations with shareholdersThe company attaches significant importance to maintaining an effective engagement with shareholders to ensure a mutual understanding of objectives and to deal with issues of concern. Responsibility for communications with shareholders rests with the Executive Directors, assisted by the Communications and Investor Relations Director. The Company Secretary oversees communications with private individual shareholders.
An analysis of the shareholder register, by type of holder and by size of holding, can be found on page 150.
Understanding the views of shareholdersThe Chairman proactively offers to attend meetings with key shareholders, and their corporate governance teams, on a regular basis. The Chairman, the Senior Independent Director and Non-executive Directors routinely attend key financial calendar events such as presentations of interim and preliminary results and make themselves available to meet shareholders as required.
The Board as a whole is informed on a regular basis about the views of key shareholders, including their concerns. The Communications and Investor Relations Director provides regular updates to the Chairman and Non-executive Directors by way of face-to-face briefings, email updates and a section in the Executive Directors’ report which is included in the Board papers as a standing item. The following information is included in these reports:
• financial calendar and draft material;• share price performance;• a report from the company’s brokers detailing activity
on the shareholder register since the previous meeting;• feedback from investor meetings, including key questions;• with regard to sell-side analysts, their recommendations and
expectations; and• peer group news.
Investor relations activity during the year under reviewThe company elected to continue to update the market six times a year, in conjunction with key financial announcements and financial period ends, due to the short order cycle in its Global Products division. Telephone briefings for analysts and investors took place in conjunction with these dates.
The Chairman and the Senior Independent Director engaged proactively with shareholders during the transition of the Chief Executive Officer prior to Steve Wadey’s appointment on 27 April 2015. The Chairman also engaged with shareholders at their request throughout the year.
Meetings with investors during the year were led by the Executive Directors. The Chairman and Senior Independent Director were available to attend meetings with individual investors on request.
A new QinetiQ investor relations app was launched during the year to make investor information available for mobile devices.
Other investor activity included: • face-to-face presentations of full year and half-year results, in May
and November respectively, where the Chairman and Directors were available for discussions with investors;
• live and post-event webcasts of key presentations in respect of the full year and half-year results;
• investor ‘road shows’ in May, June, November and December;• visits, sales team briefings, group lunches, conference presentations
and ad hoc meetings on request; and• the Annual General Meeting held on 22 July 2015.
Providing information to shareholdersThe company sets itself the target of providing information that is timely, clear and concise.
Key means of communication used by the company are:
• the Annual Report, which sets out the business model and strategy, corporate governance arrangements and financial results;
• announcements made via the company’s website or a regulatory information service;
• responding to environment, social and governance questionnaires;• results presentations and webcasts; and• the company’s website, www.QinetiQ.com, and an app for smart
phones and tablets. All shareholders and potential shareholders can gain access to the Annual Report, presentations to investors, Annual General Meeting documentation, key financial information, regulatory news, financial calendar, share and dividend data and other significant information about QinetiQ in the ‘Investors’ section of the company’s website, www.QinetiQ.com. The site also provides contact details for any investor-related queries, by telephone and by email.
QinetiQ Group plc Annual Report and Accounts 201678
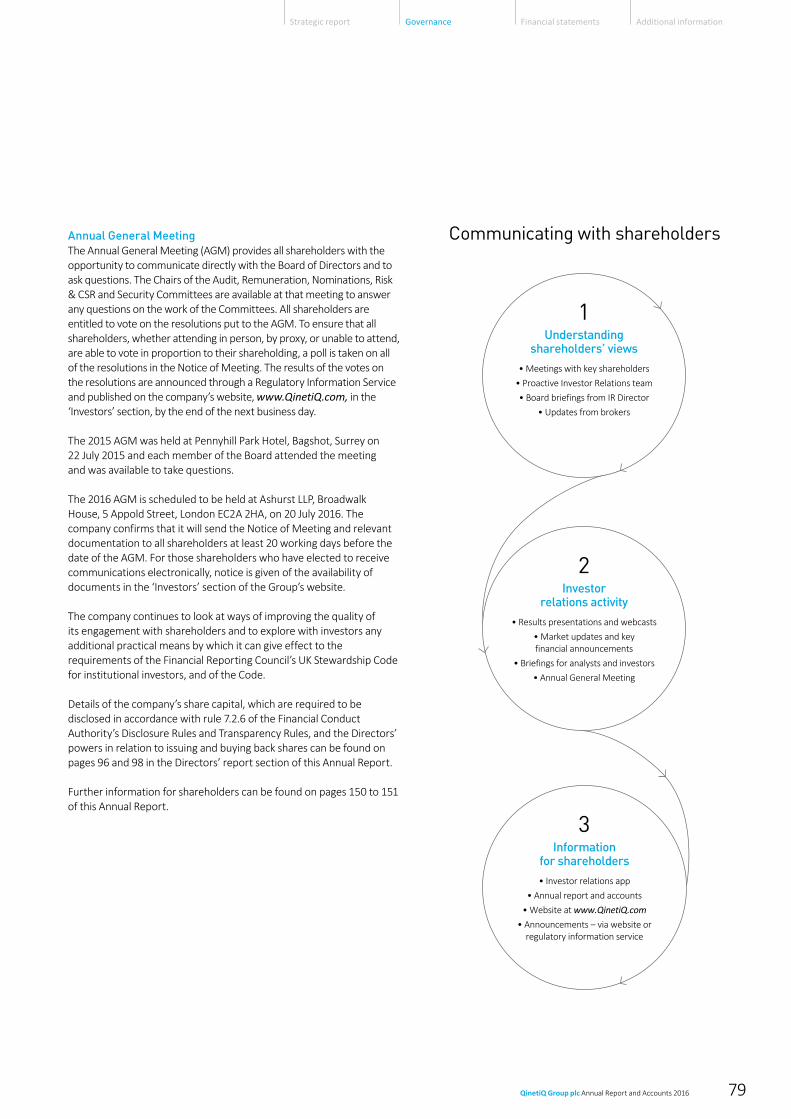
Understandingshareholders’ views
• Meetings with key shareholders
• Proactive Investor Relations team
• Board briefings from IR Director
• Updates from brokers
Investorrelations activity
• Results presentations and webcasts
• Market updates and keyfinancial announcements
• Briefings for analysts and investors
• Annual General Meeting
Informationfor shareholders• Investor relations app
• Annual report and accounts
• Website at www.QinetiQ.com• Announcements – via website or
regulatory information service
1
2
3
Communicating with shareholdersAnnual General MeetingThe Annual General Meeting (AGM) provides all shareholders with the opportunity to communicate directly with the Board of Directors and to ask questions. The Chairs of the Audit, Remuneration, Nominations, Risk & CSR and Security Committees are available at that meeting to answer any questions on the work of the Committees. All shareholders are entitled to vote on the resolutions put to the AGM. To ensure that all shareholders, whether attending in person, by proxy, or unable to attend, are able to vote in proportion to their shareholding, a poll is taken on all of the resolutions in the Notice of Meeting. The results of the votes on the resolutions are announced through a Regulatory Information Service and published on the company’s website, www.QinetiQ.com, in the ‘Investors’ section, by the end of the next business day.
The 2015 AGM was held at Pennyhill Park Hotel, Bagshot, Surrey on 22 July 2015 and each member of the Board attended the meeting and was available to take questions.
The 2016 AGM is scheduled to be held at Ashurst LLP, Broadwalk House, 5 Appold Street, London EC2A 2HA, on 20 July 2016. The company confirms that it will send the Notice of Meeting and relevant documentation to all shareholders at least 20 working days before the date of the AGM. For those shareholders who have elected to receive communications electronically, notice is given of the availability of documents in the ‘Investors’ section of the Group’s website.
The company continues to look at ways of improving the quality of its engagement with shareholders and to explore with investors any additional practical means by which it can give effect to the requirements of the Financial Reporting Council’s UK Stewardship Code for institutional investors, and of the Code.
Details of the company’s share capital, which are required to be disclosed in accordance with rule 7.2.6 of the Financial Conduct Authority’s Disclosure Rules and Transparency Rules, and the Directors’ powers in relation to issuing and buying back shares can be found on pages 96 and 98 in the Directors’ report section of this Annual Report.
Further information for shareholders can be found on pages 150 to 151 of this Annual Report.
QinetiQ Group plc Annual Report and Accounts 2016 79
Strategic report Governance Financial statements Additional information

D Remuneration
Dear shareholder,Executive pay continues to be high on the agendas of shareholders and other stakeholders alike. A key focus of our work is to ensure that the executive team’s remuneration remains aligned to the performance of the business. In presenting this year’s report for the year ending 31 March 2016, we continue to strive to be transparent, whilst aiming for a report that is easy to read. We will be seeking approval of this report at the AGM on 20 July 2016.
Business context to the Remuneration Committee’s decisionsFY16 was an important year for QinetiQ with the new leadership team, led by Steve Wadey, establishing and commencing implementation of a refreshed vision and strategy.
The Committee have fully supported Steve in ensuring that the implementation of our reward strategy aligns with, and takes account of, our two year transformation programme, whilst maintaining our high performance culture and our principles of reward for performance.
The balance between long-term sustainable performance and short term transformation has been consistently and carefully balanced in the Committee’s key decision-making during the year. Shareholding requirements have been strengthened to further align with shareholder interests, and annual performance measures have been developed to focus on ‘how we do things’ as well as results.
Steve has led the creation, by promotion and recruitment, of a senior leadership team and the application of an appropriate reward structure and implementation is underway.
Key activities and decisions made during the yearSummarised below are the key areas the Committee focused on during the year.
1. Oversight and support of the review for the Executive Committee reward structureTo support the Executive Directors in delivering the refreshed strategy and transformation programme, an Executive Committee has been formed to replace the current Operating Committee, to enable group-wide collaboration that focuses on the customer. From the outset the CEO has worked closely with the Remuneration Committee to review and establish the reward framework for the Executive Committee.
2. Performance Share Plan (PSP) award for CEOThe Committee has agreed, in line with the approved remuneration policy, to increase the PSP opportunity for the CEO from 150% to 200% of salary for awards made in 2016 and 2017 only. This increase acknowledges the forfeiture of previous long-term incentive opportunities on joining, and aims to incentivise the delivery of the revised company strategy and ensure the CEO has strong alignment
Directors’ remuneration report
Annual statement
Remuneration Committee membership and attendance during the year ended 31 March 2016During the financial year ended 31 March 2016, the Committee met on five occasions.
Member Attendance
Mike Harper (Committee Chair) 5/5
Lynn Brubaker* 1/1
Admiral Sir James Burnell-Nugent 5/5
Mark Elliott 5/5
Ian Mason 5/5
Paul Murray 5/5
Susan Searle 5/5
* Lynn Brubaker joined the Board on 27 January 2016.
This report has been prepared in compliance with Schedule 8 of The Large and Medium-sized Companies and Group (Accounts and Reports) Regulations 2013, as well as the Companies Act 2006
Remuneration Committee allocation of time
Executive Director Reward Policy and Remuneration 19.0Senior Executive Remuneration 36.0Long-Term Incentive Plan arrangements 22.0Governance 23.0
2016 %
QinetiQ Group plc Annual Report and Accounts 201680

with shareholder interests, and that the transformation programme leads to long-term sustainable company performance.
3. Review of Executive Director and Executive Committee shareholding requirementTo align with the interests of shareholders, and following a review of the market practice, the Committee implemented an increase in minimum shareholding requirements to 200% of base salary for the CEO and 150% of base salary for the CFO respectively.
The Committee also reviewed the qualifying share criteria in determining the satisfaction of the requirement and will adopt, from 1 April 2016, the Policy to include only:
• Shares owned outright with no further conditions attached;• Vested shares that remain subject to a holding period or
clawback only; and• Deferred shares that are not forfeitable under any circumstances.
4. Adjustment to performance conditionsIn March 2015 the Committee agreed a set of adjustment principles to enable consistent and fair review in the event of an accounting decision impacting on incentives.
Following the sale of the US Services division and the share buyback exercise, the Committee followed these principles and exercised its discretion to amend performance conditions as follows:
• To provide consistency, only earnings reflecting continuing operations have been used in calculating the FY13 EPS, reducing the 2013 reported EPS from 18.9p to 16.6p;
• In accordance with best practice guidance the number of shares repurchased under the share buyback has been added back in calculating the FY16 EPS, reducing the as reported EPS from 16.3p to 14.7p
Underlying operating profit in 2016 included a credit of $3.9m due to the resolution of a historical overseas exposure. The Committee viewed this as neutral for the purposes of the remuneration as the original charge reduced profit in FY13. Following these adjustments the threshold targets for the 2013 PSP and 2013 Deferred Annual Bonus (DAB) Matching were not met and therefore none of the awards granted to the CFO will vest. The CEO was not a participant in these awards, only joining the company on 27 April 2015.
5. Agreement of Executive Directors’ performance conditions The refreshed strategy and new organisational structure creates the foundation and capability to grow the company. To reflect this, Executive Directors’ performance measures focus on financial KPIs, and key collective and personal non-financial KPIs. The performance conditions strike a balance between maintaining strong traditional financial performance and building a collective and group-orientated organisation. Implementation of the policy for the year ending 31 March 2017 on page 94 highlights the key elements of the Executive Director remuneration for the year.
Effectiveness reviewAs detailed on page 61, the 2016 external review of Board and Committee effectiveness was carried out by Lintstock. The Committee questionnaire covered the following areas: time management and composition, processes and support, the work of the Committee and priorities for change.
The outcome of the review was considered at the March Board meeting. The effectiveness of the Committee was rated highly overall. Recommendations to improve the performance of the Committee over the coming year included working closely with the recently appointed Group Director Human Resources and reviewing the level of support provided by the external advisors.
The following are the remuneration priorities which the Committee is going to focus on over the coming year:• Reviewing the effectiveness of the long-term incentive plans
in driving the delivery of the company’s strategy;• Supporting the CEO to establish and incentivise a new top team; and• Developing a solution for the remuneration of senior executives
that rewards long-term value creation.
The results of this work will be reflected in the Policy put to shareholders at the 2017 AGM.
Conclusion As a Committee we work to ensure that the remuneration structure supports the company strategy and aligns with the interests of shareholders so that we are able to attract, retain and motivate high calibre executives by rewarding the creation of long-term sustainable value. The Committee is proposing no changes to the Policy at this year’s AGM. The Policy will next be subject to shareholder approval at the 2017 AGM. The Directors’ Remuneration Policy is available to view in full on the company’s website www.QinetiQ.com.
We have provided an ‘At a glance’ summary immediately after this letter which summarises the Policy, how it was implemented in the year and how it is proposed to operate for the year ending 31 March 2017.
I hope that we can rely on your vote in favour of the Annual Report on Remuneration at the AGM on 20 July 2016. On behalf of the Committee I am committed to engaging with investors as appropriate to ensure a meaningful dialogue and am grateful for all the support we have received from them and their representative bodies over the course of the year. If you would like to discuss any aspect of our remuneration policy and this report, I would be happy to hear from you. You may contact me through Jon Messent, Company Secretary and Group General Counsel.
Michael Harper Remuneration Committee Chairman 26 May 2016
QinetiQ Group plc Annual Report and Accounts 2016 81
Strategic report Governance Financial statements Additional information

Directors’ remuneration report continued
At a glance
Key principles of the Executive Director Remuneration policy
Remuneration packages are structured to support business strategy and conform to current best practice
Appropriate rewards are given for meeting specific targets set at the beginning of each year
Congruence with pay and employment conditions elsewhere in the Group and taking into account the diversity of our people
Incremental compensation is achieved for attaining stretch performance targets
Objectives are measured on metrics designed to be consistent with sustainable long-term business performance
Promotion of long-term alignment with shareholders through satisfaction of incentives in shares and required employee shareholding
Summary of Directors’ Remuneration PolicyThe Directors’ Remuneration Policy was approved at the AGM 22 July 2014. The full Policy may be found in the Corporate Governance section on the company’s website. A summary of the Policy is set out below:
Element Policy summary description Maximum opportunity
Executive Directors
Base salary We aim to pay base salaries in line with the market median against defined comparator groups.
Typically, base salaries of Executive Directors in post at the start of the policy period and who remain in the same role throughout the policy period will be increased by a similar percentage to the average annual percentage increase in salaries of all other employees in the Group.
The exceptions to this rule may be where:• an individual is below market level and a decision is taken to increase
base pay to reflect proven competence in role; or • there is a material increase in scope or responsibility in the Executive
Director’s role.
Pension Either a contribution to the QinetiQ Defined Contribution Group Personal Pension (GPP); or if the annual allowance would be exceeded, an allowance in lieu of pension contributions will be paid.
Maximum pension contribution or salary supplement is 25% of salary. Actual pension contribution or salary supplement for CEO and CFO is 20% of salary.
Benefits Benefits include car allowance, health insurance, life assurance, income protection and membership of the all employee Share Incentive Plan.
Benefit values vary year on year depending on premiums and the maximum potential value is the cost of the provision of these benefits.
Bonus Banking Plan (BBP)
Annual performance conditions and targets are set at the beginning of the plan year. For years 1-3, upon assessment of performance by the Committee, a contribution will be made into the participant’s plan account and 50% of the cumulative balance will be paid in cash. Any remaining balance will be converted into notional shares.
100% of the balance in year 4 will be paid in shares to the participant. During the four-year plan period, 50% of the retained balance is at risk of forfeiture based on a minimum level of performance determined annually by the Committee. Malus and clawback arrangements are in place.
Maximum = 225% of salary.
Target = 90% – 135% of salary.
Threshold = 0% of salary.
Performance Share Plan (PSP)
Awards are earned based on an equal weighting of absolute underlying EPS growth and relative Total Shareholder Return performance. The performance period runs for three years from the start of the financial year in which the award is granted.
Malus and clawback arrangements are in place.
Normal grant level = 150% of salary
Maximum grant level = 200% of salary
Shareholding requirement
Executives have five years to accumulate the required shareholding.
200% of base salary for the CEO. 150% of base salary for the CFO.
n/a
Non-Executive Directors
Fees Non-executive Director fee policy aims to pay at median level, when considering the same comparator group used for Executive Directors.
Increases will generally be in line with those of employees.
QinetiQ Group plc Annual Report and Accounts 201682

The Committee believes that the use of both individual and collective qualitative measures in the bonus plan is a key element in ensuring that on a holistic basis management are rewarded for the business outputs during the year.
Steve Wadey and David Mellors have collaborated well on the joint qualitative measures and are therefore rated as Exceed Expectations for each measure.
In relation to the CEO’s personal objective, Steve Wadey has successfully developed good relationships with our suppliers, key customers and stakeholders and is therefore rated as Exceed Expectations.
In relation to the CFO’s personal objective, David Mellors has defined an operating model to support Group Strategy and is therefore rated as Meet Expectations.
The following table highlights the performance and remuneration outcomes for the year ended 31 March 2016 with more detail provided in the Annual Report on Remuneration.
How have we performed against our corporate performance objectives?The company is operating in challenging conditions reflected by the Strategic Defence Security Review, highlighting the need to deliver ‘more for less’. The Single Source Regulations Office is also now fully established, driving greater transparency to help demonstrate the value for money the Government derives from qualifying defence contracts. Across our markets we are seeing requirements increasing but within the context of significant budget restraint.
Against this background the achievement of results broadly level with 2015, with continuing strong cash flow, together with the development and communication of a revised strategy, plus commencement of the transformation programme is regarded by the committee as a good result. In order to encourage management to ensure that the revised strategy and transformation programme leads to strong long-term sustainable performance; the Performance Share Plan continues to use the key financial measures of EPS and TSR.
Annual Incentive (BBP) Weighting (%) Target performance Stretch performance Actual performance% of maximum
reward achieved
Group Underlying Profit After Tax(a) 20 £89.5m £98.4m £95.9m 85.68%
Group Underlying Operating Profit(a) 30 £104.6m £115.0m £108.9m 70.74%
Group Underlying Operating Cash Flow(a)(b) 30 £80.1m £96.1m £126.5m 100.00%
CEO/CFO Shared Personal Objectives:
Strategy:• Develop the Group strategy to drive sustainable
growth across UK and international markets, building on the core strengths of the business.
5 Meet Expectations
Exceed Expectations
Exceed Expectations
CEO 85.00%
CFO 72.50%
Employees:• Maintain or improve relations with our customers,
key suppliers and stakeholders.
5 Meet Expectations
Exceed Expectations
Exceed Expectations
Organisation:• Develop plan to augment and build the skills,
processes and structure of the senior leadership team to execute the Group strategy.
5 Meet Expectations
Exceed Expectations
Exceed Expectations
CEO Individual Personal Objective:
Customers:Maintain or improve reputation of the business with our customers.
5 Meet Expectations
Exceed Expectations
Exceed Expectations
CFO Individual Personal Objective:
Operating Model:Develop a refined operating model that enables the implementation of the Group strategy, to maximise cross-cutting synergies and investment in growth, whilst continuing to deliver capital discipline and cash generation.
5 Meet Expectations
Exceed Expectations
MeetExpectations
(a) Definitions of underlying measures of performance can be found in the glossary on page 149.(b) Adjusted to exclude LTPA and MSCA capital expenditure.
Long-Term Incentives Threshold performance Stretch performance Adjusted performance% of maximum
reward achieved
2013 Performance Share Plan (EPS)(a) 18.1p 22.1p 14.7p 0.00%
2013 Performance Share Plan (TSR) Median Upper Quartile Below Median 0.00%
2013 Deferred Annual Bonus Matching (EPS)(a) 18.1p 22.1p 14.7p 0.00%
(a) An explanation of the adjustments can be found on page 90.
QinetiQ Group plc Annual Report and Accounts 2016 83
Strategic report Governance Financial statements Additional information

What did our executives earn during the year to 31 March 2016? Results for 2016 represent a strong achievement against the financial and personal objectives under the Annual Incentive. Zero vesting under the Long Term Incentives reflects the difficult defence market conditions over the last three years that has restricted the growth of the business. To provide transparency in a challenging year of transition, the following tables provide the single figure for 2016, showing how much the Executive Directors earned in respect of 2016. This figure is then considered in relation to:(i) the proportion of the single figure that is paid and the proportion that is earned in respect of 2016;(ii) the single figure for 2016 compared to the Policy remuneration scenarios;(iii) the single figure trend in comparison to EPS;(iv) the shareholding of Executive Directors.
(i) 2016 Single Figure of Remuneration for Executive Directors The auditor is required to report on the information in this table. A detailed breakdown of the figures can be found on pages 86 to 95 however, for clarity, the Bonus Banking Plan number reported is the calculated annual bonus figure before any banking has occurred.
All figures in £
2016Salary/Fee
2016Benefits
2016 BonusBanking Plan
2016 Long-Term Incentive 2016 Pension 2016 Total 2015 Total
CEO(a) 520,219 31,166 999,117 – 104,044 1,654,546 –
CFO(b) 455,885 26,403 849,917 – 91,177 1,423,382 1,759,680
(a) Appointed 27 April 2015. (b) Interim CEO until 26 April 2015 returning to enlarged CFO role on 1 May 2015.
(ii) Single Figure Paid in 2016Executive Director remuneration includes elements both paid (base salary, benefits, Bonus), and earned (Bonus Banking Pool) in 2016. To provide a clearer understanding of balance between short and long-term remuneration the following chart highlights that 30% of Executive Director earnings for 2016 are deferred and at risk of future forfeiture if minimum performance levels are not maintained. Paid Earned
FY16 Single figure remuneration type
CEO
CFO
1,154,987
998,424
499,559
424,958
637%
(iii) 2016 Single Figure versus Remuneration PolicyComparing against our Remuneration Policy, Executive Director remuneration is broadly comparable to on target performance, and in line with our financial results achieved in challenging operating conditions.
CEO (£‘000)
703 703 703
630236 1,260
859
655
703
1,569
2,822
1,654
999
Minimum Target Stretch Actual0
500
1,000
1,500
2,000
2,500
3,000
Fixed Linked to Annual Performance Linked to performance over more than 1 year
CFO (£‘000)
554 554 554
493278 990
1,046
573
554
1,325
2,590
1,423
850
Minimum Target Stretch Actual0
500
1,000
1,500
2,000
2,500
3,000
Fixed Linked to Annual Performance Linked to performanceover more than 1 year
(iv) 2016 Single Figure versus EPSThe following chart highlights that trends in Executive Director remuneration are aligned to business results. CEO single figure versus profit
2013 2014 2015 20160
5001,000
2,0001,500
3,0002,500
4,0003,500
5,0004,500
Salary
Rem
uner
atio
n (£
‘000
)
0.02.04.0
8.06.0
12.010.0
16.014.0
20.018.0
EPS
(pen
ce)
Taxable Benefits Bonus LTIP Pension EPS
Directors’ remuneration report continued
QinetiQ Group plc Annual Report and Accounts 201684

Shareholdings of Executive Directors To align with the change in Executive Director shareholding requirements the following charts indicate current holdings against the new requirements.
Shareholding requirement
Value of beneficially owned shares& deferred shares
Value of conditional shares subjectto performance conditions
200
9
153
CEO shareholding as a percentage of salary
Shareholding requirement
Value of beneficially owned shares& deferred shares
Value of conditional shares subjectto performance conditions
150
161
615
CFO shareholding as a percentage of salary
Implementation of Policy in 2016 and 2017
Element Implementation for Y/E 31 March 2016 Implementation for Y/E 31 March 2017Executive DirectorsBase salary Stephen Wadey from 27 April 2015 £560,000 per annum.
David Mellors (CFO) from 1 May 2015 £440,000 per annum.(a)
Salaries to be reviewed in September in line with the rest of the employee population.
Pension Stephen Wadey (CEO) 20% of salary.David Mellors (CFO) 20% of salary.
No change.
Benefits Policy benefits provided during financial year. No change.
Bonus Banking Plan
Maximum Annual Opportunity 225% of salary.Target = 112.5% of salary.Threshold = 0% of salary.
Performance conditions (weighting):• Group underlying operating profit (30%).• Group underlying operating cash flow (30%).• Group underlying profit after tax (20%).• Qualitative measures based on company KPIs (20%).
50% of the retained balance is at risk of forfeiture based on a Group Operating Profit Threshold Target.
Maximum Annual Opportunity 225% of salary.Target = 112.5% of salary.Threshold = 0% of salary.
Performance conditions (weighting):• Group Order Intake (25%).• Group Operating Profit (25%).• Group Operating Cash Flow (25%).• Collective measures based on company KPIs (12.5%).• Personal measures based on company KPIs (12.5%).
50% of the retained balance is at risk of forfeiture based on a Group Operating Profit Threshold Target.
Performance Share Plan
CEO 150% of salary.
CFO 150% of salary.
Performance conditions:50% of the PSP award is based on EPS growth:
• EPS growth of 3% p.a. 25% vesting.• EPS growth of 10% p.a. 100% vesting.
50% of the PSP award is based on relative TSR compared to the FTSE 250:• 30% vesting for median.• 100% vesting for upper quartile.
Straight line vesting between points.
CEO 200% of salary. The Committee considered whether with the increased award level that the performance conditions should be changed for the CEO. However, the Committee reached the conclusion that given current and predicted market conditions facing the company the EPS and TSR performance conditions were in practice likely to be more stretching than in the past and therefore there was no requirement to change them for the higher award level.
CFO 150% of salary.
Performance conditions:50% of the PSP award is based on EPS growth:• EPS growth of 3% p.a. 25% vesting.• EPS growth of 10% p.a. 100% vesting.
50% of the PSP award is based on relative TSR compared to the FTSE 250:• 30% vesting for median.• 100% vesting for upper quartile.
Straight line vesting between points.
Shareholding requirement
100% of base salary for the CEO and CFO to be built up over a period of five years.
200% of base salary for the CEO and 150% of base salary for the CFO to be built up over a period of five years from date of policy adoption (1 April 2016).
Non-Executive DirectorsFees See page 91 of the Annual Report on Remuneration for the fees and
allowances paid in the year reported on.Basic Non-executive Director fee – From 1 July 2015 £46,000.Fee for Chairing a Committee – From 1 July 2015 £9,000.
(a) Following the resignation of Leo Quinn in October 2014, David Mellors served as Interim CEO until 26 April 2015 when he returned to an enlarged CFO role, taking on more operational management responsibilities.
QinetiQ Group plc Annual Report and Accounts 2016 85
Strategic report Governance Financial statements Additional information

IntroductionThe following section of this report details how the Remuneration Policy has been implemented for the year ended 31 March 2016.
Performance measures and targets The performance targets are determined annually. The Committee selected the performance conditions, as detailed on the next page, for the Bonus Banking Plan because these are central to the Group’s overall strategy and are the key metrics used by the Executive Directors to oversee the operation of the business.
The Committee is of the opinion that the specific performance targets for the Bonus Banking Plan are commercially sensitive in respect of the company and that it would be detrimental to the interests of the company to disclose them. The targets will be disclosed after the end of the relevant financial year in that year’s Remuneration Report.
The Performance Share Plan performance conditions, as defined on page 90, complement the performance conditions described in the Bonus Banking Plan, supporting sustainable performance.
Executive Director single figure remunerationThe auditor is required to report on the information in this table. Executive Director remuneration is shown as a single figure to provide an annual comparison between the actual remuneration for the performance year ended 31 March 2016 and the preceding year. The CFO figure for 2016 includes the period as Interim CEO.
Executive Director
Salary/fees(a) Benefits(b) Bonus Banking Plan(c) Long-Term Incentive(d) Pension(e) Single figure2016 2015 2016 2015 2016 2015 2016 2015 2016 2015 2016 2015
CEO £520,219 £- £31,166 £- £999,117 £- £0 £- £104,044 £- £1,654,546 £-
CFO £455,885 £501,227 £26,403 £27,447 £849,917 £998,603 £0 £134,881 £91,177 £97,522 £1,423,382 £1,759,680
(a) For further details please refer to additional supporting information for each Executive Director opposite.(b) Benefits comprise of car allowance, private medical insurance, life assurance and income protection.(c) The Bonus Banking Plan was introduced in 2014 replacing the previous Annual Bonus scheme and Deferred Bonus arrangements. The figure reported equates to the FY16
calculated outturn. For further details, including how this figure is used to derive the deferred element please refer to Additional supporting information for each Executive Director on page 88.
(d) Long-Term Incentive figures for the year ended 31 March 2016 comprise the 2013 PSP and the 2013 DAB Matching Plan. For further details please refer to the following additional supporting information.
(e) CEO and CFO pension figure represents cash in lieu of pension equating to 20% of base salary for both years.
Directors’ remuneration report continued
Annual Report on Remuneration
QinetiQ Group plc Annual Report and Accounts 201686

Additional supporting information for each Executive DirectorTo support the single figure, this section documents each element of remuneration and how the figure was calculated for the performance year ended 31 March 2016.
Salary/fees
Executive DirectorFrom 1 May
2015(a)From 27 April
2015(b)From 20 October
2014(c)From 1 September
2014(d)Pro-rated
single figure(e)
CEO – 560,000 – – 520,219
CFO 440,000 – 633,800 403,150 455,885
(a) The CFO’s salary was restated on 1 May 2015 to reflect the enlarged CFO role including greater operational responsibility.(b) The CEO salary on joining the company.(c) The CFO’s salary was increased on 20 October 2014 as part of the transition to becoming interim CEO.(d) The CFO’s salary increased by 3% (£11,750 per annum) effective from 1 September 2014, in line with salary increases generally awarded to UK employees at that date.(e) Pro-ration calculated on a daily basis.
Total pension entitlementsNo Directors participate in the QinetiQ Pension Scheme.
Annual Incentive For the year ended 31 March 2016 achievement of on-target performance provides a payment equal to 112.5% of base salary, rising on a linear scale to 225% of base salary for achievement of stretch performance.
For the year ended 31 March 2015 the equivalent achievement of on-target performance provided a payment equal to 90% of base salary, rising on a linear scale to 225% of base salary for achievement of stretch performance.
For both performance periods the scheme begins to pay out once threshold performance measures have been achieved.
For the year ended 31 March 2016 financial performance measures make up 80% of the annual bonus potential and with personal objectives accounting for the remaining 20%.
For the year ended 31 March 2015 financial performance measures and personal objectives were equally weighted at 50% of the annual bonus potential to reflect the role of the Interim CEO during this period.
The CEO/CFO were measured against the targets as shown below:
% of Base Salary
Group underlying operating profit 67.5Group underlying operating cash flow 67.5Group underlying profit after tax 45.0Qualitative measures 45.0
2016 %
QinetiQ Group plc Annual Report and Accounts 2016 87
Strategic report Governance Financial statements Additional information

Directors’ remuneration report continued
The auditor is required to report on the information in this table which summarises the key steps in the calculation of the Annual Incentive.
CEO/CFO Shared Financial Performance Measures
Weighting(%) Threshold Target Stretch Actual
% ofmaximum
reward achievedCEO
contributionCFO
contribution
Group Underlying Profit After Tax(a) 20 £80.5m £89.5m £98.4m £95.9m 85.68% £200,575 £175,771
Group Underlying Operating Profit(a) 30 £94.1m £104.6m £115.0m £108.9m 70.74% £248,411 £217,691
Group Underlying Operating Cash Flow(a)(b) 30 £72.1m £80.1m £96.1m £126.5m 100.00% £351,148 £307,723
CEO/CFO Shared Personal Objectives:
Strategy:• Develop the Group strategy to drive
sustainable growth across UK and international markets, building on the core strengths of the business.
5 n/a Meet Expectations
Exceed Expectations
Exceed Expectations
80.00% £140,458 £123,089Employees:• Maintain or improve employee
engagement in delivery of customer satisfaction and business strategy.
5 n/a Meet Expectations
Exceed Expectations
Exceed Expectations
Organisation:• Develop plan to augment and build the
skills, processes and structure of the senior leadership team to execute the Group strategy.
5 n/a Meet Expectations
Exceed Expectations
Exceed Expectations
CEO Individual Personal Objective:
Customers:• Maintain or improve reputation of the
business with our customers.
5 n/a Meet Expectations
Exceed Expectations
Exceed Expectations
100.00% £58,525
CFO Individual Personal Objectives:
Operating Model:• Develop a refined operating model
that enables the implementation of the Group strategy, to maximise cross-cutting synergies and investment in growth, whilst continuing to deliver capital discipline and cash generation.
5 n/a Meet Expectations
Exceed Expectations
Meet Expectations
50.00% £25,643
CEO Overall Results 85.36% £999,117
CFO Overall Results 82.86% £849,917
(a) Definition of underlying measures and performance can be found in the glossary on page 149.(b) Adjusted to exclude LTPA and MSCA capital expenditure.
The Bonus Banking Plan operates as follows:• The Plan operates on a fixed 4 year cycle. Year 1 of the Plan commenced on 1 April 2014, year 2 commenced 1 April 2015,
year 3 commenced 1 April 2016, and year 4 will commence on 1 April 2017. • Performance conditions are set at the beginning of each Plan year.• At the end of each of the first three Plan years the performance against targets is assessed and the level of the incentive earned
is determined and paid into the Plan account.• At the end of each of the first three Plan years, 50% of the account balance will be paid and the balance retained and held in the Plan
as notional shares.• At the end of the 4th year, any remaining balance in the Plan account is paid out in shares.
QinetiQ Group plc Annual Report and Accounts 201688
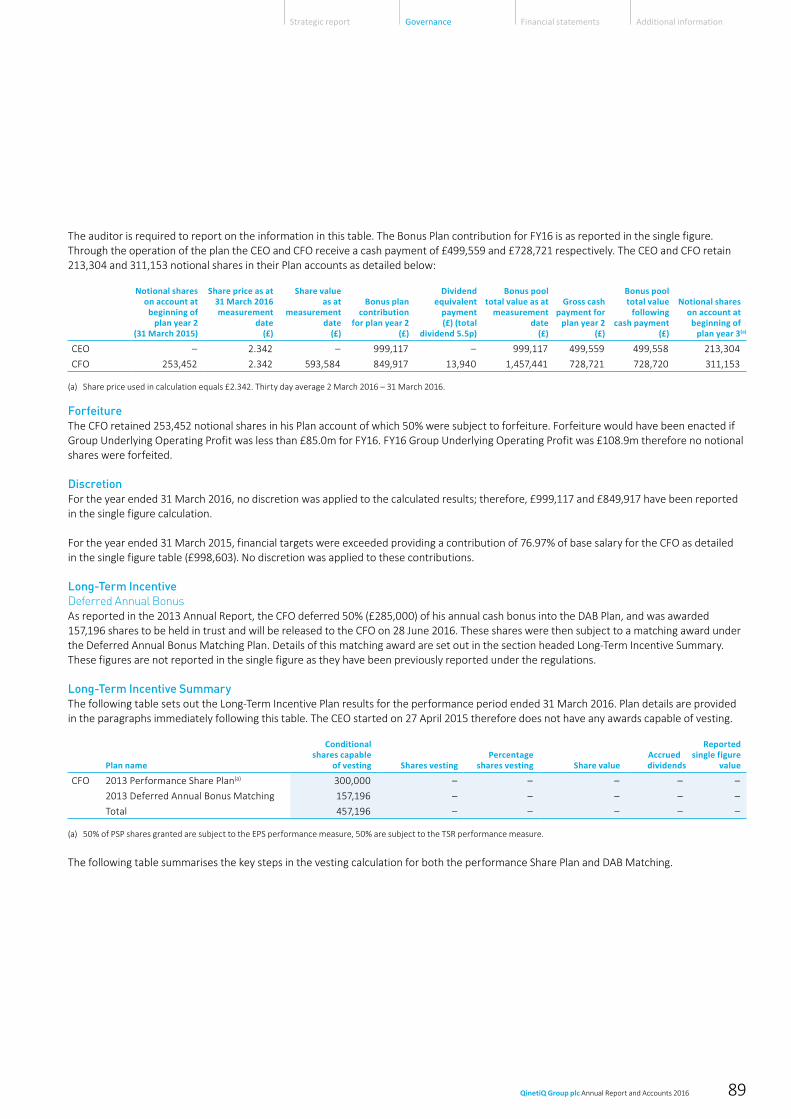
The auditor is required to report on the information in this table. The Bonus Plan contribution for FY16 is as reported in the single figure. Through the operation of the plan the CEO and CFO receive a cash payment of £499,559 and £728,721 respectively. The CEO and CFO retain 213,304 and 311,153 notional shares in their Plan accounts as detailed below:
Notional shares on account at
beginning of plan year 2
(31 March 2015)
Share price as at 31 March 2016measurement
date(£)
Share valueas at
measurementdate
(£)
Bonus plan contribution
for plan year 2 (£)
Dividendequivalent
payment(£) (total
dividend 5.5p)
Bonus pooltotal value as at
measurementdate
(£)
Gross cashpayment for
plan year 2 (£)
Bonus pooltotal value
followingcash payment
(£)
Notional shares on account at
beginning ofplan year 3(a)
CEO – 2.342 – 999,117 – 999,117 499,559 499,558 213,304
CFO 253,452 2.342 593,584 849,917 13,940 1,457,441 728,721 728,720 311,153
(a) Share price used in calculation equals £2.342. Thirty day average 2 March 2016 – 31 March 2016.
ForfeitureThe CFO retained 253,452 notional shares in his Plan account of which 50% were subject to forfeiture. Forfeiture would have been enacted if Group Underlying Operating Profit was less than £85.0m for FY16. FY16 Group Underlying Operating Profit was £108.9m therefore no notional shares were forfeited.
DiscretionFor the year ended 31 March 2016, no discretion was applied to the calculated results; therefore, £999,117 and £849,917 have been reported in the single figure calculation.
For the year ended 31 March 2015, financial targets were exceeded providing a contribution of 76.97% of base salary for the CFO as detailed in the single figure table (£998,603). No discretion was applied to these contributions.
Long-Term IncentiveDeferred Annual Bonus As reported in the 2013 Annual Report, the CFO deferred 50% (£285,000) of his annual cash bonus into the DAB Plan, and was awarded 157,196 shares to be held in trust and will be released to the CFO on 28 June 2016. These shares were then subject to a matching award under the Deferred Annual Bonus Matching Plan. Details of this matching award are set out in the section headed Long-Term Incentive Summary. These figures are not reported in the single figure as they have been previously reported under the regulations.
Long-Term Incentive SummaryThe following table sets out the Long-Term Incentive Plan results for the performance period ended 31 March 2016. Plan details are provided in the paragraphs immediately following this table. The CEO started on 27 April 2015 therefore does not have any awards capable of vesting.
Plan name
Conditional shares capable
of vesting Shares vestingPercentage
shares vesting Share valueAccrueddividends
Reported single figure
value
CFO 2013 Performance Share Plan(a) 300,000 – – – – –
2013 Deferred Annual Bonus Matching 157,196 – – – – –
Total 457,196 – – – – –
(a) 50% of PSP shares granted are subject to the EPS performance measure, 50% are subject to the TSR performance measure.
The following table summarises the key steps in the vesting calculation for both the performance Share Plan and DAB Matching.
QinetiQ Group plc Annual Report and Accounts 2016 89
Strategic report Governance Financial statements Additional information

Directors’ remuneration report continued
Long-Term Incentive Plan ResultsThe following table summarises the key vesting calculation for both the PSP and DAB Matching.
Performance measures and level Performance Share Plan DAB Matching
EPS Growth:
Threshold Performance 3% (CAGR) 3% (CAGR)
Vesting at Threshold 25% 25%
Maximum Performance 10% (CAGR) 10% (CAGR)
Vesting at Maximum 100% 100%
EPS at Start of Performance Period (Adjusted) 16.6p 16.6p
EPS at Threshold Performance 18.1p 18.1p
EPS at Maximum Performance 22.1p 22.1p
Actual Performance (Adjusted) 14.7p 14.7p
Actual Vesting – –
TSR Performance:
Threshold Performance Median –
Vesting at Threshold 30% –
Maximum Performance Upper Quartile –
Vesting at Maximum 100% –
Actual Performance Below Median –
Actual Vesting – –
Total PSP Vesting – –
Following the sale of the US Services business and the share buyback exercise the Committee has exercised its discretion to amend EPS performance conditions as follows:• To provide consistency, only earnings reflecting continuing operations have been used in calculating the FY13 EPS, reducing the 2013
reported EPS from 18.9p to 16.6p;• In accordance with best practice guidance the number of shares bought under the share buyback has been added back in calculating
the FY16 EPS, reducing the as reported EPS from 16.3p to 14.7p.
Scheme interests awarded during the financial year ended 31 March 2016The auditor is required to report on the information in this table. The following awards were made to Executive Directors.
Plan namePerformance
measure Grant date
Award as percentage
of salaryFace value
of award
Share price at date
of grant
No. of shares
grantedPerformance period
from – to
Percentage of award vesting
at threshold
CEO PSP 2015 EPS 28 Jul 15 75.0% £420,000 231p 181,818 1 Apr 15 to 31 Mar 18 25%
CEO PSP 2015 TSR 28 Jul 15 75.0% £420,000 231p 181,818 1 Apr 15 to 31 Mar 18 30%
CFO PSP 2015 EPS 28 Jul 15 75.0% £330,000 231p 142,857 1 Apr 15 to 31 Mar 18 25%
CFO PSP 2015 TSR 28 Jul 15 75.0% £330,000 231p 142,857 1 Apr 15 to 31 Mar 18 30%
The auditor is required to report on the information shown here over payments to past Directors.
Payments to past DirectorsNo payments were made to past Directors.
Payments for loss of officeNo payments were made for loss of office.
QinetiQ Group plc Annual Report and Accounts 201690

Single figure remuneration for each Non-executive Director The auditor is required to report on the information in this table. Non-executive Director remuneration is shown as a single figure to provide an annual comparison between the actual remuneration awarded during the performance year ended 31 March 2016 and the preceding year.
Non-executive Director
Salary/fees Benefits Committee Chair fees US attendance fee Single figure2016 2015 2016 2015 2016 2015 2016 2015 2016 2015
Lynn Brubaker £8,197 – – – – – £2,823 – £11,020 –
Admiral Sir James Burnell-Nugent
£45,250 £43,000 – – £9,000 £9,000 – – £54,250 £52,000
Noreen Doyle – £13,320 – – – £2,880 – – – £16,200
Mark Elliott £236,250 £236,250 £75,000 £75,000 – – – – £311,250 £311,250
Michael Harper £45,250 £43,000 – – £19,000 £16,549 – £2,500 £64,250 £62,049
Ian Mason £45,250 £35,392 – – – – – – £45,250 £35,392
Paul Murray £45,250 £43,000 – – £9,000 £9,000 – £2,500 £54,250 £54,500
Susan Searle £45,250 £44,985 – – – – – £2,500 £45,250 £47,485
Mark Elliot receives an accommodation allowance of £75,000 as he is US resident.
Noreen Doyle resigned on 22 July 2014.
Lynn Brubaker was appointed on 27 January 2016. Lynn is a US resident and receives a $4,000 fee for attending UK meetings.
Statement of Directors’ shareholding and share interestsThe auditor is required to report on the information in this table. Set out below are the Directors’ shareholdings as at 31 March 2016. In relation to the revised Executive Shareholding Policy adopted on 1 April 2016 the company requires Executive Directors to hold shares equivalent to 200% (CEO) and 150% (CFO) of base salary.
The CEO does not currently meet the minimum shareholding requirement; with a current holding equivalent to 9% of base salary using a share price of £2.362 (three-month average to 31 March 2016). This reflects his recent appointment as CEO and the lack of any opportunity for share based awards to vest.
The CFO exceeds the minimum shareholding requirement; with a current holding equivalent to 161% of base salary using a share price of £2.362 (three-month average to 31 March 2016).
Shares beneficially
owned(a)
Shares subject to performance
conditions(b)
Shares not subject to performance
conditions(c)
Total shares held at
20 May 2016
Steve Wadey 20,944 363,636 – 384,580
David Mellors 34,693 1,145,239 265,975 1,445,907
Mark Elliott 125,000 – – 125,000
Michael Harper 30,000 – – 30,000
Admiral Sir James Burnell-Nugent 11,419 – – 11,419
Paul Murray 56,077 – – 56,077
Susan Searle 17,500 – – 17,500
Ian Mason 10,000 – – 10,000
Lynn Brubaker – – – –
(a) Shares beneficially owned comprise shares held under the Share Incentive Plan (including matched shares) and shares owned by the Executive Director and any connected persons.
(b) Shares subject to performance conditions comprise awards made under the DAB (matching) for 2014 and 2013, PSP for 2015, 2014 and 2013.(c) Shares not subject to performance conditions comprise deferred shares under the DAB plan for 2014, and 2013.
QinetiQ Group plc Annual Report and Accounts 2016 91
Strategic report Governance Financial statements Additional information
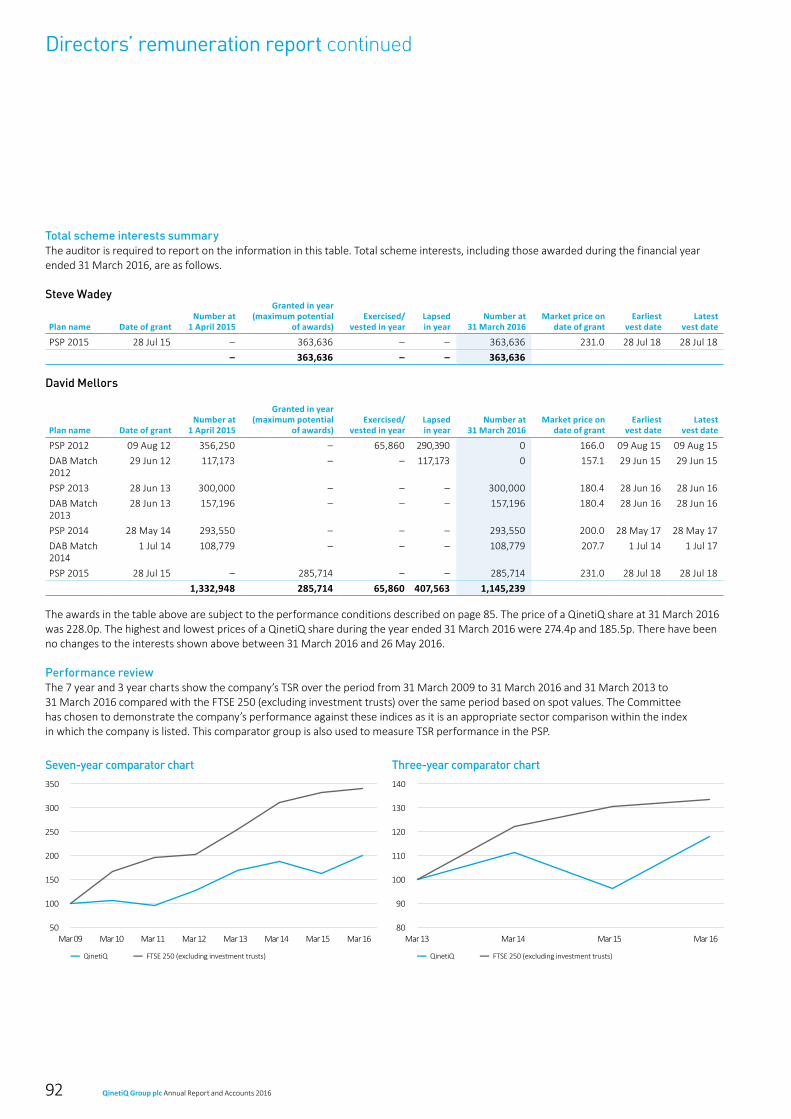
Directors’ remuneration report continued
Total scheme interests summaryThe auditor is required to report on the information in this table. Total scheme interests, including those awarded during the financial year ended 31 March 2016, are as follows.
Steve Wadey
Plan name Date of grantNumber at
1 April 2015
Granted in year (maximum potential
of awards)Exercised/
vested in year Lapsed in year
Number at 31 March 2016
Market price on date of grant
Earliest vest date
Latest vest date
PSP 2015 28 Jul 15 – 363,636 – – 363,636 231.0 28 Jul 18 28 Jul 18
– 363,636 – – 363,636
David Mellors
Plan name Date of grantNumber at
1 April 2015
Granted in year (maximum potential
of awards)Exercised/
vested in year Lapsed in year
Number at 31 March 2016
Market price on date of grant
Earliest vest date
Latest vest date
PSP 2012 09 Aug 12 356,250 – 65,860 290,390 0 166.0 09 Aug 15 09 Aug 15
DAB Match 2012
29 Jun 12 117,173 – – 117,173 0 157.1 29 Jun 15 29 Jun 15
PSP 2013 28 Jun 13 300,000 – – – 300,000 180.4 28 Jun 16 28 Jun 16
DAB Match 2013
28 Jun 13 157,196 – – – 157,196 180.4 28 Jun 16 28 Jun 16
PSP 2014 28 May 14 293,550 – – – 293,550 200.0 28 May 17 28 May 17
DAB Match 2014
1 Jul 14 108,779 – – – 108,779 207.7 1 Jul 14 1 Jul 17
PSP 2015 28 Jul 15 – 285,714 – – 285,714 231.0 28 Jul 18 28 Jul 18
1,332,948 285,714 65,860 407,563 1,145,239
The awards in the table above are subject to the performance conditions described on page 85. The price of a QinetiQ share at 31 March 2016 was 228.0p. The highest and lowest prices of a QinetiQ share during the year ended 31 March 2016 were 274.4p and 185.5p. There have been no changes to the interests shown above between 31 March 2016 and 26 May 2016.
Performance reviewThe 7 year and 3 year charts show the company’s TSR over the period from 31 March 2009 to 31 March 2016 and 31 March 2013 to 31 March 2016 compared with the FTSE 250 (excluding investment trusts) over the same period based on spot values. The Committee has chosen to demonstrate the company’s performance against these indices as it is an appropriate sector comparison within the index in which the company is listed. This comparator group is also used to measure TSR performance in the PSP.
Seven-year comparator chart
Mar 09 Mar 10 Mar 11 Mar 12 Mar 13 Mar 15Mar 14 Mar 1650
100
150
200
250
300
350
QinetiQ FTSE 250 (excluding investment trusts)
Three-year comparator chart
Mar 13 Mar 14 Mar 15 Mar 1680
90
100
110
120
130
140
QinetiQ FTSE 250 (excluding investment trusts)
QinetiQ Group plc Annual Report and Accounts 201692

CEO RemunerationThe table below shows the CEO’s remuneration over the same performance period (31 March 2009 to 31 March 2016):
Year ended 31 March Salary/fees Single figureAnnual Bonus
(% of maximum)Long-Term Incentives
(% of maximum vesting)
2016(a) 520,219 1,654,546 85.36% –
2016(b) 455,885 1,423,382 82.86% –
2015(c) 501,227 1,725,960 88.55% 13.91%
2015(d) 469,776 673,979 – –
2014 610,844 2,177,742 76.97% 15.43%
2013 593,050 3,992,001 100.00% 40.27%
2012 580,000 1,495,284 100.00% –
2011 580,000 1,327,156 100.00% –
2010(e) 217,872 886,564 – –
2010(f) 266,667 1,246,320 – –
(a) Steve Wadey joined the company 27 April 2015.(b) David Mellors was Interim CEO to 26 April 2015.(c) Steve Wadey joined the company 27 April 2015. David Mellors was Interim CEO from 1 Jan 2015.(d) Leo Quinn left the company on 31 December 2014.(e) Leo Quinn joined on 16 November 2009.(f) Graham Love on 30 November 2009.
Percentage change in CEO remunerationThe following table compares change in CEO remuneration with an employee comparator group (averaged per capita). For comparison purposes, Steve Wadey’s full year equivalent figures have been used (Steve joined on 27 April 2015).
CEO Comparison group(a)
2016 2015 % change 2016 2015 % change
Base salary £560,000 £627,792 -10.8% £38,992 £37,574 3.6%
Benefits £34,939 £57,857 -39.3% £1,200 £1,168 2.7%
Annual bonus £975,707 £998,603 -2.3% £921 £924 -0.3%
(a) The comparison group (4,000 employees) represents the UK principal businesses in service between 1 April 2015 and 31 March 2016.
Remuneration Policy for all employeesAll employees of QinetiQ are entitled to base salary, benefits and pension. UK and Australia based employees are entitled to participate in the QinetiQ Share Incentive Plan. The maximum opportunity available is based on the seniority and responsibility of the role. Participation in the PSP is available to Executive Directors; senior managers and selected employees throughout the organisation are also invited to participate. The Committee is advised of the general reward policy for other employees and of any significant changes proposed.
Relative importance of spend on payThe graph below shows actual spend on all employee remuneration, shareholder dividends and buybacks and any other significant use of profit and cash within the previous two financial years.
332.6 350.3
33.0 32.346.9
107.1
Total employeeremuneration
Share-based profitdistribution
Other significant profit distribution(a)
(£m) 2016 (£m) 2015
(a) For both 2016 and 2015 the figure relates to the share buyback resulting from the sale of the US Services business.
QinetiQ Group plc Annual Report and Accounts 2016 93
Strategic report Governance Financial statements Additional information

Directors’ remuneration report continued
Implementation of Policy for the year ending 31 March 2017Salary/feesNon-executive Director fees were last increased on 1 July 2015, and the Non-executive Chairman’s fees were last increased on 1 December 2013. Salaries and fees are reviewed in line with Policy. The review of Non-executive Directors’ fees resulted in an increase in base fees from £43,000 to £46,000 per annum.
Executive Directors are permitted to accept one external non- executive director position with the Board’s approval. Any fees received in respect of these appointments may be retained by the Executive Director.
Neither the CEO nor the CFO hold non-executive directorships in other companies.
Fees effective as at 1 April 2016
Non-executive Chairman £236,250
Accommodation allowance for Non-executive Chairman £75,000
Basic fee for UK Non-executive Director £46,000
Additional fee for chairing a Committee £9,000
Additional fee to Deputy Chairman/Senior Independent Non-executive Director £10,000
Additional fee for attendance at a Board meeting held in US by UK resident Non-executive Director £2,500
Additional fee for attendance at a Board meeting held in UK by US resident Non-executive Director $4,000
Incentives for ExecutivesBelow shows the measures and relative weighting for the 2017 Bonus Banking Plan for the CEO and CFO:
Performance Measure
Relative Weighting (%)
Bonus Banking Plan(target performance 112.5% of base salary, stretch performance 225% of base salary)
QinetiQ Operating Profit 25.0%
QinetiQ Operating Cash Flow(a) 25.0%
QinetiQ Order Intake 25.0%
Collective Objectives 12.5%
Personal Objectives 12.5%
(a) Adjusted to exclude LTPA and MSCA capital expenditure.
The Remuneration Committee has made the following main changes to the performance conditions for the 2017 Bonus Banking Plan:• Introduction of Order Intake as a new performance condition.
In accordance with the refreshed strategy top line growth is one of the key objectives. Order Intake measures revenue generation and therefore the introduction of this measure ensures that it is core focus of both the CEO and CFO. In addition, this type of measure is reflected in the bonus performance conditions for the new Executive Committee and therefore provides a common focus to the senior management of the company.
• An increase (20% to 25%) in the weighting of the element of bonus on collective and personal objectives. This amendment has been introduced to support the refreshed strategy and the transformation of the business and is designed with the financial KPIs to encourage a holistic approach to company performance over this period of change. Again these types of measures are cascaded through the Executive Committee.
Details of specific performance targets for the Bonus Banking Plan have not been provided as they are deemed commercially sensitive. They will be disclosed retrospectively in next year’s Annual Report on Remuneration.
In 2016 PSP awards to Executive Directors are equal to 200% of base salary for the CEO and 150% of base salary for the CFO. The graphs below show the targets against which the performance will be measured and the vesting mechanics:
30%
Median Upper quartile
Percentile performance
100%
TSR performance vs FTSE 250 (excl. investment trusts) – 50% of award
25%
3% 10%
CAGR EPS%
EPS performance – 50% of award100%
The Committee considered whether with the increased award level that the performance conditions should be changed for the CEO. However, the Committee reached the conclusion that given current and predicted market conditions facing the company the EPS and TSR performance conditions were in practice likely to be more stretching than in the past and therefore there was no requirement to change them for the higher award level.
QinetiQ Group plc Annual Report and Accounts 201694
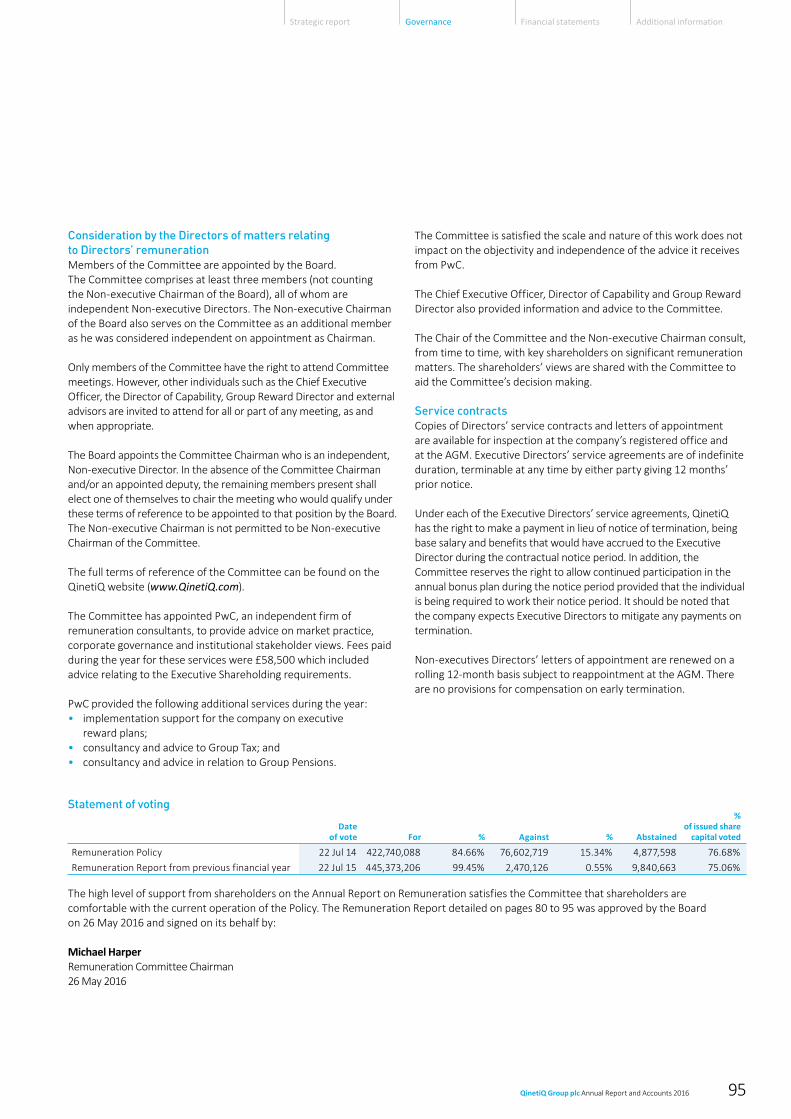
Consideration by the Directors of matters relating to Directors’ remunerationMembers of the Committee are appointed by the Board. The Committee comprises at least three members (not counting the Non-executive Chairman of the Board), all of whom are independent Non-executive Directors. The Non-executive Chairman of the Board also serves on the Committee as an additional member as he was considered independent on appointment as Chairman.
Only members of the Committee have the right to attend Committee meetings. However, other individuals such as the Chief Executive Officer, the Director of Capability, Group Reward Director and external advisors are invited to attend for all or part of any meeting, as and when appropriate.
The Board appoints the Committee Chairman who is an independent, Non-executive Director. In the absence of the Committee Chairman and/or an appointed deputy, the remaining members present shall elect one of themselves to chair the meeting who would qualify under these terms of reference to be appointed to that position by the Board. The Non-executive Chairman is not permitted to be Non-executive Chairman of the Committee.
The full terms of reference of the Committee can be found on the QinetiQ website (www.QinetiQ.com).
The Committee has appointed PwC, an independent firm of remuneration consultants, to provide advice on market practice, corporate governance and institutional stakeholder views. Fees paid during the year for these services were £58,500 which included advice relating to the Executive Shareholding requirements.
PwC provided the following additional services during the year:• implementation support for the company on executive
reward plans;• consultancy and advice to Group Tax; and• consultancy and advice in relation to Group Pensions.
The Committee is satisfied the scale and nature of this work does not impact on the objectivity and independence of the advice it receives from PwC.
The Chief Executive Officer, Director of Capability and Group Reward Director also provided information and advice to the Committee.
The Chair of the Committee and the Non-executive Chairman consult, from time to time, with key shareholders on significant remuneration matters. The shareholders’ views are shared with the Committee to aid the Committee’s decision making.
Service contractsCopies of Directors’ service contracts and letters of appointment are available for inspection at the company’s registered office and at the AGM. Executive Directors’ service agreements are of indefinite duration, terminable at any time by either party giving 12 months’ prior notice.
Under each of the Executive Directors’ service agreements, QinetiQ has the right to make a payment in lieu of notice of termination, being base salary and benefits that would have accrued to the Executive Director during the contractual notice period. In addition, the Committee reserves the right to allow continued participation in the annual bonus plan during the notice period provided that the individual is being required to work their notice period. It should be noted that the company expects Executive Directors to mitigate any payments on termination.
Non-executives Directors’ letters of appointment are renewed on a rolling 12-month basis subject to reappointment at the AGM. There are no provisions for compensation on early termination.
Statement of voting
Date of vote For % Against % Abstained
%of issued share
capital voted
Remuneration Policy 22 Jul 14 422,740,088 84.66% 76,602,719 15.34% 4,877,598 76.68%
Remuneration Report from previous financial year 22 Jul 15 445,373,206 99.45% 2,470,126 0.55% 9,840,663 75.06%
The high level of support from shareholders on the Annual Report on Remuneration satisfies the Committee that shareholders are comfortable with the current operation of the Policy. The Remuneration Report detailed on pages 80 to 95 was approved by the Board on 26 May 2016 and signed on its behalf by:
Michael Harper Remuneration Committee Chairman 26 May 2016
QinetiQ Group plc Annual Report and Accounts 2016 95
Strategic report Governance Financial statements Additional information

Directors’ report
Statutory information contained elsewhere in the Annual ReportInformation required to be part of this Directors’ report can be found elsewhere in the Annual Report as indicated in the table below and is incorporated into this report by reference:
Information Location in
Annual Report
Corporate Governance Statement page 50
Directors’ details page 58
Directors’ interests in shares page 91
Employees page 27
Financial instruments: Information on the Group’s financial risk management objectives and policies, and its exposure to credit risk, liquidity risk, interest rate risk and foreign currency risk
page 129
Greenhouse gas emissions page 31
Likely future developments in the business of the company or its subsidiaries
pages 2 to 49
Results and dividends page 38
Management reportThe Strategic report on pages 02 to 49 and the Directors’ report, as detailed on pages 96 to 99, including information which has been incorporated into those sections by reference, comprise the management report specified by rules 4.1.5R (2) and 4.1.8R of the FCA’s Disclosure Rules and Transparency Rules.
Research and developmentOne of the Group’s principal business streams is the provision of funded research and development (R&D) for customers. The Group also invests in the commercialisation of promising technologies across all areas of business.
The majority of R&D-related expenditure is incurred in respect of specific research contracts placed by customers. R&D costs are included within operating costs in the income statement and R&D income is reflected within revenue. In the financial year, the Group recorded £300.8m (2015: £306.6m) of total R&D-related expenditure, of which £277.6m (2015: £285.8m) was customer-funded work and £23.2m (2015: £20.8m) was internally funded (all comparative figures exclude discontinued operations). Additionally, £0.4m (2015: £0.4m) of late-stage development costs was capitalised and £1.2m (2015: £0.6m) of capitalised development costs was amortised in the year.
Political donationsQinetiQ does not make political donations to parties as that term would be commonly recognised. The legal definition of that term is, however, quite broad and may have the effect of covering a number of normal business activities that would not commonly be perceived to be political donations, such as sponsorship of events.
These may include legitimate interactions in making MPs and others in the political world aware of key industry issues and matters that affect QinetiQ, and that make an important contribution to their understanding of QinetiQ, the markets in which it operates and the work of their constituents.
BranchesThe company and its subsidiaries have established branches in a number of different countries in which they operate; their results are, however, not material to the Group’s financial results.
Share capitalAs at 31 March 2016, the company had allotted and fully paid up share capital of 586,681,200 ordinary shares of 1p each with an aggregate nominal value of £5.9m (including shares held by employee share trusts) and one Special Share with a nominal value of £1.
Details of the shares in issue during the financial year are shown in note 29 on page 136.
Share buyback activityFollowing the sale of the US Services business in 2014, shareholder approval was given for the Directors to purchase ordinary shares up to 14.99% of the issued ordinary share capital. The company resolved to use this authority to effect a £150 million return of capital to shareholders by way of an on-market share buyback, subject to prevailing equity market conditions, as this was considered to be a flexible distribution method which was simple to execute, easily understood by the market and provided shareholders with a choice as to whether to participate. During the financial year under review, the company completed this buyback. The company announced at the half year in November 2015 that it intended to carry out a further return of capital to shareholders of up to £50 million over 12 months, consistent with the company’s capital allocation policy, by way of an on-market buyback, subject to prevailing equity market conditions. This buyback has begun and will continue during the year ending31 March 2017, subject to market conditions.
As a result of the share buyback activity detailed above, during the year under review, 21,928,804 ordinary shares in the capital of the company (representing 3.74% of the issued ordinary share capital as at 31 March 2016) were purchased at an average price of 217 pence per share. All of these shares have been cancelled.In the financial year, the impact of the share buyback has been to increase basic underlying earnings per share from 15.2p to 16.3p, for total shareholder return to remain unchanged and for net asset value to reduce by £46.9 million. In accordance with the Investment Association’s guidelines, the effect of the share buyback has been neutralised in incentive schemes, such that for calculation purposes the number of shares in issue is regarded as the same at the end of the three-year performance period as at the beginning. Accordingly, no benefit has accrued under the incentive schemes as a consequence of the share buyback.
Rights of ordinary shareholdersThe rights of ordinary shareholders are set out in the Articles of Association. The Articles of Association can be found on the company’s website at www.QinetiQ.com in the Corporate Governance section. The holders of ordinary shares are entitled to receive the company’s Reports and Accounts, to attend and speak at general meetings of the company, to exercise voting rights in person or by appointing a proxy, and to receive a dividend where declared or paid out of profits available for that purpose.
QinetiQ Group plc Annual Report and Accounts 201696

Rights of special shareholderThe Special Share is held by HM Government through the Secretary of State for Defence (the Special Shareholder) and it may only be held by and transferred to HM Government. It confers certain rights which are set out in the Articles of Association to protect UK defence and security interests. These include:
• the promotion and reinforcement of the MOD compliance principles which require QinetiQ to be an impartial, ethical and responsible contractor by avoiding conflicts of interest in its dealings with the MOD;
• the protection of defined strategic assets of the Group, such as certain testing facilities, by providing the Special Shareholder with an option to purchase those assets in certain circumstances;
• the right to require certain persons with a material interest in QinetiQ to dispose of some or all of their ordinary shares on the grounds of national security or conflict of interest; and
• nationality of Directors provisions whereby at least the Non-executive Chairman or Chief Executive Officer must be a British citizen.
The Special Share carries no financial and economic value and the Special Shareholder is not entitled to vote at a general meeting of the company. At any time the Special Shareholder may require QinetiQ to redeem the share at par and, if wound up, the Special Shareholder would be entitled to be repaid at its nominal value before other shareholders. Any variation of the rights attaching to the Special Share requires the written approval of the MOD. Further details can be found in note 29 on page 136.
Restrictions on the transfer of sharesAs detailed above, the Special Share confers rights under the Company’s Articles of Association to require certain persons with an interest in QinetiQ’s shares that exceed certain prescribed thresholds to dispose of some or all of their ordinary shares on the grounds of national security or conflict of interest.
Employee share schemesThe QinetiQ Group plc Employee Benefit Trust (the Trust) holds shares in connection with QinetiQ’s employee share schemes, excluding the Share Incentive Plan. As at 31 March 2016, the Trust held 3,007,587 ordinary shares of 1p each (the Trust Shares). The Trustees of the Trust have agreed to waive their entitlement to dividends payable on the Trust Shares. The Trust holds further ordinary shares in respect of deferred shares held on behalf of participants in the Company’s Deferred Annual Bonus Plan. Dividends received by the Trust in respect of the deferred shares are paid direct to the plan participants on receipt and are not retained in the Trust.
Equiniti Share Plan Trustees Limited acts as Trustee in respect of all ordinary shares held by employees under the QinetiQ Group plc Share Incentive Plan (the Plan). Equiniti Share Plan Trustees Limited will vote on all resolutions proposed at general meetings in accordance with voting instructions received from participants in the Plan.
Corporate sponsored nomineeIn circumstances where ordinary shares are held by the corporate sponsored nominee service, Equiniti Corporate Nominees Limited will vote on all resolutions proposed at general meetings in accordance with voting instructions received from shareholders using such corporate nominee service.
Major shareholdingsThe company has been notified of the following interests of 3% or more in the issued ordinary share capital of the company (being voting rights over such share capital) pursuant to Rule 5.1 of the Disclosure Rules and Transparency Rules:
Name of shareholder
At 31 March 2016 % of issued share
capital*At 20 May 2016#
% of issued share
Schroders 9.984% 9.984%
Artisan Partners 5.01% 5.01%
BlackRock, Inc. 5.01% 8.63%
Investec 4.95% 4.95%
Norges Bank 3.93% 3.93%
* as notified by the shareholder.# being a date not more than a month prior to the date of the notice of AGM.
Directors’ conflicts of interestThe company requires Directors to disclose proposed outside business interests before they are entered into. This enables prior assessment of any conflict, or potential conflict, of interest and any impact on time commitment. An annual review of all external interests is carried out by the Board.
Directors’ interests in contractsAt the date of this report, there is no contract or arrangement with the company or any of its subsidiaries that is significant in relation to the business of the Group as a whole in which a Director of the company is materially interested.
IndemnitiesThe Articles of Association of the company entitle the Directors of the company, to the extent permitted by law, to be indemnified out of the assets of the company in the event that they suffer any expenses in connection with certain proceedings relating to the execution of their duties as Directors of the company.
In addition, the company purchases Directors’ and officers’ liability insurance. Where it is not possible for Directors and officers to be indemnified by the company, such Directors and officers of the company benefit from the Directors’ and officers’ liability insurance cover in respect of legal actions brought against them. This insurance protection is also provided to the company and its subsidiaries where they have provided an indemnity.
The Directors of QinetiQ Pension Scheme Trustee Limited, a Group company and the Trustee of the QinetiQ Pension Scheme (the Scheme), benefit from an indemnity contained in the rules of the Scheme. The indemnity would be provided out of the Scheme assets.
QinetiQ Group plc Annual Report and Accounts 2016 97
Strategic report Governance Financial statements Additional information

Change of control – significant agreementsThe following significant agreements contain provisions entitling the counterparties to require prior approval, exercise termination, alteration or other similar rights in the event of a change of control of the company, or if the company ceases to be a UK company:
• The Combined Aerial Target Service contract is a 20-year contract awarded to QinetiQ by the MOD on 14 December 2006. The terms of this contract require QinetiQ Limited to remain a UK company which is incorporated under the laws of any part of the UK, or an overseas company registered in the UK, and that at least 50% of the Board of Directors are UK nationals. The terms also contain change of control conditions and restricted share transfer conditions which require prior approval from HM Government if there is a material change in the ownership of QinetiQ Limited’s share capital, unless the change relates to shares listed on a regulated market – ‘material’ is defined as being 10% or more of the share capital. In addition, there are restrictions on transfers of shares to persons from countries appearing on the restricted list as issued by HM Government.
• The Long Term Partnering Agreement (LTPA) is a 25-year contract, which QinetiQ Limited signed on 28 February 2003, to provide test, evaluation and training services to the MOD. This contract contains conditions under which the prior approval of HM Government is required if the contractor, QinetiQ Limited, ceases to be a subsidiary of the QinetiQ Group, except where such change in control is permitted under the shareholders Agreement to which the MOD is a party.
• The company is party to a multi-currency revolving credit facility with a US$100m tranche and a £166m tranche, provided by a consortium of banks, that expires on 29 August 2019. Under the terms of the facility, in the event of a change of control of the company, any lender may give notice to cancel its commitment under the facility and require all outstanding amounts to be repaid.
The Directors’ contracts contain no provisions for compensation for loss of office on a change of control of the company.
Articles of AssociationChanges to the Articles must be submitted to shareholders for approval. Save in respect of the rights attaching to the Special Share, the company has not adopted any special rules relating to the appointment and replacement of Directors or the amendment of the Company’s Articles of Association, other than as provided under UK corporate law.
Appointment and replacement of DirectorsAccording to the Articles of Association, all Directors are subject to election by shareholders at the first annual general meeting following their appointment, and to re-election thereafter at intervals of no more than three years. In line with best practice reflected in the Code, however, the company requires each serving member of the Board to be put forward for election or re-election on an annual basis at each annual general meeting.
Powers of the Directors: allotment/purchase of own sharesAt the Company’s Annual General Meeting held in July 2015, the shareholders passed resolutions which authorised the Directors to allot relevant securities up to an aggregate nominal value of £3,981,256 (£1,990,329 pursuant only to a rights issue), to disapply pre-emption rights (up to 5% of the issued ordinary share capital) and to purchase ordinary shares (up to 10% of the issued ordinary share capital).
Resolutions in respect of the allotment of relevant securities, the disapplication of pre-exemption rights and the purchase of own shares will be laid before the 2016 Annual General Meeting.
Annual General MeetingThe Company’s Annual General Meeting will be held on Wednesday, 20 July 2016 at 11.00am, at the offices of Ashurst LLP, Broadwalk House, 5 Appold Street, London EC2A 2HA. Details of the business to be proposed and voted on at the meeting are contained in the Notice of Annual General Meeting, which is sent to all shareholders and is also published on the company’s website, www.QinetiQ.com in the ‘Investors’ section.
AuditorKPMG LLP has expressed its willingness to continue in office as auditor and a resolution to re-appoint them will be proposed at the Annual General Meeting.
Directors’ report continued
QinetiQ Group plc Annual Report and Accounts 201698

Directors’ responsibilities in respect of the Annual Report and financial statementsThe Directors are responsible for preparing the Annual Report and the Group and parent company financial statements in accordance with applicable law and regulations.
Company law requires the Directors to prepare Group and parent company financial statements for each financial year. Under that law they are required to prepare the Group financial statements in accordance with IFRSs as adopted by the EU and applicable law and have elected to prepare the parent company financial statements in accordance with UK Accounting Standards and applicable law (UK Generally Accepted Accounting Practice).
Under company law the Directors must not approve the financial statements unless they are satisfied that they give a true and fair view of the state of affairs of the Group and parent company and of their profit or loss for that period. In preparing each of the Group and parent company financial statements, the Directors are required to:
• select suitable accounting policies and then apply them consistently;• make judgements and estimates that are reasonable and prudent;• for the Group financial statements, state whether they have been
prepared in accordance with IFRSs as adopted by the EU;• for the parent company financial statements, state whether
applicable UK Accounting Standards have been followed, subject to any material departures disclosed and explained in the parent company financial statements; and
• prepare the financial statements on the going concern basis unless it is inappropriate to presume that the Group and the parent company will continue in business.
The Directors are responsible for keeping adequate accounting records that are sufficient to show and explain the parent company’s transactions and disclose with reasonable accuracy at any time the financial position of the parent company and enable them to ensure that its financial statements comply with the Companies Act 2006. They have general responsibility for taking such steps as are reasonably open to them to safeguard the assets of the Group and to prevent and detect fraud and other irregularities.
Under applicable law and regulations, the Directors are also responsible for preparing a Strategic report, Directors’ report, Directors’ remuneration report and Corporate Governance Statement that comply with that law and those regulations.
The Directors are responsible for the maintenance and integrity of the corporate and financial information included on the company’s website. Legislation in the UK governing the preparation and dissemination of financial statements may differ from legislation in other jurisdictions.
Statement of disclosure of information to the auditorThe Directors who held office at the date of approval of this Directors’ report have confirmed that, so far as the Directors are aware, there is no relevant audit information of which the company’s auditor is unaware, and the Directors have taken all the steps they reasonably should have taken as Directors to make themselves aware of any relevant audit information and to establish that the company’s auditor is aware of that information.
Responsibility statement of the Directors in respect of the Annual ReportThe Directors in office as at the date of this report confirm that to the best of their knowledge:
• the financial statements, prepared in accordance with the applicable set of accounting standards, give a true and fair view of the assets, liabilities, financial position and profit or loss of the company, and the undertakings included in the consolidation taken as a whole; and
• the Directors’ report includes a fair review of the development and performance of the business, and the position of the company and the undertakings included in the consolidation taken as a whole, together with a description of the principal risks and uncertainties that they face.
By order of the Board:
Jon Messent Company Secretary and Group General Counsel 26 May 2016
QinetiQ Group plc Annual Report and Accounts 2016 99
Strategic report Governance Financial statements Additional information

Opinions and conclusions arising from our audit 1. Our opinion on the financial statements is unmodifiedWe have audited the financial statements of QinetiQ Group plc for the year ended 31 March 2016 which comprise the Consolidated Income Statement, the Consolidated Statement of Comprehensive Income, the Consolidated Statement of Changes in Equity, the Consolidated Statement of Financial Position, the Consolidated Statement of Cash Flows, the parent company Balance Sheet and the related notes. In our opinion:• the financial statements give a true and fair view of the state
of the Group’s and of the parent company’s affairs as at 31 March 2016 and of the Group’s profit for the year then ended;
• the Group financial statements have been properly prepared in accordance with International Financial Reporting Standards as adopted by the European Union (IFRSs as adopted by the EU);
• the parent company financial statements have been properly prepared in accordance with UK Accounting Standards, including FRS 101 Reduced Disclosure Framework; and
• the financial statements have been prepared in accordance with the requirements of the Companies Act 2006; and, as regards the Group financial statements, Article 4 of the IAS Regulation.
2. Our assessment of risks of material misstatementIn arriving at our audit opinion above on the financial statements, the risks of material misstatement that had the greatest effect on our audit, in decreasing order of audit significance, were as follows:
Recurring risks• Recognition of revenues and profits on long-term contracts
£679.0m (2015: £685.1m)
Refer to page 71 (Report of the Audit Committee), page 107 (accounting policy note) and page 113 (financial disclosures).
The risk: A significant proportion of the Group’s revenues and profits are derived from long-term contracts. These contracts can include complex technological and commercial risks and often specify performance milestones to be achieved throughout the contract period. This results in estimates and assumptions having to be made to forecast the margin on each contract after making appropriate allowances for these technical and commercial risks related to performance milestones yet to be achieved. The risk of misstatement is that the accounting for the Group’s significant contracts does not accurately reflect the status and the associated cost to complete of the relevant contract.
Our response: Our audit procedures included, amongst others, testing the design and operating effectiveness of controls in place to manage the commercial, technical and financial aspects of the Group’s long-term contracts. For a sample of significant contracts, determined on the basis of technical and commercial complexity, financial significance and profitability, we also obtained an understanding of the status of the contract through discussions with contract project teams and Directors at a Group and divisional level, attendance at project teams’ contract review meetings, and examining externally available evidence, such as customer correspondence, where relevant. On a sample basis we examined the assumptions behind estimated costs to complete, challenging the reasonableness of these in light of supporting evidence including past experience of the contracts and the extent of technical or commercial risk identified. We also assessed whether the Group’s disclosures in respect of the analysis of revenue and material contingent liabilities properly reflected the evidence obtained.
• Carrying value of US Global Products goodwill – £37.9m (2015: £67.2m)
Refer to page 71 (Report of the Audit Committee), page 108 (accounting policy note) and page 121 (financial disclosures).
The risk: The carrying value of goodwill is assessed for impairment at least annually and whenever there is an indication that the asset may be impaired. In the period an impairment has been recognised to the goodwill associated with the US Global Products Cash-Generating Unit. There is inherent uncertainty involved in forecasting the future cash flows due to the variability of future sales and product mix. Judgement is required in the selection of an appropriate discount rate used for the purposes of the impairment calculations. Whilst the projections anticipate future growth based on 2016 performance, there remains uncertainty around the impact of new revenue streams and demand for the current portfolio of products.
Our response: Our audit procedures included testing the principles and mathematical integrity of the Group’s discounted cash flow model, comparing the Group’s assumptions to external market evidence such as projected economic growth and discount rates, involving our corporate finance specialists as we considered appropriate and challenging the cash flow projections by reviewing the timing of new revenue streams and product mix against market conditions and the current level of sales. We tested the sensitivity of the impairment calculation to changes in the judgements and assumptions used by the Directors. We also assessed whether the Group’s disclosures about the sensitivity of the outcome of the impairment assessment to changes in key assumptions properly reflected the risks inherent in the valuation of goodwill.
Independent auditor’s report to the members of QinetiQ Group plc only
QinetiQ Group plc Annual Report and Accounts 2016100
• Other payables, provisions and contingent liabilities included within other payables of £163.3m (2015: £169.7m), provisions of £19.1m (2015: £25.4m) and contingent liabilities of £Nil (2015: £Nil)
Refer to page 71 (Report of the Audit Committee), page 109 (accounting policy note) and pages 126 and 143 (financial disclosures).
The risk: The Group holds provisions in respect of warranty claims and indemnities and regulatory issues. The Group operates in regulated environments and a failure to comply with particular regulations could result in fines and/or penalties. There is judgement required in determining the significance of any instances of potential non-compliance and potential liability based on management’s assessment of the most likely outcome. The financial statements also disclose contingent liabilities in respect of legal claims and regulatory issues which have not been provided for on the basis that they are not considered to qualify for recognition as provisions. This is one of our key areas of audit focus.
Our response: Our audit procedures included a critical assessment of the extent to which the Directors’ estimates take into account a balanced assessment of the latest available information and the accuracy and reliability of the sources of that information.We corroborated the appropriateness of the Directors’ assumptions by reference to third party confirmations and legal advice, where available, and considered whether our understanding of the business gained throughout the audit process corroborated the provisions recorded. We challenged the Directors’ estimates of the most likely outcomes based on the range of possible outcomes to determine if the amounts provided are appropriate.
We considered the adequacy of the Group’s disclosures in respect of other payables, provisions and contingent liabilities.
• Tax liabilities – current tax payable £39.9m (2015: £15.3m), deferred tax asset £4.1m (2015: £12.9m).
Refer to page 71 (Report of the Audit Committee), page 108 (accounting policy note) and pages 124 and 126 (financial disclosures).
The risk: The Group is subject to income taxes in UK, USA and a number of other overseas jurisdictions. The level of current tax and deferred tax recognised requires judgements as to the likely outcome of decisions to be made by the tax authorities. This includes those related to specific tax allowances, such as the UK Research and Development tax credit. There is a risk that the judgements on which the provisions are based do not take into account or do not properly reflect the latest available, reliable information or an appropriate application of relevant tax legislation, and are either under or overstated as a result.
Our response: Our audit procedures included challenging the appropriateness of the Directors’ assumptions and estimates in relation to tax assets and liabilities, by critically assessing the range of possible amounts that may be assessed under tax laws, likely settlements based on the latest correspondence with the relevant tax authorities and the complexity of the relevant tax legislation. We involved our own tax specialists in analysing and challenging the assumptions used to determine tax provisions based on our knowledge and experience of the application of the legislation by the relevant authorities and courts. We also assessed whether the Group’s tax disclosures are appropriate and in accordance with relevant accounting standards.
Removal of risk in respect of Consolidation of US subsidiariesWe continue to perform procedures over the consolidation of US subsidiaries. However, there has been no change in our conclusion that the Proxy agreement does not restrict the Group’s ability to control FMI’s operating and financial policies. This is not one of the risks that had the greatest impact on our audit for the year ended 31 March 2016 and therefore it is not separately identified in our report.
3. Our application of materiality and an overview of the scope of our auditMateriality for the Group financial statements as a whole was set at £5.2m (2015: £5.3m), determined with reference to a benchmark of Group profit before taxation, normalised to exclude this year’s specific adjusting items as disclosed in note 4 of £108.7m (2015: £107.8m), of which it represents 4.8% (2015: 4.9%). The Group audit team performed procedures on those items excluded from normalised Group profit before taxation.
We reported to the Audit Committee any corrected or uncorrected misstatements exceeding £0.3 million (2015: £0.3 million), in addition to other identified misstatements that warranted reporting on qualitative grounds.
The audit of QinetiQ Limited, the main UK trading company, and goodwill arising on consolidation accounted for the following percentages of the Group’s results: 81% (2015: 81%) of total Group revenue; 90% (2015: 92%) of the total profits and losses that made up the Group’s underlying profit before taxation; and 69% (2015: 70%) of total Group assets. For the remaining components, we performed analysis at an aggregate Group level to re-examine our assessment that there were no significant risks of material misstatement within these.
4. Our opinion on other matters prescribed by the Companies Act 2006 is unmodifiedIn our opinion:
• the part of the Directors’ remuneration report to be audited has been properly prepared in accordance with the Companies Act 2006; and
• the information given in the Strategic report and Directors’ Report for the financial year for which the financial statements are prepared is consistent with the financial statements.
QinetiQ Group plc Annual Report and Accounts 2016 101
Strategic report Governance Financial statements Additional information

Independent auditor’s report to the members of QinetiQ Group plc only continued
5. We have nothing to report on the disclosures of principal risksBased on the knowledge we acquired during our audit, we have nothing material to add or draw attention to in relation to:
• the Directors’ confirmation of longer-term viability on page 69, concerning the principal risks, their management, and, based on that, the Directors’ assessment and expectations of the Group’s continuing in operation over the 3 years to 31 March 2019; or
• the disclosures in note 1 of the financial statements concerning the use of the going concern basis of accounting.
6. We have nothing to report in respect of the matters on which we are required to report by exceptionUnder ISAs (UK and Ireland) we are required to report to you if, based on the knowledge we acquired during our audit, we have identified other information in the Annual Report that contains a material inconsistency with either that knowledge or the financial statements, a material misstatement of fact, or that is otherwise misleading.
In particular, we are required to report to you if:
• we have identified material inconsistencies between the knowledge we acquired during our audit and the Directors’ statement that they consider that the Annual Report and financial statements taken as a whole is fair, balanced and understandable and provides the information necessary for shareholders to assess the Group’s position and performance, business model and strategy; or
• the Audit Committee Report does not appropriately address matters communicated by us to the Audit Committee.
Under the Companies Act 2006 we are required to report to you if, in our opinion:
• adequate accounting records have not been kept by the parent company, or returns adequate for our audit have not been received from branches not visited by us; or
• the parent company financial statements and the part of the Directors’ remuneration report to be audited are not in agreement with the accounting records and returns; or
• certain disclosures of Directors’ remuneration specified by law are not made; or
• we have not received all the information and explanations we require for our audit.
Under the Listing Rules we are required to review:
• the Directors’ statement, set out on pages 68 to 69, in relation to going concern and longer-term viability; and
• the part of the Corporate Governance Statement on pages 51 to 77 relating to the company’s compliance with the eleven provisions of the 2014 UK Corporate Governance Code specified for our review.
We have nothing to report in respect of the above responsibilities.
Scope of report and responsibilitiesAs explained more fully in the Directors’ Responsibilities Statement set out on page 99, the Directors are responsible for the preparation of the financial statements and for being satisfied that they give a true and fair view. A description of the scope of an audit of accounts is provided on the Financial Reporting Council’s website at www.frc.org.uk/auditscopeukprivate. This report is made solely to the company’s members as a body and subject to important explanations and disclaimers regarding our responsibilities, published on our website at www.kpmg.com/uk/auditscopeukco2014a, which are incorporated into this report as if set out in full and should be read to provide an understanding of the purpose of this report, the work we have undertaken and the basis of our opinions.
Anthony Sykes (Senior Statutory Auditor)for and on behalf of KPMG LLP, Statutory Auditor Chartered Accountants15 Canada SquareLondonE14 5GL
26 May 2016
QinetiQ Group plc Annual Report and Accounts 2016102
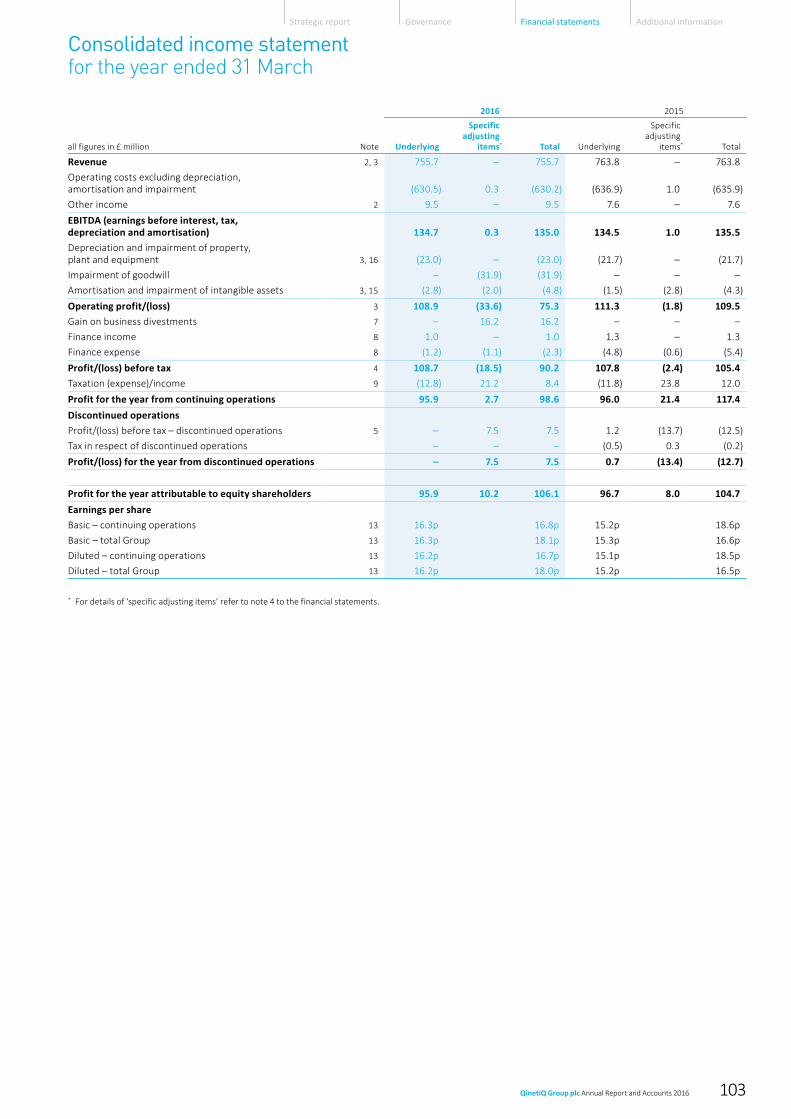
Consolidated income statement for the year ended 31 March
2016 2015
all figures in £ million Note Underlying
Specific adjusting
items* Total Underlying
Specific adjusting
items* Total
Revenue 2, 3 755.7 – 755.7 763.8 – 763.8
Operating costs excluding depreciation, amortisation and impairment (630.5) 0.3 (630.2) (636.9) 1.0 (635.9)
Other income 2 9.5 – 9.5 7.6 – 7.6
EBITDA (earnings before interest, tax, depreciation and amortisation) 134.7 0.3 135.0 134.5 1.0 135.5Depreciation and impairment of property, plant and equipment 3, 16 (23.0) – (23.0) (21.7) – (21.7)
Impairment of goodwill – (31.9) (31.9) – – –
Amortisation and impairment of intangible assets 3, 15 (2.8) (2.0) (4.8) (1.5) (2.8) (4.3)
Operating profit/(loss) 3 108.9 (33.6) 75.3 111.3 (1.8) 109.5 Gain on business divestments 7 – 16.2 16.2 – – –
Finance income 8 1.0 – 1.0 1.3 – 1.3
Finance expense 8 (1.2) (1.1) (2.3) (4.8) (0.6) (5.4)
Profit/(loss) before tax 4 108.7 (18.5) 90.2 107.8 (2.4) 105.4 Taxation (expense)/income 9 (12.8) 21.2 8.4 (11.8) 23.8 12.0
Profit for the year from continuing operations 95.9 2.7 98.6 96.0 21.4 117.4 Discontinued operationsProfit/(loss) before tax – discontinued operations 5 – 7.5 7.5 1.2 (13.7) (12.5)
Tax in respect of discontinued operations – – – (0.5) 0.3 (0.2)
Profit/(loss) for the year from discontinued operations – 7.5 7.5 0.7 (13.4) (12.7)
Profit for the year attributable to equity shareholders 95.9 10.2 106.1 96.7 8.0 104.7 Earnings per shareBasic – continuing operations 13 16.3p 16.8p 15.2p 18.6p
Basic – total Group 13 16.3p 18.1p 15.3p 16.6p
Diluted – continuing operations 13 16.2p 16.7p 15.1p 18.5p
Diluted – total Group 13 16.2p 18.0p 15.2p 16.5p
* For details of ‘specific adjusting items’ refer to note 4 to the financial statements.
QinetiQ Group plc Annual Report and Accounts 2016 103
Strategic report Governance Financial statements Additional information

all figures in £ million 2016 2015
Profit for the year 106.1 104.7
Items that will not be reclassified to profit or loss:Actuarial loss recognised in defined benefit pension schemes (10.6) (24.5)
Tax on items that will not be reclassified to profit and loss 2.1 5.1
Total items that will not be reclassified to profit or loss (8.5) (19.4)Items that may be reclassified to profit or loss:Foreign currency translation differences for foreign operations 3.2 11.0
Recycling of currency translation differences to the income statement on disposal of foreign subsidiaries 1.7 (40.9)
Decrease in fair value of hedging derivatives (0.1) (0.1)
Reclassification of hedging derivatives to the income statement – 0.1
Fair value (losses)/gains on available-for-sale investments (0.6) 0.2
Total items that may be reclassified to profit or loss 4.2 (29.7)
Other comprehensive expense for the year, net of tax (4.3) (49.1)
Total comprehensive income for the year 101.8 55.6
Consolidated statement of changes in equity for the year ended 31 March
all figures in £ million
Issued share
capital
Capital redemption
reserve Share
premiumHedge
reserveTranslation
reserveRetained earnings Total
Non- controlling
interestTotal
equity
At 1 April 2015 6.1 40.4 147.6 0.1 (6.8) 110.6 298.0 0.1 298.1 Profit for the year – – – – – 106.1 106.1 0.1 106.2 Other comprehensive income/ (expense) for the year, net of tax – – – (0.1) 4.9 (9.1) (4.3) – (4.3)Purchase of own shares – – – – – (0.7) (0.7) – (0.7)Purchase and cancellation of shares (0.2) 0.2 – – – (46.9) (46.9) – (46.9)Share-based payments – – – – – 4.7 4.7 – 4.7 Dividends – – – – – (32.3) (32.3) – (32.3)At 31 March 2016 5.9 40.6 147.6 – (1.9) 132.4 324.6 0.2 324.8
At 1 April 2014 6.6 39.9 147.6 0.1 23.1 160.7 378.0 0.1 378.1Profit for the year – – – – – 104.7 104.7 – 104.7 Other comprehensive expense for the year, net of tax – – – – (29.9) (19.2) (49.1) – (49.1)Purchase of own shares – – – – – (0.6) (0.6) – (0.6)Purchase and cancellation of shares (0.5) 0.5 – – – (107.1) (107.1) – (107.1)Share-based payments settlement – – – – – 0.6 0.6 – 0.6 Share-based payments – – – – – 3.2 3.2 – 3.2 Dividends – – – – – (31.7) (31.7) – (31.7)At 31 March 2015 6.1 40.4 147.6 0.1 (6.8) 110.6 298.0 0.1 298.1
Consolidated comprehensive income statement for the year ended 31 March
QinetiQ Group plc Annual Report and Accounts 2016104

all figures in £ million Note 2016 2015
Non-current assetsGoodwill 14 73.1 107.2
Intangible assets 15 8.3 15.3
Property, plant and equipment 16 233.4 229.6
Other financial assets 25 0.6 0.9
Investments 17 0.9 0.4
Deferred tax 18 4.1 12.9
320.4 366.3Current assetsInventories 19 19.0 18.5
Other financial assets 25 10.8 12.3
Trade and other receivables 20 156.2 159.2
Investments 21 1.7 2.3
Cash and cash equivalents 25 263.5 184.3
451.2 376.6Total assets 771.6 742.9Current liabilitiesTrade and other payables 22 (338.7) (352.3)
Current tax 23 (39.9) (15.3)
Provisions 24 (5.3) (3.0)
Other financial liabilities 25 (0.2) (1.9)
(384.1) (372.5)Non-current liabilitiesRetirement benefit obligation 31 (37.7) (39.4)
Provisions 24 (13.8) (22.4)
Other financial liabilities 25 (0.2) (0.1)
Other payables 22 (11.0) (10.4)
(62.7) (72.3)Total liabilities (446.8) (444.8)Net assets 324.8 298.1Capital and reserves Ordinary shares 29 5.9 6.1
Capital redemption reserve 40.6 40.4
Share premium account 147.6 147.6
Hedging and translation reserve (1.9) (6.7)
Retained earnings 132.4 110.6
Capital and reserves attributable to shareholders of the parent company 324.6 298.0Non-controlling interest 0.2 0.1
Total shareholders’ funds 324.8 298.1
The financial statements were approved by the Board of Directors and authorised for issue on 26 May 2016 and were signed on its behalf by:
Mark Elliott Chairman
Steve Wadey Chief Executive Officer
David Mellors Chief Financial Officer
Consolidated balance sheet as at 31 March
QinetiQ Group plc Annual Report and Accounts 2016 105
Strategic report Governance Financial statements Additional information

all figures in £ million Note 2016 2015
Net cash inflow from continuing operations before cash flows in respect of specific adjusting items 28 133.4 143.9Net cash outflow relating to restructuring – (0.6)
Disposal-related pension contribution – (6.0)
Cash generated from discontinued operations – 1.8
Cash inflow from operations 133.4 139.1Tax received 27.9 8.8
Interest received 0.9 1.0
Interest paid (0.6) (36.4)
Net cash inflow from operating activities 161.6 112.5Purchases of intangible assets (1.6) (4.2)
Purchases of property, plant and equipment (28.6) (24.8)
Proceeds from sale of property, plant and equipment 0.4 –
Investment in available for sale investments – (10.0)
Acquisition of businesses 6 (0.6) (3.7)
Sale of investment in subsidiaries 28.0 79.6
Net cash (outflow)/inflow from investing activities (2.4) 36.9Repayment of bank borrowings – (147.1)
Payment of bank loan arrangement fee – (1.3)
Purchase of own shares (48.6) (106.8)
Dividends paid to shareholders (32.3) (31.7)
Capital element of finance lease rental payments (1.4) (2.8)
Capital element of finance lease rental receipts 1.5 3.0
Net cash outflow from financing activities (80.8) (286.7)Increase/(decrease) in cash and cash equivalents 78.4 (137.3)Effect of foreign exchange changes on cash and cash equivalents 0.8 0.4
Cash and cash equivalents at beginning of year 184.3 322.2
Cash and cash equivalents disposed – (1.0)
Cash and cash equivalents at end of year 25 263.5 184.3
Reconciliation of movement in net cash for the year ended 31 March
all figures in £ million Note 2016 2015
Increase/(decrease) in cash and cash equivalents in the year 78.4 (137.3)Add back net cash flows not impacting net cash – repayment of bank loans and fees – 148.4
Add back net cash flows not impacting net cash – investments – 10.0
Add back net cash flows not impacting net cash – other (0.1) (0.2)
Change in net cash resulting from cash flows 25 78.3 20.9 Cash and cash equivalents disposed – (1.0)
Other movements including foreign exchange 25 0.7 5.1
Movement in net cash in the year 25 79.0 25.0 Net cash at beginning of year 25 195.5 170.5
Net cash at end of year 25 274.5 195.5
Consolidated cash flow statement for the year ended 31 March
QinetiQ Group plc Annual Report and Accounts 2016106

1. Significant accounting policiesAccounting policiesThe following accounting policies have been applied consistently to all periods presented in dealing with items that are considered material in relation to the Group’s financial statements. In the income statement, the Group presents specific adjusting items separately. In the judgement of the Directors, for the reader to obtain a proper understanding of the financial information, specific adjusting items need to be disclosed separately because of their size and nature. Underlying measures of performance exclude specific adjusting items.
Specific adjusting items include:
• amortisation of intangible assets arising from acquisitions;• pension net finance expense;• gains/losses on business divestments and disposal of property and investments;• impairment of goodwill and other intangible assets;• one-off recovery of research and development tax credits and associated write-off of deferred tax asset in respect of tax losses; and• other significant non-recurring deferred tax movements.
Basis of preparationThe Group’s financial statements, approved by the Directors, have been prepared on a going concern basis as discussed in the Directors’ Report on page 68 and in accordance with International Financial Reporting Standards as adopted by the EU (‘IFRS’) and the Companies Act 2006 applicable to companies reporting under IFRS. The company has elected to prepare its parent company financial statements in accordance with UK GAAP; these are presented on pages 145 to 146. The financial statements have been prepared under the historical cost convention, as modified by the revaluation of available-for-sale financial assets and other relevant financial assets and liabilities. Non-current assets held for sale are held at the lower of carrying amount and fair value less costs to sell. The Group’s reporting currency is sterling and unless otherwise stated the financial statements are rounded to the nearest £100,000.
Basis of consolidationThe consolidated financial statements comprise the financial statements of the company and its subsidiary undertakings to 31 March 2016. The purchase method of accounting has been adopted. Those subsidiary undertakings acquired or disposed of in the period are included in the consolidated income statement from the date control is obtained to the date that control is lost (usually on acquisition and disposal respectively). An investor controls an investee when it is exposed, or has rights, to variable returns from its involvement with the investee and has the ability to affect those returns through its power over the investee. This is the IFRS 10 definition of “control”.
The Group comprises certain entities that are operated under the management of a Proxy Board. Details of the Proxy Board arrangements and the powers of the proxy holders and QinetiQ management are set out in the Corporate Governance section of this Annual Report. IFRS 10 is the accounting standard now applicable in respect of consolidation of entities. This does not specifically deal with proxy situations. However, having considered the terms of the Proxy agreement, the Directors consider that the Group meets the requirements of IFRS 10 in respect of control over such affected entities and, therefore, consolidates these entities in the consolidated accounts.
An associate is an undertaking over which the Group exercises significant influence, usually from 20%–50% of the equity voting rights, in respect of financial and operating policy. A joint venture is an undertaking over which the Group exercises joint control. Associates and joint ventures are accounted for using the equity method from the date of acquisition to the date of disposal. The Group’s investments in associates and joint ventures are held at cost including goodwill on acquisition and any post-acquisition changes in the Group’s share of the net assets of the associate less any impairment to the recoverable amount. Where an associate or joint venture has net liabilities, full provision is made for the Group’s share of liabilities where there is a constructive or legal obligation to provide additional funding to the associate or joint venture.
The financial statements of subsidiaries, joint ventures and associates are adjusted where necessary to ensure compliance with Group accounting policies.
On consolidation, all intra-Group income, expenses and balances are eliminated.
RevenueRevenue represents the value of work performed for customers, and is measured net of value added taxes and other sales taxes on the following bases:
Service contractsThe Group’s service contract arrangements are accounted for under IAS18 ‘Revenue’. When the outcome of a contract involving the rendering of services can be reliably estimated, revenue associated with the transaction is recognised by reference to the stage of completion of the contract activity at the end of the reporting period. This is normally measured by the proportion of contract costs incurred for work performed to date compared with the estimated total contract costs after making suitable allowances for technical and other risks related to performance milestones yet to be achieved. No profit is recognised on contracts until the outcome of the contract can be reliably estimated. When it is probable that total contract costs will exceed total contract revenue, the expected loss is recognised immediately as an expense. The Group generally does not undertake construction contracts.
Goods soldSales of goods are recognised in the income statement on delivery of the product or when the significant risks and rewards of ownership have been transferred to the customer and revenue and costs can be reliably measured.
Royalties and intellectual property Royalty revenue is recognised over the period to which the royalty relates. Intellectual property revenue can be attributed either to perpetual licences or to limited licences. Limited licences are granted for a specified period and revenue is recognised over the period of
Notes to the financial statements
QinetiQ Group plc Annual Report and Accounts 2016 107
Strategic report Governance Financial statements Additional information

1. Significant accounting policies continuedthe licence. Perpetual licences are granted for unlimited time frames and revenue is recognised when the risks and rewards of ownership are transferred to the customer.
Segmental informationSegmental information is presented according to the Group’s internal management reporting structure and the markets in which it operates. Segmental results represent the contribution of the different segments to the profit of the Group. Corporate expenses are allocated to the corresponding segments. Unallocated items mainly comprise specific adjusting items. Specific adjusting items are referred to in note 4. Eliminations represent inter-company trading between the different segments.
Segmental assets and liabilities information is not regularly provided to the chief operating decision maker.
Research and development expenditureR&D costs incurred in respect of specific contracts placed by customers are recognised within operating costs and revenue is recognised in respect of the R&D services performed. Internally funded development expenditure is capitalised in the balance sheet where there is a clearly defined project, the expenditures are separately identifiable, the project is technically and commercially feasible, all costs are recoverable by future revenue and the resources are committed to complete the project. Such capitalised costs are amortised over the forecast period of sales resulting from the development. All other R&D costs are expensed to the income statement in the period in which they are incurred. If the research phase cannot be clearly distinguished from the development phase, the respective project-related costs are treated as if they were incurred in the research phase only and expensed.
FinancingFinancing represents the financial expense on borrowings accounted for using the effective rate method and the financial income earned on funds invested. Exchange differences on financial assets and liabilities and the income or expense from interest hedging instruments that are recognised in the income statement are included within finance income and finance expense. Financing also includes the net finance expense in respect of defined benefit pension schemes.
TaxationThe taxation charge is based on the taxable profit for the year and takes into account taxation deferred because of temporary differences between the treatment of certain items for taxation and accounting purposes. Current tax and deferred tax are charged or credited to the income statement, except where they relate to items charged or credited to equity, in which case the relevant tax is charged or credited to equity. Deferred taxation is the tax attributable to the temporary differences that appear when taxation authorities recognise and measure assets and liabilities with rules that differ from those of the consolidated financial statements. The amount of deferred tax provided is based on the expected manner of realisation or settlement of the carrying amount of assets and liabilities, using rates enacted or substantively enacted at the balance sheet date.
Any changes in the tax rates are recognised in the income statement unless related to items directly recognised in equity. Deferred tax liabilities are recognised on all taxable temporary differences excluding non-deductible goodwill. Deferred tax assets are recognised on all deductible temporary differences provided that it is probable that future taxable income will be available against which the asset can be utilised. Deferred tax assets and liabilities are offset only where there is a legally enforceable right to offset and there is an intention to settle balances on a net basis.
Discontinued operationA discontinued operation is a component of the Group’s business, the operations and cash flows of which can be clearly distinguished from the rest of the Group and which:
• represents a separate major line of business or geographical area of operations;• is part of a single coordinated plan to dispose of a separate major line of business or geographical area of operations; or• is a subsidiary acquired exclusively with a view to re-sale.
Classification as a discontinued operation occurs at the earlier of disposal or when the operation meets the criteria to be classified as held for sale. When an operation is classified as a discontinued operation, the comparative statement of profit and loss and other comprehensive income is re-presented as if the operation had been discontinued from the start of the comparative year.
GoodwillGoodwill on acquisitions of subsidiaries is included in intangible assets. Goodwill on acquisitions of joint ventures and associates is included in the carrying value of equity accounted investments. Goodwill is tested annually for impairment and carried at cost less accumulated impairment losses. Gains and losses on the disposal of an entity include the carrying amount of goodwill related to the entity sold.
Intangible assetsIntangible assets arising from business combinations are recognised at fair value and are amortised over their expected useful lives, typically between one and nine years. Internally generated intangible assets are recorded at cost, including labour, directly attributable costs and any third-party expenses. Purchased intangible assets are recognised at cost less amortisation. Intangible assets are amortised over their respective useful lives on a straight-line basis as follows:
Intellectual property rights 2–8 yearsDevelopment costs 1–4 yearsOther 1–9 years
Notes to the financial statements continued
QinetiQ Group plc Annual Report and Accounts 2016108

Property, plant and equipmentProperty, plant and equipment are stated at cost less depreciation. Freehold land is not depreciated. Other tangible non-current assets are depreciated on a straight-line basis over their useful economic lives to their estimated residual value as follows:
Freehold buildings 20–25 yearsLeasehold land and buildings Shorter of useful economic life and the period of the leasePlant and machinery 3–10 yearsFixtures and fittings 5–10 yearsComputers 3–5 yearsMotor vehicles 3–5 years
Assets under construction are included in property, plant and equipment on the basis of expenditure incurred at the balance sheet date. In the case of assets constructed by the Group, the value includes the cost of own work completed, including directly attributable costs and interest.
The useful lives, depreciation methods and residual values applied to property, plant and equipment are reviewed annually and, if appropriate, adjusted accordingly.
Impairment of goodwill and tangible, intangible and held for sale assetsAt each reporting date the Group assesses whether there is an indication that an asset may be impaired. If the carrying amount of any asset exceeds its recoverable amount an impairment loss is recognised immediately in the income statement. In addition, goodwill is tested for impairment annually irrespective of any indication of impairment. If the carrying amount exceeds the recoverable amount, the respective asset or the assets in the cash-generating unit (CGU) are written down to their recoverable amounts. The recoverable amount of an asset or CGU is the higher of its fair value less costs to sell and its value in use. The value in use is the present value of the future cash flows expected to be derived from an asset or CGU calculated using an appropriate pre-tax discount rate. Impairment losses are expensed to the income statement.
Investments in debt and equity securitiesInvestments held by the Group are classified as either a current asset or as a non-current asset and those classified as available for sale are stated at fair value, with any resultant gain or loss, other than impairment losses, being recognised directly in equity. When these investments are derecognised, the cumulative gain or loss previously recognised directly in equity is recognised in the income statement.
The fair value of quoted financial instruments is their bid price at the balance sheet date. The fair value of unquoted equity investments is based on the price of the most recent investment by the Group or a third party, if available, or derived from the present value of forecast future cash flows.
InventoriesInventory and work-in-progress are stated at the lower of cost and net realisable value. Work-in-progress and manufactured finished goods are valued at production cost. Production cost includes direct production costs and an appropriate proportion of production overheads. A provision is established when the net realisable value of any inventory item is lower than its cost.
Bid costsCosts incurred in bidding for work are normally expensed as incurred. In the case of large multi-year government contracts the bidding process typically involves a competitive bid process to determine a preferred bidder and then a further period to reach financial close with the customer. In these cases, the costs incurred after announcement of the Group achieving preferred bidder status are deferred to the balance sheet within work-in-progress. From the point financial close is reached, the costs are amortised over the life of the contract. If an opportunity for which the Group was awarded preferred bidder status fails to reach financial close, the costs deferred to that point are expensed in the income statement immediately, when it becomes likely that financial close will not be achieved.
Trade and other receivablesTrade and other receivables are stated net of provisions for doubtful debts. Amounts recoverable on contracts are included in trade and other receivables and represent revenue recognised in excess of amounts invoiced. Payments received on account are included in trade and other payables and represent amounts invoiced in excess of revenue recognised. Other receivables will also include insurance recoveries where we are virtually certain of recovery.
Cash and cash equivalentsCash and cash equivalents comprise cash at bank and short-term deposits that are readily convertible into cash. In the cash flow statement overdraft balances are included in cash and cash equivalents.
Current and non-current liabilitiesCurrent liabilities include amounts due within the normal operating cycle of the Group. Interest-bearing current and non-current liabilities are initially recognised at fair value and then stated at amortised cost with any difference between the cost and redemption value being recognised in the income statement over the period of the borrowings on an effective interest rate basis. Costs associated with the arrangement of bank facilities or the issue of loans are held net of the associated liability presented in the balance sheet. Capitalised issue costs are released over the estimated life of the facility or instrument to which they relate using the effective interest rate method. If it becomes clear that the facility or instrument will be redeemed early, the amortisation of the issue costs will be accelerated.
QinetiQ Group plc Annual Report and Accounts 2016 109
Strategic report Governance Financial statements Additional information

1. Significant accounting policies continued ProvisionsA provision is recognised in the balance sheet when the Group has a present legal or constructive obligation as a result of a past event which can be reliably estimated, and it is probable that an outflow of economic benefits will be required to settle the obligation. Where appropriate, provisions are determined by discounting the expected cash flows at an appropriate discount rate reflecting the level of risk and the time value of money.
Financial instrumentsFinancial assets and financial liabilities are recognised on the Group’s balance sheet when the Group becomes a party to the contractual provisions of the instrument. The de-recognition of a financial instrument takes place when the Group no longer controls the contractual rights that comprise the financial instrument, when the instrument expires, or when the instrument is sold, terminated or exercised.
Derivative financial instrumentsDerivative financial instruments are initially recognised and thereafter held at fair value, being the market value for quoted instruments or valuation based on models and discounted cash flow calculations for unlisted instruments.
Fair value hedgingChanges in the fair value of derivatives designated as fair value hedges of currency risk or interest rate risk are recognised in the income statement. The hedged item is held at fair value with respect to the hedged risk with any gain or loss recognised in the income statement.
Cash flow hedgingChanges in the fair value of derivatives designated as a cash flow hedge that are regarded as highly effective are recognised in equity. The ineffective portion is recognised immediately in the income statement. Where a hedged item results in an asset or a liability, gains and losses previously recognised in equity are included in the cost of the asset or liability. Gains and losses previously recognised in equity are removed and recognised in the income statement at the same time as the hedged transaction.
Leased assetsLeases are classified as finance leases when substantially all the risks and rewards of ownership are held by the lessee. Assets held under finance leases are capitalised and included in property, plant and equipment at the lower of the present value of minimum lease payments and fair value at the inception of the lease. Assets are then depreciated over the shorter of their useful economic lives or the lease term. Obligations relating to finance leases, net of finance charges arising in future periods, are included under financial liabilities.
Rentals payable under operating leases are charged to the income statement on a straight-line basis over the term of the lease.
Foreign currenciesTransactions in foreign currencies are recorded using the rate of exchange ruling at the date of the transaction. Monetary assets and liabilities in foreign currencies are translated at period-end rates. Any resulting exchange differences are taken to the income statement. Gains and losses on designated forward foreign exchange hedging contracts are matched against the foreign exchange movements on the underlying transaction.
The individual financial statements of each Group company are presented in its functional currency. On consolidation, assets and liabilities of overseas subsidiaries, associated undertakings and joint ventures, including any related goodwill, are translated to sterling at the rate of exchange at the balance sheet date. The results and cash flows of overseas subsidiaries, associated undertakings and joint ventures are translated to sterling using the average rates of exchange during the period. Exchange adjustments arising from the re-translation of the opening net investment and the results for the period to the period-end rate are taken directly to equity and reported in the statement of comprehensive income.
Post-retirement benefitsThe Group provides both defined contribution and defined benefit pension arrangements. The liabilities of the Group arising from defined benefit obligations, and the related current service cost, are determined using the projected unit credit method. Valuations for accounting purposes are carried out bi-annually. Actuarial advice is provided by external consultants. For the funded defined benefit plans, the excess or deficit of the fair value of plan assets less the present value of the defined benefit obligation are recognised as an asset or a liability respectively.
For defined benefit plans, the cost charged to the income statement consists of administrative expenses and the net interest cost. There is no service cost due to the fact the plans are closed to future accrual. The finance element of the pension charge is shown in finance expense and the administration cost element is charged as a component of operating costs in the income statement. Actuarial gains and losses and re-measurement gains and losses are recognised immediately in full through the statement of comprehensive income. Contributions to defined contribution plans are charged to the income statement as incurred.
Share-based paymentsThe Group operates share-based payment arrangements with employees. The fair value of equity-settled awards for share-based payments is determined on grant and expensed straight line over the period from grant to the date of earliest unconditional exercise. The fair value of cash-settled awards for share-based payments is determined each period end until they are exercised or lapse. The value is expensed straight line over the period from grant to the date of earliest unconditional exercise. The charges for both equity and cash-settled share-based payments are updated annually for non-market-based vesting conditions.
Notes to the financial statements continued
QinetiQ Group plc Annual Report and Accounts 2016110

Share capitalOrdinary share capital of the company is recorded as the proceeds received, less issue costs. Company shares held by the employee benefit trusts are held at the consideration paid. They are classified as own shares within equity. Any gain or loss on the purchase, sale or issue of company shares is recorded in equity.
Recent accounting developmentsDevelopments adopted by the Group in 2016 with no material impact on the financial statementsThe following UK GAAP and EU-endorsed Standards and amendments, improvements and interpretations of published Standards are effective for accounting periods beginning on or after 1 January 2015 and have been adopted with no material impact on the Group’s financial statements:
FRS 100, 101 and 102 FRS 100, 101 and 102 all fall under the new UK GAAP regime. FRS 100 sets out the application of financial reporting requirements in the UK and Republic of Ireland and FRS 101, known as ‘IFRS with reduced disclosures’ outlines the reduced disclosure framework available for use by qualifying entities choosing to follow the principles of IFRS but under the umbrella of UK GAAP. FRS 102 is applicable in the UK and Republic of Ireland and is known as the ‘new UK GAAP’. FRS 102 follows more closely the principles of existing UK GAAP with some exceptions. The mandatory effective date for the new framework of reporting is for accounting periods beginning on or after 1 January 2015. QinetiQ had the choice between applying either full IFRS, or a choice of either FRS 101, or FRS 102 to its subsidiary entities. The two latter options both fall under UK GAAP and either may therefore be applied to subsidiary entities on an entity by entity basis. The Group has adopted the UK GAAP option as of 1 April 2015.
IAS19 Employee Benefits – amendment to clarify requirement that relates to how contributions from employees or third parties that are linked to service should be attributed to periods of service.
Annual improvement 2010-2012 cycle:
• IFRS 2 Share-based Payment – amends definitions of ‘vesting condition’ and ‘market condition’ and adds definitions for ‘performance condition’ and ‘service condition’.
• IFRS 3 Business Combinations – amendment to clarify that contingent consideration that is classified as an asset or liability shall be measured at fair value at each reporting date.
• IFRS 8 Operating Segments – two amendments relating to disclosure requirements on application of aggregation criteria and reconciliation of assets.
• IFRS 13 Fair Value Measurement – amendment relating to short-term receivables and payables with no stated interest rate.• IAS16 Property, Plant and Equipment and IAS38 Intangible Assets – amendment clarifying that under the revaluation method, accumulated
depreciation should be restated on a proportionate basis.• IFRS 24 Related Party Disclosures – clarification that an entity providing key management personnel services to the reporting entity
or to the parent of the reporting entity is a related party of the reporting entity.
Annual improvement 2011-2013 cycle:
• IFRS 1 First-time Adoption of IFRS – amendment relating to first-time application of IFRS.• IFRS 3 Business Combinations – amendment clarifying that IFRS 3 excludes from its scope the accounting for the formation of a joint
arrangement in the financial statements of the joint arrangement itself.• IAS40 Investment Property – amendment clarifying the interrelationship of IFRS 3 and IAS40 when classifying property as investment
property or owner-occupied property.
Developments expected in future periods of which the impact is being assessedIFRS 15 Revenue from Contracts with Customers: the final Standard was published in May 2014 and the IASB has taken the decision to defer the effective date of IFRS 15 to 1 January 2018 ie FY19 for QinetiQ. The new Standard introduces a five-step model to the principle of revenue recognition. Briefly, the framework includes identifying the contract with the customer, identifying the performance obligations in the contract, determining the transaction price, allocating the transaction price to the performance obligations in the contract and recognising revenue when (or as) the entity satisfies the performance obligations. QinetiQ is currently undertaking an assessment of the impact of the new Standard. Typical issues to be analysed on a contract-by-contract basis include whether the current methodology for recognising revenue over time remains appropriate, the treatment of contract modifications, variable consideration, determination and distinction of performance obligations, collectability and licences (list not exhaustive). QinetiQ is also undertaking an analysis of the transitional guidance which allows for two different approaches: the retrospective method (with optional practical expedients) or the cumulative effect method. Under the retrospective method, QinetiQ would need to restate prior year comparatives and recognise the cumulative effect of applying the new Standard in equity at the start of the earliest presented comparative period. Under the cumulative effect method, QinetiQ would apply the new Standard as of the date of initial application, with no restatement of comparative period amounts. It would record the cumulative effect of initially applying the new Standard – which would affect revenue and costs – as an adjustment to the opening balance of equity at the date of initial application. Under the cumulative effect method, the provisions of the new Standard apply only to contracts that are open (ie not complete) under previous GAAP at the date of initial application.
QinetiQ Group plc Annual Report and Accounts 2016 111
Strategic report Governance Financial statements Additional information
1. Significant accounting policies continued Leases: The final Standard IFRS 16 ‘Leases’ was published in January 2016. Under the new Standard, companies will recognise new assets and liabilities, bringing added transparency to the balance sheet. IFRS 16 eliminates the current dual accounting model for lessees, which distinguishes between on-balance sheet finance leases and off-balance sheet operating leases. Instead, there is a single, on-balance sheet accounting model that is similar to current finance lease accounting. Lessor accounting remains similar to current practice – ie lessors continue to classify leases as finance and operating leases. The Standard will be effective from 1 January 2019 ie FY20 for QinetiQ subject to EU endorsement.
IFRS 9 Financial Instruments – This new Standard on accounting for financial instruments will replace IAS39 Financial Instruments: Recognition and Measurement. This Standard has not yet been endorsed by the EU. It is expected to come into effect for accounting periods beginning on or after 1 January 2018.
Developments expected in future periods with no material impact on the Group’s financial statementsThe Directors anticipate that the adoption of the following new, revised, amended and improved published standards and interpretations, which were in issue at the date of authorisation of these financial statements, will have no material impact on the financial statements of the Group when they become applicable in future periods:
• IFRS 14 ‘Regulatory Deferral Accounts’;• Amendments to IFRS 9, 10 and 11; and• Amendments to IAS1, 7, 9, 12, 15, 27, 36 and 38.
Critical accounting estimates and judgements in applying accounting policiesThe following commentary is intended to highlight those policies that are critical to the business based on the level of management judgement required in their application, their complexity and their potential impact on the results and financial position reported for the Group. The level of management judgement required includes assumptions and estimates about future events that are uncertain and the actual outcome of which may result in a materially different outcome from that anticipated.
Revenue and profit recognitionThe estimation process required to evaluate the potential outcome of contracts and projects requires skill, knowledge and experience from a variety of sources within the business to assess the status of the contract, costs to complete, internal and external labour resources required and other factors. This process is carried out continuously throughout the business to ensure that project and contract assessments reflect the latest status of such work. No profit is recognised on a contract until the outcome can be reliably estimated.
Business combinations and related goodwillIntangible assets recognised on business combinations have been valued using established methods and models to determine estimated value and useful economic life, with input, where appropriate, from external valuation consultants. Such methods require the use of estimates which may produce results that are different from actual future outcomes.
The Group tests annually whether goodwill has suffered any impairment. This process relies on the use of estimates of the future profitability and cash flows of its CGUs which may differ from the actual results delivered. In addition, the Group reviews whether identified intangible assets have suffered any impairment. Further details on the sensitivity of the carrying value of goodwill to changes in the key assumptions are set out in note 14.
TaxIn determining the Group’s provisions for income tax and deferred tax, it is necessary to assess the likelihood and timing of recovery of tax losses created, and to consider transactions in a small number of key tax jurisdictions for which the ultimate tax determination is uncertain. To the extent that the final outcome differs from the tax that has been provided, adjustments will be made to income tax and deferred tax provisions held in the period the determination is made.
Other payables, provisions and contingent liabilitiesThe Group holds liabilities in respect of environmental and regulatory issues. The Group operates in regulated environments and a failure to comply with particular regulations could result in fines and/or penalties. There is judgement required in determining the significance of any instances of potential non-compliance and potential liability based on management’s assessment of the most likely outcome. The financial statements also disclose contingent liabilities in respect of legal claims and regulatory issues which have not been provided for on the basis that they are not considered to qualify for recognition as provisions. Judgement is required in these assessments.
Post-retirement benefitsThe Group’s defined benefit pension obligations and net income statement costs are based on key assumptions, including discount rates, mortality and inflation. Management exercises its best judgement, in consultation with actuarial advisors, in selecting the values for these assumptions that are the most appropriate to the Group. Small changes in these assumptions at the balance sheet date, individually or collectively, may result in significant changes in the size of the deficit or the net income statement costs. Any change in these assumptions would have an impact on the retirement benefit obligation recognised. Further details of these assumptions are set out in note 31.
Notes to the financial statements continued
QinetiQ Group plc Annual Report and Accounts 2016112

2. Revenue and other incomeRevenue and other income is analysed as follows:
Revenue by category – continuing operationsFor the year ended 31 March all figures in £ million 2016 2015
Sales of goods 66.0 76.9
Services 679.0 688.9
Royalties and licences 10.7 8.0
Revenue 755.7 763.8
Share of associates’ profit/(loss) after tax 0.5 (0.1)
Other income 9.0 7.7
Total other income 9.5 7.6
Revenue and profit after tax of associates was £7.3m and £1.0m respectively (2015: revenue of £7.7m and loss before tax of £0.1m). The figures in the table above represent the Group share of this profit/loss after tax.
Other income is in respect of property rentals and the recovery of other related property costs.
Revenue by customer geographic location – continuing operationsFor the year ended 31 Marchall figures in £ million 2016 2015
United Kingdom 597.8 610.7
US 69.4 69.4
Other 88.5 83.7
Total 755.7 763.8
Revenue by major customer type – continuing operationsFor the year ended 31 Marchall figures in £ million 2016 2015
UK Government 531.0 537.6
US Government 53.0 51.2
Other 171.7 175.0
Total 755.7 763.8
Revenue from the UK Government was generated by the EMEA Services and Global Products operating segments. Revenue from the US Government was generated by the Global Products operating segment.
QinetiQ Group plc Annual Report and Accounts 2016 113
Strategic report Governance Financial statements Additional information

3. Segmental analysisOperating segmentsFor the year ended 31 March all figures in £ million Note 2016 2015
RevenueOperating
profit RevenueOperating
profit
EMEA Services 616.4 93.8 625.6 93.0
Global Products 139.3 15.1 138.2 18.3
Total operating segments 755.7 108.9 763.8 111.3
Reconciliation of operating segment profit to total profit:
Operating profit before specific adjusting items1 – underlying operating profit 108.9 111.3Specific adjusting items:
Restructuring – 1.0
Profit on disposal of property 0.3 –
Impairment of goodwill (31.9) –
Amortisation of intangible assets arising from acquisitions (2.0) (2.8)
Operating profit 75.3 109.5 Gain on business divestments 7 16.2 –
Net finance expense 8 (1.3) (4.1)
Profit before tax 90.2 105.4 Taxation income 9 8.4 12.0
Profit for the year from continuing operations 98.6 117.4
Discontinued operationsProfit/(loss) from discontinued operations, net of tax 5 7.5 (12.7)
Profit for the period attributable to equity shareholders 106.1 104.7
1 The measure of profit presented to the chief operating decision maker is underlying operating profit (as defined in the glossary on page 149). No measure of segmental assets and liabilities has been disclosed as this information is not regularly provided to the chief operating decision maker.
Depreciation and amortisation by business segment – excluding specific adjusting items (note 4)For the year ended 31 March 2016
all figures in £ millionEMEA
ServicesGlobal
Products
Total continuing operations
Depreciation and impairment of property, plant and equipment 21.1 1.9 23.0Amortisation of purchased or internally developed intangible assets 1.3 1.5 2.8
22.4 3.4 25.8
For the year ended 31 March 2015
all figures in £ millionEMEA
ServicesGlobal
Products
Total continuing operations
Depreciation and impairment of property, plant and equipment 19.7 2.0 21.7Amortisation of purchased or internally developed intangible assets 0.8 0.7 1.5
20.5 2.7 23.2
Excludes specific adjusting items not included within the measure of operating profit reported to the chief operating decision maker.
Non-current assets* by geographic locationall figures in £ million UK Rest of World Total
Year ended 31 March 2016 264.3 50.5 314.8
UK Rest of World Total
Year ended 31 March 2015 262.0 91.4 353.4
* excluding deferred tax and financial instruments.
Notes to the financial statements continued
QinetiQ Group plc Annual Report and Accounts 2016114

4. Profit before taxThe following auditor’s remuneration has been charged in arriving at profit before tax:
all figures in £ million 2016 2015
Fees payable to the auditor and its associates:Audit of the Group’s annual accounts 0.4 0.4
Audit of the accounts of subsidiaries of the company and its associated pension scheme 0.1 0.2
Audit-related assurance services 0.1 0.1
Total audit fees 0.6 0.7Other assurance services – –
Corporate finance services – due diligence support – –
All other non-audit services 0.2 0.1
Total non-audit fees 0.2 0.1Total auditor’s remuneration 0.8 0.8
The following items have also been charged in arriving at profit before tax for continuing operations:
all figures in £ million 2016 2015
Depreciation and impairment of property, plant and equipment:Owned assets: depreciation (23.4) (20.7)
Owned assets: impairment reversal/(charge) 0.4 (1.0)
Foreign exchange gain/(loss) 0.2 (0.3)Research and development expenditure – customer funded contracts (277.6) (285.8)Research and development expenditure – Group funded (23.2) (20.8)
‘Specific adjusting items’ In the income statement, the Group presents specific adjusting items separately. In the judgement of the Directors, for the reader to obtain a proper understanding of the financial information, specific adjusting items need to be disclosed separately because of their size and nature. Underlying measures of performance exclude specific adjusting items. The following specific adjusting items have been (charged)/credited in arriving at profit before tax:
all figures in £ million Note 2016 2015
Profit on disposal of property 0.3 –
Reversal of unutilised restructuring provisions – 1.0
Specific adjusting items before amortisation, depreciation and impairment 0.3 1.0 Impairment of goodwill 14 (31.9) –
Amortisation of intangible assets arising from acquisitions (2.0) (2.8)
Specific adjusting items operating loss (33.6) (1.8)
Gain on business divestments 7 16.2 –
Defined benefit pension scheme net finance expense (1.1) (0.6)
Specific adjusting items loss before tax – continuing operations (18.5) (2.4)
Profit on disposal of subsidiary – before accelerated interest expense 5 7.5 15.9
Loss on disposal of subsidiary – accelerated interest expense 5 – (28.8)
Profit/(loss) on disposal of subsidiary 5 7.5 (12.9)
Amortisation of intangible assets arising from acquisition – (0.8)
Specific adjusting items loss before tax – discontinued operations 7.5 (13.7)
Total specific adjusting items loss before tax (11.0) (16.1)
Specific adjusting items – tax (continuing operations) 21.2 23.8
Specific adjusting items – tax (discontinued operations) – 0.3
Total specific adjusting items profit after tax 10.2 8.0
Reconciliation of underlying profit for the year to total profit for the year2016 2015
Underlying profit after tax – total Group 95.9 96.7 Total specific adjusting items profit after tax 10.2 8.0
Total profit for the year attributable to equity shareholders 106.1 104.7
QinetiQ Group plc Annual Report and Accounts 2016 115
Strategic report Governance Financial statements Additional information

5. Discontinued operationsIn the prior year, on 23 May 2014, the Group completed its sale of the US Services division, comprising QinetiQ North America Inc. and its subsidiaries. The Circular seeking shareholder approval for the sale of the US Services division specified that the proceeds would be applied in settling the remaining private placement (‘PP’) debt of $248m which was put in place to finance the acquisitions of the US Services business. Accordingly, the penalty of £28.8m incurred on the early redemption of the PP debt was considered to be inextricably linked to the sale of that business and was, therefore, disclosed as an adjustment to the loss on its sale rather than as a finance expense.
Net cash inflow in respect of this transaction was £78.6m in the year to 31 March 2015, with a further £28.8m outflow in respect of the associated PP early redemption expense. Additional deferred consideration, the earn-out, was payable on a sliding scale between zero and $50m based on gross profit generated by the disposed business in the financial year to 31 March 2015. Actual gross profit delivered by the disposed business resulted in deferred consideration of £6.2m (in line with expectations and matching the prior year book value of deferred consideration receivable) becoming due, which was paid in full in the year to 31 March 2016.
In the current year, an income statement impact of this transaction occurred from the release of opening warranty and indemnity liabilities following expiry of the contractual warranty clauses and an assessed remote possibility of claims under the extant indemnity clauses of the sale agreement.
The full impact of the disposal is given below:
a) Results of discontinued operationsall figures in £ million 2016 2015
Revenue – 55.7
Operating costs excluding depreciation, amortisation and impairment – (54.2)
EBITDA (earnings before interest, tax, depreciation and amortisation) – 1.5Depreciation, amortisation and impairment of assets – (0.3)
Underlying operating profit – 1.2Amortisation of intangible assets arising from acquisitions – (0.8)
Operating profit – 0.4 Finance expense – –
Profit before tax – 0.4 Taxation expense – (0.2)
Results from operating activities, net of tax – 0.2 Profit on sale of discontinued operations – before accelerated interest costs 7.5 15.9
Loss on sale of discontinued operations – accelerated interest costs – (28.8)
Gain/(loss) for the period 7.5 (12.7)Basic gain/(loss) per share 1.3p (2.0)p
Diluted gain/(loss) per share 1.3p (2.0)p
b) Cash flows from discontinued operationsall figures in £ million 2016 2015
Net cash from operating activities – 1.8
Net cash inflow for the year from the disposed entity – 1.8Cash outflow in respect of accelerated interest expense – included within ‘Interest paid’ – (28.8)
Net cash outflow related to discontinued operations – (27.0)
c) Effect of disposal on the financial position of the Groupall figures in £ million 2016 2015
Consideration received (net of transaction costs), satisfied in cash 6.2 79.6
Cash and cash equivalents disposed – (1.0)
Net cash inflow in the year 6.2 78.6
Notes to the financial statements continued
QinetiQ Group plc Annual Report and Accounts 2016116

6. Business combinationsThe Group made two acquisitions in the prior year to 31 March 2015: SR2020 and Redfern Integrated Optics Inc. Consideration (of £0.4m) for the acquisition of SR2020 was paid in full in the prior year and no further payments, or adjustments to the assets acquired, were made in the year to 31 March 2016. The total consideration for the acquisition of Redfern Integrated Optics Inc. was £3.9m, of which £3.3m was paid in the prior year. The remaining consideration of £0.6m was paid in the current year.
7. Gain on business divestments – continuing operationsFor the year ended 31 Marchall figures in £ million 2016 2015
Gain on business divestments 16.2 –
The gain on business divestments relates to the sale of the Cyveillance business on 11 December 2015 for consideration before costs of $34.1m and a gain on disposal of £16.2m. There is no deferred consideration receivable.
8. Finance income and expense – continuing operationsFor the year ended 31 Marchall figures in £ million 2016 2015
Receivable on bank deposits 1.0 1.1
Finance lease income – 0.2
Finance income 1.0 1.3
Amortisation of recapitalisation fee (0.3) (0.7)
Payable on bank loans and overdrafts (0.6) (0.9)
Payable on US dollar private placement debt – (2.6)
Finance lease expense – (0.2)
Unwinding of discount on financial liabilities (0.3) (0.4)
Finance expense before specific adjusting items (1.2) (4.8)
Specific adjusting items:
Defined benefit pension scheme net finance expense (1.1) (0.6)
Total finance expense (2.3) (5.4)
Net finance expense (1.3) (4.1)
QinetiQ Group plc Annual Report and Accounts 2016 117
Strategic report Governance Financial statements Additional information

9. Taxation – continuing operationsall figures in £ million 2016 2015
Before specific
adjusting items*
Specific adjusting
items* Total
Before specific
adjusting items*
Specific adjusting
items* Total
Analysis of chargeCurrent UK tax expense/(income) 2.2 (35.6) (33.4) 0.5 – 0.5
Overseas corporation tax
Current year 2.4 – 2.4 1.4 (0.5) 0.9
Adjustment for prior year – – – (1.0) 0.6 (0.4)
Current tax expense/(income) 4.6 (35.6) (31.0) 0.9 0.1 1.0Deferred tax expense/(income) 7.7 20.0 27.7 11.3 (22.9) (11.6)
Deferred tax impact of change in rates (0.2) – (0.2) (0.4) – (0.4)
Deferred tax in respect of prior years 0.7 (5.6) (4.9) – (1.0) (1.0)
Deferred tax expense/(income) 8.2 14.4 22.6 10.9 (23.9) (13.0)Taxation expense/(income) – continuing operations 12.8 (21.2) (8.4) 11.8 (23.8) (12.0)
Factors affecting tax charge/(credit) in yearPrincipal factors reducing the Group’s current year tax charge below the UK statutory rate are explained below:
Profit/(loss) before tax 108.7 (18.5) 90.2 107.8 (2.4) 105.4
Tax on profit/(loss) before tax at 20% (2015: 21%) 21.7 (3.7) 18.0 22.6 (0.5) 22.1Effect of:
Expenses not deductible for tax purposes and non-taxable items 3.7 4.5 8.2 (7.9) 1.7 (6.2)
Research and development credits/reliefs (13.7) (36.8) (50.5) (10.7) – (10.7)
Tax in respect of an FY09 US acquisition – payable to the tax authorities 16.2 – 16.2 – – –
Tax in respect of an FY09 US acquisition – recoverable from insurers (16.2) – (16.2) – – –
Utilisation/(recognition) of deferred tax asset in respect of UK trading losses – 25.2 25.2 – (25.2) (25.2)
Current tax losses for which no deferred tax asset was recognised – – – 6.9 – 6.9
Deferred tax impact of change in rates (0.2) – (0.2) (0.4) – (0.4)
Deferred tax in respect of prior years 0.7 (5.6) (4.9) 0.9 – 0.9
Other deferred tax movements – (4.8) (4.8) – – –
Effect of different rates in overseas jurisdictions 0.6 – 0.6 0.4 0.2 0.6
Taxation expense/(income) – continuing operations 12.8 (21.2) (8.4) 11.8 (23.8) (12.0)Effective tax rate 11.8% (9.3%) 10.9% (11.4%)
* Details of specific adjusting items can be found in note 4.
UK Group companies have now elected to obtain tax benefits in respect of allowable R&D expenditure through the R&D Expenditure Credit (‘RDEC’) process rather than through the previous treatment as a super-deduction in the tax computations. This election was made retrospectively back to 1 April 2013 and the incremental impact on the tax expense for the years ending 31 March 2014 and 31 March 2015 has been reported in the current year as a specific adjusting item. The change of regime results in the utilisation of previously capitalised UK trading losses and the associated deferred tax asset has been written off in the current year, also reported as a specific adjusting item. Other deferred tax movements includes the effect of changes in estimates in respect of the apportionment of book values between qualifying and non-qualifying property, plant and equipment.
Deferred tax has been calculated using the enacted future statutory tax rates.
At 31 March 2016 the Group had unused tax losses of £154.8m (2015: £291.6m) which are available for offset against future profits. £26.1m of these losses are time limited of which £6.3m will expire in 2034 and £19.8m will expire in 2035. Certain UK tax losses had been recognised on the balance sheet as at 31 March 2015 as a deferred tax asset of £25.2m. As noted above those tax losses have now been utilised following the election into the RDEC regime. No deferred tax asset is recognised in respect of the remaining tax losses due to uncertainty over the timing and extent of their utilisation.
Notes to the financial statements continued
QinetiQ Group plc Annual Report and Accounts 2016118
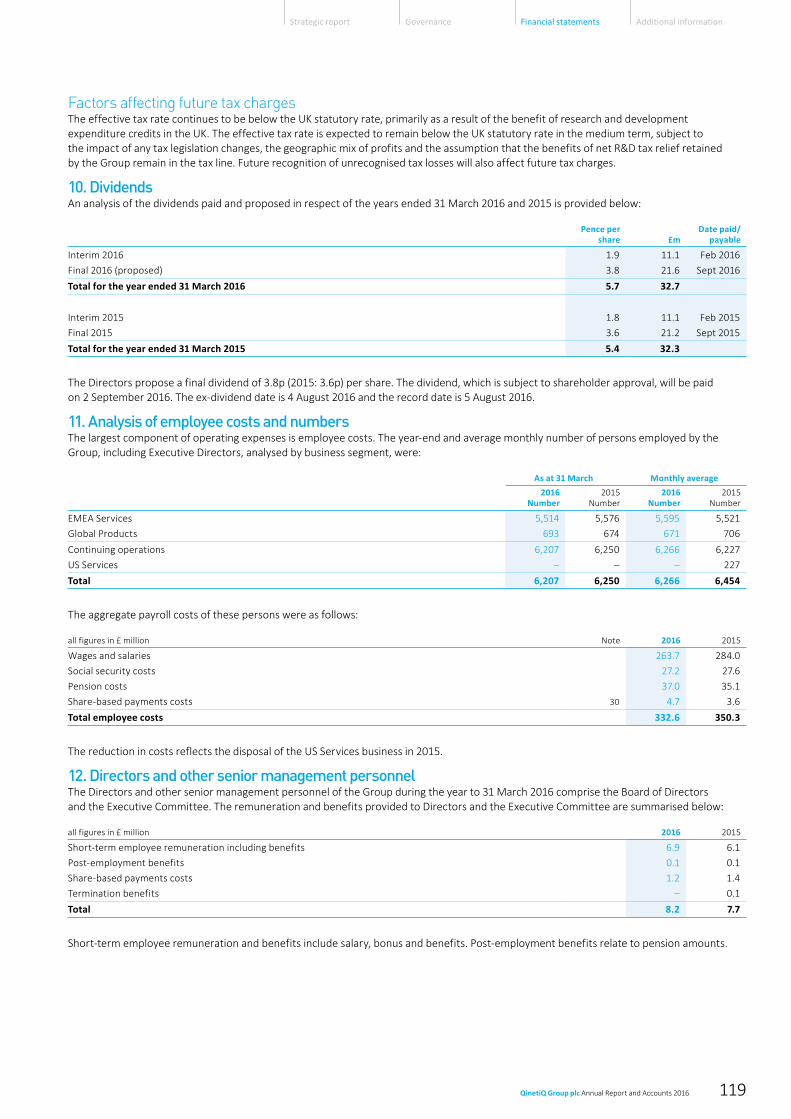
Factors affecting future tax chargesThe effective tax rate continues to be below the UK statutory rate, primarily as a result of the benefit of research and development expenditure credits in the UK. The effective tax rate is expected to remain below the UK statutory rate in the medium term, subject to the impact of any tax legislation changes, the geographic mix of profits and the assumption that the benefits of net R&D tax relief retained by the Group remain in the tax line. Future recognition of unrecognised tax losses will also affect future tax charges.
10. DividendsAn analysis of the dividends paid and proposed in respect of the years ended 31 March 2016 and 2015 is provided below:
Pence per share £m
Date paid/payable
Interim 2016 1.9 11.1 Feb 2016
Final 2016 (proposed) 3.8 21.6 Sept 2016
Total for the year ended 31 March 2016 5.7 32.7
Interim 2015 1.8 11.1 Feb 2015
Final 2015 3.6 21.2 Sept 2015
Total for the year ended 31 March 2015 5.4 32.3
The Directors propose a final dividend of 3.8p (2015: 3.6p) per share. The dividend, which is subject to shareholder approval, will be paid on 2 September 2016. The ex-dividend date is 4 August 2016 and the record date is 5 August 2016.
11. Analysis of employee costs and numbersThe largest component of operating expenses is employee costs. The year-end and average monthly number of persons employed by the Group, including Executive Directors, analysed by business segment, were:
As at 31 March Monthly average2016
Number2015
Number2016
Number2015
Number
EMEA Services 5,514 5,576 5,595 5,521
Global Products 693 674 671 706
Continuing operations 6,207 6,250 6,266 6,227
US Services – – – 227
Total 6,207 6,250 6,266 6,454
The aggregate payroll costs of these persons were as follows:
all figures in £ million Note 2016 2015
Wages and salaries 263.7 284.0
Social security costs 27.2 27.6
Pension costs 37.0 35.1
Share-based payments costs 30 4.7 3.6
Total employee costs 332.6 350.3
The reduction in costs reflects the disposal of the US Services business in 2015.
12. Directors and other senior management personnelThe Directors and other senior management personnel of the Group during the year to 31 March 2016 comprise the Board of Directors and the Executive Committee. The remuneration and benefits provided to Directors and the Executive Committee are summarised below:
all figures in £ million 2016 2015
Short-term employee remuneration including benefits 6.9 6.1
Post-employment benefits 0.1 0.1
Share-based payments costs 1.2 1.4
Termination benefits – 0.1
Total 8.2 7.7
Short-term employee remuneration and benefits include salary, bonus and benefits. Post-employment benefits relate to pension amounts.
QinetiQ Group plc Annual Report and Accounts 2016 119
Strategic report Governance Financial statements Additional information

13. Earnings per shareBasic earnings per share is calculated by dividing the profit attributable to equity shareholders by the weighted average number of ordinary shares in issue during the year. The weighted average number of shares used excludes those shares bought by the Group and held as own shares (see note 29). For diluted earnings per share the weighted average number of shares in issue is adjusted to assume conversion of all potentially dilutive ordinary shares arising from unvested share-based awards including share options.
For the year ended 31 March 2016 2015
Weighted average number of shares Million 587.0 630.9
Effect of dilutive securities Million 3.7 3.7
Diluted number of shares Million 590.7 634.6
Underlying basic earnings per share figures are presented below, in addition to the basic and diluted earnings per share, because the Directors consider this gives a more relevant indication of underlying business performance and reflects the adjustments to basic earnings per share for the impact of specific adjusting items (see note 4) and tax thereon.
Underlying EPS – continuing operationsFor the year ended 31 March 2016 2015
Profit attributable to equity shareholders £ million 98.6 117.4
Remove loss after tax in respect of specific adjusting items £ million (2.7) (21.4)
Underlying profit after taxation £ million 95.9 96.0Weighted average number of shares Million 587.0 630.9
Underlying basic EPS – continuing operations Pence 16.3 15.2Diluted number of shares Million 590.7 634.6
Underlying diluted EPS – continuing operations Pence 16.2 15.1
Underlying EPS – total GroupFor the year ended 31 March 2016 2015
Profit attributable to equity shareholders £ million 106.1 104.7
Remove loss after tax in respect of specific adjusting items £ million (10.2) (8.0)
Underlying profit after taxation £ million 95.9 96.7Weighted average number of shares Million 587.0 630.9
Underlying basic EPS – total Group Pence 16.3 15.3Diluted number of shares Million 590.7 634.6
Underlying diluted EPS – total Group Pence 16.2 15.2
Basic and diluted EPS – continuing operationsFor the year ended 31 March 2016 2015
Profit attributable to equity shareholders £ million 98.6 117.4
Weighted average number of shares Million 587.0 630.9
Basic EPS – continuing operations Pence 16.8 18.6Diluted number of shares Million 590.7 634.6
Diluted EPS – continuing operations Pence 16.7 18.5
Basic and diluted EPS – total GroupFor the year ended 31 March 2016 2015
Profit attributable to equity shareholders £ million 106.1 104.7
Weighted average number of shares Million 587.0 630.9
Basic EPS – total Group Pence 18.1 16.6Diluted number of shares Million 590.7 634.6
Diluted EPS – total Group Pence 18.0 16.5
Notes to the financial statements continued
QinetiQ Group plc Annual Report and Accounts 2016120
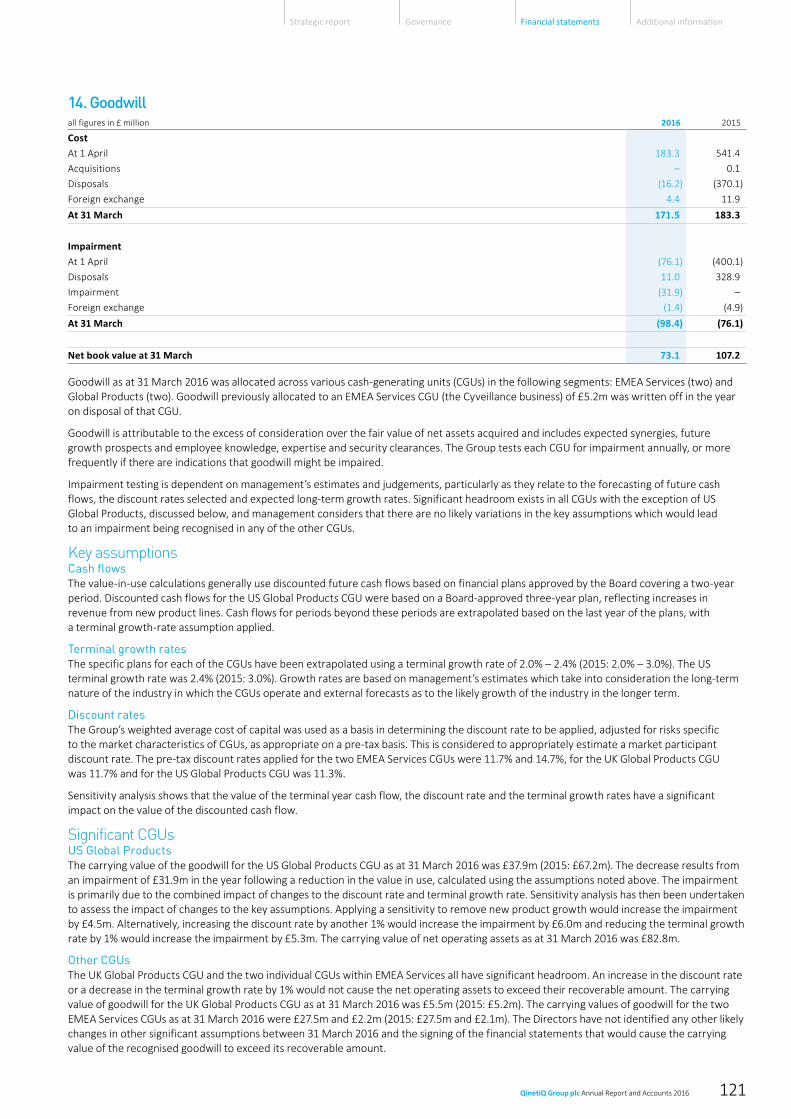
14. Goodwillall figures in £ million 2016 2015
CostAt 1 April 183.3 541.4
Acquisitions – 0.1
Disposals (16.2) (370.1)
Foreign exchange 4.4 11.9
At 31 March 171.5 183.3
ImpairmentAt 1 April (76.1) (400.1)
Disposals 11.0 328.9
Impairment (31.9) –
Foreign exchange (1.4) (4.9)
At 31 March (98.4) (76.1)
Net book value at 31 March 73.1 107.2
Goodwill as at 31 March 2016 was allocated across various cash-generating units (CGUs) in the following segments: EMEA Services (two) and Global Products (two). Goodwill previously allocated to an EMEA Services CGU (the Cyveillance business) of £5.2m was written off in the year on disposal of that CGU.
Goodwill is attributable to the excess of consideration over the fair value of net assets acquired and includes expected synergies, future growth prospects and employee knowledge, expertise and security clearances. The Group tests each CGU for impairment annually, or more frequently if there are indications that goodwill might be impaired.
Impairment testing is dependent on management’s estimates and judgements, particularly as they relate to the forecasting of future cash flows, the discount rates selected and expected long-term growth rates. Significant headroom exists in all CGUs with the exception of US Global Products, discussed below, and management considers that there are no likely variations in the key assumptions which would lead to an impairment being recognised in any of the other CGUs.
Key assumptionsCash flows The value-in-use calculations generally use discounted future cash flows based on financial plans approved by the Board covering a two-year period. Discounted cash flows for the US Global Products CGU were based on a Board-approved three-year plan, reflecting increases in revenue from new product lines. Cash flows for periods beyond these periods are extrapolated based on the last year of the plans, with a terminal growth-rate assumption applied.
Terminal growth rates The specific plans for each of the CGUs have been extrapolated using a terminal growth rate of 2.0% – 2.4% (2015: 2.0% – 3.0%). The US terminal growth rate was 2.4% (2015: 3.0%). Growth rates are based on management’s estimates which take into consideration the long-term nature of the industry in which the CGUs operate and external forecasts as to the likely growth of the industry in the longer term.
Discount ratesThe Group’s weighted average cost of capital was used as a basis in determining the discount rate to be applied, adjusted for risks specific to the market characteristics of CGUs, as appropriate on a pre-tax basis. This is considered to appropriately estimate a market participant discount rate. The pre-tax discount rates applied for the two EMEA Services CGUs were 11.7% and 14.7%, for the UK Global Products CGU was 11.7% and for the US Global Products CGU was 11.3%.
Sensitivity analysis shows that the value of the terminal year cash flow, the discount rate and the terminal growth rates have a significant impact on the value of the discounted cash flow.
Significant CGUs US Global ProductsThe carrying value of the goodwill for the US Global Products CGU as at 31 March 2016 was £37.9m (2015: £67.2m). The decrease results from an impairment of £31.9m in the year following a reduction in the value in use, calculated using the assumptions noted above. The impairment is primarily due to the combined impact of changes to the discount rate and terminal growth rate. Sensitivity analysis has then been undertaken to assess the impact of changes to the key assumptions. Applying a sensitivity to remove new product growth would increase the impairment by £4.5m. Alternatively, increasing the discount rate by another 1% would increase the impairment by £6.0m and reducing the terminal growth rate by 1% would increase the impairment by £5.3m. The carrying value of net operating assets as at 31 March 2016 was £82.8m.
Other CGUsThe UK Global Products CGU and the two individual CGUs within EMEA Services all have significant headroom. An increase in the discount rate or a decrease in the terminal growth rate by 1% would not cause the net operating assets to exceed their recoverable amount. The carrying value of goodwill for the UK Global Products CGU as at 31 March 2016 was £5.5m (2015: £5.2m). The carrying values of goodwill for the two EMEA Services CGUs as at 31 March 2016 were £27.5m and £2.2m (2015: £27.5m and £2.1m). The Directors have not identified any other likely changes in other significant assumptions between 31 March 2016 and the signing of the financial statements that would cause the carrying value of the recognised goodwill to exceed its recoverable amount.
QinetiQ Group plc Annual Report and Accounts 2016 121
Strategic report Governance Financial statements Additional information

15. Intangible assets Year ended 31 March 2016
Acquired intangible assets
all figures in £ millionCustomer
relationshipsIntellectual
propertyBrand
namesDevelopment
costs
Other intangible
assets Total
CostAt 1 April 2015 39.0 58.9 4.1 17.0 42.3 161.3
Additions – internally developed – – – 0.4 0.5 0.9
Additions – purchased – – – 0.1 0.6 0.7
Disposals – – – – (0.5) (0.5)
Divestments (7.7) (7.3) (2.2) – – (17.2)
Transfers – – – 1.0 (0.9) 0.1
Foreign exchange 0.6 1.1 0.2 – 0.2 2.1
At 31 March 2016 31.9 52.7 2.1 18.5 42.2 147.4
Amortisation and impairmentAt 1 April 2015 33.0 57.8 2.6 15.0 37.6 146.0
Amortisation charge for year 0.3 1.6 0.1 1.2 1.3 4.5
Impairments – – – 0.3 – 0.3
Disposals – – – – (0.2) (0.2)
Divestments (2.9) (9.3) (1.3) – – (13.5)
Foreign exchange 0.8 1.0 0.1 – 0.1 2.0
At 31 March 2016 31.2 51.1 1.5 16.5 38.8 139.1
Net book value at 31 March 2016 0.7 1.6 0.6 2.0 3.4 8.3
Divestments are in respect of the disposal of the Cyveillance business (see note 7).
Year ended 31 March 2015
Acquired intangible assets
all figures in £ millionCustomer
relationshipsIntellectual
propertyBrand
namesDevelopment
costs
Other intangible
assets Total
CostAt 1 April 2014 141.4 53.5 9.2 17.0 35.8 256.9
Additions – internally developed – – – 0.4 1.3 1.7
Additions – purchased – – – – 2.5 2.5
Additions – recognised on acquisition – 3.3 – – – 3.3
Divestments (108.9) (2.0) (6.0) (0.3) (1.7) (118.9)
Transfers – – – (0.1) 0.7 0.6
Foreign exchange 6.5 4.1 0.9 – 3.7 15.2
At 31 March 2015 39.0 58.9 4.1 17.0 42.3 161.3
Amortisation and impairmentAt 1 April 2014 105.5 49.9 8.1 14.5 34.7 212.7
Amortisation charge for year 1.4 2.1 0.1 0.6 0.9 5.1
Divestments (79.0) (1.0) (5.9) (0.1) (0.3) (86.3)
Transfers – – – – (0.2) (0.2)
Foreign exchange 5.1 6.8 0.3 – 2.5 14.7
At 31 March 2015 33.0 57.8 2.6 15.0 37.6 146.0
Net book value at 31 March 2015 6.0 1.1 1.5 2.0 4.7 15.3
Notes to the financial statements continued
QinetiQ Group plc Annual Report and Accounts 2016122

16. Property, plant and equipment Year ended 31 March 2016
all figures in £ millionLand and buildings
Plant, machinery
and vehicles
Computers and office
equipmentAssets under construction Total
Cost At 1 April 2015 312.6 174.3 41.5 37.1 565.5
Additions – purchased 2.2 2.9 1.9 21.6 28.6
Additions – acquisition – – – – –
Disposals (0.2) (1.0) (2.2) (1.2) (2.8)
Divestments (0.2) – (1.8) – (2.0)
Transfers 3.8 14.0 7.8 (25.7) (0.1)
Foreign exchange 0.2 0.5 0.2 – 0.9
At 31 March 2016 318.4 190.7 49.2 31.8 590.1
DepreciationAt 1 April 2015 152.3 147.0 36.2 0.4 335.9
Charge for year 10.2 9.7 3.5 – 23.4
Impairment charge / (reversal) – – – (0.4) (0.4)
Disposals (0.1) (0.7) (0.3) – (1.1)
Divestments (0.1) – (1.6) – (1.7)
Foreign exchange 0.1 0.4 0.1 – 0.6
At 31 March 2016 162.4 156.4 37.9 – 356.7
Net book value at 31 March 2016 156.0 34.3 11.3 31.8 233.4
Divestments are in respect of the disposal of the Cyveillance business (see note 7).
Year ended 31 March 2015
all figures in £ millionLand and buildings
Plant, machinery
and vehicles
Computers and office
equipmentAssets under construction Total
Cost At 1 April 2014 317.6 164.5 50.0 24.9 557.0
Additions – purchased 0.3 1.2 1.0 22.3 24.8
Additions – acquisition – 0.3 0.1 – 0.4
Disposals (0.8) (0.5) (0.2) (1.2) (2.7)
Divestments (3.4) (1.4) (11.5) – (16.3)
Transfers (1.9) 8.9 1.3 (8.9) (0.6)
Foreign exchange 0.8 1.3 0.8 – 2.9
At 31 March 2015 312.6 174.3 41.5 37.1 565.5
DepreciationAt 1 April 2014 145.9 137.5 39.8 – 323.2
Charge for year 9.7 8.5 2.8 – 21.0
Impairment – 0.5 0.1 0.4 1.0
Disposals (0.8) (0.5) (0.1) – (1.4)
Divestments (1.9) (1.0) (7.5) – (10.4)
Transfers (1.1) 1.1 0.2 – 0.2
Foreign exchange 0.5 0.9 0.9 – 2.3
At 31 March 2015 152.3 147.0 36.2 0.4 335.9
Net book value at 31 March 2015 160.3 27.3 5.3 36.7 229.6
Under the terms of the Business Transfer Agreement with the MOD, certain restrictions have been placed on freehold land and buildings, and certain plant and machinery related to them. These restrictions are detailed in note 32.
QinetiQ Group plc Annual Report and Accounts 2016 123
Strategic report Governance Financial statements Additional information

17. Non-current investmentsAs at 31 March all figures in £ million 2016 2015
Joint venture and
associates financial
results
Group net share of joint ventures and
associates
Joint venture and
associates financial
results
Group net share of joint ventures and
associates
Non-current assets 0.2 0.1 0.3 0.1
Current assets 12.8 6.1 8.0 3.9
13.0 6.2 8.3 4.0
Current liabilities (11.2) (5.4) (7.6) (3.7)
Net assets of joint ventures and associates 1.8 0.8 0.7 0.3Other non-current investments 0.1 0.1
Total 1.8 0.9 0.7 0.4
During the year ended 31 March 2016 there were sales to associates of £3.2m (2015: £3.0m). At the year end there were outstanding receivables from associates of £0.4m (2015: £0.3m).
18. Deferred taxDeferred tax assets and liabilities are offset only where there is a legally enforceable right to do so and there is an intention to settle the balances net.
Movements in the deferred tax assets and liabilities are shown below:
Year ended 31 March 2016Deferred tax asset
all figures in £ millionPension liability
Short-term timing
differencesTrading
losses Total
At 1 April 2015 1.6 7.6 25.2 34.4
(Charged)/credited to income statement (2.3) 0.6 (25.2) (26.9)
Credited/(charged) to other comprehensive income 2.2 (0.1) – 2.1
Foreign exchange – 0.1 – 0.1
Eliminated on disposal – (0.2) – (0.2)
Gross deferred tax asset at 31 March 2016 1.5 8.0 – 9.5Less: liability available for offset (5.4)
Net deferred tax asset at 31 March 2016 4.1
Deferred tax liability
all figures in £ million
Accelerated capital
allowances Amortisation Total
At 1 April 2015 (17.7) (3.8) (21.5)
Credited to income statement 4.2 0.1 4.3
Eliminated on disposal (0.1) 1.5 1.4
Foreign exchange 0.1 (0.1) –
Transferred to current tax 10.4 – 10.4
Gross deferred tax liability at 31 March 2016 (3.1) (2.3) (5.4)Less: asset available for offset 5.4
Net deferred tax liability at 31 March 2016 –
UK Group companies have now elected to obtain tax benefits in respect of allowable R&D expenditure through the R&D Expenditure Credit (‘RDEC’) process rather than through the previous treatment as a super-deduction in the tax computations. This election was made retrospectively back to 1 April 2013 and the incremental impact on the tax expense for years ending 31 March 2014 and 31 March 2015 has been reported in the current year as a specific adjusting item. The change of regime results in the utilisation of previously capitalised UK trading losses and the associated deferred tax asset has been charged to the income statement (see note 9).
Deferred tax has been calculated using the enacted future statutory tax rates.
At 31 March 2016 the Group had unused tax losses of £154.8m (2015: £291.6m) which are available for offset against future profits. £26.1m of these losses are time limited of which £6.3m will expire in 2034 and £19.8m will expire in 2035. Certain UK tax losses had been recognised on the balance sheet as at 31 March 2015 as a deferred tax asset of £25.2m. As noted above those tax losses have now been utilised following the election into the RDEC regime. No deferred tax asset is recognised in respect of the remaining tax losses due to uncertainty over the timing and extent of their utilisation.
Deferred tax eliminated on disposal relates to the disposal of the Cyveillance business (see note 7).
Notes to the financial statements continued
QinetiQ Group plc Annual Report and Accounts 2016124
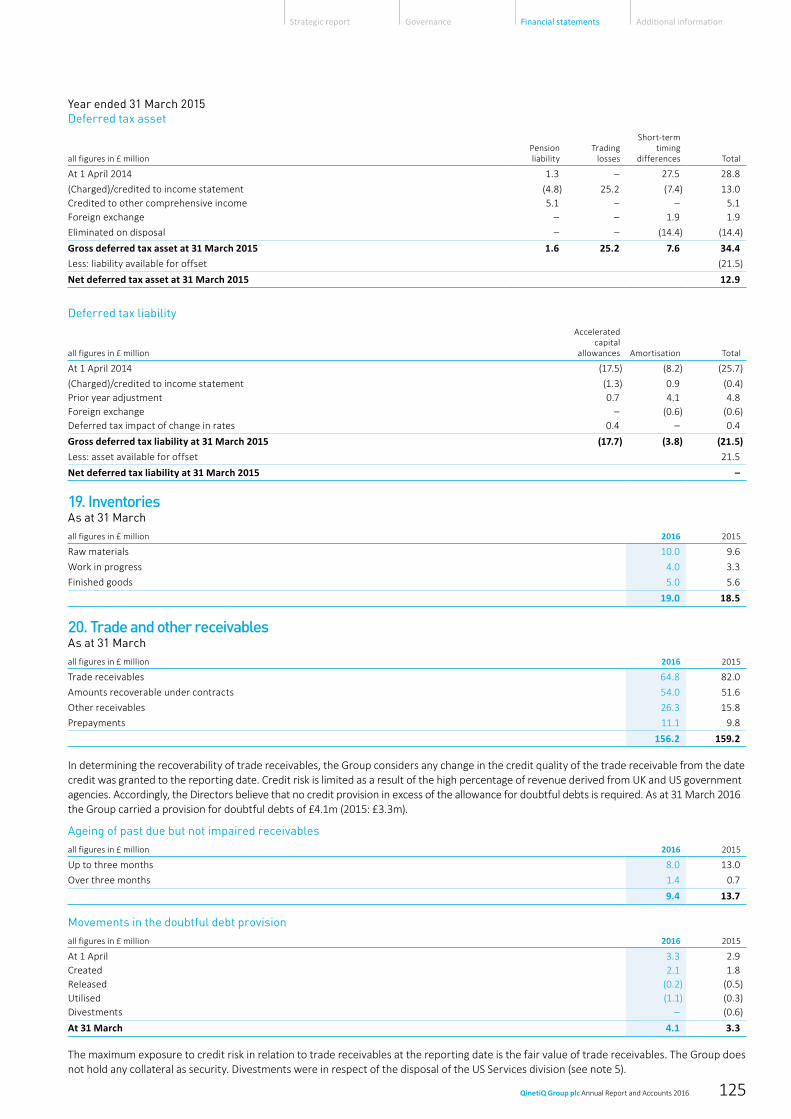
Year ended 31 March 2015Deferred tax asset
all figures in £ millionPension liability
Trading losses
Short-term timing
differences Total
At 1 April 2014 1.3 – 27.5 28.8
(Charged)/credited to income statement (4.8) 25.2 (7.4) 13.0Credited to other comprehensive income 5.1 – – 5.1Foreign exchange – – 1.9 1.9
Eliminated on disposal – – (14.4) (14.4)
Gross deferred tax asset at 31 March 2015 1.6 25.2 7.6 34.4Less: liability available for offset (21.5)
Net deferred tax asset at 31 March 2015 12.9
Deferred tax liability
all figures in £ million
Accelerated capital
allowances Amortisation Total
At 1 April 2014 (17.5) (8.2) (25.7)
(Charged)/credited to income statement (1.3) 0.9 (0.4)Prior year adjustment 0.7 4.1 4.8 Foreign exchange – (0.6) (0.6)Deferred tax impact of change in rates 0.4 – 0.4
Gross deferred tax liability at 31 March 2015 (17.7) (3.8) (21.5)Less: asset available for offset 21.5
Net deferred tax liability at 31 March 2015 –
19. InventoriesAs at 31 March all figures in £ million 2016 2015
Raw materials 10.0 9.6
Work in progress 4.0 3.3
Finished goods 5.0 5.6
19.0 18.5
20. Trade and other receivablesAs at 31 March all figures in £ million 2016 2015
Trade receivables 64.8 82.0
Amounts recoverable under contracts 54.0 51.6
Other receivables 26.3 15.8
Prepayments 11.1 9.8
156.2 159.2
In determining the recoverability of trade receivables, the Group considers any change in the credit quality of the trade receivable from the date credit was granted to the reporting date. Credit risk is limited as a result of the high percentage of revenue derived from UK and US government agencies. Accordingly, the Directors believe that no credit provision in excess of the allowance for doubtful debts is required. As at 31 March 2016 the Group carried a provision for doubtful debts of £4.1m (2015: £3.3m).
Ageing of past due but not impaired receivablesall figures in £ million 2016 2015
Up to three months 8.0 13.0
Over three months 1.4 0.7
9.4 13.7
Movements in the doubtful debt provisionall figures in £ million 2016 2015
At 1 April 3.3 2.9Created 2.1 1.8Released (0.2) (0.5)Utilised (1.1) (0.3)Divestments – (0.6)
At 31 March 4.1 3.3
The maximum exposure to credit risk in relation to trade receivables at the reporting date is the fair value of trade receivables. The Group does not hold any collateral as security. Divestments were in respect of the disposal of the US Services division (see note 5).
QinetiQ Group plc Annual Report and Accounts 2016 125
Strategic report Governance Financial statements Additional information

21. Current asset investmentsAs at 31 March all figures in £ million 2016 2015
Current asset investments 1.7 2.3
At 31 March 2016 the Group held a 4.9% shareholding in pSivida Limited (31 March 2015: 4.9%), a company listed on NASDAQ and the Australian and Frankfurt Stock Exchanges. The investment is held at fair value using the closing share price at 31 March 2016 of AUS$3.56 per share (31 March 2015: AUS$5.08 per share).
22. Trade and other payables As at 31 March all figures in £ million 2016 2015
Trade payables 32.9 29.5
Other tax and social security 32.3 31.9
Deferred income 111.3 122.0
Accrued expenses and other payables 162.2 168.9
Total current trade and other payables 338.7 352.3Payments received on account 9.9 9.6
Other payables 1.1 0.8
Total non-current trade and other payables 11.0 10.4Total trade and other payables 349.7 362.7
23. Current taxAs at 31 March all figures in £ million 2016 2015
Current tax liability 39.9 15.3
The increase in the current tax liability is primarily due to a tax liability crystallising in the US following a court decision in respect of taxes payable in respect of the Group’s acquisition of Dominion Technology Resources, Inc. in 2008. An insurance policy was taken out by the Group at the point of acquisition and if, subject to an appeal, the court’s decision is final then the funds required to settle this dispute will be provided by the insurers and an escrow account funded by the vendors. Hence, an offsetting receivable is reported on the balance sheet as at 31 March 2016 (included within trade and other receivables).
24. Provisions Year ended 31 March 2016
all figures in £ million Property
Warranty and
indemnities Other Total
At 1 April 2015 13.5 6.4 5.5 25.4
Created in year 1.8 – 1.3 3.1
Released in year (0.5) (6.7) (0.6) (7.8)
Unwind of discount 0.3 – – 0.3
Utilised in year (1.7) – (0.5) (2.2)
Foreign exchange – 0.3 – 0.3
At 31 March 2016 13.4 – 5.7 19.1
Current liability 3.2 – 2.1 5.3
Non-current liability 10.2 – 3.6 13.8
At 31 March 2016 13.4 – 5.7 19.1
Property provisions relate to under-utilised properties in the UK. The extent of the provision is affected by the timing of when properties can be sub-let and the proportion of space that can be sub-let. Based on current assessment the provision will be utilised within ten years.
Other provisions relate to environmental and other liabilities, the magnitude and timing of utilisation of which are determined by a variety of factors.
Notes to the financial statements continued
QinetiQ Group plc Annual Report and Accounts 2016126

25. Net cashAs at 31 Marchall figures in £ million 2016 2015
Assets Liabilities Net Assets Liabilities Net
Current financial assets/(liabilities)Deferred financing costs 0.3 – 0.3 0.3 – 0.3
Borrowings 0.3 – 0.3 0.3 – 0.3
Available-for-sale investment 9.9 – 9.9 10.0 – 10.0
Derivative financial instruments 0.6 (0.2) 0.4 0.5 (0.5) –
Finance lease debtor/(creditor) – – – 1.5 (1.4) 0.1
Total current financial assets/(liabilities) 10.8 (0.2) 10.6 12.3 (1.9) 10.4Non-current assets/(liabilities)Deferred financing costs 0.5 – 0.5 0.8 – 0.8
Borrowings 0.5 – 0.5 0.8 – 0.8
Derivative financial instruments 0.1 (0.2) (0.1) 0.1 (0.1) –
Total non-current financial assets/(liabilities) 0.6 (0.2) 0.4 0.9 (0.1) 0.8 Cash 68.4 – 68.4 41.6 – 41.6
Cash equivalents 195.1 – 195.1 142.7 – 142.7
Total cash and cash equivalents 263.5 – 263.5 184.3 – 184.3
Total net cash as defined by the Group 274.5 195.5
At 31 March 2016 £1.6m (2015: £1.3m) of cash was held by the Group’s captive insurance subsidiary, including £0.1m (2015: £0.1m) that was restricted in its use.
Reconciliation of net cash flow to movement in net cashall figures in £ million 2016 2015
Increase/(decrease) in cash and cash equivalents in the year 78.4 (137.3)
Repayment of US$ private placement notes – 147.1
Outflow in respect of the purchase of available for sale investments – 10.0
Payment of bank loan arrangement fee – 1.3
Capital element of finance lease payments 1.4 2.8
Capital element of finance lease receipts (1.5) (3.0)
Change in net cash as defined by the Group resulting from cash flows 78.3 20.9Cash and cash equivalents disposed – (1.0)
Amortisation of deferred financing costs (0.3) (0.7)
Finance lease receivables – 0.3
Finance lease payables – (0.2)
Foreign exchange and other non-cash movements 1.0 5.7
In-year movement in net cash as defined by the Group 79.0 25.0Net cash as defined by Group at the beginning of the year 195.5 170.5
Net cash as defined by Group at the end of the year 274.5 195.5Less: other financial assets and liabilities (11.0) (11.2)
Total cash and cash equivalents 263.5 184.3
QinetiQ Group plc Annual Report and Accounts 2016 127
Strategic report Governance Financial statements Additional information

25. Net cash continuedFinance leasesGroup as a lessorThe minimum lease receivables under finance leases fall due as follows:
all figures in £ million Minimum lease paymentsPresent value of minimum
lease payments2016 2015 2016 2015
Amounts receivable under finance leasesWithin one year – 1.5 – 1.5
– 1.5 – 1.5
Group as a lesseeThe minimum lease payments under finance leases fall due as follows:
all figures in £ million Minimum lease paymentsPresent value of minimum
lease payments2016 2015 2016 2015
Amounts payable under finance leasesWithin one year – 1.4 – 1.4
– 1.4 – 1.4Classified as follows:Financial liability – current – 1.4
– 1.4
26. Operating leasesGroup as a lessorThe Group receives rental income on certain properties. Primarily these are properties partially occupied by Group companies, with vacant space sub-let to third-party tenants. The Group had contracted with tenants for the following future minimum lease payments:
all figures in £ million 2016 2015
Within one year 6.5 7.3
In the second to fifth years inclusive 13.6 19.1
Greater than five years 7.2 10.9
27.3 37.3
Group as a lesseeall figures in £ million 2016 2015
Lease and sub-lease income statement expense for the year 5.3 6.1
The Group had the following total future minimum lease payment commitments:
all figures in £ million 2016 2015
Within one year 9.4 5.0
In the second to fifth years inclusive 8.1 6.8
Greater than five years 1.5 1.2
19.0 13.0
Operating lease payments represent rentals payable by the Group on certain property, plant and equipment. Principal operating leases are negotiated for a term of approximately ten years.
Notes to the financial statements continued
QinetiQ Group plc Annual Report and Accounts 2016128

27. Financial risk managementThe Group’s international operations expose it to financial risks that include the effects of changes in foreign exchange rates, interest rates, credit risks and liquidity risks.
Treasury and risk management policies, which are set by the Board, specify guidelines on financial risks and the use of financial instruments to manage risk. The instruments and techniques used to manage exposures include foreign currency derivatives and interest rate derivatives. Group treasury monitors financial risks and compliance with risk management policies. There have been no changes in any risk management policies since the year end.
A) Fair values of financial instruments The table below analyses financial instruments carried at fair value, by valuation method. The different levels have been defined as follows:
Level 1 – measured using quoted prices (unadjusted) in active markets for identical assets or liabilities;
Level 2 – measured using inputs other than quoted prices included within Level 1 that are observable for the asset or liability, either directly (ie as prices) or indirectly (ie derived from prices). Level 2 derivatives comprise forward foreign exchange contracts which have been fair valued using forward exchange rates that are quoted in an active market; and
Level 3 – measured using inputs for the asset or liability that are not based on observable market data (ie unobservable inputs).
The following table presents the Group’s assets and liabilities that are measured at fair value as at 31 March 2016:
all figures in £ million Note Level 1 Level 2 Level 3 Total
AssetsAvailable for sale investments 25 9.9 – – 9.9
Current other investments 21 1.7 – – 1.7
Current derivative financial instruments 25 – 0.6 – 0.6
Non-current other investments – – 0.1 0.1
Non-current derivative financial instruments 25 – 0.1 – 0.1
LiabilitiesCurrent derivative financial instruments 25 – (0.2) – (0.2)
Non-current derivative financial instruments 25 – (0.2) – (0.2)
Total 11.6 0.3 0.1 12.0
The following table presents the Group’s assets and liabilities that are measured at fair value as at 31 March 2015:
all figures in £ million Note Level 1 Level 2 Level 3 Total
AssetsAvailable for sale investments 25 10.0 – – 10.0
Current other investments 21 2.3 – – 2.3
Current derivative financial instruments 25 – 0.5 – 0.5
Non-current other investments – – 0.1 0.1
Non-current derivative financial instruments 25 – 0.1 – 0.1
LiabilitiesCurrent derivative financial instruments 25 – (0.5) – (0.5)
Non-current derivative financial instruments 25 – (0.1) – (0.1)
Total 12.3 – 0.1 12.4
For cash and cash equivalents, trade and other receivables and bank and current borrowings, the fair value of the financial instruments approximate to their carrying value as a result of the short maturity periods of these financial instruments. For trade and other receivables, allowances are made within the carrying value for credit risk. For other financial instruments, the fair value is based on market value, where available. Where market values are not available, the fair values have been calculated by discounting cash flows to net present value using prevailing market-based interest rates translated at the year end rates, except for unlisted fixed asset investments where fair value equals carrying value. There have been no transfers between levels.
QinetiQ Group plc Annual Report and Accounts 2016 129
Strategic report Governance Financial statements Additional information

27. Financial risk management continuedAll financial assets and liabilities had a fair value that is identical to book value at 31 March 2016 and 31 March 2015. Detailed analysis is provided in the tables below:
As at 31 March 2016
all figures in £ million NoteAvailable
for saleLoans and
receivables
Financial liabilities at
amortised cost
Derivatives used as hedges
Total carrying
valueTotal fair
value
Financial assetsNon-currentDerivative financial instruments 25 – – – 0.1 0.1 0.1
Other investments 17 0.1 – – – 0.1 0.1
CurrentTrade and other receivables 20 – 156.2 – – 156.2 156.2
Derivative financial instruments 25 – – – 0.6 0.6 0.6
Current asset investments 21 1.7 – – – 1.7 1.7
Available for sale investment 9.9 – – – 9.9 9.9
Cash and cash equivalents 25 – 263.5 – – 263.5 263.5
Total financial assets 11.7 419.7 – 0.7 432.1 432.1Financial liabilitiesNon-currentTrade and other payables 22 – – (11.0) – (11.0) (11.0)
Deferred financing costs 25 – – 0.5 – 0.5 0.5
Derivative financial instruments 25 – – – (0.2) (0.2) (0.2)
CurrentTrade and other payables 22 – – (338.7) – (338.7) (338.7)
Derivative financial instruments 25 – – – (0.2) (0.2) (0.2)
Deferred financing costs 25 – – 0.3 – 0.3 0.3
Total financial liabilities – – (348.9) (0.4) (349.3) (349.3)
Total 11.7 419.7 (348.9) 0.3 82.8 82.8
As at 31 March 2015
all figures in £ million NoteAvailable
for saleLoans and
receivables
Financial liabilities at
amortised cost
Derivatives used as hedges
Total carrying value
Total fair value
Financial assetsNon-current Derivative financial instruments 25 – – – 0.1 0.1 0.1
Other investments 17 0.1 – – – 0.1 0.1
CurrentFinance leases 25 – 1.5 – – 1.5 1.5
Trade and other receivables 20 – 159.2 – – 159.2 159.2
Derivative financial instruments 25 – – – 0.5 0.5 0.5
Current asset investments 21 2.3 – – – 2.3 2.3
Available for sale investment 10.0 – – – 10.0 10.0
Cash and cash equivalents 25 – 184.3 – – 184.3 184.3
Total financial assets 12.4 345.0 – 0.6 358.0 358.0Financial liabilitiesNon-currentTrade and other payables 22 – – (10.4) – (10.4) (10.4)
Bank and other borrowings 25 – – 0.8 – 0.8 0.8
Finance leases 25 – – – (0.1) (0.1) (0.1)
CurrentTrade and other payables 22 – – (352.3) – (352.3) (352.3)
Derivative financial instruments 25 – – – (0.5) (0.5) (0.5)
Finance leases 25 – – (1.4) – (1.4) (1.4)
Deferred financing costs 25 – – 0.3 – 0.3 0.3
Total financial liabilities – – (363.0) (0.6) (363.6) (363.6)
Total 12.4 345.0 (363.0) – (5.6) (5.6)
Notes to the financial statements continued
QinetiQ Group plc Annual Report and Accounts 2016130

B) Interest rate riskThe Group operates an interest rate policy designed to optimise interest costs and to reduce volatility in reported earnings. The Group’s current policy is to require rates to be fixed for 30%–80% of the level of borrowings, which is achieved primarily through fixed-rate borrowings. Where there are significant changes in the level and/or structure of debt, policy permits borrowings to be 100% fixed, with regular Board reviews of the appropriateness of this fixed percentage. At 31 March 2016 none (2015: 100%) of the Group’s borrowings were at fixed rates with no adjustment for interest rate swaps.
Financial assets/(liabilities)As at 31 March 2016
Financial asset Financial liability
all figures in £ millionFixed or capped Floating
Non-interest bearing
Fixed or capped Floating
Non-interest bearing
Sterling – 246.6 10.6 – – (0.4)
US dollar – 8.9 0.1 – – –
Euro – 2.1 – – – –
Australian dollar – 3.6 1.7 – – –
Other – 2.3 – – – –
– 263.5 12.4 – – (0.4)
As at 31 March 2015Financial asset Financial liability
all figures in £ millionFixed or capped Floating
Non-interest bearing
Fixed or capped Floating
Non-interest bearing
Sterling 1.5 163.9 10.6 (1.4) – (0.6)
US dollar – 14.7 0.1 – – –
Euro – 1.9 – – – –
Australian dollar – 3.0 2.3 – – –
Other – 0.8 – – – –
1.5 184.3 13.0 (1.4) – (0.6)
Floating-rate financial assets attract interest based on the relevant national LIBID equivalent. Floating-rate financial liabilities bear interest at the relevant national LIBOR equivalent. Trade and other receivables/payables and deferred finance costs are excluded from this analysis.
For the fixed or capped-rate financial assets and liabilities, the average interest rates (including the relevant marginal cost of borrowing) and the average period for which the rates are fixed are:
2016 2015
Fixed or capped
£m
Weighted average
interest rate %
Weighted average years to
maturity
Fixed or capped
£m
Weighted average
interest rate %
Weighted average years
to maturity
Financial assets:
Sterling – – – 1.5 13.4 0.5
Total financial assets – – – 1.5 13.4 0.5Financial liabilities:
Sterling – – – (1.4) 12.1 0.5
Total financial liabilities – – – (1.4) 12.1 0.5
Sterling assets and liabilities consist primarily of finance leases with the weighted average interest rate reflecting the internal rate of return of those leases.
QinetiQ Group plc Annual Report and Accounts 2016 131
Strategic report Governance Financial statements Additional information

27. Financial risk management continuedInterest rate risk managementThe Group private placement borrowings were repaid during the prior year and were fixed-rate, while the revolving credit facility is floating-rate and undrawn as at 31 March 2016.
C) Currency riskTransactional currency exposureThe Group is exposed to foreign currency risks arising from sales or purchases by businesses in currencies other than their functional currency. It is Group policy that when such a sale or purchase is certain, the net foreign exchange exposure is hedged using forward foreign exchange contracts. Hedge accounting documentation and effectiveness testing are undertaken for all the Group’s transactional hedge contracts.
The table below shows the Group’s currency exposures, being exposures on currency transactions that give rise to net currency gains and losses recognised in the income statement. Such exposures comprise the monetary assets and liabilities of the Group that are not denominated in the functional currency of the operating company involved.
Functional currency of the operating companyNet foreign currency monetary assets/(liabilities)
all figures in £ million US$ Euro AUS$ Other Total
31 March 2016 – sterling 5.8 1.7 0.2 0.6 8.331 March 2015 – sterling (5.9) 2.0 (0.1) 0.8 (3.2)
The amounts shown in the table take into account the effect of the forward contracts entered into to manage these currency exposures.
The Group enters into forward foreign currency contracts to hedge the currency exposures that arise on sales and purchases denominated in foreign currencies, as the transaction occurs. The principal contract amounts of the outstanding forward currency contracts as at 31 March 2016 against sterling are net US dollars sold £13.5m (US$19.3m) and net euros sold £3.4m (€4.3m).
Translational currency exposureThe Group has significant investments in overseas operations, particularly in the US. As a result, the sterling value of the Group’s balance sheet can be significantly affected by movement in exchange rates. The Group does not hedge against translational currency exposure to overseas net assets.
D) Financial credit risk The Group is exposed to credit-related losses in the event of non-performance by counterparties to financial instruments, but does not currently expect any counterparties to fail to meet their obligations. Credit risk is mitigated by a Board-approved policy of only selecting counterparties with a strong investment grade long-term credit rating for cash deposits. In the normal course of business the Group operates notional cash pooling systems, where a legal right of set-off applies.
The maximum credit-risk exposure in the event of other parties failing to perform their obligations under financial assets, excluding trade and other receivables, totals £275.9m (2015: £198.8m). The Group held cash and cash equivalents of £263.5m at 31 March 2016 (2015: £184.3m), which represents the maximum credit exposure on these assets. The cash and cash equivalents were held with different financial institutions which were rated single A or better, although £145.1m (2015: £142.7m) was invested in AAA-rated money funds at the year end and £40m (2015: £50m) was invested in deposits collateralised by security, where the security was gilts.
E) Liquidity riskBorrowing facilitiesAs at 31 March 2016 the Group had a revolving credit facility (RCF) of US$100m and £166m (2015: US$100m and £166m).
The RCF is contracted until 2019 and is unutilised as shown in the table below:
Interest rate:LIBOR plus
Total £m
Drawn £m
Undrawn £m
Committed facilities 31 March 2016 0.65% 235.6 – 235.6
Freely available cash and cash equivalents 263.4
Available funds 31 March 2016 499.0
Committed facilities 31 March 2015 0.65% 233.3 – 233.3
Freely available cash and cash equivalents 184.2
Available funds 31 March 2015 417.5
Notes to the financial statements continued
QinetiQ Group plc Annual Report and Accounts 2016132

Gross contractual cash flows for borrowings and other financial liabilitiesThe following are the contractual maturities of financial liabilities, including interest payments. The cash flows associated with derivatives that are cash flow hedges are expected to have an impact on profit or loss in the periods shown.
As at 31 March 2016
all figures in £ millionBookvalue
Contractual cash flows 1 year or less 1–2 years 2–5 years
More than 5 years
Non-derivative financial liabilitiesTrade and other payables (349.7) (349.7) (338.7) (11.0) – –
Recapitalisation fee 0.8 – – – – –
Derivative financial liabilitiesForward foreign currency contracts – cash flow hedges (0.4) (0.4) (0.2) (0.1) (0.1) –
(349.3) (350.1) (338.9) (11.1) (0.1) –
As at 31 March 2015
all figures in £ millionBookvalue
Contractual cash flows 1 year or less 1–2 years 2–5 years
More than 5 years
Non-derivative financial liabilitiesTrade and other payables (362.7) (362.7) (352.3) (10.4) – –
Recapitalisation fee 1.1 – – – – –
Finance leases (1.4) (1.4) (1.4) – – –
Derivative financial liabilitiesForward foreign currency contracts – cash flow hedges (0.6) (0.6) (0.5) (0.1) – –
(363.6) (364.7) (354.2) (10.5) – –
F) Derivative financial instrumentsAs at 31 March
2016 2015
all figures in £ millionAssetgains
Liability losses Net
Assetgains
Liability losses Net
Forward foreign currency contracts – cash flow hedges 0.7 (0.4) 0.3 0.6 (0.6) –
Derivative assets/(liabilities) at the end of the year 0.7 (0.4) 0.3 0.6 (0.6) –
As at 31 March
2016 2015
all figures in £ millionAssetgains
Liability losses Net
Assetgains
Liability losses Net
Expected to be recognised:
In one year or less 0.6 (0.2) 0.4 0.5 (0.5) –
Between one and two years 0.1 (0.1) – – (0.1) (0.1)
More than two years – (0.1) (0.1) 0.1 – 0.1
Derivative assets/(liabilities) at the end of the year 0.7 (0.4) 0.3 0.6 (0.6) –
QinetiQ Group plc Annual Report and Accounts 2016 133
Strategic report Governance Financial statements Additional information

27. Financial risk management continuedG) Maturity of financial liabilitiesAs at 31 March 2016
all figures in £ million
Trade and other
payables
Bank borrowings
and loan notes
Finance leases and derivative
financial instruments Total
Due in one year or less 338.7 (0.3) 0.2 338.6
Due in more than one year but not more than two years 11.0 (0.3) 0.1 10.8
Due in more than two years but not more than five years – (0.2) 0.1 (0.1)
Due in more than five years – – – –
349.7 (0.8) 0.4 349.3
As at 31 March 2015
all figures in £ million
Trade and other
payables
Bank borrowings
and loan notes
Finance leases and derivative
financial instruments Total
Due in one year or less 352.3 (0.3) 1.9 353.9
Due in more than one year but not more than two years 10.4 (0.3) 0.1 10.2
Due in more than two years but not more than five years – (0.5) – (0.5)
Due in more than five years – – – –
362.7 (1.1) 2.0 363.6
H) Sensitivity analysisThe Group’s sensitivity to changes in foreign exchange rates and interest rates on financial assets and liabilities as at 31 March 2016 is set out in the following table. The impact of a weakening in sterling on the Group’s financial assets and liabilities would be more than offset in equity and income by its impact on the Group’s overseas net assets and earnings respectively. Sensitivity on the Group’s assets other than financial assets and liabilities is not included in this analysis.
As at 31 March 2016
1% decrease in interest rates 10% weakening in sterling
all figures in £ million Equity1Profit
before tax EquityProfit
before tax
Sterling – (2.5) – –
US dollar – (0.1) 1.0 –
Other – (0.1) 1.1 –
1% increase in interest rates 10% strengthening in sterling
all figures in £ million Equity1Profit
before tax EquityProfit
before tax
Sterling – 2.5 – –
US dollar – 0.1 (0.8) –
Other – 0.1 (0.9) –
As at 31 March 2015
1% decrease in interest rates 10% weakening in sterling
all figures in £ million Equity1Profit
before tax EquityProfit
before tax
Sterling – (1.6) – –
US dollar – (0.1) 1.6 –
Other – (0.1) 0.9 –
1% increase in interest rates 10% strengthening in sterling
all figures in £ million Equity1Profit
before tax EquityProfit
before tax
Sterling – 1.6 – –
US dollar – 0.1 (1.3) –
Other – 0.1 (0.7) –
1 This relates to the impact on items charged directly to equity and excludes the impact on profit/loss for the year flowing into equity.
Notes to the financial statements continued
QinetiQ Group plc Annual Report and Accounts 2016134

The amounts generated from the sensitivity analysis are forward-looking estimates of market risk assuming that certain market conditions occur. Actual results in the future may differ materially from those projected as a result of developments in the global financial markets that may cause fluctuations in interest and exchange rates to vary from the hypothetical amounts disclosed which should not, therefore, be considered to be a projection of likely future events and losses.
The estimated changes for interest rate movements are based on an instantaneous decrease or increase of 1% (100 basis points) in the specific rate of interest applicable to each class of financial instruments from the levels effective at 31 March 2016, with all other variables remaining constant. The estimated changes for foreign exchange rates are based on an instantaneous 10% weakening or strengthening in sterling against all other currencies from the levels applicable at 31 March 2016, with all other variables remaining constant. Such analysis is for illustrative purposes only – in practice market rates rarely change in isolation.
The impact of transactional risk on the Group’s monetary assets/liabilities that are not held in the functional currency of the entity holding those assets/liabilities is minimal. A 10% weakening in sterling would also result in a minimal decrease in profit before tax.
28. Cash flows from operationsFor the year ended 31 March
all figures in £ million 2016 2015
Profit after tax for the year 106.1 104.7Adjustments for:
Taxation income (8.4) (11.8)
Net finance costs 1.3 4.1
(Profit)/loss on business divestments and disposal of investments (23.7) 12.9
Reversal of unutilised restructuring provisions – (1.0)
Amortisation and impairment of purchased or internally developed intangible assets 2.8 1.5
Amortisation of intangible assets arising from acquisitions 2.0 3.6
Impairment of goodwill 31.9 –
Depreciation and impairment of property, plant and equipment 23.0 22.0
Loss on disposal of property, plant and equipment 1.2 1.2
Share of post-tax (profit)/loss of equity accounted entities (0.5) 0.1
Share-based payments charge 4.7 3.6
Changes in retirement benefit obligations (13.4) (7.9)
Net movement in provisions (0.3) (1.6)
126.7 131.4
(Increase)/decrease in inventories (0.2) 2.6
Decrease in receivables 13.8 27.3
Decrease in payables (6.9) (22.2)
Changes in working capital 6.7 7.7Cash generated from operations 133.4 139.1Add back: cash outflow relating to restructuring – 0.6
Add back: disposal-related pension contribution – 6.0
Less: cash generated from discontinued operations – (1.8)
Net cash flow from operations before specific adjusting items 133.4 143.9
Reconciliation of net cash flow from operations before specific adjusting items to underlying operating cash flowall figures in £ million 2016 2015
Net cash flow from operations before specific adjusting items 133.4 143.9
Purchases of intangible assets (1.6) (4.2)
Purchases of property, plant and equipment (28.6) (24.8)
Proceeds from sale of property, plant and equipment 0.4 –
Underlying operating cash flow 103.6 114.9
QinetiQ Group plc Annual Report and Accounts 2016 135
Strategic report Governance Financial statements Additional information

29. Share capital and other reservesShares allotted, called up and fully paid:
Ordinary shares of 1p each (equity) Special Share of £1 (non-equity) Total
£ Number £ Number £ Number
At 1 April 2014 6,604,764 660,476,373 1 1 6,604,765 660,476,374Cancelled in the year (518,664) (51,866,369) – – (518,664) (51,866,369)
At 31 March 2015 6,086,100 608,610,004 1 1 6,086,101 608,610,005Issued in the year – – – – – –
Cancelled in the year (219,288) (21,928,804) – – (219,288) (21,928,804)
At 31 March 2016 5,866,812 586,681,200 1 1 5,866,813 586,681,201
Except as noted below all shares in issue at 31 March 2016 rank pari-passu in all respects.
In May 2014 the company initiated a £150m capital return to shareholders by way of a share buyback. At 31 March 2016 this programme was complete. A new £50m share buyback was announced in November 2015 and by 31 March 2016 the Group had completed £3m of the programme.
Rights attaching to the Special ShareQinetiQ carries out activities which are important to UK defence and security interests. To protect these interests in the context of the ongoing commercial relationship between the MOD and QinetiQ, and to promote and reinforce the Compliance Principles, the MOD holds a Special Share in QinetiQ. QinetiQ obtained MOD consent to changes in its Special Shareholder rights, which were approved by shareholders at the 2012 AGM. The changes to the Special Share were disclosed in the 2012 Annual Report. Subsequent to the changes approved at the 2012 AGM the Special Share confers certain rights on the holder:
a) to require the Group to implement and maintain the Compliance System (as defined in the Articles of Association) so as to make at all times effective its and each member of QinetiQ Controlled Group’s application of the Compliance Principles, in a manner acceptable to the Special Shareholder;
b) to refer matters to the Board for its consideration in relation to the application of the Compliance Principles;
c) to require the Board to obtain Special Shareholder’s consent:
i) if at any time when the chairman is not a British Citizen, it is proposed to appoint any person to the office of chief executive, who is not a British Citizen; and
ii) if at any time when the chief executive is not a British Citizen, it is proposed to appoint any person to the office of chairman, who is not a British Citizen;
d) to require the Board to take action to rectify any omission in the application of the Compliance Principles, if the Special Shareholder is of the opinion that such steps are necessary to protect the defence or security interests of the United Kingdom; and
e) to demand a poll at any of QinetiQ’s meetings (even though it may have no voting rights except those specifically set out in the Articles).
The Special Shareholder has an option to purchase defined Strategic Assets of the Group in certain circumstances. The Special Shareholder has, inter alia, the right to purchase any Strategic Assets which the Group wishes to sell. Strategic Assets are normally testing and research facilities (see note 32 for further details).
The Special Share may only be issued to, held by and transferred to HM Government (or as it directs). At any time the Special Shareholder may require QinetiQ to redeem the Special Share at par. If QinetiQ is wound up the Special Shareholder will be entitled to be repaid the capital paid up on the Special Share before other shareholders receive any payment. The Special Shareholder has no other right to share in the capital or profits of QinetiQ.
The Special Shareholder must give consent to a general meeting held on short notice.
The Special Share entitles the Special Shareholder to require certain persons who hold (together with any person acting in concert with them) a material interest in QinetiQ to dispose of some or all of their ordinary shares in certain prescribed circumstances on the grounds of national security or conflict of interest.
The Directors must register any transfer of the Special Share within seven days.
Other reservesThe translation reserve includes the cumulative foreign exchange difference arising on translation since the Group transitioned to IFRS. Movements on hedge instruments, where the hedge is effective, are recorded in the hedge reserve until the hedge ceases.
The capital redemption reserve, which was created following the redemption of preference share capital and the bonus issue of shares, cannot be distributed.
Own sharesOwn shares represent shares in the company that are held by independent trusts and include treasury shares and shares held by the employee share ownership plan. Included in retained earnings at 31 March 2016 are 4,862,182 shares (2015: 5,443,881 shares).
Notes to the financial statements continued
QinetiQ Group plc Annual Report and Accounts 2016136

30. Share-based paymentsThe Group operates a number of share-based payment plans for employees. The total share-based payment expense in the year was £4.7m, of which £4.7m related to equity-settled schemes and nil related to cash-settled schemes (year to 31 March 2015: £3.6m, of which £3.4m related to equity-settled schemes and £0.2m to cash-settled schemes).
Performance Share Plan (PSP) In the year, the Group made awards of conditional shares to certain UK senior employees under the PSP. The awards vest after three years with 50% of the awards subject to TSR conditions and 50% subject to EPS conditions as detailed in the Report from the Remuneration Committee.
2016Number
of shares
2015Number
of shares
Outstanding at start of year 9,457,408 8,090,260
Granted during year 3,842,409 4,310,206
Exercised during the year (2,304,189) (461,196)
Forfeited/lapsed during year (2,081,068) (2,481,862)
Outstanding at end of year 8,914,560 9,457,408
PSP awards are equity-settled awards and those outstanding at 31 March 2016 had an average remaining life of 1.4 years (2015: 1.3 years). There is no exercise price for these PSP awards. Monte Carlo modelling was used to fair value the TSR element of the awards at grant date. Assumptions used in the models included 22% (2015: 24%) for the average share price volatility of the FTSE comparator group and 53% (2015: 51%) for the average correlation to the comparator group. The weighted average fair value of grants made during the year was £1.79 (2015: £1.57). The weighted average share price at date of exercise was £2.51 (2015: £1.97). Of the options outstanding at the end of the year nil were exercisable (2015: nil).
Restricted Stock Units (RSU) In prior years the Group granted RSU awards to certain senior US employees under the RSU plan. The awards vest over one, two, three and four years. Of the 2014 awards, and the awards granted before 2012, half are dependent on achieving QNA organic profit growth targets and half on a time-based criterion. The time-based criterion requires the employee to have been in continual service up to the date of vesting. QNA organic profit growth is measured over the most recent financial year compared with the previous financial year, with 125% of this element awarded at a QNA organic profit growth rate above 15%, 100% awarded at 12.5%, 75% awarded at 10% and 25% awarded at 5%. The 2012 grants are entirely dependent on achieving QNA organic profit growth targets. 67.5% of the 2013 grants are dependent on achieving QNA organic profit growth targets and 32.5% are dependent on a time-based criterion.
2016Number
of shares
2015Number
of shares
Outstanding at start of year 175,187 3,819,001
Exercised during year (9,375) (196,154)
Forfeited/lapsed during year (141,437) (3,447,660)
Outstanding at end of year 24,375 175,187
RSUs are equity-settled awards; those outstanding at 31 March 2016 had an average remaining life of 0.4 years (2015: 1.1 years). There is no exercise price for these RSU awards. The weighted average share price at date of exercise was £2.35 (2015: £2.09). Of the awards outstanding at the end of the year nil were exercisable (2015: nil).
Value Sharing Plan (VSP) In 2012 and 2011, the Group granted VSP awards to certain senior UK employees under the VSP. The awards vest over a three-year performance period: 50% of the 2012 awards and 70% of the 2011 awards (which vested in 2014) are/were dependent on creating additional shareholder value, measured as net cash returns to investors and the increase in PBT over an 8.5% hurdle; 50% of the 2012 awards and 30% of the 2011 awards are/were dependent on TSR against a comparator group of FTSE 250 listed companies (less investment trusts) over a three-year performance period. Half the awards vest three years from the date of grant; the remaining half of the awards vest four years from the date of grant.
2016Number
of shares
2015Number
of shares
Outstanding at start of year 153,848 5,018,288
Exercised during year (153,848) (1,210,650)
Forfeited/lapsed during year – (3,653,790)
Outstanding at end of year – 153,848
VSP awards are equity-settled awards; those outstanding at 31 March 2016 had an average remaining life of nil years (2015: 0.2 years). There is no exercise price for these VSP awards. The weighted average share price at date of exercise was £2.37 (2015: £2.04). Of the awards outstanding at the end of the year nil were exercisable (2015: nil).
QinetiQ Group plc Annual Report and Accounts 2016 137
Strategic report Governance Financial statements Additional information

30. Share-based payments continuedGroup Share Incentive Plan (SIP)Under the QinetiQ SIP the Group offers UK employees the opportunity of purchasing up to £150 worth of shares a month at the prevailing market rate. The Group will make a matching share award of a third of the employee’s payment. The Group’s matching shares may be forfeited if the employee ceases to be employed by QinetiQ within three years of the award of the shares. There is no exercise price for these SIP awards.
2016Number of
matchingshares
2015Number of
matchingshares
Outstanding at start of year 647,821 725,904
Awarded during year 322,597 280,267
Exercised during year (123,202) (309,350)
Forfeited during year (41,431) (49,000)
Outstanding at end of year 805,785 647,821
SIP matching shares are equity-settled awards; those outstanding at 31 March 2016 had an average remaining life of 1.5 years (2015: 1.5 years). There is no exercise price for these SIP awards. Of the shares outstanding at the end of the year nil were exercisable (2015: nil).
Group Deferred Annual Bonus Plan (DAB)Under the QinetiQ DAB Plan the Group requires certain senior executives to defer part of their annual bonus as shares and be entitled to matching awards to a maximum of 1:1 based on EPS performance. The number that will vest is dependent on the growth of EPS over the measurement period of three years as detailed in the Report from the Remuneration Committee.
2016Number of
matchingshares
2015Number of
matchingshares
Outstanding at start of year 464,115 1,162,896
Granted during year – 303,639
Exercised during the year – (85,126)
Forfeited during year (152,615) (917,294)
Outstanding at end of year 311,500 464,115
DAB matching shares are equity-settled awards; those outstanding at 31 March 2016 had an average remaining life of 0.7 years (2015: 1.2 years). The weighted average fair value of grants made during the prior year was £2.08. The weighted average share price at date of exercise during the prior year was £2.08. There is no exercise price for these DAB awards. Of the shares outstanding at the end of the year nil were exercisable (2015: nil).
Cash Alternative Units (CAUs) During the year, the Group granted CAU awards to certain employees in the UK and US.
2016Number of
awards
2015Number of
awards
Outstanding at start of year 290,022 1,229,541
Awarded during year 20,000 94,894
Exercised during the year (135,352) (364,362)
Forfeited during year (139,670) (670,051)
Outstanding at end of year 35,000 290,022
CAUs are cash-settled awards which vest over one, two, three and four years from the date of grant. The CAUs have no performance criteria attached, other than the requirement that the employee remains in employment with the Group. Those awards outstanding at 31 March 2016 had an average remaining life of 0.5 years (2015: 0.8 years). There is no exercise price for these awards. The fair value of the grants at 31 March 2016 was £2.28 (2015: £1.91) being the Group’s closing share price on that day. The weighted average share price on the date of exercise was £2.34 (2015: £2.08). The carrying amount of the liability of the grants at the balance sheet date was nil (2015: £0.3m). Of the awards outstanding at the end of the year nil were exercisable.
Notes to the financial statements continued
QinetiQ Group plc Annual Report and Accounts 2016138

Bonus Banking Plan (BBP) During the year, the Group granted BBP awards to certain senior executives in the UK.
2016Number of
awards
2015Number of
awards
Outstanding at start of year 330,725 –
Granted during the year 493,505 330,725
Exercised during the year (5,711) –
Forfeited during year (3,741) –
Outstanding at end of year 814,778 330,725
The BBP is a remuneration scheme that runs for four years with effect from 1 April 2014. Refer to the Directors’ Remuneration Report for further details. Under the BBP a contribution will be made by the company into the participant’s plan account at the start of each plan year. 50% of the plan account balance for Executive Directors and 75% for all other participants will be paid in cash or shares (at the company’s discretion) at the end of each plan year. 100% of the balance in year four will be paid in shares to the participant. During the four-year plan period, 50% of the retained balance is at risk of forfeiture based on a minimum level of performance determined annually by the Audit Committee.
At 31 March 2016, the awards had an average remaining life of 2.3 years (2015: 1.7 years). There is no exercise price for these awards. The fair value of the awards at 31 March 2016 was £2.34 (2015: £1.91) being the Group’s 30 day average share price in the period running up to 31 March. Of the awards outstanding at the end of the year nil were exercisable.
Share-based award pricing – otherShare-based awards that vest based on non-market performance conditions, including certain PSP, RSUs and DAB awards, have been valued at the share price at grant, less attrition.
31. Post-retirement benefitsDefined contribution plansIn the UK the Group operates two defined contribution plans for the majority of its UK employees: a Group Personal Pension Plan (GPP) and a defined contribution section of the QinetiQ Pension Scheme. These are both defined contribution schemes managed by Zurich. A defined contribution plan is a pension plan under which the Group and employees pay fixed contributions to a third-party financial provider. The Group has no legal or constructive obligations to pay further contributions if the fund does not hold sufficient assets to pay all employees the benefits relating to employee service in the current and prior periods. The contributions are recognised as an employee benefit expense when they are due. Prepaid contributions are recognised as an asset to the extent that a cash refund or a reduction in the future payments is available.
Defined benefit pension plansIn the UK the Group operates the QinetiQ Pension Scheme (the ‘Scheme’) for a significant proportion of its UK employees. The Scheme closed to future accrual on 31 October 2013. After this date, defined benefit members transferred to a defined contribution scheme.
The Scheme is a final salary plan, which provides benefits to members in the form of a guaranteed level of pension payable for life. The level of benefits provided depends on the members’ length of service and their final pensionable earnings at closure to future accrual. In the Scheme, pensions in payment are generally updated in line with the Consumer Price Index (CPI). The benefit payments are made from Trustee-administered funds. Plan assets held in trusts are governed by UK regulations as is the nature of the relationship between the Group and the Trustees and their composition. Responsibility for the governance of the Scheme – including investment decisions and contribution schedules – lies jointly with the company and the Board of Trustees. The Board of Trustees must be composed of representatives of the company and plan participants in accordance with the Scheme’s regulations.
The liability recognised in the balance sheet in respect of defined benefit pension plans is the present value of the defined benefit obligation at the end of the reporting period less the fair value of plan assets. The defined benefit obligation is calculated bi-annually by independent actuaries using the projected unit credit method. The present value of the defined benefit obligation is determined by discounting the estimated future cash outflows using interest rates of high quality corporate bonds that are denominated in the currency in which the benefits will be paid, and that have terms to maturity approximating to the terms of the related pension obligation. In countries where there is no deep market in such bonds, the market rates on government bonds are used.
Actuarial gains and losses arising from experience adjustments and changes in actuarial assumptions are charged or credited to equity in other comprehensive income in the period in which they arise.
The expected employer cash contribution to the Scheme for the year ending 31 March 2017 is £13.0m. The Group has no further payment obligations once the contributions have been paid.
Triennial funding valuationThe most recent completed full actuarial valuation of the Scheme was undertaken as at 30 June 2014 and resulted in an actuarially assessed surplus of £31.0m.
The agreed recovery plan requires £13.0m contributions per annum until 31 March 2018, the same annual funding level as previously in place. This includes £2.5m p.a. distributions to the Scheme, indexed by reference to CPI, from the Group’s Pension Funding Partnership.
QinetiQ Group plc Annual Report and Accounts 2016 139
Strategic report Governance Financial statements Additional information

31. Post-retirement benefits continuedQinetiQ’s Pension Funding Partnership structureFollowing the 30 June 2011 valuation, a package of pension changes has been agreed with the Trustees to provide stability to the Scheme. As part of the package of proposals, on 26 March 2012 QinetiQ established the QinetiQ PFP Limited Partnership (the ‘Partnership’) with the Scheme. Under this arrangement, properties to the capitalised value of £32.3m were transferred to the Partnership. The transfers were affected through a 20-year sale and leaseback agreement. The Scheme’s interest in the Partnership entitles it to an annual distribution of approximately £2.5m for 20 years, indexed with reference to CPI. These contributions replaced part of the regular contributions made under the past deficit recovery payments plan. The Scheme’s interest in the Partnership will revert back to QinetiQ Limited in 2032.
The Partnership is controlled by QinetiQ and its results are consolidated by the Group. Under IAS19, the interest held by the Scheme in the Partnership does not qualify as a plan asset for the purposes of the Group’s consolidated financial statements and is, therefore, not included within the fair value of plan assets. As a result, the Group’s consolidated financial statements are unchanged by the Partnership. In addition, the value of the property transferred to the Partnership and leased back to QinetiQ remains on the balance sheet. QinetiQ retains the operational flexibility to substitute properties of equivalent value within the Partnership and has the option to settle outstanding amounts due under the interest before 2032 if it so chooses.
Other UK schemes In the UK the Group has a small number of employees for whom benefits are secured through the Prudential Platinum Scheme. The net pension deficits of this scheme at 31 March 2016 amounted to £nil (2015: £nil). QinetiQ also offers employees access to a Group Self Invested Personal Pension Plan, but no company contributions are paid to this arrangement.
QinetiQ Pension Scheme net pension liabilityThe fair value of the QinetiQ Pension Scheme assets, which are not intended to be realised in the short term and may be subject to significant change before they are realised, and the present value of the Scheme’s liabilities, which are derived from cash flow projections over long periods, and thus inherently uncertain, were:
all figures in £ million 2016 2015
Equities – quoted 347.9 447.2
Equities – unquoted 66.1 70.0
LDI investment* 362.8 323.4
Corporate bonds 314.2 311.4
Alternative bonds** 176.6 176.3
Property 126.6 113.4
Cash and other 16.2 12.9
Total market value of assets 1,410.4 1,454.6Present value of Scheme liabilities (1,448.1) (1,494.0)
Net pension liability before deferred tax (37.7) (39.4)Deferred tax asset 1.5 1.6
Net pension liability after deferred tax (36.2) (37.8)
* The Scheme has assets invested in a Liability Driven Investment portfolio. As at 31 March 2016 this hedges against 40% of the interest rate and 100% of the inflation rate risk, as measured on the Trustees’ gilt-funding basis.
** Includes allocations to high-yield bonds, secured loans and emerging market debt.
The company has an unconditional right to a refund of any surplus that may arise on cessation of the Scheme.
Notes to the financial statements continued
QinetiQ Group plc Annual Report and Accounts 2016140

Changes to the fair value of Scheme assetsall figures in £ million 2016 2015
Opening fair value of Scheme assets 1,454.6 1,304.6
Interest income on Scheme assets 46.3 53.9
Re-measurement (loss)/gain on Scheme assets (75.8) 116.3
Contributions by the employer 14.6 9.2
Net benefits paid out and transfers (28.1) (28.1)
Administrative expenses (1.2) (1.3)
Closing fair value of Scheme assets 1,410.4 1,454.6
Changes to the present value of the defined benefit obligationall figures in £ million 2016 2015
Opening defined benefit obligation (1,494.0) (1,326.8)
Interest cost (47.4) (54.5)
Actuarial gain/(loss) on Scheme liabilities based on: Change in financial assumptions 40.4 (128.3)
Experience gains 24.8 7.8
Change in demographic assumptions – (20.3)
Net benefits paid out and transfers 28.1 28.1
Closing defined benefit obligation (1,448.1) (1,494.0)
Changes to the net pension liabilityall figures in £ million 2016 2015
Opening net pension liability (39.4) (22.2)
Net finance cost (1.1) (0.6)
Administrative expenses (1.2) (1.3)
Net actuarial loss (10.6) (24.5)
Contributions by the employer 14.6 9.2
Closing net pension liability (37.7) (39.4)
Total expense recognised in the income statementall figures in £ million 2016 2015
Net interest on the net defined benefit liability 1.1 0.6
Administrative expenses 1.2 1.3
Total expense recognised in the income statement (gross of deferred tax) 2.3 1.9
AssumptionsThe major assumptions used in the IAS19 valuation of the Scheme were:
2016 2015
Discount rate applied to Scheme liabilities 3.4% 3.2%
CPI inflation assumption 2.1% 2.1%
Assumed life expectancies in years:
Future male pensioners (currently aged 60) 89 88
Future female pensioners (currently aged 60) 91 91
Future male pensioners (currently aged 40) 91 91
Future female pensioners (currently aged 40) 93 93
The assumptions used by the actuary are the best estimates chosen from a range of possible actuarial assumptions which, because of the timescale covered, may not necessarily be borne out in practice. It is important to note that these assumptions are long term and, in the case of the discount rate and the inflation rate, are measured by external market indicators. The mortality assumptions as at 31 March 2016 and 31 March 2015 were 90% of S2PMA for males and 90% of S2PFA for females, based on year of birth making allowance for improvements in mortality in line with CMI_2013 Core Projections and a long-term rate of improvement of 1.5% per annum.
The balance sheet net pension liability is a snapshot view which can be significantly influenced by short-term market factors. The calculation of the surplus or deficit depends, therefore, on factors which are beyond the control of the Group – principally the value at the balance sheet date of equity shares (and other assets) in which the Scheme has invested and long-term interest rates which are used to discount future liabilities. The funding of the Scheme is based on long-term trends and assumptions relating to market growth, as advised by qualified actuaries and investment advisors.
The weighted average duration of the defined benefit obligation is approximately 20 years.
QinetiQ Group plc Annual Report and Accounts 2016 141
Strategic report Governance Financial statements Additional information

31. Post-retirement benefits continuedSensitivity analysis of the principal assumptions used to measure Scheme liabilities
Assumption Change in assumptionIndicative impact on Scheme liabilities
(before deferred tax)
Discount rate Increase/decrease by 0.1% Decrease/increase by £27m
Rate of inflation Increase/decrease by 0.1% Increase/decrease by £25m
Rate of mortality Increase by one year Increase by £36m
The above sensitivity analyses are based on a change in an assumption while holding all other assumptions constant. In practice, this is unlikely to occur, and changes in some of the assumptions may be correlated. When calculating the sensitivity of the defined benefit obligation to significant actuarial assumptions the same method (projected unit credit method) has been applied as when calculating the pension liability recognised within the statement of financial position. The methods and types of assumption did not change.
RisksThrough its defined benefit pension plan, the Group is exposed to a number of risks, the most significant of which are detailed below:
Volatility in market conditions
Results under IAS19 can change dramatically depending on market conditions. The defined benefit obligation is linked to yields on AA-rated corporate bonds, while many of the assets of the Scheme are invested in other assets. Changing markets in conjunction with discount rate volatility will lead to volatility in the net pension liability on the Group’s balance sheet and in other comprehensive income. To a lesser extent this will also lead to volatility in the IAS19 pension finance expense in the Group’s income statement.
Choice of accounting assumptions
The calculation of the defined benefit obligation (DBO) involves projecting future cash flows from the Scheme many years into the future. This means that the assumptions used can have a material impact on the balance sheet position and profit and loss charge. In practice future experience within the Scheme may not be in line with the assumptions adopted. For example, members could live longer than foreseen or inflation could be higher or lower than allowed for in the DBO calculation.
The accounting assumptions noted above are used to calculate the year end net pension liability in accordance with the relevant accounting standard, IAS19 (revised) ‘Employee benefits’. Changes in these assumptions have no impact on the Group’s cash payments into the Scheme. The payments into the Scheme are reassessed after every triennial valuation.
The triennial valuations are calculated on a funding basis and use a different set of assumptions, as agreed with the pension Trustees. Given the current extremely low gilt yields, a funding valuation of the Scheme would probably have resulted in a bigger deficit than the IAS19 methodology if one had been performed at the year end.
Notes to the financial statements continued
QinetiQ Group plc Annual Report and Accounts 2016142
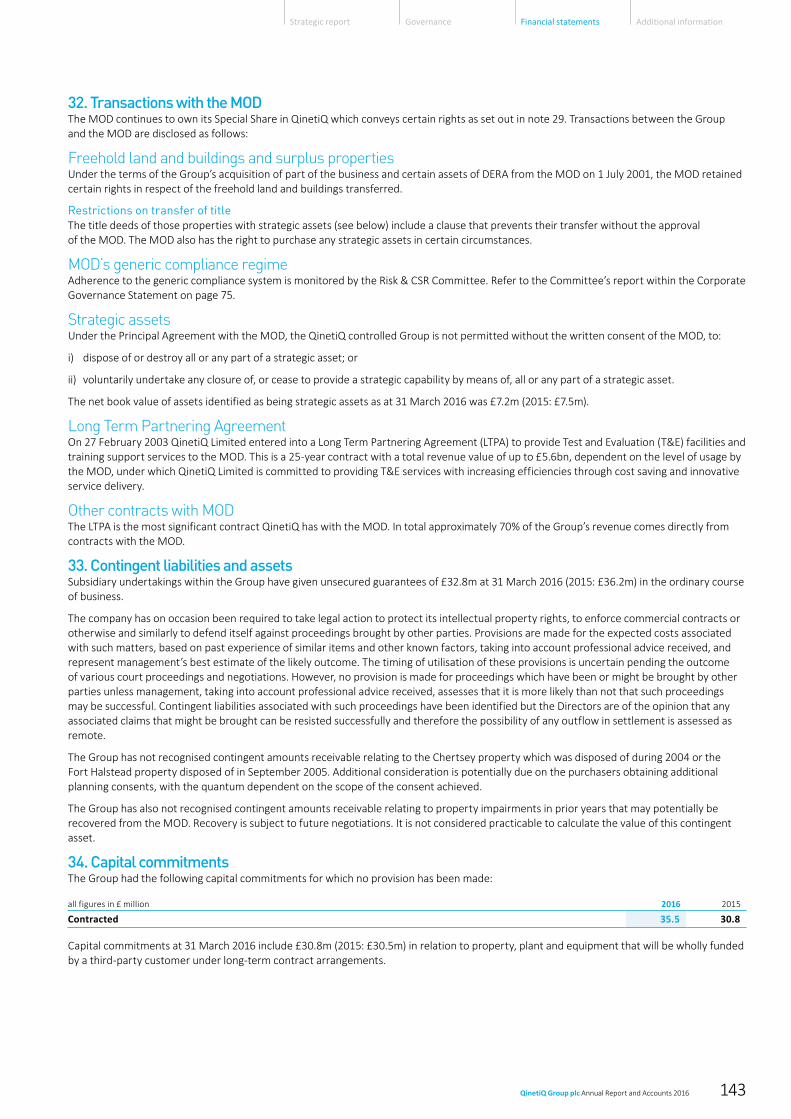
32. Transactions with the MODThe MOD continues to own its Special Share in QinetiQ which conveys certain rights as set out in note 29. Transactions between the Group and the MOD are disclosed as follows:
Freehold land and buildings and surplus propertiesUnder the terms of the Group’s acquisition of part of the business and certain assets of DERA from the MOD on 1 July 2001, the MOD retained certain rights in respect of the freehold land and buildings transferred.
Restrictions on transfer of titleThe title deeds of those properties with strategic assets (see below) include a clause that prevents their transfer without the approval of the MOD. The MOD also has the right to purchase any strategic assets in certain circumstances.
MOD’s generic compliance regimeAdherence to the generic compliance system is monitored by the Risk & CSR Committee. Refer to the Committee’s report within the Corporate Governance Statement on page 75.
Strategic assetsUnder the Principal Agreement with the MOD, the QinetiQ controlled Group is not permitted without the written consent of the MOD, to:
i) dispose of or destroy all or any part of a strategic asset; or
ii) voluntarily undertake any closure of, or cease to provide a strategic capability by means of, all or any part of a strategic asset.
The net book value of assets identified as being strategic assets as at 31 March 2016 was £7.2m (2015: £7.5m).
Long Term Partnering AgreementOn 27 February 2003 QinetiQ Limited entered into a Long Term Partnering Agreement (LTPA) to provide Test and Evaluation (T&E) facilities and training support services to the MOD. This is a 25-year contract with a total revenue value of up to £5.6bn, dependent on the level of usage by the MOD, under which QinetiQ Limited is committed to providing T&E services with increasing efficiencies through cost saving and innovative service delivery.
Other contracts with MODThe LTPA is the most significant contract QinetiQ has with the MOD. In total approximately 70% of the Group’s revenue comes directly from contracts with the MOD.
33. Contingent liabilities and assetsSubsidiary undertakings within the Group have given unsecured guarantees of £32.8m at 31 March 2016 (2015: £36.2m) in the ordinary course of business.
The company has on occasion been required to take legal action to protect its intellectual property rights, to enforce commercial contracts or otherwise and similarly to defend itself against proceedings brought by other parties. Provisions are made for the expected costs associated with such matters, based on past experience of similar items and other known factors, taking into account professional advice received, and represent management’s best estimate of the likely outcome. The timing of utilisation of these provisions is uncertain pending the outcome of various court proceedings and negotiations. However, no provision is made for proceedings which have been or might be brought by other parties unless management, taking into account professional advice received, assesses that it is more likely than not that such proceedings may be successful. Contingent liabilities associated with such proceedings have been identified but the Directors are of the opinion that any associated claims that might be brought can be resisted successfully and therefore the possibility of any outflow in settlement is assessed as remote.
The Group has not recognised contingent amounts receivable relating to the Chertsey property which was disposed of during 2004 or the Fort Halstead property disposed of in September 2005. Additional consideration is potentially due on the purchasers obtaining additional planning consents, with the quantum dependent on the scope of the consent achieved.
The Group has also not recognised contingent amounts receivable relating to property impairments in prior years that may potentially be recovered from the MOD. Recovery is subject to future negotiations. It is not considered practicable to calculate the value of this contingent asset.
34. Capital commitmentsThe Group had the following capital commitments for which no provision has been made:
all figures in £ million 2016 2015
Contracted 35.5 30.8
Capital commitments at 31 March 2016 include £30.8m (2015: £30.5m) in relation to property, plant and equipment that will be wholly funded by a third-party customer under long-term contract arrangements.
QinetiQ Group plc Annual Report and Accounts 2016 143
Strategic report Governance Financial statements Additional information

35. SubsidiariesThe full list of companies which were part of the Group as at 31 March 2016 is detailed below:
Name of company Country of incorporation Name of company Country of incorporation
Subsidiaries1,2,3 Subsidiaries1,2,3
BJ Trustee Limited England & Wales QinetiQ Target Services Limited England & Wales
Boldon James Holdings Limited England & Wales QinetiQ Estates Limited Scotland
Boldon James Inc US QinetiQ GP Limited Scotland
Boldon James Limited England & Wales QinetiQ Group Holdings Limited England & Wales
Cody US Limited England & Wales QinetiQ Holdings Limited England & Wales
Commerce Decisions Limited England & Wales QinetiQ Inc US
Commerce Decisions Pty Ltd Australia QinetiQ Insurance PCC Limited Guernsey
CueSim Limited England & Wales QinetiQ Investments Limited England & Wales
Foster-Miller Canada Limited Canada QinetiQ Limited England & Wales
Foster-Miller Inc US QinetiQ Novare Pty Ltd Australia
Graphic Research Corporation Limited England & Wales QinetiQ Overseas Holdings (2) Limited England & Wales
Gyldan 1 Limited England & Wales QinetiQ Overseas Holdings Limited England & Wales
Gyldan 2 England & Wales QinetiQ Overseas Trading Limited England & Wales
Gyldan 3 Limited England & Wales QinetiQ Partnership Finance Limited England & Wales
Gyldan 4 Limited England & WalesQinetiQ Pension Scheme Trustee Limited England & Wales
Leading Technology Limited England & Wales QinetiQ PFP LP Scotland
Metrix UK Limited England & Wales QinetiQ Philippines Company, Inc Philippines
Optasense Canada Limited Canada QinetiQ Pty Ltd Australia
Optasense Holdings Limited England & Wales QinetiQ Services Holdings Pty Ltd Australia
Optasense Inc US QinetiQ Space N.V. Belgium
Optasense Limited England & Wales QinetiQ Sweden AB Sweden
Precis (2187) Limited England & Wales QinetiQ US Holdings, Inc. US
Precis (2188) Limited England & Wales Redu Operational Services S.A. Belgium
Q Shelf Limited England & Wales Sensoptics Limited England & Wales
QinetiQ Aerostructures Pty Ltd Australia Tarsier Limited England & Wales
QinetiQ Australia Pty Ltd Australia Trusted Experts Limited England & Wales
QinetiQ Canada Operations Limited Canada TSG International LLC US
QinetiQ Consulting Pty Ltd Australia Associates4
QinetiQ Corporate Finance Limited England & Wales Redu Space Services S.A. Belgium
QinetiQ Defence Training Limited England & Wales Trillium International – I, L.P. Cayman Islands
1 Accounting reference date is 31 March. All subsidiary undertakings listed above have financial year ends of 31 March. 2 The Group owned 100% of the ordinary shares of the subsidiary undertakings except for Redu Operational Services S.A. (52%).3 QinetiQ Group Holdings Limited is a direct subsidiary of QinetiQ Group plc. All other subsidiaries are held indirectly by other subsidiaries of QinetiQ Group plc.4 The Group owned 48% of Redu Space Services S.A. and 25% of Trillium International – I, L.P.
Notes to the financial statements continued
QinetiQ Group plc Annual Report and Accounts 2016144

all figures in £ million Note 2016 2015
Fixed assetsInvestments in subsidiary undertaking 2 462.9 458.2
462.9 458.2Current assetsDebtors 3 185.0 81.6
185.0 81.6Current liabilitiesCreditors – amounts falling due within one year 4 (291.0) (205.5)
Net current liabilities (106.0) (123.9)Total assets less current liabilities 356.9 334.3
Net assets 356.9 334.3
Capital and reserves Equity share capital 6 5.9 6.1
Capital redemption reserve 6 40.6 40.4
Share premium account 6 147.6 147.6
Profit and loss account 6 162.8 140.2
Capital and reserves attributable to shareholders 356.9 334.3
There are no other recognised gains and losses.
The financial statements of QinetiQ Group plc (company number 4586941) were approved by the Board of Directors and authorised for issue on 26 May 2016 and were signed on its behalf by:
Mark Elliott Chairman
Steve Wadey Chief Executive Officer
David Mellors Chief Financial Officer
Company balance sheet as at 31 March
QinetiQ Group plc Annual Report and Accounts 2016 145
Strategic report Governance Financial statements Additional information

all figures in £ millionIssued share
capital
Capital redemption
reserveShare
premiumProfit
and lossTotal
equity
At 1 April 2015 6.1 40.4 147.6 140.2 334.3
Profit for the year – – – 97.8 97.8
Purchase of own shares – – – (0.7) (0.7)
Purchase and cancellation of shares (0.2) 0.2 – (46.9) (46.9)
Dividend paid – – – (32.3) (32.3)
Share-based payments – – – 4.7 4.7
At 31 March 2016 5.9 40.6 147.6 162.8 356.9
At 1 April 2014 6.6 39.9 147.6 275.6 469.7
Profit for the year – – – 0.2 0.2
Purchase of own shares – – – (0.6) (0.6)
Purchase and cancellation of shares (0.5) 0.5 – (107.1) (107.1)
Share-based payments – settlement – – – 0.6 0.6
Dividend paid – – – (31.7) (31.7)
Share-based payments – – – 3.2 3.2
At 31 March 2015 6.1 40.4 147.6 140.2 334.3
The capital redemption reserve is not distributable and was created following redemption of preference share capital.
Notes to the company financial statements
1. Accounting policiesThe following accounting policies have been applied consistently in dealing with items which are considered material in relation to the company’s financial statements.
Basis of preparationThe financial statements have been prepared under the historical cost convention and in accordance with applicable UK Accounting Standards. As permitted by section 408(4) of the Companies Act 2006, a separate profit and loss account dealing with the results of the company has not been presented.
These financial statements were prepared in accordance with Financial Reporting Standard 101 Reduced Disclosure Framework (“FRS 101”). In preparing these financial statements, the company applies the recognition, measurement and disclosure requirements of International Financial Reporting Standards as adopted by the EU (“Adopted IFRSs”), but makes amendments where necessary in order to comply with Companies Act 2006 and has set out below where advantage of the FRS 101 disclosure exemptions has been taken.
• A Cash Flow Statement and related notes;• Disclosures in respect of transactions with wholly owned subsidiaries;• Disclosures in respect of capital management;• The effects of new but not yet effective IFRSs;• Disclosures in respect of the compensation of Key Management Personnel;• Disclosures of transactions with a management entity that provides key management personnel services to the company;• IFRS 2 Share Based Payments in respect of Group settled share based payments; and• Certain disclosures required by IFRS 13 Fair Value Measurement and the disclosures required by IFRS 7.
In the transition to FRS 101, the company has applied IFRS 1 whilst ensuring that its assets and liabilities are measured in compliance with FRS 101. No adjustments were required as part of that transition.
InvestmentsIn the company’s financial statements, investments in subsidiary undertakings are stated at cost less any impairment in value.
Share-based paymentsThe fair value of equity-settled awards for share-based payments is determined on grant and expensed straight line over the period from grant to the date of earliest unconditional exercise. The fair value of cash-settled awards for share-based payments is determined at each period end until they are exercised or lapse. The value is expensed straight line over the period from grant to the date of earliest unconditional exercise. The charges for both equity and cash-settled share-based payments are updated annually for non-market-based vesting conditions. Further details of the Group’s share-based payment charge are disclosed in note 30 to the Group financial statements. The cost of share-based payments is charged to subsidiary undertakings.
Company statement of changes in equity for the year ended 31 March
QinetiQ Group plc Annual Report and Accounts 2016146

2. Investment in subsidiary undertakingAs at 31 March
all figures in £ million 2016 2015
Subsidiary undertaking – 100% of ordinary share capital of QinetiQ Group Holdings Limited 424.3 424.3
Capital contributions arising from share-based payments to employees of subsidiaries 38.6 33.9
462.9 458.2
A list of all principal subsidiary undertakings of QinetiQ Group plc is disclosed in note 35 to the Group financial statements.
3. Debtors As at 31 March
all figures in £ million 2016 2015
Amounts owed by Group undertakings 185.0 81.6
Amounts owed by Group undertakings includes a dividend from its subsidiary of £100m (2015: nil) received during the year.
4. CreditorsAs at 31 March
all figures in £ million 2016 2015
Amounts owed to Group undertakings 291.0 205.5
5. Share capitalThe company’s share capital is disclosed in note 29 to the Group financial statements.
6. Share-based paymentsThe company’s share-based payment arrangements are set out in note 30 to the Group financial statements.
7. Other informationDirectors’ emoluments, excluding company pension contributions, were £3.6m (2015: £2.9m). These emoluments were all in relation to services provided on behalf of the QinetiQ Group with no amount specifically relating to their work for the company.
Details of the Directors’ emoluments, share schemes and entitlements under money purchase pension schemes are disclosed in the Remuneration Report.
The remuneration of the company’s auditor for the year to 31 March 2016 was £170,000 (2015: £178,000), which was for audit of the Group’s annual accounts and audit related assurance services. No other services were provided by the auditor to the company.
QinetiQ Group plc Annual Report and Accounts 2016 147
Strategic report Governance Financial statements Additional information

2016 2015 2014 20133 20122,3
EMEA Services (formerly UK Services) £m 616.4 625.6 607.0 594.6 620.9
Global Products £m 139.3 138.2 175.6 269.4 325.0
Revenue – continuing operations £m 755.7 763.8 782.6 864.0 945.9
Discontinued operations (US Services) £m – 55.7 408.8 463.8 523.7
Revenue – total Group £m 755.7 819.5 1,191.4 1,327.8 1,469.6
EMEA Services (formerly UK Services) £m 93.8 93.0 86.7 84.8 56.3
Global Products £m 15.1 18.3 27.0 60.2 66.2
Underlying operating profit1 – continuing operations £m 108.9 111.3 113.7 145.0 122.5
Discontinued operations (US Services) £m – 1.2 19.0 23.7 37.1
Underlying operating profit1 – total Group £m 108.9 112.5 132.7 168.7 159.6
Profit/(loss) before tax £m 97.7 92.9 4.1 (137.0) 316.3
Profit/(loss) attributable to equity shareholders £m 106.1 104.7 (12.7) (133.2) 246.3
Underlying basic EPS1 Pence 16.3 15.3 16.0 18.9 13.6
Basic EPS Pence 18.1 16.6 (1.9) (20.5) 37.9
Diluted EPS Pence 18.0 16.5 (1.9) (20.5) 37.6
Dividend per share Pence 5.7 5.4 4.6 3.8 2.9
Underlying net cash from operations (post capex)1 £m 103.6 116.7 136.5 175.9 235.4
Net cash/(debt) £m 274.5 195.5 170.5 74.0 (122.2)
Average number of employees 6,266 6,454 9,134 9,772 10,637
Continuing operations4:Orders £m 659.8 613.6 596.9 626.1 706.8
Underlying operating margin1 % 14.4 14.6 14.5 16.8 13.0
Underlying profit before tax1 £m 108.7 107.8 101.2 128.4 73.1
Profit before tax £m 90.2 105.4 84.0 103.7 288.3
Profit after tax £m 98.6 117.4 68.0 89.9 233.9
Underlying basic EPS1 Pence 16.3 15.2 13.8 16.6 10.5
Basic EPS Pence 16.8 18.6 10.4 13.9 36.0
Underlying net cash from operations (post capex)1 £m 103.6 114.9 106.2 137.7 217.3
1 Underlying measures are stated before specific adjusting items. Definitions of underlying measures of performance are in the glossary on page 149. Underlying financial measures are presented because the Board believes these provide a better representation of the Group’s long-term performance trend. For details of specific adjusting items refer to note 4 of the financial statements.
2 IAS19 (revised) ‘Employee Benefits’ was adopted for 2013 and the 2012 comparatives have been restated accordingly.3 The 2013 figures have been restated to reflect the reclassification of product sales from UK Services to Global Products and the reclassification of Cyveillance® from US Services
to EMEA Services. 2012 has also been restated to reflect the reclassification of Cyveillance® from US Services to EMEA Services.4 Continuing operations excludes the financial results of the US Services business disposed in 2015.
Five-year record For the years ended 31 March (unaudited)
QinetiQ Group plc Annual Report and Accounts 2016148

Glossary
AGM Annual General Meeting
ASD15 At-Sea-Demonstration 2015
CAGR Compound Annual Growth Rate
C4ISR Command, control, communications, computers, intelligence, surveillance and reconnaissance
COTS Commercial off the shelf
CPI Consumer Price Index
CR Corporate Responsibility
CRC Carbon Reduction Commitment
CSR Corporate Social Responsibility
DAB Deferred Annual Bonus
defra Department for Environment, Food and Rural Affairs
DE&S MOD’s Defence, Equipment and Support organisation
DHS US Department of Homeland Security
DoD US Department of Defense
EBITDA Earnings before interest, tax, depreciation and amortisation
EMEA Europe, Middle East and Australasia
EPS Earnings per share
ESA European Space Agency
ESOS Energy Savings Opportunity Scheme
EST Engineering, Science and Technical
FAR Federal Acquisition Regulations
FMI Foster-Miller, Inc. – the legal entity through which the US Products division operates
Funded backlog
The expected future value of revenue from contractually committed and funded customer orders (excluding the £998m third-term re-pricing of the LTPA contract)
GHG Greenhouse gas
IAS International Accounting Standards
IFRS International Financial Reporting Standards
IRAD Internal research and development
ISS International Space Station
KPI Key Performance Indicator
LIBID London inter-bank bid rate
LIBOR London inter-bank offered rate
LTI Lost time incident
LTPA Long Term Partnering Agreement – 25-year contract established in 2003 to manage the MOD’s test and evaluation ranges
MOD UK Ministry of Defence
MSCA Maritime Strategic Capability Agreement
OHSAS Occupational Health and Safety Advisory Services
Orange book Single-source pricing regulations used by UK Government from 1 April 2015. Replaces the Yellow book regulations
Organic growth The level of year-on-year growth, expressed as a percentage, calculated at constant foreign exchange rates, adjusting comparatives to incorporate the results of acquired entities but excluding the results for any disposals or discontinued operations for the same duration of ownership as the current period
PBT Profit before tax
PSP Performance Share Plan
QLZ QinetiQ Learning Zone
QNA QinetiQ North America
QSOS QinetiQ Share Option Scheme
R&D Research and development
RSU Restricted Stock Unit
SEMAP Systems Engineering Master Apprenticeship Programme
Specific adjusting items
Amortisation of intangible assets arising from acquisitions; impairment of goodwill and intangible assets; gains/losses on business divestments and disposal of property and investments; net pension finance expense; net restructuring charges/ recoveries; tax on the preceding items; one-off recovery of research and development tax credits and associated write-off of tax losses; and other significant non-recurring deferred tax movements
SDSR Strategic Defence and Security Review
SPA Special protection area
SSRO Single Source Regulations Office
SSSI Site of Special Scientific Interest
STEM Science, Technology, Engineering and Maths
TSR Total shareholder return
UAV Unmanned aerial vehicle
UK Corporate Governance Code
Guidelines of the Financial Reporting Council to address the principal aspects of corporate governance
UK GAAP UK Generally Accepted Accounting Practice
Underlying basic earnings per share
Basic earnings per share as adjusted to exclude ‘specific adjusting items’
Underlying effective tax rate
The tax charge for the year excluding the tax impact of ‘specific adjusting items’ expressed as a percentage of underlying profit before tax
Underlying net cash from operations (post capex)
Net cash inflow from operations before cash flows of specific adjusting items, less net cash outflow on purchase/sale of intangible assets and property, plant and equipment
Underlying net finance costs
Net finance costs excluding net pension finance costs
Underlying operating cash conversion
The ratio of underlying net cash from operations (post capex) to underlying operating profit excluding share of post-tax result of equity-accounted joint ventures and associates
Underlying operating margin
Underlying operating profit expressed as a percentage of revenue
Underlying operating profit
Operating profit as adjusted to exclude ‘specific adjusting items’
Underlying profit before tax
Profit before tax as adjusted to exclude ‘specific adjusting items’
VSP Value Sharing Plan
QinetiQ Group plc Annual Report and Accounts 2016 149
Strategic report Governance Financial statements Additional information

Shareholding enquiriesThe company’s registrar is Equiniti. Enquiries regarding your shareholding, including the following administrative matters, should be addressed to Equiniti:• Change of personal details such as change of name or address.• Lost share certificates.• Dividend payment enquiries.• Direct dividend payments. You can have your dividends paid
directly into a UK bank or building society account by completing a dividend mandate form. The associated dividend confirmation will still be sent to your registered address. If you live outside the UK, Equiniti offers a global payments service which is available in certain countries and could enable you to receive your dividends direct into your bank account in your local currency.
Contact details for registrarBy post:Equiniti LimitedAspect HouseSpencer RoadLancingWest SussexBN99 6DA
By telephone:0371 384 2021* for UK calls+44 (0)121 415 7576 for calls from outside the UK.
* Lines are open 8.30am to 5.30pm (UK time), Monday to Friday (excluding public holidays in England and Wales).
By email:You can send an email enquiry securely from Equiniti’s website, at https://help.shareview.co.uk.
Online:Equiniti’s website at https://help.shareview.co.uk (Shareview) includes answers to frequently asked questions and provides key forms for download. Shareview also offers online access to your shareholding where you can manage your account, register for electronic communications, see details of balance movements and complete certain amendments online, such as changes to dividend mandate instructions. You can register at www.shareview.co.uk, click on ‘Register’ and follow the steps.
Electronic communicationsThe company offers shareholders the option to receive documentation and communications electronically, via the company’s website. The wider use of electronic communications enables fast receipt of documents, reduces the company’s printing, paper and postal costs and reduces the company’s environmental impact. Shareholders can register for electronic communications at www.shareview.co.uk and may also cast their vote for the 2016 Annual General Meeting online quickly and easily using the Sharevote service by visiting www.sharevote.co.uk.
Dividend Tax ChangesFrom 6 April 2016, the dividend tax credit has been replaced by an annual tax-free dividend allowance of £5,000. UK residents will pay tax on dividends received over that amount at specified rates. Dividends paid on shares held within pensions and Individual Savings Accounts will continue to be tax-free. Further information is available from HMRC at www.gov.uk/government/publications/dividend-allowance-factsheet.
Donating shares to charity – ShareGiftSmall parcels of shares, which may be uneconomic to sell on their own, can be donated to ShareGift, the share donation charity (registered charity no. 1052686). ShareGift transfers these holdings into their name, aggregates them, and uses the proceeds to support a wide range of UK charities based on donor suggestion. If you would like further details about ShareGift, please visit www.sharegift.org, email [email protected] or telephone them on 020 7930 3737.
Share priceDetails of current and historical share prices can be found on the company’s website at www.QinetiQ.com/investors. The graph below shows the share price trend during the year ended 31 March 2016:
31 Mar 15 31 May 15 31 Jul 15 30 Sep 15 30 Nov 15 31 Jan 16 31 Mar 16140
160
180
200
220
240
260
280
The share prices used in the graph above are the mid-market prices as derived from the London Stock Exchange Daily Official List.
Analysis of Share Register at 31 March 2016
By type of holderNumber of
holdings% of total
holdingsShares
held% of share
capital
Individuals 5,739 86.84% 5,833,438 0.99%
Institutions and others 870 13.16% 580,847,762 99.01%
Total 6,609 100.00% 586,681,200 100.00%By size of holding
1–500 4,258 64.43% 855,323 0.15%
501–1,000 580 8.78% 469,469 0.08%
1,001–5,000 1,103 16.69% 2,700,065 0.46%
5,001–10,000 191 2.89% 1,412,499 0.24%
10,001–100,000 234 3.54% 7,230,020 1.23%
Over 100,000 243 3.67% 574,013,824 97.84%
Total 6,609 100.00% 586,681,200 100.00%
Shareholder information
QinetiQ Group plc Annual Report and Accounts 2016150

Beware of share fraudFraudsters use persuasive and high-pressure tactics to lure investors into scams. They may offer to sell shares that turn out to be worthless or non-existent, or to buy shares at an inflated price in return for an upfront payment. While high profits are promised, if you buy or sell shares in this way you will probably lose your money.
How to avoid share fraud 1. Keep in mind that firms authorised by the FCA are unlikely to
contact you out of the blue with an offer to buy or sell shares. 2. Do not get into a conversation, note the name of the person and
firm contacting you and then end the call. 3. Check the Financial Services Register from www.fca.org.uk to see
if the person and firm contacting you is authorised by the FCA. 4. Beware of fraudsters claiming to be from an authorised firm,
copying its website or giving you false contact details. 5. Use the firm’s contact details listed on the Register if you want
to call it back. 6. Call the FCA on 0800 111 6768 if the firm does not have contact
details on the Register or you are told they are out of date. 7. Search the list of unauthorised firms to avoid at
www.fca.org.uk/scams. 8. Consider that if you buy or sell shares from an unauthorised firm
you will not have access to the Financial Ombudsman Service or Financial Services Compensation Scheme.
9. Think about getting independent financial and professional advice before you hand over any money.
10. Remember: if it sounds too good to be true, it probably is!
Report a scam• If you are approached by fraudsters please tell the FCA using the
share fraud reporting form at www.fca.org.uk/scams, where you can find out more about investment scams.
• You can also call the FCA Consumer Helpline on 0800 111 6768. • If you have already paid money to share fraudsters you should
contact Action Fraud on 0300 123 2040.
Key dates20 July 2016 Trading update
20 July 2016 Annual General Meeting
4 August 2016 Ordinary shares marked ex-dividend
5 August 2016 Final 2016 dividend record date
2 September 2016 Final 2016 dividend payment date
30 September 2016 Half-year financial period end
17 November 2016 Half-year results announcement
February 2017 Trading update (provisional date)
31 March 2017 Financial year end
May 2017 Preliminary results announcement (provisional date)
QinetiQ Group plc Annual Report and Accounts 2016 151
Strategic report Governance Financial statements Additional information

Cautionary statementAll statements other than statements of historical fact included in this Annual Report, including, without limitation, those regarding the financial condition, results, operations and businesses of QinetiQ and its strategy, plans and objectives and the markets and economies in which it operates, are forward-looking statements. Such forward-looking statements, which reflect management’s assumptions made on the basis of information available to it at this time, involve known and unknown risks, uncertainties and other important factors which could cause the actual results, performance or achievements of QinetiQ or the markets and economies in which QinetiQ operates to be materially different from future results, performance or achievements expressed or implied by such forward-looking statements. Nothing in this Annual Report should be regarded as a profit forecast.
This Annual Report is intended to provide information to shareholders and is not designed to be relied upon by any other party. The company and its Directors accept no liability to any other person other than under English law.
Additional information
Company informationRegistered officeCody Technology Park Ively Road Farnborough HampshireGU14 0LXTel: +44 (0) 1252 392000Company Registration Number: 4586941
AuditorKPMG LLPChartered Accountants 15 Canada Square LondonE14 5GL
RegistrarEquinitiAspect House Spencer Road LancingWest Sussex BN99 6DA
Advisors Corporate brokersJ.P.Morgan25 Bank Street LondonE14 5JP
Bank of America Merrill Lynch 2 King Edward StreetLondonEC1A 1HQ
Principal legal advisor Ashurst LLP Broadwalk House5 Appold StreetLondonEC2A 2HA
QinetiQ Group plc Annual Report and Accounts 2016152

This report is printed on Claro Silk paper. Manufactured at a mill that is FSC® accredited. Certified to both ISO 14001 Environmental Standard and to the European Eco-Management and Audit Scheme.
Printed by Westerham (Principal Colour). Principal Colour are ISO 14001 certified, Alcohol Free and FSC® Chain of Custody certified.
Designed and produced by SampsonMay Telephone: 020 7403 4099 www.sampsonmay.com

Registered officeCody Technology ParkIvely Road, FarnboroughHampshire GU14 0LXUnited Kingdom
Tel: +44 (0) 1252 392000www.QinetiQ.com
Company Registration Number4586941© QinetiQ Group plc