Beaumont 02
34
Chapter 3 Petroleum Systems by Leslie B. Magoon and Edward A. Beaumont
description
petroleo
Transcript of Beaumont 02
Chapter 3
Petroleum Systems
by
Leslie B. Magoon
and
Edward A. Beaumont
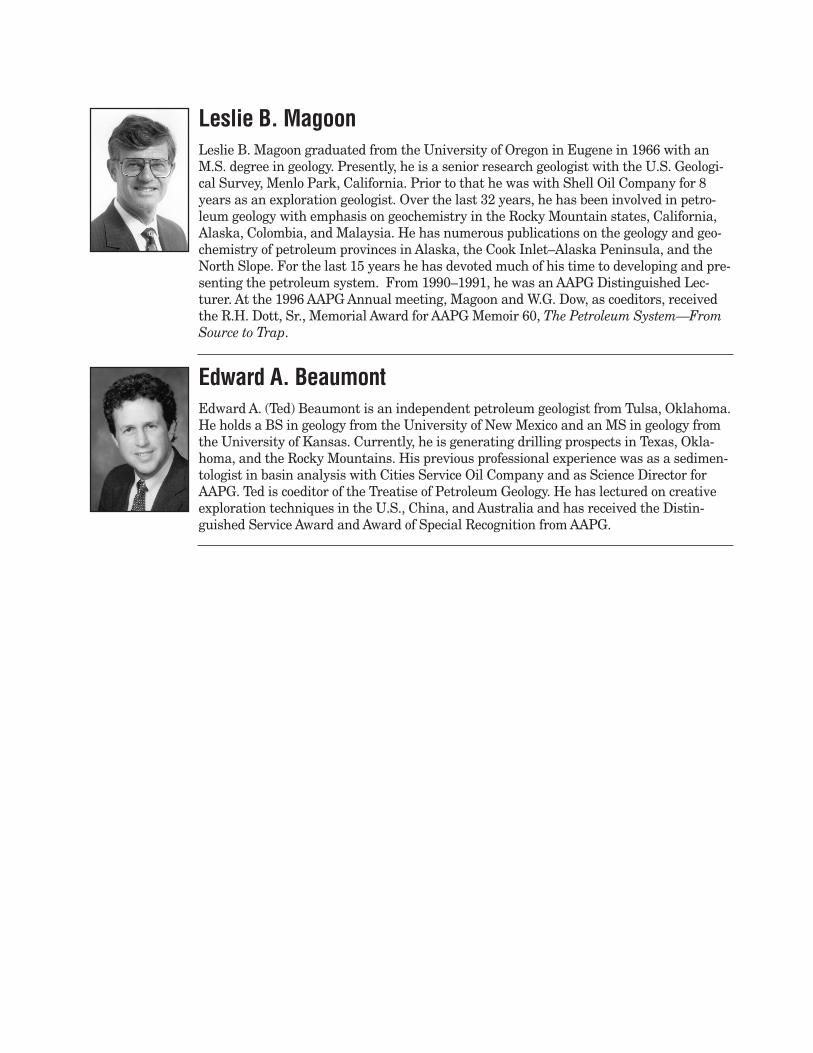
Leslie B. MagoonLeslie B. Magoon graduated from the University of Oregon in Eugene in 1966 with anM.S. degree in geology. Presently, he is a senior research geologist with the U.S. Geologi-cal Survey, Menlo Park, California. Prior to that he was with Shell Oil Company for 8years as an exploration geologist. Over the last 32 years, he has been involved in petro-leum geology with emphasis on geochemistry in the Rocky Mountain states, California,Alaska, Colombia, and Malaysia. He has numerous publications on the geology and geo-chemistry of petroleum provinces in Alaska, the Cook Inlet–Alaska Peninsula, and theNorth Slope. For the last 15 years he has devoted much of his time to developing and pre-senting the petroleum system. From 1990–1991, he was an AAPG Distinguished Lec-turer. At the 1996 AAPG Annual meeting, Magoon and W.G. Dow, as coeditors, receivedthe R.H. Dott, Sr., Memorial Award for AAPG Memoir 60, The Petroleum System—FromSource to Trap.
Edward A. BeaumontEdward A. (Ted) Beaumont is an independent petroleum geologist from Tulsa, Oklahoma.He holds a BS in geology from the University of New Mexico and an MS in geology fromthe University of Kansas. Currently, he is generating drilling prospects in Texas, Okla-homa, and the Rocky Mountains. His previous professional experience was as a sedimen-tologist in basin analysis with Cities Service Oil Company and as Science Director forAAPG. Ted is coeditor of the Treatise of Petroleum Geology. He has lectured on creativeexploration techniques in the U.S., China, and Australia and has received the Distin-guished Service Award and Award of Special Recognition from AAPG.
Overview • 3-3
Overview
This chapter discusses the concept and use of petroleum systems. It describes what petro-leum systems are and how they can be identified and mapped.
Introduction
This chapter contains the following sections.
Section Topic Page
A Defining a Petroleum System 3–4
B Examples of Two Petroleum Systems 3–14
C Applying the Petroleum System Concept 3–24
D References 3–34
In this chapter
3-4 • Petroleum Systems
Section A
Defining a Petroleum System
The first step in petroleum system analysis is petroleum system definition. This sectiondiscusses what the concept of a petroleum system is; how to identify and name a system;how the components relate geographically, stratigraphically, and temporally; and how tomap a petroleum system.
Introduction
This section contains the following topics.
Topic Page
The Petroleum System Concept 3–5
Identifying a Petroleum System 3–6
Naming a Petroleum System 3–7
Geographic, Stratigraphic, and Temporal Extent 3–9
Size of a Petroleum System 3–12
Mapping a Petroleum System 3–13
In this section
Defining a Petroleum System • 3-5
The petroleum system is a unifying concept that encompasses all of the disparate ele-ments and processes of petroleum geology. Practical application of petroleum systems canbe used in exploration, resource evaluation, and research. This chapter discusses itsapplication to petroleum exploration.
Introduction
The Petroleum System Concept
A petroleum system encompasses a pod of active source rock and all genetically related oiland gas accumulations. It includes all the geologic elements and processes that are essen-tial if an oil and gas accumulation is to exist.
Petroleum describes a compound that includes high concentrations of any of the follow-ing substances:• Thermal and biological hydrocarbon gas found in conventional reservoirs as well as in
gas hydrates, tight reservoirs, fractured shale, and coal• Condensates• Crude oils• Natural bitumen in reservoirs, generally in siliciclastic and carbonate rocks
System describes the interdependent elements and processes that form the functionalunit that creates hydrocarbon accumulations.
What is apetroleumsystem?
The essential elements of a petroleum system include the following:• Source rock• Reservoir rock• Seal rock• Overburden rock
Petroleum systems have two processes:• Trap formation• Generation–migration–accumulation of hydrocarbons
These essential elements and processes must be correctly placed in time and space so thatorganic matter included in a source rock can be converted into a petroleum accumulation.A petroleum system exists wherever all these essential elements and processes are knownto occur or are thought to have a reasonable chance or probability to occur.
Elements andprocesses
A petroleum system investigation identifies, names, determines the level of certainty, andmaps the geographic, stratigraphic, and temporal extent of a petroleum system. Theinvestigation includes certain components:• Petroleum–petroleum geochemical correlation• Petroleum–source rock geochemical correlation• Burial history chart• Petroleum system map• Petroleum system cross section• Events chart• Table of hydrocarbon accumulations• Determination of generation–accumulation efficiency
Petroleumsysteminvestigation
3-6 • Petroleum Systems
Before a petroleum system can be investigated, it must be identified as being present.Introduction
Identifying a Petroleum System
To identify a petroleum system, the explorationist must find some petroleum. Any quan-tity of petroleum, no matter how small, is proof of a petroleum system. An oil or gas seep,a show of oil or gas in a well, or an oil or gas accumulation demonstrates the presence of apetroleum system.
Petroleumsystemidentification
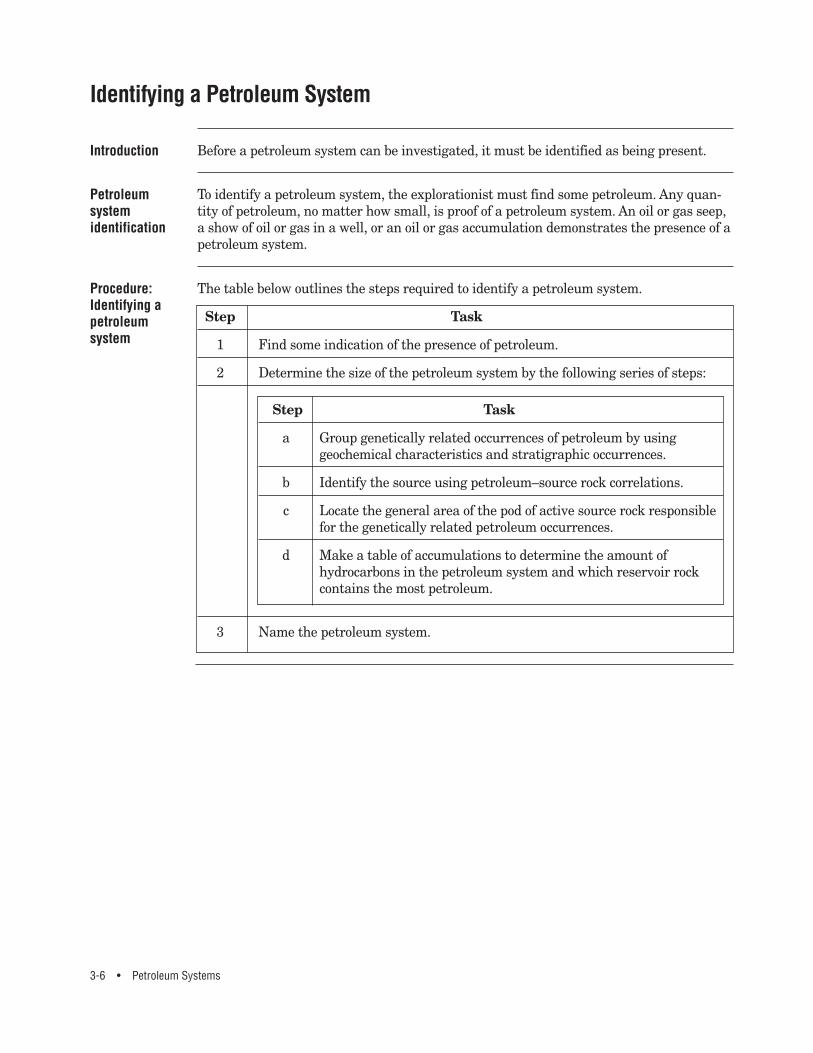
The table below outlines the steps required to identify a petroleum system.
Step Task
1 Find some indication of the presence of petroleum.
2 Determine the size of the petroleum system by the following series of steps:
3 Name the petroleum system.
Procedure:Identifying apetroleumsystem
Step Task
a Group genetically related occurrences of petroleum by using geochemical characteristics and stratigraphic occurrences.
b Identify the source using petroleum–source rock correlations.
c Locate the general area of the pod of active source rock responsible for the genetically related petroleum occurrences.
d Make a table of accumulations to determine the amount of hydrocarbons in the petroleum system and which reservoir rock contains the most petroleum.
Defining a Petroleum System • 3-7
A unique designation or name is important to identify a person, place, item, or idea. Asgeologists, we name rock units, fossils, uplifts, and basins. The name for a specific petro-leum system separates it from other petroleum systems and other geologic names.
Introduction
Naming a Petroleum System
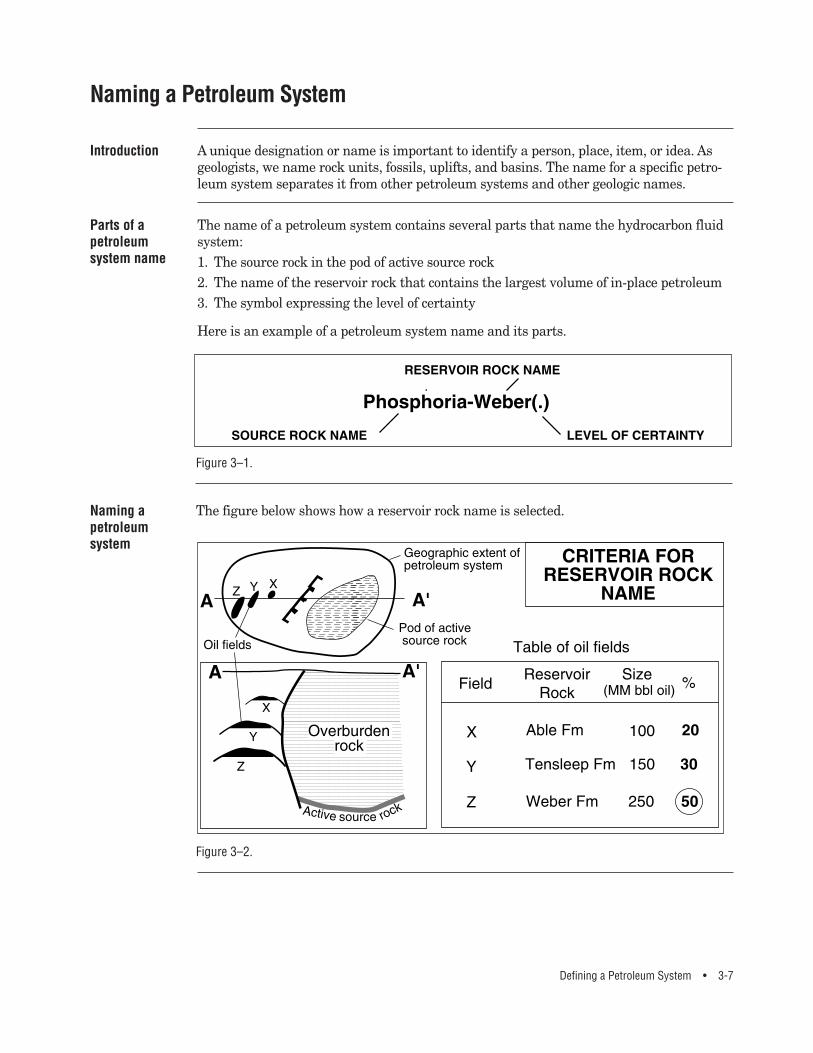
The name of a petroleum system contains several parts that name the hydrocarbon fluidsystem:1. The source rock in the pod of active source rock2. The name of the reservoir rock that contains the largest volume of in-place petroleum3. The symbol expressing the level of certainty
Here is an example of a petroleum system name and its parts.
Parts of apetroleumsystem name
Naming apetroleumsystem
The figure below shows how a reservoir rock name is selected.
Figure 3–1.
Figure 3–2.
�������������������������������������������
�������������������������������������������
�������������������������������������������
�������������������������������������������
�������������������������������������������
�������������������������������������������
�������������������������������������������
�������������������������������������������
�������������������������������������������
�������������������������������������������
�������������������������������������������
�������������������������������������������
�������������������������������������������
����
3-8 • Petroleum Systems
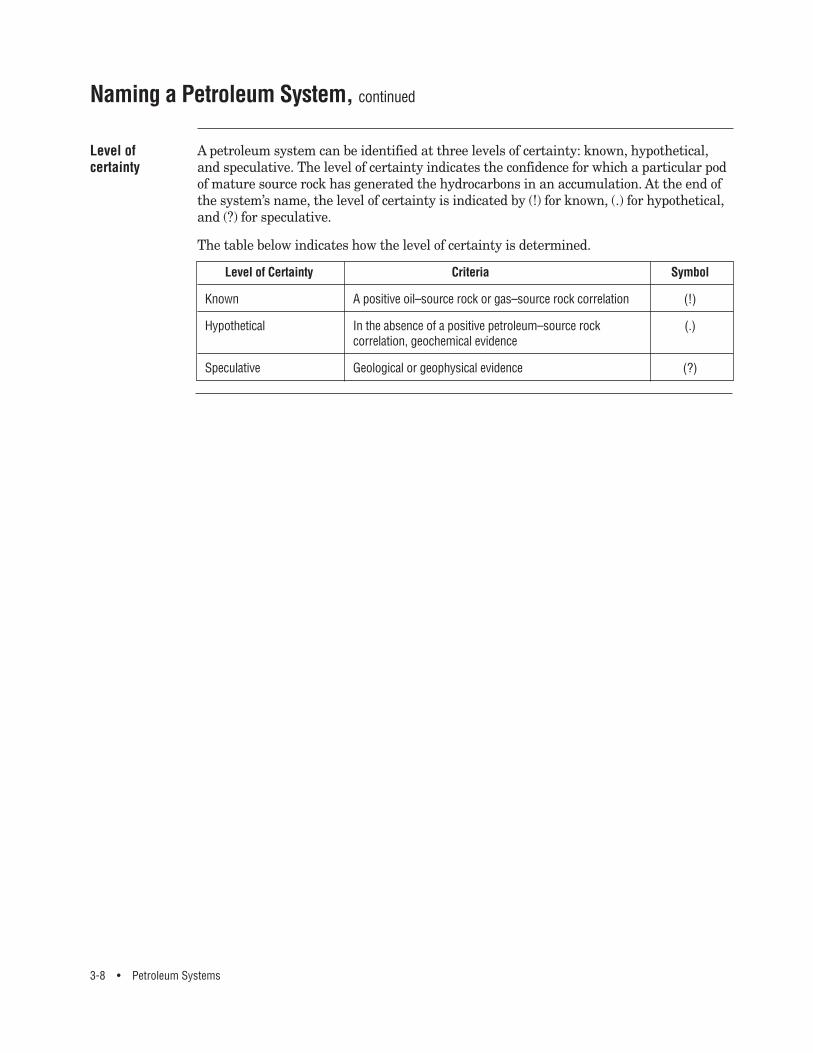
A petroleum system can be identified at three levels of certainty: known, hypothetical,and speculative. The level of certainty indicates the confidence for which a particular podof mature source rock has generated the hydrocarbons in an accumulation. At the end ofthe system’s name, the level of certainty is indicated by (!) for known, (.) for hypothetical,and (?) for speculative.
The table below indicates how the level of certainty is determined.
Level of Certainty Criteria Symbol
Known A positive oil–source rock or gas–source rock correlation (!)
Hypothetical In the absence of a positive petroleum–source rock (.)correlation, geochemical evidence
Speculative Geological or geophysical evidence (?)
Level ofcertainty
Naming a Petroleum System, continued
Defining a Petroleum System • 3-9
Petroleum systems are limited by time and space. Each system can be described in termsof its own unique temporal and spatial elements and processes.
Introduction
Geographic, Stratigraphic, and Temporal Extent
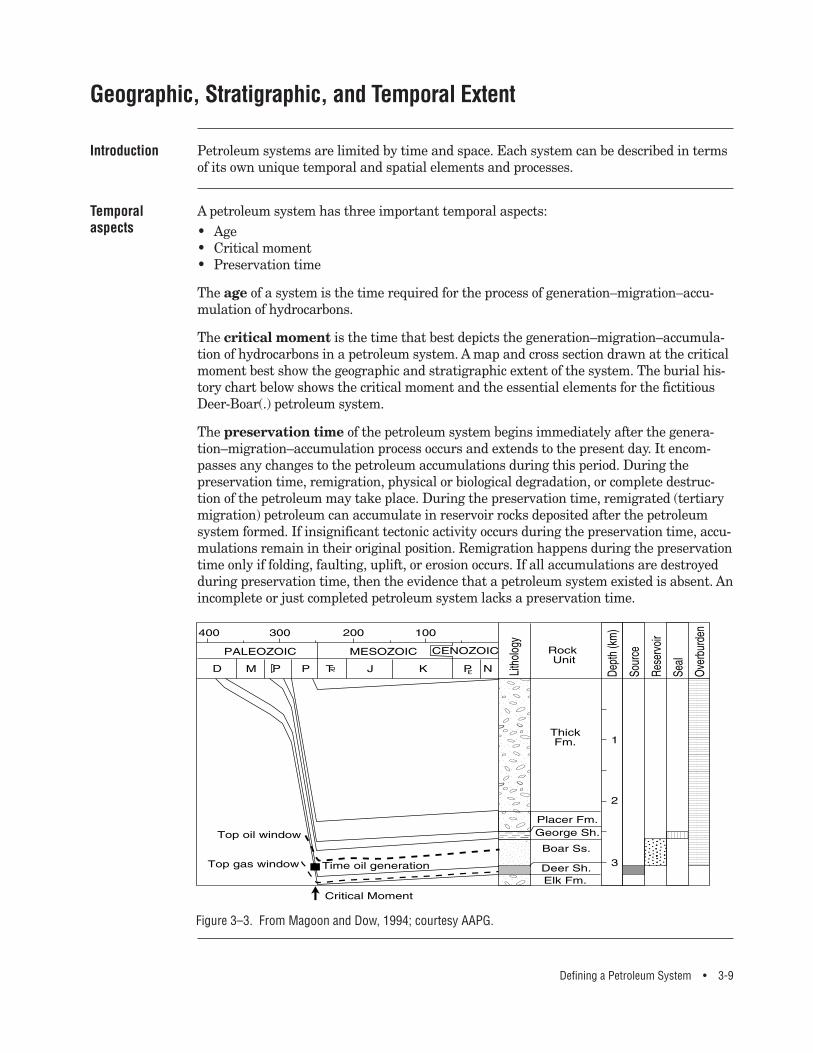
A petroleum system has three important temporal aspects: • Age • Critical moment • Preservation time
The age of a system is the time required for the process of generation–migration–accu-mulation of hydrocarbons.
The critical moment is the time that best depicts the generation–migration–accumula-tion of hydrocarbons in a petroleum system. A map and cross section drawn at the criticalmoment best show the geographic and stratigraphic extent of the system. The burial his-tory chart below shows the critical moment and the essential elements for the fictitiousDeer-Boar(.) petroleum system.
The preservation time of the petroleum system begins immediately after the genera-tion–migration–accumulation process occurs and extends to the present day. It encom-passes any changes to the petroleum accumulations during this period. During thepreservation time, remigration, physical or biological degradation, or complete destruc-tion of the petroleum may take place. During the preservation time, remigrated (tertiarymigration) petroleum can accumulate in reservoir rocks deposited after the petroleumsystem formed. If insignificant tectonic activity occurs during the preservation time, accu-mulations remain in their original position. Remigration happens during the preservationtime only if folding, faulting, uplift, or erosion occurs. If all accumulations are destroyedduring preservation time, then the evidence that a petroleum system existed is absent. Anincomplete or just completed petroleum system lacks a preservation time.
Temporalaspects
����
������������
���
�
������������
������������
������������
������������
������������
������������
�����������
������������
������������
������������
������������
������������
�����������
Figure 3–3. From Magoon and Dow, 1994; courtesy AAPG.
����������������� ��
������
���������������������� �
�
3-10 • Petroleum Systems
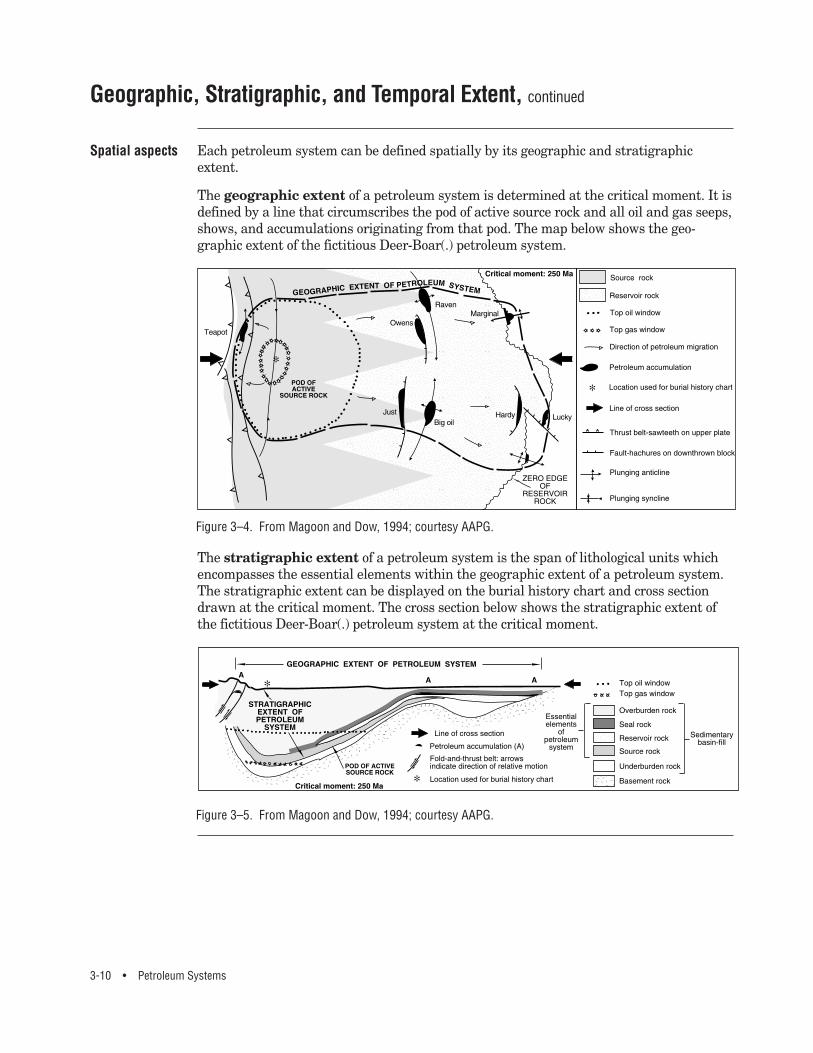
Each petroleum system can be defined spatially by its geographic and stratigraphicextent.
The geographic extent of a petroleum system is determined at the critical moment. It isdefined by a line that circumscribes the pod of active source rock and all oil and gas seeps,shows, and accumulations originating from that pod. The map below shows the geo-graphic extent of the fictitious Deer-Boar(.) petroleum system.
Spatial aspects
Geographic, Stratigraphic, and Temporal Extent, continued
The stratigraphic extent of a petroleum system is the span of lithological units whichencompasses the essential elements within the geographic extent of a petroleum system.The stratigraphic extent can be displayed on the burial history chart and cross sectiondrawn at the critical moment. The cross section below shows the stratigraphic extent ofthe fictitious Deer-Boar(.) petroleum system at the critical moment.
Figure 3–4. From Magoon and Dow, 1994; courtesy AAPG.
Figure 3–5. From Magoon and Dow, 1994; courtesy AAPG.
������������������������
��������������������������
������������������������������������������
����������������
����
Defining a Petroleum System • 3-11
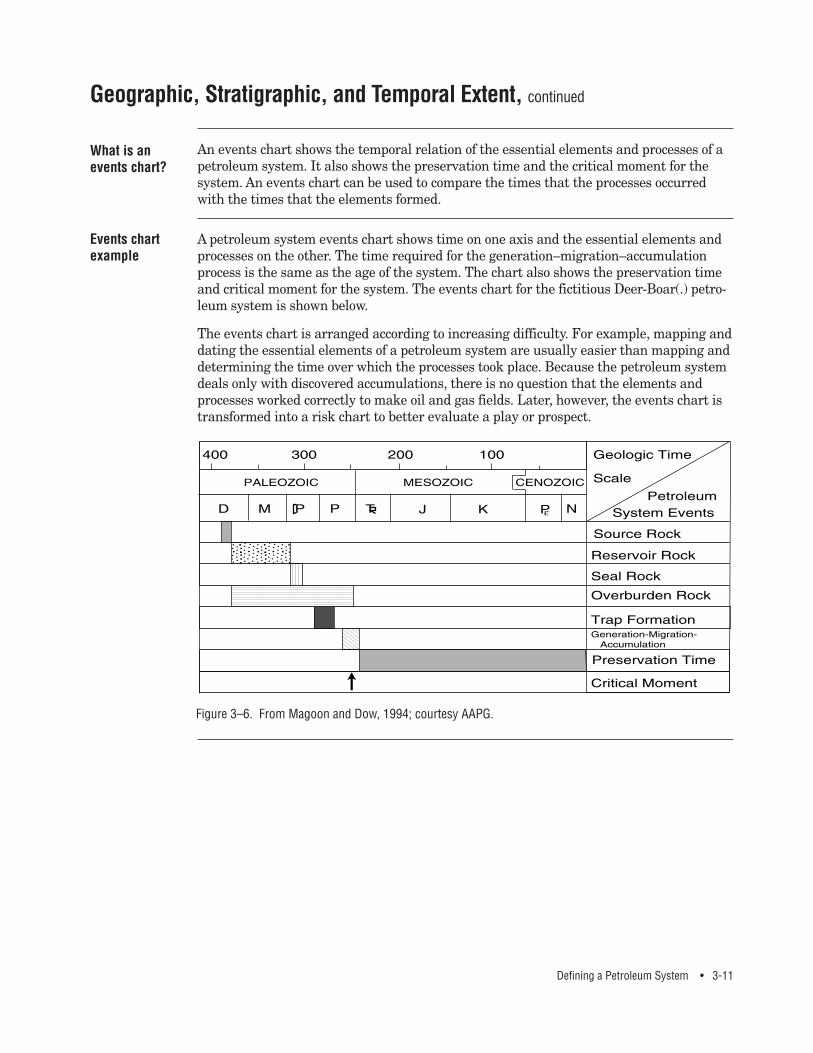
An events chart shows the temporal relation of the essential elements and processes of apetroleum system. It also shows the preservation time and the critical moment for thesystem. An events chart can be used to compare the times that the processes occurredwith the times that the elements formed.
What is anevents chart?
Geographic, Stratigraphic, and Temporal Extent, continued
A petroleum system events chart shows time on one axis and the essential elements andprocesses on the other. The time required for the generation–migration–accumulationprocess is the same as the age of the system. The chart also shows the preservation timeand critical moment for the system. The events chart for the fictitious Deer-Boar(.) petro-leum system is shown below.
The events chart is arranged according to increasing difficulty. For example, mapping anddating the essential elements of a petroleum system are usually easier than mapping anddetermining the time over which the processes took place. Because the petroleum systemdeals only with discovered accumulations, there is no question that the elements andprocesses worked correctly to make oil and gas fields. Later, however, the events chart istransformed into a risk chart to better evaluate a play or prospect.
Events chartexample
Figure 3–6. From Magoon and Dow, 1994; courtesy AAPG.
�������������
�����
�����������������
�
���������
���������
���������
���������
���������
���������
3-12 • Petroleum Systems
The size of a petroleum system includes the total volume of all recoverable hydrocarbonsthat originated from a single pod of active source rock. This total volume is used to com-pare against other petroleum systems and to determine the generation–accumulationefficiency.
Introduction
Size of a Petroleum System
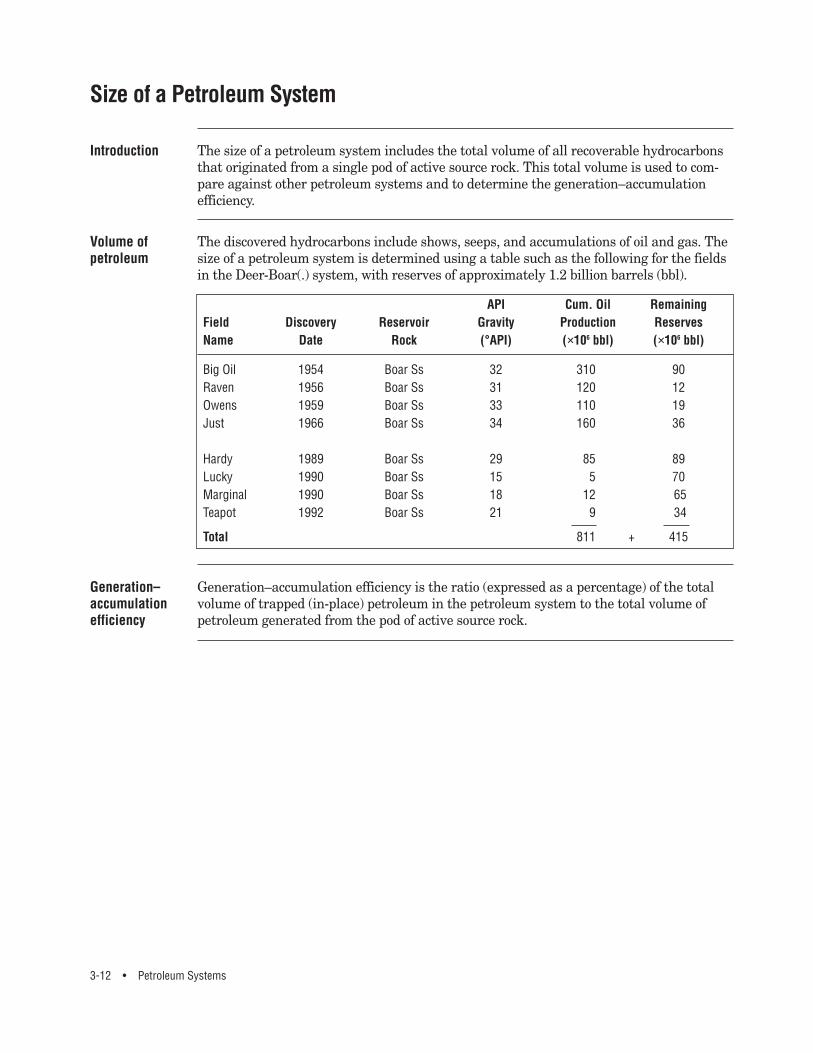
The discovered hydrocarbons include shows, seeps, and accumulations of oil and gas. Thesize of a petroleum system is determined using a table such as the following for the fieldsin the Deer-Boar(.) system, with reserves of approximately 1.2 billion barrels (bbl).
API Cum. Oil Remaining Field Discovery Reservoir Gravity Production ReservesName Date Rock (°API) (×106 bbl) (×106 bbl)
Big Oil 1954 Boar Ss 32 310 90Raven 1956 Boar Ss 31 120 12Owens 1959 Boar Ss 33 110 19Just 1966 Boar Ss 34 160 36
Hardy 1989 Boar Ss 29 85 89Lucky 1990 Boar Ss 15 5 70Marginal 1990 Boar Ss 18 12 65Teapot 1992 Boar Ss 21 9 34
Total 811 415
Volume ofpetroleum
Generation–accumulation efficiency is the ratio (expressed as a percentage) of the totalvolume of trapped (in-place) petroleum in the petroleum system to the total volume ofpetroleum generated from the pod of active source rock.
Generation–accumulationefficiency
+
Defining a Petroleum System • 3-13
A petroleum system is mapped by showing the geographic, stratigraphic, and temporalextent of the system.
Introduction
Mapping a Petroleum System
The geographic extent is the area over which the petroleum system is known to occur.It is defined in map view by a line on the earth’s surface that circumscribes the pod ofactive source rock as well as all the known petroleum shows, seeps, and accumulationsthat originated from that pod. The geographic extent is outlined to correspond to the timeof the critical moment. It is similar to the known extent, or known geographic extent.
Mapping thegeographicextent
The stratigraphic extent of a petroleum system is the span of lithological units whichencompasses the essential elements within the geographic extent of a petroleum system.The stratigraphic extent can be displayed on the burial history chart and cross sectiondrawn at the critical moment. The stratigraphic extent is from below the pod of activesource rock or the petroleum of the discovered accumulations in the system, whichever isdeeper, to the top of the overburden rock.
Mapping thestratigraphicextent
The temporal extent of the petroleum system is shown on the events chart and includesthe age of the essential elements and processes, the preservation time, and the criticalmoment. By displaying together the time over which these separate events took place, therelation between forming and charging the traps containing the accumulations is easilyevaluated.
Mapping thetemporal extent
3-14 • Petroleum Systems
Section B
Examples of Two Petroleum SystemsTo better understand how a petroleum system is mapped and described, two examples arepresented: the Mandal-Ekofisk(!) and the Ellesmerian(!) petroleum systems (from Corn-ford, 1994, and Bird, 1994, respectively). The petroleum in the former system migratedacross stratigraphic units (or vertically) into many accumulations, whereas the lattermigrated along stratigraphic units (or laterally) into a few accumulations. Both oil sys-tems are multibillion barrels in size. These two examples illustrate many of the conceptsand principles discussed in section A.
Introduction
This section contains the following topics.
Topic Page
Mandal-Ekofisk(!) Petroleum System 3–15
Ellesmerian(!) Petroleum System 3–19
In this section
Examples of Two Petroleum Systems • 3-15
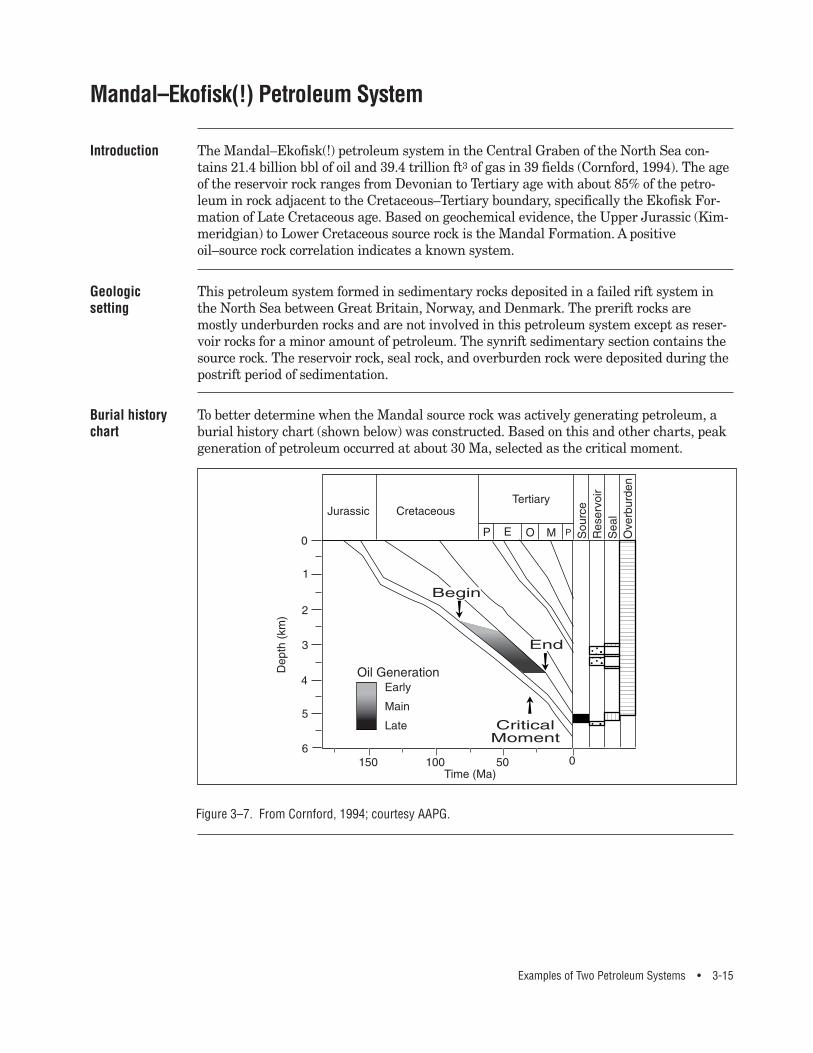
The Mandal–Ekofisk(!) petroleum system in the Central Graben of the North Sea con-tains 21.4 billion bbl of oil and 39.4 trillion ft3 of gas in 39 fields (Cornford, 1994). The ageof the reservoir rock ranges from Devonian to Tertiary age with about 85% of the petro-leum in rock adjacent to the Cretaceous–Tertiary boundary, specifically the Ekofisk For-mation of Late Cretaceous age. Based on geochemical evidence, the Upper Jurassic (Kim-meridgian) to Lower Cretaceous source rock is the Mandal Formation. A positiveoil–source rock correlation indicates a known system.
Introduction
Mandal–Ekofisk(!) Petroleum System
This petroleum system formed in sedimentary rocks deposited in a failed rift system inthe North Sea between Great Britain, Norway, and Denmark. The prerift rocks aremostly underburden rocks and are not involved in this petroleum system except as reser-voir rocks for a minor amount of petroleum. The synrift sedimentary section contains thesource rock. The reservoir rock, seal rock, and overburden rock were deposited during thepostrift period of sedimentation.
Geologicsetting
To better determine when the Mandal source rock was actively generating petroleum, aburial history chart (shown below) was constructed. Based on this and other charts, peakgeneration of petroleum occurred at about 30 Ma, selected as the critical moment.
Burial historychart
����������
����������
����������
����������
������
����������
����������
����������
����������
������
��
����
�����
���������������
Figure 3–7. From Cornford, 1994; courtesy AAPG.
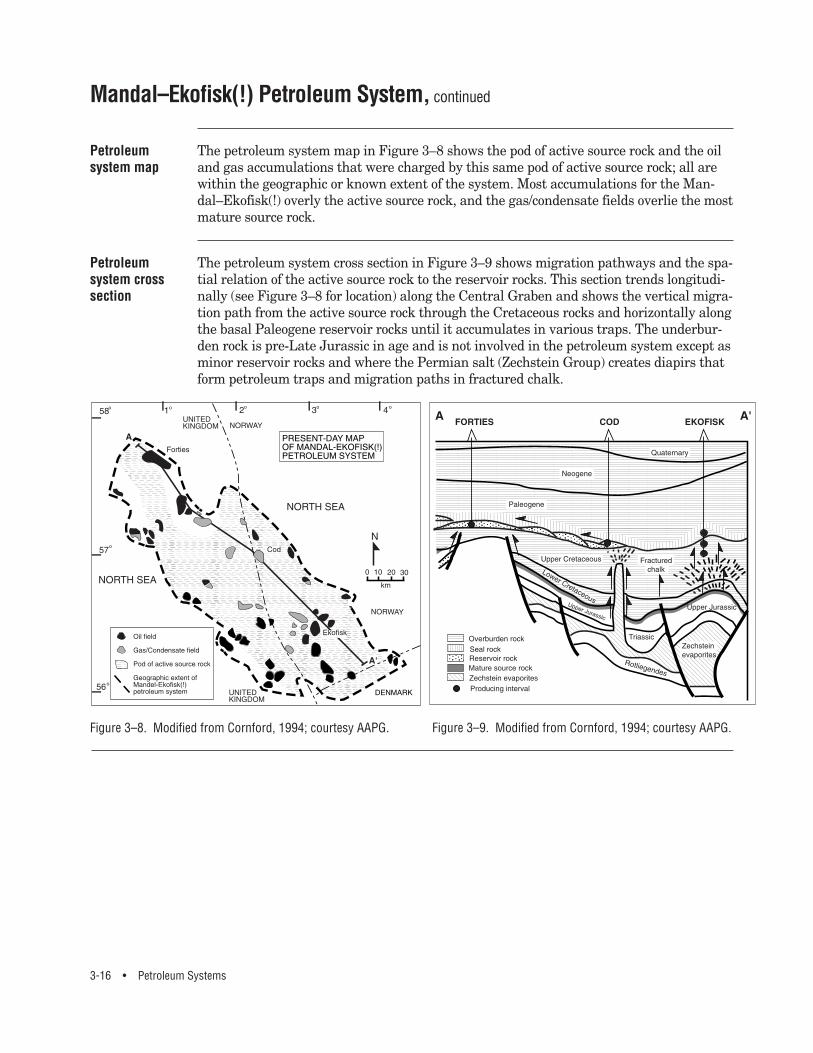
The petroleum system cross section in Figure 3–9 shows migration pathways and the spa-tial relation of the active source rock to the reservoir rocks. This section trends longitudi-nally (see Figure 3–8 for location) along the Central Graben and shows the vertical migra-tion path from the active source rock through the Cretaceous rocks and horizontally alongthe basal Paleogene reservoir rocks until it accumulates in various traps. The underbur-den rock is pre-Late Jurassic in age and is not involved in the petroleum system except asminor reservoir rocks and where the Permian salt (Zechstein Group) creates diapirs thatform petroleum traps and migration paths in fractured chalk.
Petroleumsystem crosssection
3-16 • Petroleum Systems
The petroleum system map in Figure 3–8 shows the pod of active source rock and the oiland gas accumulations that were charged by this same pod of active source rock; all arewithin the geographic or known extent of the system. Most accumulations for the Man-dal–Ekofisk(!) overly the active source rock, and the gas/condensate fields overlie the mostmature source rock.
Petroleumsystem map
Mandal–Ekofisk(!) Petroleum System, continued
�������������������������������������������������
QQQQQQQQQQQQQQQQQQQQQQQQQQQQQQQQQQQQQQQQQQQQQQQQQ
¢¢¢¢¢¢¢¢¢¢¢¢¢¢¢¢¢¢¢¢¢¢¢¢¢¢¢¢¢¢¢¢¢¢¢¢¢¢¢¢¢¢¢¢¢¢¢¢¢
��QQ¢¢
����������
����������
����������
����������
����������
����������
����������
����������
������
����������
����������
����������
����������
����������
����������
����������
������
����������
����������
����������
����������
����������
����������
����������
����������
������
����������
����������
����������
����������
����������
����������
����������
������
����������
����������
����������
����������
����������
����������
����������
����������
������
����������
����������
����������
����������
����������
����������
����������
������
����������
����������
����������
����������
����������
����������
����������
����������
������
����������
����������
����������
����������
����������
����������
����������
������
����������
����������
����������
����������
����������
����������
����������
����������
������
����������
����������
����������
����������
����������
����������
����������
������
����������
����������
����������
����������
����������
����������
����������
����������
������
����������
����������
����������
����������
����������
����������
����������
������
����������
����������
����������
����������
����������
����������
����������
����������
������
����������
����������
����������
����������
����������
����������
����������
������
����������
����������
����������
����������
����������
����������
����������
����������
������
����������
����������
����������
����������
����������
����������
����������
������
����������
����������
����������
����������
����������
����������
����������
����������
������
����������
����������
����������
����������
����������
����������
����������
������
������������������������������������������������������������������������������������������������������������������������������������������������������������������������������������������������������������������������������������������������������������������������������������������������������������������������������������������������������������������������������������������������������������������������������������������������������������������������������������������������������������������������������������������������������������������������������������������������������������������������������������
��
������������������������������������
����
������
������
������
������
������
������
������
������
������
������
������
������
������
������
������
������
������
������
������
������
������
������
������
������
������
������
������
������
������
������
������
������
������
������
������
������
������
������
������
������
������
������
������
������
������
������
������
������
������
������
������
������
������
������
�����
������
������
������
������
������
������
������
������
������
������
������
������
������
������
������
������
������
������
������
������
������
������
������
������
������
������
������
������
������
������
������
������
������
������
������
������
������
������
������
������
������
������
������
������
������
������
������
������
������
������
������
������
������
������
������
������
������
������
������
������
������
������
������
������
������
������
������
������
������
����
������
������
������
������
������
������
������
������
����
������
������
������
������
������
������
������
����
������
������
������
������
������
������
����
������
������
������
������
������
����
������
������
������
������
����
������
������
������
����
������
������
����
������
����
���
����������
��������
�����������
�
Figure 3–8. Modified from Cornford, 1994; courtesy AAPG. Figure 3–9. Modified from Cornford, 1994; courtesy AAPG.
Examples of Two Petroleum Systems • 3-17
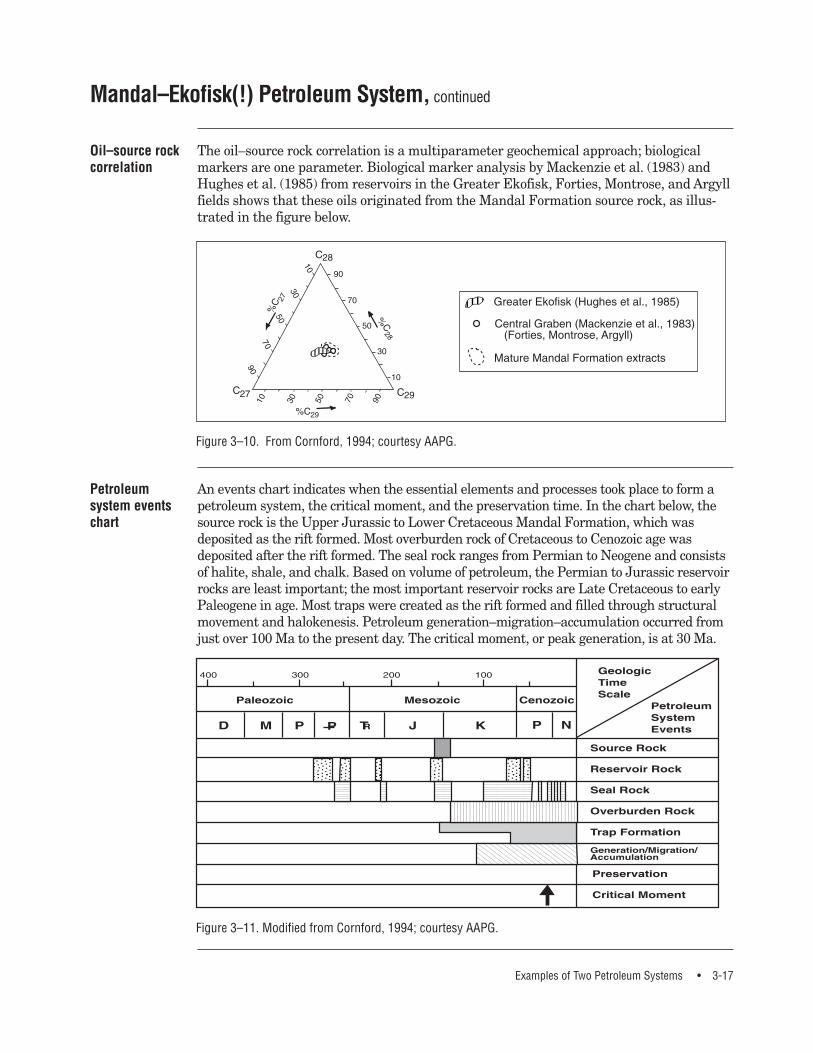
The oil–source rock correlation is a multiparameter geochemical approach; biologicalmarkers are one parameter. Biological marker analysis by Mackenzie et al. (1983) andHughes et al. (1985) from reservoirs in the Greater Ekofisk, Forties, Montrose, and Argyllfields shows that these oils originated from the Mandal Formation source rock, as illus-trated in the figure below.
Oil–source rockcorrelation
Mandal–Ekofisk(!) Petroleum System, continued
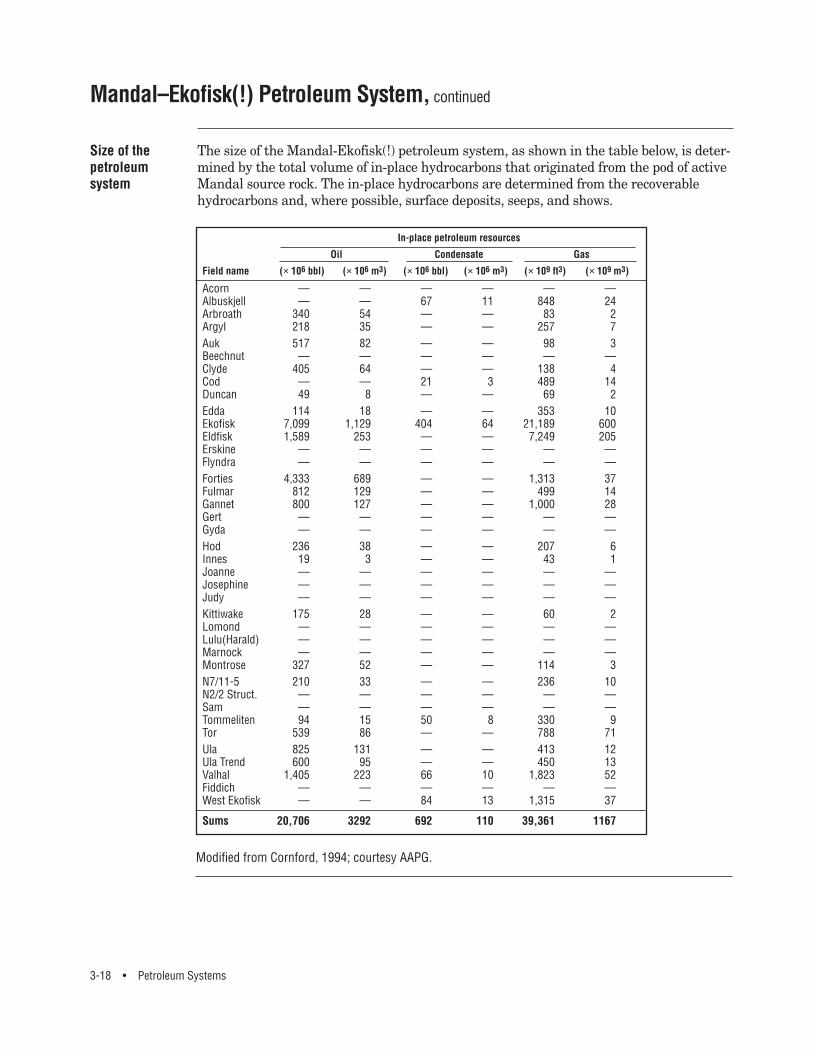
An events chart indicates when the essential elements and processes took place to form apetroleum system, the critical moment, and the preservation time. In the chart below, thesource rock is the Upper Jurassic to Lower Cretaceous Mandal Formation, which wasdeposited as the rift formed. Most overburden rock of Cretaceous to Cenozoic age wasdeposited after the rift formed. The seal rock ranges from Permian to Neogene and consistsof halite, shale, and chalk. Based on volume of petroleum, the Permian to Jurassic reservoirrocks are least important; the most important reservoir rocks are Late Cretaceous to earlyPaleogene in age. Most traps were created as the rift formed and filled through structuralmovement and halokenesis. Petroleum generation–migration–accumulation occurred fromjust over 100 Ma to the present day. The critical moment, or peak generation, is at 30 Ma.
Petroleumsystem eventschart
��������������
����������
��������
��
������
����������
����������
����������
����������
���������� ���������
���������
���������
����������
����������
����������
����������
����������
���������
���
������
������
�
������
������
�
������
������
�
������
������
�
������
����
�����
����������������������������������������������������������������������������������
Figure 3–10. From Cornford, 1994; courtesy AAPG.
Figure 3–11. Modified from Cornford, 1994; courtesy AAPG.
3-18 • Petroleum Systems
The size of the Mandal-Ekofisk(!) petroleum system, as shown in the table below, is deter-mined by the total volume of in-place hydrocarbons that originated from the pod of activeMandal source rock. The in-place hydrocarbons are determined from the recoverablehydrocarbons and, where possible, surface deposits, seeps, and shows.
Size of thepetroleumsystem
Mandal–Ekofisk(!) Petroleum System, continued
In-place petroleum resources
Oil Condensate Gas
Field name (× 106 bbl) (× 106 m3) (× 106 bbl) (× 106 m3) (× 109 ft3) (× 109 m3)
Acorn — — — — — —Albuskjell — — 67 11 848 24Arbroath 340 54 — — 83 2Argyl 218 35 — — 257 7Auk 517 82 — — 98 3Beechnut — — — — — —Clyde 405 64 — — 138 4Cod — — 21 3 489 14Duncan 49 8 — — 69 2Edda 114 18 — — 353 10Ekofisk 7,099 1,129 404 64 21,189 600Eldfisk 1,589 253 — — 7,249 205Erskine — — — — — —Flyndra — — — — — —Forties 4,333 689 — — 1,313 37Fulmar 812 129 — — 499 14Gannet 800 127 — — 1,000 28Gert — — — — — —Gyda — — — — — —Hod 236 38 — — 207 6Innes 19 3 — — 43 1Joanne — — — — — —Josephine — — — — — —Judy — — — — — —Kittiwake 175 28 — — 60 2Lomond — — — — — —Lulu(Harald) — — — — — —Marnock — — — — — —Montrose 327 52 — — 114 3N7/11-5 210 33 — — 236 10N2/2 Struct. — — — — — —Sam — — — — — —Tommeliten 94 15 50 8 330 9Tor 539 86 — — 788 71Ula 825 131 — — 413 12Ula Trend 600 95 — — 450 13Valhal 1,405 223 66 10 1,823 52Fiddich — — — — — —West Ekofisk — — 84 13 1,315 37
Sums 20,706 3292 692 110 39,361 1167
Modified from Cornford, 1994; courtesy AAPG.
Examples of Two Petroleum Systems • 3-19
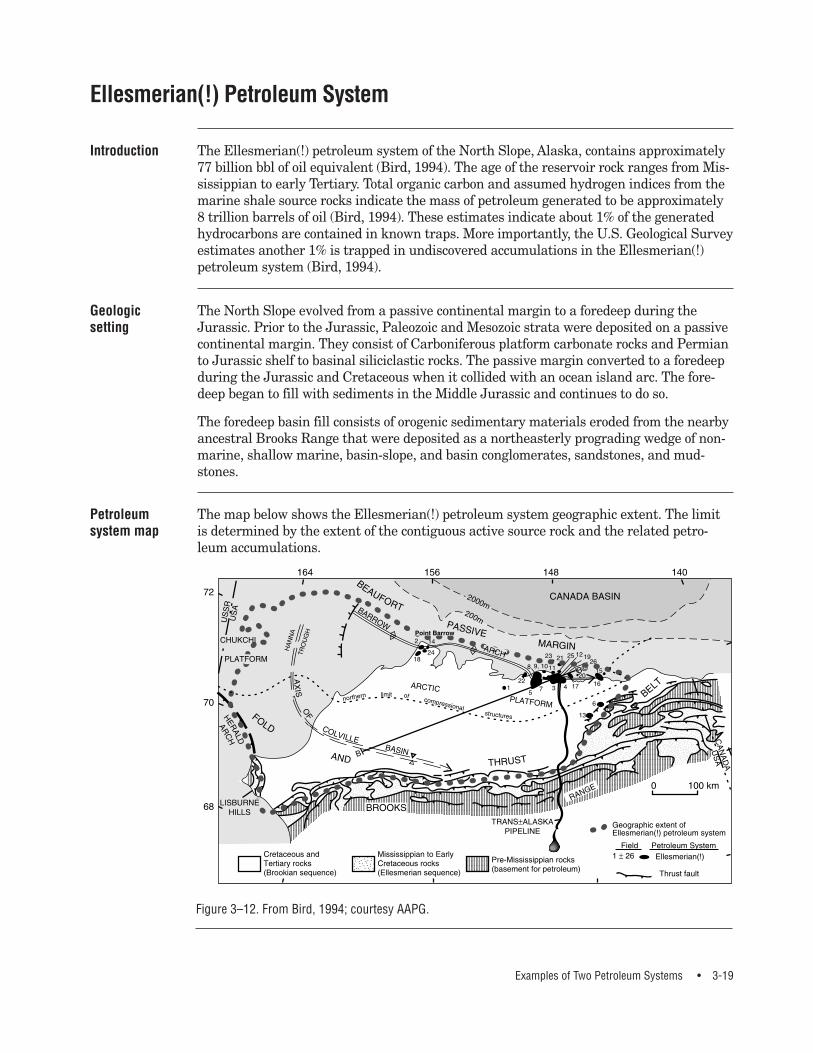
The Ellesmerian(!) petroleum system of the North Slope, Alaska, contains approximately77 billion bbl of oil equivalent (Bird, 1994). The age of the reservoir rock ranges from Mis-sissippian to early Tertiary. Total organic carbon and assumed hydrogen indices from themarine shale source rocks indicate the mass of petroleum generated to be approximately8 trillion barrels of oil (Bird, 1994). These estimates indicate about 1% of the generatedhydrocarbons are contained in known traps. More importantly, the U.S. Geological Surveyestimates another 1% is trapped in undiscovered accumulations in the Ellesmerian(!)petroleum system (Bird, 1994).
Introduction
Ellesmerian(!) Petroleum System
The North Slope evolved from a passive continental margin to a foredeep during theJurassic. Prior to the Jurassic, Paleozoic and Mesozoic strata were deposited on a passivecontinental margin. They consist of Carboniferous platform carbonate rocks and Permianto Jurassic shelf to basinal siliciclastic rocks. The passive margin converted to a foredeepduring the Jurassic and Cretaceous when it collided with an ocean island arc. The fore-deep began to fill with sediments in the Middle Jurassic and continues to do so.
The foredeep basin fill consists of orogenic sedimentary materials eroded from the nearbyancestral Brooks Range that were deposited as a northeasterly prograding wedge of non-marine, shallow marine, basin-slope, and basin conglomerates, sandstones, and mud-stones.
Geologicsetting
The map below shows the Ellesmerian(!) petroleum system geographic extent. The limitis determined by the extent of the contiguous active source rock and the related petro-leum accumulations.
Petroleumsystem map
����������������������������������������������������
���
��
��������
���������������
�������� ���������������������
���������������
������
������
������������������������������������������������
�������������������������������������������������������������������������������������������������������������������������������������������������������������������������������������������������������������������������������������������������������������������������������������������������������������������������������������������������������������������������������������������������������������������������������������������������������������������������������������������������������������������������������������������������������������������������������������������������������������������������������������������������������������������������������������������������������������������������������������������������������������������������������������������������������������������������������������������������������������������������������������������������������������������������������������������������������������
����������������������������
����������������������������������������������������������������
������������������������������������������������������������������������������������������������������������������������������������������������������������������������������������������������������������������������������������������������������������������������������������������������������������������������������������������������������������������������������������������������������������������������������������������������������������������������������������������������������������������������������������������������������������������������������������������������������������������������������������������������������������������������������������������������������������������������������������������������������������������������������������������������������������������������������������������������������������������������������������������������������������������������������������������������������������������������������������������������������������������������������������������������������������������������������������������������������������������������������������������������������������������������������������������������������������������������������������������������������������������������������������������������������������������������������������������������������������������������������������������������������������������������������������������������������������������������������������������������������������������������������������������������������������������������������������������������������������������������������������������������������������������������������������������������������������������������������������������������������������������������������������������������������������������������������������������������������������������������������������������������������������������������������������������������������������������������������������������������������������������������������������������������������������������������������������������������������������������������������������������������������������������������������������������������������������������������������������������������������������������������������������������������������������������������������������������������������������������������������������������������������������������������������������������������������������������������������������������������������������������������������������������������������������������������������������������������������������������������������������������������������������������������������������������������������������������������������������������������������������������������������������������������������������������������������������������������������������������������������������������������������������������������������������������������������������������������������������������������������������������������������������������������������������������������������������������������������������������������������������������������������������������������������������������������������������������������������������������������������������������������������������������������������������������������������������������������������������������������������������������������������������������������������������������������������������������������������������������������������������������������������������������������������������������������������������������������������������
������������������������������������������������������������������������������������������������������������������������������������������������������������������������������������������������������������������������������������������������������������������������������������������������������������������������������������������������������������������������������������
����������������������������������������������������������������������������������������
�����������������������������������
������������������������
������������������������
����������
���
����
����
������������������������������������������������������������
�
��
Figure 3–12. From Bird, 1994; courtesy AAPG.
3-20 • Petroleum Systems
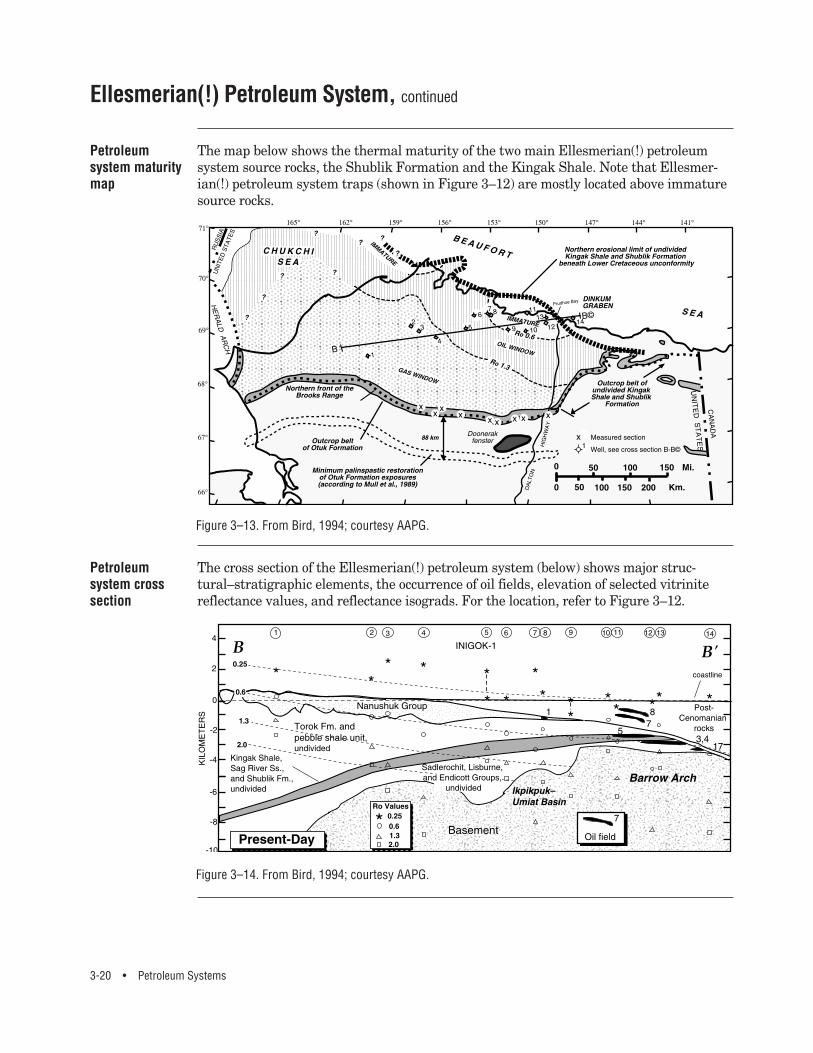
The map below shows the thermal maturity of the two main Ellesmerian(!) petroleumsystem source rocks, the Shublik Formation and the Kingak Shale. Note that Ellesmer-ian(!) petroleum system traps (shown in Figure 3–12) are mostly located above immaturesource rocks.
Petroleumsystem maturitymap
Ellesmerian(!) Petroleum System, continued
The cross section of the Ellesmerian(!) petroleum system (below) shows major struc-tural–stratigraphic elements, the occurrence of oil fields, elevation of selected vitrinitereflectance values, and reflectance isograds. For the location, refer to Figure 3–12.
Petroleumsystem crosssection
���������������������������������������������������������������������������������������������������������������������������������������������������������������������������������������������������������������������������������������������������������������������������������������������������������������������������������������������������������������������������������������������������������������������������������������������������������������������������������������������������������������������������������������������������������������������������������������������������������������������������������������������������������������������������������������������������������������������������������������������������������������������������������������������������������
������������������������������������������������������������������������������������������������������������������������������������������������������������������������������������������������������������������������������������������������������������������������������������������������������������������������������������������������������������������������������������������������������������������������������������������������������������������������������������������������������������������������������������������������������������������������������������������������������������������������������������
������������������������������������������������������������������������������������������������������������������������������������������������������������������
����
�������
��������������
Figure 3–14. From Bird, 1994; courtesy AAPG.
Figure 3–13. From Bird, 1994; courtesy AAPG.
Examples of Two Petroleum Systems • 3-21
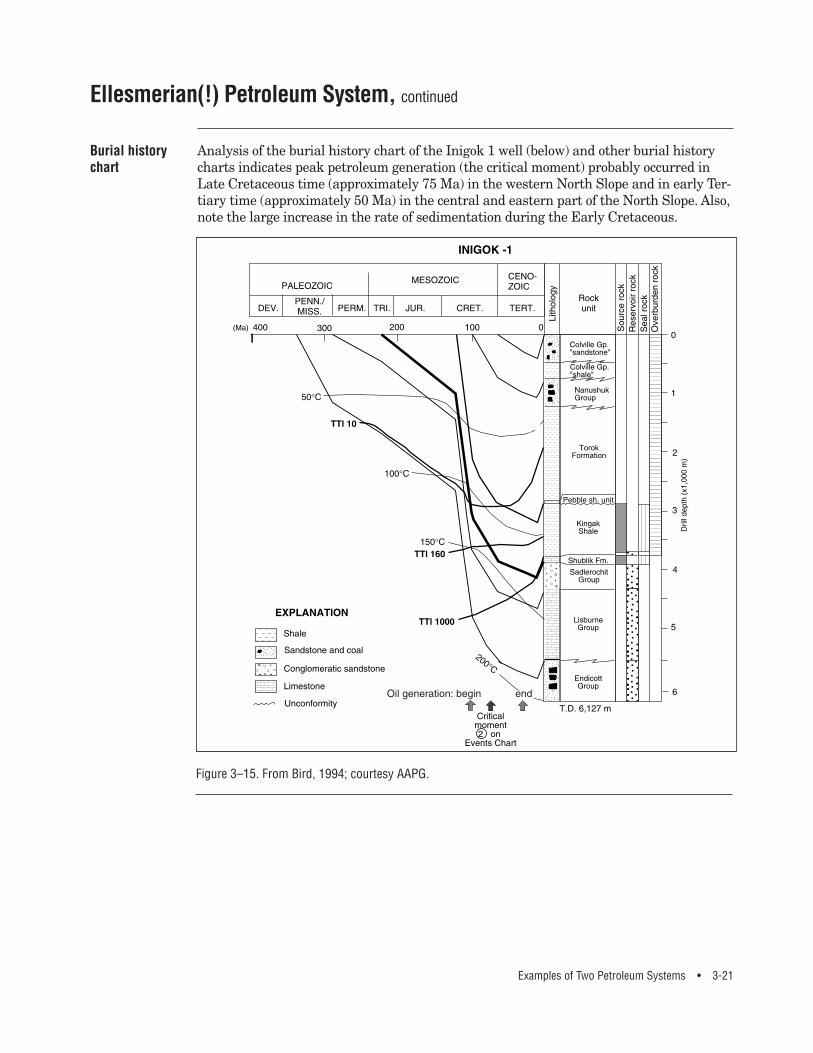
Analysis of the burial history chart of the Inigok 1 well (below) and other burial historycharts indicates peak petroleum generation (the critical moment) probably occurred inLate Cretaceous time (approximately 75 Ma) in the western North Slope and in early Ter-tiary time (approximately 50 Ma) in the central and eastern part of the North Slope. Also,note the large increase in the rate of sedimentation during the Early Cretaceous.
Burial historychart
Ellesmerian(!) Petroleum System, continued
����������
�����������������������������
������������������������������
�������������������������������
����
����
�����
� �����
��
����
����
������
����
����������
����������
����������
����������
����������
�������
������������
����
Figure 3–15. From Bird, 1994; courtesy AAPG.
3-22 • Petroleum Systems
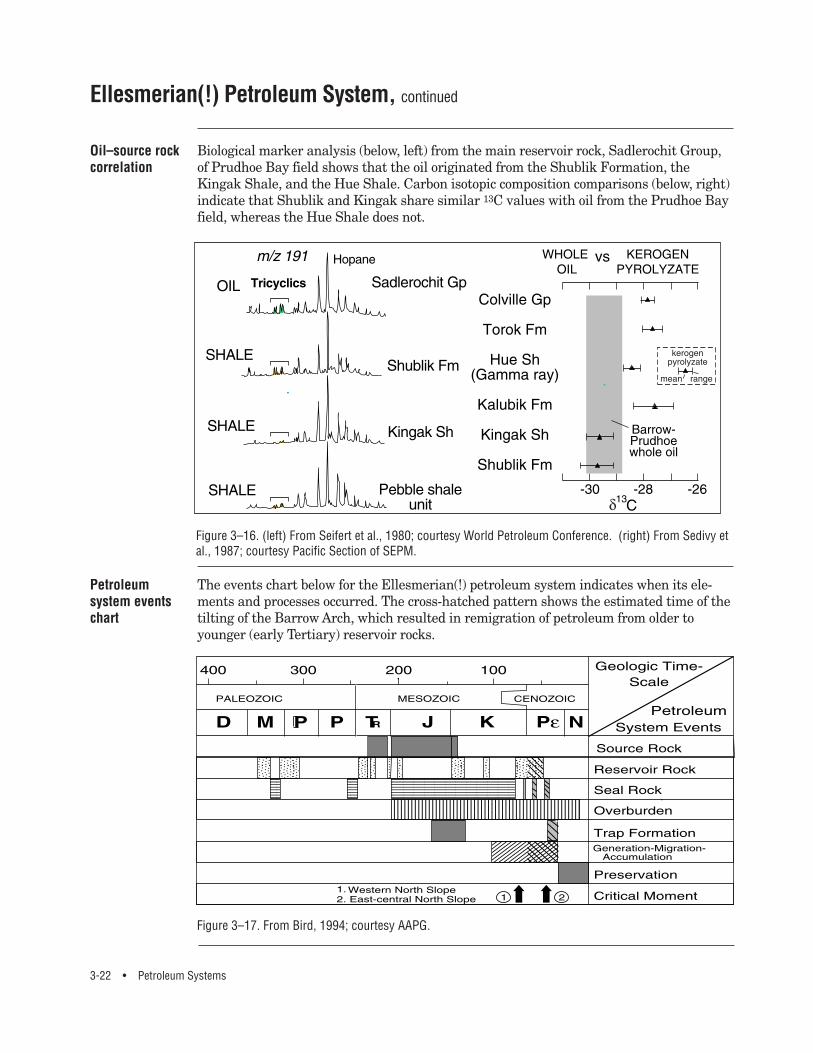
Biological marker analysis (below, left) from the main reservoir rock, Sadlerochit Group,of Prudhoe Bay field shows that the oil originated from the Shublik Formation, theKingak Shale, and the Hue Shale. Carbon isotopic composition comparisons (below, right)indicate that Shublik and Kingak share similar 13C values with oil from the Prudhoe Bayfield, whereas the Hue Shale does not.
Oil–source rockcorrelation
Ellesmerian(!) Petroleum System, continued
The events chart below for the Ellesmerian(!) petroleum system indicates when its ele-ments and processes occurred. The cross-hatched pattern shows the estimated time of thetilting of the Barrow Arch, which resulted in remigration of petroleum from older toyounger (early Tertiary) reservoir rocks.
Petroleumsystem eventschart
������
��
����
���
���������
��������������
����������������
����������������
��������������
��������
��
������
������
������
������
���� ��
������
������
������
������
������
������
������
������
������
������
������
���� ��
������
������
���
������
������
������
������
������
��������
��������
����
��
���������������������������������������������������������������������������������������������������������������������������������������������������������������������
Figure 3–16. (left) From Seifert et al., 1980; courtesy World Petroleum Conference. (right) From Sedivy etal., 1987; courtesy Pacific Section of SEPM.
Figure 3–17. From Bird, 1994; courtesy AAPG.
Examples of Two Petroleum Systems • 3-23
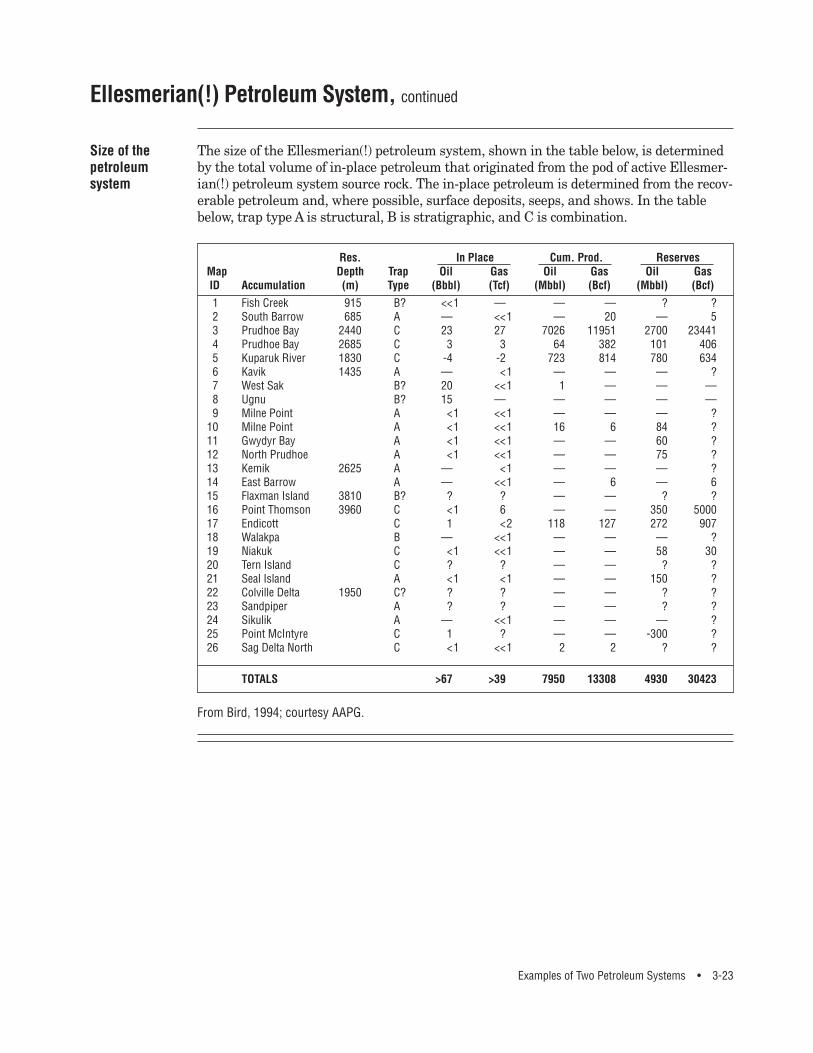
The size of the Ellesmerian(!) petroleum system, shown in the table below, is determinedby the total volume of in-place petroleum that originated from the pod of active Ellesmer-ian(!) petroleum system source rock. The in-place petroleum is determined from the recov-erable petroleum and, where possible, surface deposits, seeps, and shows. In the tablebelow, trap type A is structural, B is stratigraphic, and C is combination.
Res. In Place Cum. Prod. ReservesMap Depth Trap Oil Gas Oil Gas Oil Gas ID Accumulation (m) Type (Bbbl) (Tcf) (Mbbl) (Bcf) (Mbbl) (Bcf)1 Fish Creek 915 B? <<.1 — — — ? ?2 South Barrow 685 A — <<.1 — 20 — 53 Prudhoe Bay 2440 C 23 27 7026 11951 2700 234414 Prudhoe Bay 2685 C 3 3 64 382 101 4065 Kuparuk River 1830 C -4 -2 723 814 780 6346 Kavik 1435 A — <.1 — — — ?7 West Sak B? 20 <<.1 1 — — —8 Ugnu B? 15 — — — — —9 Milne Point A <.1 <<.1 — — — ?
10 Milne Point A <.1 <<.1 16 6 84 ?11 Gwydyr Bay A <.1 <<.1 — — 60 ?12 North Prudhoe A <.1 <<.1 — — 75 ?13 Kemik 2625 A — <.1 — — — ?14 East Barrow A — <<.1 — 6 — 615 Flaxman Island 3810 B? ? ? — — ? ?16 Point Thomson 3960 C <.1 6 — — 350 500017 Endicott C 1 <.2 118 127 272 90718 Walakpa B — <<.1 — — — ?19 Niakuk C <.1 <<.1 — — 58 3020 Tern Island C ? ? — — ? ?21 Seal Island A <.1 <.1 — — 150 ?22 Colville Delta 1950 C? ? ? — — ? ?23 Sandpiper A ? ? — — ? ?24 Sikulik A — <<.1 — — — ?25 Point McIntyre C 1 ? — — -300 ?26 Sag Delta North C <.1 <<.1 2 2 ? ?
TOTALS >67 >39 7950 13308 4930 30423
Size of thepetroleumsystem
Ellesmerian(!) Petroleum System, continued
From Bird, 1994; courtesy AAPG.
3-24 • Petroleum Systems
This section discusses how to apply the petroleum system concept to petroleum explo-ration. It defines petroleum province, basin, system, play, and prospect and it shows howthe system relates to the complementary play. It also explains how to use a petroleumsystem study to reduce exploration risk.
Introduction
Section C
Applying the Petroleum System Concept
This section contains the following topics.
Topic Page
Basin, System, Play, and Prospect 3–25
Reducing Exploration Risk 3–27
Examples of Applying the Concept 3–31
In this section
Applying the Petroleum System Concept • 3-25
Words frequently have more than one meaning; nomenclature in this discipline of petro-leum geology is no exception. To more clearly separate the petroleum system from thesedimentary basin and the play and prospect, the meaning of these words needs to beclarified with respect to each other and the petroleum province.
Introduction
Basin, System, Play, and Prospect
Petroleum province, a geographic term, is an area where petroleum occurs in commer-cial quantities. Basin is sometimes used geographically to mean petroleum province,such as the Williston Basin or Paris Basin. The Zagros fold belt could be a structuralprovince or a petroleum province, not a basin.
A map showing differential thickness of sedimentary rocks is used to determine basins(thick), uplifts (thin), and fold belts (folded). These features are properly named provinces;if they contain petroleum, they are called petroleum provinces. The use of “basin” in thiscontext is improper; it is also inconsistent with the petroleum system concept describedbelow, which defines “basin” as the area into which sedimentary rocks are deposited.
Petroleumprovince
A sedimentary basin is a depression filled with sedimentary rocks. The presence of sedi-mentary rocks is proof that a basin existed.
The depression, formed by any tectonic process, is lined by basement rock, which can beigneous, metamorphic, and/or sedimentary rock. The basin fill includes the rock matter,organic matter, and water deposited in this depression. In certain cases, such as with coaland some carbonate deposits, the sedimentary material is formed in situ. The essentialelements of a petroleum system are deposited in sedimentary basins. Frequently, one ormore overlapping sedimentary basins are responsible for the essential elements of apetroleum system. Traps are formed by tectonic processes that act on sedimentary rocks.However, the moment petroleum is generated, biologically or thermally, a petroleum sys-tem is formed.
Sedimentarybasin
The petroleum system includes the pod of active source rock, the natural distributionnetwork, and the genetically related discovered petroleum occurrences. Presence of petro-leum is proof that a system exists.
The pod of active source rock is part of the petroleum system because it is the provenanceof these related petroleum occurrences. The distribution network is the migration pathsto discovered accumulations, seeps, and shows.
In contrast to the play and prospect, which address undiscovered commercial accumula-tions, the petroleum system includes only the discovered petroleum occurrences. If anexploratory well encounters any type or amount of petroleum, that petroleum is part of apetroleum system.
Petroleumsystem
3-26 • Petroleum Systems
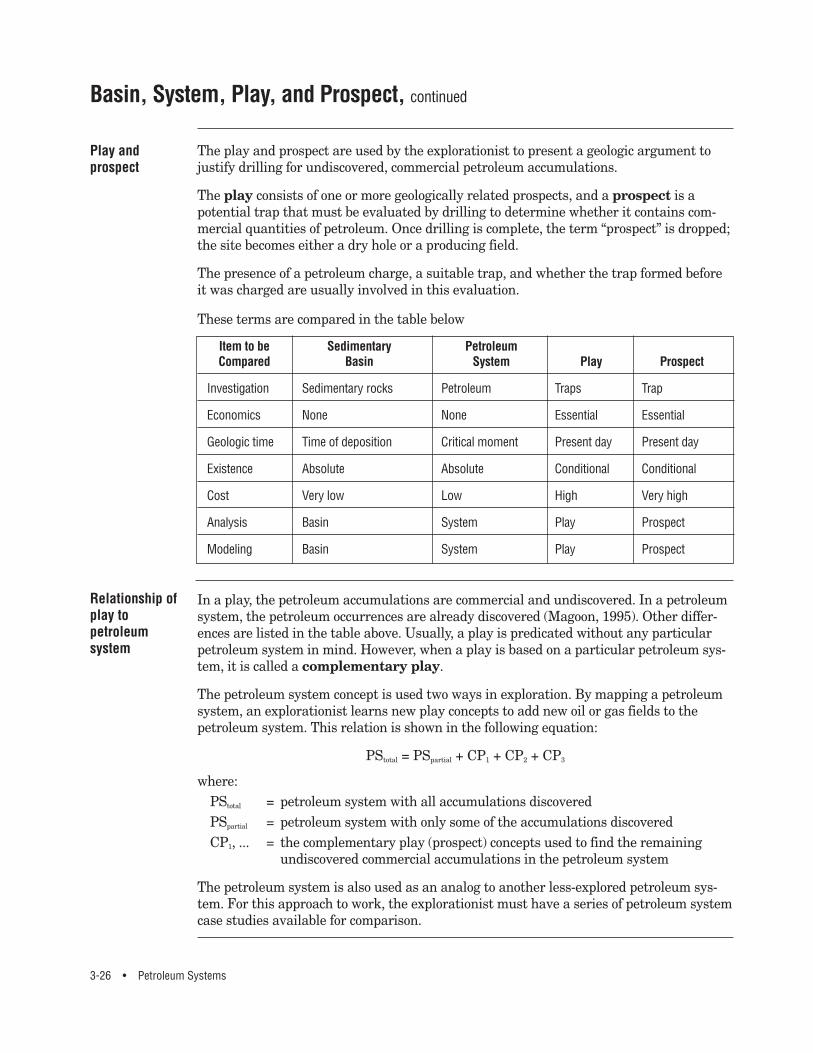
These terms are compared in the table below
Item to be Sedimentary PetroleumCompared Basin System Play Prospect
Investigation Sedimentary rocks Petroleum Traps Trap
Economics None None Essential Essential
Geologic time Time of deposition Critical moment Present day Present day
Existence Absolute Absolute Conditional Conditional
Cost Very low Low High Very high
Analysis Basin System Play Prospect
Modeling Basin System Play Prospect
The play and prospect are used by the explorationist to present a geologic argument tojustify drilling for undiscovered, commercial petroleum accumulations.
The play consists of one or more geologically related prospects, and a prospect is apotential trap that must be evaluated by drilling to determine whether it contains com-mercial quantities of petroleum. Once drilling is complete, the term “prospect” is dropped;the site becomes either a dry hole or a producing field.
The presence of a petroleum charge, a suitable trap, and whether the trap formed beforeit was charged are usually involved in this evaluation.
Play andprospect
Basin, System, Play, and Prospect, continued
In a play, the petroleum accumulations are commercial and undiscovered. In a petroleumsystem, the petroleum occurrences are already discovered (Magoon, 1995). Other differ-ences are listed in the table above. Usually, a play is predicated without any particularpetroleum system in mind. However, when a play is based on a particular petroleum sys-tem, it is called a complementary play.
The petroleum system concept is used two ways in exploration. By mapping a petroleumsystem, an explorationist learns new play concepts to add new oil or gas fields to thepetroleum system. This relation is shown in the following equation:
PStotal = PSpartial + CP1 + CP2 + CP3
where: PStotal = petroleum system with all accumulations discovered PSpartial = petroleum system with only some of the accumulations discovered CP1, ... = the complementary play (prospect) concepts used to find the remaining
undiscovered commercial accumulations in the petroleum system
The petroleum system is also used as an analog to another less-explored petroleum sys-tem. For this approach to work, the explorationist must have a series of petroleum systemcase studies available for comparison.
Relationship ofplay topetroleumsystem
Applying the Petroleum System Concept • 3-27
The complementary play evaluates the exploration risk for finding undiscovered hydro-carbons associated with a particular petroleum system.
First, the petroleum system case study is completed. As the case study develops, anidea(s) or play(s) that involves this petroleum system will occur to the investigator. Thisplay complements the petroleum system because it could add hydrocarbons (if discovered)to the system.
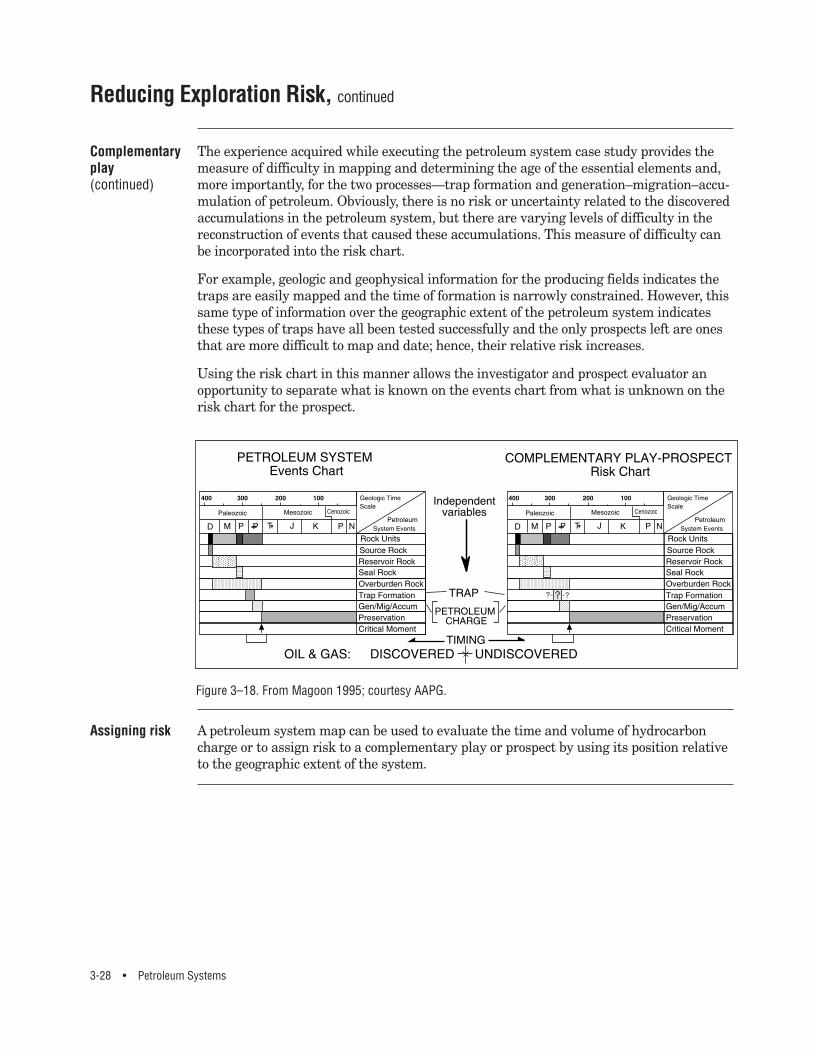
The events chart on the next page shows how the risk chart for the complementary play(prospect) is related to the petroleum system vis-a-vis the three independent variables—trap, petroleum charge, and timing.
Complementaryplay
Reducing Exploration Risk
In exploration, the general question is Where can we find substantial quantities of hydro-carbons that are economical to produce? To solve this problem, exploration geologists findand evaluate a prospect. In addition to helping evaluate petroleum charge, trap, and tim-ing, the petroleum system concept can help in the exploration process by determiningexploration intensity and assessing risk.
Introduction
A play is one or more prospects that may define a profitable accumulation of undiscoveredpetroleum. Traditionally, a play is developed and evaluated without any particular petro-leum system in mind. For example, if a prospect (play) is identified near a series of oilfields in anticlinal traps, it could be argued—using geophysics and geochemistry—thatthe prospect is an anticlinal trap charged with the same oil.
Three independent variables—petroleum charge (fluids), trap (sedimentary rocks), andtiming (time)—are usually evaluated. Petroleum charge is the volume and characteris-tics of the oil and gas available to the trap, if it exists. The trap includes the reservoir andseal rocks and the trapping geometry formed by the reservoir–seal interface. Timing iswhether the trap formed before the petroleum charge entered the trap.
Each independent variable has equal weight because if any variable is absent (0), theprospect is a failure; if all variables are present (1.0), the prospect is a commercial suc-cess. Therefore, each independent variable can be evaluated on a scale of zero to one(0–1.0). Exploration risk is determined by multiplying the three variables: charge, trap,and timing.
Within each independent variable, a series of subevents (which are also independent)must be evaluated. For example, if a trap is to be evaluated, the reservoir rock must bemapped carefully and its properties predicted using geologic principals. A similar proce-dure is carried out for the seal and trapping geometry. These subevents must be reducedto a single number between 0 and 1.0 that represents the independent variable, the trap.The subevents that contribute to petroleum charge and timing should also be evaluatedin a similar manner.
A practical way to carry out this exercise is to first map the petroleum system so theknowledge about the system can be used to evaluate the complementary play.
Play
3-28 • Petroleum Systems
Reducing Exploration Risk, continued
Cenozoic
���
���������
����������������
��������������������������������������������������������������������������
Cenozoic
��������
����
��������������������
��������������������������������������������������������������������������
The experience acquired while executing the petroleum system case study provides themeasure of difficulty in mapping and determining the age of the essential elements and,more importantly, for the two processes—trap formation and generation–migration–accu-mulation of petroleum. Obviously, there is no risk or uncertainty related to the discoveredaccumulations in the petroleum system, but there are varying levels of difficulty in thereconstruction of events that caused these accumulations. This measure of difficulty canbe incorporated into the risk chart.
For example, geologic and geophysical information for the producing fields indicates thetraps are easily mapped and the time of formation is narrowly constrained. However, thissame type of information over the geographic extent of the petroleum system indicatesthese types of traps have all been tested successfully and the only prospects left are onesthat are more difficult to map and date; hence, their relative risk increases.
Using the risk chart in this manner allows the investigator and prospect evaluator anopportunity to separate what is known on the events chart from what is unknown on therisk chart for the prospect.
Complementaryplay (continued)
A petroleum system map can be used to evaluate the time and volume of hydrocarboncharge or to assign risk to a complementary play or prospect by using its position relativeto the geographic extent of the system.
Assigning risk
Figure 3–18. From Magoon 1995; courtesy AAPG.
Applying the Petroleum System Concept • 3-29
Reducing Exploration Risk, continued
In a petroleum province, drilling density usually indicates how intensively an area hasbeen explored. Though this is a relative measure, a petroleum province having oneexploratory well every square kilometer is well explored compared with a province thathas one well every 100 km2. Exploration intensity by province ranges from lightly to mod-erately to heavily explored. However, in a petroleum province with overlapping petroleumsystems, the shallowest petroleum system may be heavily explored compared with thedeeper petroleum systems. To determine level of exploration, each petroleum system inthe province of interest should be mapped and the size and location of the commercialaccumulations compared with the dry exploratory wells. The dry-hole ratio or successratio determines exploration intensity and success.
Explorationintensity
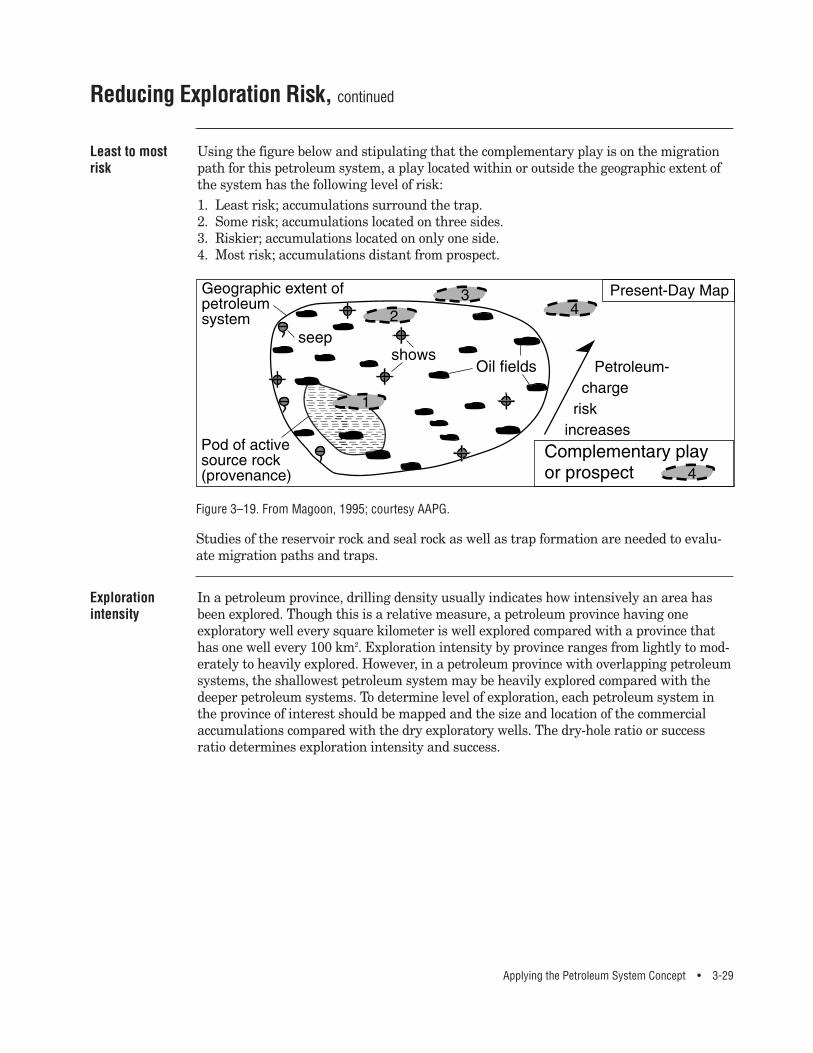
Studies of the reservoir rock and seal rock as well as trap formation are needed to evalu-ate migration paths and traps.
����
Figure 3–19. From Magoon, 1995; courtesy AAPG.
Using the figure below and stipulating that the complementary play is on the migrationpath for this petroleum system, a play located within or outside the geographic extent ofthe system has the following level of risk:1. Least risk; accumulations surround the trap.2. Some risk; accumulations located on three sides.3. Riskier; accumulations located on only one side.4. Most risk; accumulations distant from prospect.
Least to mostrisk
3-30 • Petroleum Systems
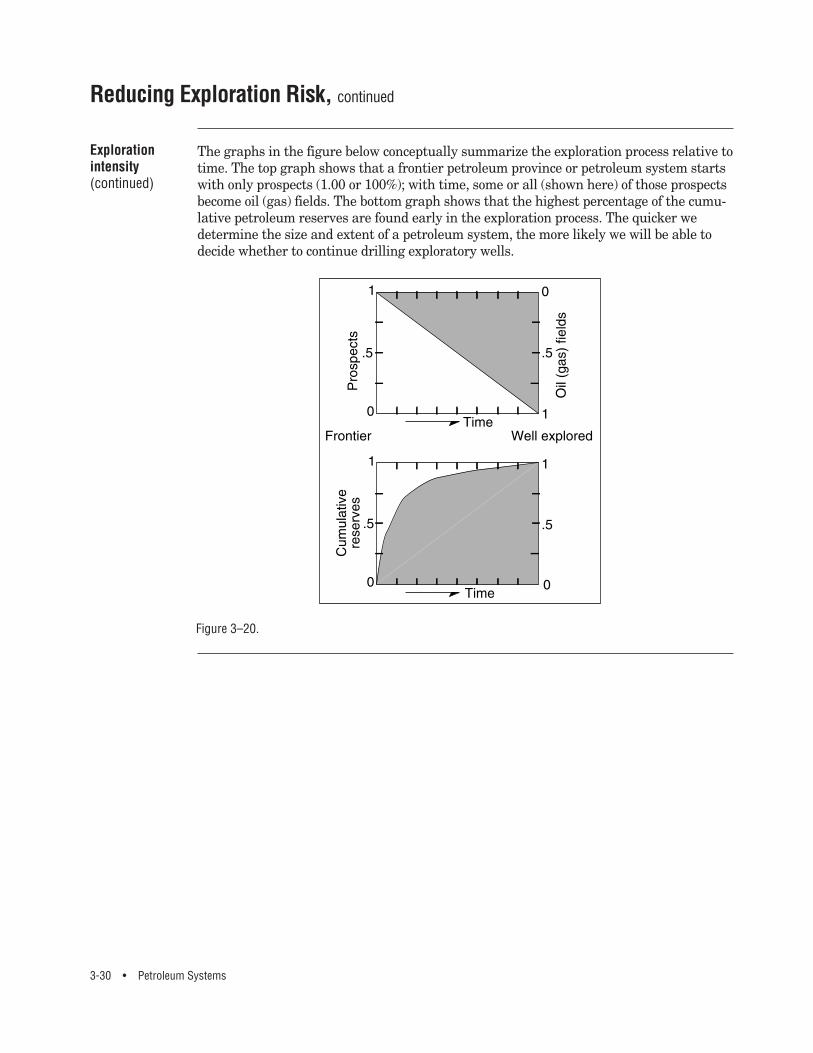
The graphs in the figure below conceptually summarize the exploration process relative totime. The top graph shows that a frontier petroleum province or petroleum system startswith only prospects (1.00 or 100%); with time, some or all (shown here) of those prospectsbecome oil (gas) fields. The bottom graph shows that the highest percentage of the cumu-lative petroleum reserves are found early in the exploration process. The quicker wedetermine the size and extent of a petroleum system, the more likely we will be able todecide whether to continue drilling exploratory wells.
Reducing Exploration Risk, continued
Figure 3–20.
Explorationintensity(continued)
Applying the Petroleum System Concept • 3-31
Linking the elements (source, reservoir, seal, and overburden) to the processes of petro-leum geology (trap formation and hydrocarbon generation–migration–accumulation) is aneffective exploration approach. Mapping and studying a petroleum system helps explo-rationists predict which traps will contain petroleum and which will not. It also helpsthem focus on that part of a province that will most likely contain accumulations. Beloware some examples of how the petroleum system concept can be applied to petroleumexploration at local and regional levels.
Introduction
Examples of Applying the Concept
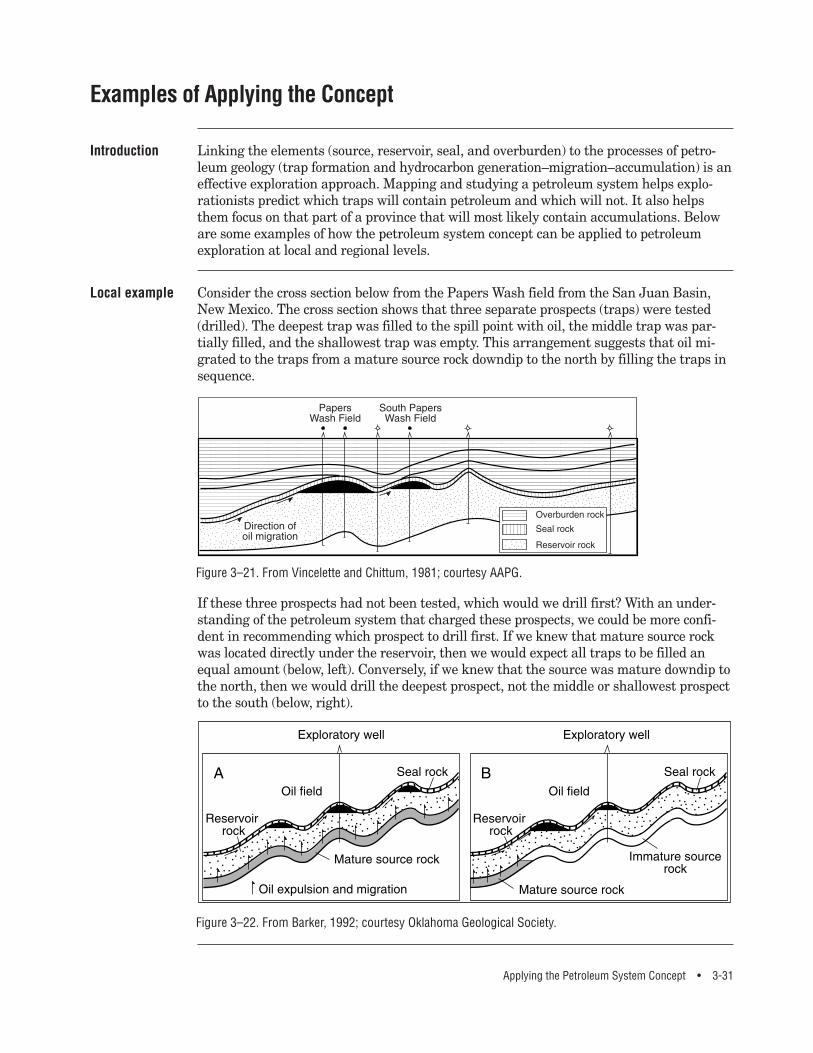
Consider the cross section below from the Papers Wash field from the San Juan Basin,New Mexico. The cross section shows that three separate prospects (traps) were tested(drilled). The deepest trap was filled to the spill point with oil, the middle trap was par-tially filled, and the shallowest trap was empty. This arrangement suggests that oil mi-grated to the traps from a mature source rock downdip to the north by filling the traps insequence.
If these three prospects had not been tested, which would we drill first? With an under-standing of the petroleum system that charged these prospects, we could be more confi-dent in recommending which prospect to drill first. If we knew that mature source rockwas located directly under the reservoir, then we would expect all traps to be filled anequal amount (below, left). Conversely, if we knew that the source was mature downdip tothe north, then we would drill the deepest prospect, not the middle or shallowest prospectto the south (below, right).
Local example
���������������������������������������������������������������������������������������������������������������������������������������������������������������������������������������������������������������������������������������������������������������������������������������������������������������������������������������������������������������������������������������������������
����������
����������
���������
����������
���������
����������
����������
���������
����������
���������
����������
����������
���������
����������
���������
����������
����������
���������
����������
���������
����������
����������
���������
����������
���������
����������
����������
���������
����������
���������
����������
����������
���������
����������
���������
����������
����������
���������
����������
���������
����
���������
��������������������������������������������������������������������������������������������������������������������������������������������������������������������������������������������������������
������
�������������������������������������������������������������������������������������������������������������������������������������������������������������������������������������������������������������
������
Figure 3–21. From Vincelette and Chittum, 1981; courtesy AAPG.
Figure 3–22. From Barker, 1992; courtesy Oklahoma Geological Society.
3-32 • Petroleum Systems
Examples of Applying the Concept, continued
Petroleum system studies may serve as analogs for undocumented petroleum systems inprospective petroleum provinces. Because a petroleum system study describes both ele-ments and processes, we can use them as look-alike and work-alike analogs. Petroleumsystems also can be classified in different ways according to our needs—an example ofapplying a petroleum system classification scheme to petroleum exploration.
Regional-scaleapplications
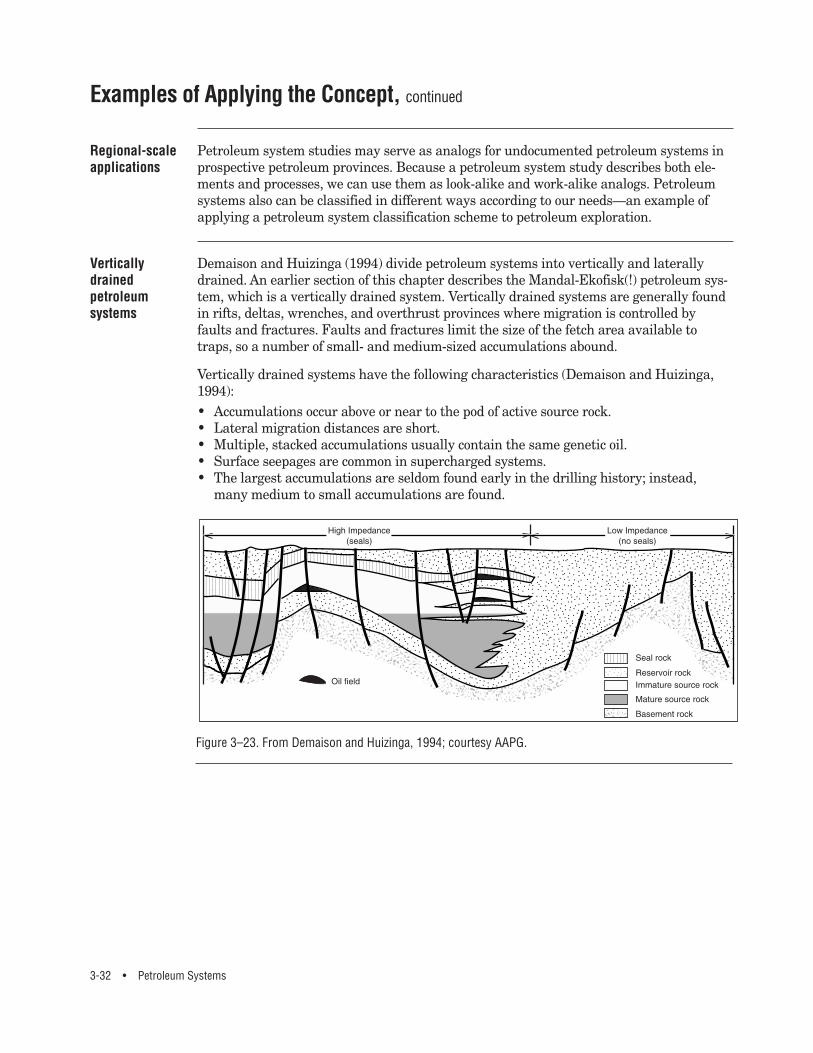
Demaison and Huizinga (1994) divide petroleum systems into vertically and laterallydrained. An earlier section of this chapter describes the Mandal-Ekofisk(!) petroleum sys-tem, which is a vertically drained system. Vertically drained systems are generally foundin rifts, deltas, wrenches, and overthrust provinces where migration is controlled byfaults and fractures. Faults and fractures limit the size of the fetch area available totraps, so a number of small- and medium-sized accumulations abound.
Vertically drained systems have the following characteristics (Demaison and Huizinga,1994): • Accumulations occur above or near to the pod of active source rock.• Lateral migration distances are short.• Multiple, stacked accumulations usually contain the same genetic oil. • Surface seepages are common in supercharged systems.• The largest accumulations are seldom found early in the drilling history; instead,
many medium to small accumulations are found.
Verticallydrainedpetroleumsystems
������������������������������������������������������������������������������������������������������������������������������
������������������������������������������������������������������������������������������������������������������������������������������������������������������������������������������������������������
��������������������������
������������Figure 3–23. From Demaison and Huizinga, 1994; courtesy AAPG.
Applying the Petroleum System Concept • 3-33
Examples of Applying the Concept, continued
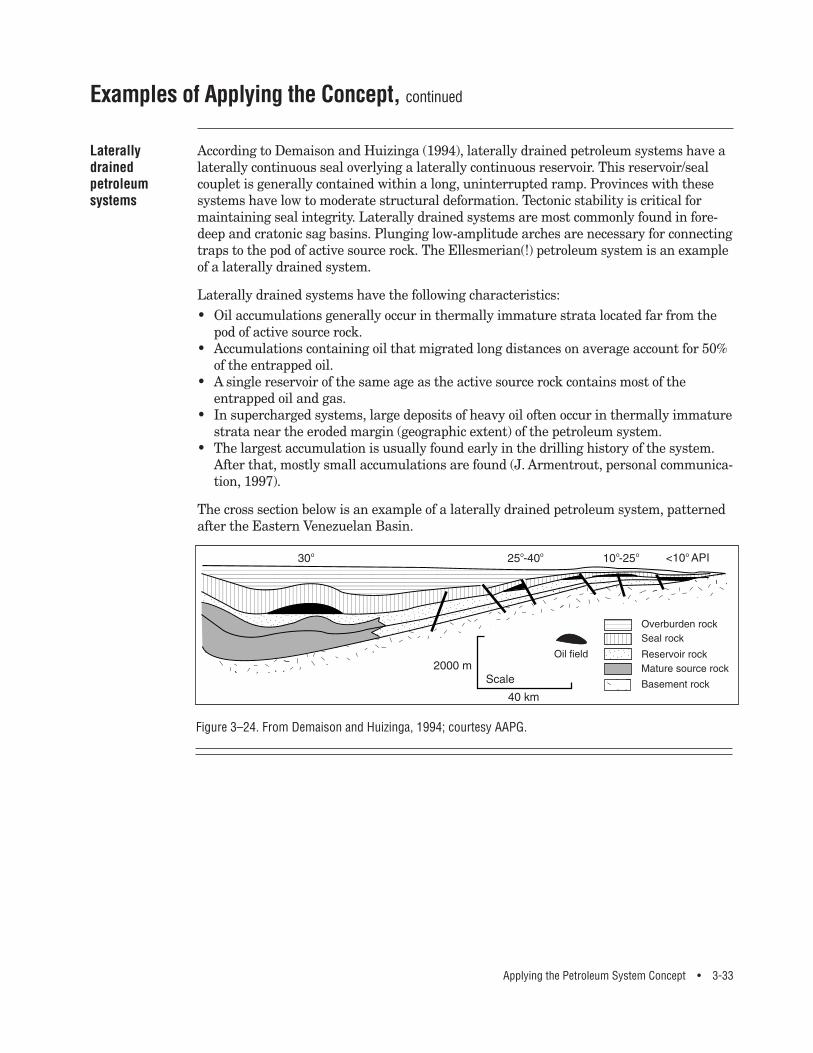
According to Demaison and Huizinga (1994), laterally drained petroleum systems have alaterally continuous seal overlying a laterally continuous reservoir. This reservoir/sealcouplet is generally contained within a long, uninterrupted ramp. Provinces with thesesystems have low to moderate structural deformation. Tectonic stability is critical formaintaining seal integrity. Laterally drained systems are most commonly found in fore-deep and cratonic sag basins. Plunging low-amplitude arches are necessary for connectingtraps to the pod of active source rock. The Ellesmerian(!) petroleum system is an exampleof a laterally drained system.
Laterally drained systems have the following characteristics: • Oil accumulations generally occur in thermally immature strata located far from the
pod of active source rock. • Accumulations containing oil that migrated long distances on average account for 50%
of the entrapped oil. • A single reservoir of the same age as the active source rock contains most of the
entrapped oil and gas.• In supercharged systems, large deposits of heavy oil often occur in thermally immature
strata near the eroded margin (geographic extent) of the petroleum system. • The largest accumulation is usually found early in the drilling history of the system.
After that, mostly small accumulations are found (J. Armentrout, personal communica-tion, 1997).
The cross section below is an example of a laterally drained petroleum system, patternedafter the Eastern Venezuelan Basin.
Laterallydrainedpetroleumsystems
������������������
yyyyyyyyyyyyyyyyyy
��yy���������������������������������������������������������������������������������������������������������������������������������������������������������������������������������������������������������������������������������������������������������������������������������������������������������������������������������������������������������������������������������������������������������������������������������������
����������
����������
����������
����������
����������
����������
����������
����������
����������
����������
����������
����������
����������
����������
����������
����������
����������
��������
����������
Figure 3–24. From Demaison and Huizinga, 1994; courtesy AAPG.
3-34 • Petroleum Systems
Barker, C., 1992, The role of source rock studies in petroleum exploration, in K.S. Johnsonand B.J. Cardott, eds., Source Rocks in the Southern Midcontinent, 1990 Symposium:Oklahoma Geological Survey Circular 93, p. 3–20.
Bird, K.J., 1994, Ellesmerian(!) petroleum system, North Slope, Alaska, USA, in L.B.Magoon and W.G. Dow, eds., The Petroleum System—From Source to Trap: AAPG Mem-oir 60, p. 339–358.
Cornford, C., 1994, The Mandal-Ekofisk(!) petroleum system in the Central Graben of theNorth Sea, in L.B. Magoon and W.G. Dow, eds., The Petroleum System—From Source toTrap: AAPG Memoir 60, p. 537–571.
Demaison, G., and B.J. Huizinga, 1994, Genetic classification of petroleum systems usingthree factors: charge, migration, and entrapment, in L.B. Magoon and W.G. Dow, eds.,The Petroleum System—From Source to Trap: AAPG Memoir 60, p. 73–89.
Hughes, W.B., A.G. Holba, D.E. Miller, and J.S. Richardson, 1985, Geochemistry of thegreater Ekofisk crude oils, in B.M. Thomas et al., eds., Petroleum Geochemistry in theExploration of the Norwegian Shelf: London, Graham and Trotman, p. 75–92.
Mackenzie, A.S., J.R. Maxwell, and M.L. Coleman, 1983, Biological marker and isotopestudies of North Sea crude oils and sediments: Proceedings of the 11th World PetroleumCongress, London, Section PD1(4), p. 45–56.
Magoon, L.B., 1995, The play that complements the petroleum system—a new explo-ration equation: Oil & Gas Journal, vol. 93, no. 40, p. 85–87.
Magoon, L.B., and W.G. Dow, 1994, The petroleum system, in L.B. Magoon and W.G. Dow,eds., The Petroleum System—From Source to Trap: AAPG Memoir 60, p. 3–24.
Sedivy, R.A., I.E. Penfield, H.I. Halpern, R.J. Drozd, G.A. Cole, and R. Burwood, 1987,Investigation of source rock–crude oil relationships in the northern Alaska hydrocarbonhabitat, in I. Tailleur and P. Weimer, eds., Alaskan North Slope Geology: Pacific SectionSEPM Book 50, p. 169–179.
Seifert, W.K., J.M. Moldowan, and R.W. Jones, 1980, Application of biological markerchemistry to petroleum exploration: Proceedings of the 10th World Petroleum Congress,Bucharest, p. 425–440.
Vincelette, R.R., and W.E. Chittum, 1981, Exploration for oil accumulations in EntradaSandstone, San Juan basin, New Mexico: AAPG Bulletin, vol. 65, p. 2546–2570.
Section D
References