
BD Social
7
The Relative Health Burden of Selected Social and Behavioral Risk Factors in the United States: Implications for Policy Peter Muennig, MD, MPH, Kevin Fiscella, MD, MPH, Daniel Tancredi, PhD, and Peter Franks, MD Heart disease, cancer, and stroke are the leading causes of death in the United States and much of the world. These deaths arise in part from behavioral risk factors such as smoking, obesity, and excessive alcohol use and in part from social risk factors, such as income and education disparities. 1 –4 Social risk factors also affect population health. 5,6 Howe ver , although publ ic hea lth poli cy has been directed at individual social and behavioral risks, there has been little systematic investigation of their relative contribution to US population healt h. Building on prior research, 7–10 we examined social risk in the context of health disparities resulting from an individual’s membership in a socially identifiable and disadvantaged group compared with membership in a nondisadvan- taged count erpart . 11 The poo r he al th outco me s of such groups has long been linked, in part, to diffe renti al access to everyd ay social goods, in- cluding access to medical care, transportation, housin g, and disab ility insura nce. 4,12 Social risk factors affect health through a wide array of pathwa ys including stress , discrimina tion, social exclusion, environmental exposures, and health behav iors. 3,13–17 We examined the potential health gains associated with selected policy goals that are at the forefront of the current national debates. These include smoking prevention, increased access to medica l care, poverty reducti on, and early childhood education programs targeted toward increasing high school graduation rates. To contextuali ze these finding s, we also ex- plored so me of the priority areas from Healthy People 2010. 1 8 We focused on specifi c polici es. For exa mpl e, we qua nti fied the popu lat ion hea lth benefit s of povert y reduction rather than the entire income gradient 1 9 ; however, we did not attempt to estimate the population health impact of any 1 policy . Rather , we simply pre sent the total burden of disease associated with each risk factor that targeted policies might address. The obj ect ive is to prov ide pol icym ake rs wit h a roug h sense of how different policy prioritie s might influence population health. METHODS We estimated the burden of disease in the United States associated with race (non- Hispanic Black versus non-Hispanic White); income (<200% of the federal poverty line versus ‡200%); schooling (<12 years versus ‡1 2); and health insura nce (none versus pri- vate). The selected behaviora l risk factors we studied were smoking (current versus never); obesity (body mass index [BMI; weight in kilograms divided by height in meters squared] ‡ 30 kg/m 2 versus 20 kg/m 2 to 24.9 kg/m 2 ); overweig ht (BMI 25 kg/m 2 to 29.9 kg/m 2 versus 20 kg/m 2 to 24.9 kg/m 2 ); and binge drinking (‡ 5 drinks per day at leas t 1 day per year versus < 5). Datasets We conducted all analys es by using consis- tent nationally representative datasets of the US noninstitutionalized population: the Na- tional Health Interview Survey (NHIS) linked both to the National Death Index and the Medical Expenditures Panel Survey (MEPS). We constructed mortality models with data from the 1 997–200 0 NHIS (157809 adults aged 18 to 85 years) linked to mortality data via the National Death Index (1904535 per- son-years, 5749 deaths), with follow-up through the end of 2002 (the most recent follow-up publicly available). 20,21 This linkage is achieved via participant identifiers within the NHIS (e.g., their social security number), and permit s prospective follow-u p of mortality data. The 1 except ion was the insura nce analys is, for which we used 1996–2000 MEPS dat a because the MEPS contains more detailed information than the NHIS. We exploited the MEPS linkage to the NHIS to obtain mortality follow-up through the end of 2002. We constructed health-related quality-of-life (HRQL) models by using the EuroQol (EQ-5D) from the 2000–2002 MEPS with US weights (38305 adults). 22,23 The EQ-5D is a 5-item prefer ence-b ased HRQL measure where partici- pants rate their problems with mobility , self- care, usual activities , pain or discomfort , and anxiety or depression with a 3-category scale Objectives. We soug ht to quan tify the pote ntial health impact of sele cted medical and nonmedical policy changes within the United States. Methods. Using data from the 1997–2000 National Health Interview Surveys (linked to mortality data through 2002) and the 1996–2002 Medical Expenditure Panel Surveys, we calculated age-specific health-relat ed quality-of-life scores and mortality probabilities for 8 social and behavioral risk factors. We then used Markov models to estimate the quality-adjusted life years lost. Results. Ranked quality-adjusted life years lost were income less than 200% of the poverty line versus 200% or greater (464 million; 95% confidence interval [CI]=368, 564); current-smoker versus never-smoker (329 million; 95% CI=226, 382); body mass index 30 or higher versus 20 to less than 25 (205 million; 95% CI=159, 269); non-Hispanic Black versus non-Hispanic White (120 million; 95% CI=83, 163); and less than 12 years of school relative to 12 or more (74 million; 95% CI= 52, 101 ). Bin ge dri nking , ove rwe igh t, and hea lth ins urance hav e relatively less influence on population health. Conclusions. Pove rty, smo king, and high -school drop outs impo se the grea test burd en of disease in the Un ited St ates .(Am J Publ ic Heal th. 2010;100:1758–1764. doi:10.2105/AJPH.2009.165019) RESEARCH AND PRACTICE 1758 | Research and Practice | Peer Reviewed | Muennig et al. Ameri can Journal of Public Health | September 2010, Vol 100, No. 9
-
Upload
peter-muennig -
Category
Documents
-
view
220 -
download
0
Transcript of BD Social

7/25/2019 BD Social
http://slidepdf.com/reader/full/bd-social 1/7
The Relative Health Burden of Selected Social and Behavioral RiskFactors in the United States: Implications for Policy
Peter Muennig, MD, MPH, Kevin Fiscella, MD, MPH, Daniel Tancredi, PhD, and Peter Franks, MD
Heart disease, cancer, and stroke are the
leading causes of death in the United States
and much of the world. These deaths arise in
part from behavioral risk factors such as
smoking, obesity, and excessive alcohol use
and in part from social risk factors, such as
income and education disparities.1–4 Social
risk factors also affect population health.5,6
However, although public health policy has been
directed at individual social and behavioral risks,
there has been little systematic investigation of
their relative contribution to US population
health.
Building on prior research,7–10 we examined
social risk in the context of health disparities
resulting from an individual’s membership in
a socially identifiable and disadvantaged group
compared with membership in a nondisadvan-
taged counterpart.11The poor health outcomes of
such groups has long been linked, in part, to
differential access to everyday social goods, in-
cluding access to medical care, transportation, housing, and disability insurance.4,12 Social risk
factors affect health through a wide array of
pathways including stress, discrimination, social
exclusion, environmental exposures, and health
behaviors.3,13–17
We examined the potential health gains
associated with selected policy goals that are at
the forefront of the current national debates.
These include smoking prevention, increased
access to medical care, poverty reduction, and
early childhood education programs targeted
toward increasing high school graduation rates.
To contextualize these findings, we also ex-
plored some of the priority areas from Healthy
People 2010.18 We focused on specific policies.
For example, we quantified the population health
benefits of poverty reduction rather than the
entire income gradient 19; however, we did not
attempt to estimate the population health impact
of any 1 policy. Rather, we simply present the
total burden of disease associated with each risk
factor that targeted policies might address. The
objective is to provide policymakers with a rough
sense of how different policy priorities might
influence population health.
METHODS
We estimated the burden of disease in the
United States associated with race (non-
Hispanic Black versus non-Hispanic White);
income (<200% of the federal poverty line
versus ‡200%); schooling (<12 years versus
‡12); and health insurance (none versus pri-
vate). The selected behavioral risk factors we
studied were smoking (current versus never);
obesity (body mass index [BMI; weight in
kilograms divided by height in meters squared]
‡30 kg/m2 versus 20 kg/m2 to 24.9 kg/m2 );
overweight (BMI 25 kg/m2 to 29.9 kg/m2
versus 20 kg/m2 to 24.9 kg/m2 ); and binge
drinking (‡5 drinks per day at least 1 day per
year versus < 5).
Datasets
We conducted all analyses by using consis-
tent nationally representative datasets of the
US noninstitutionalized population: the Na-
tional Health Interview Survey (NHIS) linked
both to the National Death Index and the
Medical Expenditures Panel Survey (MEPS).
We constructed mortality models with data from the 1997–2000 NHIS (157 809 adults
aged 18 to 85 years) linked to mortality data
via the National Death Index (1904535 per-
son-years, 5749 deaths), with follow-up
through the end of 2002 (the most recent
follow-up publicly available).20,21 This linkage
is achieved via participant identifiers within the
NHIS (e.g., their social security number), and
permits prospective follow-up of mortality data.
The 1 exception was the insurance analysis, for
which we used 1996–2000 MEPS data because
the MEPS contains more detailed information
than the NHIS. We exploited the MEPS linkage
to the NHIS to obtain mortality follow-up
through the end of 2002.
We constructed health-related quality-of-life
(HRQL) models by using the EuroQol (EQ-5D)
from the 2000–2002 MEPS with US weights
(38305 adults).22,23 The EQ-5D is a 5-item
preference-based HRQL measure where partici-
pants rate their problems with mobility, self-
care, usual activities, pain or discomfort, and
anxiety or depression with a 3-category scale
Objectives. We sought to quantify the potential health impact of selected
medical and nonmedical policy changes within the United States.
Methods. Using data from the 1997–2000 National Health Interview Surveys
(linked to mortality data through 2002) and the 1996–2002 Medical Expenditure
Panel Surveys, we calculated age-specific health-related quality-of-life scores
and mortality probabilities for 8 social and behavioral risk factors. We then used
Markov models to estimate the quality-adjusted life years lost.
Results. Ranked quality-adjusted life years lost were income less than 200% of
the poverty line versus 200% or greater (464 million; 95% confidence interval
[CI]=368, 564); current-smoker versus never-smoker (329 million; 95% CI=226,382); body mass index 30 or higher versus 20 to less than 25 (205 million; 95%
CI=159, 269); non-Hispanic Black versus non-Hispanic White (120 million; 95%
CI=83, 163); and less than 12 years of school relative to 12 or more (74 million;
95% CI= 52, 101). Binge drinking, overweight, and health insurance have
relatively less influence on population health.
Conclusions.Poverty, smoking, and high-school dropouts impose the greatest
burden of disease in the United States. (AmJ PublicHealth. 2010;100:1758–1764.
doi:10.2105/AJPH.2009.165019)
RESEARCH AND PRACTICE
1758 | Research and Practice | Peer Reviewed | Muennig et al. American Journal of Public Health | September 2010, Vol 100, No. 9

7/25/2019 BD Social
http://slidepdf.com/reader/full/bd-social 2/7
(no problems, some problems, extreme prob-
lems). This score is translated into a value rang-
ing from zero (equivalent to death) to 1 (equiv-
alent to perfect health).
The MEPS is a subsample of NHIS respon-dents, so the 2 surveys can be linked.24 Persons
were eligible for inclusion in these analyses if
they were aged 18 years or older. There was
no upper age limit except for the insurance
analysis, which ran to age 65 (the age at which
almost all persons become insured through
Medicare).
Risk Factor Selection
Our choice of risk factors was guided by
the published literature1,19,25–29 but limited by
data available in both NHIS and MEPS.
Behavioral risk factors. We identified smok-
ing, obesity, overweight, and alcohol misuse as
4 important behavioral risk factors.1,26,29 Be-
cause we lacked reliable measures of alcohol
dependence in our data, we substituted binge
drinking to at least capture some of the risk.
Other behavioral risk factors such as exercise
level, sexual behavior, and the use of illicit drugs
either appear to have less impact or there were
inadequate data for estimation.
Social risk factors. The most studied social
factors are those related to socioeconomic
status and race, which appear to have powerfulindependent effects on mortality.17,30–33 We
also included absence of health insurance as
a social risk factor. Although having health
insurance may also be viewed as a mediator of
social risk rather than a social risk factor itself, it
shares many common characteristics of social
risk factors, including being largely shaped by
social policy and strongly clustering with other
social risk factors.34 Occupation also shapes
health both indirectly through income and di-
rectly through social status, social networks,
occupational hazards, stress, agency, and behav-
ioral norms. However, unlike education and
income, there are no generally accepted ordinal
(or dichotomous) measures in the available data
that fully capture these disparate aspects of
occupational risk, so we did not examine it.
Risk Factor Thresholds
We developed a series of dichotomous
thresholds to compare individuals with the risk
factor present to those with no risk factor
present. Thresholds were primarily chosen
based upon the potential health benefits asso-
ciated with current policy goals.
Most social programs aimed at addressing
income disparities in the United States are
targeted toward poverty alleviation. Theseinclude earned income tax credits, school lunch
programs, and Medicaid. Most programs vary
by state, but are targeted to those earning less
than 200% of the federal poverty line.35–37
Thus, we used less than 200% relative to 200%
or more of the poverty line, per 2000 Census
definitionsobtained via the MEPS, as a threshold.
Most education programs are geared toward
improving high-school graduation.38 We
therefore chose the threshold for educational
attainment (less than12 years versus12 years or
more) based on whether individuals possessed
a high school diploma, as it is the basic social
credential needed for employment.
The smoking analysis compared current
smokers with never smokers. Former smokers
were excluded because many have quit only
after developing serious underlying disease,
and in the cross-sectional data available their
mortality and HRQL were worse than that of
current smokers.
The overweight (BMI‡25 kg/m2 to 29.9
kg/m2 ) and obesity (BMI‡30 kg/m2 ) analyses
used standard thresholds.39 However, we used
normal BMI (‡20 kg/m2
to 24.9 kg/m2
) asour reference rather than BMI from 18.5 kg/m2
to 24.9 kg/m2 to ensure that we did not include
chronically ill persons (who are prevalent in
the 18.5 kg/m2 to 19.9 kg/m2 range) in the
reference group.40 This analysis reflects the
potential health benefits associated with over-
weight and obesity prevention.
The race analyses compared non-Hispanic
Blacks with non-Hispanic Whites. African
Americans have the worst life expectancy of
any major minority group. We conducted 2
analyses, first without controlling for income
and education and then again controlling for
these factors. The former analysis may be
useful for estimating the health benefits asso-
ciated with community-targeted education in-
terventions, such as Head Start or reduced class
size programs. The latter analysis is meant to
estimate the health benefits associated with
antidiscrimination policies.
The health insurance analysis compared
those with no coverage for 12 months in the
survey year with those having 12 months of
private coverage. We excluded those on public
health insurance because these persons often
have severe medical morbidity or disabilities
complicating the assessment of health insur-
ance effects. This analysis helps estimate the potential health benefits associated with uni-
versal health insurance.
The binge drinking analysis was constrained
by the available data to comparing those
drinking 5 or more drinks per day at least 1 day
per year with those drinking less. This analysis
helps estimate the potential health benefits
associated with either community- or office-
based anti–binge drinking programs.
Outcome Measure
To assess relative effects of social and be-
havioral risk factors on population health, we
used quality-adjusted life years (QALYs), which
capture both morbidity and mortality in a
single metric. The QALY is capable of com-
paring disparate conditions, such as depression
and stroke, or effects of disparate risk factors.41
Central to the QALY is the HRQL score, here
measured as the EQ-5D.42
Regression Analyses
We conducted regression analyses with
Stata version 10.1 (Statacorp, College Station,
TX), adjusting for the complex survey designsof the NHIS and MEPS. We estimated risk
factor stratified regression models separately
for mortality and for HRQL. Confidence inter-
vals for estimated regression coefficients were
adjusted for the survey design and were based
on the linearized (robust) variance estimator.
To derive the age-specific mortality risks and
HRQL scores, we used the sample of partici-
pants with the risk factor present as a standard
population as follows. First, we estimated re-
gression coefficients from a pair of mortality
and HRQL regression analyses of the datasets
involving only persons with the risk factor
present. From these regression analyses, we
generated age-specific mortality rates and
HRQL scores for the ‘‘risk factor present’’
condition. Second, we estimated regression
coefficients from mortality and HRQL regres-
sion analyses involving only those with the risk
factor absent. We then applied the regression
coefficients from the analyses of those with the
risk factor absent to the covariate values of
those with the risk factor present to predict the
RESEARCH AND PRACTICE
September 2010, Vol 100, No. 9 | American Journal of Public Health Muennig et al. | Peer Reviewed | Research and Practice | 1759

7/25/2019 BD Social
http://slidepdf.com/reader/full/bd-social 3/7
corresponding counterfactual (‘‘risk factor ab-
sent’’) age-specific mortality rates and HRQL
scores.
We adjusted all regression models for a baseset of covariates: age, log age (to address non-
linear age effects), gender, region of the country
(Northeast, South, Midwest, West), and survey
year (as a series of dummy variables). When
included as covariates, we measured income
and educational attainment with 5 categories
each (<100%, 100% to 124%, 125% to 199%,
200% to 399%, and ‡400% of the federal
poverty level; and <12 years, 12 years, 13 to
15 years, 16 years, and >16 years of schooling
completed), and race/ethnicity was measured
as 4 categories (non-Hispanic White, non-
Hispanic Black, Hispanic, or Asian). See Table 1
for a listing of variables included as covariates
in each analysis.
We estimated mortality regression coeffi-
cients with a multiplicative hazards parametric
regression model of age-at-event failure time
data, specified as a log-linear model by using
Poisson regression.43,44 To better estimate the
impact of time-varying age on the baseline
hazard, this model used person-years as the unit
of analysis, with each participant contributing an
observation for each full or partial year of follow-
up. A person-year observation could represent
only a partial-year of follow-up because of the
timing of death relative the NHIS interview.We used standard methods in the Poisson re-
gression model to account for differences in
observation lengths.44,45 We estimated HRQL
regression coefficients with a survey weighted
least squares linear regression model with
EQ-5D scores as the dependent variable.
Markov Cohort Models
We used Markov cohort models to compute
the expected QALYs gained when risk factors
are removed from the US population. The
models used our regression-derived mortality
probabilities and mean HRQL scores (in 1-year
age intervals) as inputs. We ran models to age
85 years. We also ran them to age 65 years
to (1) provide prime-of-life estimates, (2) facil-
itate comparisons with the insurance analysis
(which also ran only to age 65 years), and (3)
explore survivor effects.
During each 1-year cycle, the age-specific
mortality risk was used to transition partici-
pants to the ‘‘dead’’ state beginning at the next
cycle,at whichpoint they exited the model with
all subsequent HRQL scores set to zero. The
remaining participants were assigned to the
‘‘alive’’ state and received the HRQL score
for the next age (based on the appropriate
age and risk-factor–specific HRQL score input parameter). No discounting was applied to
our estimates to ensure comparability with
other burden of disease study methodology. All
Markov models were built with DATApro
2006 (TreeAge Software, Williamstown, MA).
We estimated the overall societal health
impact by multiplying the incremental differ-
ences in quality-adjusted life expectancy in
QALYs by the number of adults in the United
States at risk to obtain total QALYs lost asso-
ciated with the risk factor.
We used the 95% confidence intervals
around each age-specific HRQL and mortality
parameter estimate to derive 95% Monte Carlo
confidence intervals for each estimate of
QALYs lost associated with a given risk factor.
Each distribution was sampled 100 times per
trial, and1000 trials were run for each analysis.
The final output for each model was normally
distributed.
RESULTS
Sample sizes, population proportions, and
person-years of follow-up are shown in Table2. The mean age of the sample was 46.3 years
(standard error [SE]= 0.14), with 55.4%
(SE = 0.2) women. The mean EQ-5D score was
0.87 (SE = 0.001).
Table 3 presents the quality-adjusted life
expectancy at age 18 years with and without
the risk factor alongside rankings of the in-
cremental health impact (the gains associated
with eliminating the risk) of each risk factor
over the lifespan of the average American. On
average, living at less than 200% federal
poverty level showed the greatest impact on
health, resulting in a net loss of 8.2 QALYs per
person exposed. Smoking was second, with
6.6 QALYs lost per person over his or her
lifetime. These were followed by the following
risk factors in rank order: less than 12 years of
school, being non-Hispanic Black, obesity,
binge drinking, lack of health insurance, and
overweight. When modeling was truncated at
age 65 years, smoking dropped in ranking.
Table 4 presents estimates of the US burden
of disease associated with each risk factor. This
TABLE 1—Covariates Used for Each Risk Factor Regression Model for Estimating the Impact
of Common Social and Behavioral Risk Factors on US Population Health: 1997–2000
National Health Interview Survey Followed Through 2002
Risk Factor Model Covariates
< 12 years schooling Base, race/ethnicity
< 200% of federal poverty line Base, race/ethnicity
< 200% of federal poverty linea
Base, race/ethnicity, education
Non-Hispanic Black Base
Non-Hispanic Blackb
Base, income, education
No health insurance Base, race/ethnicity, income, education
Smoking Base, race/ethnicity, income, education
Obesityc
Base, race/ethnicity, income, education, smoking status
Overweight Base, race/ethnicity, income, education, smoking status
Binge drinking d
Base, race/ethnicity, income, education, smoking status
Notes. Base covariates were age, log age, region, survey year. Race/ethnicity was categorized as non-Hispanic White, non-
Hispanic Black, Hispanic, Asian. Income categories were <100%, 100% to 124%, 125% to 199%, 200% to 399%, ‡400% of
federal poverty line. Education categories were <12 years, 12 years, 13 to 15 years, 16 years, >16 years schooling
completed.aPer 2000 Census definitions obtained via the MEPS. The poverty analysis was conducted twice, once with and once without
education included as a covariate to isolate the effects of adult income programs and childhood intervention programs.b The race analysis was conducted twice, once with and once without income and education added as covariates to isolate the
burden of disease associated with childhood intervention programs and anti–racial discrimination programs, respectively.cDefined by body mass index (BMI; weight in kilograms divided by height in meters squared). Obesity indicated by BMI ‡30 kg/m
2.
dDefined as more than 5 or more drinks per day at least 1 day per year.
RESEARCH AND PRACTICE
1760 | Research and Practice | Peer Reviewed | Muennig et al. American Journal of Public Health | September 2010, Vol 100, No. 9
7/25/2019 BD Social
http://slidepdf.com/reader/full/bd-social 4/7
analysis takes into account both the average
impact on individuals and the number of in-
dividuals exposed. Here, poverty was again
the leading risk factor, resulting in 544 million
QALYs lost (range=434 million to 666 mil-
lion). Smoking was again second, at 332 million
QALYs lost (range=246 million to 415 mil-
lion). Having less than 12 years of education
was again third, followed by being obese, being
non-Hispanic Black, binge drinking, being
overweight, and being uninsured. The Monte
Carlo confidence intervals for the estimates for
no health insurance and overweight overlap
with zero, indicating the effects were not
statistically significant. In the analyses through
age 65 years, poverty was again the leading
risk factor, with other rankings largely
unchanged.
DISCUSSION
There is debate over the extent to which
health policies should be directed at broader
social risk factors (such as race, education,
poverty, and health insurance) relative to nar-
rower, intermediate, and behavioral risk factors(such as smoking, obesity, and alcohol con-
sumption).32,46 Although there is substantial
overlap, the former are generally addressed by
nonmedical social policies, some of which are
controversial in the US context, and the latter via
the public health and medical systems.27 One
missing piece of information in this debate is the
relative extent to which these major risk factors
impact population health. Numerous studies
have examined the impact of behavioral and
social risk factors on health,17,30,31,47–52 but this
is the first study to examine these together by
using a consistent analytic approach applied to
the same set of nationally representative data.
We found that living at less than 200% of the federal poverty level reduced quality-
adjusted life expectancy more than any other
risk factor, even after we controlled for effects
of education. However, smoking also proved
to be a major contributor to population health,
outweighing the overall impact of less than
12 years of schooling and being non-Hispanic
Black. The individual impacts on QALYs of
living at less than 200% of the federal poverty
level, failing to graduate from high school,
and being non-Hispanic Black were each
greater than that of obesity. However, on a
population level, the high prevalence of obesity
renders it the fourth largest public health
problem we, falling behind being poor,
a smoker, or a high school dropout in impor-
tance. The relatively small impact of schooling
in our analyses was surprising, and may reflect
the declining health-related significance of
high-school graduation, effects of social grade
promotion, and inclusion of those with general
equivalency diplomas.
Our analysis captured age-related differ-
ences in mortality; used consistent, nationally
representative data sources that captured rele-vant confounders; used predictive modeling;
and included measures of morbidity. The
primary limitation was that risk factor cate-
gories are not entirely independent, but
rather overlap in complex ways. For instance,
low-income persons are more likely to
smoke, so the smoking analysis will capture
some income effects. To address this limitation,
we introduced control variables into our
models. However, it is likely that other un-
adjusted confounders may have biased our
findings.
Confounding was also a challenge in our
smoking and drinking analyses. Those with
either of these risk factors may be more likely
to engage in other risk-taking behaviors for
which we were not able to account. Thus, our
estimates of the burden of disease associated
with these factors may be overstated. Other
unmeasured confounders, such as genetic fac-
tors or personality profiles, may also have
resulted in overestimates of the burden of
disease reported here.
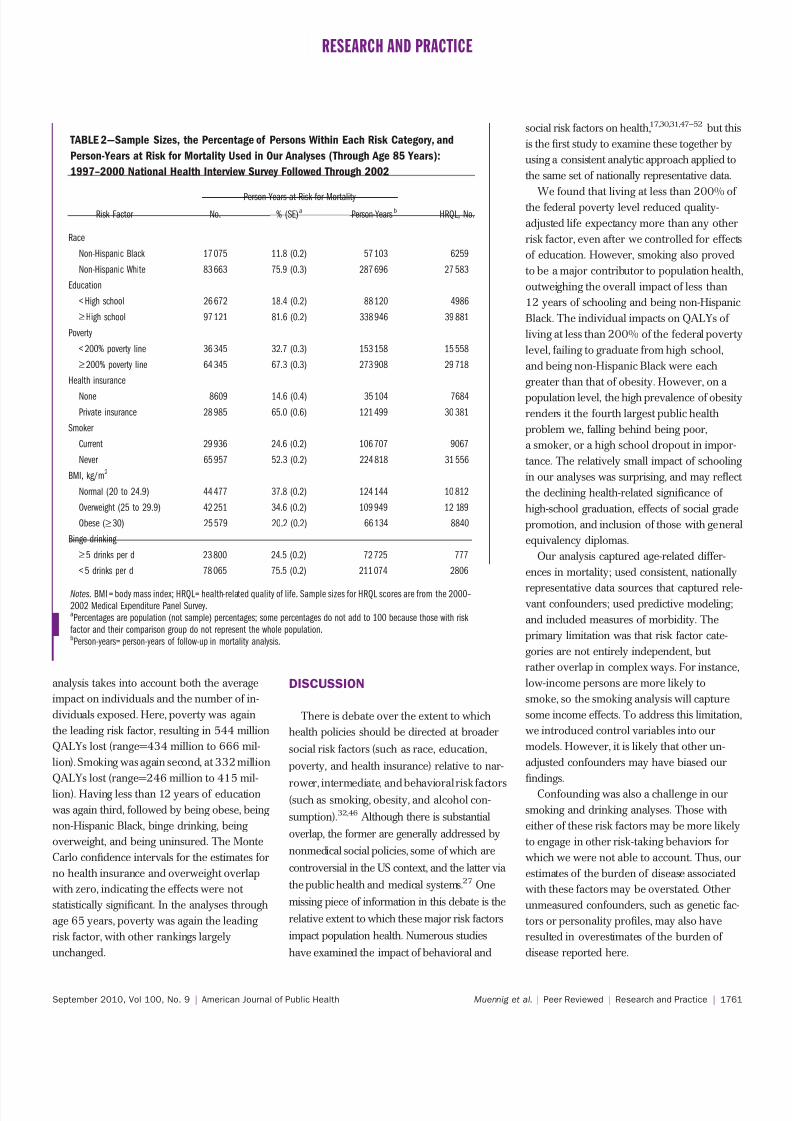
TABLE 2—Sample Sizes, the Percentage of Persons Within Each Risk Category, and
Person-Years at Risk for Mortality Used in Our Analyses (Through Age 85 Years):
1997–2000 National Health Interview Survey Followed Through 2002
Person-Years at Risk for Mortality
Risk Factor No. % (SE)a
Person-Yearsb
HRQL, No.
Race
Non-Hispanic Black 17 075 11.8 (0.2) 57 103 6259
Non-Hispanic White 83 663 75.9 (0.3) 287 696 27 583
Education
< High school 26 672 18.4 (0.2) 88 120 4986
‡High school 97 121 81.6 (0.2) 338 946 39 881
Poverty
< 200% poverty line 36 345 32.7 (0.3) 153 158 15 558
‡200% poverty line 64 345 67.3 (0.3) 273 908 29 718
Health insurance
None 8609 14.6 (0.4) 35 104 7684
Private insurance 28 985 65.0 (0.6) 121 499 30 381
Smoker
Current 29 936 24.6 (0.2) 106 707 9067
Never 65 957 52.3 (0.2) 224 818 31 556
BMI, kg/m2
Normal (20 to 24.9) 44 477 37.8 (0.2) 124 144 10 812
Overweight (25 to 29.9) 42 251 34.6 (0.2) 109 949 12 189
Obese (‡30) 25 579 20.2 (0.2) 66 134 8840
Binge drinking
‡5 drinks per d 23 800 24.5 (0.2) 72 725 777
< 5 drinks per d 78 065 75.5 (0.2) 211 074 2806
Notes. BMI = body mass index; HRQL= health-related quality of life. Sample sizes for HRQL scores are from the 2000–
2002 Medical Expenditure Panel Survey.aPercentages are population (not sample) percentages; some percentages do not add to 100 because those with risk
factor and their comparison group do not represent the whole population.bPerson-years= person-years of follow-up in mortality analysis.
RESEARCH AND PRACTICE
September 2010, Vol 100, No. 9 | American Journal of Public Health Muennig et al. | Peer Reviewed | Research and Practice | 1761

7/25/2019 BD Social
http://slidepdf.com/reader/full/bd-social 5/7
A further limitation is that policy solutions
aimed at addressing the burden of disease
associated with earning less than 200% of the
poverty line are less than clear because the
income–health relationship is bidirectional.53
Poverty produces a wide array of risk factors
(e.g., crime, poor housing, limited access to
medical care) thereby damaging the health and
longevity of low-income populations. But
sickness also leads to unemployment and pov-
erty. The policy implications for these 2 path-
ways differ. Poverty itself might be addressed
through policies that minimize inequalities in
schooling (e.g., through early intervention pro-
grams) or through the Earned Income Tax
Credit.52,53 In contrast, to address the effect of
health on income, policies such as universal
health insurance and disability insurance would
better stem the loss of income among those who
are poor because they are sick.54,55 Likewise,
our health insurance analysis was designed to
detect potential benefits associated with
improved access to medical care. However, health insurance would also protect health by
reducing income shocks associated with illness;
health care costs are a leading cause of home
foreclosure.
Differences in the follow-up interval for
mortality estimates, the time intervals over
which the risk factors are captured, and re-
gression model design (e.g., treating inputs as
moderators versus mediators) also affect our
estimates of population health impact of the
risk factor under study. Risk factor status was
assessed at baseline only, so that misclassifica-
tion over time would produce biased estimates.
This bias was somewhat reduced by the short
follow-up interval. However, the risk factors
we estimated were of a similar magnitude
to those in the medical literature.17,30,31,47–52
We were only able to explore the limited
range of socio–behavioral risk factors available
in the datasets we used. As with other burden
of disease studies, our estimates can only
serve as guideposts for policymakers; the pol-
icies we identify will not eliminate the risk
factor in the population. Conversely, policies
can have spillover effects. For example, theoverall income–health gradient is much larger
than the poverty gradient,19 so spillover effects
from poverty reduction programs could produce
larger gains. Finally, inputs were self-reported.
Others have shown that intermediate causes
of deaths—behavioral risk factors, microbial
agents, toxic agents, motor vehicle accidents,
and firearms—account for more than half of all
the deaths in the United States.1,29 We extend
these earlier analyses to include measures of
morbidity and key social determinants of health.
We find that living at less than 200% of the
federal poverty level imposes a greater societal
health burden than either of the leading behav-
ioral causes of death—tobacco and obesity. Con-
sistent with this, the original planning committee
for Healthy People 2010 strongly considered
including poverty and educational attainment
among its leading indicators.56 Our findings
provide additional justification for including so-
cial determinants in Healthy People 2020 and
may help inform priority setting aimed at opti-
mizing population health. j
TABLE 3—Quality-Adjusted Life Expectancy at Age 18 for Persons With and Without Each
Risk Factor Under Study, and Incremental Quality Adjusted Life-Years (QALYs) Lost by Age
65 or 85 Years: 1997–2000 National Health Interview Survey Followed Through 2002
Risk Factor
QALYs From Age18 to 65 Years,
Mean (SD)
IncrementalQALYs Lost to Age
65 Years, Mean
QALYs From Age 18 to 85
Years, Mean (SD)
Incremental QALYsLost to Age
85 Years, Mean
Poverty
‡200% poverty line 41.2 (0.6) 52.9 (1.2)
< 200% poverty line 36.8 (0.7) 4.5 44.7 (1.2) 8.2
Smoker a
Never 40.1 (0.6) 50.9 (1.1)
Current 37.4 (0.7) 2.7 44.2 (1.1) 6.6
Poverty adjusted for education
‡200% poverty line 40.1 (0.6) 51.0 (1.1)
< 200% poverty line 36.7 (0.7) 3.4 44.7 (1.1) 6.4
Education‡High school 40.1 (0.6) 50.8 (1.1)
< High school 37.8 (0.7) 2.2 45.8 (1.2) 5.1
Race
Non-Hispanic White 40.2 (0.6) 50.9 (1.1)
Non-Hispanic Black 38.4 (0.7) 1.8 46.2 (1.2) 4.7
Obesityb
Normal (BMI= 20 to 24.9 kg/m2) 40.6 (0.6) 52.2 (1.1)
Obese (BMI‡30 kg/m2) 38.2 (0.6) 2.4 48.0 (1.1) 4.2
Race adjusted for income, educationa
Non-Hispanic White 38.8 (0.6) 48.0 (1.1)
Non-Hispanic Black 38.3 (0.7) 0.5 46.3 (1.2) 1.7
Binge drinking b
< 5 drinks per d 40.2 (0.7) 50.5 (1.2)
‡5 drinks per d 39.6 (0.6) 0.62 49.3 (1.1) 1.2
Health insurancea
Private insurance 40.0 (0.7) . . .
None 39.4 (0.6) 0.6 . . . . . .
Overweightb
Normal (BMI= 20 to < 25 kg/m2) 40.9 (0.6) 52.7 (1.2)
Overweight (BMI=25 to 29.9 kg/m2) 40.4 (0.6) 0.5 52.4 (1.2) 0.3
Note. BMI = body mass index. All regressions adjusted for age, log age, gender, race/ethnicity (except race model), region of
residence (Northeast, South, Midwest, West), and survey year.a Adjusted for poverty (< 100%, 100% to 124%, 125% to 199%, 200% to 399%, ‡ 400% of the federal poverty level) and
education levels (< 12 years, 12 years, 13 to 15 years, 16 years, > 16 years of schooling completed).b Adjusted for poverty, education levels, and smoking status.
RESEARCH AND PRACTICE
1762 | Research and Practice | Peer Reviewed | Muennig et al. American Journal of Public Health | September 2010, Vol 100, No. 9

7/25/2019 BD Social
http://slidepdf.com/reader/full/bd-social 6/7
About the AuthorsPeter Muennig is with the Department of Health Policy and Management at the Mailman School of Public Health,
Columbia University, New York, NY. Kevin Fiscella is with the Departments of Family Medicine and Community and Preventive Medicine at the University of Rochester
School of Medicine and Dentistry, Rochester, NY. Daniel Tancredi is with the Center for Healthcare Policy and Research and the Department of Pediatrics at the University of California at Davis. Peter Franks is with the Center
for Healthcare Policy and Research and Department of Family and Community Medicine at the University of California at Davis.
Correspondence should be sent to Peter Muennig,MD, MPH, Assistant Professor, Health Policy and Management, Mailman School of Public Health, Columbia
University. 600 W 168th St, 6th Floor, New York, NY 10032 (e-mail: [email protected]). Reprints can be ordered at http://www.ajph.org by clicking the ‘‘Reprints/ Eprints’’ link.
This article was accepted July 5, 2009.
ContributorsP. Muennig led the article development and conductedthe Markov model analyses. K. Fiscella helped developthe policy model and contributed to article development.D. Tancredi provided expert input on the development and refinement of the regression models and contributedto article development. P. Franks co-led the articledevelopment and led the development of regressionmodels.
Human Participant ProtectionThis study used only anonymous nationally representa-tive datasets and no additional institutional review boardapproval was needed.
References1. McGinnis JM, Foege WH. Actual causes of death inthe United States. JAMA. 1993;270(18):2207–2212.
2. Link BG, Phelan J. Social conditions as funda-mental causes of disease. J Health Soc Behav . 1995;35:
80–94.3. Adler NE, Ostrove JM. Socioeconomic status and
health: what we know and what we don’t. Ann N Y Acad Sci . 1999;896:3–15.
4. Virchow R. Notes on the typhoid epidemic prevail-ing in Upper Silesia. Arch Pathologische Anatomie Physi- ologic Klinische Medizin . 1849;2:143–322.
5. World Health Organization. Commission on thesocial determinants of health. Available at: http://www.who.int/social_determinants/en. Accessed October 19, 2008.
6. Robert Wood Johnson Foundation. Commission toBuild a Healthier America. Available online at: http://www.commissiononhealth.org. Accessed October 19,2008.
7. Smedly BD, Stith AY, Nelson AR. Unequal Treat- ment: Confronting Racial and Ethnic Disparities in Health Care . Washington, DC: National Academy Press; 2002.
8. Starfield B. Pathways of influence on equity in health. Soc Sci Med . 2007;64(7):1355–1362.
9. Rathore SS, Krumholz HM. Differences, disparities,and biases: clarifying racial variations in health care use.
Ann Intern Med . 2004;141(8):635–638.
10. Braveman P, Gruskin S. Defining equity in health. J Epidemiol Community Health . 2003;57(4):254–258.
11. Franks P, Fiscella K. Reducing disparities down-stream: prospects and challenges. J Gen Intern Med .2008;23(5):672–677.
12. Sen A. Development as Freedom . New York, NY:Knopf; 1999.
13. Christakis NA, Fowler JH. The spread of obesity ina large social network over 32 years. N Engl J Med .2007;357(4):370–379.
14. Christakis NA, Fowler JH. The collective dynamicsof smoking in a large social network. N Engl J Med . 2008;358(21):2249–2258.
15. Lantz PM, House JS, Lepkowski JM, Williams DR,Mero RP, Chen J. Socioeconomic factors, health behav-iors, and mortality: results from a nationally representa-tive prospective study of US adults. JAMA. 1998;279(21):1703–1708.
16. McEwen BS, Mirsky AE. How socioeconomic statusmay ‘‘get under the skin’’ and affect the heart. Eur Heart J .2002;23(22):1727–1728.
17. Williams DR. Race, socioeconomic status, and health. The added effects of racism and discrimination. Ann N Y Acad Sci . 1999;896:173–188.
18. Healthy People 2010: Understanding and Improving
Health . Washington, DC: US Department of Health andHuman Services; 2000:30–31.
19. Muennig P, Franks P, Jia H, Lubetkin E, Gold MR.The income-associated burden of disease in the UnitedStates. Soc Sci Med . 2005;61(9):2018–2026.
20. National Center for Health Statistics. NationalHealth Interview Survey. Available at: http://www.cdc.gov/nchs/nhis.htm. Accessed August 3, 2008.
21. National Center for Health Statistics. National DeathIndex. Available at: http://www.cdc.gov/nchs/r&d/nchs_datalinkage/nhis_data_linkage_mortality_ activities.htm. Accessed August 3, 2008.
22. Agency for Health and Research Quality. MedicalExpenditure Panel Survey. Available at: http://www.meps.ahrq.gov/mepsweb. Accessed August 3, 2008.
23. Shaw JW, Johnson JA, Coons SJ. US valuation of theEQ-5D health states: development and testing of the D1valuation model. Med Care . 2005;43(3):203–220.
24. National Center for Health Statistics. NationalHealth Interview Survey and Medical Expenditure PanelSurvey Linkage Files. Available at: http://www.cdc.gov/nchs/about/major/nhis/nhismep.htm. Accessed June 7,2009.
25. Murray CJL, Lopez AD. Alternative projections of mortality and disability by cause 1990-2020: GlobalBurden of Disease Study. Lancet . 1997;349(9064):1498–1504.
26. Murray CJL, Lopez AD, Harvard School of Public Health, World Health Organization, World Bank. The Global Burden of Disease: A Comprehensive Assessment of
Mortality and Disability From Diseases, Injuries, and Risk Factors in 1990 and Projected to 2020 . Cambridge, MA:Harvard School of Public Health; 1996.
27. Schoeni RF, House JS, Kaplan GA, Pollack H, eds.Making Americans Healthier: Social and Economic Policy as Health Policy . New York, NY: Russell Sage Foundation;2008.
28. Franks P, Muennig P, Lubetkin E, Jia H. The burdenof disease associated with being African American in the
United States and the contribution of socioeconomic status. Soc Sci Med . 2006;62(10):2469–2478.
29. Mokdad AH, Marks JS, Stroup DF, Gerberding JL.Actual causes of death in the United States, 2000. JAMA.2004;291(10):1238–1245.
TABLE 4—The Impact of Selected Social and Behavioral Risk Factors on Millions of
Quality-Adjusted Life Years (QALYs) Lost in the United States: 1997–2000
National Health Interview Survey Followed Through 2002
Risk Factor Impact to Age 65 Years,
Millions of QALYs (95% CI)Impact to Age 85 Years,
Millions of QALYs (95% CI)
< 200% poverty line 226 (182,276) 544 (434, 666)
< 200% poverty line adjusted for education 171 (128, 223) 421 (315, 537)
Current smoker a
129 (92,167) 332 (246, 415)
< High-school education 56 (35, 80) 190 (134, 259)
Obesity (BMI‡30 kg/m2)b
100 (81, 131) 149 (115,193)
Non-Hispanic Black race 40 (21,59) 113 (78, 153)
Binge drinking bc
29 (3, 67) 56 (15, 118)
Non-Hispanic Black racea
13 (–2, 32) 42 (13, 83)
Overweight (BMI‡25 kg/m2
to 29.9 kg/m2)b
20 (–24, 42) 35 (10,45)
Uninsureda
11 (–15, 29) . . .
Note. BMI = body mass index. All regressions adjusted for age, log age, gender, race/ethnicity (except race model), region of
residence (Northeast, South, Midwest, West), and survey year.a Adjusted for poverty (< 100%, 100% to 124%, 125% to 199%, 200% to 399%, ‡ 400% of the federal poverty level) and
education levels (< 12 years, 12 years, 13 to 15 years, 16 years, > 16 years of schooling completed).b Adjusted for poverty, education levels, and smoking status.cDefined as 5 or more drinks per day at least 1 day per year.
RESEARCH AND PRACTICE
September 2010, Vol 100, No. 9 | American Journal of Public Health Muennig et al. | Peer Reviewed | Research and Practice | 1763

7/25/2019 BD Social
http://slidepdf.com/reader/full/bd-social 7/7
30. Lynch JW, Kaplan GA, Shema SJ. Cumulativeimpact of sustained economic hardship on physical,cognitive, psychological, and social functioning. N Engl J
Med . 1997;337(26):1889–1895.
31. Lleras-Muney A. The relationship between educa-tion and adult mortality in the United States. Rev Econ Stud . 2005;72(1):189–221.
32. Deaton A. Policy implications of the gradient of health and wealth. An economist asks, would redistrib-uting income improve population health? Health Aff (Millwood). 2002;21(2):13–30.
33. Muennig P, Schweinhart L, Montie J, Neidell M. Theeffect of a pre-kindergarten education intervention onadult health: 37-year follow-up results of a randomizedcontrolled trial. Am J Public Health . 2009;99(8):1431–1437.
34. Mechanic D. Policy Challenges in Modern Health Care .
New Brunswick, NJ: Rutgers University Press; 2005.
35. United States Department of Agriculture. Nationalschool lunch program. Available at: http://www.fns.usda.gov/cnd/lunch/AboutLunch/NSLPFactsheet.pdf.
Accessed May 29, 2009.
36. Dickert S, Houser S, Scholz JK. The earned incometax credit and transfer programs: a study of labor market and program participation. Tax Policy Econ . 1995;9:1–50.
37. Iglehart JK. The American health care system–Medicaid. N Engl J Med . 1999;340(5):403–408.
38. Levin H, Belfield C. The Price We Pay: Economic and
Social Consequences of Inadequate Education . Washington,DC: Brookings Institution Press; 2007.
39. Centers for Disease Control and Prevention. De-fining overweight and obesity. Available at: http://
www.cdc.gov/nccdphp/dnpa/obesity/defining.htm.Accessed May 30, 2009.
40. Fontaine KR, Redden DT, Wang C, Westfall AO,Allison DB. Years of life lost due to obesity. JAMA.2003;289(2):187–193.
41. Weinstein MC, Stason WB. Foundations of cost-effectiveness analysis for health and medical practices.N Engl J Med . 1977;296(13):716–721.
42. The EuroQol Group. EuroQol–a new facility for themeasurement of health-related quality of life. Health Policy . 1990;16(3):199–208.
43. Holford TR. The analysis of rates and of survivor-ship using log-linear models. Biometrics . 1980;36:299–305.
44. Andersen PK, Borgan O, Gill RD, Keiding N.Statistical Models Based on Counting Processes . New York,NY: Springer; 1993.
45. McCullagh P, Naelder JA. Generalized Linear Models .2nd ed. London, England: Chapman and Hall; 1989.
46. Mechanic D. Disadvantage, inequality, and social policy. Health Aff (Millwood). 2002;21(2):48–55.
47. Kitagawa EM, Hauser PM. Differential Mortality in the United States; a Study in Socioeconomic Epidemiology .Cambridge, MA: Harvard University Press; 1973.
48. Rogot E, Sorlie PD, Johnson NJ. Life expectancy byemployment status, income, and education in the Na-tional Longitudinal Mortality Study. Public Health Rep .1992;107(4):457–461.
49. Doll R, Peto R. Mortality in relation to smoking: 20 years’ observations on male British doctors. BMJ . 1976;2(6051):1525–1536.
50. Allison DB, Fontaine KR, Manson JE, Stevens J,VanItallie TB. Annual deaths attributable to obesity inthe United States. JAMA. 1999;282(16):1530–1538.
51. Muennig P, Lubetkin E, Jia H, Franks P. Gender andthe burden of disease attributable to obesity. Am J Public
Health . 2006;96(9):1662–1668.
52. Muennig P, Franks P, Gold M. The cost effectivenessof health insurance. Am J Prev Med . 2005;28(1):59–64.
53. Muennig P. Health selection vs. causation in theincome gradient: what can we learn from graphicaltrends? J Health Care Poor Underserved . 2008;19(2):574–579.
54. Muennig P, Woolf SH. Health and economic benefits of reducing the number of students per class-room in US primary schools. Am J Public Health .2007;97(11):2020–2027.
55. Levin H, Belfield C, Muennig P, Rouse C. The Price We Pay: Economic and Social Consequences of Inadequate Education . Washington, DC: Brookings InstitutionPress; 2007.
56. Institute of Medicine. Leading Health Indicators for Healthy People 2010: A Final Report . Available at: http://www.nap.edu/openbook.php?record_id=9436&page=R1.Accessed November 10, 2008.
RESEARCH AND PRACTICE
1764 | Research and Practice | Peer Reviewed | Muennig et al. American Journal of Public Health | September 2010, Vol 100, No. 9


![l>lf·· E ·B; -I,:,C-·-1·1V · cat. no.i bd lj.657 bd lj.6]5 bd 4630 bd 4·627 bd 4628 bd 4886 bd 4546 bd 4·545 bd 4544 bd 4542 bd lj,588 bd lj.593 bd 0102 bd 4636 bd 4632 bd](https://static.fdocuments.net/doc/165x107/5f7c69bb7d840d18665ab1e6/llf-e-b-ic-11v-cat-noi-bd-lj657-bd-lj65-bd-4630-bd-4627-bd-4628-bd.jpg)