BCM - Body Composition Monitor · 2016-02-01 · 3 BCM-BodyCompositionMonitor From technology to...
12
BCM - Body Composition Monitor Innovation for better outcome Analysis Systems
Transcript of BCM - Body Composition Monitor · 2016-02-01 · 3 BCM-BodyCompositionMonitor From technology to...

BCM - Body Composition MonitorInnovation for better outcome
Analysis Systems


Better Clinical Management of Patients with KidneyDisease
Fresenius Medical Care offers a wide range of
monitoring tools and treatment modalities to
provide your patients with state-of-the-art dialysis
therapy.
With the introduction of
BCM - Body Composition Monitor,
Fresenius Medical Care further
facilitates the quality of dialysis and clinical
management of kidney disease patients.
1
Despite significant improvements in the quality and efficacy
of haemodialysis therapy in recent years, cardiovascular
diseases remain the leading cause of death in dialysis
patients.
Fluid overload is a common condition among patients on
dialysis and one of the major causes of mortality. Improving
the treatment of hypertension and correction of fluid
balance have the potential to limit the development of left
ventricular hypertrophy thus increasing life expectancy.1
Fresenius Medical Care together with nephrologists world-
wide is dedicated towards reducing the high cardiovascular
morbidity and mortality of dialysis patients.

BCM - Body Composition Monitor
Achieving optimal fluid balance remains a major
clinical challenge especially when a number of
comorbid complications is present. Assessment
of fluid status based on subjective indicators
has been a limiting factor in the control of fluid
balance.
Increasing patient numbers and constraints on
physicians’ time have further reduced the scope
for quality assessment.
The BCM - Body Composition Monitor is the first
device that determines individual fluid status and
body composition in an easy and objective way.
The Body Composition Monitor assists the physician
in the convenient assessment of clinically relevant
parameters:
• Quantification of fluid status:
– Overhydration
– Total body water (V)
• Assessment of body composition:
– Lean tissue mass
– Adipose tissue mass
Furthermore, the BCM - Body Composition Monitor helps
to investigate the link between fluid status and blood
pressure, therefore allowing a more appropriate
prescription of ultrafiltration and antihypertensive agents.
The measurement is based on a non-invasive and
accurate method that is easy to apply and results are
obtained within just two minutes.
The BCM - Body Composition Monitor can be applied for
the vast majority of chronic kidney disease patients with or
without renal replacement therapy.
2

3
BCM - Body Composition Monitor
From technology to therapy
The BCM - Body Composition Monitor employs the
latest bioimpedance spectroscopy techniques. It
measures at 50 frequencies over a range from 5 to
1000 kHz to determine the electrical resistances of
the total body water (TBW) and the extracellular
water (ECW).
While high-frequency current passes through the
total body water, low-frequency current cannot
penetrate cell membranes and thus flows exclusively
through the extracellular water.
To obtain the clinically relevant output parameters,
two advanced physiological models are used in the
BCM - Body Composition Monitor:
• A volume model describing electrical
conductance in a cell suspension enabling the
total body water and extracellular water as well
as the intracellular water (ICW) to be calculated2.
• A body composition model calculating the three
principal body compartments overhydration,
lean tissue and adipose tissue from ECW and
TBW information3.
The Cole-Cole plot displays the raw data of the
measurement separating ECW from TBW.
The BCM - Body Composition Monitoring device takes three
steps to display the final output parameters: overhydration, adi-
pose tissue mass and lean tissue mass.

Innovation for better outcome
A precise “V” for dialysis doseassessment
The BCM - Body Composition Monitor provides an
accurate determination of total body water (TBW)
which has been validated against gold standard
dilution methods.
As TBW is equivalent to the urea distribution
volume (V), there is no need for time consuming
kinetic urea modelling or anthropometric equations
which can produce erroneous results in extremes
of body composition.
European Best Practice Guidelines recommend a
target dialysis dose of urea eKt/V ≥ 1.2 per session
for a thrice-weekly schedule.4
Thus BCM - Body Composition Monitor can be
used for
• Dialysis dose prescription
• “V“ input for the Fresenius Medical Care OCM®
option.
The Body Composition Monitor assessment of total body water
is validated against gold standard reference methods.
How is the BCM – Body CompositionMonitor validated?
All output parameters have been validated against the
gold standard reference methods in various studies
involving more than 500 patients and healthy
controls.
These reference methods include:
• Extracellular water – bromide dilution
• Intracellular water – total body potassium (TBK)
• Total Body Water – deuterium dilution
• Lean Tissue Mass – Dual Energy X-ray
Absorptiometry (DEXA)
• Adipose Tissue Mass – 4-compartment modelling,
DEXA, air displacement plethysmography and under
water weighing
• Body Cell Mass – magnet resonance tomography,
TBK
• Overhydration – by expert clinical assessment
4
5
BCM - Body Composition Monitor
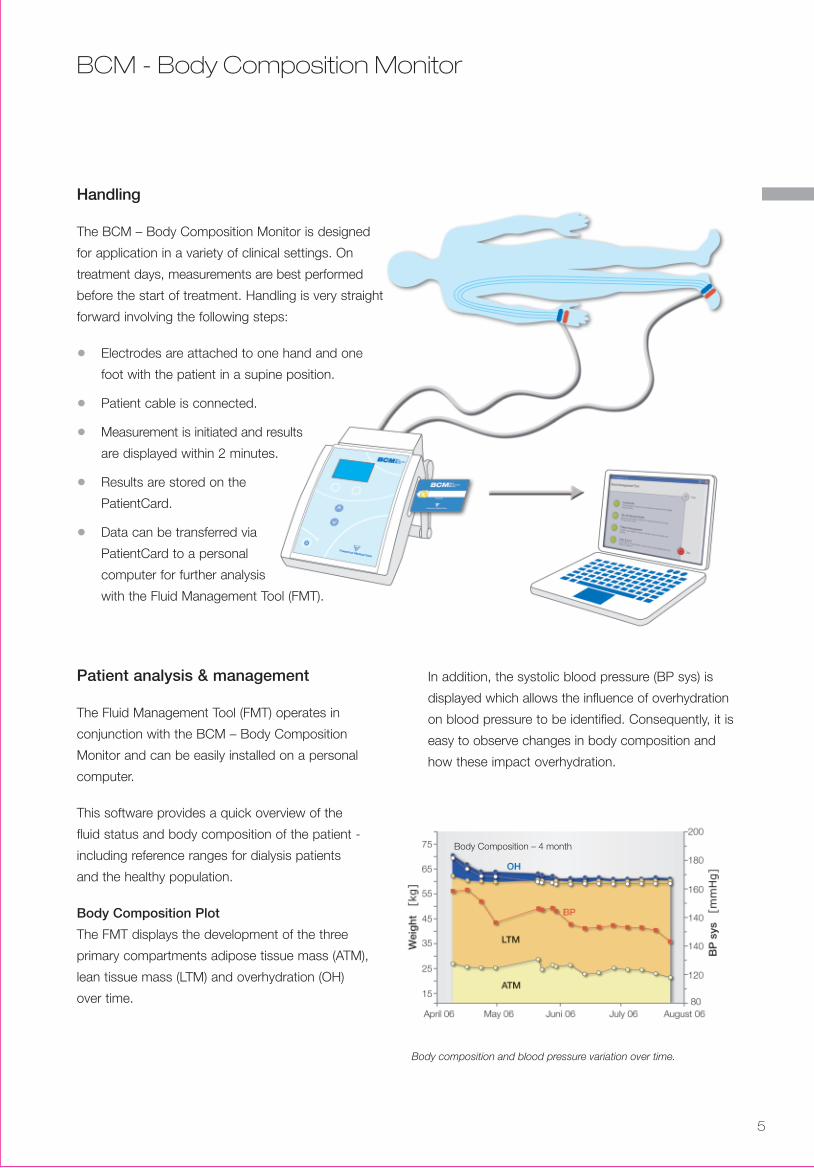
Handling
The BCM – Body Composition Monitor is designed
for application in a variety of clinical settings. On
treatment days, measurements are best performed
before the start of treatment. Handling is very straight
forward involving the following steps:
• Electrodes are attached to one hand and one
foot with the patient in a supine position.
• Patient cable is connected.
• Measurement is initiated and results
are displayed within 2 minutes.
• Results are stored on the
PatientCard.
• Data can be transferred via
PatientCard to a personal
computer for further analysis
with the Fluid Management Tool (FMT).
Patient analysis & management
The Fluid Management Tool (FMT) operates in
conjunction with the BCM – Body Composition
Monitor and can be easily installed on a personal
computer.
This software provides a quick overview of the
fluid status and body composition of the patient -
including reference ranges for dialysis patients
and the healthy population.
Body Composition Plot
The FMT displays the development of the three
primary compartments adipose tissue mass (ATM),
lean tissue mass (LTM) and overhydration (OH)
over time.
In addition, the systolic blood pressure (BP sys) is
displayed which allows the influence of overhydration
on blood pressure to be identified. Consequently, it is
easy to observe changes in body composition and
how these impact overhydration.
Body composition and blood pressure variation over time.
Body Composition – 4 month

6
Hydration Reference Plot
It is known that overhydration often leads to
hypertension. However, in many patients this
relationship can be heavily influenced by underlying
comorbidities5. For example, in some patients,
hypertension may be dependent on vascular
disorders6 while on the other hand, there are patients
who exhibit apparently normal or low blood pressure
despite gross overhydration7.
The hydration reference plot depicts the association
between overhydration status and systolic blood
pressure on one graph.
The easiest way to identify abnormal conditions is to
compare patient results with a reference population.
The reference region N has been defined from
measurements in healthy subjects allowing direct
comparison of patient parameters. A second reference
region indicates the typical range of well managed
patients measured pre-dialysis and with a maximum
weight gain of 2.5 L. Both reference ranges are
adjusted for age and sex. The position of the patient
in the plot allows a first interpretation of the patient’s
condition at the time of the measurement and aids
the physician to possible actions the patient might
benefit from.
Innovation for better outcome
Overhydration (OH) and systolic blood pressure (BP sys) are
combined in one graph – the Hydration Reference Plot (HRP).
The BCM – Body Composition Monitor …
... is the first device that measures the individual
overhydration
... improves management of hypertension and fluid
status
... provides a basis for nutritional assessment
... determines “V” for dialysis dose prescription
... measures non-invasively, fast and easy
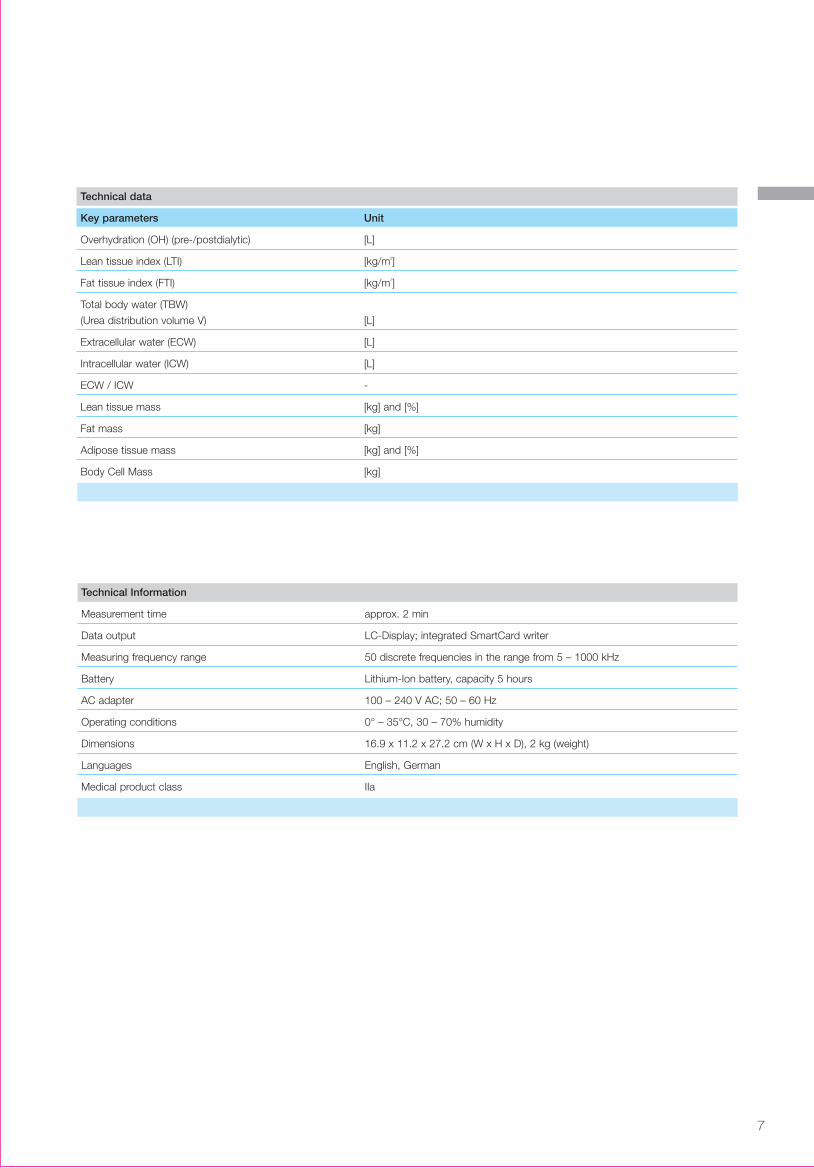
Technical data
Key parameters Unit
Overhydration (OH) (pre-/postdialytic) [L]
Lean tissue index (LTI) [kg/m2]
Fat tissue index (FTI) [kg/m2]
Total body water (TBW)
(Urea distribution volume V) [L]
Extracellular water (ECW) [L]
Intracellular water (ICW) [L]
ECW / ICW -
Lean tissue mass [kg] and [%]
Fat mass [kg]
Adipose tissue mass [kg] and [%]
Body Cell Mass [kg]
Technical Information
Measurement time approx. 2 min
Data output LC-Display; integrated SmartCard writer
Measuring frequency range 50 discrete frequencies in the range from 5 – 1000 kHz
Battery Lithium-Ion battery, capacity 5 hours
AC adapter 100 – 240 V AC; 50 – 60 Hz
Operating conditions 0° – 35°C, 30 – 70% humidity
Dimensions 16.9 x 11.2 x 27.2 cm (W x H x D), 2 kg (weight)
Languages English, German
Medical product class IIa
7

References
1 Left ventricular hypertrophy is present in 70% of the dialysis population (Levin, A et al., Prevalent left ventricular
hypertrophy in the predialysis population: identifying opportunities for intervention, Am J Kidney Dis 1996;
27(3):347-54)
2 Moissl, U et al., Body fluid volume determination via body composition spectroscopy in health and disease.
Physiol. Meas 2006; 27: 921-933.
3 Chamney, P et al., A whole-body model to distinguish excess fluid from the hydration of major body tissues.
Am J Clin Nutr 2007; 85: 80-89.
4 European Best Practice Guidelines for Haemodialysis. Nephrol Dial Transplant 2002; 17 Suppl. 7
5 Jones CH et al., The relationship between serum albumin and hydration status in hemodialysis patients, J Ren
Nutr. 2002; a12(4):209-12
6 Levin NW et al., What clinical insights from the early days of dialysis are being overlooked today? Semin Dial.
2005; 18(1):13-21.
7 Cannella G et al., Inadequate diagnosis and therapy of arterial hypertension as causes of left ventricular
hypertrophy in uremic dialysis patients. Kidney Int. 2000; 58(1):260-8.
8


Fresenius Medical Care Asia Pacific Limited · Room 5101-5123, 51/F Sun Hung Kai Centre, 30 Harbour Road, Wanchai, Hong Kong
Tel +852-2802 2900 · Fax +852-2898 2273
AP
243