BBVA EAGLEs Emerging and Growth- Leading Economies · EAGLEs (excluding China and India)* vs G6...
43
BBVA EAGLEs Emerging and Growth- Leading Economies Annual Report 2012
Transcript of BBVA EAGLEs Emerging and Growth- Leading Economies · EAGLEs (excluding China and India)* vs G6...

BBVA EAGLEsEmerging and Growth-Leading Economies
Annual Report 2012

BBVA EAGLEs: What is it?
• Concept introduced by BBVA Research 15
months ago to provide investors with a more
rigorous and dynamic approach to selecting key
Emerging Markets (EM)
– Why rigorous
– Why dynamic
2

BBVA EAGLEs: Why is it relevant?
• Continuous follow up of key EMs is needed because of rapid structural changes in those countries/global economy
• Investors’ need to review their decisions often (hold to maturity strategy at any cost is not realistic)
• EMs themselves need to be fully aware of their relative relevance both as recipients of investments but also as new investors
3

BBVA EAGLEs: Why is it relevant for Turkey?
• Turkey plays an strategic role in the area, being the potential bridge between Europe and the Middle East (not only in the economic field)
• As an EAGLE, Turkey presents business opportunities stemming mainly from an increasing middle class and low financial and trade integration
• We identify Turkey as one of the most promising economies in the next 10 years, with relative good fundamentals for high growth
4

A guide to the Report1. The new EAGLEs outlook
Box A. Forecasting Methodology
Box B. Our sample: 45 emerging markets
2. The map of risks to our outlook
Macroeconomic risks
Potential brakes to growth
3. Ad-hoc issues in the world of EAGLEs
Structural disequilibria: how do EAGLE countries fare when compared with developed ones?
Shifting wealth: China is the only global creditor within BBVA EAGLEs
What about the Gulf economies? An EAGLE in the making
EAGLEs in Africa? Not for the time being
Following the EAGLEs on the Web
5

Outline
The world is changing: deep knowledge about key emerging markets key
BBVA Research’s own group: the EAGLEs
Other potential EAGLEs
Robustness of our analysis and balance of risks
Opportunities : Some specific examples
6

7
Emerging Markets Dynamism
• G7 countries’ growth is expected to remain below 2% for the next 10 years
• EM growth to outpace G7 average by 4pp including China and around 3pp without
• 2012 will be the year in which EM and Industrialized Economies will have the same size
GDP adjusted by PPP: growth rates (%)Note: 45 Emerging Markets– Argentina, Bahrain, Bangladesh, Brazil, Bulgaria, Chile, China, Colombia, Czech Rep., Egypt, Estonia, Hungary, India, Indonesia, Iran, Jordan, Korea, Kuwait, Latvia, Lithuania, Malaysia, Mauritius, Mexico, Morocco, Nigeria, Oman, Pakistan, Peru, the Philippines, Poland, Qatar, Romania, Russia, Slovak Rep., South Africa, Sri Lanka, Sudan, Taiwan, Thailand, Tunisia, Turkey, Ukraine, the UAE, Venezuela and Vietnam.Source: BBVA Research and IMF
Share of World GDP adjusted PPP: 45 Emerging
Markets vs Industrialized EconomiesSource: BBVA Research and IMF WEO
0
1
2
3
4
5
6
7
1980s 1990s 2000s 2011-2021
45 w/o China 45 EM G7
30
35
40
45
50
55
60
65
1981
1985
1989
1993
1997
2001
2005
2009
2013
2017
2021
45EM Industrialized Economies
7

8
Life beyond BRICs in Emerging Markets
• What about the other EM (ex. BRICs)?
- Combined size is bigger than the G6 in PPP terms (60% in USD terms)
- Contribution to global growth in next 10 years 4 times larger (3 times in USD terms)
(billion USD, adjusted by PPP) Source: BBVA Research and IMF WEO
Emerging Markets
(ex. BICs) in 2011
accounted for 21.3% of
World GDP (vs. 19.3% G6)
Emerging Markets Expected GDP
Growth 8,908 billions
Emerging Markets Current GDP 15,915 billions
G6Expected GDP Growth 2,429 billions
G6Current GDP 14,894 billions
G6 Aggregate: Canada, Germany, France, Italy, Japan and the UKEmerging Markets: other Emerging Markets excluding Brazil, Russia, India and China
Emerging Markets (ex.
BRICs)
Incremental GDP between
2011-2021 will account for
22.6% of World GDP
growth (vs. 6% G6)
(billion USD)Source: BBVA Research and IMF WEO
45 EM without BRICs vs G6: current economic size and incremental GDP 2011-2021
Emerging Markets Expected GDP
Growth 5,451 billions
Emerging Markets Current GDP
10,261 billions
G6Expected GDP Growth 2,707 billions
G6Current GDP 17,346 billions
8

Outline
The world is changing: deep knowledge about key emerging markets key
BBVA Research’s own group: the EAGLEs
Other potential EAGLEs
Robustness of our analysis and balance of risks
Opportunities: Same specific examples
9

10
Methodology: a mix of Size and Growth
45 emerging markets candidates
G6 economies
Current GDP GDP in 10 years
BBVA Research forecasts / IMFStep 1
Step 2Incremental
GDPGDP in 10 years Current GDP- =
10

11
Ordering and selection criteria according to incremental GDP
Step 3
G6 economies average
G6 economies minimum
NEST countries
EAGLEs
Rest of emerging economies candidates
Higher
incremental GDP
Lower incremental
GDP
Methodology: a mix of Size and Growth
11

12
Growth forecasts: a mix of Cycle and Structural factors
• Fiscal policy
• Monetary policy
• External demand
• Commodity prices
• Confidence
• Credit restrictions
• Financial markets
• Demographics
• Labor market structure
• Capital stock
• Total factor productivity (infrastructures, technology, business climate, institutions, regulation,…)
Short & Medium term Cyclical Long term Structural
12

Differences with Other EM groupings
BRIC (GS)
Absolute size• Bigger does not necessarily determine
market potential
BBVA EAGLEs
Absolute growth• Large enough size plus…
• Fast enough growth
No clear cut-off
Static concept• No anticipation, but inertia
• Too long horizon (>20-25 years)
• Why only 4 countries? Subjective
Defined cut-off: the G6 group
Dynamic concept• Anticipation
• Shorter horizon: 10 years
• Flexible number of countries: admission depends on performance
• Other approaches have been made to select a group of emerging economies (CIVETS, CARBS, NEXT-11) and all of them lack the dynamic and transparent criteria of the EAGLEs method
13

14
How to determine the number of countries: The cut-off
G6 economies average
G6 economies minimum
NEST
EAGLEs
Rest of emerging economies candidates
Incremental GDP of G6 economies (2011-2021 GDP change)(billion USD, adjusted by PPP)
405avg
134min
• EAGLEs: Any country with an incremental growth > USD 405 billion• NEST: Countries with incremental growth higher than USD 134 billion but below USD 405 billion
Japan Germany UK
Canada France Italy
460
460
460
460
410
410
410
410
340
340
340
340
340
340
340
340
130
130
130
130
740
14

15
China & India the largest EAGLEs
• China is playing in a league of its own
• India would have a larger contribution to GDP growth than the US
Global Leaders in the next 10 years:
GDP adjusted by PPP (billion USD)Source: BBVA Research and IMF WEO
Global Leaders in the next 10 years: contribution to
World economic growth 2011-2021 (%) Source: BBVA Research and IMF WEO
0
5000
10000
15000
20000
25000
30000
China United States India
Incremental GDP Size in 2011
34.09.6
11.9
44.5
China United States India RoW
15
Brazil
Indonesia
JapanKorea Russia
Turkey
MexicoGermany
TaiwanUK
CanadaFrance
Italy
2,247
1,100
4,311 1,523 2,326
1,053 1,6283,039 863 2,213
1,367 2,173
1,791
0
200
400
600
800
1,000
1,200
1,400
Incremental GDP PPP 2011-2021 (billion
USD)
G6 EconomiesEAGLEs
16
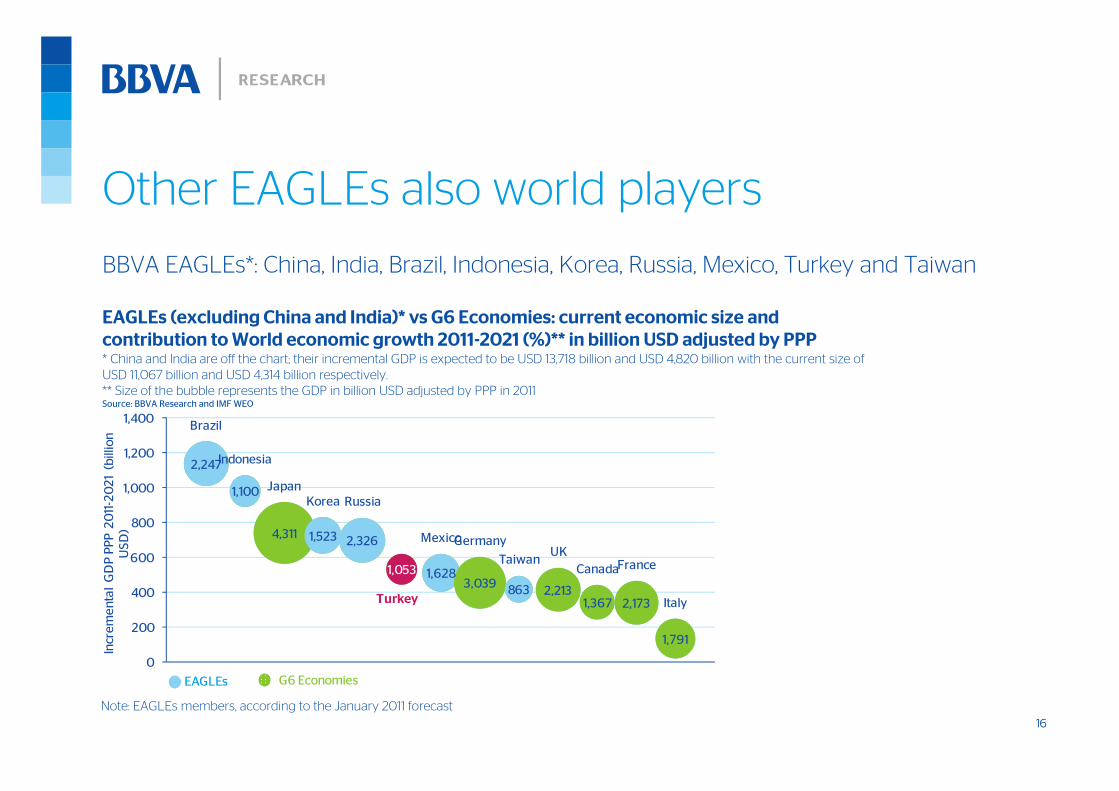
Other EAGLEs also world players
BBVA EAGLEs*: China, India, Brazil, Indonesia, Korea, Russia, Mexico, Turkey and Taiwan
Note: EAGLEs members, according to the January 2011 forecast
EAGLEs (excluding China and India)* vs G6 Economies: current economic size and
contribution to World economic growth 2011-2021 (%)** in billion USD adjusted by PPP* China and India are off the chart; their incremental GDP is expected to be USD 13,718 billion and USD 4,820 billion with the current size of
USD 11,067 billion and USD 4,314 billion respectively.
** Size of the bubble represents the GDP in billion USD adjusted by PPP in 2011Source: BBVA Research and IMF WEO
16

17
EAGLEs versus G7: A new G?
EAGLEs will be responsible of almost 60% of the new World GDP in the next ten years, Nest
almost 9%, whereas G7 will contribute around 16%
45 EM: Argentina, Bahrain, Bangladesh, Brazil, Bulgaria, Chile, China, Colombia, Czech Rep., Egypt, Estonia, Hungary, India, Indonesia, Iran, Jordan, Korea, Kuwait, Latvia, Lithuania, Malaysia, Mauritius, Mexico,
Morocco, Nigeria, Oman, Pakistan, Peru, the Philippines, Poland, Qatar, Romania, Russia, Slovak Rep., South Africa, Sri Lanka, Sudan, Taiwan, Thailand, Tunisia, Turkey, Ukraine, the UAE, Venezuela and Vietnam.
Industrialized economies: Australia, Austria, Belgium, Canada, Cyprus, Denmark, Finland, France, Germany, Greece, Hong Kong, Iceland, Ireland, Israel, Italy, Japan, Luxembourg, Malta, the Netherlands, New Zealand,
Norway, Portugal, Singapore, Slovenia, Spain, Sweden, Switzerland, the United Kingdom and the United States.
EAGLEs, Nest and G7: current economic size and incremental GDP 2011-2021 (billion USD PPP)Source: BBVA Research and IMF WEO
EAGLEs, Nest and G7: current economic size and incremental GDP 2011-2021 (billion USD)Source: BBVA Research and IMF WEO
EAGLEs,
26,122
Nest, 6,733
G7, 29,700
EAGLEs,
23,550
Nest, 4,171
G7, 6,309
EAGLEs NestG7
EAGLEs,
15,988
Nest, 3,913
G7, 32,127
EAGLEs,
13,418
Nest, 2,260 G7, 6,466
EAGLEs NestG7
17

Outline
The world is changing: need to know more about key emerging markets
BBVA Research’s own group: the EAGLEs
Other potential EAGLEs
Balance of risks and robustness
Opportunities: Same specific examples
18

G6 Average
Egypt
Thailand
Australia
Argentina
Saudi Arabia
Canada
France
Nigeria
Colombia
Poland
Vietnam
Pakistan
Bangladesh
Malaysia
Spain
South Africa
Philippines
Iraq
Peru
Kazakhstan
Hong Kong
Chile
Singapore
Ukraine
Italy
2,482506 601 899 700 665 1,367 2,173 407 461 752 295 480
277 4361,385 543 382 125
296 211 344 275 308322
1,791
0
50
100
150
200
250
300
350
400
450
500
Incremental GDP PPP 2011-2021
(billion U
SD)
Other EconomiesNest G6 Economies
19
The Nest a watch list of potential EAGLEs
• As many as 15 economies in the NEST (contributing more to global GDP than smallest G6, Italy)
• Egypt relegated from the EAGLEs; Chile and Ukraine advanced from the group of other EM to NEST
Note: NEST members, according to January 2011 forecast.
Nest, G6 and Other Economies: current economic size and contribution to World economic
growth 2011-2021 (%)* in billion USD adjusted by PPP* Size of the bubble represents the GDP in billion USD adjusted by PPP in 2011 Source: BBVA Research and IMF WEO
19

0
200
400
600
800
1000
1200
1400
1600
Iran Saudi Arabia
UAE Qatar Kuwait Oman Bahrain
Current size Incremental GDP 2011-2021
20
GCC an EAGLE in the making
• GCC rapid growth driven by high oil prices, which will probably continue in the medium term.. This explains the GCC
larger future size and its growing global relevance if economic integration is pursued
• However, big challenges remain in the GCC such as very high social expenditure as well as lack of diversification
Incremental GDP adjusted by PPP (billion USD) and
contribution to World economic growth 2011-2021 (%)** The graph excludes China (USD 13,718 billion, 34%) and India (USD 4,820 billion, 11.9%)Source: BBVA Research and IMF
GCC countries and Iran: current economic size and
incremental GDP 2011-2021 (billion USD)Source: BBVA Research and IMF WEO
0.0
0.5
1.0
1.5
2.0
2.5
3.0
0
200
400
600
800
1000
1200
Brazil
Indonesia
Japan
Korea
GCC
Russia
Turkey
Mexico
Germ
any
Taiw
an
UK
G6 Avg.
20

0.0 0.5 1.0 1.5 2.0 2.5 3.0
ItalyFranceCanada
United KingdomTaiwan
GermanyIran
MexicoTurkeyRussiaKoreaJapan
IndonesiaBrazil
Incremental GDP 2010-2020 Incremental GDP 2011-2021
0
2000
4000
6000
8000
10000
12000
14000
China
India
Brazil
Indonesia
Korea
Russia
Turkey
Mexico
Iran
Taiw
an
GDP in 2011 Incremental GDP 2011-2021
Iran: an inconvenient EAGLE?
21
EAGLEs and Iran: current economic size and incremental GDP (billion USD)Source: BBVA Research and IMF WEO
• Iran’s expected GDP is now above the G6 Average so it nominally qualifies as an EAGLE
• However, UN sanctions make it an impossible candidate for any market oriented grouping of EM
• Lack of information about infrastructure, institutional framework and other relevant sectors
EAGLEs and G7: contribution to World economic growth (percentage)*out of chart: China (30.2% & 34%), India (8.5 & 8.9%) and the US (8.7% & 9.6%)Source: BBVA Research and IMF WEO
21

Outline
The world is changing: need to know more about key emerging markets
BBVA Research’s own group: the EAGLEs
Other EAGLEs around
Robustness of our analysis and balance of risks
Opportunities: Same specific examples
22

23
Robustness: Significant idiosyncratic shocks should take place to alter group members
Membership sensitivity of the EAGLEs and the Nest countriesSource: BBVA Research.0
Average annual growth in the next 10 years
Baseline scenario To become a NEST… Difference
EAGLEs
China 8.4 0.4 -8.0
India 7.8 0.9 -6.9Brazil 4.2 1.7 -2.5
Indonesia 6.6 3.2 -3.4
Korea 4.0 2.4 -1.6Russia 2.7 1.6 -1.0Turkey 4.2 3.3 -0.9
Mexico 2.8 2.2 -0.5
Taiwan 4.0 3.9 -0.1
Baseline scenario To become an EAGLE… Difference
NEST
Egypt 5.7 6.1 0.4Thailand 4.9 5.3 0.3
Argentina 4.1 4.7 0.6
Nigeria 6.2 7.1 1.0Colombia 5.4 6.5 1.1
Poland 3.6 4.4 0.8Vietnam 7.3 9.0 1.8
Pakistan 4.9 6.3 1.4
Bangladesh 7.0 9.4 2.4Malaysia 4.8 6.8 2.0South Africa 3.6 5.7 2.1
Philippines 4.8 7.5 2.7
Peru 5.3 9.0 3.7Chile 4.8 9.5 4.6
Ukraine 4.2 8.5 4.3
23

24
Macroeconomic risks and potential brakes to growth
• Sudden collapse of growth
• External demand
•Macroeconomic disequilibria
• Institutional factors
• Social unrest risks
• Inclusive growth challenge
Macroeconomic Risks Institutional & Social Risks
24

25
Balance of Risks for the EAGLEs
Poverty
Inequality &
poverty
China
Brazil
Korea
Turkey
India
Indonesia
Russia
Mexico
Taiwan
Growth model External demand Macro imbalances
China dependency
Low labor force growth
& weak TFP
fundamentals
Low trade
partners’ growthCurrent account
deficit
Low trade
partners’ growth
Weak TFP
fundamentals
China dependency / very
open
Decline in labor force / low
quality infrastructures
Low trade partners’ growth /
reliance on commodities
Weak TFP
fundamentals
Reliance on
commodities
Small twin deficits
and high public debt
Twin deficits &
high public debtWeak TFP
fundamentals
Low quality
infrastructuresChina and
commodities dependency
Institutional Social Risk Inclusive Growth
Shortages on
the public side InequalityFood
dependency
Shortages on private
and public sectors
Food dep. / high unemployment/
low secondary education enrolment
Poverty
Investment
climate
Shortages on
private and
public sectors
Food dependency .
low secondary education
enrolmentPoverty
Shortages on private
and public
sectors
Food
dependency
Low labor force
growth
Inequality
25

Macroeconomic imbalances for of a G7 risk
26
Developed Economies: Twin Deficits 2011(CAC and Fiscal Balance as % of GDP)Source: BBVA Research and IMF WEO
Emerging Economies: Twin Deficits 2011(CAC and Fiscal Balance as % of GDP)Source: BBVA Research and IMF WEO
• The Old View: Emerging Markets Economic Growth traditionally higher than the Developed Economies. But the Risk-Return trade off not favorable for Emerging Markets
• The New Paradigm: Past crisis in EM trigger improvements in macro prudential policymaking management. Higher Economic Growth + Low risk
-15
-12
-9
-6
-3
0
3
6
9
12
15
-12 -9 -6 -3 0 3Fiscal Balance (% GDP)
Current Account Balance
(%GDP)
TwinDeficits
Area-15
-12
-9
-6
-3
0
3
6
9
12
15
-12 -9 -6 -3 0 3Fiscal Balance (% GDP)
Current Account Balance
(%GDP)
TwinDeficits
Area

Outline
The world is changing: need to know more about key emerging markets
BBVA Research’s own group: the EAGLEs
Other EAGLEs around
Balance of risks and robustness
Opportunities: Some specific examples
27

Business opportunities in many areas
28
• Urbanization and increase of middle classes:
– Boost of private consumption
– Change in consumption patterns
– Demand of touristic services
• Investment to close the infrastructure gap and to promote export-led economy
• Sustained demand for commodities and energy sources
• Financial deepening:
– Credit for increasing consumption and investment, also housing
– Development of pension systems (population aging increasingly an issue)
• Opportunities related to inclusive growth challenge
– Education, health policies, social protection

0
50
100
150
200
250
300
350
400
450
500
EAGLEs EAGLEs ex China
China G6 USA
2010 2020
The middle income class is going to grow the most in EAGLEs
29
Growing opportunities for financial services, sales of durable goods, education, health and insurance industry among others
Middle income class (millions of people 2010 – 2020)Source: BBVA Research
29

EAGLEs lead automobile production
EAGLEs vs G7: automobile production (million of units)Source: BBVA Research and International Organization of Motor Vehicle Manufactures (OICA)
EAGLEs: automobile production(million of units)Source: BBVA Research and International Organization of Motor Vehicle Manufactures (OICA)
The rise in production implies technology transfers and a productivity catch up process underway
9
10
11
12
13
14
15
16
17
18
2000
2001
2002
2003
2004
2005
2006
2007
2008
2009
2010
G7 EAGELs
0
2,000,000
4,000,000
6,000,000
8,000,000
10,000,000
12,000,000
14,000,000
16,000,000
18,000,000
20,000,000
1999
2000
2001
2002
2003
2004
2005
2006
2007
2008
2009
2010
Brazil China IndiaIndonesia Korea MexicoRussia Taiwan Turkey
30

EAGLEs auto sales also growing much faster
EAGLEs vs G7: automobile domestic salesSource: BBVA Research and Local automotives associations
EAGLEs: automobile domestic sales (million of untis)Source: BBVA Research and Local automotives associations
• Sales surged as income rose and middle income class increased
• Retail banking opportunities
0
5
10
15
20
25
30
35
2000
2001
2002
2003
2004
2005
2006
2007
2008
2009
2010
EAGLEs G7
0
5
10
15
20
25
30
35
2000
2001
2002
2003
2004
2005
2006
2007
2008
2009
2010
Brazil China India Indonesia Korea
Mexico Russia Taiwan Turkey
31

EAGLEs growing tourism industry
EAGLEs are becoming a top destination for tourist services worldwide
EAGLEs: International Tourism Receipts (billion USD)*Note: no data for Taiwan Source: BBVA Research and WDI
Country Ranking in 2005 Ranking in 2010 2005 2010 Percentage Change
China 7 3 32 50 58
Turkey 9 8 20 25 25
India 26 15 8 15 92
Korea 24 16 8 14 67
Russia 25 19 8 13 63
Mexico 16 21 13 13 -2
Indonesia 38 30 5 8 50
Brazil 40 33 4 6 48
EAGLEsEAGLEsEAGLEsEAGLEs 97979797 142142142142 46464646
G7G7G7G7 394394394394 372372372372 ----5555
32

EAGLEs growing number of tourists
5 EAGLEs are in the top 20 of the countries whose citizens expend the most in tourism services
EAGLEs: International Tourism Expenditure (billion USD)* Note: no data for Taiwan Source: BBVA Research and WDI
Country Ranking in 2005 Ranking in 2010 2005 2010 Percentage Change
China 7 4 25 60 142
Russia 9 9 18 30 64
Korea 11 13 17 20 16
Brazil 29 14 6 19 228
India 25 17 8 14 66
Mexico 23 21 9 9 1
Indonesia 34 23 5 8 79
Turkey 40 29 3 5 66
EAGLEsEAGLEsEAGLEsEAGLEs 91919191 166166166166 82828282
G7G7G7G7 394394394394 410410410410 4444
33

Egypt
Thailand
ArgentinaNigeria
Colombia
Poland
Vietnam
Pakistan
Bangladesh
Malaysia
South Africa
Philippines
Peru
Chile
Ukraine
0.0
0.2
0.4
0.6
0.8
1.0
0.0 0.2 0.4 0.6 0.8 1.0
Share of World FDI inflows (2006-
2010)
Contribution to World economic growth (2011-2021)
Brazil
Indonesia
Korea
Russia
Turkey
Mexico
Taiwan
G6 Average
00.0
0.5
1.0
1.5
2.0
2.5
3.0
0.0 0.5 1.0 1.5 2.0 2.5 3.0
Share of World FDI inflows (2006-
2010)
Contribution to World economic growth (2011-2021)
EAGLEs FDI inflows underrepresented
EAGLEs: contribution to World economic growth vs share of World FDI inflows (percentage)out of chart: China (FDI share: 9.2%; Contribution share: 34%)
India (FDI share: 1.8%; Contribution share: 11.9%)G6 Average: Canada, France, Germany, Italy, Japan and the UKSource: BBVA Research, IMF and UNCTAD
• Most of the EAGLEs and Nest will continue to be huge recipients of FDI in coming years
• G6 is clearly overrepresented
Nest: contribution to World economic growth vs share of World FDI inflows (percentage)out of chart: G6 Average (FDI share: 2.9 Contribution share: 1%G6 Average: Canada, France, Germany, Italy, Japan and the UKSource: BBVA Research, IMF and UNCTAD
34

0
1
2
3
4
5
6
7
China
India
Indonesia
Korea
Turkey
Russia
Mexico
Taiw
an
Brazil
G7
average
EAGLEs need to close the gap of quality and quantity of infrastructure
• EAGLEs should attract FDI to fund infrastructure projects
• An ambitious agenda will foster economic growth and improve their competitiveness
EAGLEs: Quality of Overall Infrastructure Source: WEF 2011-2012
35

0
10
20
30
40
50
60
70
80
Europe Asia North America
South and CentralAmerica
Africa Middle East
Much more room for integration in EM
36
Intraregional trade in the world (2010)(as a percentage of total trade)Source: BBVA Research and WTO
• Trade integration in Asia Trade integration in Asia Trade integration in Asia Trade integration in Asia has not required any formal process (like in the EU or the many failed attempts in Latin America) and linkages have developed naturallydeveloped naturallydeveloped naturallydeveloped naturally, building an integrated network for manufacturing
• Integration should also be fostered in investment projects and financing investment projects and financing investment projects and financing investment projects and financing

Key Messages about EAGLEs
• China and IndiaChina and IndiaChina and IndiaChina and India are the largest ones. TurkeyTurkeyTurkeyTurkey is the leader in Emerging Europe. Brazil, Indonesia, Korea, Russia, Mexico and Taiwan are also leading emerging economies. Egypt became the first “fallen angel”
The New EAGLEs and the first falling angel
• The EAGLEs and the Nest are expected to contribute more than two thirds of World growth in the next ten years. On the other hand, G7 contribution would be
around 16 per cent
Key contributors to global growth
• China is becoming the world’s largest creditor.
• After Turkey, the GCC GCC GCC GCC as a block is the next Middle East EAGLE.. Iran complies with
the criteria of future size but lacks the minimal institutional requirements
• Despite experiencing sound economic progress, Africa is still lagging behind with no EAGLE to be sind (Egypt and South Africa in the next)
Special issues in BBVA EAGLEs second annual report
37

Key Messages about EAGLEs
• Macroeconomic vulnerabilities on EAGLEs members are bounded. The promising outlook for economic growth creates a unique opportunity to tackle the bottlenecks for growth
Low vulnerability
• FDI into EAGLEs to increase. The rise of the middle income class will boost consumption of durable goods and services. Infrastructure investment to rise (very
low except in China)
Opportunities within the EAGLEs
38

Appendix
Full list of emerging markets candidates
39

40
Annex: Full list of emerging markets candidates45 Emerging Markets and G7 Projections*G6 = G7 - USSource: BBVA Research and IMF WEO
GDP (billion USD PPP) GDP (billion USD PPP)
Country 2011 2021 Change Average annual growth (%) Country 2011 2021 Change Average annual growth (%)
EAGLES
China 11,067 24,785 13,718 8.4
Other Emerging Economies
UAE 256 388 131 4.2India 4,314 9,135 4,820 7.8 Romania 259 386 126 4.1Brazil 2,247 3,385 1,137 4.2 Morocco 160 276 116 5.6Indonesia 1,100 2,083 983 6.6 Qatar 178 286 107 4.8Korea 1,523 2,249 725 4.0 Sri Lanka 113 213 100 6.6Russia 2,326 3,026 700 2.7 Czech Rep. 268 361 93 3.0Turkey 1,053 1,587 534 4.2 Kuwait 147 236 88 4.8Mexico 1,628 2,141 514 2.8 Tunisia 100 186 86 6.4Iran (excluded) 912 1,409 497 4.4 Venezuela 366 445 79 2.0Taiwan 863 1,281 419 4.0 Hungary 192 261 68 3.1G6 average 2,482 2,887 405 1.5 Slovak Rep. 125 188 64 4.2
NEST
Egypt 506 880 374 5.7 Sudan 95 149 53 4.5Thailand 601 974 373 4.9 Bulgaria 100 145 46 3.8Argentina 700 1,048 347 4.1 Oman 80 115 35 3.7Nigeria 407 740 333 6.2 Lithuania 60 87 27 3.8Colombia 461 783 322 5.4 Jordan 36 56 20 4.5Poland 752 1,067 316 3.6 Latvia 34 50 16 4.0Vietnam 295 595 300 7.3 Bahrain 30 46 16 4.3Pakistan 480 774 294 4.9 Estonia 26 39 12 3.9Bangladesh 277 545 268 7.0 Mauritius 19 29 10 4.5Malaysia 436 698 262 4.8South Africa 543 772 229 3.6 G7 United States 14,806 18,687 3,881 2.4Philippines 382 607 225 4.8
*G6
Japan 4,311 5,052 741 1.6Peru 296 494 198 5.3 Germany 3,039 3,495 456 1.4Chile 275 441 165 4.8 UK 2,213 2,628 415 1.7Ukraine 322 485 163 4.2 Canada 1,367 1,710 343 2.3G6 minimum 1,791 1,925 134 0.7 France 2,173 2,513 341 1.5
Groups
EAGLES 26,122 49,672 23,550 6.6 Italy 1,791 1,925 134 0.7NEST 6,733 10,904 4,171 4.9G6 14,894 17,323 2,429 1.5
Other Economies
Saudi Arabia 665 1010 345 4.3G7 29,700 36,009 6,309 1.9 Iraq 125 325 201 10.1World 77,204 117,565 40,361 4.3 Kazakhstan 211 388 177 6.3
40

Appendix
Find out more about EAGLEs
41

42
EAGLEs Presence on the Internet
Review
• A permanent follow-up is made by BBVA Research with an
annual update of EAGLEs and NEST members.
• Quarterly report on EAGLEs economic situation\
• Special topics covered in BBVA’s Eagles watches
• Complementary analysis tools like the
Country Risk Observatory• Reports and presentations to be found at
www.bbvaeagles.com
• Experts discussions and comments in BBVA
EAGLEs Twitter and LinkedIn Discussion
Group
Diffusion
Dialogue • Cooperation with local think-tanks for knowledge network on
the analyzed economies: TUSIAD is our think-tank in Turkey42

43
Cross-Country Unit Team Members
Alicia García-HerreroChief Economist
for Emerging [email protected]
+852 2582 3281
Cross-Country Emerging Market Analysis
Chief Economist
Álvaro Ortiz [email protected]+34 630144485 Ext 51933
Mario Nigrinis [email protected]+852 2582 3193
David Martí[email protected]+34 690 845 429
Alfonso [email protected]+34 91 3743530
With the assistance of:
Carrie [email protected]
Paul [email protected]
Juan [email protected]
Edward [email protected]
43