Bayesian inference of a historical bottleneck in a heavily...
20
Bayesian inference of a historical bottleneck in a heavily exploited marine mammal J. I. HOFFMAN,* S. M. GRANT,† J. FORCADA† and C. D. PHILLIPS‡ *Department of Animal Behaviour, University of Bielefeld, Postfach 100131, 33501 Bielefeld, Germany, †British Antarctic Survey, Natural Environment Research Council, High Cross, Madingley Road, Cambridge CB3 0ET, UK, ‡Department of Biological Sciences, Texas Tech University, Lubbock, Texas 79409, USA Abstract Emerging Bayesian analytical approaches offer increasingly sophisticated means of reconstructing historical population dynamics from genetic data, but have been little applied to scenarios involving demographic bottlenecks. Consequently, we analysed a large mitochondrial and microsatellite dataset from the Antarctic fur seal Arctocephalus gazella, a species subjected to one of the most extreme examples of uncontrolled exploitation in history when it was reduced to the brink of extinction by the sealing industry during the late eighteenth and nineteenth centuries. Classical bottleneck tests, which exploit the fact that rare alleles are rapidly lost during demographic reduction, yielded ambiguous results. In contrast, a strong signal of recent demographic decline was detected using both Bayesian skyline plots and Approximate Bayesian Computation, the latter also allowing derivation of posterior parameter estimates that were remarkably consistent with historical observations. This was achieved using only contemporary samples, further emphasizing the potential of Bayesian approaches to address important problems in conservation and evolutionary biology. Keywords: Antarctic fur seal, Approximate Bayesian Computation (ABC), Bayesian Skyline Plot (BSP), bottleneck, conservation genetics, demographic history, heterozygosity excess, microsat- ellite, mtDNA, pinniped Received 27 April 2011; revision received 11 July 2011; accepted 20 July 2011 Introduction Many natural populations have experienced severe demographic reductions, or population bottlenecks, due to over-exploitation or anthropogenically induced habi- tat destruction. This is a major cause of concern to con- servation biologists because bottlenecks can lead to the loss of genetic variability, elevated levels of inbreeding and the fixation of mildly deleterious alleles, thereby increasing the risk of extinction and compromising adaptive evolutionary potential (Hedrick & Miller 1992; Lande 1994; Mills & Smouse 1994; Lynch et al. 1995; Frankham et al. 1999). Unfortunately however, detect- ing and measuring the impacts of such changes is not usually possible because patterns of historical abun- dance are seldom known. Consequently, there has been considerable interest in the development and applica- tion of methods for detecting bottleneck signatures using neutral genetic markers such as microsatellites. One such approach exploits the fact that genetic drift is intensified in small populations, leading to concomi- tant changes in allele frequencies and in some cases the fixation or loss of alleles. This in principle allows changes in the effective population size to be measured when multiple, temporally spaced samples are available (Waples 1989; Luikart et al. 1999; Williamson & Slatkin 1999; Anderson et al. 2000; Beaumont 2003). However, this approach may underestimate the magnitude of severe bottlenecks because the loss of alleles constrains the extent to which allele frequencies are subsequently able to drift (Richards & Leberg 1996). Perhaps more importantly, to detect a historical reduction in popula- tion size using this method requires both pre- and post- bottleneck samples. Approaches that attempt to eluci- date demographic history from a single genetic sample have therefore grown in popularity. Correspondence: Joseph I. Hoffman, Fax: 0049 (0) 521 1062998; E-mail: [email protected] ȑ 2011 Blackwell Publishing Ltd Molecular Ecology (2011) 20, 3989–4008 doi: 10.1111/j.1365-294X.2011.05248.x
Transcript of Bayesian inference of a historical bottleneck in a heavily...
Molecular Ecology (2011) 20, 3989–4008 doi: 10.1111/j.1365-294X.2011.05248.x
Bayesian inference of a historical bottleneck in a heavilyexploited marine mammal
J . I . HOFFMAN,* S . M. GRANT,† J . FORCADA† and C. D. PHILLIPS‡
*Department of Animal Behaviour, University of Bielefeld, Postfach 100131, 33501 Bielefeld, Germany, †British Antarctic
Survey, Natural Environment Research Council, High Cross, Madingley Road, Cambridge CB3 0ET, UK, ‡Department of
Biological Sciences, Texas Tech University, Lubbock, Texas 79409, USA
Corresponde
E-mail: josep
� 2011 Black
Abstract
Emerging Bayesian analytical approaches offer increasingly sophisticated means of
reconstructing historical population dynamics from genetic data, but have been little
applied to scenarios involving demographic bottlenecks. Consequently, we analysed a
large mitochondrial and microsatellite dataset from the Antarctic fur seal Arctocephalusgazella, a species subjected to one of the most extreme examples of uncontrolled
exploitation in history when it was reduced to the brink of extinction by the sealing
industry during the late eighteenth and nineteenth centuries. Classical bottleneck tests,
which exploit the fact that rare alleles are rapidly lost during demographic reduction,
yielded ambiguous results. In contrast, a strong signal of recent demographic decline was
detected using both Bayesian skyline plots and Approximate Bayesian Computation, the
latter also allowing derivation of posterior parameter estimates that were remarkably
consistent with historical observations. This was achieved using only contemporary
samples, further emphasizing the potential of Bayesian approaches to address important
problems in conservation and evolutionary biology.
Keywords: Antarctic fur seal, Approximate Bayesian Computation (ABC), Bayesian Skyline Plot
(BSP), bottleneck, conservation genetics, demographic history, heterozygosity excess, microsat-
ellite, mtDNA, pinniped
Received 27 April 2011; revision received 11 July 2011; accepted 20 July 2011
Introduction
Many natural populations have experienced severe
demographic reductions, or population bottlenecks, due
to over-exploitation or anthropogenically induced habi-
tat destruction. This is a major cause of concern to con-
servation biologists because bottlenecks can lead to the
loss of genetic variability, elevated levels of inbreeding
and the fixation of mildly deleterious alleles, thereby
increasing the risk of extinction and compromising
adaptive evolutionary potential (Hedrick & Miller 1992;
Lande 1994; Mills & Smouse 1994; Lynch et al. 1995;
Frankham et al. 1999). Unfortunately however, detect-
ing and measuring the impacts of such changes is not
usually possible because patterns of historical abun-
dance are seldom known. Consequently, there has been
considerable interest in the development and applica-
nce: Joseph I. Hoffman, Fax: 0049 (0) 521 1062998;
well Publishing Ltd
tion of methods for detecting bottleneck signatures
using neutral genetic markers such as microsatellites.
One such approach exploits the fact that genetic drift
is intensified in small populations, leading to concomi-
tant changes in allele frequencies and in some cases the
fixation or loss of alleles. This in principle allows
changes in the effective population size to be measured
when multiple, temporally spaced samples are available
(Waples 1989; Luikart et al. 1999; Williamson & Slatkin
1999; Anderson et al. 2000; Beaumont 2003). However,
this approach may underestimate the magnitude of
severe bottlenecks because the loss of alleles constrains
the extent to which allele frequencies are subsequently
able to drift (Richards & Leberg 1996). Perhaps more
importantly, to detect a historical reduction in popula-
tion size using this method requires both pre- and post-
bottleneck samples. Approaches that attempt to eluci-
date demographic history from a single genetic sample
have therefore grown in popularity.

3990 J . I . HOFFMAN ET AL.
Three classical single-sample methods for detecting
population bottlenecks are the heterozygosity excess
(Cornuet & Luikart 1996), mode-shift (Luikart et al.
1998) and M-ratio (Garza & Williamson 2001) tests. The
first and arguably most widely used of these is based
on the premise that rare alleles are rapidly lost during a
bottleneck but their loss only weakly influences hetero-
zygosity. This generates a transient excess of heterozy-
gosity (lasting up to 4 · Ne generations, where Ne is the
bottleneck effective population size) relative to a popu-
lation at equilibrium with an equivalent number of
alleles. The second test (Luikart et al. 1998) measures
the impact of the loss of rare alleles on the overall allele
frequency distribution. The underlying rationale is that
large, non-bottlenecked populations should have a high
proportion of alleles at low frequency (<0.1), whereas
alleles of intermediate frequency (e.g. 0.1–0.2) are
expected to become more abundant after a severe bot-
tleneck. Third, the M-ratio of Garza & Williamson
(2001), defined as the ratio of the total number of alleles
(k) to the allelic size range (r), may also be informative
in respect of bottleneck history. This statistic exploits
the fact that the loss of any allele during a bottleneck
will reduce k, whereas only the loss of alleles at the
extremes of the size range will reduce r. Consequently,
k will tend to reduce more quickly than r in declining
populations, leading to the expectation than M will be
smaller in recently bottlenecked populations than in
those at equilibrium.
Although the mode-shift test has not been extensively
evaluated, heterozygosity excess and the M-ratio have
both been shown to perform well at distinguishing bot-
tlenecked from non-bottlenecked samples when applied
to empirical datasets from species or populations with
contrasting demographic histories (Cornuet & Luikart
1996; Spencer et al. 2000; Beebee & Rowe 2001; Garza &
Williamson 2001). Furthermore, recent simulations sug-
gest that these two measures may convey subtly differ-
ent signals, the M-ratio for example being most likely to
correctly identify a bottleneck when pre-bottleneck pop-
ulation size was large, the bottleneck lasted several gen-
erations or the population subsequently made a
demographic recovery (Williamson-Natesan 2005).
However, a major drawback of both approaches is that
they require simplifying assumptions to be made about
the mutational mechanism of the genetic markers
employed. These assumptions if incorrect have the
potential to strongly influence equilibrium values of
both heterozygosity conditional upon allele number and
M (Guinand & Scribner 2003; Williamson-Natesan 2005;
Busch et al. 2007).
Fortunately, emerging analytical approaches drawing
upon Bayesian methodologies provide a novel avenue
for exploring demographic history independently of the
bottleneck tests described above. For example, by
implementing a flexible demographic model, Bayesian
Skyline Plots (BSPs) allow changes in effective popula-
tion size (Ne) over time to be deduced without the need
for assumptions to be made about key demographic
parameters (Drummond et al. 2005). Potentially even
more powerful is Approximate Bayesian Computation
(ABC), an approach that allows for selection of the opti-
mal demographic ⁄ evolutionary history and associated
parameters among a set of hypothesized models (Beau-
mont et al. 2002; Bertorelle et al. 2010). This is achieved
by generating alternative simulated datasets based on
assumptions about evolutionary and demographic
parameters which are then compared to the observed
data using summary statistics.
Surprisingly few studies have used ABC to infer
the bottleneck histories of natural populations, and
these have largely explored events occurring over
time scales of thousands of years (Chan et al. 2006;
Thornton & Andolfatto 2006), often using a combina-
tion of ancient and contemporary samples. However,
many conservation biologists are more interested in
the impact of relatively recent, anthropogenically
induced bottlenecks. Moreover, the use of ancient
samples has largely restricted studies to using mito-
chondrial DNA (mtDNA) sequences, whereas the
inclusion of multiple unlinked nuclear markers such
as microsatellites holds the potential to substantially
improve analytical power (Chan et al. 2006; Chevalet
& Nikolic 2010). Finally, previous studies have lacked
detailed historical observations with which to parame-
terize bottleneck scenarios for evaluation within the
ABC framework.
The Antarctic fur seal (Arctocephalus gazella) provides
an excellent opportunity to explore the relative abilities
of established and emerging analytical approaches to
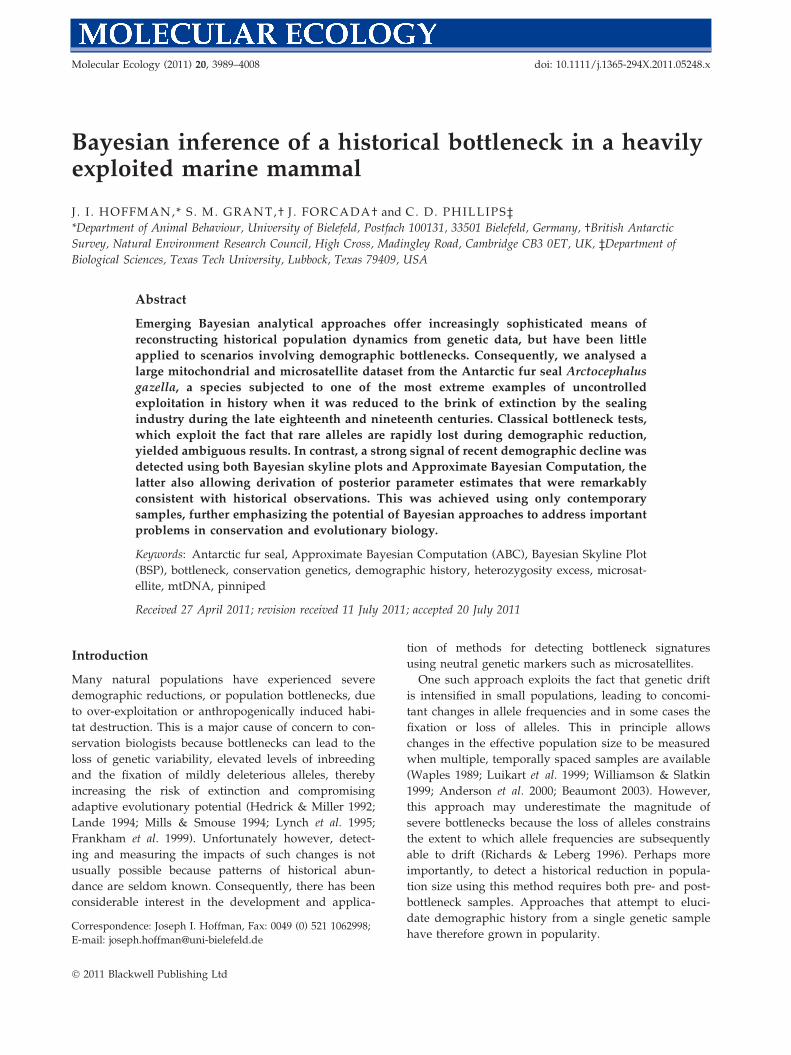
detect a recent historical bottleneck. This species occurs
predominantly to the south of the Antarctic Conver-
gence, with 97% of the extant population breeding on
the island of South Georgia (Fig. 1, Boyd & Roberts
1993). Like most other members of the Arctocephalus
genus, Antarctic fur seals were subject to uncontrolled
exploitation for their fur and oil during the late eigh-
teenth and nineteenth centuries. Uniquely however,
many of the journals and logbooks of early explorers
and sealing captains have been retained and scrutinized
(see Table S1, Supporting information) allowing
detailed reconstruction of the timing and extent of the
demographic reduction (Fig. 2). Census data are simi-
larly available with which to track the post-exploitation
recovery of the population (see Table S2, Supporting
information). Together, these historical records allow
the a priori parameterization of a plausible demographic
model that can be tested using ABC.
� 2011 Blackwell Publishing Ltd
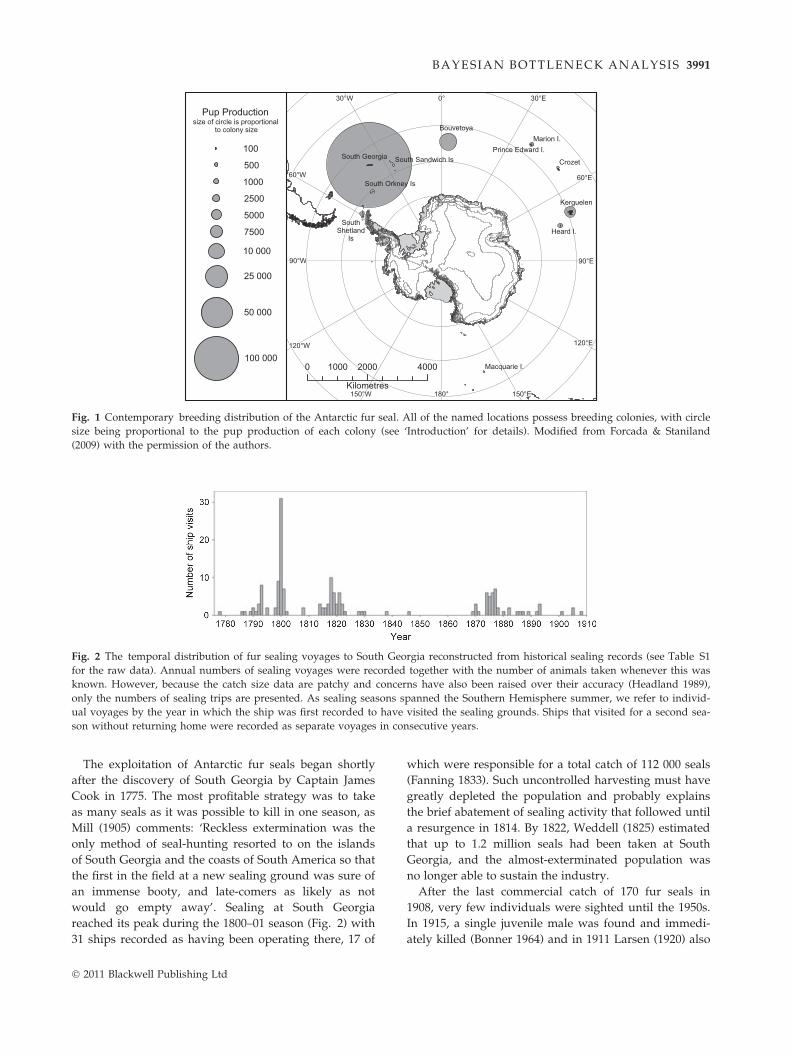
Fig. 2 The temporal distribution of fur sealing voyages to South Georgia reconstructed from historical sealing records (see Table S1
for the raw data). Annual numbers of sealing voyages were recorded together with the number of animals taken whenever this was
known. However, because the catch size data are patchy and concerns have also been raised over their accuracy (Headland 1989),
only the numbers of sealing trips are presented. As sealing seasons spanned the Southern Hemisphere summer, we refer to individ-
ual voyages by the year in which the ship was first recorded to have visited the sealing grounds. Ships that visited for a second sea-
son without returning home were recorded as separate voyages in consecutive years.
4000
Crozet
Bouvetoya
Kerguelen
Heard I.
South Georgia
Marion I.
Macquarie I.
South Orkney Is
Prince Edward I.
SouthShetland
Is
South Sandwich Is
120°W120°W
90°W90°W
60°W60°W 60°E60°E
90°E90°E
150°W150°W 180°180° 150°E150°E
30°W30°W 0°0° 30°E30°E
120°E120°E
0 20001000
Kilometres
Pup Productionsize of circle is proportional
to colony size
100
500
1000
2500
5000
7500
10 000
25 000
50 000
100 000
Fig. 1 Contemporary breeding distribution of the Antarctic fur seal. All of the named locations possess breeding colonies, with circle
size being proportional to the pup production of each colony (see ‘Introduction’ for details). Modified from Forcada & Staniland
(2009) with the permission of the authors.
BAYESI AN BOTTLENECK ANALYSIS 3991
The exploitation of Antarctic fur seals began shortly
after the discovery of South Georgia by Captain James
Cook in 1775. The most profitable strategy was to take
as many seals as it was possible to kill in one season, as
Mill (1905) comments: ‘Reckless extermination was the
only method of seal-hunting resorted to on the islands
of South Georgia and the coasts of South America so that
the first in the field at a new sealing ground was sure of
an immense booty, and late-comers as likely as not
would go empty away’. Sealing at South Georgia
reached its peak during the 1800–01 season (Fig. 2) with
31 ships recorded as having been operating there, 17 of
� 2011 Blackwell Publishing Ltd
which were responsible for a total catch of 112 000 seals
(Fanning 1833). Such uncontrolled harvesting must have
greatly depleted the population and probably explains
the brief abatement of sealing activity that followed until
a resurgence in 1814. By 1822, Weddell (1825) estimated
that up to 1.2 million seals had been taken at South
Georgia, and the almost-exterminated population was
no longer able to sustain the industry.
After the last commercial catch of 170 fur seals in
1908, very few individuals were sighted until the 1950s.
In 1915, a single juvenile male was found and immedi-
ately killed (Bonner 1964) and in 1911 Larsen (1920) also

Table 1 Numbers of Antarctic fur seals genotyped at the
mitochondrial HVR1 and 21 microsatellite loci. For a detailed
map of the sampling locations, see Fig. S1 (Supporting infor-
mation)
Location Sampling site
Number of
samples
genotyped
Willis Islands Main Island 16
Bird Island Study colony 142
Freshwater beach 25
Mainland
South Georgia
Prince Olav Harbour 12
Leith Harbour 1
Husvik 12
Cooper Bay 14
Annenkov Island 15
Wilson Harbour 9
246
3992 J . I . HOFFMAN ET AL.
reported sighting a group of 30 individuals. A dedi-
cated fur seal survey found 38 animals at Bird Island in
1933 and inferred a total population of 60 (Bonner
1964). The Discovery expedition of 1936 subsequently
reported 59 seals including 12 pups at the same location
(Payne 1977), but the population is thought to have
remained at around this level until the 1950s. Rapid
population growth ensued in the 1960s and 1970s, and
by 1990 fur seal numbers were estimated to have
reached 1.5 million (Boyd 1993). The most recent esti-
mate of 3 million was made at the XXIII Antarctic
Treaty Consultative Meeting in 1999 (Specially Pro-
tected Species in Antarctica. XXIII ATCM ⁄ WP24.
Agenda Item 7c; Meeting 1999).
Here, we genotyped 246 Antarctic fur seals from
South Georgia at a 263-bp region of the hypervariable
region 1 (HVR1) of the mitochondrial control region and
21 unlinked highly polymorphic microsatellites. Our
aims were to explore the relative abilities of classical bot-
tleneck tests and Bayesian approaches to recover a signal
of historical exploitation and to estimate via ABC the
distributions of key bottleneck parameters including
timing and minimum population size. Our approach dif-
fers from previous studies using ABC in two main
respects. First, our dataset comprises both mtDNA and
microsatellite data, bringing enhanced genetic resolution
as well as bi-parental perspectives. Second, population
reduction resulting from harvesting and subsequent
recovery are well documented in this species, providing
a strong a priori demographic model.
Materials and methods
Tissue sample collection
Tissue samples were collected from Antarctic fur seal
pups during the austral summer of 2003 ⁄ 2004 from an
intensively studied colony at Bird Island where an ele-
vated scaffold walkway (Doidge et al. 1984) provides
access to animals with minimal disturbance. Additional
samples were obtained from a neighbouring colony at
Freshwater Beach on Bird Island, from the nearby Willis
Islands and also from several rookeries around main-
land South Georgia that were visited opportunistically
by sailing boat (Table 1 and Fig. S1, Supporting infor-
mation). Samples were taken from the fore-flipper using
piglet ear-notching pliers and stored individually in the
preservative buffer 20% dimethylsulphoxide (DMSO)
saturated with salt at )20 �C.
DNA extraction and microsatellite genotyping
Total genomic DNA was extracted using an adapted
Chelex 100 protocol and phenol-chloroform purified.
Each sample was then genotyped at 21 unlinked micro-
satellite loci (Table 2) as described in detail by Hoffman
& Amos (2005). Loci were amplified using the following
PCR profile: one cycle of 120 s at 94 �C, 45 s at T1, 50 s
at 72 �C; 10 cycles of 30 s at 94 �C, 45 s at T1, 50 s at 72
�C; 25 cycles of 30 s at 89 �C, 45s at T2, 50s at 72 �C;
and one final cycle of five minutes at 72 �C (see Table 2
for T1 and T2). PCR products were resolved by electro-
phoresis on standard 6% polyacrylamide sequencing
gels, detected by autoradiography and scored manually.
GENEPOP (Raymond & Rousset 1995) was used to calcu-
late observed and expected microsatellite heterozygosi-
ties and to test for deviations from Hardy–Weinberg
equilibrium and for linkage disequilibrium. For each of
these tests, we set the dememorization number to
10 000, the number of batches to 1000 and the number
of iterations per batch to 10 000.
Mitochondrial DNA sequencing
A 316-bp region of the mitochondrial hypervariable
region 1 (HVR1) was PCR amplified using Thr ⁄ Pro (5¢-TCCCTAAGACTCAAGGAAGAG-3¢) and Cent (5¢-GAGCGAGAAGAGGTACACTTT-3¢) following Wynen
et al. (2000). Each PCR was carried out in a 25 lL reac-
tion volume containing 10 ng of template DNA, 10 mM
Tris–HCl (pH 8.3), 50 mM KCl, 2 mM MgCl2, 0.1%
Tween 20, 0.1% gelatine, 0.1% IGEPAL, 0.05 mM
dNTPs, 0.4 lM of each primer and 0.25 units of Taq
polymerase. The following PCR profile was used: one
cycle of 120 s at 94 �C; 15 cycles of 45 s at 94 �C, 45s at
50 �C, 60 s at 72 �C; 25 cycles of 45 s at 90 �C, 45 s at
50 �C, 60 s at 72 �C; and one final cycle of 5 min at 72
�C. Ten microlitres of PCR product was purified using
Antarctic phosphatase and exonuclease I (New England
� 2011 Blackwell Publishing Ltd

Table 2 Details of the 21 microsatellite loci employed in this study and their polymorphism characteristics in 246 Antarctic fur seals
Locus Isolated from species Reference
T1
(�C)
T2
(�C)
Number
of alleles HE HO
HWE
P value
Aa4 South American fur seal Arctocephalus
australis
Gemmell et al. (1997) 46 48 6 0.745 0.715 0.372
Ag10 Antarctic fur seal Arctocephalus gazella Hoffman et al. (2008) 46 48 7 0.771 0.758 0.206
Agaz1 Antarctic fur seal Arctocephalus gazella Hoffman (2009) 50 54 13 0.872 0.814 0.010
Agaz2 Antarctic fur seal Arctocephalus gazella Hoffman (2009) 46 48 10 0.793 0.794 0.218
Hg1.3 Grey seal Halichoerus grypus Gemmell et al. (1997) 42 46 13 0.871 0.855 0.920
Hg6.3 Grey seal Halichoerus grypus Allen et al. (1995) 46 48 13 0.869 0.842 0.051
Hg6.10 Grey seal Halichoerus grypus Allen et al. (1995) 55 60 14 0.850 0.884 0.595
Hg8.10 Grey seal Halichoerus grypus Allen et al. (1995) 42 46 5 0.499 0.520 0.065
Lw8 Weddell seal Leptonychotes weddellii Davis et al. (2002) 42 46 13 0.903 0.937 0.892
Lw10 Weddell seal Leptonychotes weddellii Davis et al. (2002) 46 48 17 0.909 0.898 0.750
Lw15 Weddell seal Leptonychotes weddellii Davis et al. (2002) 48 52 14 0.883 0.803 0.008
M11a Southern elephant seal Mirounga leonina Hoelzel et al. (1999) 46 48 18 0.918 0.906 0.353
OrrFCB1 Atlantic walrus Odobenus rosmarus rosmarus Buchanan et al. (1998) 45 50 10 0.789 0.718 0.220
OrrFCB7 Atlantic walrus Odobenus rosmarus rosmarus Buchanan et al. (1998) 55 60 12 0.851 0.865 0.720
OrrFCB8 Atlantic walrus Odobenus rosmarus rosmarus Buchanan et al. (1998) 55 60 8 0.786 0.812 0.156
OrrFCB16 Atlantic walrus Odobenus rosmarus rosmarus Buchanan et al. (1998) 55 60 4 0.578 0.615 0.128
Pv9 Grey seal Halichoerus grypus Allen et al. (1995) 48 52 10 0.753 0.765 0.809
PvcA Harbour seal Phoca vitulina Coltman et al. (1996) 46 48 7 0.782 0.754 0.677
PvcE Harbour seal Phoca vitulina Coltman et al. (1996) 45 50 14 0.875 0.882 0.970
Zcwb07 Galapagos sea lion Zalophus californianus
wollebaeki
Hoffman et al. (2007) 48 52 12 0.853 0.896 0.335
Zcwg04 Galapagos sea lion Zalophus californianus
wollebaeki
Hoffman et al. (2007) 46 48 17 0.901 0.879 0.532
T1 and T2 denote PCR annealing temperatures. HE, expected heterozygosity; HO observed heterozygosity. Individually significant
Hardy-Weinberg equilibrium (HWE) P values at a < 0.05 are highlighted in bold. None of these remained significant following table-
wide sequential Bonferroni adjustment.
BAYESI AN BOTTLENECK ANALYSIS 3993
Biolabs) following the manufacturer’s recommended
protocol. Samples were then sequenced using the
Applied Biosystems BigDye� Terminator v3.1 Cycle
Sequencing Kit and analysed on an ABI PRISMTM 377
DNA sequencer. Fragments were sequenced initially
from the 5¢-end, but were also repeated from the 3¢-end
if the first sequence was either too short or contained
one or more ambiguous bases. Consensus sequences
were generated using CHROMASPRO version 1.3.4 and all
of the sequences were then aligned manually within
BIOEDIT version 5.0.6 (Hall 1999). Sites containing inser-
tions ⁄ deletions or missing data were removed, includ-
ing a highly variable region enriched for TC repeats
that was previously described by Wynen et al. (2000) as
the ‘TC landmark’. All the sequences were then
trimmed to the length of the shortest sequence. This
yielded 263-bp of contiguous sequence, corresponding
to sites 14–292 of the Genbank sequence for Wynen
et al.’s (2000) A.gazella haplotype 1 (AF384376). Finally,
17 randomly selected samples were repeated from
scratch to determine repeatability. All the pairs of repli-
cates were identical, suggesting that the mtDNA data-
set is of high quality.
� 2011 Blackwell Publishing Ltd
Tests for population substructure
Because the inference of historical changes in popula-
tion size can be sensitive to population structure (Peter
et al. 2010), we first checked for the presence of genetic
subdivision within South Georgia by calculating pair-
wise Fst values among all of the sampling locations for
both classes of marker. Fst was calculated for microsat-
ellites using FSTAT version 2.9.3 (Goudet 1995) and for
mitochondrial DNA using ARLEQUIN version 2.0 (Schnei-
der et al. 2000). Mean pairwise Fst among populations
was )2.5 · 10)5 (SE = 0.001, range = )0.011 to 0.012) for
microsatellites and -0.032 (SE = 0.018, range = )0.367 to
0.105) for mtDNA. Only three of the 72 resulting values
were individually significant at P < 0.05, none of which
remained so following sequential Bonferroni correction
for multiple tests. We also conducted a Bayesian cluster
analysis of the microsatellite genotype dataset using the
program STRUCTURE version 2.2.3 (Pritchard et al. 2000).
This program uses a maximum likelihood approach to
determine the most likely number of genetically distinct
groups in a sample (K) by subdividing the dataset in a
way that maximizes Hardy–Weinberg equilibrium and

3994 J . I . HOFFMAN ET AL.
linkage equilibrium within the resulting clusters. We
ran five independent runs each for K = 1–9 using
1 · 106 MCMC iterations after a burn-in of 1 · 105,
specifying the correlated allele frequencies model and
assuming admixture. The replicate runs for each value
of K were highly concordant for their output log likeli-
hood values, with the highest values being consistently
associated with K = 1 (Fig. S2, Supporting information),
indicating a lack of genetic structure. Moreover, the
results of subsequent data analyses were qualitatively
similar regardless of whether the full dataset was used
or analyses were restricted to the study colony at Bird
Island (data not shown).
Microsatellite-based bottleneck tests
To test for evidence of a genetic bottleneck, we first
used the heterozygosity excess method of Luikart et al.
(1998) implemented within the program BOTTLENECK ver-
sion 1.2.02 (Piry et al. 1999). One potential drawback of
this approach is that, although microsatellites evolve
mainly by gaining or losing a single repeat unit (the
Stepwise Mutation Model, SMM (Kimura & Ohta
1978)), occasional larger ‘jump’ mutations of several
repeat units are also common (Di Rienzo et al. 1994;
Schlotterer et al. 1998). Consequently, BOTTLENECK allows
the user to specify a range of mutation models, from
the strict SMM through two-phase models (TPMs) with
varying proportions of multi-step mutations to the infi-
nite alleles model (IAM) where every new mutation is
novel. For our analysis, four TPM models were evalu-
ated with 1%, 5%, 10% and 30% multi-step mutations
respectively and a default variance of 30. For each of
the mutational models, the heterozygosity of each locus
expected under mutation-drift equilibrium given the
observed number of alleles (Heq) was determined using
10 000 simulations and then compared against observed
heterozygosity (He). We then recorded the number of
loci for which He was greater than Heq and determined
whether the overall set of deviations was statistically
significant using sign, standardized differences and Wil-
coxon signed ranks tests. Bottlenecked populations are
also expected to exhibit a characteristic ‘mode shift’ in
the frequency distribution of alleles away from the L-
shaped distribution expected under mutation-drift equi-
librium (Luikart et al. 1998). Consequently, BOTTLENECK
was also used to generate a qualitative descriptor of
whether the observed allele frequencies at each locus
deviate from such a distribution.
As an alternative test for a population bottleneck, we
also calculated Garza and Williamson’s M-ratio for our
dataset using the program M_P_VAL (Garza & William-
son 2001). The significance of the resulting value was
determined by comparison against a distribution of M
values calculated from 10 000 theoretical populations in
mutation-drift equilibrium. Using conventional criteria,
a significant reduction in population size is inferred if
fewer than 5% of the replicates fall below the observed
value of M. The program allows the user to modify
three parameters that approximate the mutation process
in natural populations: the proportion of mutations that
are larger than a single step (pg), the average size of
non-single-step mutations (Dg) and h = 4 Nel (where Ne
is the effective pre-bottleneck population size at equilib-
rium and l is the mutation rate). We used the default
settings of pg = 0.1 and Dg = 3.5, and varied h between 1
and 1000, the latter corresponding to an effective pre-
bottleneck population size of 500 000 assuming a com-
monly used estimate of the dinucleotide microsatellite
mutation rate of 5 · 10)4 mutants per gamete per gener-
ation (Weber & Wong 1993) as suggested by Garza &
Williamson (2001).
Mitochondrial DNA analyses
To visualize relationships among the observed mtDNA
haplotypes, a median joining network was constructed
within NETWORK version 4.516 (Bandelt et al. 1999). This
program calculates all possible minimum spanning
trees for the dataset and then combines these into a
single minimum spanning network following an algo-
rithm directly analogous to that proposed by Excoffier
& Smouse (1994). Inferred intermediate haplotypes are
then added to the network in order to minimize its
overall length. For comparison, we also estimated a
statistical parsimony network (Templeton et al. 1992)
using the program TCS version 1.2.1 (Clement et al.
2000). This approach first defines the uncorrected
distance between haplotypes above which the parsi-
mony criterion is violated with more than 5% probabil-
ity (the ‘parsimony limit’). The haplotypes are then
connected to one another, starting with those that are
most similar, until either all of the haplotypes are
included in a single network or the parsimony limit has
been reached.
The distribution of the observed number of differ-
ences between each pair of haplotypes (the ‘mismatch
distribution’, Slatkin & Hudson 1991; Rogers & Har-
pending 1992) was next calculated within ARLEQUIN.
This typically forms a unimodal wave in samples
drawn from recently expanded populations, whereas
samples from static or bottlenecked populations tend to
exhibit multimodal distributions (Slatkin & Hudson
1991; Rogers & Harpending 1992; Excoffier & Schneider
1999). ARLEQUIN was also used to calculate Harpending’s
raggedness index (Harpending 1994) and to test for
deviation of the observed dataset from a model of rapid
population expansion assuming the same mean number
� 2011 Blackwell Publishing Ltd

BAYESI AN BOTTLENECK ANALYSIS 3995
of pairwise differences as the observed sample (Rogers
& Harpending 1992). To test for deviations from neu-
trality, we also calculated Tajima’s D (Tajima 1989) and
Fu’s Fs (Fu 1997) within ARLEQUIN. Significant negative
values of these statistics indicate an excess of low fre-
quency polymorphisms, a pattern commonly attributed
to recent population expansion.
Bayesian skyline plot
MCMC sampling procedures (Drummond et al. 2005)
were used to generate a BSP of female effective popula-
tion size (Nef) over time within BEAST version 1.5.4
(Drummond & Rambaut 2007). The Bayesian skyline
algorithm describes a flexible demographic model
which estimates the posterior distributions of theta
(h = Nefs, where s = generation length) through time
while minimizing assumptions about population
growth trajectories. Three discrete changes in popula-
tion size were allowed, a value selected so as not to
over-parameterize the data. To allow derivation of Nef
from h, we estimated s, defined by Caswell (2001) as
the mean age of mothers of the offspring produced by a
cohort over its lifetime, at 9.89 years (SD = 2.42,
range = 4.83–12.72) using 26 consecutive years of data
within population models developed and implemented
by Forcada et al. (2008).
Due to uncertainty over the exact HVR1 mutation
rate, we explored a range of values. First, as a lower
bound we used Dickerson et al.’s (2010) estimate of the
HVR1 mutation rate of 5.74 · 10)7 substitutions per site
per generation (s ⁄ s ⁄ gen) derived for Callorhinus ursinus.
However, this may underestimate the true value
because it was based on multiple species alignments,
which represent more evolutionary time for recurrent
mutation to occur among lineages. Second, we used
Phillips et al.’s (2009) estimate of 2.71 · 10)6 s ⁄ s ⁄ gen
derived for Eumetopias jubatus. This figure is potentially
more realistic because it was obtained by calibration
with a linked coding region, thereby correcting for ho-
moplasies that would otherwise go undetected. Third,
we estimated the rate directly for A.gazella based on
mean pairwise sequence divergence from its sister
taxon A.tropicalis, assuming a time to most recent com-
mon ancestor (tmrca) of 20 thousand years ago (Higdon
et al. 2007). The resulting value was unusually high at
3.65 · 10)5 s ⁄ s ⁄ gen and could quite possibly be a gross
over-estimate due to uncertainty over Higdon et al.’s
(2007) estimate of tmrca at this shallow node. However,
similarly high rates have also been reported over short
time intervals in other species (Heyer et al. 2001; Subra-
manian et al. 2009). Consequently, we took the cautious
approach of using this value as an upper bound for our
analyses. Finally, we ran a fourth analysis making no
� 2011 Blackwell Publishing Ltd
prior assumptions on the mutation rate or tmrca.
Although this only generated relative parameter esti-
mates that cannot be directly interpreted as actual Nef
or time, it allowed us to determine whether assump-
tions about the mutation rate or tmrca affected the shape
of the demographic reconstructions. All BSP analyses
consisted of either 50 or 75 million MCMC iterations,
depending on which of these produced acceptable effec-
tive sample sizes (ESS) as defined by the program
authors for the posterior and prior distributions.
Approximate Bayesian Computation (ABC) analysis
Statistical support for alternative historical scenarios
that either included or excluded a bottleneck was tested
within an ABC framework. This allowed us not only to
determine whether or not a bottleneck is likely to have
occurred, but also to estimate values of key parameters
of interest. We initially simulated two primary historical
models. The first incorporated a recent population bot-
tleneck, with prior distributions broadly surrounding
values derived from historical records (Fig. 2). The
model described an ancestral Ne uniformly distributed
between 1 and 1.5 · 106, the upper bound encompass-
ing Weddell’s (1825) estimate of 1.2 million seals having
been taken during the initial bout of harvesting. The
occurrence of the bottleneck was described by two uni-
form distributions representing the time parameter
associated with Ne-historical (15–100 generations ago) and
the time associated with the end of the bottleneck (i.e.
with the lowest value of Ne-bottleneck, 1–30 generations
ago). The bottleneck model was constrained such that
changes in effective population size occur simulta-
neously. The prior on Ne-bottleneck was bounded between
1 and 1000, values that generously surround the 1911
census population of 30 individuals (Larsen 1920). Ne-
contemporary was uniformly distributed between 1 and
1.5 · 106. For comparison, a null model of no popula-
tion bottleneck was also defined, in which Ne was uni-
formly distributed through time (1–100 generations)
and bounded between 1 and 1.5 · 106 individuals. For
both models, the HVR1 mutation rate was defined by a
uniform distribution with lower and upper bounds of
5.74 · 10)7 (Dickerson et al. 2010) and 2.71 · 10)6 (Phil-
lips et al. 2009) s ⁄ s ⁄ gen respectively. The HKY + I + G
(I = 0.57, G = 0.50) mutation model defined for HVR1
was determined using the hierarchical likelihood ratio
test and Akaike information criterion, as implemented
in JMODELTEST v 0.1.1 (Posada 2008). For microsatellites,
the generalized stepwise mutation model (Estoup et al.
2002) was implemented with a mean rate uniformly dis-
tributed between 1.00 · 10)4 and 1.00 · 10)3 substitu-
tions ⁄ generation. These simulations were performed
assuming a 1:1 sex ratio.

3996 J . I . HOFFMAN ET AL.
To explore the influence of prior assumptions on pos-
terior distributions using ABC we next initiated a series
of simulations incorporating prior parameter adjust-
ments. Specifically, we examined the influence of
assumptions on the prior distributions of the mitochon-
drial mutation rate and sex ratio on the posterior distri-
butions of parameters of interest. This was important
because the assumed value of lmitochondrial describes the
source of genetic diversity for simulated populations
while sex ratio influences the diversity of bi-parentally
inherited markers. The effect of HRV1 mutation rate
prior was explored using a liberal prior bounded by
5.74 · 10)7 and 3.65 · 10)5 s ⁄ s ⁄ gen. The effect of assum-
ing a 1:1 sex ratio was assessed through additional sim-
ulations based on a sex ratio of one male to five
females. This sex ratio was drawn from field observa-
tions and it is unclear how accurately this value reflects
the true genomic contributions of the two sexes.
In addition to the above simulations, all models were
simulated a second time, but with broadened uniform
priors on all parameters relating to Ne and time. Specifi-
cally, contemporary and historic Ne were distributed
between 1 and 6 · 106, bottleneck Ne between 1 and
2000, time associated with Ne-historical between 1 and 500
generations ago, and timing of the end of the bottleneck
between 1 and 50 generations ago. Prior distributions of
parameters for all analyses are described in Table 4.
Finally, to assess whether the strength of the bottleneck
signal differs between the mtDNA and microsatellite
datasets, additional simulations were performed on
each data type independently. These were carried out
twice, once with the initially defined priors on Ne and
time, and also following the broadened priors on these
parameters.
For each model, one million genetic datasets were
simulated with the defined demographic and marker
parameters. Four summary statistics were then gener-
ated for the observed and simulated datasets: mean
Table 3 The number of loci with heterozygosity excess and test p
‘Materials and methods’ for details) within the program BOTTLENECK (P
Mutational
model
No. of loci with
heterozygosity
excess
Sign tes
P value
IAM 21 <0.0001
TPM70 20 <0.001
TPM90 17 0.008
TPM95 16 0.075
TPM99 16 0.076
SMM 12 0.531
The mode test revealed normal L-shaped distributions under all of th
correction for multiple statistical tests are highlighted in bold.
pairwise difference and Tajima’s D (Tajima 1989) for
HVR1, and mean heterozygosity and the mean number
of alleles for microsatellites. Normalized Euclidean dis-
tances were calculated between the observed dataset
and each of the simulated datasets using the local linear
regression method of Beaumont et al. (2002). The ten
thousand datasets with the smallest Euclidean distances
were then retained to build posterior parameter distri-
butions, which were smooth weighted using the Locfit
function within R version 2.9.1 (R Development Team
2005). The posterior probabilities of each scenario were
estimated using a logistic regression approach, provid-
ing both point estimates and 95% confidence intervals
(Fagundes et al. 2007; Cornuet et al. 2008). Statistical
measures of performance and Type I and Type II error
rates were also calculated as a means of model checking
(Excoffier et al. 2005). All the above analyses were
implemented within the DIYABC v1 software package
(Cornuet et al. 2008, 2010).
Results
To test for a genetic signature of a historical population
bottleneck, we genotyped 246 Antarctic fur seals from
nine rookeries across South Georgia (Table 1) at 21 mi-
crosatellite loci and sequenced a 263-bp segment of the
hypervariable region 1 (HVR1) of the mitochondrial
control region. The microsatellite loci were highly infor-
mative, possessing on average 11.3 alleles and with a
mean observed heterozygosity of 0.81 (Table 2). Follow-
ing sequential Bonferroni correction to compensate for
multiple statistical tests, none of the loci deviated signif-
icantly from Hardy-Weinberg equilibrium and no pairs
of loci exhibited significant linkage disequilibrium. The
same was found restricting the dataset to the study col-
ony on Bird Island (n = 142, Table S3, Supporting infor-
mation). A total of 26 mitochondrial haplotypes were
identified, eleven of which (Genbank accession numbers
robabilities obtained using a range of mutational models (see
iry et al. 1999)
t
Standardized
differences test
P value
Wilcoxon test
P value
<0.0001 <0.0001
<0.0001 <0.0001
0.002 <0.001
0.018 0.008
0.326 0.320
0.373 0.919
e scenarios tested. P values significant at a < 0.05 without
� 2011 Blackwell Publishing Ltd

Tab
le4
Pri
or
un
ifo
rmd
istr
ibu
tio
ns,
mea
n,
med
ian
,m
od
e,q
uan
tile
san
des
tim
ates
of
bia
san
dp
reci
sio
n(M
RB
=m
ean
rela
tiv
eb
ias,
RM
SE
=ro
ot
mea
nsq
uar
eer
ror)
for
the
po
ster
iors
of
par
amet
ers
calc
ula
ted
fro
msi
mu
lati
on
so
fh
isto
ric
mo
del
sth
atd
iffe
red
inp
rio
rb
ou
nd
so
fsp
ecifi
cp
aram
eter
s
Par
amet
erM
od
elP
rio
rM
ean
Med
ian
Mo
de
5%95%
MR
BR
MS
E
Ne-
con
tem
por
ary
Init
ial
1–1.
5·
106
7.44
·10
57.
42·
105
1.78
·10
56.
69·
104
1.42
·10
66.
5098
.68
Sex
rati
o=
1:5
7.44
·10
57.
45·
105
2.24
·10
57.
53·
104
1.42
·10
62.
3618
.19
Bro
aden
edl s
eq
7.38
·10
57.
33·
105
4.32
·10
57.
00·
104
1.43
·10
65.
7658
.36
Mic
rosa
tell
ites
on
ly7.
45·
105
7.44
·10
51.
94·
105
7.28
·10
41.
42·
106
4.49
40.7
8
Bro
ad
en
ed
1–6
·10
62.
98·
106
2.97
·10
66.
98·
105
2.79
·10
55.
72·
106
2.13
11.9
0
Sex
rati
o=
1:5
2.95
·10
62.
92·
106
2.74
·10
52.
73·
105
5.67
·10
66.
1060
.50
Bro
aden
edl s
eq
3.01
·10
63.
04·
106
5.17
·10
62.
85·
105
5.71
·10
67.
8010
5.60
Mic
rosa
tell
ites
on
ly3.
00·
106
2.98
·10
62.
72·
106
2.93
·10
55.
70·
106
2.83
19.9
0
Ne-
bot
tlen
eck
Init
ial
1–10
0016
413
912
246
371
0.62
1.85
Sex
rati
o=
1:5
356
313
215
9282
10.
772.
70
Bro
aden
edl s
eq
169
140
133
4842
90.
602.
69
Mic
rosa
tell
ites
on
ly18
815
315
353
563
0.68
2.97
Bro
ad
en
ed
1–20
0065
866
268
821
710
700.
431.
49
Sex
rati
o=
1:5
1200
1250
1360
469
1810
0.48
3.64
Bro
aden
edl s
eq
660
667
678
228
1090
0.42
1.30
Mic
rosa
tell
ites
on
ly66
565
559
321
611
000.
330.
98
Ne-
his
tori
cal
Init
ial
1–1.
5·
106
7.77
·10
57.
63·
105
3.96
·10
51.
55·
105
1.43
·10
61.
5622
.52
Sex
rati
o=
1:5
3.60
·10
52.
42·
105
1.17
·10
56.
39·
104
1.10
·10
63.
2933
.13
Bro
aden
edl s
eq
7.48
·10
57.
20·
105
3.59
·10
51.
44·
105
1.42
·10
61.
078.
64
Mic
rosa
tell
ites
on
ly6.
31·
105
5.94
·10
59.
56·
103
1.19
·10
41.
41·
106
2.90
35.6
5
Bro
ad
en
ed
1–6
·10
62.
41·
106
2.05
·10
67.
40·
105
3.20
·10
55.
49·
106
0.83
3.52
Sex
rati
o=
1:5
9.07
·10
54.
35·
105
9.88
·10
46.
79·
104
3.67
·10
62.
0320
.00
Bro
aden
edl s
eq
2.29
·10
61.
92·
106
5.74
·10
52.
87·
105
5.42
·10
61.
316.
57
Mic
rosa
tell
ites
on
ly2.
79·
106
2.76
·10
61.
13·
104
1.23
·10
55.
67·
106
9.04
133.
37
s bot
tlen
eck-
end
Init
ial
1–30
1211
62
270.
772.
49
Sex
rati
o=
1:5
1312
62
270.
752.
31
Bro
aden
edl s
eq
1211
52
270.
812.
49
Mic
rosa
tell
ites
on
ly13
127
328
1.05
2.87
Bro
ad
en
ed
1–50
1713
52
420.
973.
08
Sex
rati
o=
1:5
1713
42
430.
672.
38
Bro
aden
edl s
eq
1713
72
431.
003.
56
Mic
rosa
tell
ites
on
ly18
141
244
0.95
2.93
s his
tori
cal
Init
ial
15–1
0070
7410
032
980.
180.
59
Sex
rati
o=
1:5
6972
9629
980.
160.
57
Bro
aden
edl s
eq
7174
9932
980.
140.
56
Mic
rosa
tell
ites
on
ly71
7494
3198
0.19
0.59
Bro
ad
en
ed
1–20
0031
632
949
010
448
52.
517
.88
Sex
rati
o=
1:5
284
287
279
7747
51.
6014
.18
Bro
aden
edl s
eq
316
327
466
105
484
3.62
3.56
Mic
rosa
tell
ites
on
ly32
033
349
710
848
62.
8323
.33
BAYESI AN BOTTLENECK ANALYSIS 3997
� 2011 Blackwell Publishing Ltd

Tab
le4
(Co
nti
nu
ed)
Par
amet
erM
od
elP
rio
rM
ean
Med
ian
Mo
de
5%95%
MR
BR
MS
E
l mit
ochon
dri
alIn
itia
l5.
74·
10)
7–2
.71
·10
)6
1.67
·10
)6
1.67
·10
)6
6.27
·10
)7
6.80
·10
)7
2.64
·10
)6
0.20
0.61
Sex
rati
o=
1:5
1.64
·10
)6
1.65
·10
)6
2.70
·10
)6
6.43
·10
)7
2.62
·10
)6
0.15
0.58
Bro
aden
edl s
eq
1.84
·10
)5
1.84
·10
)5
7.52
·10
)6
2.37
·10
)6
3.47
·10
)5
0.98
3.14
Bro
ad
en
ed
5.74
·10
)7–3
.65
·10
)5
1.65
·10
)6
1.65
·10
)6
5.78
·10
)7
6.67
·10
)7
2.65
·10
)6
0.21
0.65
Sex
rati
o=
1:5
1.57
·10
)6
1.52
·10
)6
5.78
·10
)7
6.31
·10
)7
2.65
·10
)6
0.22
0.68
Bro
aden
edl s
eq
1.85
·10
)5
1.85
·10
)5
1.21
·10
)6
2.22
·10
)6
3.47
·10
)5
1.29
4.18
l mic
rosa
tell
ite
Init
ial
1.00
·10
)4–1
.00
·10
)3
4.69
·10
)4
4.31
·10
)4
2.66
·10
)4
1.34
·10
)4
9.12
·10
)4
0.29
0.92
Sex
rati
o=
1:5
4.85
·10
)4
4.53
·10
)4
2.49
·10
)4
1.35
·10
)4
9.27
·10
)4
0.26
0.84
Bro
aden
edl s
eq
4.75
·10
)4
4.35
·10
)4
2.98
·10
)4
1.35
·10
)4
9.23
·10
)4
0.33
0.93
Mic
rosa
tell
ites
on
ly5.
24·
10)
45.
00·
10)
44.
12·
10)
41.
56·
10)
49.
38·
10)
40.
320.
91
Bro
ad
en
ed
1.00
·10
)4–1
.00
·10
)3
3.16
·10
)4
2.46
·10
)4
1.44
·10
)4
1.18
·10
)4
7.68
·10
)4
0.25
0.78
Sex
rati
o=
1:5
3.90
·10
)4
3.26
·10
)4
1.78
·10
)4
1.37
·10
)4
8.61
·10
)4
0.24
0.68
Bro
aden
edl s
eq
3.12
·10
)4
2.45
·10
)4
1.38
·10
)4
1.17
·10
)4
7.59
·10
)4
0.18
0.73
Mic
rosa
tell
ites
on
ly3.
53·
10)
42.
85·
10)
41.
83·
10)
41.
18·
10)
48.
17·
10)
40.
280.
79
3998 J . I . HOFFMAN ET AL.
JF304904–JF304914) had not previously been described
by Wynen et al. (2000).
Classical bottleneck tests
We first interrogated our microsatellite dataset for evi-
dence of a genetic bottleneck using the heterozygosity
excess approach of Luikart et al. (1998). The results
were highly dependent on the mutational model upon
which the predicted relationship between heterozygos-
ity and the number of alleles was based (Table 3).
Thus, a significant excess of heterozygosity relative to
expectations was detected under the IAM but not the
SMM and P-values obtained for TPM models scaled
positively with the proportion of multi-step mutations
specified. This pattern probably reflects the greater
power of the IAM to detect a bottleneck (Cornuet & Lu-
ikart 1996), despite this model being unrealistic for most
‘real’ microsatellites (Di Rienzo et al. 1994). A mode
shift in the allele frequency distribution was not
detected.
Recent simulations (Williamson-Natesan 2005) sug-
gest that when pre-bottleneck population size was large
or the population made a demographic recovery, the
ratio of the number of alleles to allelic size range may
be more informative about bottleneck history than het-
erozygosity excess. Consequently, we also calculated
the M-ratio of Garza & Williamson (2001). The resulting
value of 0.798 lies above the 0.7 threshold proposed by
Garza & Williamson (2001), implying a lack of support
for a bottleneck. Comparing this value against a null
distribution derived from 10 000 theoretical populations
in mutation-drift equilibrium, a bottleneck signature
was only inferred below h = 1.63, a value that corre-
sponds to a pre-bottleneck Ne of 812 assuming a default
microsatellite mutation rate of 5 · 10)4 (Weber & Wong
1993). This seems unrealistically low given Weddel’s
(1825) report of 1.2 million seals having been harvested.
Historical inference from mtDNA
For an alternative perspective on the recent demo-
graphic history of the species, we generated a Median
Joining Network (MJN) and mismatch distribution. The
MJN was remarkably diffuse, invoking the presence of
59 missing intermediate haplotypes (Fig. 3a). A qualita-
tively similar network was also obtained using statisti-
cal parsimony (data not shown), the main difference
being that several of the more distantly connected hapl-
otypes in the original MJN violated the parsimony limit
and were thus no longer incorporated (illustrated by
open circles in Fig. 3a). The observed mismatch distri-
bution was multimodal (Fig. 3b, Harpending’s ragged-
ness index = 0.034, P = 0.025), allowing us to reject a
� 2011 Blackwell Publishing Ltd

(a)
(b)
Fig. 3 Phylogenetic relationships among 26 mitochondrial
HVR1 haplotypes observed in 246 Antarctic fur seals. (a) a
median joining network in which each line joining two circles
corresponds to a single nucleotide substitution, with grey cir-
cles representing observed haplotypes, black circles represent-
ing hypothetical haplotypes that were not observed in the
sample and empty circles representing observed haplotypes
that were not connected to the rest of the network using a sta-
tistical parsimony approach (see Materials and methods for
details). Circle sizes reflect the relative frequency of each of the
observed haplotypes. (b) histogram showing the observed dis-
tribution of pairwise differences. For comparison, the dashed
line represents the expected distribution under a model of sud-
den population expansion.
Fig. 4 Bayesian skyline plot displaying the median Nef and
95% highest probability intervals plotted against time.
BAYESI AN BOTTLENECK ANALYSIS 3999
model of historical population expansion. Moreover,
Tajima’s D (Tajima 1989) and Fu’s Fs (Fu 1997) both
rendered positive, non-significant values (D = 0.632,
P = 0.801; Fs = 2.321, P = 0.774). Such a pattern is con-
sistent with a genetic bottleneck but also cannot be
readily distinguished from a static population at equi-
librium (see ‘Discussion’).
Bayesian skyline plot
We next attempted to reconstruct a historical profile of
female effective population size (Nef) over time. Several
� 2011 Blackwell Publishing Ltd
different Bayesian skyline analyses were conducted,
each varying in prior constraints placed on coalescence
time and mutation rate, but all generated consistently
similar historical Nef distributions. The emerging demo-
graphic pattern was one of a historically large and sta-
ble Nef followed by a recent, sharp decline, the timing
of which was not sensitive to prior assumptions on
either l or tmrca. However, assumptions on l did affect
the magnitude of pre-bottleneck Nef. estimates. The BSP
generated from the analysis with a 20kya coalescence
time and a HVR1 mutation rate of 2.71 · 10)6 s ⁄ s ⁄ gen
is shown in Fig. 4, as this yielded what we consider to
be the most biologically plausible historical population
size estimate (mean Nef was estimated at 2.5 million for
l = 5.74 · 10)7 s ⁄ s ⁄ gen, 1.4 million for l = 2.71 · 10)6
s ⁄ s ⁄ gen and 1800 for l = 3.65 · 10)5 s ⁄ s ⁄ gen).
Approximate Bayesian Computation (ABC) analysis
Evaluation of the two proposed historic models indi-
cated that the one incorporating a population bottleneck
based on historical observations most accurately
described the genetic data. This model received a pos-
terior probability of between 0.99 and 1, whereas the
model depicting a constant population size through
time received a posterior probability of between 0 and
0.01. In addition, Type I and Type II error rates for the
selection of the bottleneck model were 0.18 and 0.12
respectively. The posterior distribution of selected
parameters using values drawn from the 10 000 data-
sets closest to the observed are shown in Fig. 5 and
Table 4. These indicate a genetic bottleneck that ended
approximately 11 generations ago (mean = 12, med-
ian = 11, mode = 6 generations ago, 95% CI = 2–27)
with an Ne at this time of approximately 139
(mean = 164, median = 139, mode = 122, 95% CI = 46–

(a) (b)
(c) (d)
(e) (f)
Fig. 5 Posterior density curves of model parameters based on 10 000 accepted values from 1 · 106 iterations of the initial bottleneck
model (see ‘Materials and methods’ for details). Continuous, large-dashed and short-dashed lines represent posterior density curves
obtained for simulations with a sex ratio of 1, a sex ratio of 1:5 and with expanded priors on mitochondrial mutation rate respec-
tively. For the latter, data are only presented in panel f for the range 5.74 · 10)7 to 2.71 · 10)6. Dotted lines represent results obtained
for the microsatellite dataset only. Data from simulations using only mtDNA are not included due to the bottleneck model not being
supported.
4000 J . I . HOFFMAN ET AL.
371). No clear posterior estimate of the time parameter
associated with Ne-historical was recovered (data not
shown). The statistical descriptors for contemporary Ne
were much larger (mean = 744 000, mean = 742 000,
mode = 178 000, 95% CI = 66 900–1 420 000) and exhib-
ited a flat posterior distribution. Estimates of historical
Ne were also comparatively large (mean = 777 000,
median = 763 000, mode = 396 000, 95% CI = 155 000–
1 430 000), but the lower bound of the CI for historical
Ne was over twice as large as that estimated for contem-
porary Ne. Moreover, the posterior distribution of his-
torical Ne dipped towards lower Ne values indicating
resolution for estimating the posterior lower bound of
this parameter.
With Bayesian analytical approaches, choices of prior
distributions can have a strong impact on posterior
parameter estimates (Chan et al. 2006). Consequently,
we explored the sensitivity of our analysis to a variety
� 2011 Blackwell Publishing Ltd

BAYESI AN BOTTLENECK ANALYSIS 4001
of different prior assumptions (see ‘Materials and meth-
ods’ and Table 4 for details). Simulations involving
prior parameter adjustments on sex ratio and mitochon-
drial mutation rate from the initial bottleneck model
yielded largely unaltered estimates (Fig. 5, Table 4).
The main deviation observed was in the estimation of
bottleneck and historical Ne values from simulations
invoking a 1:5 sex ratio. These analyses depicted a lar-
(a) (b
(c) (d
(e) (f
Fig. 6 Posterior density curves of model parameters based on 10 000
with expanded priors on Ne and time (see ‘Materials and methods’ fo
resent posterior density curves obtained for simulations with a sex r
chondrial mutation rate respectively. For the latter, data are only pres
lines represent results obtained for the microsatellite dataset only. Da
the bottleneck model not being supported.
� 2011 Blackwell Publishing Ltd
ger bottleneck Ne (about double the size) and a histori-
cal Ne peaking at around 0.2 million.
For our initial simulations, we chose prior distribu-
tions tightly bounded around values based on the avail-
able historical data. However, to explore sensitivity to
these assumptions, we replicated all of the above simu-
lations with wider priors on Ne and time (Fig. 6,
Table 4). The bottleneck model was again highly sup-
)
)
)
accepted values from 1 · 106 iterations of the bottleneck model
r details). Continuous, large-dashed and short-dashed lines rep-
atio of 1, a sex ratio of 1:5 and with expanded priors on mito-
ented in panel f for the range 5.74 · 10)7 to 2.71 · 10)6. Dotted
ta from simulations using only mtDNA are not included due to

4002 J . I . HOFFMAN ET AL.
ported over the constant population size model (poster-
ior probabilities were 1 and 0, respectively), with type I
and II error rate estimates being lower than those
obtained from the initial simulations (0.08 and 0, respec-
tively). Parameter estimates were almost identical to
those obtained in our initial simulations with the excep-
tion of bottleneck Ne, which was consistently larger at
around 700 and 1400 for analyses based on a sex ratio
of 1 and 1:5 respectively.
Finally, we tested for any potential differences in the
strength of the bottleneck signal contained within the
mtDNA and microsatellite datasets by conducting addi-
tional simulations separately for each class of marker.
For microsatellites, the bottleneck model was supported
over the constant population size model regardless of
Ne and time priors (Figs 5 and 6; Table 4). Posterior
support values were also closely comparable to those
reported above (e.g. bottleneck model = 0.94–0.96 vs.
constant population size model = 0.04–0.05 for simula-
tions using the initial priors on Ne and time). In con-
trast, the mtDNA dataset was marginally better
supported by the constant population size model than
the bottleneck model (bottleneck model = 0.24–0.27;
constant population size model = 0.72–0.75).
Discussion
Classical bottleneck tests are often used by conservation
and evolutionary biologists to evaluate whether species
have experienced historical demographic bottlenecks. In
contrast, recently developed Bayesian approaches offer
the potential to allow more detailed inferences in respect
of both bottleneck timing and severity, but have not yet
been thoroughly evaluated. Consequently, we analysed
a multi-marker dataset using both sets of approaches to
elucidate the possible impact of historical exploitation
on Antarctic fur seals at South Georgia. Heterozygosity
excess, mode-shift and M-ratio tests yielded unclear
results. In contrast, Bayesian skyline and ABC analyses
both yielded strong support for a recent and severe
reduction in population size, with this inference appear-
ing reasonably robust to a variety of prior assumptions.
Microsatellite-based tests for a bottleneck
Interpretation of the results of classical bottleneck tests
was not straightforward. The heterozygosity excess
approach yielded P-values that were highly dependent
upon the underlying mutational model, a bottleneck
being inferred using the IAM but not the SMM, despite
the former being unrealistic for most microsatellites (Di
Rienzo et al. 1994). We therefore explored a range of
intermediate TPM models, these revealing evidence for
a bottleneck only when the proportion of multi-step
(non-SMM) mutations was greater than around 5%.
The true proportion probably lies in the region of 10–
15%, but can be highly variable among species, loci
and even alleles (Garza & Williamson 2001; Ellegren
2004). Consequently, although our results are suggestive
of a bottleneck, precise knowledge of the mutation
mode of our markers would be needed to be sure. This
uncertainty is further compounded by the results of the
mode-shift and M-ratio tests, neither of which sup-
ported a bottleneck scenario.
Several other microsatellite-based studies of species
thought to have experienced severe but temporary
reductions in population size have either failed alto-
gether to detect a bottleneck or, as with our study,
yielded results that depend on the mutational model
specified (Spong & Hellborg 2002; Waldick et al. 2002;
Spear et al. 2006; Busch et al. 2007; Rosa de Oliveira
et al. 2009). In at least some of these cases, too few
markers may have been used to provide adequate reso-
lution, a problem expected to disproportionately influ-
ence the more conservative SMM model. However, our
study used 21 microsatellite loci, over twice the mini-
mum number recommended by Luikart & Cornuet
(1998). These loci were also highly informative, possess-
ing on average 11.3 alleles (range = 5–18, Table 2).
Finally, tests for heterozygosity excess applied to an
independent dataset comprising 84 adult male individu-
als genotyped for a much larger panel of 76 microsatel-
lite loci (Hoffman et al. 2010) yielded virtually identical
results (data not shown).
A number of factors other than genetic resolution
may also influence the strength and duration of a bot-
tleneck signature. For example, immigration is capable
of erasing a bottleneck signal within a few generations,
particularly if the immigrants originate from a geneti-
cally divergent population, bringing with them rare
alleles but not substantially affecting overall heterozy-
gosity (Cornuet & Luikart 1996; Keller et al. 2001). Con-
versely, hybridization holds the potential to generate a
false positive signal, for example, artificially lowering
M by introducing gaps into the allele frequency distri-
bution (Garza & Williamson 2001). Again however, nei-
ther of these are likely to be important in Antarctic fur
seals. Global population structure is weak and much of
the species’ range is believed to have been seeded from
South Georgia and not vice versa (Wynen et al. 2000),
suggesting that historical immigration into our study
area is likely to have been negligible. Similarly,
although A. gazella is known to hybridize with the sub-
Antarctic fur seal A. tropicalis, Wynen et al. (2000) found
no shared haplotypes between these species and a
sequence divergence of 8%, suggesting that this phe-
nomenon is recent, not extensive and confined only to
very small regions of range overlap.
� 2011 Blackwell Publishing Ltd

BAYESI AN BOTTLENECK ANALYSIS 4003
One plausible explanation for the lack of a clear and
pervasive bottleneck signal using classical tests draws
upon the observation that this species recovered from
the demographic reduction extremely rapidly, census
sizes increasing from just a handful of individuals in
the 1920s to around three million within fewer than ten
generations of the recorded bottleneck. Rapid popula-
tion expansion is expected to promote the recovery of
allelic diversity (Slatkin & Hudson 1991) and will there-
fore tend to erode any pre-existing signal of heterozy-
gosity excess (Cornuet & Luikart 1996). Similarly, given
the unusually high average allelic richness of our panel
of loci and assuming that most mutations are single-
step, the majority of novel mutations would not be
expected to broaden the allelic size range, and should
therefore increase the M-ratio causing a corresponding
reduction in significance.
Finally, another possible explanation for our results is
that the bottleneck may not have been severe enough to
generate a clear heterozygosity excess ⁄ M-ratio signal in
the first place. However, this would require sufficiently
large numbers of individuals to have escaped sealing,
either at remote locations or perhaps even by shifting
their range en masse, only to return after the departure
of the sealers. The latter seems unlikely given the strong
breeding site fidelity exhibited by both sexes (Hoffman
et al. 2006) coupled with natal philopatry (Hoffman &
Forcada, in review). Nevertheless, the Willis Islands
provide a plausible refuge in the close vicinity of South
Georgia that could potentially have sheltered a small
breeding population (Wynen et al. 2000). To formally
evaluate the scale of population reduction that could be
detected in this species using classical bottleneck tests
would require extensive simulations in order to account
for key uncertainties including locus-specific mutation
models and rates, and Ne values.
Inferences from the distribution of mitochondrialhaplotypes
According to Rogers & Harpending (1992), populations
that have undergone recent bottlenecks tend to exhibit
ragged, multimodal mismatch distributions. This notion
has received considerable empirical support (Excoffier &
Schneider 1999; Weber et al. 2004; Johnson et al. 2007).
For example, a recent study of the Guadalupe fur seal
Arctocephalus townsendi that compared pre- with post-
bottleneck samples recovered a unimodal distribution
from the former but a multimodal distribution from the
latter (Weber et al. 2004). Similarly, contemporary sam-
ples taken from three unexploited Antarctic phocid spe-
cies reveal unimodal peaks indicative of Pleistocene
expansion (Curtis et al. 2009) whereas the heavily
exploited Juan Fernandez fur seal A. philippii shows a
� 2011 Blackwell Publishing Ltd
ragged distribution (Goldsworthy et al. 2000). Our study
detected clear multimodality in the mismatch distribu-
tion of the Antarctic fur seal, which would appear con-
sistent with the known recent history of the species.
However, populations in demographic equilibrium are
also expected to produce multimodal distributions,
reflecting the highly stochastic nature of gene genealo-
gies (Slatkin & Hudson 1991). Consequently, in our
study the mismatch distribution is only informative if
one is able to discount a priori the possibility of the pop-
ulation having remained at demographic equilibrium.
Another potential complication in interpreting the
mismatch distribution relates to the presence of weak
population structure across the species’ range. Wynen
et al. (2000) previously defined two mitochondrial
clades, one associated with South Georgia, the South
Shetlands, Bouvetøya and Marion Island, and a second
encompassing the eastern populations of Iles Kerguelen
and Macquarie Island. To test whether any of the dis-
tantly connected nodes within South Georgia’s median
joining network could have been sourced from the east-
ern clade, we constructed a second network incorporat-
ing populations sampled by Wynen et al. (2000) from
across the species range (Fig. S3, Supporting informa-
tion). Most of the haplotypes derived from the eastern
region were absent from South Georgia, suggesting that
they do not contribute appreciably to the overall topog-
raphy of the South Georgia network. Nevertheless,
these considerations highlight potential pitfalls in bas-
ing demographic inference entirely on contemporary
mtDNA samples. A better understanding the mismatch
distribution will have to await future studies that are
able to incorporate range-wide, stratiographically posi-
tioned historical genetic samples.
Bayesian inference
In contrast to classical bottleneck tests and the mtDNA
mismatch distribution, Bayesian skyline analysis pro-
vided clear evidence of a recent historical reduction in
Nef. This demographic trend was observed across BSPs
generated from multiple analyses that differed in
assumptions regarding tmrca and l, indicating the pres-
ence of a genetic signature within the observed data
that is robust to variation in the assumptions of these
parameters. Furthermore, the BSP’s flexible demo-
graphic model was also able to detect a genetic signa-
ture of demographic decline despite the population
having subsequently expanded. However, no signal of
post-bottleneck recovery was observed, consistent with
a similar lack of resolution for contemporary population
size in our ABC analyses (see below).
By applying ABC methods to the full Antarctic fur
seal genetic dataset comprising mtDNA sequence data

4004 J . I . HOFFMAN ET AL.
and 21 autosomal microsatellites, a bottleneck scenario
defined using historical records was strongly supported
over the alternative model of constant population size.
Moreover, the parameters of the bottleneck model,
being prior-bounded around harvest and post-harvest
population data, retained posterior distributions that
were highly consistent with the observational data. For
example, the median estimate for the timing of the end
of the genetic bottleneck returned from our initial
model was 109 years ago (corresponding to the year
1894) with an associated median Ne-bottleneck of 139 indi-
viduals. By comparison, the last commercial catch of fur
seals took place in 1908 and the census size was shortly
afterwards measured at 30 individuals (Larsen 1920).
Such a remarkable degree of congruence between cen-
sus and genetic estimates indicates a strong demo-
graphic signal for this historic event in the genetic
dataset. Furthermore, although the posterior distribu-
tion of contemporary Ne was flat, suggesting the
absence of a genetic signal for estimating this parame-
ter, the distribution of pre-bottleneck Ne indicated rela-
tively poor support for values below around 250 000.
This is consistent with a historically large population
that underwent a recent and drastic genetic bottleneck,
after which Ne has potentially begun to recover. It may
further indicate that the recency of the bottleneck has
limited any signal present for describing contemporary
Ne. Related, the observation that no clear posterior esti-
mate of the time parameter associated with Ne-historical
was recovered from our analyses further suggests the
erosion of this historic signal by the bottleneck.
Analytical sensitivity
A general area of uncertainty for many population
genetic studies concerns assumptions on l. In particu-
lar, tmrca, which is required for calibrating the estimation
of l, is often unknown. Furthermore, perceived l can
also be highly dependent on the amount of evolution-
ary time represented in a given dataset (ranging from
gametic and pedigree dataset rate estimates to those
estimated over longer evolutionary time scales (Heyer
et al. 2001; Phillips et al. 2009; Subramanian et al. 2009).
To compensate for these sources of uncertainty, we con-
structed several alternative BSPs and also defined rela-
tively broad prior distributions for lmitochondrial within
the ABC framework. The BSPs recovered the same
demographic trend regardless of lmitochondrial, but pre-
bottleneck Nef estimates were found to scale negatively
with l. The relationship between these parameters is as
would be expected under the coalescent given that phy-
logenetic relationships among haplotypes (and inter-
node branch lengths) were approximately the same
among analyses. In contrast, ABC analyses that differed
in prior bounds of lmitochondrial (one analysis incorporat-
ing a prior on lmitochondrial that very broadly surrounded
the prior for the other analysis) yielded highly congru-
ent estimates for the parameters Ne and s (particularly
for the bottleneck itself) although neither produced a
clear posterior definition of lmitochondrial. By implication,
lmitochondrial is not only difficult to estimate for this pop-
ulation history using ABC, but also appears to have lit-
tle influence on posterior parameter distributions
regardless of the exact scenario tested. This may be
related to the fact that the bottleneck signal within ABC
appears to be largely attributable to the microsatellite
dataset (see below).
Parameter estimates obtained for simulations explor-
ing sex ratio and prior boundaries on Ne and time were
also in general highly congruent. Consequently, for sim-
plicity we focused primarily on the results of the initial
model, although summaries of all of the simulations are
available in Table 4 and Figs 4 and 5. However, two
important points of difference were observed. First, sim-
ulations invoking a 1:5 sex ratio yielded somewhat dif-
ferent estimates of Ne-bottleneck and Ne-historical, with the
former being roughly double that estimated through
other simulations and the latter being approximately
half the size. Second, simulations based on broadened
prior definitions of Ne and time yielded Ne-bottleneck esti-
mates that were approximately four times larger than in
our initial models. It is unclear which of these simula-
tions lie closest to the truth. The prior bounds used for
our initial simulations were appropriately bounded
around values estimated from the available historical
data, but could potentially have been too conservative in
respect of historical and ⁄ or contemporary Ne. Similarly,
although a sex ratio of 1:5 based on the numbers of adult
males and females within the colony provides a reason-
able upper bound for exploring the sensitivity of our
analyses to variation in sex ratio, this figure is likely to
be too extreme. Accurate estimation of the operational
sex ratio is not yet possible for this species because this
would require large numbers of complete male and
female life histories incorporating individual-based mea-
sures of reproductive success and offspring survivor-
ship. However, a limited molecular paternity analysis
conducted previously at the same colony has shown
that, despite Antarctic fur seals being moderately polyg-
ynous, appreciable numbers of females do not conceive
to males sighted ashore, resulting in lower than expected
levels of shared paternity (Hoffman et al. 2003).
Bottleneck severity
Although simulations incorporating a variety of prior
distributions all independently supported a bottleneck
model over one of constant population size and the
� 2011 Blackwell Publishing Ltd

BAYESI AN BOTTLENECK ANALYSIS 4005
timing of recovery from the bottleneck was robustly
defined, considerable latitude was observed in poster-
ior estimates relating to Ne. This suggests that careful
exploration of prior bounds is crucial to deriving real-
istic posterior estimates, particularly for historical and
bottleneck population size, key parameters of interest
to conservation biologists. By exploring a generous
parameter space, we have shown that the true value
of Ne-bottleneck almost certainly lies above Larsen’s (1920)
census size of 30 individuals, and could be up to fifty
times higher. Moreover, we can be fairly confident that
the population remained small for only a few genera-
tions. Given that the substantial loss of genetic diver-
sity is believed to require a prolonged period of very
low population size (Amos & Harwood 1998), this
may help to explain why the Antarctic fur seal
remains one of the most genetically diverse of all pin-
niped species (Hoffman et al. 2009) despite having
passed through a well-documented population bottle-
neck.
Contributions of different markers
We have been able to analyse a genetic dataset compris-
ing more than one marker type thanks to a new frame-
work that allows ABC to be implemented jointly for
mtDNA and microsatellites (Cornuet et al. 2008). How-
ever, the question arises as to which of these two mark-
ers contributes most strongly to the detectable
bottleneck signal. This could have an important bearing
on the broader interpretation of our findings given that
the classical bottleneck tests were based exclusively on
microsatellites whereas only mtDNA was used for the
mismatch and BSP analyses. It is not entirely clear
a priori which of these two classes of marker would be
expected to be most informative in respect of a bottle-
neck: mtDNA owing to its lower effective population
size relative to the autosomal genome (Wilson et al.
1985) or microsatellites due to the enhanced resolution
provided by 21 unlinked highly polymorphic loci (Chan
et al. 2006). Our simulations incorporating only one
data type support the latter, with the bottleneck model
gaining strong support over a history of constant popu-
lation size for the microsatellite dataset, but the constant
population size model being marginally better sup-
ported for mtDNA. Moreover, posterior parameter esti-
mates obtained when the analysis was restricted to
microsatellites were also largely congruent with those
based on the combined mtDNA and microsatellite data,
the only exception being historical population size. This
suggests that the failure of classical bottleneck tests to
detect a clear bottleneck signal is more likely to be
related to the underlying approach than to the microsat-
ellite dataset being uninformative.
� 2011 Blackwell Publishing Ltd
Conclusions
Although detailed historical records document a reduc-
tion in population size in the Antarctic fur seal down to
30 individuals or fewer, it seems likely that larger num-
bers may have escaped sealing, either by breeding at
remote or inaccessible locations such as the Willis
Islands (Wynen et al. 2000) or perhaps by remaining out
at sea. Our results suggest that a dramatic reduction in
population size did indeed take place, but that this may
not have been substantial or long-lasting enough to have
appreciably reduced levels of genetic diversity. Similar
insights from other bottlenecked species offer to substan-
tially improve our understanding of how historical
demographic reductions influence contemporary genetic
diversity, with important implications for the conserva-
tion and management of threatened natural populations.
Acknowledgements
We are extremely grateful to S. Poncet, D. Poncet, G. Robert-
son, C. Duck, E. Kraus and K. Cripps for collecting tissue sam-
ples from various sites around South Georgia, as well as D.
Briggs, M. Jessop, K. Reid, R. Taylor, T. Walker and N. Warren
for help with tissue sampling and logistical support at Bird
Island. We also thank C. Garza for supplying us with an
updated version of M_P_val, P. Fretwell for generating Fig. 1,
R. Headland for advice on historical sealing records and K.
Dasmahapatra and two anonymous referees for comments that
helped improve the manuscript. This work was funded by a
Natural Environment Research Council Strategic Alliance Fel-
lowship awarded to JIH and a States of Jersey postgraduate
scholarship awarded to SMG. Tissue samples were collected
and retained under permits issued by the Department for Envi-
ronment, Food and Rural Affairs and in accordance with the
Convention on International Trade in Endangered Species of
Wild Fauna and Flora. All field procedures were approved by
the British Antarctic Survey (BAS). This work contributes to
the BAS Dynamics and Management of Ocean Ecosystems
(DYNAMOE) science programme.
References
Aars J, Ims RA, Liu HP et al. (1998) Bank voles in linear
habitats show restricted gene flow as revealed by
mitochondrial DNA (mtDNA). Molecular Ecology, 7, 1383–
1389.
Allen PJ, Amos W, Pomeroy PP, Twiss SD (1995) Microsatellite
variation in grey seals (Halichoerus grypus) shows evidence of
genetic differentiation between two British breeding colonies.
Molecular Ecology, 4, 653–662.
Amos W, Harwood J (1998) Factors affecting levels of genetic
diversity in natural populations. Philosophical Transactions of
the Royal Society of London Series B-Biological Sciences, 353,
177–186.
Anderson EC, Williamson EG, Thompson EA (2000) Monte
carlo evaluation of the likelihood for Ne from temporally
spaced samples. Genetics, 156, 2109–2118.

4006 J . I . HOFFMAN ET AL.
Bandelt H-J, Forster P, Rohl A (1999) Median-joining networks
for inferring intraspecific phylogenies. Molecular Biology and
Evolution, 16, 37–48.
Beaumont MA (2003) Estimation of population growth or
decline in genetically monitored populations. Genetics, 164,
1139–1160.
Beaumont MA, Zhang W, Balding DJ (2002) Approximate
Bayesian Computation in Population Genetics. Genetics, 162,
2025–2035.
Beebee T, Rowe G (2001) Application of genetic bottleneck
testing to the investigation of Amphibian declines: a case
study with Natterjack Toads. Conservation Biology, 15, 266–270.
Bertorelle G, Benazzo A, Mona S (2010) ABC as a flexible
framework to estimate demography over space and time:
some cons, many pros. Molecular Ecology, 19, 2609–2625.
Bonner WN (1964) Population increase in the fur seal
Arctocephalus gazella at South Georgia. In: Carrick R,
Holdgate M, Prevost J (Eds) Biologie Antarctique. 1962,
Hermann, Paris.
Boyd IL (1993) Pup production and distribution of breeding
Antarctic fur seals (Arctocephalus gazella) at South Georgia.
Antarctic Science, 5, 17–24.
Boyd IL, Roberts JP (1993) Tooth growth in male Antarctic fur
seals (Arctocephalus gazella) from South Georgia - an indicator
of long-term growth history. Journal of Zoology (London), 229,
177–190.
Buchanan FC, Maiers LD, Thue TD et al. (1998) Microsatellites
from the Atlantic walrus Odobenus rosmarus rosmarus.
Molecular Ecology, 7, 1083–1085.
Busch JD, Waser PM, DeWoody JA (2007) Recent demographic
bottlenecks are not accompanied by a genetic signature in
banner-tailed kangaroo rats (Dipodomys spectabilis). Molecular
Ecology, 16, 2450–2462.
Caswell H (2001) Matrix Population Models, 2nd edn. Sinauer
Associates, Sunderland, Massachusetts.
Chan YL, Anderson CNK, Hadley EA (2006) Bayesian
estimation of the timing and severity of a population
bottleneck from ancient DNA. PLoS Genetics, 2, e59.
Chevalet C, Nikolic N (2011) The distribution of coalescence
times and distances between microsatellite alleles with
changing effective population size. Theoretical Population
Biology, 77, 152–163.
Clement M, Posada D, Crandall KA (2000) TCS: a computer
program to estimate gene genealogies. Molecular Ecology, 9,
1657–1659.
Coltman DW, Bowen WD, Wright JM (1996) PCR primers for
harbour seal (Phoca vitulina concolour) microsatellites amplify
polymorphic loci in other pinniped species. Molecular
Ecology, 5, 161–163.
Cornuet JM, Luikart G (1996) Description and power analysis
of two tests for detecting recent population bottlenecks from
allele frequency data. Genetics, 144, 2001–2014.
Cornuet JM, Santo F, Beaumont MA et al. (2008) Inferring
population history with DIYABC: a user-friendly approach
to Approximate Bayesian Computations. Bioinformatics, 24,
2713–2719.
Cornuet JM, Ravign V, Estoup A (2010) Inference on
population history and model checking using DNA sequence
and microsatellite data with the software DIYABC (v1.0).
BMC Bioinformatics, 11, 401.
Curtis C, Stewart BS et al. (2009) Pleistocene population
expansions of Antarctic seals. Molecular Ecology, 18, 2112–
2121.
Davis CS, Gelatt TS, Siniff D, Strobeck C (2002) Dinucleotide
microsatellite markers from the Antarctic seals and their use
in other pinnipeds. Molecular Ecology Notes, 2, 203–208.
Di Rienzo A, Peterson AC, Garza JC et al. (1994) Mutational
processes of simple sequence repeat loci in human
populations. Proceedings of the National Academy of Sciences,
USA, 91, 3166–3170.
Dickerson BR, Ream RR, Vignieri SN, Bentzen P (2010)
Population structure as revealed by mtDNA and
microsatellites in Northern fur seals, Callorhinus ursinus,
throughout their range. PLoS ONE, 5, e10671.
Doidge DW, Croxall JP, Baker JR (1984) Density-dependent
pup mortality in the Antarctic fur seal Arctocephalus gazella at
South Georgia. Journal of Zoology (London), 202, 449–460.
Drummond AJ, Rambaut A (2007) BEAST: Bayesian
evolutionary analysis by sampling trees. BMC Evolutionary
Biology, 7, 214.
Drummond AJ, Rambaut A, Shapiro B, Pybus OG (2005)
Bayesian coalescent inference of past population dynamics
from molecular sequences. Molecular Biology and Evolution,
22, 1185–1192.
Ellegren H (2004) Microsatellites: simple sequences with
complex evolution. Nature Reviews Genetics, 5, 435–445.
Estoup A, Jarne P, Cornuet JM (2002) Homoplasy and
mutation model at microsatellite loci and their consequences
for population genetics analysis. Molecular Ecology, 11, 1591–
1604.
Excoffier L, Schneider S (1999) Why hunter-gatherer
populations do not show signs of Pleistocene demographic
expansions. Proceedings of the National Academy of Sciences,
USA, 96, 10597–10602.
Excoffier L, Smouse PE (1994) Using allele frequencies and
geographic subdivision to reconstruct gene trees within a
species: molecular variance parsimony. Genetics, 136, 343–359.
Excoffier L, Estoup A, Cornuet JM (2005) Bayesian analysis of
an admixture model with mutations and arbitrarily linked
markers. Genetics, 169, 1727–1738.
Fagundes NJR, Ray N, Beaumont MA et al. (2007) Statistical
evaluation of alternative models of human evolution.
Proceedings of the National Acadamy of Sciences, USA, 104,
17614–17619.
Fanning E (1833) Voyages and Discoveries in the South Seas 1792–
1832. Marine Research Society, Salem, Massachusetts.
Forcada J, Staniland IJ (2009) Antarctic fur seal Arctocephalus
gazella. In: Perrin WF, Wursig B, Thewissen JGM (Eds)
Encyclopedia of Marine Mammals, 2nd Ed. Academic Press
(Elsevier).
Forcada J, Trathan PN, Murphy EJ (2008) Life history buffering
in Antarctic mammals and birds against changing patterns
of climate and environmental variation. Global Change
Biology, 14, 2473–2488.
Frankham R, Lees K, Montgomery M et al. (1999) Do
population size bottlenecks reduce evolutionary potential?
Animal Conservation, 2, 255–260.
Fu YX (1997) Statistical tests of neutrality of mutations against
population growth, hitchhiking and background selection.
Genetics, 147, 915–925.
� 2011 Blackwell Publishing Ltd
BAYESI AN BOTTLENECK ANALYSIS 4007
Garza JC, Williamson EG (2001) Detection of reduced
population size using data from microsatellite loci. Molecular
Ecology, 10, 305–318.
Gemmell NJ, Allen PJ, Goodman SJ, Reed JZ (1997)
Interspecific microsatellite markers for the study of pinniped
populations. Molecular Ecology, 6, 661–666.
Goldsworthy S, Francis J, Boness D, Fleischer R (2000)
Variation in the mitochondrial control region in the Juan
Fernandez Fur Seal (Arctocephalus philippi). Journal of Heredity,
91, 371–377.
Goudet J (1995) FSTAT (version 1.2): a computer program to
calculate F-statistics. Journal of Heredity, 86, 485–486.
Guinand B, Scribner KT (2003) Evaluation of methodology for
detection of genetic bottlenecks: inferences from temporally
replicated lake trout populations. Comptus Rendus Biologies,
326, S61–S67.
Hall TA (1999) BioEdit: a user-friendly biological sequence
alignment editor and analysis program for windows
95 ⁄ 98 ⁄ NT. Nucleic Acids Symposium Series, 41, 95–98.
Harpending H (1994) Signature of an ancient population
growth in a low-resolution mitochondrial DNA mismatch
distribution. Human Biology, 66, 591–600.
Headland RK (1989) Chronology of Antarctic Expeditions and
Related Historical Events. Cambridge University Press,
Cambridge.
Hedrick PW, Miller PS (1992) Conservation genetics:
techniques and fundamentals. Ecological Applications, 2, 30–
46.
Heyer E, Zietkiewicz E, Rochowski A et al. (2001) Phylogenetic
and familial estimates of mitochondrial substitution rates:
study of control region mutations in deep-rooting pedigrees.
American Journal of Human Genetics, 69, 11113–11126.
Higdon JW, Bininda-Edmonds ORP, Beck RMD, Ferguson SH
(2007) Phylogeny and divergence of the pinnipeds
(Carnivora: Mammalia) assessed using a multigene dataset.
BMC Evolutionary Biology, 7, 216.
Hoelzel AR, LeBoeuf BJ, Reiter J, Campagna C (1999) Alpha-
male paternity in elephant seals. Behavioral Ecology and
Sociobiology, 46, 298–306.
Hoffman JI (2009) A panel of new microsatellite loci for genetic
studies of Antarctic fur seals and other otariids. Conservation
Genetics, 10, 989–992.
Hoffman JI, Amos W (2005) Microsatellite genotyping errors:
detection approaches, common sources and consequences for
paternal exclusion. Molecular Ecology, 14, 599–612.
Hoffman JI, Boyd IL, Amos W (2003) Male reproductive
strategy and the importance of maternal status in the
Antarctic fur seal Arctocephalus gazella. Evolution, 57, 1917–
1930.
Hoffman JI, Trathan PN, Amos W (2006) Genetic tagging
reveals extreme site fidelity in territorial male Antarctic fur
seals Arctocephalus gazella. Molecular Ecology, 15, 3841–3847.
Hoffman JI, Steinfartz S, Wolf JBW (2007) Ten novel
dinucleotide microsatellite loci cloned from the Galapagos
sea lion (Zalophus californianus wollebaeki) are polymorphic in
other pinniped species. Moleular Ecology Notes, 7, 103–105.
Hoffman JI, Dasmahapatra KK, Nichols HJ (2008) Ten novel
polymorphic dinucleotide microsatellite loci cloned from the
Antarctic fur seal Arctocephalus gazella. Molecular Ecology
Resources, 8, 459–461.
� 2011 Blackwell Publishing Ltd
Hoffman JI, Dasmahapatra KK, Amos W et al. (2009)
Contrasting patterns of genetic diversity at three different
genetic markers in a marine mammal metapopulation.
Molecular Ecology, 18, 2961–2978.
Hoffman JI, Forcada J, Amos W (2010) Exploring the
mechanisms underlying a heterozygosity-fitnesss correlation
for canine size in the Antarctic fur seal Arctocephalus gazella.
Journal of Heredity, 101, 539–552.
Johnson JA, Dunn PO, Bouzat JL (2007) Effects of recent
population bottle necks on reconstructing the demographic
history of prairie chickens. Molecular Ecology, 16, 2203–2222.
Keller LF, Jeffery KJ, Arcese P et al. (2001) Immigration and
the ephemerality of a natural population bottleneck:
evidence from molecular markers. Proceedings of the Royal
Society of London Series B-Biological Sciences, 268, 1387–1394.
Kimura M, Ohta T (1978) Stepwise mutation model and
distribution of allelic frequencies in a finite population.
Proceedings of the National Academy of Sciences of the United
States of America, 75, 2868–2872.
Lande R (1994) Risk of population extinction from fixation of
new deleterious mutations. Evolution, 48, 1460–1469.
Larsen CA (1920) Report of the Interdepartmental Committee
on Research and Development in the Dependencies of the
Falkland Islands, p. 657. His Majesty’s Stationary Office,
London.
Luikart G, Cornuet JM (1998) Empirical evaluation of a test for
identifying recently bottlenecked populations from allele
frequency data. Conservation Biology, 12, 228–237.
Luikart G, Allendorf FW, Cornuet JM, Sherwin WB (1998)
Distortion of allele frequency distributions provides a test for
recent population bottlenecks. Journal of Heredity, 89, 238–247.
Luikart G, Cornuet JM, Allendorf FW (1999) Temporal changes
in allele frequencies provide estimates of population
bottleneck size. Conservation Biology, 13, 523–530.
Lynch M, Conery J, Burger R (1995) Mutation accumulation
and the extinction of small populations. American Naturalist,
146, 489–518.
Mill HR (1905) The Siege of the South Pole: The Story of Antarctic
Exploration. Alston Rivers, London.
Mills LS, Smouse PE (1994) Demographic consequences of
inbreeding in remnant populations. American Naturalist, 144,
412–431.
Payne MR (1977) Growth of a fur seal population. Philosophical
Transactions of the Royal Society of London, B, 279, 67–79.
Peter BM, Wegmann D, Excoffier L (2010) Distinguishing
between population bottleneck and population subdivision
by a bayesian model choice procedure. Molecular Ecology, 19,
4648–4660.
Phillips CD, Trujillo RG, Gelatt TS et al. (2009) Assessing
substitution patterns, rates and homoplasy at HVRI of Steller
sea lions, Eumetopias jubatus. Molecular Ecology, 18, 3379–3393.
Piry S, Luikart G, Cornuet J-M (1999) BOTTLENECK: a
computer program for detecting recent reductions in the
effective population size using allele frequency data. Journal
of Heredity, 90, 502–503.
Posada D (2008) jModelTest: Phylogenetic Model Averaging.
Molecular Biology and Evolution, 25, 1253–1256.
Pritchard JK, Stephens M, Donnelly P (2000) Inference of
population structure using multilocus genotype data.
Genetics, 155, 945–959.

4008 J . I . HOFFMAN ET AL.
R Development Team (2005) R: A Language and Environment for
Statistical Computing. R Foundation for Statistical Computing,
Vienna, Austria.
Raymond M, Rousset F (1995) Genepop (Version 1.2) -
population genetics software for exact tests of ecumenicism.
Journal of Heredity, 86, 248–249.
Richards C, Leberg PL (1996) Temporal changes in allele
frequencies and a population’s history of severe bottlenecks.
Conservation Biology, 10, 832–839.
Rogers AR, Harpending H (1992) Population growth makes
waves in the distribution of pairwise genetic differences.
Molecular Biology and Evolution, 9, 552–569.
Rosa de Oliveira L, Meyer D, Hoffman JI, Majluf P, Morgante
JS (2009) Evidence of a genetic bottleneck in an El Nino
affected population of South American fur seals,
Arctocephalus australis. Journal of the Marine Biological
Association of the United Kingdom, 89, 1717–1725.
Schlotterer C, Ritter R, Harr B, Brem G (1998) High mutation
rate of a long microsatellite allele in Drosophila melanogaster
provides evidence for allele-specific mutation rates. Molecular
Biology and Evolution, 15, 1269–1274.
Schneider S, Roessli D, Excoffier L (2000) ARLEQUIN ver 2.000:
a software for population genetics data analysis. Genetics and
Biometry Laboratory, Department of Anthropology and
Ecology, University of Geneva, Geneva, Switzerland.
Slatkin M, Hudson RR (1991) Pairwise comparisons of
mitochondrial DNA sequences in stable and exponentially
growing populations. Genetics, 129, 555–562.
Spear SF, Peterson CR, Matocq MD, Storfer A (2006) Molecular
evidence for historical and recent population size reductions
of tiger salamanders (Ambystoma tigrinum) in Yellowstone
National Park. Conservation Genetics, 7, 605–611.
Spencer CC, Neigel JE, Leberg PL (2000) Experimental
evaluation of the usefulness of microsatellite DNA for
detecting demographic bottlenecks. Molecular Ecology, 9,
1517–1528.
Spong G, Hellborg L (2002) A near-extinction event in lynx: do
microsatellite data tell the tale? Conservation Ecology, 6, 1–8.
Subramanian S, Denver DR, Millar CD et al. (2009) High
mitogenomic evolutionary rates and time dependency.
Trends in Genetics, 25, 482–486.
Tajima F (1989) Statistical method for testing the neutral
mutation hypothesisby DNA polymorphism. Genetics, 123,
585–595.
Templeton AR, Crandall KA, Sing CF (1992) A cladistic
analysis of phenotypic associations with haplotypes inferred
from restriction endonuclease mapping and DNA sequence
data. III. Cladogram estimation. Genetics, 132, 619–633.
Thornton K, Andolfatto P (2006) Approximate Bayesian
Inference reveals evidence for a recent, severe bottleneck in a
Netherlands population of Drosophila melanogaster. Genetics,
172, 1607–1619.
Waldick RC, Kraus S, Brown M, White BN (2002) Evaluating
the effects of historic bottleneck events: an assessment of
microsatellite variability in the endangered, North Atlantic
right whale. Molecular Ecology, 11, 2241–2249.
Waples RS (1989) A generalised approach for estimating
effective population size from temporal changes in allele
frequency. Genetics, 121, 379–391.
Weber JL, Wong C (1993) Mutation of human short tandem
repeats. Human Molecular Genetics, 2, 1123–1128.
Weber DS, Stewart BS et al. (2004) Genetic consequences of a
severe population bottleneck in the Guadalupe fur seal
(Arctocephalus townsendi). Journal of Heredity, 95, 144–153.
Weddell J (1825) A voyage Towards the South Pole Performed in
the Years 1822–1824. Longman, Hurst, Rees, Orme, Brown
and Green, London.
Williamson EG, Slatkin M (1999) Using maximum likelihood to
estimate population size from temporal changes in allele
frequencies. Genetics, 152, 755–761.
Williamson-Natesan EG (2005) Comparison of methods for
detecting bottlenecks from mirosatellite loci. Conservation
Genetics, 6, 551–562.
Wilson AC, Cann RL, Carr SM et al. (1985) Mitochondrial
DNA and two perspectives on evolutionary genetics.
Biological Journal of the Linnean Sociey, 26, 375–400.
Wynen LP, Goldsworthy SD, Guinet C et al. (2000) Postsealing
genetic variation and population structure of two species of
fur seal (Arctocephalus gazella and A. tropicalis). Molecular
Ecology, 9, 299–314.
Data accessibility
DNA sequences: Genbank accessions JF304904-JF304914.
Sample locations and microsatellite data: DRYAD entry doi:
10.5061/dryad.0kj5n.
Supporting information
Additional supporting information may be found in the online
version of this article.
Fig. S1 Map of South Georgia showing the locations from
which 246 individual Antarctic fur seals were tissue-sampled.
Fig. S2 Results of the Structure (Pritchard et al. 2000) analysis,
showing mean ± SE ln P(D) values based on five replicates for
each value of K, the hypothesised number of groups in the
data.
Fig. S3 A median joining network illustrating phylogenetic
relationships among 39 mitochondrial HVR1 haplotypes
observed in 371 Antarctic fur seals.
Table S1 Summary of sealing voyages to South Georgia
including the names of ships and catches taken where known,
together with literature sources
Table S2 Summary of post-bottleneck population sizes for the
Antarctic fur seal population at South Georgia
Table S3 Polymorphism characteristics of 21 microsatellite loci
in 142 Antarctic fur seals from the study colony at Bird Island,
South Georgia
Please note: Wiley-Blackwell are not responsible for the content
or functionality of any supporting information supplied by the
authors. Any queries (other than missing material) should be
directed to the corresponding author for the article.
� 2011 Blackwell Publishing Ltd