Bay of Plenty Coastal Water Quality, · Bay of Plenty Coastal Water Quality, 2003 - 2004 Prepared...
106
Working with our communities for a better environment Bay of Plenty Coastal Water Quality, 2003 - 2004 Prepared by Stephen Park, Senior Environmental Scientist Environment Bay of Plenty Environmental Publication 2005/13 June 2005 5 Quay Street P O Box 364 Whakatane NEW ZEALAND ISSN 1175 - 9372
Transcript of Bay of Plenty Coastal Water Quality, · Bay of Plenty Coastal Water Quality, 2003 - 2004 Prepared...
Working with our communities for a better environment
Bay of Plenty Coastal Water Quality, 2003 - 2004
Prepared by Stephen Park, Senior Environmental Scientist
Environment Bay of Plenty Environmental Publication 2005/13 June 2005 5 Quay Street P O Box 364 Whakatane NEW ZEALAND ISSN 1175 - 9372
Environment Bay of Plenty
Environmental Publication 2005/13 Bay of Plenty Coastal Water Quality, 2003 - 2004
Acknowledgements
The invaluable assistance of ASR Ltd in conducting f ield w ork and preparation of some of the graphics for this report is acknow ledged. Staff from ASR Ltd involved in f ield w ork included Brett Beamsley, Andrew Moores, Peter Longdill, Mathew Hays, Julien Lefeuvre, Ben Courtadon and Ben Francois. Brian Spake (Harbour Master) is gratefully acknow ledged for making his vessel available for survey work as required. The Ministry of Economic Development is also gratefully acknow ledged for their support, having made a f inancial contribution to the AMA project.
Cover Photo: Looking out to Karew a and Tuhuna (Mayor) Islands from Matakana Island beach. Photo by Sam Stephens.


Environment Bay of Plenty i
Environmental Publication 2005/13 Bay of Plenty Coastal Water Quality, 2003 - 2004
Executive Summary
A study of the central Bay of Plenty’s coastal shelf w aters w as undertaken to collect data for the support of modelling and estimating the sustainability and carrying capacity of aquaculture. The study included physical and chemical analysis of the w aters, quantif ication of phytoplankton communities, current measurements and temperature profiling of the w ater column and the use of remote sensing to provide a synopsis of seasonal and spatial patterns of sea surface temperature and chlorophyll-a concentrations. In this report the data gained from physical, chemical and phytoplankton analysis of the w ater column is presented.
Field w ork to collect physical, chemical and phytoplankton data w as conducted along three transects spanning the coastal shelf out to a depth of 200m at Pukehina, Whakatane and Opotiki. Sampling w as also conducted from October 2003 through to May 2004. An additional instrument (CTD) survey w as conducted in December 2004 across a w ider area of the Bay of Plenty, out tow ards the east.
Results are similar to the earlier f indings of the coastal shelf survey undertaken in 1996/97 in respect of the major seasonal and depth related trends observed in the w ater column. In this survey the use of a w ider range of monitoring equipment to measure many of the parameters means that there is a far better resolution and understanding of the oceanographic processes operating in these w aters. The CTD and current measurements show that the shelf waters are a complex system w ith w ide variations around the Bay of Plenty at any one point in time.


Environment Bay of Plenty
Environmental Publication 2005/13 Bay of Plenty Coastal Water Quality, 2003 - 2004
Contents
Acknowledgements.......................................................................................................1
Executive Summary........................................................................................................ i
Chapter 1: Introduction ..............................................................................................1
1.1 Scope.............................................................................................................................1
1.2 AMA Project background ............................................................................................2
Chapter 2: Methods ......................................................................................................5
2.1 Location and Physical Environment ........................................................................5
2.2 Sampling Programme................................................................................................6
2.3 Methods.........................................................................................................................7
Chapter 3: Results .........................................................................................................9
3.1 Physical Attributes .......................................................................................................9
3.2 Nutrients......................................................................................................................25
3.3 Biological ....................................................................................................................26
Chapter 4: Summary....................................................................................................33
Chapter 5: References..............................................................................................35
Appendices.......................................................................................................................37
Appendix 1 – Site Location and Sampling Program.......................................................39
Appendix 2 – BOP Offshore Transect Survey Results....................................................41
Appendix 3 – CTD Profiles From Transect Surveys........................................................47

Environment Bay of Plenty
Bay of Plenty Coastal Water Quality, 2003 – 2004 Environmental Publication 2005/13
List of Tables
Table 1 Methods used for chemical / biological analysis. .....................................................7
Table 2 Gridding methods used in the plotting of data. .........................................................8
Table 3 Phytoplankton species list and the seasonal abundance rank obtained from the three transects sampled in Bay of Plenty coastal w aters .....................................28
Table 4 Overall percentage of diatoms cells in the total number of phytoplankton cells counted from spot samples on each transect........................................................29
Table 5 Total numbers of phytoplankton cells counted in spot samples from the Pukehina transect. .................................................................................................................29
Table 6 Total numbers of phytoplankton cells counted in spot samples from the Whakatane transect. .................................................................................................................30
Table 7 Total numbers of phytoplankton cells counted in spot samples from the Opotiki transect. .................................................................................................................30
List of Figures
Figure 1 Location of transect sampling sites and the w ave buoy in the Bay of Plenty coastal shelf w aters ................................................................................................5
Figure 2 Secchi depth and vertical light extinction coeff icients recorded along each of the transects from October 2003 to May 2004. ...........................................................10
Figure 3 Temperature (oC) plots from Opotiki, Whakatane and Pukehina transects on the BOP continental shelf. ............................................................................................13
Figure 4 Salinity (psu) plots from Opotiki, Whakatane and Pukehina transects on the BOP continental shelf. ....................................................................................................15
Figure 5 Density (σt) plots from Opotiki, Whakatane and Pukehina transects on the BOP continental shelf. ....................................................................................................16
Figure 6 Dissolved Oxygen (%) plots from Opotiki, Whakatane and Pukehina transects on the BOP continental shelf. ......................................................................................17
Figure 7 Turbidity (NTU) plots from Opotiki, Whakatane and Pukehina transects on the BOP continental shelf. ....................................................................................................19
Figure 8 Suspended solids (g/m3) plots from Opotiki, Whakatane and Pukehina transects n the BOP continental shelf. ......................................................................................20
Figure 9 Photosynthetically Active Radiation plots from Opotiki, Whakatane and Pukehina transects on the BOP continental shelf. .................................................................21
Figure 10 Chlorophyll-a plots (as f luorescence measurements) from Opotiki, Whakatane and Pukehina transects on the BOP continental shelf...................................................22
Environment Bay of Plenty
Environmental Publication 2005/13 Bay of Plenty Coastal Water Quality, 2003 - 2004
Figure 11 Concentration of oxidised nitrogen from Opotiki, Whakatane and Pukehina transects on the BOP continental shelf.................................................................. 23
Figure 12 Concentration of dissolved reactive phosphorus from Opotiki, Whakatane and Pukehina transects on the BOP continental shelf. ................................................. 24
Figure 13 Relationship betw een Dissolved Reactive Silica and conductivity. ....................... 25
Figure 14 Relationship betw een instrument f luorescence values and Chl-a (mg/m3). .......... 27


1
Environmental Publication 2005/13 Bay of Plenty Coastal Water Quality, 2003 - 2004
Chapter 1: Introduction
1.1 Scope
This report presents the results of f ield survey w ork jointly conducted by Environment Bay of Plenty and ASR Limited staff along a set of transects spanning the Bay of Plenty coastal shelf w aters. The w ork w as part of the Aquaculture Management Areas (AMA) science project, collecting physical and biological data (Oct 2003 – December 2004) to support assessment of the productivity and sustainability of coastal shelf w aters within the Bay of Plenty. The specif ic objectives of the projects f ield surveys w ere to;
• Provide quantitative data on the spatial and seasonal abundance of phytoplankton species.
• Assess spatial and seasonal patterns of nutrients required for phytoplankton grow th.
• Assess spatial and seasonal patterns of physical parameters.
• Measurement of current direction and velocity.
• Improve our understanding of the oceanographic processes and ensure data collection that w ill support modelling of the shelf system.
The magnitude of the effort and the success w ith the f ield measurements is a credit to all staff involved.
Some aspects of the f ield surveys or other components of the overall project, such as the current and w ave data w ill be reported separately. Other reports being produced by ASR Ltd (Longdill et.al 2005a & b, Beamsley et.al 2005, Mead et.al 2005)on the field data summarise:
• Measurements of currents and temperatures. 12 months of intermittent Acoustic Doppler Current Meter and thermistor records w ere collected during the 2-year programme.
• Observations w ith seabed video over the shelf w ith grain size, mud contents and biological organism assessments.

2 Environment Bay of Plenty
Bay of Plenty Coastal Water Quality, 2003 – 2004 Environmental Publication 2005/13
1.2 AMA Project Background
Aquaculture as an industry in New Zealand has been grow ing rapidly in recent years and has become a substantial producer and export earner. The industry is still largely dominated by green lipped mussel and salmon farming but has the potential to produce a very w ide range of product. In some areas such as the Marlborough Sounds suitable farming space has become limited and is considered a valuable asset. In the Bay of Plenty only around 4 ha of aquaculture existed up until May 2001 at w hich time it then received tw o large applications for a total of 8,760 ha.
In March 2002 the government imposed a moratorium on the granting of marine space for the purposes of aquaculture due to the explosion of demand and the complicated and sometimes adhoc approach to the processing of consents. The moratorium w as “to provide Regional Councils w ith the opportunity to plan for Aquaculture Management Areas”. It w as also intended to remove much of the dual process that currently exists to make it more straight forw ard and easier for industry to establish.
The moratorium has now meant that Regional Councils must w ork out w here to allow aquaculture to take place and how much. Environment Bay of Plenty is dealing with this task under both a science and planning project. The planning project is defining areas that w ill be most suitable. The approach taken is to define and map the various values of the marine environment that may potentially clash w ith aquaculture. This includes ecological, cultural, recreational f ishing, commercial f ishing, recreational activities, navigation, landscape and w ater quality values and issues.
Aquaculture can put considerable pressure on some components of the marine environment. Mussel farming for instance can cause phytoplankton depletion, change plankton species composition, result in nutrient changes, deposition of shell and faeces, impacts on w ater quality and a range of other actual or potential impacts. One of the most important questions is that of sustainability from a productivity view point. For example how much mussel farming could the Bay of Plenty coastal shelf waters support w ithout such farms depleting phytoplankton levels to an extent that other inshore shellf ish beds may be impacted, inhibiting their ability to grow at normal rates and sustainable levels.
The aquaculture industry grow th and moratorium has imposed an urgent need to obtain a sound understanding of the oceanographic processes, productivity and carrying capacity of the Bay of Plenty coastal w aters. The science project being run as part of the w hole AMA project is intended to address many of the issues and know ledge gaps mentioned above. It w as started in July 2003 and w ill be concluded at the end of 2005 w ith a f inal report in March 2006.
The science project in its f irst year (2003/4) aimed to set up a w ave buoy, current meter and gather data from field surveys on the physical and biological status of the coastal w aters during each season of the year. In addition remote sensing data is being used to assist in defining the seasonal and spatial status of Bay of Plenty w aters for sea surface temperature and chlorophyll-a levels. Further w ork on defining the nature of the seabed and benthic communities w ill also be undertaken.
A large component of the science project w ill be the development of hydrological and productivity models of the Bay of Plenty. Plankton, nutrient, physical and remote sensing

Environment Bay of Plenty 3
Environmental Publication 2005/13 Bay of Plenty Coastal Water Quality, 2003 - 2004
data w ill all help in developing and calibrating numerical models aimed at estimating impacts, carrying capacity and sustainability of marine farming. Overall the project is primarily aimed at providing information needed to assist Environment Bay of Plenty’s planning responsibilities in a w ay w hich w ill also help to safeguard the regions natural marine resources and ecosystems.


5
Environmental Publication 2005/13 Bay of Plenty Coastal Water Quality, 2003 - 2004
Chapter 2: Methods
2.1 Location and Physical Environment
Field sampling for the AMA science project builds upon a previous survey of the coastal shelf w aters undertaken in 1996/97 (Park 1998). In Figure 1 below the three transects in the centre of the bay (Pukehina, Whakatane & Opotiki) running from shore (10m depth) out to the edge of the continental shelf (200m depth) w ere used for the 2003/2004 field surveys. The Tauranga and Whakatane transects w ere both used in the 1996/97 survey. Grid references for the sampling points along each of these transects are provided in Appendix 1.
Figure 1 Location of transect sampling sites and the wave buoy in the Bay of Plenty coastal shelf waters
The Bay of Plenty coastline is exposed to w ind and w aves from the northw est to easterly directions and is a lee shore in respect of New Zealand’s prevailing south-w esterly w ind f low s. Offshore w aters are predominantly influenced by the East Auckland Current, w hich f low s south-eastw ard along the north-east coast of the North

6 Environment Bay of Plenty
Bay of Plenty Coastal Water Quality, 2003 - 2004 Environmental Publication 2005/13
Island to East Cape w here the main core of the current turns north-eastw ard (Ridgway and Greig 1986). Influence of the current is thought to be variable w ith limited penetration inshore.
Inshore currents are highly variable responding to both tidal effects and w ind forcing (Healy et al 1988, Harms 1989). During periods of high w ind strengths, currents w ere observed to f low in the direction of the w ind w ith velocities of up to 40 cm sec-1. In addition, periods of onshore bottom current occurred w ith offshore w ind and the reverse w ith onshore w inds. Residual current f low s during periods of w eak and variable w inds appear to be to the south, possibly as an inshore influence of the East Auckland Current. Similar residual currents have been observed from a long-term current observation on the east Coromandel shelf (Bradshaw et al 1991). Initial results collected from this project w ould also support this synopsis.
The inshore end of the Tauranga transect is influenced by tidal currents and f lushing associated w ith the southern entrance of Tauranga Harbour. A similar situation exists w ith the Whakatane transect and estuary.
The southern entrance to Tauranga Harbour has a recorded f low of 153 x106 m 3 w ith maximum current speeds of 2.65 m.s-1 (Beca Carter Hollings and Ferner Ltd 1978). Freshw ater inflow s to the southern harbour have been estimated to be around 30.5 m3s-
1 (<1% of tidal compartment) w ith the Wairoa River contributing 58% of the total (McIntosh 1994). The catchment of the northern Tauranga Harbour basin is much smaller w ith total freshw ater inflow of around 4.6 m3s-1.
In contrast to the Tauranga situation Whakatane Estuary is much smaller w ith a high riverine influence. The Whakatane River, w hich f low s into the estuary, has a mean flow of 57 m3s-1. Peak ebb-tide f low s from the estuary have been gauged at 140 m3s-1 during river f low s of 18 m3s-1 (Healy 1983). Catchment soils are still inf luenced by volcanic ash but most soils are derived from w eathering of the underlying greyw acke rocks.
Offshore of Opotiki the situation is similar to that of Whakatane, especially regarding the catchment geology. Opotiki Estuary is even smaller measuring only 0.6 km2. The freshw ater inflow from the Waioeka and Otara Rivers combined is also slightly less with a mean annual f low of 44m3 s-1. Both these rivers f low through Opotiki Estuary.
At the Pukehina transect there is not a lot of freshw ater influence even at the inshore 10m depth site. The Waitahanui Stream is around 1 km aw ay and has a mean annual f low of 6 m3 s-1. The Kaituna River is 15 km to the northw est and has a mean annual f low of 39 m3 s-1, but due to the distance it has only a very diffuse effect on salinity.
2.2 Sampling Programme
Field sampling w as conducted at sites along each of the Pukehina, Whakatane and Opotiki transects show n in Figure 1. Surveys w ere conducted four times w ithin a year to obtain data on seasonal variations in w ater quality and plankton assemblages. Each transect has sampling sites set at the 10, 20, 30, 50, 100 and 200m depth contours. This takes each transect from w ithin a kilometre of the shore out to the edge of the continental shelf. This ensured that neritic coastal w aters w ere fully covered and allow s comparison to oceanic w ater masses.

Environment Bay of Plenty 7
Environmental Publication 2005/13 Bay of Plenty Coastal Water Quality, 2003 - 2004
Samples w ere obtained on all transects w ithin a day of the follow ing dates:
17th October, 2003, 3rd December 2003, 18th March 2004, 25th May 2004, 1st August 2004.
An additional set of transect w ere surveyed w ith CTD instruments on 7-9th December 2004.
At each of the sampling sites instrument readings, w ater samples, bacterial samples, and plankton samples w ere taken at specif ied depths. Appendix 1 sets out the sampling programme in detail listing depths and all chemical, physical, and biological sampling conducted.
The surface sample (0-5m) for all chemistry and plankton samples taken from each sampling location w as obtained as a depth integrated tube sample. All other samples from each of the specif ied depths w ere point samples taken w ith a 3 litre van Dorn bottle.
Instruments readings at each site w ere taken w ith a SBE 19plus SEACAT Profiler from the surface dow n to the seabed. This probe recorded temperature, conductivity, pressure (depth), Oxygen (SBE 43), PAR (LI-COR LI-193SA), f luorometer (Turner SCUFA), and OBS (turbidity – Turner SCUFA). In addition temperature and conductivity w ere recorded from the w ater samples retrieved w ith the van Dorn bottles for sample analysis using a hand held YSI meter.
2.3 Methods
The follow ing methods w ere used to derive the results from the f ield sampling. All samples for chemical analysis w ere stored and returned w ith the time period stipulated according to the method requirements;
Table 1 - Methods used for chemical / biological analysis.
Parameter Method Detection Limit†
Suspended Solids APHA method 2540D 0.1 g/m3
Total Organic Carbon cataly tic oxidation, IR detection. APHA 5310B 20th ed. 1998
0.5 g/m3
Dissolved Organic Carbon
0.45 µm ny lon f ilter, cataly tic oxidation, IR detection APHA 5310B
0.5 g/m3
Dissolved Reactive Silica
On-site f iltration of sample. Moly bdosilicate/ascorbic acid reduction
1 mg/m3
Dissolved iron On-site f iltration of sample. 0.45 µm f iltered sample. ICP MS ultra-trace with dy namic reaction cell APHA
4 mg/m3
Total nitrogen persulphate digestion, auto cadmium reduction, f low injection analy ser
1 mg/m3
Ammonium nitrogen NWASCO Misc Pub. No. 38, 1982. phenolhy pochlorite colorimetry
1 mg/m3
Oxidised nitrogen f low injection analy ser, APHA 4500 NO3-1 1 mg/m3
Total Phosphorus acid persulphate digestion, moly bdate colorimetry . Flow injection analy ser APHA 4500-PH
4 mg/m3
Dissolved Reactive Phosphorus
NWASCO Misc Pub. No. 38, 1982. Antimony – phosphate – moly bdate
4 mg/m3
Dissolved non-bl i
0.5 g/m3
8 Environment Bay of Plenty
Bay of Plenty Coastal Water Quality, 2003 - 2004 Environmental Publication 2005/13
Non-purgable organic carbon
acid pre-treatment to remov e inorganic carbon. Elementar combustion analy ser
0.5 g/m3
Secchi disc measured in metres (to 0.1m increments) without a v iewing tube
Vlec v ertical light extinction coef f icient deriv ed f rom PAR measurements (LI-COR LI-193SA) f or the surf ace photic zone of the water column using log plot of data
Enterococci APHA method 9230c - number cf u/100ml
pH pH measurement @ 25oC
Chlorophyll-a total filterable
total phy toplankton f ilterable on 0.7µm and abov e, GFC f iltration, acetone pigment extraction, spectrof luorometric measurement
0.1 mg/m3
Nano-chl-a as f or total Chlorophy ll-a but only f or plankton 0.7-20µm 0.1 mg/m3
Micro-chl-a as f or total Chlorophy ll-a but only f or plankton 20-200 µm
0.1 mg/m3
Phytoplankton
Phy toplankton samples were collected f rom set depths using a v an Dorn bottle with the exception of the surface (0-5m) sample which was obtained f rom a depth integrated tube sample. Around 250 ml of sample was preserv ed with Lugol’s Iodine. These samples were then sent to NIWA in Wellington f or analy sis by either Hoe
†Detection limit with 95% conf idence, some results are below this lev el
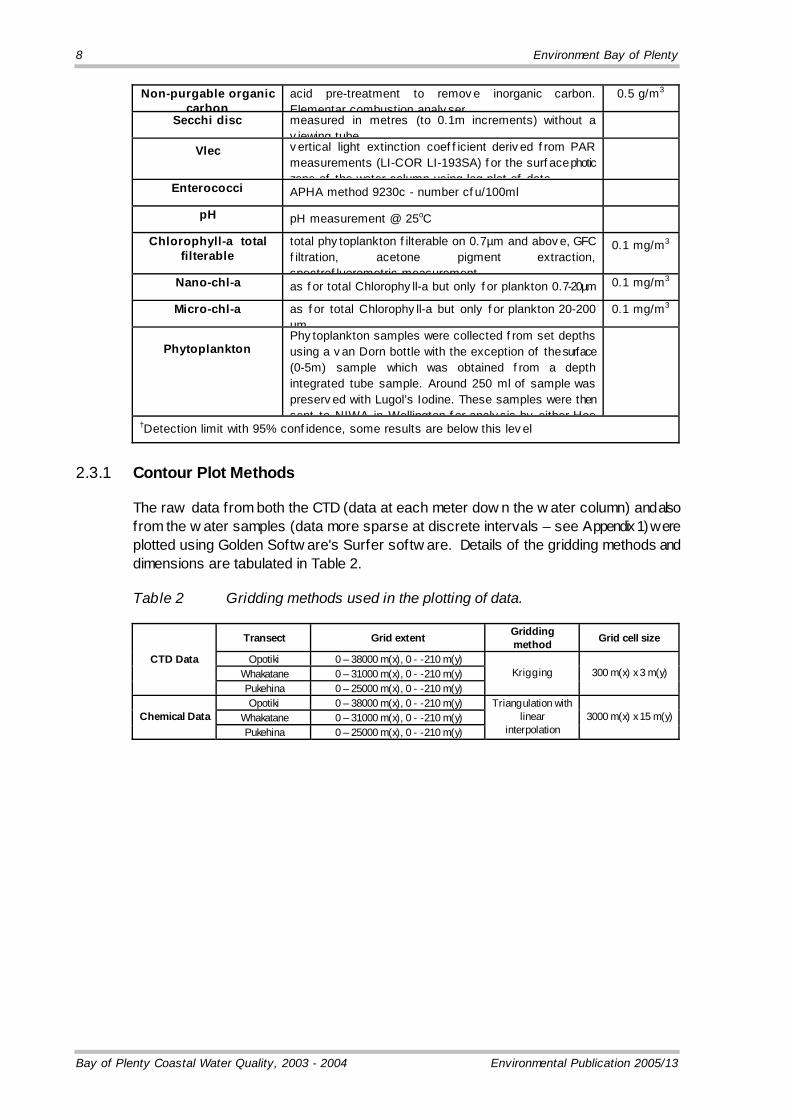
2.3.1 Contour Plot Methods
The raw data from both the CTD (data at each meter dow n the w ater column) and also from the w ater samples (data more sparse at discrete intervals – see Appendix 1) were plotted using Golden Softw are's Surfer softw are. Details of the gridding methods and dimensions are tabulated in Table 2.
Table 2 Gridding methods used in the plotting of data.
Transect Grid extent Gridding method Grid cell size
Opotiki 0 – 38000 m(x), 0 - -210 m(y) Whakatane 0 – 31000 m(x), 0 - -210 m(y)
CTD Data
Pukehina 0 – 25000 m(x), 0 - -210 m(y) Krigging 300 m(x) x 3 m(y)
Opotiki 0 – 38000 m(x), 0 - -210 m(y) Whakatane 0 – 31000 m(x), 0 - -210 m(y) Chemical Data Pukehina 0 – 25000 m(x), 0 - -210 m(y)
Triangulation with linear
interpolation 3000 m(x) x 15 m(y)

9
Environmental Publication 2005/13 Bay of Plenty Coastal Water Quality, 2003 - 2004
Chapter 3: Results
3.1 Physical Attributes
3.1.1 Water Clarity
Results for measurements of Secchi depth and vertical light extinction co-efficient (Vlec) are displayed in Figure 2. All the transects, w hich ran out from Pukehina, Whakatane and Opotiki, show ed a number of consistent trends as expected. All have a signif icant improvement in w ater clarity out to the edge of the continental shelf. Inshore (10 m depth contour) Secchi depth measurements ranged from 1 – 7 m w hile offshore values show ed a larger degree of variation. At the 200 m contour visibility reached a maximum of about 30 m in the autumn (March) sampling period.
Overlaid on the inshore offshore trend is the seasonal component. This w as most easily seen further offshore at the 200 m contour w here there w ere measurements of only 6-7 m in spring and early summer compared to the autumn maximum of 30 m.
The overall timing and magnitude of the inshore–offshore and seasonal variations are similar to the previous survey that w as conducted in 1996/97(Park 1998).
3.1.2 Salinity/conductivity
Salinity profiles for the Pukehina, Whakatane and Opotiki transects are presented in Figures 4 and 5. In addition the profile of the w ater column at each sampling point along the transects is given in Appendix III.
The predominant feature seen in all plots is the seasonal influence of freshw ater input into the Bay of Plenty from land. In the profile plots in Appendix III, there are many examples w here salinity changes markedly w ith depth in association w ith the different layers of w ater. Many of these distinct w ater layers show reversal of current direction (Beamsley et.al 2005). The seasonal pattern is very similar to the f indings of a similar survey undertaken in 1996/97 (Park 1998).

10 Environment Bay of Plenty
Bay of Plenty Coastal Water Quality, 2003 – 2004 Environmental Publication 2005/13
10 20 30 50 100 200Depth contour (m)
May 04Mar 04Dec 03Oct 03
Date
0.0
0.1
0.2
0.3
0.4
Vlec
0
10
20
30
Secc
hi d
epth
(m)
0.0
0.1
0.2
0.3
0.4
Vlec
0
10
20
30
Secc
hi d
epth
(m)
0.0
0.1
0.2
0.3
0.4
Vlec
10 20 30 50 100 200Depth contour (m)
0
10
20
30
Secc
hi d
epth
(m)
May 04Mar 04Dec 03Oct 03
Date
Pukehina
Whakatane
Opotiki
Pukehina
Whakatane
Opotiki
Figure 2 Secchi depth and vertical light extinction coefficients recorded along each of the transects from October 2003 to May 2004.
3.1.3 Temperature
Temperature profiles for the Pukehina, Whakatane and Opotiki transects are presented in Figures 3 providing a visual perspective across the shelf w aters of each transect. All transects show the strong development of a seasonal thermo cline in w hich stratif ied surface w aters are much w armer than the deep w ater. In summer w ater temperatures

Environment Bay of Plenty 11
Environmental Publication 2005/13 Bay of Plenty Coastal Water Quality, 2003 - 2004
are typically 20 –22 oC at the surface w ith a thermo cline extending from 20 – 50 m depth w ith at least 2 degrees of temperature variation w ith the underlying w ater. The thermo cline tends to increase in depth further out from shore.
Winter w ater temperatures drop to around 12 –13 oC. In the May 2004 survey of the transects, the surface w aters w ere cooling w ith the deeper w ater being slightly w armer. At the edge of the shelf (200m contour) the deep oceanic w ater could usually be detected and measured around 12.5 at this depth regardless of season.
As show n by the CTD profile plots in Appendix III, temperature can change quite sharply in association w ith more distinct layers of w ater. As mentioned above for salinity, some of these w ater layers are also moving in different directions.
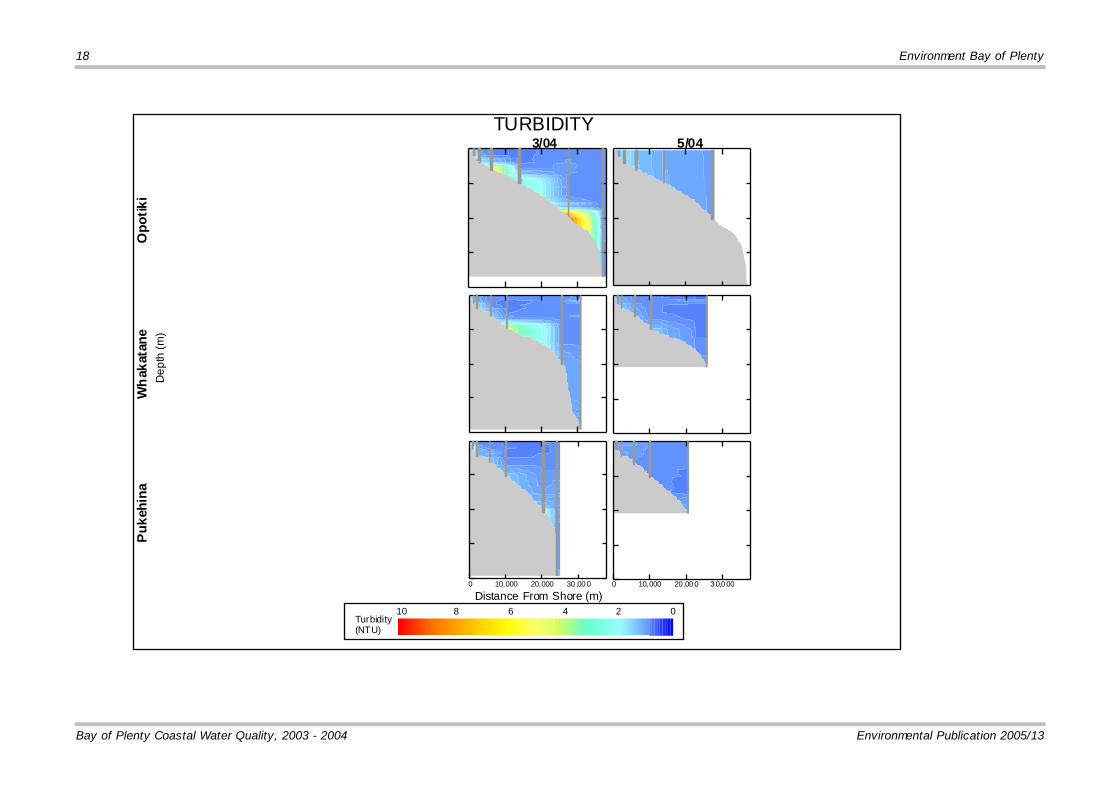
3.1.4 Suspended Solids and turbidity
Figures 7 and 8 present turbidity and suspended solids data. Density of sample points for suspended solids is not high so some of the results appear a little bit variable. Some of the trends noted in previous surveys (Park 1998) are apparent. That is for higher levels of suspended solids to occur both inshore and seasonally in w inter and spring.
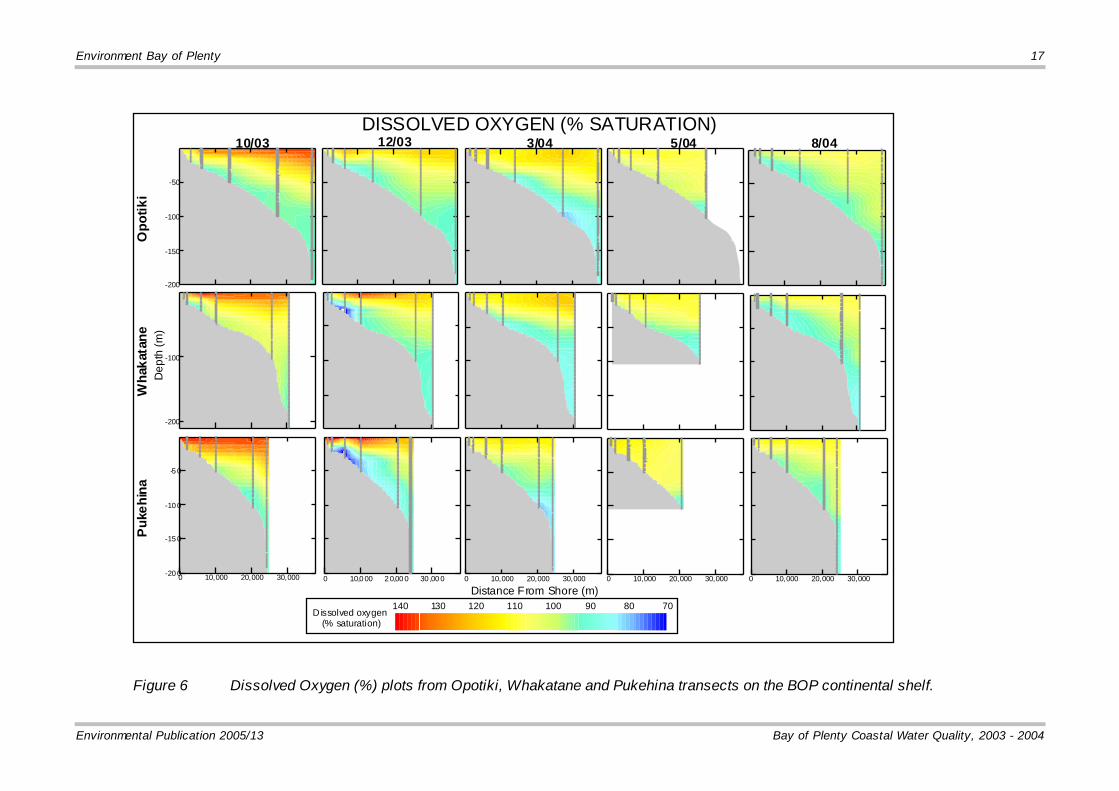
3.1.5 Dissolved oxygen
Dissolved oxygen profiles (% saturation) for the Pukehina, Whakatane and Opotiki transects are presented in Figure 6 providing a visual perspective across the shelf w aters of each transect. A more detailed depth profile relationship betw een dissolved oxygen and the physical properties of the shelf w aters is provided by the graphics in Appendix III.
The general pattern show n by dissolved oxygen is for a seasonal peak to occur in the surface w aters in spring and early summer. High concentrations of dissolved oxygen clearly relate to the amount of phytoplankton present. There is also some association of dissolved oxygen levels and the physically separate w ater bodies w hich are often present. Figure 6 also show s clearly a high demand for oxygen associated w ith the seafloor, particularly in the mid-shelf region.


Environment Bay of Plenty 13
Environmental Publication 2005/13 Bay of Plenty Coastal Water Quality, 2003 - 2004
-200
-150
-100
-50
-200
-150
-100
-50
0 10,000 20,000 30,000-200
-150
-100
-50
0 10,000 20,000 30,000 0 10,000 20,000 30,000 0 10,000 20,000 30,000 0 10,000 20,000 30,000
TEMPERATURE
Distance From Shore (m)
Dept
h (m
)10/03 12/03 3/04 5/04 8/04
Opo
tiki
Wha
kata
nePu
kehi
na
Temperature (oC)
121314151617181920
Figure 3 Temperature (oC) plots from Opotiki, Whakatane and Pukehina transects on the BOP continental shelf.

14 Environment Bay of Plenty
Bay of Plenty Coastal Water Quality, 2003 - 2004 Environmental Publication 2005/13

Environment Bay of Plenty 15
Environmental Publication 2005/13 Bay of Plenty Coastal Water Quality, 2003 - 2004
-200
-150
-100
-50
32.53333.53434.53535.536
0 10,000 20,000 30,000-200
-150
-100
-50
0 10,000 20,000 30,000 0 10,000 20,000 30,000
-200
-150
-100
-50
0 10,000 20,000 30,000 0 10,000 20,000 30,000
SALINITY
Distance From Shore (m)
Dep
th (m
)
10/03 12/03 3/04 5/04 8/04O
potik
iW
haka
tane
Puke
hina
Salinity (psu)
Figure 4 Salinity (psu) plots from Opotiki, Whakatane and Pukehina transects on the BOP continental shelf.

16 Environment Bay of Plenty
Bay of Plenty Coastal Water Quality, 2003 - 2004 Environmental Publication 2005/13
-200
-150
-100
-50
-200
-150
-100
-50
0 10,000 20,000 30,000-20 0
-15 0
-10 0
-5 0
0 10,0 00 2 0,00 0 30 ,00 0 0 10,000 20,000 30,000 0 10,000 20,000 30,000 0 10,000 20,000 30,000
DENSITY
Distance From Shore (m)
Dep
th (m
)10/03 12/03 3/04 5/04 8/04
Opo
tiki
Wha
kata
neP
ukeh
ina
Density (Sigma-t, kgm-3)
24.124.424.72525.325.625.926.226.5
Figure 5 Density (σt) plots from Opotiki, Whakatane and Pukehina transects on the BOP continental shelf.
Environment Bay of Plenty 17
Environmental Publication 2005/13 Bay of Plenty Coastal Water Quality, 2003 - 2004
-200
-150
-100
-50
-200
-100
0 10,000 20,000 30,000-20 0
-15 0
-10 0
-5 0
0 10,0 00 2 0,00 0 30 ,00 0 0 10,000 20,000 30,000 0 10,000 20,000 30,000 0 10,000 20,000 30,000
DISSOLVED OXYGEN (% SATURATION)
Distance From Shore (m)
Dep
th (m
)10/03 12/03 3/04 5/04 8/04
Opo
tiki
Wha
kata
neP
ukeh
ina
Dissolved oxygen (% saturation)
708090100110120130140
Figure 6 Dissolved Oxygen (%) plots from Opotiki, Whakatane and Pukehina transects on the BOP continental shelf.
18 Environment Bay of Plenty
Bay of Plenty Coastal Water Quality, 2003 - 2004 Environmental Publication 2005/13
0 10,000 20,000 30 ,00 0 0 10,000 20 ,00 0 3 0,0 00
TURBIDITY
Distance From Shore (m)
Dep
th (m
)3/04 5/04
Opo
tiki
Wh
akat
ane
Puk
ehin
a
Turbidity(NTU)
0246810
Environment Bay of Plenty 19
Environmental Publication 2005/13 Bay of Plenty Coastal Water Quality, 2003 - 2004
Figure 7 Turbidity (NTU) plots from Opotiki, Whakatane and Pukehina transects on the BOP continental shelf.

20 Environment Bay of Plenty
Bay of Plenty Coastal Water Quality, 2003 - 2004 Environmental Publication 2005/13
0 10,000 20,000 30,0000 10,000 20,000 30,0000 10,000 20,000 30,0000 10,000 20,000 30,000-200
-150
-100
-50
0-200
-150
-100
-50
0-200
-150
-100
-50
0
SUSPENDED SOLIDS
Distance From Shore (m)
Dep
th (m
)10/03 12/03 3/04 5/04
Opo
tiki
Wh
akat
ane
Puk
ehin
a
Suspended Solids(g/m3)
02.557.51012.51517.52022.52527.530
Figure 8 Suspended solids (g/m3) plots from Opotiki, Whakatane and Pukehina transects n the BOP continental shelf.

Environment Bay of Plenty 21
Environmental Publication 2005/13 Bay of Plenty Coastal Water Quality, 2003 - 2004
-200
-150
-100
-50
-200
-150
-100
-50
0 10,000 20,000 30,0 00-2 00
-1 50
-1 00
-50
0 10 ,000 20,000 30,000 0 1 0,00 0 20,000 30,000 0 10,000 20,000 30,0 00 0 10,000 20,000 30,0 00
PHOTOSYNTHETICALLY ACTIVE RADIATION
Distance From Shore (m)
Dep
th (
m)
10/03 12/03 3/04 5/04 8/04O
potik
iW
haka
tane
Puke
hina
PAR(Biospherical/Licor)
0200400600800100012001400
Figure 9 Photosynthetically Active Radiation plots from Opotiki, Whakatane and Pukehina transects on the BOP continental shelf.

22 Environment Bay of Plenty
Bay of Plenty Coastal Water Quality, 2003 - 2004 Environmental Publication 2005/13
-200
-150
-100
-50
-200
-150
-100
-50
0 10,000 20 ,000 30,000-200
-150
-100
-50
0 10,000 20,0 00 30,000 0 10,000 20,000 30 ,000
FLUORESCENCE
Distance From Shore (m)
Dep
th (m
)10/03 12/03 3/04 5/04
Opo
tiki
Wha
kata
neP
ukeh
ina
Flourescence (RFU)
036912151821
Figure 10 Chlorophyll-a plots (as fluorescence measurements) from Opotiki, Whakatane and Pukehina transects on the BOP continental shelf.

Environment Bay of Plenty 23
Environmental Publication 2005/13 Bay of Plenty Coastal Water Quality, 2003 - 2004
Figure 11 Concentration of oxidised nitrogen from Opotiki, Whakatane and Pukehina transects on the BOP continental shelf.

24 Environment Bay of Plenty
Bay of Plenty Coastal Water Quality, 2003 - 2004 Environmental Publication 2005/13
Figure 12 Concentration of dissolved reactive phosphorus from Opotiki, Whakatane and Pukehina transects on the BOP continental shelf.
Environment Bay of Plenty 25
Environmental Publication 2005/13 Bay of Plenty Coastal Water Quality, 2003 - 2004
3.2 Nutrients
Results for all the nutrient analyses undertaken along the transects is provided in Appendix II. Some of the data has been graphically presented to highlight observed patterns.
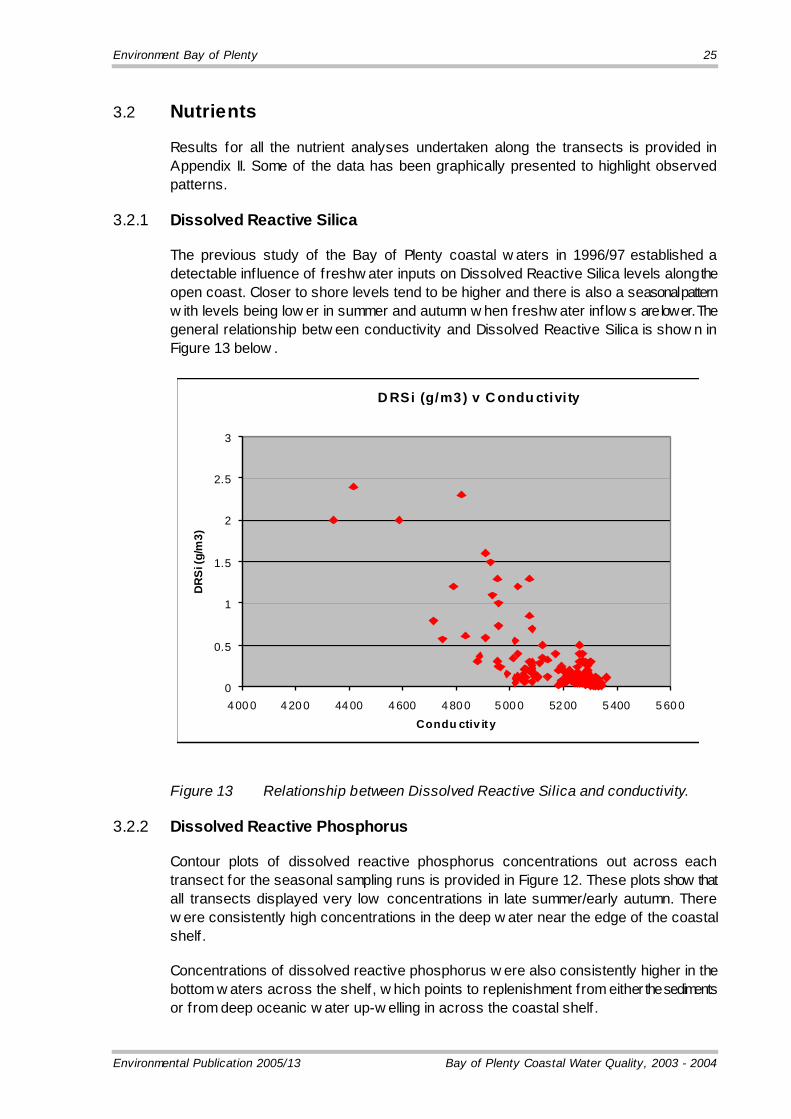
3.2.1 Dissolved Reactive Silica
The previous study of the Bay of Plenty coastal w aters in 1996/97 established a detectable influence of freshw ater inputs on Dissolved Reactive Silica levels along the open coast. Closer to shore levels tend to be higher and there is also a seasonal pattern w ith levels being low er in summer and autumn w hen freshw ater inflow s are lower. The general relationship betw een conductivity and Dissolved Reactive Silica is show n in Figure 13 below .
D RSi (g/m3) v C ondu ctivi ty
0
0.5
1
1.5
2
2.5
3
4 00 0 4 20 0 44 00 4 600 4 80 0 5 00 0 52 00 5 400 5 60 0Condu ctiv ity
DR
Si (
g/m
3)
Figure 13 Relationship between Dissolved Reactive Silica and conductivity.
3.2.2 Dissolved Reactive Phosphorus
Contour plots of dissolved reactive phosphorus concentrations out across each transect for the seasonal sampling runs is provided in Figure 12. These plots show that all transects displayed very low concentrations in late summer/early autumn. There w ere consistently high concentrations in the deep w ater near the edge of the coastal shelf.
Concentrations of dissolved reactive phosphorus w ere also consistently higher in the bottom w aters across the shelf, w hich points to replenishment from either the sediments or from deep oceanic w ater up-w elling in across the coastal shelf.

26 Environment Bay of Plenty
Bay of Plenty Coastal Water Quality, 2003 - 2004 Environmental Publication 2005/13
3.2.3 Total Oxidised nitrogen
Contour plots of total oxidised nitrogen concentrations out across each transect for the seasonal sampling runs are provided in Figure 11. Data is missing for the December 2003 runs as all the samples w ere lost in the laboratory.
Overall trends are similar to the earlier Bay of Plenty study (Park 1998) w ith a seasonal pattern of depletion in summer w ithin the upper stratif ied w aters. There is also consistently higher concentrations in the bottom w aters, particularly near the edge of the coastal shelf. As w ith dissolved reactive phosphorus, this points to sediment regeneration and up-w elling of the deep oceanic w ater in across the shelf.
3.3 Biological
3.3.1 Chlorophyll-a
Concentrations of chlorophyll-a measured during the year on each of the transects is best show n graphically by results presented in Figure 10 and the w ater column profiles graphed and presented in Appendix III.
During the course of the f ield surveys w ater samples w ere collected from set points and analysed for chl-a concentrations to assist w ith both calibration and general validation of instrument readings (see Appendix II). Calibration of the f luorometer is based on 29 samples collected on the 22nd October and 9th December 2005. In vivo estimates of chlorophyll concentration w ere corrected for turbidity effects using a multiple regression model as follow s:
Y = mxx + mzz + b, result obtained for this regression w as an r2 of 0.85877
Where:
Y = corrected chlorophyll value (mg/m3)
mx = coeff icient (slope) for in vivo chl-a = 0.82568
mz = coeff icient (slope) for turbidity = -0.2295
b = y intercept = -0.41137
Throughout most of the transect surveys turbidity w as generally very low so a simpler equation of y (chl-a mg/m3) = 0.82568 * f luorescence value - 0.41137 could be used to convert the f luorescence data. The simpler relationship betw een just f luorescence and Chlorophyll-a (mg/m3) is show n in Figure 14 below .

Environment Bay of Plenty 27
Environmental Publication 2005/13 Bay of Plenty Coastal Water Quality, 2003 - 2004
R2 = 0.8568
0
1
2
3
4
5
6
7
8
9
10
0 2 4 6 8 10 12Fluoresence
Chl
-a (
mg/
m3)
Figure 14 Relationship between instrument fluorescence values and Chl-a (mg/m3).
The highest f luorescence values from the survey w ere obtained on the 17th October 2003 at the 50 m depth contour on the Whakatane transect. The peak f luorescence value of 40 occurred as a pronounced spike in a very narrow depth range at about 17 m. This maximum converts to just over 30 mg/m3 of chl-a w hich is very high. Generally peak spring values as measured by f luorometer appeared to be around 18 mg/m3 of chl-a, w hich is still indicative of high productivity.
Chlorophyll-a concentrations at all sampling sites tended to peak in spring. During summer and autumn measured levels w ere much low er at around 2 mg/m3.
In the mid shelf area (50 – 100 m depth) the depth at w hich the chl-a peaks occurred, show ed a seasonal change associated w ith the development of the thermocline. The peak w as deepest in summer w hen a strong and deep thermocline w as also present.
3.3.2 Phytoplankton species
Results of the phytoplankton enumeration and identif ication show ed a number of typical trends. Table 3 below contains the list of species identif ied from the entire survey of the transects. In spring the most abundant species w as the diatom Eucampia zoodiacus, w hile the dinoflagellate Protoperidinium spp. dominated in summer, then in autumn it w as Nitzschia spp. follow ed by Chaetoceros spp. in w inter. The overall pattern w as that the dinoflagellates w ere more abundant in summer and autumn. This is show n in Table 4 below w hich provides the seasonal percentage composition of diatoms in the phytoplankton counts. All three transects show that numerically the diatoms w ere very dominant in spring.

28 Environment Bay of Plenty
Bay of Plenty Coastal Water Quality, 2003 - 2004 Environmental Publication 2005/13
Table 3 Phytoplankton species list and the seasonal abundance rank obtained from the three transects sampled in Bay of Plenty coastal waters
Diatoms Spring Summer Autumn Winter Asterionella glacialis 19 17 6
Cerataulina spp. 15
Cerataulina pelagica 17
Chaetoceros spp. 5 13 12 1
Coscinodiscus sp. 21 24 27
Detonula spp. 2 8 11 10
Diploneis sp. 15 15 28
Ditylum brightwellii 10
Ditylum spp. 16
Eucampia zoodiacus 1
Eucampia sp. 16 14 17
Fragilariopsis sp. 19
Guinardia spp. 8 19
Lauderia annulata 16
Lauderia sp. 9
Navicula spp. 9 6 9 14
Nitzschia longisimma 6
Nitzschia spp. 2 1 8
Odontella mobiliensis 7
Odontella sp. 7
Pleurosigma spp. 17 21 18
Pseudonitzschia spp. 4 5 4 3
Rhizosolenia imbricata 13 21
Rhizosolenia stolterforthii 12 5
Rhizosolenia spp. 12 20 13
Skeletonema costatum 8 2
Stephanopyxis sp. 11
Thalassosira spp. 3 4 7 4
Dinoflagellates
Alexandrium sp. 6 22
Ceratium furca 22 32
Ceratium tripos 2 14 29
Ceratium spp. 19 30
Dinophysis sp. 18 31
Gymnodinium spp. 10 16 25
Gyrodinium spp. 14 9 13 26
Oxytoxum sp. 22
Polykrikos sp. 3 33
Prorocentrum spp. 11 5 20
Protoperidinium spp. 18 1 10 23
Pyraminmonas sp. 18
Scrippsiella sp. 2 24
Non-photosy nthetic species 11
Unknown dinof lagellates (25 micron) 15

Environment Bay of Plenty 29
Environmental Publication 2005/13 Bay of Plenty Coastal Water Quality, 2003 - 2004
Micro flagellates
Cry ptomonads 7 3 12
Silicoflagellate
Dictyocha sp. 23
Table 4 Overall percentage of diatoms cells in the total number of phytoplankton cells counted from spot samples on each transect.
Spring Summer Autumn Winter Pukehina 98 57 56 95 Whakatane 99 27 56 85 Opotiki 98 23 49 93
Results of the numbers of phytoplankton cells present in each of the samples are given in Tables 5-7 below . On each of the transects the seasonal trend in total cell numbers is very similar. Numbers are highest in spring and decline to the low est levels in autumn.
In terms of spatial distribution there is a pattern of higher phytoplankton cell numbers occurring inshore. How ever in the spring transect sampling the numbers are just as high w ell offshore at the 200 m depth contour. The highest recorded cell numbers in any sample w as from 20 m depth at the 200 m depth contour around 35 km offshore from Opotiki.
Table 5 Total numbers of phytoplankton cells counted in spot samples from the Pukehina transect.
Oct 03 Dec 03 Mar 04 May 04 Contour depth (m) Number of phytoplankton cells (1,000’s/l)
10 0 200 31 300 20 0 122 135 10 186 20 20 60 55 14 146 30 0 210 13 25 164 30 20 10 9 120 50 0 234 73 9 223 50 20 286 2 2 151 50 30 521 17 6 109 50 50 100 2 10 43
100 20 5 100 30 13 100 100 8 7 2 14 200 0 326 81 4 200 20 485 86 3 200 30 543 134 5 200 50 121 2 3
mean 251 58 9 123

30 Environment Bay of Plenty
Bay of Plenty Coastal Water Quality, 2003 - 2004 Environmental Publication 2005/13
Table 6 Total numbers of phytoplankton cells counted in spot samples from the Whakatane transect.
Oct 03 Dec 03 Mar 04 May 04 Contour depth (m) Number of phytoplankton cells (1,000’s/l)
10 0 105 46 17 208 20 0 159 58 11 219 20 20 32 6 23 34 30 0 139 36 3 165 30 20 481 31 18 273 50 0 203 670 10 90 50 20 409 24 5 72 50 30 171 41 14 40 50 50 25 3 17 5
100 10 2 100 20 4 100 30 1 100 100 15 1 1 1 200 0 309 9 4 200 20 250 2 8 200 30 280 4 2 200 50 15 1 17
mean 185 67 11 85
Table 7 Total numbers of phytoplankton cells counted in spot samples from the Opotiki transect.
Oct 03 Dec 03 Mar 04 May 04 Contour depth (m) Number of phytoplankton cells (1,000’s/l)
10 0 43 20 7 109 20 0 151 37 13 224 20 20 22 7 6 104 30 0 159 69 3 113 30 20 601 6 2 201 30 30 6 50 0 311 55 2 92 50 20 313 39 5 46 50 30 53 19 8 125 50 50 3 6 18 55
100 20 10 100 30 3 100 100 8 1 1 4 200 0 352 1 2 200 20 672 6 2 200 30 443 3 200 50 189 4 4
mean 237 20 5 91

Environment Bay of Plenty 31
Environmental Publication 2005/13 Bay of Plenty Coastal Water Quality, 2003 - 2004

33
Environmental Publication 2005/13 Bay of Plenty Coastal Water Quality, 2003 - 2004
Chapter 4: Summary Results from this survey program have provided a w ealth of information on the Bay of Plenty coastal w aters. Observed seasonal and spatial trends out across the continental shelf are very similar to those observed in 1996/97. The use of CTD profiling equipment and f luorescence probe has improved the understanding of the vertical structure of the w ater column. The data w ill be used to help calibrate a model the physical dynamics of the Bay of Plenty coastal shelf system.
Current records have show n a complex system on the Bay of Plenty continental shelf being driven primarily by w ind w ith tides and external currents (East Auckland Current) also having an influence (Beamsley et al 2005). This confirms the earlier f indings of Healy et al (1988).
The major physical patterns w ithin the Bay of Plenty coastal w aters are the seasonal changes in w ater temperature w ith associated summer thermo cline development. Winter temperatures are usually around 12 – 13 oC w hile in summer they reach 21 – 22 oC. Nutrient levels are generally higher in w inter and become depleted in the surface w aters over summer. As in the earlier study of 1996/97 (Park 1998) data suggests that nutrient recycling from the sea f loor and inputs from the deep oceanic w ater via up-w elling are both important to overall productivity. Water clarity also improves seasonally in late summer and is highest out aw ay from the shore. Influence of terrestrial freshw ater inputs and associated nutrient and clarity factors is highest in w inter near the coast, often forming very large surface plumes during the larger river fresh or f lood events.
Phytoplankton levels are generally highest in late w inter and spring show ing a pattern of spatial decline out across the shelf. Peak concentrations of around 670,000 cells per litre were recorded from w ater samples during the surveys but peak levels are likely to be much higher. Diatoms tend to dominate during w inter and spring w hile dinoflagellates are proportionately more abundant in summer.
Fluorometer measurements show that estimated chlorophyll-a concentrations (another measure of phytoplankton productivity) reached peaks of around 15 – 18 mg/m3. The highest recorded estimate of chlorophyll-a concentration w as a very sharp peak of around 40 mg/m3. During summer f luorometer estimates of maximum chlorophyll-a concentrations tend to be around 1 – 2 mg/m3. Large and consistent spatial variations also occur across the Bay of Plenty depending on the prevailing w eather/current conditions. During the last survey in December 2004 chlorophyll-a concentrations to the east of Whakatane w ere low right across the shelf (1 – 2 mg/m3) while the areas to the w est show ed moderate levels (5 – 10 mg/m3).
This survey and report form part of the total AMA science project for the Bay of Plenty, w hich includes w ork on the currents and temperatures, sediments and biology. It also includes an analysis of remote sensing data to provide a synopsis of seasonal and spatial variability of sea surface temperature and chlorophyll-a w ithin the Bay of Plenty. All the w ater quality, climatic and current data w ill be used to develop a productivity model w hich w ill allow assessments of the

34 Environment Bay of Plenty
Bay of Plenty Coastal Water Quality, 2003 - 2004 Environmental Publication 2005/13
sustainability of aquaculture w ithin this region’s coastal shelf w aters. The modelling and assessments of sustainability are to be reported on by mid 2006.

35
Environmental Publication 2005/13 Bay of Plenty Coastal Water Quality, 2003 - 2004
Chapter 5: References Beamsley, B., Black, K.P., Longdill, P.C., and McComb, P. 2005: Bay of Plenty Current and
Temperature Measurements: Aquaculture Management Areas. Report for Environment Bay of Plenty, ASR Ltd, P.O. Box 67, Raglan, NZ, 65p.
Beca Carter Hollings and Ferner Limited 1978: Tauranga Harbour gauging. Unpublished report prepared for Bay of Plenty Catchment Commission and RWB.
Harms, C. 1989: Dredge spoil dispersion from an inner shelf dump-mound. unpublished thesis University of Waikato.
Healy, T. R. 1983: Assessment of stability and natural hazard risk of the Whakatane Spit in relation to proposed marina development. Unpublished report to Whakatane District Council. 74p.
Healy, T. R., McCabe, B., Grace, R., Harms, C. 1988: Environmental assessment programme for Tauranga Harbour dredging and inner shelf spoil dumping. Report for the Bay of Plenty Harbour Board. 43p.
Longdill, P.C., Black, K.P., Healy, T.R., Mead, S.T., and Beamsley, B. 2005a: Bay of Plenty Sediment Characteristics: Aquaculture Management Areas. Report for Environment Bay of Plenty, ASR Ltd, P.O. Box 67, Raglan, NZ, and the University of Waikato. 59p.
Longdill, P.C., Black, K.P., and Park, S.G. 2005b: Bay of Plenty Shelf Physical and Chemical Water Properties 2003-2004: Data Report. Report for Environment Bay of Plenty, ASR Ltd, P.O. Box 67, Raglan, NZ, 35p.
McIntosh, J. 1994: Water and sediment quality of Tauranga Harbour. Environmental Report 94/10. Environment BOP, P.O. 364, Quay Street, Whakatane, N.Z.
Mead, S.T., Longdill, P.C., Moores, A., Beamsley, B., and Black, K.P. 2005: Bay of Plenty Biological Survey: Aquaculture Management Areas. Report for Environment Bay of Plenty, ASR Ltd, P.O. Box 67, Raglan, NZ, 35p.
Park, S.G. 1998: Bay of Plenty Coastal Water Quality 1996 – 1997. Environmental Report 98/5. Environment BOP, P.O. 364, Quay Street, Whakatane, N.Z.
Ridgw ay, N.M. & Greig, M.J.N. 1986: Water movements in Bay of Plenty, New Zealand. N.Z. J. Mar. & Freshw ater Res. 20: 447-453.


37
Environmental Publication 2005/13 Bay of Plenty Coastal Water Quality, 2003 - 2004
Appendices Appendix I Site location and sampling program
Appendix II BOP offshore transect survey results
Appendix III CTD profiles for transect surveys


Environment Bay of Plenty 39
Environmental Publication 2005/13 Bay of Plenty Coastal Water Quality, 2003 - 2004
Appendix 1 – Site Location and Sampling Program
Sampling Sites
Latitude Longitude NZMS 260 Grid ref. (m) labstar # Tauranga Transect 10 m depth 37 35 40.9 176 08 34.8 2787737 6395999 730031 20 m 37 34 53.4 176 09 54.0 2789731 6397394 730032 30m 37 34 05.5 176 11 13.2 2791725 6398800 730033 50m 37 31 00.0 176 16 00.0 2798966 6404261 730034 100m 37 27 45.0 176 22 21.0 2808542 6409921 730035 200m 37 25 12.0 176 25 43.0 2813682 6414446 730036 Pukehina Transect 10m 37 49 25.3 176 36 34.8 2827892 6369054 730043 20m 37 48 51.6 176 36 59.3 2828533 6370066 730044 30m 37 47 11.5 176 38 10.8 2830408 6373078 730045 50m 37 45 05.0 176 39 41.1 2832774 6376884 730046 100m 37 40 12.4 176 43 10.9 2838278 6385687 730047 200m 37 38 30.7 176 44 23.6 2840189 6388745 730048 Whakatane Transect 10m 37 56 02.0 177 00 53.3 2862982 6355319 730037 20 m 37 55 35.4 177 01 17.3 2863604 6356112 730038 30m 37 53 43.1 177 02 22.4 2865348 6359500 730039 50m 37 51 41.9 177 04 00.0 2867899 6363125 730040 100m 37 44 12.9 177 08 30.5 2875141 6376649 730041 200m 37 41 51.9 177 10 02.0 2877580 6380891 730042 Opotiki Transect 10m 37 58 41.4 177 15 44.1 2884479 6349415 730049 20m 37 57 50.0 177 15 47.5 2884636 6350990 730050 30m 37 56 04.3 177 15 58.0 2885047 6354233 730051 50m 37 51 55.7 177 16 23.1 2886021 6361859 730052 100m 37 44 42.6 177 17 06.2 2887710 6375147 730053 200m 37 39 27.4 177 17 37.3 2888933 6384817 730054
Sampling program At each sampling station the follow ing parameters w ere recorded; vertical light attenuation, secchi depth, and dissolved oxygen, temperature, f luorescence, turbidity and salinity/conductivity profiles. These profiles are based on the dow n-cast recordings from the SBE 19 Plus probe. Surface sampling (0-5m) in the plans below is an integrated tube sample except for the Enterococcal samples. Sampling plan for phytoplankton identif ication and enumeration, 168 spot samples (14 per transect) Sample Sampling Station (depth contour m)

40 Environment Bay of Plenty
Bay of Plenty Coastal Water Quality, 2003 - 2004 Environmental Publication 2005/13
Depth (m) 10 20 30 50 100 200 0-5 . x x x x . x 10 . . . . . . . . 20 . . . . x x x . x 30 . . . . . x . x 50 . . . . . x . x 100 . . . . . . . . x . 200 . . . . . . . . . Sampling plan for phytoplankton size fractionation (Chl-a), 144 spot samples (9 per transect) Sample Sampling Station (depth contour m) Depth (m) 10 20 30 50 100 200 0-5 . . x . x . x 10 . . . . . . . . 20 . . . . x . x . . 30 . . . . . x . x 50 . . . . . x . . 100 . . . . . . . . x . 200 . . . . . . . . . Sampling plan for dissolved nutrients DRP, NH4, NO3, 288 spot samples (18 per transect) Sample Sampling Station (depth contour m) Depth (m) 10 20 30 50 100 200 0-5 . x x x x x x 10 . . . . . . . . 20 . . . x x x . x 30 . . . . x x . x 50 . . . . . x x x 100 . . . . . . x . 200 . . . . . . . x Sampling plan for TN, TP, SS, DRSi, DFe and TOC/DOC, 192 spot samples (16 per transect). Sample Sampling Station (depth contour m) Depth (m) 10 20 30 50 100 200 0-5 . x x x x x x 10 . . . . . . . . . 20 . . . . x x x . . 30 . . . . x x . x 50 . . . . . x x . 100 . . . . . . x . 200 . . . . . . . x Sampling plan for Enterococci bacteria, 96 spot samples (6 per transect). Sample Sampling Station (depth contour m) Depth (m) 10 20 30 50 100 200 0 . . . x x x x x x

Environment Bay of Plenty 41
Environmental Publication 2005/13 Bay of Plenty Coastal Water Quality, 2003 - 2004
Appendix 2 – BOP Offshore Transect Survey Results
In the follow ing results the f irst column lists the transect sampled (Pukehina, Whakatane & Opotiki) w ith the depth contour along the transect given in the fourth column, then the actual water depth at that site from w hich the samples w ere taken. The follow ing abbreviations and units are used; Temp temperature (degrees Celsius) Cond conductivity @ 25 oC Saln salinity Secchi secchi disc (measured in metres w ithout a view ing tube) Vlec vertical light extinction coeff icient derived from PAR measurements Ent Enterocci number cfu/100ml PH pH measurement @ 25oC SS Suspended Solids (g/m3) TOC Total Organic Carbon (g/m3) DOC Dissolved Organic Carbon (g/m3) DNPOC Dissolved non-purgable organic carbon (g/m3) NPOC Non-purgable organic carbon (g/m3) DRSi Dissolved Reactive Silica (mg/m3) DFe Dissolved iron (mg/m3) TN Total nitrogen (mg/m3) NH4 Ammonium nitrogen (mg/m3) NOx Oxidised nitrogen (mg/m3) TP Total Phosphorus (mg/m3) DRP Dissolved Reactive Phosphorus (mg/m3) Chla Chlorophyll-a total f ilterable on 0.7µm (mg/m3) Nanochla Chlorophyll-a for plankton 0.7-20µm (mg/m3) Microchla Chlorophyll-a for plankton 20-200 µm (mg/m3) Plankton Phytoplankton (thousands of cells per litre)

42 Environment Bay of Plenty
Bay of Plenty Coastal Water Quality, 2003 - 2004 Environmental Publication 2005/13

Environment Bay of Plenty 43
Environmental Publication 2005/13 Bay of Plenty Coastal Water Quality, 2003 - 2004

44 Environment Bay of Plenty
Bay of Plenty Coastal Water Quality, 2003 - 2004 Environmental Publication 2005/13

Environment Bay of Plenty 45
Environmental Publication 2005/13 Bay of Plenty Coastal Water Quality, 2003 - 2004


Environment Bay of Plenty 47
Environmental Publication 2005/13 Bay of Plenty Coastal Water Quality, 2003 - 2004
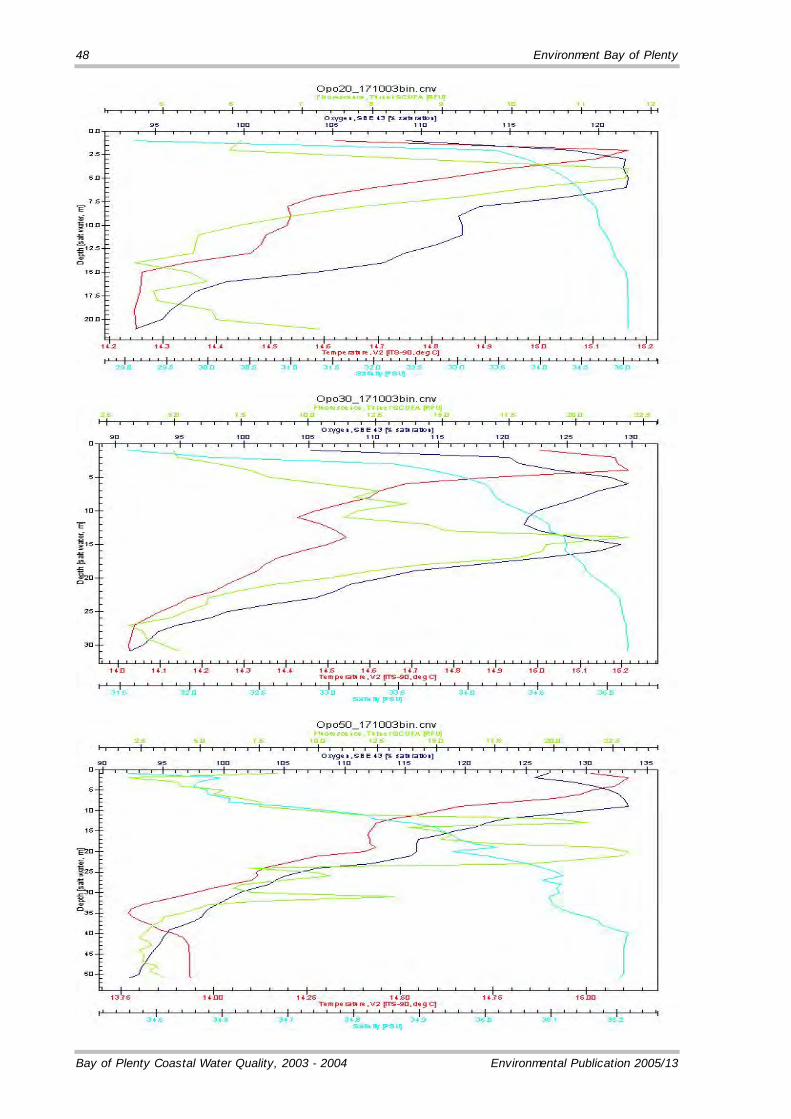
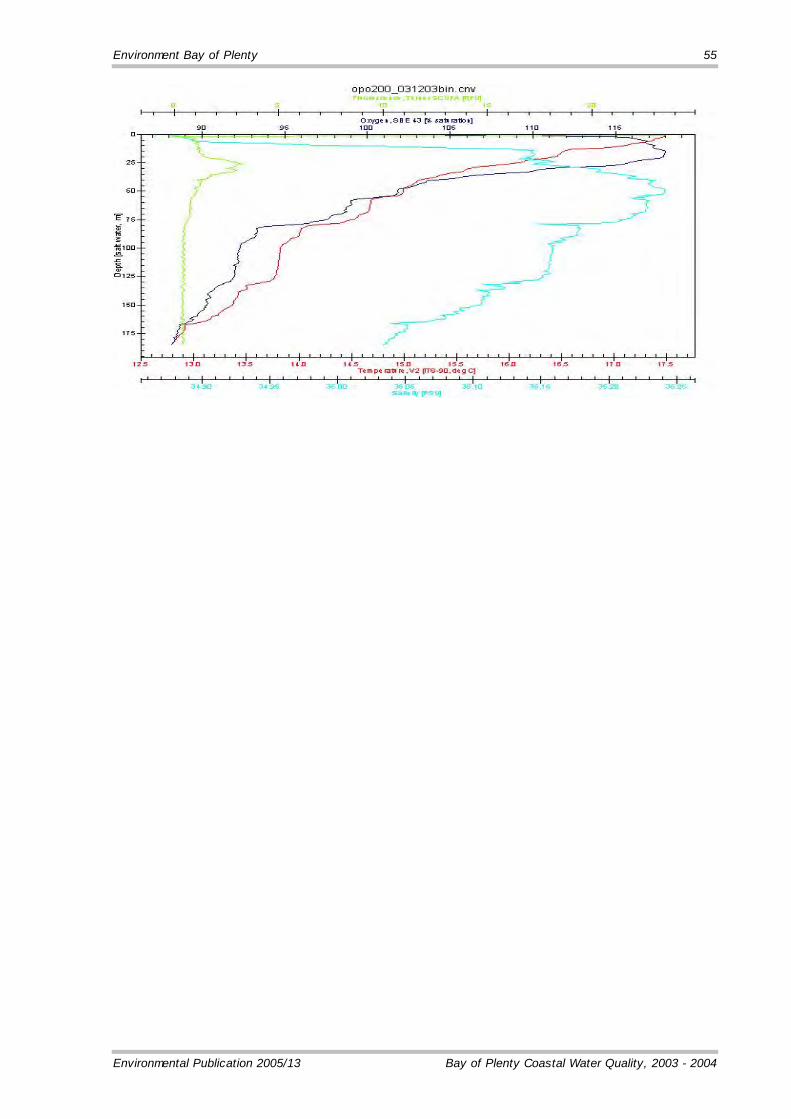
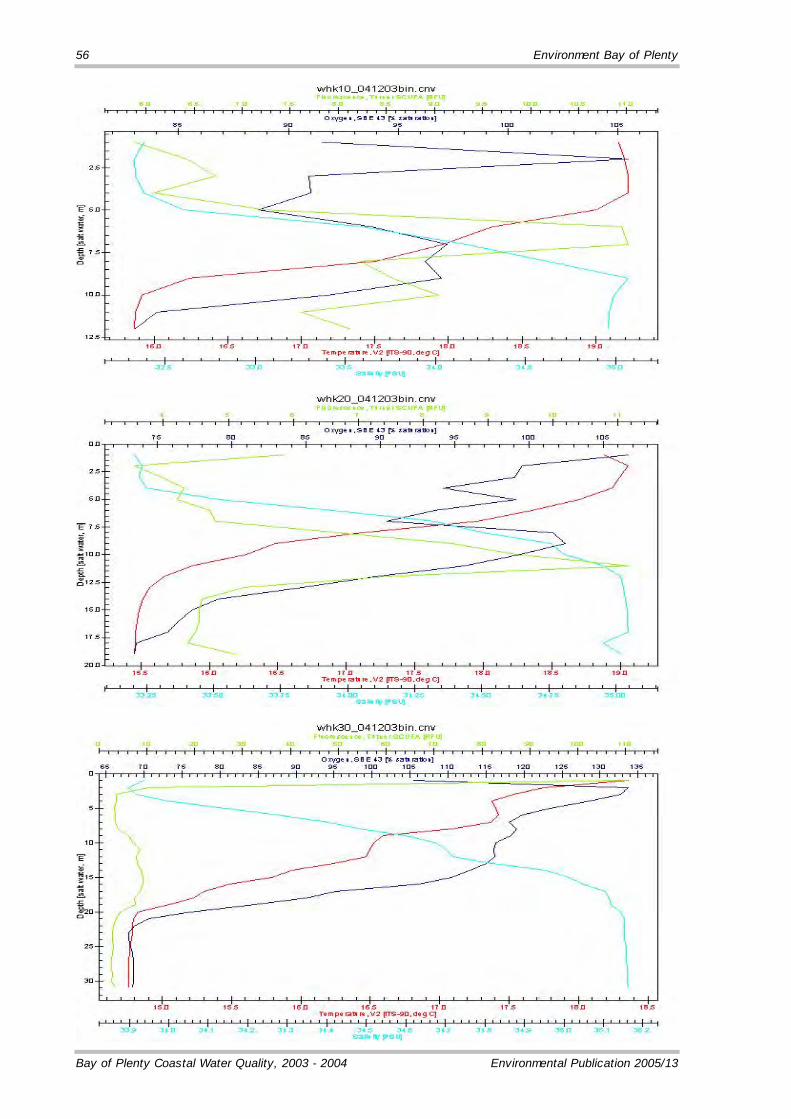
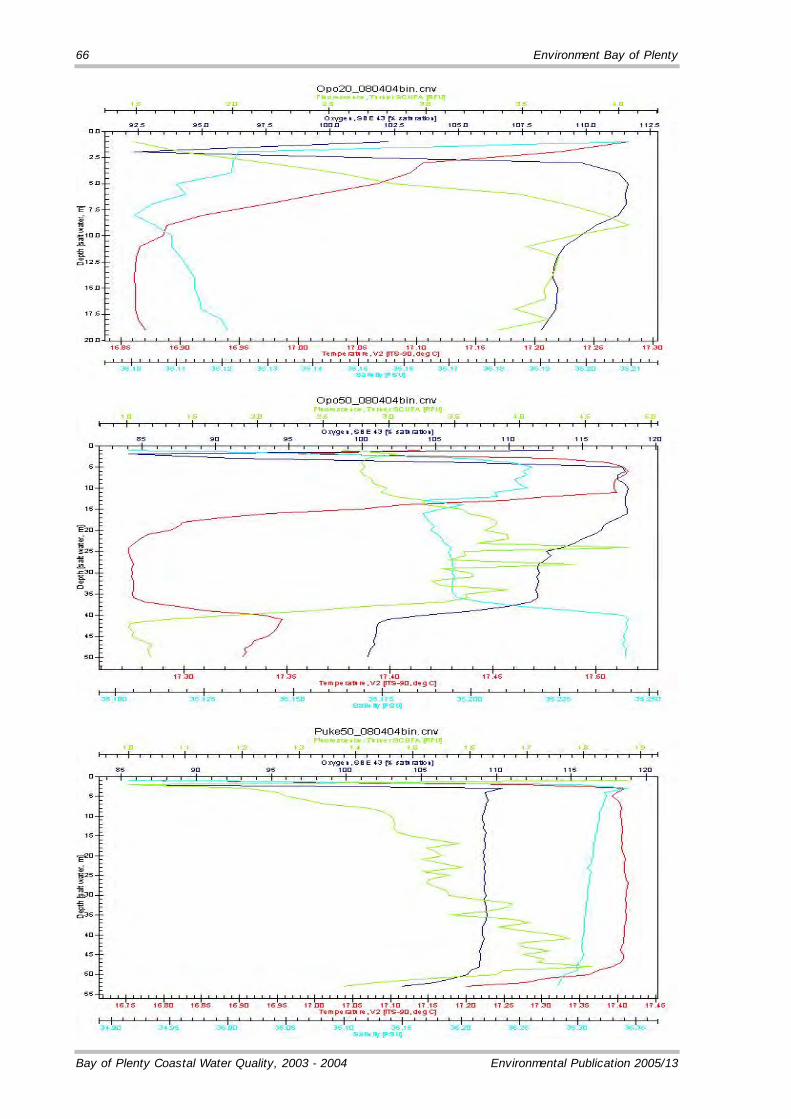
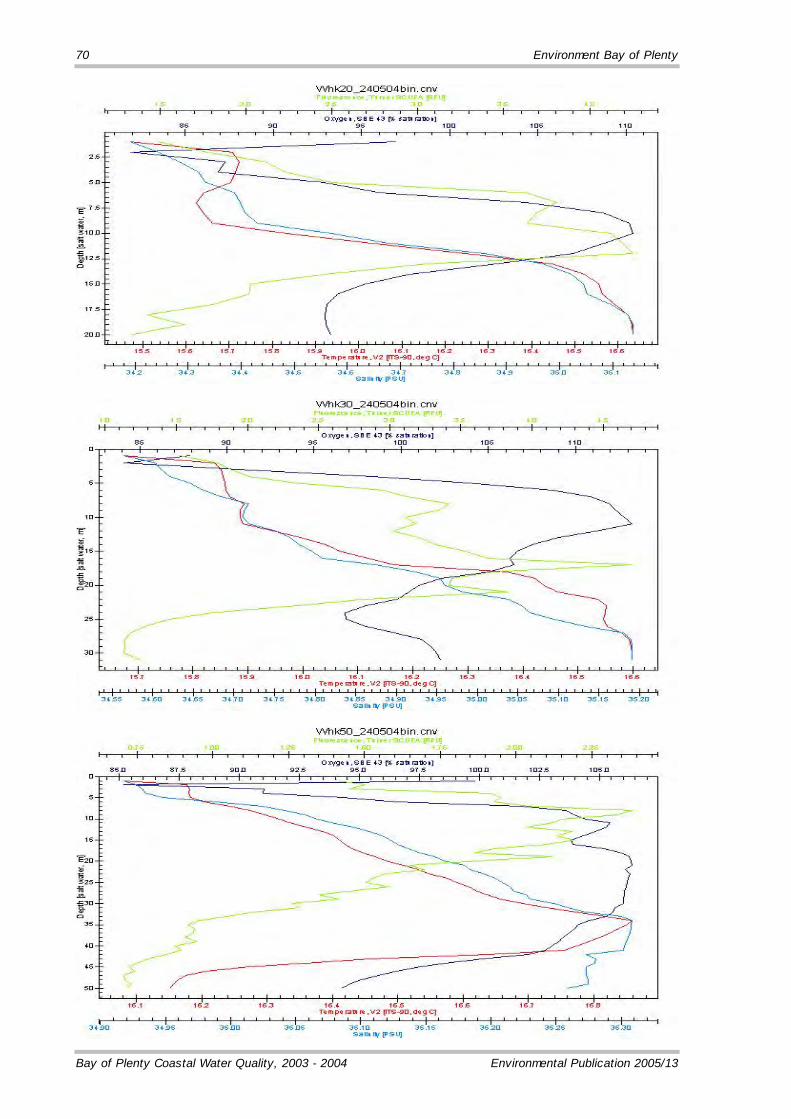
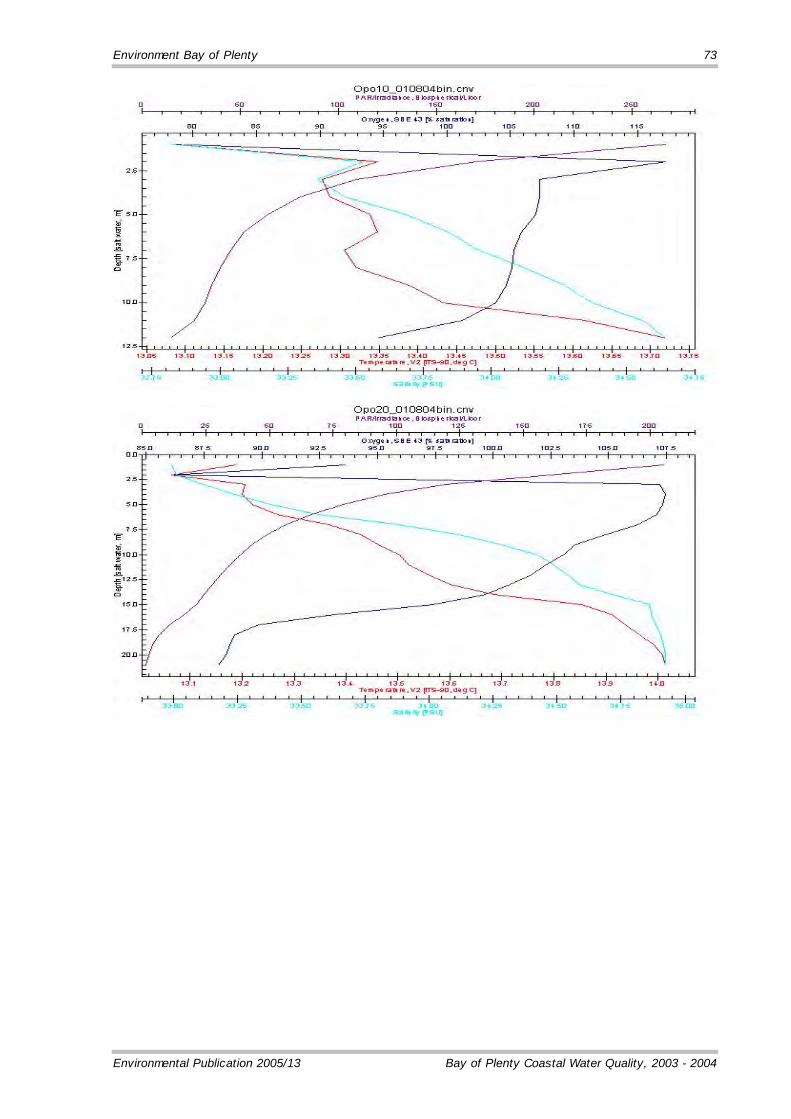
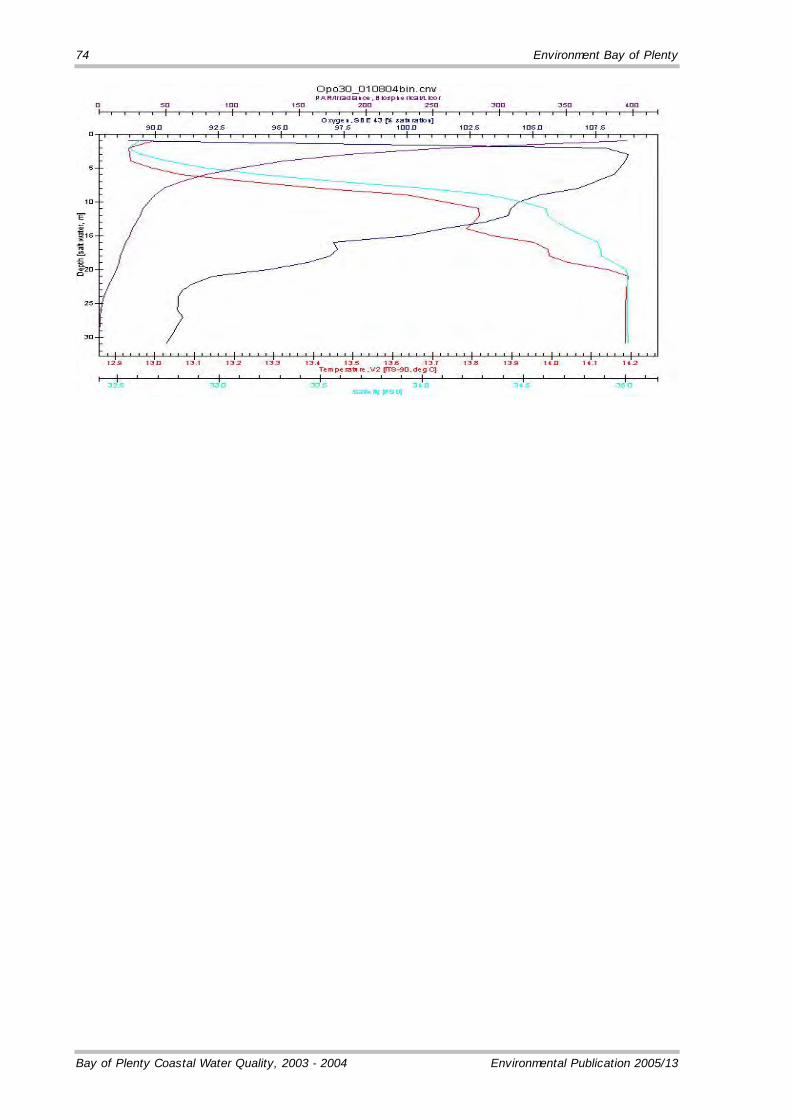
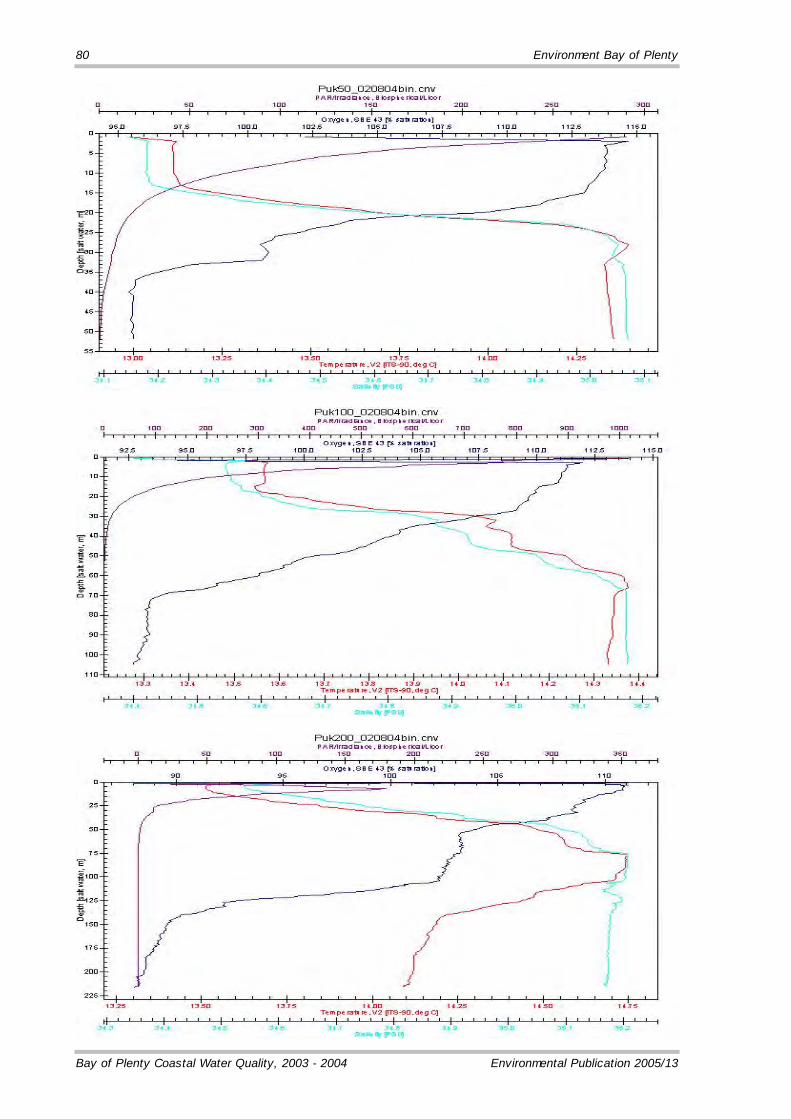
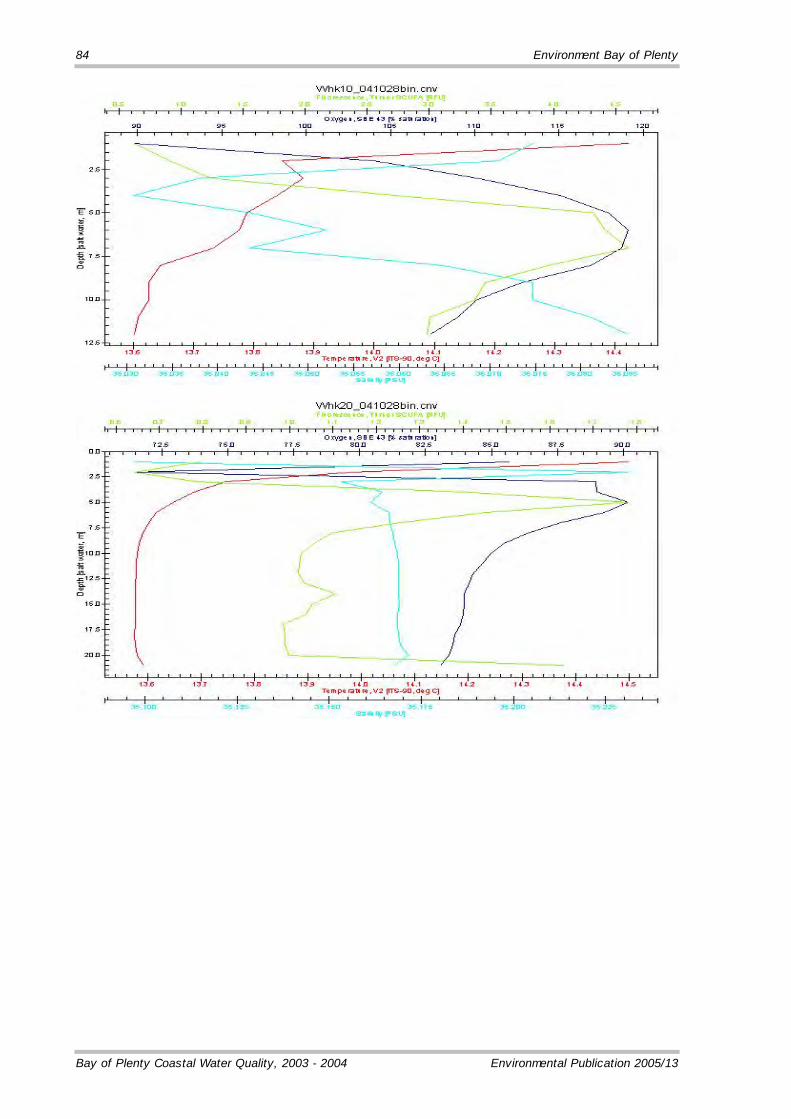
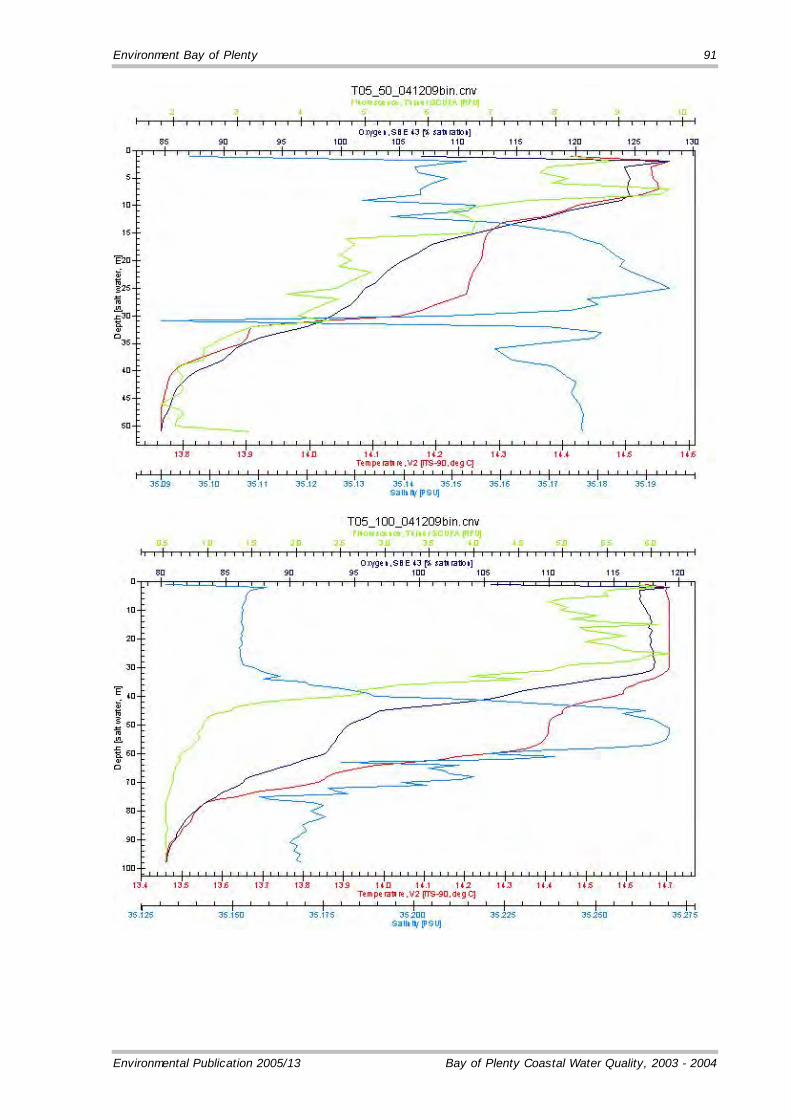
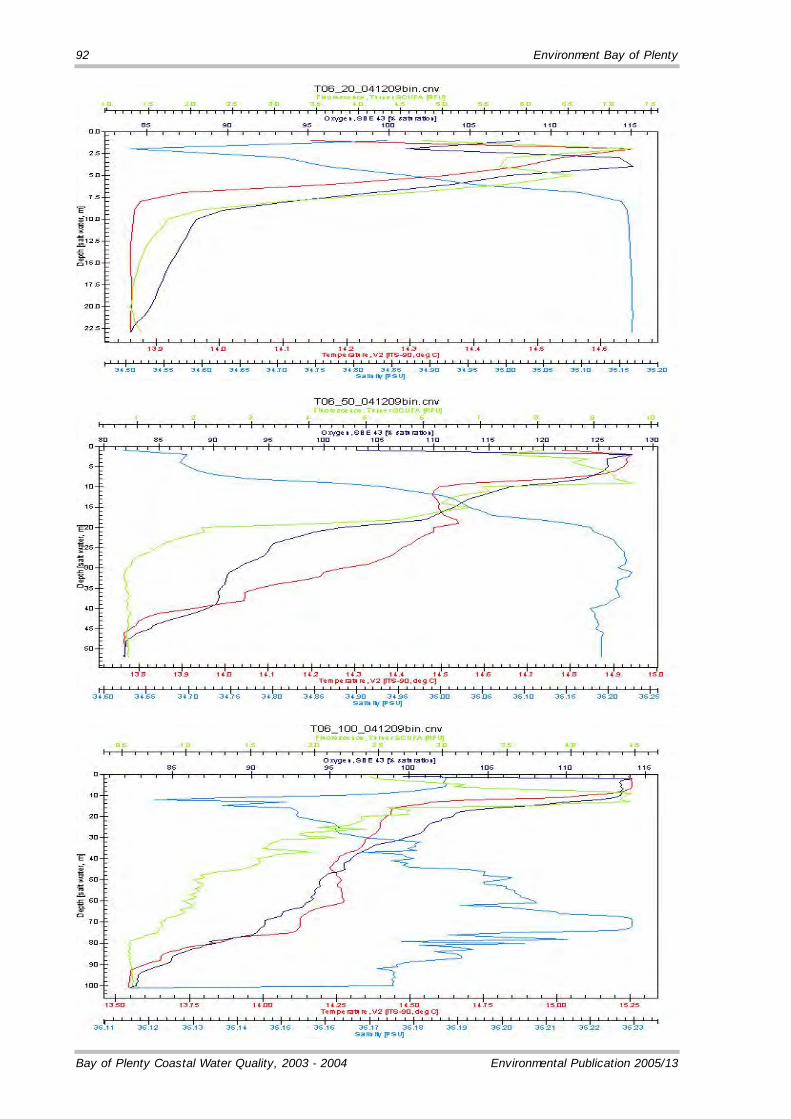
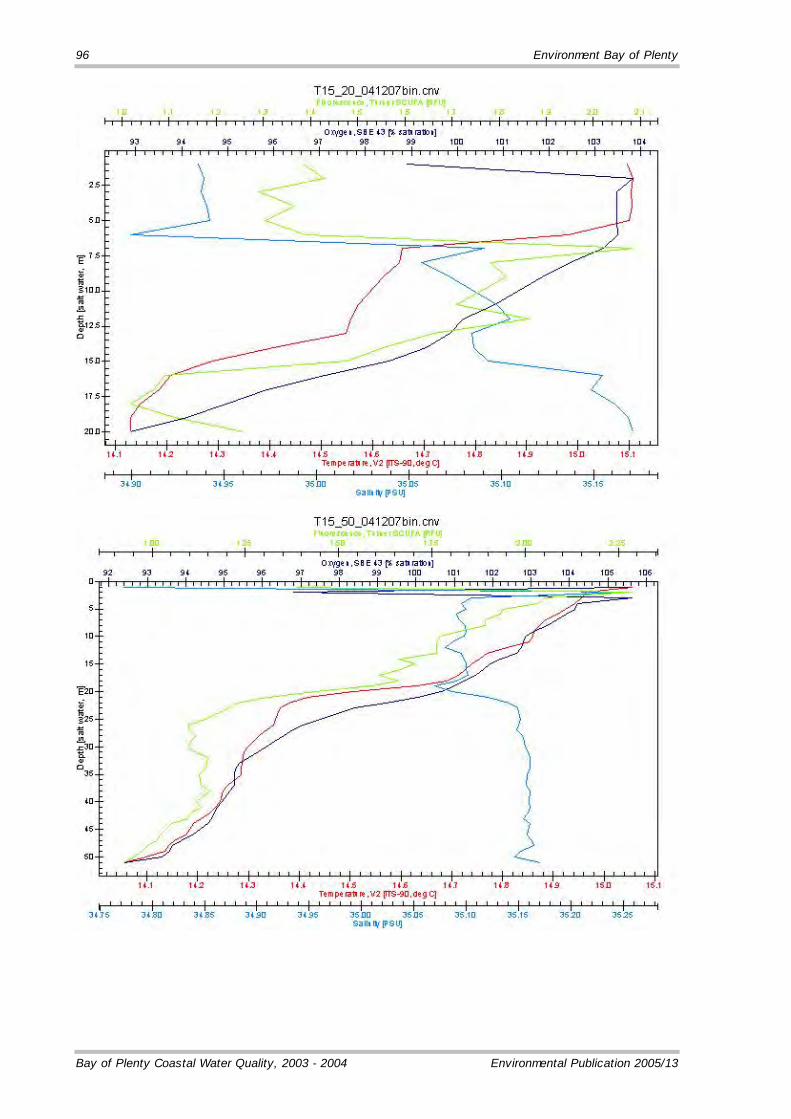
Appendix 3 – CTD Profiles From Transect Surveys
CTD transect data covers the period from October 2003 up to December 2004.
Graph titles start w ith the transect;
“Opo” = Opotiki, “Whk” = Whakatane, “Puk” = Pukehina.
Next in graph title is the depth contour and then the date of sampling. The bin.cnv can be ignored, although the “bin” indicates that that the graph is based on averaging the data over 1 m depth intervals.
For example “Opo20_171003bin.cnv” is data from the 20 m depth contour on the Opotiki transect sampled on the 17th October 2003.
In graphs Whk30_041203 and puk200_051203 there are w hat should be obvious f luorescence signal errors in the upper w ater column. On the August 2004 run of the transects the fluorometer w as not functioning correctly so no data w as obtained.
There are additional transects profiled for 7-9th December 2004 labelled T05 – T15, and these correspond to the ASR Ltd shelf sediment survey as follow s;
T05 = “C” and is off Matata
TO6 = “D” and is off Thornton
T11 = “I” and is off Opape
T13 = “K” and is off Omaio Bay
T15 = “M” and is off Raukokore
48 Environment Bay of Plenty
Bay of Plenty Coastal Water Quality, 2003 - 2004 Environmental Publication 2005/13

Environment Bay of Plenty 49
Environmental Publication 2005/13 Bay of Plenty Coastal Water Quality, 2003 - 2004

50 Environment Bay of Plenty
Bay of Plenty Coastal Water Quality, 2003 - 2004 Environmental Publication 2005/13

Environment Bay of Plenty 51
Environmental Publication 2005/13 Bay of Plenty Coastal Water Quality, 2003 - 2004

52 Environment Bay of Plenty
Bay of Plenty Coastal Water Quality, 2003 - 2004 Environmental Publication 2005/13

Environment Bay of Plenty 53
Environmental Publication 2005/13 Bay of Plenty Coastal Water Quality, 2003 - 2004

54 Environment Bay of Plenty
Bay of Plenty Coastal Water Quality, 2003 - 2004 Environmental Publication 2005/13
Environment Bay of Plenty 55
Environmental Publication 2005/13 Bay of Plenty Coastal Water Quality, 2003 - 2004
56 Environment Bay of Plenty
Bay of Plenty Coastal Water Quality, 2003 - 2004 Environmental Publication 2005/13

Environment Bay of Plenty 57
Environmental Publication 2005/13 Bay of Plenty Coastal Water Quality, 2003 - 2004

58 Environment Bay of Plenty
Bay of Plenty Coastal Water Quality, 2003 - 2004 Environmental Publication 2005/13

Environment Bay of Plenty 59
Environmental Publication 2005/13 Bay of Plenty Coastal Water Quality, 2003 - 2004

60 Environment Bay of Plenty
Bay of Plenty Coastal Water Quality, 2003 - 2004 Environmental Publication 2005/13

Environment Bay of Plenty 61
Environmental Publication 2005/13 Bay of Plenty Coastal Water Quality, 2003 - 2004

62 Environment Bay of Plenty
Bay of Plenty Coastal Water Quality, 2003 - 2004 Environmental Publication 2005/13

Environment Bay of Plenty 63
Environmental Publication 2005/13 Bay of Plenty Coastal Water Quality, 2003 - 2004

64 Environment Bay of Plenty
Bay of Plenty Coastal Water Quality, 2003 - 2004 Environmental Publication 2005/13

Environment Bay of Plenty 65
Environmental Publication 2005/13 Bay of Plenty Coastal Water Quality, 2003 - 2004
66 Environment Bay of Plenty
Bay of Plenty Coastal Water Quality, 2003 - 2004 Environmental Publication 2005/13

Environment Bay of Plenty 67
Environmental Publication 2005/13 Bay of Plenty Coastal Water Quality, 2003 - 2004

68 Environment Bay of Plenty
Bay of Plenty Coastal Water Quality, 2003 - 2004 Environmental Publication 2005/13

Environment Bay of Plenty 69
Environmental Publication 2005/13 Bay of Plenty Coastal Water Quality, 2003 - 2004
70 Environment Bay of Plenty
Bay of Plenty Coastal Water Quality, 2003 - 2004 Environmental Publication 2005/13

Environment Bay of Plenty 71
Environmental Publication 2005/13 Bay of Plenty Coastal Water Quality, 2003 - 2004

72 Environment Bay of Plenty
Bay of Plenty Coastal Water Quality, 2003 - 2004 Environmental Publication 2005/13
Environment Bay of Plenty 73
Environmental Publication 2005/13 Bay of Plenty Coastal Water Quality, 2003 - 2004
74 Environment Bay of Plenty
Bay of Plenty Coastal Water Quality, 2003 - 2004 Environmental Publication 2005/13

Environment Bay of Plenty 75
Environmental Publication 2005/13 Bay of Plenty Coastal Water Quality, 2003 - 2004

76 Environment Bay of Plenty
Bay of Plenty Coastal Water Quality, 2003 - 2004 Environmental Publication 2005/13

Environment Bay of Plenty 77
Environmental Publication 2005/13 Bay of Plenty Coastal Water Quality, 2003 - 2004

78 Environment Bay of Plenty
Bay of Plenty Coastal Water Quality, 2003 - 2004 Environmental Publication 2005/13

Environment Bay of Plenty 79
Environmental Publication 2005/13 Bay of Plenty Coastal Water Quality, 2003 - 2004
80 Environment Bay of Plenty
Bay of Plenty Coastal Water Quality, 2003 - 2004 Environmental Publication 2005/13

Environment Bay of Plenty 81
Environmental Publication 2005/13 Bay of Plenty Coastal Water Quality, 2003 - 2004

82 Environment Bay of Plenty
Bay of Plenty Coastal Water Quality, 2003 - 2004 Environmental Publication 2005/13

Environment Bay of Plenty 83
Environmental Publication 2005/13 Bay of Plenty Coastal Water Quality, 2003 - 2004
84 Environment Bay of Plenty
Bay of Plenty Coastal Water Quality, 2003 - 2004 Environmental Publication 2005/13

Environment Bay of Plenty 85
Environmental Publication 2005/13 Bay of Plenty Coastal Water Quality, 2003 - 2004

86 Environment Bay of Plenty
Bay of Plenty Coastal Water Quality, 2003 - 2004 Environmental Publication 2005/13

Environment Bay of Plenty 87
Environmental Publication 2005/13 Bay of Plenty Coastal Water Quality, 2003 - 2004

88 Environment Bay of Plenty
Bay of Plenty Coastal Water Quality, 2003 - 2004 Environmental Publication 2005/13

Environment Bay of Plenty 89
Environmental Publication 2005/13 Bay of Plenty Coastal Water Quality, 2003 - 2004

90 Environment Bay of Plenty
Bay of Plenty Coastal Water Quality, 2003 - 2004 Environmental Publication 2005/13
Environment Bay of Plenty 91
Environmental Publication 2005/13 Bay of Plenty Coastal Water Quality, 2003 - 2004
92 Environment Bay of Plenty
Bay of Plenty Coastal Water Quality, 2003 - 2004 Environmental Publication 2005/13

Environment Bay of Plenty 93
Environmental Publication 2005/13 Bay of Plenty Coastal Water Quality, 2003 - 2004

94 Environment Bay of Plenty
Bay of Plenty Coastal Water Quality, 2003 - 2004 Environmental Publication 2005/13

Environment Bay of Plenty 95
Environmental Publication 2005/13 Bay of Plenty Coastal Water Quality, 2003 - 2004
96 Environment Bay of Plenty
Bay of Plenty Coastal Water Quality, 2003 - 2004 Environmental Publication 2005/13

Environment Bay of Plenty 97
Environmental Publication 2005/13 Bay of Plenty Coastal Water Quality, 2003 - 2004