Bay-Delta Fisheries Resources: Pelagic Organisms · 2012-09-17 · Bay-Delta Fisheries Resources:...
81
Bay-Delta Fisheries Resources: Pelagic Organisms September 14, 2012 Submitted by: State Water Contractors, Inc. San Luis & Delta-Mendota Water Authority
Transcript of Bay-Delta Fisheries Resources: Pelagic Organisms · 2012-09-17 · Bay-Delta Fisheries Resources:...
Bay-Delta Fisheries Resources: Pelagic Organisms
September 14, 2012
Submitted by: State Water Contractors, Inc. San Luis & Delta-Mendota Water Authority

[This page intentionally left blank for double-sided printing]
Bay-Delta Fisheries Resources: Pelagic Organisms
September 14, 2012 Table of Contents i
Table of Contents
Executive Summary, p. 1
Chapter 1 – Longfin Smelt, p. 5 1.1 – Introduction and summary, p. 5 1.2 – Life history, p. 5 1.3 – Abundance and distribution of longfin smelt, p. 7 1.4 – Environmental factors affecting longfin smelt, p. 9 1.4.1 – Food resources, p. 9
1.4.2 – Entrainment, p. 12 1.5 – Reasons for caution regarding flow relationships, p. 13
Chapter 2 – Delta Smelt, p. 19 2.1 – Introduction and summary, p. 19 2.2 – Delta smelt biology, p. 20 2.3 – Delta smelt habitat, p. 20 2.4 – Environmental factors affecting delta smelt, p. 22 2.4.1 – Nutrients, p. 22
2.4.2 – Declines in primary productivity, p. 22 2.4.3 – Predation, p. 23 2.4.4 – Water temperatures, p. 24 2.4.5 – Entrainment, p. 25 2.4.6 – Water clarity, p. 27 2.4.7 – Physical habitat, p. 29
Chapter 3 – Other Pelagic Species, p. 41 3.1 – Green Sturgeon, p. 43 3.2 – Summary and introduction, p. 43 3.3 – Green sturgeon biology, p. 43 3.4 – Environmental factors affecting green sturgeon, p. 44
3.4.1 – Impassable dams, p. 45 3.4.2 – Migration barriers, p. 45 3.4.3 – Fishing impacts, p. 45 3.4.4 – Water diversions, p. 45 3.4.5 – Flow and temperature effects, p. 45 3.4.6 – Ecosystem changes, p. 46
4.0 – Sacramento Splittail, p. 47 4.1 – Introduction and summary, p. 47 4.2 – Sacramento splittail biology, p. 47
4.3 – Environmental factors affecting Sacramento splittail, p. 48 5.0 – Starry Flounder, p. 50 5.1 – Introduction and summary, p. 50 5.2 – Starry flounder biology, p. 50
5.3 – Environmental factors affecting starry flounder, p. 50 6.0 – American Shad, p. 52

Bay-Delta Fisheries Resources: Pelagic Organisms
ii · Executive Summary September 14, 2012
6.1 – Introduction and summary, p. 52 6.2 – American shad biology, p. 52 6.3 – Environmental factors affecting American shad, p. 53 7.0 – Northern Anchovy, p. 55 7.1 – Introduction and summary, p. 55 7.2 – Northern anchovy biology, p. 55 7.3 – Environmental factors affecting northern anchovy, p. 55 8.0 – Striped Bass, p. 57 8.1 – Introduction and summary, p. 57 8.2 – Striped bass biology, p. 57 8.3 – Environmental factors affecting striped bass, p. 57 9.0 – California Bay Shrimp, p. 61 9.1 – Introduction and summary, p. 61 9.2 – California bay shrimp biology, p. 61 9.3 – Environmental factors affecting California bay shrimp, p. 62
Cited References, p. 64
Figures
1. Bay Study Midwater Trawl and Otter Trawl catch per unit effort, p. 6
2. Extent of Interagency Ecological Program monitoring stations, p. 8
3A. Spring distribution of age-0 longfin smelt in the Bay-Delta system based on catch per unit effort, p. 9
3B. Spring distribution of age-1 longfin smelt in the Bay-Delta system based on catch per unit effort, p. 10
3C. Spring distribution of age-2 longfin smelt in the Bay-Delta system based on catch per unit effort, p. 11
4. Percent frequency of detection of age-0 longfin smelt by region, p. 12
5. Relationships between various factors and longfin smelt FMWT Index, p. 15
6. Bay Study Midwater Trawl catch per unit effort and Fall Midwater Trawl index for longfin smelt, p. 17
7. Estimates of abundance with and without covariates, Maunder and Deriso (2011) delta smelt life cycle model, p. 27
8. Suspended sediment concentration, mid-depth, Point San Pablo, p. 28
9. Historical trends in turbidity, diatom density, and chlorophyll-a for Suisun Bay stations D4, D6, D7, D8, p. 29
10. Distribution of delta smelt across all regular fish monitoring surveys, p. 36

Bay-Delta Fisheries Resources: Pelagic Organisms
September 14, 2012 Table of Contents iii
11. The green sturgeon life cycle, p. 44
12. Estimated annual salvage of green sturgeon at State Water Project (SWP) and federal Central Valley Project (CVP) fish facilities in the South Delta, p. 46
13. Age-0 splittail (>24 mm FL) abundance and distribution based on U.S. Fish and Wildlife Service beach seine survey, 1978-1982, 1992-2002, p. 49
14. Annual abundance of age-0 starry flounder, p. 51
15. Annual index of American shad abundance, p. 54
16. Fall Midwater Trawl index for striped bass, p. 58
17. Population abundance estimates of adult striped bass (age-3 to age-6), p. 59
18. Population abundance estimates of sub-adult striped bass (age-1 and age-2), p. 59
19. Change in abundance of California bay shrimp over time in relation to spring X2 location, ammonium loading, and the nitrogen:phosphorus ratio, p. 63

Bay-Delta Fisheries Resources: Pelagic Organisms
iv · Executive Summary September 14, 2012
Acronyms
BDCP Bay Delta Conservation Plan
BiOp biological opinion
cfs cubic foot/feet per second
CVP Central Valley Project
CDFG California Department of Fish and Game
DIN:TP ratio of dissolved inorganic nitrogen to total phosphorus
DWR California Department of Water Resources
mg L-1 milligram(s) per liter
NMFS National Marine Fisheries Service
N:P ratio of nitrogen to phosphorus
IEP Interagency Ecological Program
POD pelagic organism decline
SWP State Water Project
USFWS United States Fish and Wildlife Service
USGS United States Geological Survey

Bay-Delta Fisheries Resources: Pelagic Organisms
September 14, 2012 Executive Summary 1
Executive Summary
The State Water Contractors and the San Luis & Delta-Mendota Water Authority (Public Water Agencies or PWAs) have conducted a technical assessment of the status and trends of eight fishes of concern in the Sacramento-San Joaquin Delta (Delta or estuary). In the ongoing workshops, the State Water Resources Control Board (State Water Board) has and will continue to receive information regarding the scientific and technical basis for potential changes to the 2006 Water Quality Control Plan for the Bay-Delta. This presentation has been prepared to help inform the second of those workshops on Bay-Delta Fishery Resources. This document addresses fish species other than salmonids, which are described in a companion submission.
These workshops provide an opportunity for the State Water Board to consider the wealth of scientific information that has been developed since it completed the review of the 2006 Bay-Delta Plan and since it released the 2010 Flow Criteria Report.
This submittal assesses the available scientific information on the multiple stressors affecting the Bay-Delta ecosystem and population-level effects on key fish species. An assessment of available scientific information reveals a high degree of uncertainty as to whether Delta through flows, particularly in the form of reservoir releases and export curtailments, affect the abundance of two key fish species, longfin smelt and delta smelt. Conversely, it is fairly well accepted that changes in food resources, in terms of quality and quantity, have likely impacted delta and longfin smelt abundances, and the best available information indicates that these changes have been caused by changes in nutrient loadings. Increasing water temperatures, changes in turbidity, and predation have also likely affected the abundance of the two smelt species. While these stressors are not controllable with reservoir releases or export curtailments, there are other actions that could be taken, including physical habitat restoration and pollution control.
Longfin Smelt
A brief summary of factors the State Water Board should consider when evaluating the need for Delta through flows for longfin smelt include:
Their abundance index decline (based on the FMWT) is closely tied to food web changes. Invasion and establishment of the Amur River clam, Potamocorbula amurensis, and increases in the concentration of ammonium and changes in the ratios of key nutrients are the primary cause of detrimental changes to the food web in the upper estuary.
There are a number of factors besides the Amur River clam abundances and nutrients that have statistically significant relationships with longfin smelt abundance. They include winter-spring outflow, water clarity, and tributary flows. Water clarity and tributary flows, and other factors, correlate as well or better than winter-spring outflow.

Bay-Delta Fisheries Resources: Pelagic Organisms
2 · Executive Summary September 14, 2012
The longfin smelt’s full geographic range in the estuary should be considered. The Bay Study demonstrates that longfin smelt are found in significant numbers far downstream of the low-salinity zone in San Pablo, Central, and South bays in the winter and spring. The Fall Midwater Trawl does not sample longfin smelt’s full geographic range, although it does cover the region where most longfin smelt are found in the fall. Catch data from this survey do not well represent longfin smelt that are in deeper waters and the survey area is getting deeper.
While some longfin smelt are entrained and salvaged by water project operations, they are found infrequently and at very small percentages of the total population in the Delta in areas where the threat of entrainment may be high.
Delta smelt
A brief summary of factors the State Water Board should consider when evaluating the need for Delta through flows for delta smelt include:
Four life cycle or multi-variable analyses of delta smelt abundance and potential stressors have recently been published (MacNally et al. 2010; Thomson et al. 2010; Maunder and Deriso 2011; Miller et al. 2012). These latter two studies show food resource availability to be a significant driver of delta smelt abundance. Thomson et al. (2010) found weak effects of water clarity and winter exports on delta smelt. MacNally et al. (2010) identified weak effects of predator abundance (largemouth bass) and stronger effects of warmer summer temperatures and duration of water temperatures suitable for spawning. Maunder and Deriso (2011) found that water temperature, prey density, and predators explained the recent decline in delta smelt abundance. And, Miller et al. (2012) found that prey density strongly predicted delta smelt abundance, while water temperature and predators were weakly associated with abundance. None of these models indicate that X2 position in the fall months affects delta smelt abundance.
Delta smelt do not have a statistically significant relationship between species abundance and low salinity zone volume or winter-spring, summer, or fall outflow.
Feyrer et al. (2011) proposed a statistically significant relationship between species abundance and an index of habitat quality in the fall. Because the equation contains an induced correlation, the index of habitat quality cannot be relied upon as a predictor of abundance for delta smelt. Initial analyses suggest the relationship between abundance and the habitat index is not significant. Stated differently, because the index of habitat quality is also a measure of abundance, the relationship provides no support for the importance of the habitat quality index. Irrespective of whether the habitat index equation has a statistically significant relationship with abundance, the fall X2 conceptual model has several deficiencies:
o Data analysis did not include Cache Slough abundance data;

Bay-Delta Fisheries Resources: Pelagic Organisms
September 14, 2012 Executive Summary 3
o Studies ultimately focused on a single variable;
o Four life cycle or multi-variable models independently reached the same conclusion: the position of X2 in the fall months has no statistically significant effect on species abundance;
o Suisun Bay is not currently as productive as it once was;
o It is unclear that delta smelt are distributed in relation to the low-salinity zone;
o A complete analysis establishing that the position of X2 can serve as a surrogate for delta smelt habitat needs to be conducted;
o Based on the high flows in 2011, the low Summer Townet Survey results for 2012 would not have been predicted by the fall X2 conceptual model;
o X2 position has not been trending upstream in the fall.
Other Pelagic Organisms
A brief summary of factors the State Water Board should consider when evaluating the need for Delta through flows for other pelagic species include:
Green sturgeon: There is currently little or no scientific basis that any specific action, such as further modifications of water project operations, will produce negligible, limited, or substantial benefits. Due to a fundamental lack of information on the status of green sturgeon and the factors that limit its numbers, additional research is an essential prerequisite to the identification of additional actions.
Splittail: No flow-related actions are supported by the scientific literature. The
literature supports actions intended to increase the availability of floodplain rearing and spawning habitat for splittail and other fishes, including physical modifications to the Fremont Weir and Yolo Bypass to manage the timing, frequency, and duration of inundation of the Yolo Bypass with gravity flow from the Sacrament River, and to improve upstream fish passage past barriers that include Fremont and Lisbon weirs.
Starry flounder: Based on the Bay Study Otter Trawl data from the past three decades, starry flounder is not experiencing a decline in abundance in the San Francisco estuary. There is no scientific justification for the SWRCB to take any further actions to maintain the abundance of the fish.
American shad: American shad is a bay fish that spawns upstream in larger rivers; it is not an estuarine fish. Its weak relationship with the location of X2 in the Delta is likely an artifact of physical circumstances that co-vary with inter-year variation in Delta through flows. Similar to Chinook salmon, the use of the Delta by American

Bay-Delta Fisheries Resources: Pelagic Organisms
4 · Executive Summary September 14, 2012
shad is primarily a just-passing-through phenomenon on directional downstream migration to salt waters. The scientific literature does not support additional flow-based action.
Northern anchovy: The central stock of northern anchovy is not experiencing a decline.
Striped bass: In spite of the effects of density dependence during their young juvenile stage, sufficient numbers of age-0 fish appear to be recruiting into the adult population. Likewise, recreational catch, the California Department of Fish and Game’s (CDFG) designated beneficial use for striped bass, has not declined.
California bay shrimp: Based on the Bay Study Otter Trawl data, California bay shrimp is not experiencing a decline. There is no reason to believe that further actions are needed to maintain its abundance.

Bay-Delta Fisheries Resources: Pelagic Organisms
September 14, 2012 Longfin Smelt (Spirinchus thaleichthys) · 5
1.0 Longfin Smelt
1.1 Introduction and Summary
A brief summary of factors the State Water Board should consider when evaluating the need for Delta through flows for longfin smelt include:
Their abundance index decline (based on the FMWT) is closely tied to food web changes. Invasion and establishment of the Amur River clam, increases in the concentration of ammonium, and changes in the ratios of key nutrients are the primary cause of detrimental changes to the food web in the upper estuary.
There are a number of factors besides the Amur River clam abundances and nutrients that have statistically significant relationships with longfin smelt abundance. They include winter-spring outflow, water clarity, and tributary flows. Water clarity and tributary flows, and other factors, correlate as well or better than winter-spring outflow.
The longfin smelt’s full geographic range in the estuary should be considered. The Bay Study demonstrates that longfin smelt are found in significant numbers far downstream of the low-salinity zone in San Pablo, Central, and South bays in the winter and spring. The Fall Midwater Trawl does not sample longfin smelt’s full geographic range, although it does cover the region where most longfin smelt are found in the fall. Catch data from this survey do not well represent longfin smelt that are in deeper waters and the survey area is getting deeper.
While some longfin smelt are entrained and salvaged by water project operations, they are found infrequently and at very small percentages of the total population in areas of the Delta where the threat of entrainment may be high.
1.2 Life history
The longfin smelt, Spirinchus thaleichthys, is a small (90–110 mm standard length at maturity) fish that usually has a 2-year life cycle (Moyle 2002). Historically, populations of longfin smelt in California have been present in the San Francisco estuary, Humboldt Bay, the Eel River estuary, and the Klamath River estuary (Moyle 2002). In the Bay-Delta, it is an anadromous species that spends its life in salt water except for spawning, when it seeks out lower salinity water. It is frequently referred to as a pelagic fish (that is, it lives in open waters), but it is encountered in shallow water circumstances and spawns along shorelines where fresher water meets the estuary (see, e.g., Sommer et al. 2007; Baxter et al. 2010). An examination of the available survey data suggests that a significant fraction of age-2 longfin smelt reside near the bottom (Figure 1). Age-0 and age-1 longfin smelt are almost always found at greater densities deeper in the water-column (Rosenfield and Baxter 2007; Rosenfield 2010).

Bay-Delta Fisheries Resources: Pelagic Organisms
6 Longfin Smelt (Spirinchus thaleichthys) September 14, 2012
According to some monitoring surveys, the longfin smelt is among the native species in the San Francisco estuary that have declined dramatically over the past decade and a half (see, e.g., Baxter 1999; Moyle 2002), with a recent rapid collapse coincident with the POD (Baxter et al. 2010). Despite this decline, they have been, and may continue to be, among
the most abundant resident pelagic or demersal fish species in the estuary (Dege and Brown 2004; Sommer et al. 2007).
As adults mature and prepare to spawn, most often from December through February, they make generally short-distance, brief spawning runs into fresher water where spawning takes place over a sand substrate (Baxter et al. 2009). Hobbs et al. (2010) examined otoliths and isotopic signatures and determined that the salinity preference of larval longfin smelt is broad (from 0-15 ppt), with frequent occurrence in fresher water salinities (~1-3 ppt) and in brackish waters (>5 ppt). Baxter et al. (2010) reports that “nursery habitats” cover a wide salinity range from 0.1-18 ppt.
Moyle (2002) reported that spawning by longfin smelt in
the Delta occurs below Medford Island in the San Joaquin River and below Rio Vista on the Sacramento River. The western extent of spawning habitat in the Delta was previously thought to be in upper Suisun Bay around Pittsburg and in Montezuma Slough in Suisun Marsh (Moyle 2002); however, the 20-mm Survey has found large numbers of larval longfin smelt in the Napa River. The conclusions of Moyle (2002) are contradicted by more recent published material. As presented by Leidy (2007) and Rosenfield (2010), other watercourses tributary to San Pablo Bay (e.g., the Petaluma River and Sonoma Creek) and South Bay (e.g., Coyote Creek) may also provide spawning habitat (there are currently no regular fish monitoring programs on those tributary streams), suggesting they are not
Log
Cat
ch P
er
Un
it E
ffo
rtLo
g C
atch
Pe
r U
nit
Eff
ort
Log
Cat
ch P
er
Un
it E
ffo
rt
Age-0 fish
19
80
19
82
19
84
19
86
19
88
19
90
19
92
19
94
19
96
19
98
20
00
20
02
20
04
20
06
20
08
20
10
Bay Study Otter Trawl(1980-1987)
Bay Study Otter Trawl(1988-2011)
Bay Study Midwater Trawl(1980-1987)
Bay Study Midwater Trawl(1988-2011)
Age-1 fish
Age-2 fish
Figure 1. Bay Study Otter Trawl (boxes) and Midwater Trawl (circles) catch per unit effort. Age-0 and age-1 fish catch is greater in the Otter Trawl, which samples near the bottom, than the Midwater Trawl, indicating that many fish are more demersal than pelagic. Age-2 fish are more pelagic. Otter Trawl CPUE converted to the same units as the Midwater Trawl. Data from the California Department of Fish and Game’s Bay Study.

Bay-Delta Fisheries Resources: Pelagic Organisms
September 14, 2012 Longfin Smelt (Spirinchus thaleichthys) · 7
exclusively dependent on the Suisun Bay region or the low-salinity zone for rearing. The upper end of the spawning habitat in the Delta is in the region of the confluence of the Sacramento and San Joaquin rivers, although the 20-mm Survey records small numbers of longfin smelt as far upstream on the Sacramento River as the Cache Slough region and east into the central estuary; however, these represent a very small percentage of their distribution (e.g., Baxter et al. 2009 characterizes upstream spawning as sporadic and rare). Larvae are found in salinities up to 15 ppt (Hobbs et al. 2010) and juveniles inhabit most of the estuary seaward of about 2 psu (Kimmerer 2002).
1.3 Abundance and Distribution of Longfin Smelt
Rosenfield and Baxter (2007) and Baxter et al. (2009) document that the range of longfin smelt extends into San Francisco Bay. The available data show the primary geographic range of the San Francisco estuary population of longfin smelt extends from the lower Sacramento River confluence downstream through Suisun, San Pablo, and Central bays, and even in South Bay and the near-ocean. Small fractions of the population can be found as far upstream as the American River, the lower San Joaquin River, and various other interior portions of the Delta, Suisun Marsh, and Cache Slough (Figure 2). In every life stage and in every year, most of the population(s) is located in north San Francisco, San Pablo, and Suisun bays. Suisun and San Pablo bays show consistently more frequent longfin smelt occurrences compared with other regions, suggesting those waters serve as potential nursery areas (Figure 3A, 3B, 3C). In contrast, the Delta surveys have shown irregular and small occurrences, suggesting habitats upstream of Suisun Bay may be of lesser quality, or are only utilized under certain circumstances.
The data reflected in Figures 2, 3A, 3B, and 3C suggest that longfin smelt are not tightly associated with a particular salinity or the estuary’s low-salinity zone, which is consistent with Kimmerer (2004) and Baxter et al. (2010).
Baxter et al. (2010) reported on a general shift in where longfin smelt are captured in the water column. The ratio of catch in the water column to catch at the bottom declined sharply during the POD years and has remained low, suggesting a shift in habitat use toward the bottom. Through the entire period of record, summer-fall longfin smelt (mostly age-0) catches in the Bay Study Midwater Trawl generally exceeded those in the Otter Trawl in Suisun Bay and the west Delta, whereas from San Pablo Bay downstream the reverse was true. During the POD years, coincident with the sharp drop in the Bay Study Midwater to Otter Trawl catch ratio, relative Otter Trawl catches by embayment shifted downstream and the greatest proportion occurred in Central Bay. Thus, both historical and recent downstream shifts in habitat use seem to have occurred, in addition to the recent shift toward the bottom indicated by the Bay Study Midwater:Otter Trawl ratio decline. These shifts downstream and toward the bottom further suggest that the pelagic feeding environment of the upper estuary has declined and that the longfin smelt response occurred in stages. Also, such shifts undoubtedly affected longfin smelt abundance as indexed by midwater trawls (FMWT and Bay Study Midwater Trawl) and contributed in part to the declines observed in their respective abundance indices. All of this suggests that there is some uncertainty in the results of the trawl data.

Bay-Delta Fisheries Resources: Pelagic Organisms
8 Longfin Smelt (Spirinchus thaleichthys) September 14, 2012
Figure 2. Extent of Interagency Ecological Program monitoring stations. The Fall Midwater Trawl does not extend into Central and South Bays while the Bay Study trawls do. The Bay Study trawls demonstrate that longfin smelt’s known range in the estuary extends into these bays. From Gray et al. (in prep).

Bay-Delta Fisheries Resources: Pelagic Organisms
September 14, 2012 Longfin Smelt (Spirinchus thaleichthys) · 9
Schoellhamer (2011) notes that the estuary overall is in an erosion state, with its main channels deepening. Such changes in the Delta’s bathymetry could further affect the monitoring catch of longfin smelt. The midwater trawls (Bay Study and FMWT) sample to a depth of 10-12 m because of gear limitations. Many of the estuary’s main channels now exceed this depth (see Bay Study and FMWT data at http://www.dfg.ca.gov/delta/). Approximately one-third of the Bay Study stations now exceed 12 m in depth. Thus, at many stations the midwater trawls are no longer sampling the deepest stratum of the water, even as longfin smelt catch has been shifting towards the bottom.
1.4 Environmental Factors Affecting Longfin Smelt
1.4.1 Food Resources
Food resources utilized by fishes of concern have declined in the low-salinity zone and upstream on the Sacramento River (Jassby et al. 2002; Kimmerer 2004). Nixon (1988) reports a strong relationship between production at the base of the food web (primary production) and production of fish (fishery yield), providing an explanation for the low fishery production in the Bay-Delta estuary. USFWS (2012) links changes in primary production caused in part by the invasion and establishment of the Amur River clam to longfin smelt population dynamics. Glibert et al. (2011) links changes in primary production to unbalanced nutrient ratios, a change that likely created conditions supportive of the Amur River clam’s invasion. While other factors may also be at work, the
Figure 3A. Spring distribution of longfin smelt in the Bay-Delta system based on catch per unit effort. (A) Age-0 fish. Note, the dark shaded circles represent 90% of the effort adjusted catch (major catch) and the light circles indicates the <9% effort adjusted catch (minor catch). Longfin smelt are found far below the low-salinity zone, especially in San Pablo Bay. From Gray et al. (in prep).
B
A

Bay-Delta Fisheries Resources: Pelagic Organisms
10 Longfin Smelt (Spirinchus thaleichthys) September 14, 2012
hypothesis that changes in primary production are a strong driver of longfin smelt declines is plausible.
Juvenile longfin smelt feed primarily on calanoid copepods, especially Eurytemora affinis, whereas older juveniles and adults feed principally on opossum shrimpand Acanthomysis spp. shrimp, when available (Hobbs et al. 2006; Slater 2008; Rosenfield 2010). E. affinis is important to age-0 longfin smelt in the spring. In summer and early fall, larger longfin smelt switch to N. mercedis (Slater 2008). In later fall, amphipods become regionally more important. Opossum shrimp has declined substantially in the estuary since the early 1970s (Orsi and Mecum 1996); when opossum shrimp are less abundant, adult longfin smelt return to feeding primarily on copepods and amphipods (Feyrer et al. 2003; Hobbs et al. 2006; USFWS 2012). It is widely accepted that food resources preferred by native fishes have suffered a major decline in the Delta (Kimmerer 2002; Moyle 2002; Rosenfield and Baxter 2007), being replaced by smaller, less nutritious taxa (Lehman 2000; Lehman et al. 2005; Lehman et al. 2010; Jassby et al. 2002; Sommer et al. 2007; Glibert et al. 2011; Winder and Jassby 2010).
Invasion of the estuary by the Amur River clam, P. amurensis, led to a sharp decline in the abundance of E. affinis, N. mercedis, and other mysids in the Suisun Bay region (Orsi and
Figure 3B. Spring distribution of age-1 longfin smelt in the Bay-Delta system based on catch per unit effort. Note: the dark shaded circles represent 90% of the effort adjusted catch (major catch) and the light circles indicates the <9% effort adjusted catch (minor catch). Age-1 longfin smelt are found throughout San Francisco Bay and west of the low-salinity zone. From Gray et al. (in prep).
B

Bay-Delta Fisheries Resources: Pelagic Organisms
September 14, 2012 Longfin Smelt (Spirinchus thaleichthys) · 11
Mecum 1996). After examining a number of potential causes of the opossum shrimp decline, Orsi and Mecum concluded that food limitation caused by grazing of the Amur River clam is the most probable cause. A factor leading to their conclusion is that, after 1984, the percent of large mysids (>11 mm) declined and was very low from 1988 to 1993. Orsi and Mecum concluded that so long as P. amurensis remains abundant in Suisun Bay, the abundance of N. mercedis is likely to also remain low. Additionally, the introduction and population increase of two Asian mysids in 1992 may compete with N. mercedis for resources (Orsi and Mecum 1996). According to Glibert et al. (2011), changes in nutrient forms and ratios may have played a role in the successful invasion by and establishment of the Amur River clam.
In addition to the food limiting effects of the Amur River clam, E. affinis and the opossum shrimp also suffered further declines because of unbalanced nutrient ratios that favor smaller, less nutritious taxa (Lehman 2000; Lehman et al. 2005; Lehman et al. 2010; Jassby et al. 2002; Sommer et al. 2007; Winder and Jassby 2010; Glibert et al. 2011; Glibert 2012).
Figure 3C. Spring distribution of age-2 longfin smelt in the Bay-Delta system based on catch per unit effort. Note: the dark shaded circles represent 90% of the effort adjusted catch (major catch) and the light circles indicates the <9% effort adjusted catch (minor catch). Adult longfin smelt are found throughout the estuary. From Gray et al. (in prep).
C

Bay-Delta Fisheries Resources: Pelagic Organisms
12 Longfin Smelt (Spirinchus thaleichthys) September 14, 2012
A manifestation of the imbalance in the nitrogen:phosphorus ratio may have created conditions favorable for invasion by the Amur River clam (Glibert et al. 2011). A detailed discussion of the current condition of the estuary’s food web is found in the PWA’s submittal, Ecosystem Changes to the Bay-Delta Estuary: A Technical Assessment of Available Scientific Information, dated 16 August 2012.
A potential response by fishes to reduced food supplies in a region is to move to more favorable areas without such limitations, if possible. A change in distribution from areas of low food availability to more productive areas may have occurred, as Baxter et al. (2010) notes that shifts in distribution away from habitats sampled by the Fall Midwater Trawl may explain some of the decline in longfin smelt in the FMWT abundance index, just as it has for striped bass (Sommer et al. 2011) and northern anchovy (Kimmerer 2006).
Reduced abundance is not observed in the Bay Study Otter Trawl (Baxter et al. 2010), which samples down through San Pablo, Central, and South bays (see Figure 1); these regions have not experienced as severe a drop in chlorophyll-a as seen in Suisun Bay and the Delta (Kimmerer 2004).
1.4.2 Entrainment
Grimaldo et al. (2009) stated: “There is considerable concern about the number of fish entrained at the export facilities. Unlike the X2-fish relationships, there is no direct evidence that entrainment affects population-level responses of fish.” Likewise, Baxter et al. (2010) acknowledged that the effects of entrainment on the longfin smelt population was unknown. Except for 2002, when an unusual number of longfin smelt were salvaged, entrainment by the water projects has been very low. USFWS (2012) reported the total number of spawning age longfin smelt salvaged at both pumps between 1993 and 2007 was 1,133 (an average of 87 fish per year). Baxter et al. 2009 characterizes upstream spawning, which may increase the likelihood that larval longfin smelt could be entrained, as sporadic and rare.
Rosenfield (2010) hypothesized that the water projects may entrain significant numbers of larval longfin smelt in low outflow years and immediately after the spawning period.1 Using particle tracking models and distributional assumptions, Baxter et al. (2009) estimated that larval entrainment at the water projects might be 2-10% of the total larval population. Table 2 of Baxter et al. (2009) indicates that entrainment of larval longfin smelt can reach the tens of thousands, and may have reached over a million fish in 2002; however, Table 2 of Baxter et al. (2009) is based at least partially on prescreen losses of juvenile Chinook salmon, delta smelt, striped bass, and steelhead trout (see Baxter et al. 2009, Appendix B). As these species have not been verified as appropriate surrogates for juvenile or adult longfin smelt for the purpose of estimating entrainment, Baxter et al.’s (2009) estimates are uncertain. And, based on the 20-mm Survey, which does not survey the entire range of longfin smelt, only small numbers of larval-juvenile longfin smelt are found in the sub-region of the Delta in which the pumps are located, indicating that entrainment of larvae is
1 Fish less than 20-mm are not efficiently captured by the salvage facilities and are not counted in salvage surveys.

Bay-Delta Fisheries Resources: Pelagic Organisms
September 14, 2012 Longfin Smelt (Spirinchus thaleichthys) · 13
expected to be low. As previously mentioned and as demonstrated by Figures 3A-3C, in every life stage and in every year the bulk of the longfin smelt population is located in Central, San Pablo and Suisun bays (Figure 4).
Baxter et al. (2009) also used particle tracking model runs to estimate the potential for entrainment of larval longfin smelt. Seven particle injection points were chosen, most of which were in the interior Delta and up to the Cache Slough region, areas which are outside the typical distribution of longfin smelt. Each of the insertion points introduced 5,000 particles, even though Baxter et al. (2009) characterizes upstream spawning as sporadic and rare. This casts further uncertainty on Baxter et al.’s (2009) conclusions on longfin smelt entrainment.
The importance of entrainment by the CVP and SWP pumping plants us further questioned by the data which show that far more longfin smelt are caught as bycatch – a form of entrainment – in small bay shrimp trawl fishery and bait fishing (anchovies and sardines) operations in South San Francisco Bay, San Pablo Bay, and Carquinez Strait (CDFG 2009). The California Department of Fish and Game estimated the total longfin smelt bycatch from shrimping in 1989 and 1990 at 15,539 fish, and in 2004 at 18,815-30,574 fish. Even though the bay shrimp trawl industry has declined since 2004, it continues to entrain longfin smelt at levels greater than those attributed to the water projects (USFWS (2012).
1.5 Reasons for Caution Regarding Flow Relationships
Numerous sources have described the positive correlation between winter-spring estuary outflow and longfin smelt abundance (see, e.g., Stevens and Miller 1983; Jassby et al. 1995; Kimmerer 2002, 2004; Kimmerer et al. 2009). However, the biological mechanism(s) of the spring X2:longfin smelt abundance relationship remains unknown (Kimmerer et al. 2009; Baxter et al. 2010), even though considerable research efforts have been undertaken since
X X X X X
Bay Study larval survey 1980-1989
20-mm Survey 1995-2011
XX No sampling
Freq
uen
cy o
f D
etec
tio
n (
%)
Figure 4. Percent frequency of detection of age-0 longfin smelt by region. “X” indicates no sampling and “0” indicates sampling but no longfin smelt observed. Data were from BMWT = Bay Study Midwater Trawl; BOT = Bay Study Otter Trawl; Kodiak = Spring Kodiak Trawl.
Bay-Delta Fisheries Resources: Pelagic Organisms
14 Longfin Smelt (Spirinchus thaleichthys) September 14, 2012
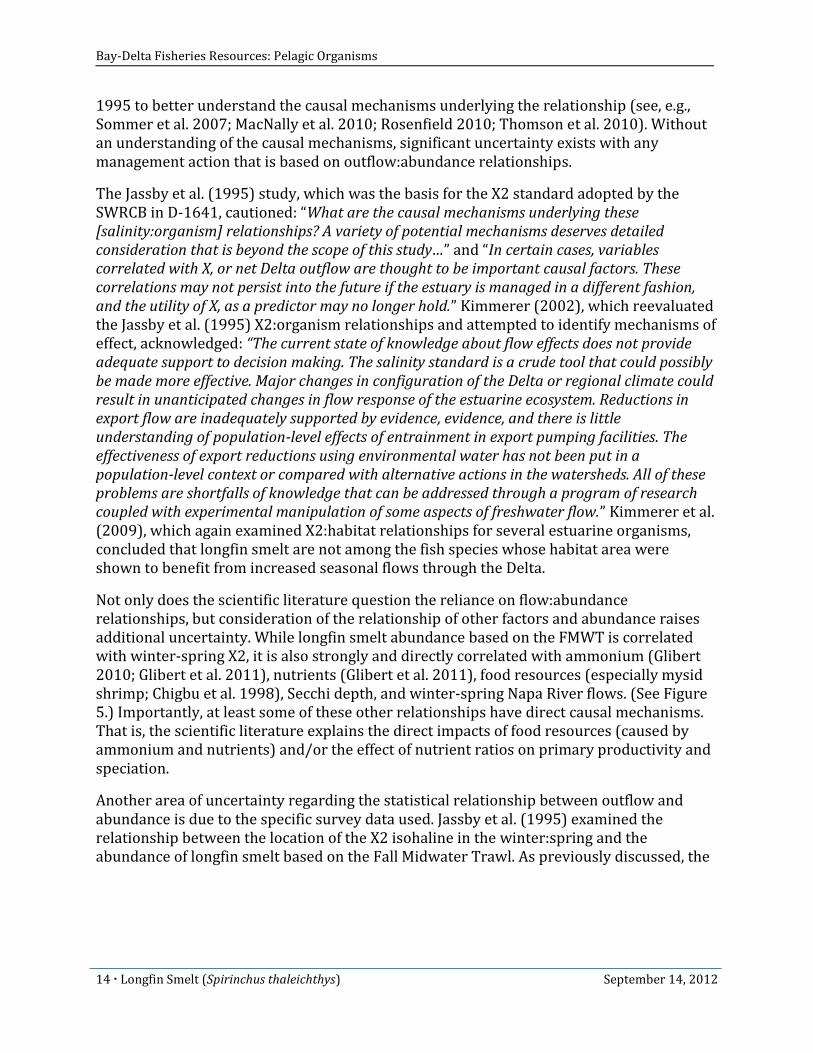
1995 to better understand the causal mechanisms underlying the relationship (see, e.g., Sommer et al. 2007; MacNally et al. 2010; Rosenfield 2010; Thomson et al. 2010). Without an understanding of the causal mechanisms, significant uncertainty exists with any management action that is based on outflow:abundance relationships.
The Jassby et al. (1995) study, which was the basis for the X2 standard adopted by the SWRCB in D-1641, cautioned: “What are the causal mechanisms underlying these [salinity:organism] relationships? A variety of potential mechanisms deserves detailed consideration that is beyond the scope of this study…” and “In certain cases, variables correlated with X, or net Delta outflow are thought to be important causal factors. These correlations may not persist into the future if the estuary is managed in a different fashion, and the utility of X, as a predictor may no longer hold.” Kimmerer (2002), which reevaluated the Jassby et al. (1995) X2:organism relationships and attempted to identify mechanisms of effect, acknowledged: “The current state of knowledge about flow effects does not provide adequate support to decision making. The salinity standard is a crude tool that could possibly be made more effective. Major changes in configuration of the Delta or regional climate could result in unanticipated changes in flow response of the estuarine ecosystem. Reductions in export flow are inadequately supported by evidence, evidence, and there is little understanding of population-level effects of entrainment in export pumping facilities. The effectiveness of export reductions using environmental water has not been put in a population-level context or compared with alternative actions in the watersheds. All of these problems are shortfalls of knowledge that can be addressed through a program of research coupled with experimental manipulation of some aspects of freshwater flow.” Kimmerer et al. (2009), which again examined X2:habitat relationships for several estuarine organisms, concluded that longfin smelt are not among the fish species whose habitat area were shown to benefit from increased seasonal flows through the Delta.
Not only does the scientific literature question the reliance on flow:abundance relationships, but consideration of the relationship of other factors and abundance raises additional uncertainty. While longfin smelt abundance based on the FMWT is correlated with winter-spring X2, it is also strongly and directly correlated with ammonium (Glibert 2010; Glibert et al. 2011), nutrients (Glibert et al. 2011), food resources (especially mysid shrimp; Chigbu et al. 1998), Secchi depth, and winter-spring Napa River flows. (See Figure 5.) Importantly, at least some of these other relationships have direct causal mechanisms. That is, the scientific literature explains the direct impacts of food resources (caused by ammonium and nutrients) and/or the effect of nutrient ratios on primary productivity and speciation.
Another area of uncertainty regarding the statistical relationship between outflow and abundance is due to the specific survey data used. Jassby et al. (1995) examined the relationship between the location of the X2 isohaline in the winter:spring and the abundance of longfin smelt based on the Fall Midwater Trawl. As previously discussed, the

Bay-Delta Fisheries Resources: Pelagic Organisms
September 14, 2012 Longfin Smelt (Spirinchus thaleichthys) · 15
Fall Midwater Trawl misses much of the range of longfin smelt (see Figure 2, Figures 3A-3C).
Another area of caution relates to differences in efficiencies between the fish monitoring surveys. The Fall Midwater Trawl is conducted from September-December using a large net towed mid-channel and obliquely from the bottom to the surface. It primarily samples age-0 longfin smelt. Gear limitations prevent the nets from sampling deeper than
Log FM
WT In
dex
Log Secchi Depth (cm)
Log DIN:TP (wt:wt)
Napa River Flows (cfs)
X2 (km)Log Mysid CPUE (# m3)
A B
C D
E
Log FM
WT In
dex
Log FM
WT In
dex
R2=0.50
R2=0.41
R2=0.07
R2=0.35
R2=0.65
R2=0.53
R2=0.48
R2=0.64
R2=0.37
R2=0.21
Log (mg L-1)
R2=0.27 R2=0.48
F
Figure 5. Relationships between various factors and longfin smelt FMWT Index. (A) Mysid CPUE (#/m3); (B) X2 (km); (C) DIN:TP (wt:wt); (D) 𝑁𝐻4
+ (mg L-1); (E) Secchi Depth (cm); (F) Average Napa River flows Jan-Mar (cfs). Except for X2, all values are log values. Black boxes 1975-1988; red boxes 1988-2011 except for (C), (D) and (E) which are 1988-2010. Black lines 1975-2011 except for (C), (D) and (E) which are 1988-2010; red lines 1988-2011 except for (C), (D) and (E) which are 1988-2010. Bold R2 values are significant at p≤0.05.

Bay-Delta Fisheries Resources: Pelagic Organisms
16 Longfin Smelt (Spirinchus thaleichthys) September 14, 2012
approximately 10-12 m; many monitoring stations now exceed 10-12 m in depth. The Bay Study Otter Trawl is conducted throughout the year using a net designed to travel along the channel bottom picking up demersal organisms (although there may be some residual sampling of other water depths as the net is lowered and raised to the surface) (see state Department of Fish and Game’s website for a description of trawl gear). The Bay Study Otter Trawl and its related Midwater Trawl samples the area covered by the FMWT and also downstream (see Figure 2). The Bay Study is the only one that covers the Central and South Bays, the downstream range of longfin smelt in the estuary.
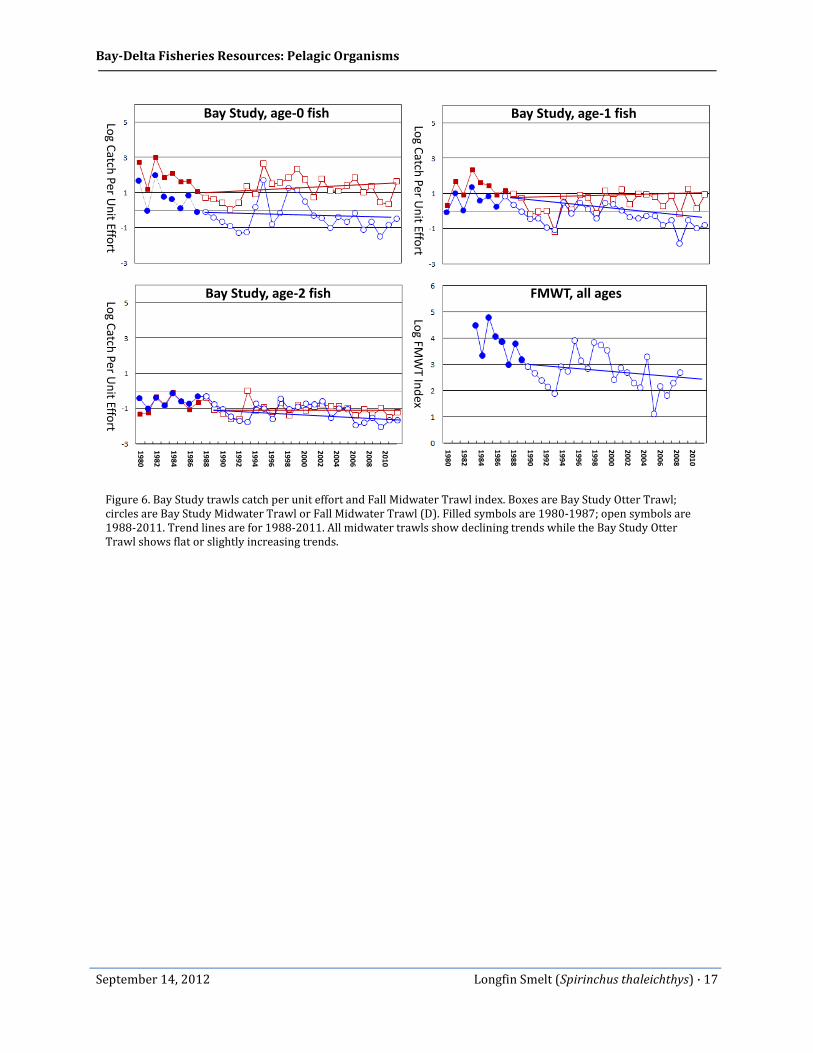
The differences in the fish monitoring surveys can be illustrated by examining the post-1987 period (Figure 6). Much of the longfin smelt population decline appears to have occurred shortly after 1987 (see, e.g., Jassby et al. 1995; Kimmerer et al. 2009), with only moderate declines since then. The Bay Study Midwater Trawl and FMWT indicate a continued but slower rate of decline since approximately 2000, while the Bay Study Otter Trawl indicates a level or slightly rising trend. In addition, it appears that as Secchi depth decreases (turbidity increases) the Otter Trawl catch increases and the Fall Midwater Trawl decreases. The fact that the Bay Study Midwater Trawl, FMWT, and Otter Trawl present a different picture of historical trends indicates there is still uncertainty regarding longfin smelt’s true population status. And, the average depth of the estuary’s bays has been increasing over time (Jaffe et al. 1998; Cappiella et al. 1999). The estuary is in an erosion stage, resulting in deepening channels (Schoellhamer 2011). In addition, the efficiency of the midwater trawls may have decreased over time as the channels have eroded.
Bay-Delta Fisheries Resources: Pelagic Organisms
September 14, 2012 Longfin Smelt (Spirinchus thaleichthys) · 17
Log C
atch Per U
nit Effo
rtLo
g Catch
Per Un
it Effort
Log C
atch Per U
nit Effo
rtLo
g FMW
T Ind
ex
Bay Study, age-0 fish Bay Study, age-1 fish
Bay Study, age-2 fish
19
80
19
82
19
84
19
86
19
88
19
90
19
92
19
94
19
96
19
98
20
00
20
02
20
04
20
06
20
08
20
10
19
80
19
82
19
84
19
86
19
88
19
90
19
92
19
94
19
96
19
98
20
00
20
02
20
04
20
06
20
08
20
10
FMWT, all ages
Figure 6. Bay Study trawls catch per unit effort and Fall Midwater Trawl index. Boxes are Bay Study Otter Trawl; circles are Bay Study Midwater Trawl or Fall Midwater Trawl (D). Filled symbols are 1980-1987; open symbols are 1988-2011. Trend lines are for 1988-2011. All midwater trawls show declining trends while the Bay Study Otter Trawl shows flat or slightly increasing trends.

Bay-Delta Fisheries Resources: Pelagic Organisms
18 Longfin Smelt (Spirinchus thaleichthys) September 14, 2012
[This page intentionally left blank for double-sided printing]

Bay-Delta Fisheries Resources: Pelagic Organisms
September 14, 2012 Delta Smelt (Hypomesus transpacificus) · 19
2.0 Delta Smelt
2.1 Introduction and Summary
A brief summary of factors the State Water Board should consider when evaluating the need for Delta through flows for delta smelt include:
Four life cycle or multi-variable analyses of delta smelt abundance and potential stressors have recently been published (MacNally et al. 2010; Thomson et al. 2010; Maunder and Deriso 2011; Miller et al. 2012). These latter two studies show food resource availability to be a significant driver of delta smelt abundance. Thomson et al. (2010) found weak effects of water clarity and winter exports on delta smelt. MacNally et al. (2010) identified weak effects of predator abundance (largemouth bass) and stronger effects of warmer summer temperatures and duration of water temperatures suitable for spawning. Maunder and Deriso (2011) found that water temperature, prey density, and predators explained the recent decline in delta smelt abundance. And, Miller et al. (2012) found that prey density strongly predicted delta smelt abundance, while water temperature and predators were weakly associated with abundance. None of these models indicate that X2 position in the fall months affects delta smelt abundance.
Delta smelt do not have a statistically significant relationship between species abundance and low-salinity zone volume, winter-spring, summer, or fall outflow.
Feyrer et al. (2011) proposed a statistically significant relationship between species abundance and an index of habitat quality in the fall. Because the equation contains an induced correlation, the index of habitat quality cannot be relied upon as a predictor of delta smelt abundance. Initial analyses suggest the relationship between abundance and the habitat index is not significant. Stated differently, because the index of habitat quality is also a measure of abundance, the relationship provides no support for the importance of the habitat quality index. Irrespective of whether the habitat index equation has a statistically significant relationship with abundance, the fall X2 conceptual model has several deficiencies:
o Data analysis did not include Cache Slough abundance data;
o Studies ultimately focused on a single variable;
o Four life cycle or multi-variable models independently reached the same conclusion: the position of X2 in the fall months has no statistically significant effect on species abundance;
o Suisun Bay is not currently as productive as it once was;
o It is unclear that delta smelt are distributed in relation to the low-salinity zone;
Bay-Delta Fisheries Resources: Pelagic Organisms
20 Delta Smelt (Hypomesus transpacificus) September 14, 2012
o A complete analysis establishing that the position of X2 can serve as a
surrogate for delta smelt habitat needs to be conducted;
o Based on the high flows in 2011, the low Summer Townet Survey results for 2012 would not have been predicted by the fall X2 conceptual model;
o X2 position has not been trending upstream in the fall.
2.2 Delta Smelt Biology
The delta smelt, Hypomesus transpacificus, is a small, almost transparent, euryhaline fish species with a mostly annual life cycle. Most adults die following spawning in the spring, but a few survive a second year (Moyle et al. 1992; Bennett 2005). Young delta smelt emerge in the late winter or early spring, grow rapidly during summer, and reach adulthood in the fall months (Moyle 2002).
Water temperatures over about 25°C are lethal and can constrain delta smelt habitat, especially during summer and early fall (Swanson et al. 2000). The fish has been found as far west as San Pablo Bay and as far upstream on the Sacramento River as the confluence between the Sacramento and Feather rivers (Merz et al. 2011). In most years, the bulk of the population is distributed from Grizzly Bay to the Cache Slough region (Merz et al. 2011). In recent years, monitoring catch in the Cache Slough region, including the Sacramento Deep Water Ship Channel, has demonstrated that this region is vitally important to the population.
2.3 Delta Smelt Habitat
Habitat for a species is generally defined as a geographic area that supports the physical (abiotic) and biological (biotic) resources upon which a species depends. For analytical purposes and for assessing effects, this approach has not been used by the fishery agencies; rather, the location of X2, or the volume of water in the low-salinity zone, has been used to measure habitat changes. Therefore, instead of considering the full range of habitat features that delta smelt utilize, the fishery agencies have generally only looked at one – X2 position. If a habitat surrogate such as X2 position is to be used, there needs to be an accompanying analysis explaining why that single factor accurately predicts changes in the array of habitat features that define species habitat.
Part of the difficulty in defining habitat for delta smelt is that there is limited research on the habitats that delta smelt prefer, as well as a comprehensive understanding of why smelt are distributed as they are, with a large segment of the population occurring in comparatively fresh water year round. There is also much that still needs to be learned about how delta smelt use their environment at various life stages (e.g., whether delta smelt migrate, their mobility at various life stages, habitat preferences, etc.).
There are a variety of researchers investigating the habitat needs and preferences of delta smelt. This research includes work by Hamilton and Murphy. Their work may provide an
Bay-Delta Fisheries Resources: Pelagic Organisms
September 14, 2012 Delta Smelt (Hypomesus transpacificus) · 21
operational description of habitat. The Hamilton and Murphy habitat affinity analysis covers multiple life stages of the delta smelt drawn from time-series data from four trawl surveys, and data on environmental attributes taken from throughout the distribution of the fish. Ranges of conditions acceptable to delta smelt for each of seven environmental attributes were identified. Low turbidity and high water temperatures render a large portion of the estuary seasonally unacceptable to delta smelt. Within areas that experience largely acceptable water quality conditions, patterns of delta smelt occurrences indicate that habitat occurs where deep channels adjoin shallow-water circumstances and extensive patches of emergent vegetation. Habitat suitability indices show that favored environmental circumstances vary with life stages, and delta smelt move as they mature to access suitable areas with environmental attributes in acceptable ranges. Areas that exhibit highest geometrically weighted average HSI values for environmental attributes are displayed on maps, and can be viewed as representing potential priority target areas for habitat restoration efforts.
Hamilton and Murphy (in prep) describe habitat for delta smelt as:
“…areas in the northern and central estuary that are characterized by complex bathymetry, with deep channels close to shallows and shorelines, with little submerged vegetation, but immediately bounded by extensive tidal or freshwater marshlands. Such situations appear to contribute to local production of diatom-rich phytoplankton communities that support calanoid copepods, in particular Eurytemora and Pseudodioptomus, and some cyclopoid zooplankton, which are frequent in the diets of delta smelt. The fish demonstrates affinities for waters that experience salinity in the range of 200-8000 EC, a water transparency (Secchi depth) less than 50 cm, and temperatures below 22 degrees Celsius, with preferred conditions varying somewhat with life stage. Before spawning, delta smelt initiate a diffuse landward dispersal to fresher-water circumstances, and while little is known about the microhabitat conditions required for successful spawning, preferred substrates may include clean cobble or sandy surfaces to which eggs are adhered. Delta smelt frequently are found in open water situations, but less so during spawning. Where pre-spawning delta smelt must disperse greater distances to spawning areas, intervening areas of the estuary, including some areas with conditions less suitable for delta smelt, are included as habitat.”
Sommer and Mejia (in review) largely corroborates the habitat preference findings of Hamilton and Murphy (in prep), although Sommer and Mejia did not perform affinity or similar habitat preference analyses.
While not the definitive work, Hamilton and Murphy (in prep) does provide an initial framework for further study regarding delta smelt habitat preferences. Future habitat restoration projects should consider the design elements proposed by Hamilton and Murphy, thereby testing their habitat models as part of a practical experiment that will assist in defining delta smelt habitat.

Bay-Delta Fisheries Resources: Pelagic Organisms
22 Delta Smelt (Hypomesus transpacificus) September 14, 2012
2.4 Environmental Factors Affecting Delta Smelt
There are four delta smelt life cycle analyses that have been published, each evaluating the available data with the intention of learning more about the environmental stressors driving delta smelt abundance. Each model was created independently of the others and as a result the approaches and data sets used in each analysis differ. The results of these analyses provide insight into the drivers of delta smelt abundance, particularly where there is substantial agreement between the models. The models generally agree that food resources are important, as well as temperature and predation. Fall X2 position was not identified as a driver of abundance.
2.4.1 Nutrients
Recent analyses have demonstrated inhibitory effects of ammonium on the nitrogen uptake and productivity of phytoplankton (Wilkerson et al. 2006; Dugdale et al. 2007; Brooks et al. 2012; Parker et al. 2012a, 2012b) and the effects of an altered N:P ratio on community structure (Glibert 2010; Glibert et al. 2011; Glibert 2012). Both of these effects occur in the Delta, particularly in Suisun Bay, where previously large springtime blooms of phytoplankton occurred but which are currently rare. Evidence that the Delta suffers from the long-term consequences of changes in nutrient forms and ratios is found in the decline of diatoms and dominance of flagellates and cyanobacteria (Brown 2009; Glibert et al. 2011). Major changes in the estuary’s food web have lowered its carrying capacity for higher trophic levels (Kimmerer et al. 2000). Changes in nutrient forms and ratios offer a plausible biological mechanism for trophic changes (Glibert 2010; Glibert et al. 2011). Evidence of glycogen depletion demonstrates that delta smelt in at least some regions of the estuary are food limited (Bennett 2005; Bennett et al. 2008). A decline in average length at age is further evidence for food shortages (Sweetnam 1999; Bennett 2005). Glibert et al. (2011) found a relationship between phosphorus and length at age, suggesting a stoichiometric explanation. (See expanded discussion of nutrients in PWA submittal for ecosystem change and low salinity zone workshop and presentation by Dr. Patricia Glibert.)
2.4.2 Declines in Primary Productivity
Significant changes to the estuary’s food web have occurred, particularly when the Amur River clam became abundant after 1987 (Carlton et al. 1990; Alpine and Cloern 1992; Kimmerer et al. 1994; Feyrer et al. 2003; Kimmerer 2006; Feyrer et al. 2007; Greene et al 2011). Kimmerer et al. (1994) reported a 69 percent drop in chlorophyll concentration after the Amur River clam became abundant. Because it consumes diatoms and copepod nauplii, P. amurensis has played a role in the restructuring of the plankton community in the estuary (Carlton et al. 1990; Kimmerer et al. 1994). Greene et al. (2011) found that P. amurensis also feeds heavily on microzooplankton (e.g., ciliates), which are a food resource for macrozooplankton (e.g., copepods). As a result, the Amur River clam may disrupt the link between these trophic levels (Greene et al. 2011).
The Amur River clam has a wide tolerance for salinity, being found in the full range of bay salinities (<1 to 33‰) (Carlton et al. 1990). The euryhaline Asiatic bivalve Corbicula

Bay-Delta Fisheries Resources: Pelagic Organisms
September 14, 2012 Delta Smelt (Hypomesus transpacificus) · 23
fluminea invaded the estuary in the 1940s. On average, it has been more abundant in the central Delta and Suisun Bay regions after wet years, while the Amur River clam has been more abundant, mostly in the Suisun Bay region, in dry years (Peterson and Vayssières 2010). This fact has significant implications to species recovery, since it is likely that changes in salinity simply shifts the dominant benthic bivalve community from one species to another (Peterson and Vayssières 2010).
A second driver of change to the estuary’s food web came into play when increasing anthropogenic discharges of nitrogen were coupled with reductions in phosphorus loading in the estuary (Van Nieuwenhuyse 2007; Glibert et al. 2011). Changes in nutrient forms and ratios caused stoichiometric changes in lower trophic levels, away from a diatom-based food web and toward a less efficient bacterial food web (Glibert 2010; Glibert et al. 2011). According to Glibert (2010), the decline in diatoms, which began in 1982, is highly correlated with the increase in ammonium loading. (Delta smelt abundances experienced a step change in 1981-1982 (Kimmerer et al. 2009)). Diatoms prefer – and, under some conditions, physiologically require – nitrate over ammonium, unlike many other algae which preferentially use ammonium over other nitrogen forms. As nitrate became less available relative to ammonium in Suisun Bay, a competitive advantage shifted to phytoplankton taxa that can more efficiently use reduced forms of nitrogen. Among the phytoplankton groups that replaced diatoms in the estuary, cyanobacteria and many flagellates show a preference for chemically reduced forms of nitrogen (Berg et al. 2001; Glibert et al. 2004, 2006; Brown 2009).
Today, the Suisun Bay region is dominated by cyanobacteria and flagellates (Brown 2009). Observed changes in zooplankton composition are consistent with ecological stoichiometric principles, which predict that consumers that successfully sequester the nutrient in lesser supply relative to their needs should dominate and, in so doing, may stabilize at a new stable state (Glibert et al. 2011). Ecological stoichiometry theory predicts that systems that shift from low to high nitrogen-to-phosphorus ratios should sustain shifts from planktivores to piscivores or omnivores (Sterner and Elser 2002). As mentioned previously and in the PWAs’ submittal, Ecosystem Changes to the Bay-Delta Estuary: A Technical Assessment of Available Scientific Information, dated 16 August 2012, this is clearly what has happened in the Delta. Glibert et al. (2011) reviews several other estuaries where nutrient changes have caused similar effects on estuarine biota.
Combined, the effect on the estuary’s food web has been severe – its apparent carrying capacity for multiple desired fish species has been reduced as the effects of an altered food web have cascaded upward to higher trophic levels (Kimmerer et al. 2000). Additional Delta through flows are unlikely to affect abundance of invasive bivalves, which shift their location in the estuary depending on salinity. Glibert (2010) points out that the current strategy of salinity management will likely show little beneficial effect on phytoplankton, zooplankton, or fish.
2.4.3 Predation
Predation may be an important stressor effecting delta smelt abundance. Maunder and Deriso (2011) found that predation was one of the main variables explaining variations in

Bay-Delta Fisheries Resources: Pelagic Organisms
24 Delta Smelt (Hypomesus transpacificus) September 14, 2012
delta smelt abundance, but MacNally et al. (2010) and Miller et al. (2012) described weaker effects of predation. It is known that striped bass prey on delta smelt due to their ubiquitous distribution in the estuary (Nobriga and Feyrer 2007), although it is uncommon in the gut contents of striped bass (Bennett 2005). Inland silversides Menidia berrylina are usually collected in areas where delta smelt spawn and may prey on their eggs and larvae (USFWS 1996; Bennett and Moyle 1996; Bennett 2005). Additionally, inland silversides may compete with juvenile and adult delta smelt for resources (Bennett 1996; 2005). Bennett and Moyle (1996) describe a negative relationship between silverside abundance and delta smelt abundance, particularly in dry years. Using qPCR genetic techniques, Cavallo et al. (2011) found DNA from delta smelt in the digestive tracts of 37% of the inland silversides collected during a Spring Kodiak Trawl survey. Further qPCR research confirms that inland silversides are a significant predator on delta smelt (UCD 2012). The chameleon goby Tridentiger trigonocephalus and yellowfin goby Acanthogobius flavimanus may also prey on delta smelt eggs and larvae and interfere with recovery of the species (USFWS 1996).
Although inland silversides were found to be the most prolific predator on delta smelt, ongoing predation research at U.C. Davis reveals that a greater number of species are now known to prey on delta smelt, including Chinook salmon, Siberian shrimp Exopalaemon, perch and sunfish, largemouth bass, Sacramento pikeminnow, and threadfin shad. Predators were caught both in near-shore and open waters (UCD 2012).
2.4.4 Water Temperatures
Water temperature was identified by Maunder and Deriso (2011) as a significant determinant of delta smelt abundance. The results of Maunder and Deriso (2011) suggest water temperatures throughout the estuary are becoming less hospitable for delta smelt. MacNally et al. (2010) found lesser effects of warmer summer temperatures and duration of water temperatures during spawning. Bennett (2005) noted that longer spawning periods in cooler years can produce more cohorts and on average higher numbers of adult delta smelt. In particular, warmer summer water temperatures have made the south Delta, especially the San Joaquin region, inhospitable for delta smelt (Nobriga et al. 2008). Indeed, since 1978, the Summer Townet Survey has experienced near-zero catches of delta smelt in the San Joaquin region (Nobriga et al 2008). Nobriga et al. (2008) found that summer water temperature acted somewhat like a switch, with capture probability decreasing abruptly at about 24oC. Wagner et al. (2011) predict that climate change will increase the number of days above delta smelt’s thermal maxima (especially along the Sacramento River) and may influence a shift to earlier spawning; however, as presented in the PWAs’ submittal, Ecosystem Changes to the Bay-Delta Estuary: A Technical Assessment of Available Scientific Information, dated 16 August 2012, the scientific literature supports a conclusion that reservoir releases do not influence water temperatures in the Delta or downstream.
Water temperatures throughout most of the estuary are governed to a great extent by air temperature (Kimmerer 2004; Jassby 2008; Cloern et al. 2011). Therefore, while climate change models predict that water temperatures will continue to increase, reservoir releases are unable to moderate Delta water temperatures.

Bay-Delta Fisheries Resources: Pelagic Organisms
September 14, 2012 Delta Smelt (Hypomesus transpacificus) · 25
2.4.5 Entrainment
While Maunder and Deriso (2011) noted entrainment of adult delta smelt as weakly related to its abundance2, numerous scientific articles reference the potential deleterious effects of entrainment in water operations facilities on delta smelt (Moyle 2002; Dege and Brown 2004; Bennett 2005; Kimmerer 2008). Kimmerer (2008) is the only article that attempts to quantify these effects. Kimmerer estimated that entrainment losses may be 0-40 percent of the population throughout the winter and spring, but entrainment effects on year-over-year abundance were found to be small and dwarfed by the 50-fold variation in summer-fall survival. Miller (2011) discusses several upward biases in Kimmerer’s (2008) analyses for delta smelt. Kimmerer (2011) responded to Miller (2011) and adjusted his estimates down. Grimaldo et al. (2009) acknowledge that there is no evidence of entrainment effects on the population of delta smelt.
In its delta smelt BiOp, FWS undertook an analysis of raw salvage data to justify controls on water project operations to limit reverse flows in Old and Middle Rivers (OMR). There have been criticisms of the FWS’ OMR analysis, including a concern with the FWS’s failure to normalize the data. The FWS has since addressed this specific concern by normalizing its data in its recent submittal to the State Board for the ecosystem change and low salinity zone workshop. Other analysis, however, have showed that the FWS’ OMR approach is not necessarily the best way to management SWP-CVP project operations to avoid large delta smelt entrainment events. More specifically, Deriso (2011) demonstrated that entrainment of spawning adults can be predicted by including three-day turbidity averages into the trigger for OMR flow. Incorporation of the three-day turbidity averages provides an equivalent level of protection at far less water cost than the FWS’s analysis. In essence, the largest entrainment effects are avoided, consistent with Kimmerer’s (2008) contention that entrainment effects are episodic, and with Grimaldo et al. (2009), which found that delta smelt salvage happens within days of first flush turbidity events.
FWS’ submission, Technical Staff Comments to the State Water Resources Control Board re: the Comprehensive (Phase 2) Review and Update to the Bay-Delta Plan, dated 16 August 2012, contains substantial information on entrainment and the influence of turbidity on entrainment. Its annual salvage vs. OMR graphs (USFWS submittal, Figures 5-8, pp. 8-11) indicate that only in 1996, 1999, and 2004 does a discernible pattern exist; however, there is not agreement among the graphs on the level of negative OMR flow that induces higher levels of entrainment. In fact, in 2004 the pattern suggests that strongly positive OMR flow induces higher entrainment. USFWS concludes that there is no particular OMR flow that assures entrainment will or will not occur (USFWS submittal, p. 6, 11). The Deriso (2011) OMR and turbidity trigger analysis is not countermanded by USFWS’s submission.
USFWS’s submission critiques the Maunder and Deriso (2011) life cycle model results on entrainment effects, suggesting it corroborates the Kimmerer (2008, 2011) contention that entrainment effects may be sporadically significant. USFWS failed to note that the entrainment estimates used in Maunder and Deriso (2011) are based on Kimmerer’s 2008
2 Thomson et al. (2010) found winter exports to be a weak predictor of delta smelt abundance.

Bay-Delta Fisheries Resources: Pelagic Organisms
26 Delta Smelt (Hypomesus transpacificus) September 14, 2012
paper and extrapolations thereof. Therefore any interpretation USFWS makes about sporadic significance is really a conclusion based on Kimmerer’s (2008, 2011) work.
USFWS correctly notes that Kimmerer (2008, 2011) assumes no compensatory density-dependent effects for his entire sequence of years from 1980-2006. This assumption is questionable given that delta smelt abundance was recorded at very high levels during the 1990s. If density dependence exists at high abundance, then several successive high abundance years would effectively “reset” the clock and erase any effect of past abundance patterns. Even ignoring this problem, there are other issues with the Kimmerer (2008) analysis. If the population is at a low level of abundance, then with conventional stock production models, such as the Ricker recruitment model, it is true that substantive compensatory density-dependence is unlikely to be occurring; however, it is also true that natural survival is maximized at a low level of abundance. The long-term equilibrium reduction in a population due to a constant annual mortality (e.g., entrainment) is dependent on the maximum intrinsic rate of growth. For example, in a Ricker model, expressed as B(t+1) = B(t)(1-F)exp(a-b*B(t)), the percent reduction in equilibrium abundance due to a given constant annual mortality “F” is equal to –ln(1-F)/a (Lawson and Hilborn 1985). The parameter “a” is the maximum intrinsic rate of growth. Note that the long-term equilibrium abundance does not depend on initial population size.
If one were to fit a Ricker stock production model (which incorporates density-dependence) to the years of data analyzed by Kimmerer (2008, 2011) then one would be able to extract the “a” parameter estimate and use the formula provided above to calculate the long-term equilibrium population reduction for a given assumed average entrainment loss. Deriso (2009) did such an exercise using Ricker model parameters obtained by applying the Ricker model to 1987-2006 data (Deriso 2009, Appendix 1) to obtain the estimate a=0.92. Taking the same average entrainment loss of 10% as used by Kimmerer (2008, 2011), the long-term equilibrium abundance is calculated to be just 11% lower than if no entrainment occurred. This is far less than the 10-fold reduction in abundance estimated by Kimmerer (2008, 2011).
USFWS also failed to note that, according to Maunder and Deriso (2011), even with no entrainment the population of delta smelt would have been predicted to decline to a very low level of abundance. As stated in Maunder and Deriso (2011): “Entrainment is estimated to have only a small impact on the adult abundance in either the lowest AICc model, which uses the estimated adult entrainment coefficient and the juvenile entrainment coefficient is zero, or the alternative model, in which both the juvenile and adult entrainment coefficients are set to one.”
USFWS’s submittal (p. 30) references Kimmerer (2008) to support its contention that the agreement between Kimmerer’s entrainment estimates and particle tracking model (PTM) simulations based on the 20-mm Survey demonstrates that PTM provides a reliable estimate of entrainment for fish inhabiting the San Joaquin River and south Delta. Kimmerer’s (2008) results are certainly not evidence that PTM accurately predicts entrainment. As Kimmerer (2008, p. 22-23) himself wrote: “The variation in annual loss was related to flow conditions …, but this relationship is tautological, since Old and Middle River flow was used explicitly in the calculations,” and “The relationship of proportional loss to Old

Bay-Delta Fisheries Resources: Pelagic Organisms
September 14, 2012 Delta Smelt (Hypomesus transpacificus) · 27
and Middle River flow (by assumption) and inflow and export flow guarantees a relationship with X2.” That the PTM tracks OMR flow and Kimmerer’s (2008) estimates also track OMR flow is by no means validation for the use of PTM as a predictor of entrainment.
The fact that the delta smelt decline can be explained by environmental covariates and not entrainment is shown in Figure 7 of Maunder and Deriso (2011), reproduced below as Figure 7, where the “alternative model” (right panel) which does not contain entrainment clearly demonstrates.
2.4.6 Water Clarity
Thomson et al. (2010) found that changes in water clarity weakly predicted delta smelt abundance. Researchers infer that because delta smelt are thought to have poor vision, turbid water improves visual acuity when seeking out prey (Boehloert and Morgan 1985 in Lindberg et al. 2000; Baskerville-Bridges et al. 2004) and provides some protection from predators (Moyle 2002). Delta smelt appear to prefer turbid waters during all life stages.
It is widely acknowledged that turbidity levels in the estuary have declined. One important causal factor is depletion of the erodible sediment pool by the late 1990s (Schoellhamer 2011). Evidence of depletion is seen in the 36% step decrease in suspended sediment concentration beginning in 1999 (Figure 8).
A
C
B
D
Ad
ult relative ab
un
dan
ce (x10
3)A
du
lt with
ou
t covariates –
adu
lts with
covariates
Figure 7. Estimates of abundance with and without covariates (coefficients of the covariates set to zero) (top panels) and ratio of the two with 95% confidence intervals (bottom panels, y axis limited to show details) from the lowest AICc (left panels) model that has Ricker survival from juveniles to adults (black lines) and a Beverton-Holt stock-recruitment relationship (gray lines) and the alternative model (the model that has the fewest covariates and the AIC is less than two AIC units greater than the lowest AIC model) (right panels).

Bay-Delta Fisheries Resources: Pelagic Organisms
28 Delta Smelt (Hypomesus transpacificus) September 14, 2012
Schoellhamer (2011) describes riprapping of the banks of the lower Sacramento River and sediment trapping behind the rim dams and in flood control bypasses as contributors to the decreased sediment supply to the estuary, and notes that the sediment threshold that was crossed in 1999 is coincident with the POD decline that occurred immediately
thereafter. Delta smelt require turbid water for successful feeding and predator avoidance (Boehloert and Morgan 1985 in
Lindberg et al. 2000; Moyle 2002; Baskerville-Bridges et al. 2004).
Phytoplankton also contribute to turbidity levels. Numerous references in the scientific literature point to filtering of the water column by the Amur River clam P. amurensis leading to reduction of phytoplankton standing stock (see, e.g., Carlton et al. 1990; Alpine and Cloern 1992; Feyrer et al. 2003; Kimmerer 2006; Greene et al 2011). While phytoplankton is usually only a small component of suspended particulate matter in the Bay-Delta and northern San Francisco Bay (Cloern 1987; Jassby et al. 2002), invasion by the Amur River clam P. amurensis contributed to water clarity of the Suisun Bay region. Analysis of the available data shows that chlorophyll and turbidity levels tracked each other in the summer and fall prior to 1987 (Figure 9).
Absent an erodible sediment pool, the main contributors to turbidity are wind-wave sediment resuspension and rainfall runoff from the watersheds below reservoirs. Wind-wave resuspension is greatest in spring and summer (Schoellhamer 2011) while rainfall runoff is limited primarily to the rainy season. Turbidity pulses are associated with rainfall runoff events (Grimaldo et al. 2009).
Figure 8. Suspended sediment concentration, mid-depth, Point San Pablo. The vertical dashed line indicates when the step decrease occurred. From Schoellhamer (2011). The decline in suspended sediment is obvious starting in 1999.

Bay-Delta Fisheries Resources: Pelagic Organisms
September 14, 2012 Delta Smelt (Hypomesus transpacificus) · 29
Resuspension is a major source of turbidity levels in both San Pablo and Suisun Bay during the summer, due to reliable onshore winds (Ruhl and Shoellhamer 2004; Ganju et al. 2009; Ganju et al. 2011). The erodible sediment supply is greater in the shallows than in the deeper channels, resulting in greater resuspension in these areas (Ruhl and Schoellhamer 2004). Unlike the Suisun Bay region, which is in an erosion phase (depletion of sediment), the Cache Slough region is in a depositional phase (accrual of sediment) (Morgan-King 2012 IEP Science Workshop). The Cache Slough complex is a backwater region with dead-end channels that trap sediments. The broad shallows are subject to wind-wave resuspension, keeping the region’s turbidity at levels satisfactory for delta smelt during all life stages.
2.4.7 Physical Habitat
Hamilton and Murphy (in prep) examined seven environmental attributes and six life stages for selection by delta smelt and found that its habitat includes areas characterized by complex bathymetry (with deep channels close to shallows and shorelines), with little submerged vegetation, but immediately bounded by tidal or freshwater marshlands (which appear to contribute to local production of diatom-rich phytoplankton communities that support adequate levels of delta smelt prey). And, they found that the full array of physical and biotic attributes necessary to consistently support delta smelt, set in spatial context with necessary adjacency and adequate temporal availability, is found in relatively limited areas of the contemporary estuary. Candidate areas for restoration of large emergent wetlands include eastern Montezuma Slough, the Sacramento River below Isleton, and the Cache Slough area. Furthermore, it appears that habitat conditions in areas in north Bay and Montezuma Slough could be improved with channel modifications, and increasing the
Turb
idity (N
TU)
Log D
iatom
Den
sity (cells/m-3)
and
Log C
hlo
rop
hyll-a
(µg
/L)
Figure 9. Historical trends in turbidity (black line), diatom density (red line), and chlorophyll-a (blue line) for Suisun Bay stations D4, D6, D7, D8. Turbidity and both diatom density and chlorophyll-a tracked fairly well until 1988. The pattern has become more divergent since then.

Bay-Delta Fisheries Resources: Pelagic Organisms
30 Delta Smelt (Hypomesus transpacificus) September 14, 2012
availability of areas of shallow water in Grizzly Bay, Suisun Bay, and some stretches of the Sacramento River could improve habitat in those areas for young delta smelt.
Less than five percent of the Bay-Delta’s historical wetlands and marshlands remain (TBI 1998; Brown 2003). Historically, larger river channels were intermittently connected to nearby intertidal wetlands by a series of distributary channels that occasionally joined the river channels. Diking of distributary channels and conversion of wetlands to agriculture (and, to a lesser extent, urban and suburban development) eliminated most of the connecting distributary channels. The loss of the historical wetlands resulted in significant reductions in allochthonous carbon loading (e.g., from soil and plant material) in the estuary (TBI 1998). Increasing the areal extent of wetlands has the potential to restore at least some of the supply of allochthonous (soil generated) carbon (TBI 1998), which is an important nutrient for the lower trophic levels of the food web. Recognizing the need for additional wetlands habitat, the Bay Delta Conservation Plan anticipates the creation of a significant area of wetlands (BDCP 2012).
2.4.8.1 Conceptual Model Suggesting a Relationship Between the Low-Salinity Zone and Delta Smelt Abundance
The only X2 (low-salinity zone) conceptual model being discussed in recent years relates to a potential relationship between delta smelt abundance and X2 in the fall months. Until perhaps very recently, delta smelt conceptual models have not included spring X2. This has likely been the case because delta smelt are not one of the species with a known abundance relationship with winter-spring outflow (see, e.g., Jassby et al. 1995; Kimmerer 2002; Kimmerer et al. 2009), and because the current Delta Plan already contains spring outflow requirements. To a certain extent, the conceptual models may have changed very recently with the review of the results of the Fall Low-Salinity Habitat (FLaSH) studies, which has resulted in a suggestion that X2 location is biologically important to delta smelt all year, and thereby de-emphasizing fall as a season with special biological meaning. It is premature to consider whether a new conceptual model of a year-round X2 should be considered because the FLaSH study results are preliminary and largely inconclusive (FLaSH, 2012, p. 2). Irrespective of the preliminary FLaSH results, the fishery agencies have thus far only proposed an X2 in the fall months for delta smelt, so that is the only season addressed in detail in this analysis.
The conceptual model regarding fall X2 is described in three papers: Feyrer et al. (2007), Feyrer et al. (2008), and Feyrer et al. (2011). Feyrer et al. 2008 is unpublished but it is relevant to the discussion because a preliminary draft was considered SWRCB Flow Report.
There is new information relating to the fall X2 conceptual model that raises substantial questions about certain statements contained in the SWRCB Flow Report in the following areas: (1) “[t]he amount of habitat available to delta smelt is controlled by freshwater flow and how that flow affects the position of X2 (emphasis added);” (2) there is a demonstrated relationship between fall X2 position and abundance; and (3) the quantity of “habitat” that becomes available to delta smelt when fall X2 is positioned at particular geographic locations provides abundance benefits. (SWRCB Flow Report, pp. 108-110). These
Bay-Delta Fisheries Resources: Pelagic Organisms
September 14, 2012 Delta Smelt (Hypomesus transpacificus) · 31
statements do not accurately reflect the current state of the science, and would have to be highly qualified and labeled as uncertain and requiring further investigation.
The areas of concern and uncertainty can be summarized as follows:
2.4.8.1.1 The Current Data Does Not Support a Direct Relationship Between the Location of X2 in the Fall and Delta Smelt Abundance
Feyrer et al. (2007) investigated the relationship between certain water quality variables (salinity, turbidity and temperature) and delta smelt occurrence (distribution). Feyrer et al. (2007) also used a stock recruit model to examine the effect of those water quality variables on abundance between the pre-adult stage (FMWT) and subsequent juvenile stage (TNS). The fish abundance data was divided into two separate time periods – 1968-1986 and 1987-2004. For 1987-2004 (but not 1968-1986), incorporating either salinity alone, or salinity in combination with turbidity, improved the fit of the model and explained more of the variance in the data set (Feyrer et al. 2007, pp. 727-728). Using Akaike’s Information Criteria, the model with the water quality covariates was preferred.
Feyrer et al. (2008) sought to expand upon the analysis in Feyrer et al. (2007) by chaining together a series of modeled relationships, ultimately linking fall X2 position with abundance. This modeling chained together: (1) water quality variables and presence/absence (or occurrence) of smelt; (2) probabilities of occurrence and quantitative measures of suitable abiotic habitat; (3) suitable abiotic habitat area and X2 position; and (4) suitable abiotic habitat (or X2) and subsequent abundance from pre-adults (FMWT) to juveniles (TNS) the following year (see also Delta Smelt BiOp, pp. 235-236, 268 (Figure E-22)). Feyrer et al. (2008) also developed several future outflow/fall X2 scenarios and modeled the effects of those different scenarios on projected smelt abundance.
The Feyrer et al. (2008) unpublished manuscript was substantially modified and evolved into the Feyrer et al. (2011) article, which was subsequently published. The statistical analysis in Feyrer et al. 2008 had been the subject of quite a bit of scientific debate, which included a critical review in the March 2010 National Research Council Report. The data analysis of fall X2 position and abundance in Feyrer et al. (2008) was ultimately dropped from the Feyrer et al. (2011) article.
This discussion of Feyrer et al. 2007 and 2008 is particularly relevant to these State Water Board proceedings because the SWRCB Flow Report contains the above-described analysis that Feyrer et al. subsequently modified.
2.4.8.1.2 There is Uncertainty Associated With the Method Used to Develop the Fall “Habitat Index”
The revised Feyrer et al. (2008) analysis is contained in Feyrer et al. (2011). This revised analysis linked together multiple relationships, e.g., water quality variables and presence/absence of delta smelt, probability of occurrence and a habitat index, and the habitat index and the average location of X2 in the fall months. The relationship that is proposed in Feyrer et al. (2011) is not a direct relationship between X2 and abundance, as

Bay-Delta Fisheries Resources: Pelagic Organisms
32 Delta Smelt (Hypomesus transpacificus) September 14, 2012
was proposed in Feyrer et al. (2008) (unpublished); it is a relationship between abundance and a habitat index. Feyrer et al. (2011) uses this abundance-habitat index relationship to support the premise that delta smelt habitat carrying capacity has declined as a result of changing X2 position in the fall. Feyrer et al. (2011) concluded that the habitat index was reduced from 1967 through 2008, and under certain future development and climate scenarios. There are several uncertainties associated with the analysis as presented in Feyrer et al. 2011.
2.4.8.1.2.1 Data Analysis Is Circular
The relationship between X2 and abundance in Feyrer et al. (2011) depends on a correlation between Feyrer et al.’s habitat index and FMWT abundance. This correlation is graphically shown in Figure 2C of Feyrer et al. (2011); however, this correlation appears to be an induced correlation. The habitat index was constructed using FMWT abundance data and then the habitat index was correlated against FMWT abundance. Consequently, both the X and the Y axes of the graph use a common data set. When the same data are being compared on both axes, some degree of statistical correlation will be induced.
The habitat index:FMWT correlation should therefore be evaluated in light of the potential for induced correlation. Dr. Ken Burnham has estimated that the induced correlation could lead to a baseline correlation of R2=0.56. Feyrer’s habitat index:FMWT correlation has an R2=0.51, which suggests that the correlation between the habitat index and FMWT could be almost entirely induced.
2.4.8.1.2.2 Data Analysis Did Not Include Cache Slough Abundance Data
Feyrer et al.’s (2011) analyses did not include the delta smelt residing wholly in freshwater in the Cache Slough region. The FMWT did not begin sampling in the Cache Slough region until 2009. Feyrer et al.’s water quality:presence/absence analyses were all done using FMWT data before that survey began sampling in the Cache Slough region (Feyrer et al. 2007 used FMWT data up to 2004; Feyrer et al. 2008 used data up to 2006; Feyrer et al. (2011) used data up to 2008). Since the Feyrer et al. conceptual model is that salinity is the driver of delta smelt distribution, not using the data from fresher areas, particularly the Cache Slough region where a large segment of the population reside, may have affected the results of the data analysis.
Delta smelt inhabit the Cache Slough region year-round; their presence there is not a sampling artifact (Sommer et al. 2011; Delta Science Program Science News, April 2010).
The size of the delta smelt population in the Cache Slough region is substantial, comprising as much as 42% of the current monitoring catch since 2005 (Sommer et al. 2009; Huggett 2010). Sommer et al. (2009) also noted that delta smelt in the Cache Slough region are “a fairly substantial portion of the population as about 42% of the Spring Kodiak Trawl delta smelt catch during March-May since 2005 was in the Cache Slough complex”. Hamilton et al. (in press)recognized that the data suggest that the delta smelt population in Cache Slough may be a separate subunit of the population, and that current fish abundance surveys may not be sampling the full range of the species. Nearly 60% of the delta smelt

Bay-Delta Fisheries Resources: Pelagic Organisms
September 14, 2012 Delta Smelt (Hypomesus transpacificus) · 33
captured in the 2011 Summer Townet Survey were collected in the Cache Slough Complex. (Osborn 2012).
2.4.8.1.2.3 The Feyrer et al. Studies Focused on Abiotic Variables
The Feyrer et al. analyses only consider three abiotic variables – salinity and turbidity (Secchi depth) – and excluded all of the other abiotic and biotic variables that make up a species’ habitat and affect its abundance. The Feyrer et al. (2007) article acknowledged that biotic variables such as predation, food supply, and competition played a major role in distribution and habitat of smelt, but these variables were not included in the analysis.
2.4.8.1.2.4 Life Cycle Modeling Shows That the Location of Fall X2 Has No Significant Effect on Delta Smelt Abundance
Several life cycle or multi-variable models have been conducted to try to explain the abundance patterns of delta smelt, including the fall season.
Thomson et al. (2010) used change-point analysis to investigate step changes in nearly two dozen candidate environmental factors which they surmised might have corresponded with the dramatic drop in delta smelt numbers that was sustained for much of the past decade, including the mean location of X2 in the fall months. No signal of effects on delta smelt from the location of X2 in the fall months was identified.
MacNally et al. (2010) used multivariate autoregressive modeling to evaluate 54 fish-environmental factor relationships, including the factors considered by Thomson et al., and found generally weak relationships, but enhanced signals from food availability and the position of the low-salinity zone in the spring.
Maunder and Deriso (2011) used a multistage life-cycle model that varied levels of presumptive density dependence to consider environmental factors acting on delta smelt abundance and found a substantive deterministic relationship to be the availability of the fish’s food resources. The location of X2 in the fall months was not found to be a predictor of delta smelt abundance.
The environmental data in that study were shared in a multi-variable regression analysis by Miller et al. (2012), who asserted that their specification of environmental variables was spatially and temporally rectified to better reflect within-Delta patterns of environmental variation. They found food availability to be a major signal and predation and entrainment to be minor signals, with overarching effects from density dependence.
Like Thomson et al., none of the latter three studies found evidence of a relationship between the location of X2 in the estuary in the fall months and delta smelt abundance. There is no evidence that can be drawn from those studies of environmental stressors to support the link between the location of X2 in the estuary in the fall months and trends in delta smelt population numbers.
Because the location of the low-salinity zone in the estuary has only a weak spatial relationship with the extent and quality of delta smelt habitat (NRC 2012), and because

Bay-Delta Fisheries Resources: Pelagic Organisms
34 Delta Smelt (Hypomesus transpacificus) September 14, 2012
there is no established connection between the location of the low-salinity zone in the estuary and the abundance of delta smelt (Thomson et al. 2010; MacNally et al. 2010; Maunder and Deriso 2011; Miller et al. 2012), the central premise of the fall X2 conceptual model has not been supported. Therefore, the two critical assertions of the Feyrer papers – that the location of the low-salinity zone in the estuary is linked to delta smelt population size (or performance or production) and that the extent of the low-salinity zone functionally represents the extent of habitat for delta smelt – deserve closer examination.
2.4.8.1.2.5 The Conceptual Model Suggesting a Biological Rationale for Locating the Position of X2 near Suisun Bay Has Not Been Sufficiently Investigated
The fall X2 conceptual model is based on the idea that the action will redistribute delta smelt downstream into Suisun Bay, thereby increasing opportunities for feeding and rearing (USFWS 2008). This model further contemplates that the redistribution of delta smelt downstream into Suisun Bay in the fall months will reduce the vulnerability of the fish to predation (USBR 2011). Available data do not support the conceptual model. The data do not reflect a relationship between the location of X2 in the Sacramento-San Joaquin Delta and the population dynamics of delta smelt or the location and extent of the low-salinity zone and the extent of suitable habitat for the delta smelt. The conceptual model suggesting that Suisun Bay is the optimum habitat for delta smelt is contrary to an earlier conceptual model that Suisun Bay is a poor habitat area for delta smelt (the so-called “bad Suisun Bay” model). The bad Suisun Bay model became one of two conceptual models favored several years ago (Jones and Stokes 2006; Armor et al 2007; House Committee on Resources 2007). It also appeared in the Interagency Ecological Program’s 2006-2007 POD work plan and its 2005 POD synthesis report. The conceptual model recognized that non-native species are causing detrimental changes to the Suisun Bay food web. Among those, the Amur River clam has had the largest known effect, greatly reducing primary production (see PWA submittal, Ecosystem Changes to the Bay-Delta Estuary: A Technical Assessment of Available Scientific Information, dated 16 August 2012, pp. 2-20). Introductions of various zooplanktons eaten by young fishes have further changed the pathways from primary production to fish (Baxter et al. 2010; Gould and Kimmerer 2010). Due to these known changes, and possibly others, the bad Suisun Bay conceptual model posits that Suisun Bay is a less suitable nursery than it used to be. The current fall X2 conceptual model based on work by Feyrer et al. (2007, 2011) does not consider food availability or quality. The PWAs’ submittal, Ecosystem Changes to the Bay-Delta Estuary: A Technical Assessment of Available Scientific Information, dated 16 August 2012, pp. 2-2 to 2-42, describes changes to the Delta’s and the low-salinity zone’s food web and how these have cascaded from primary productivity to higher trophic levels.

Bay-Delta Fisheries Resources: Pelagic Organisms
September 14, 2012 Delta Smelt (Hypomesus transpacificus) · 35
2.4.8.1.2.6 The Conceptual Model Suggesting That the Low-Salinity Zone Should Be Located in Any Particular Location is Based on the Model That Delta Smelt Distribution Changes in Relation to the Low-Salinity Zone
The monitoring data does not necessarily support the conceptual model that delta smelt are distributed in relation to the low-salinity zone or that the delta smelt population’s distribution can be changed by moving the low-salinity zone downstream.
Distributional data demonstrate that delta smelt inhabit areas of the estuary that are characterized by a wide range of salinity from freshwater to 10 psu and higher. Further, a recent affinity analysis3 (Hamilton and Murphy in prep) finds that the species is not limited by salinity and flows to the areas it occupies. Rather, other environmental factors define delta smelt habitat and the survival and future recovery of the species in the estuary. Delta smelt are found across the entire northern delta, in far western portions of Grizzly and Suisun bays that are characterized by higher salinity conditions, and east to areas beyond Cache Slough where tidal exchanges give way to fresh water on the lower Sacramento River (Merz et al. 2011). Survey returns for multiple life stages of delta smelt have now been analyzed with time-series data drawn from a collection of environmental factors in an effort to provide guidance to habitat conservation planning (Hamilton and Murphy in prep). Those analyses offer contingent explanations for patterns of delta smelt presence and absence in specific areas, and they show that delta smelt have the ability to seek out habitat and maintain presence in suitable locations across a wide range of salinity conditions and the broadest fluctuating seasonal flow scenarios. Delta smelt habitat requirements (more exactly, the physical and biotic conditions required for delta smelt presence) are multi-dimensional and for some environmental attributes of the Delta vary with life stage, reflecting the fact that smaller, younger fish have different resource needs and ecological tolerances than larger, more mature fish, and spawning fish seek out areas of the Delta not used by juveniles and pre-spawning adults. Maps of the distribution of delta smelt in the estuary offer insights into delta smelt habitat requirements that are salient to planning for restoration of habitat for the species (Figure 10). Larval and juvenile fish are found throughout the Sacramento River, while pre-spawning and spawning fish are found in fresher water circumstances, such as Suisun Marsh, Cache Slough, and portions of the lower Sacramento River.
Broad parts of the estuary exhibit salinity conditions that are acceptable for delta smelt in all water years and under all contemporary flow regimes (Sommer and Mejia in review). But, while salinity and flows have negligible contributions to delta smelt habitat suitability, the same distribution data indicate that large portions of the estuary are frequently unsuitable for delta smelt, particularly in the south and southeast Delta, where summer and fall water conditions can be too warm and too clear, and hence are unoccupied by delta smelt (Nobriga et al. 2008).
3 Affinity analysis in the biological sciences is widely used to examine habitat and species relationships (see, e.g., Deri et al. 2010). It is a data analysis and data mining technique that discovers co-occurrence relationships among activities performed by (or recorded about) specific individuals or groups. In general, this can be applied to any process where agents can be uniquely identified and information about their activities can be recorded.

Bay-Delta Fisheries Resources: Pelagic Organisms
36 Delta Smelt (Hypomesus transpacificus) September 14, 2012
2.4.8.1.2.7 Before X2 Can Be Used as a Surrogate for Delta Smelt Habitat Analyses Are Needed That Establish the Appropriateness of Using a Surrogate
While Feyrer et al. (2007) noted that “other factors,” including several biotic and abiotic factors noted above, contribute to delta smelt habitat, and the delta smelt biological opinion recognized that multiple resources and other environmental factors contribute to the survival and recovery of delta smelt, the location of X2 in the estuary in the fall months
Figure 10. Distribution of delta smelt across all regular fish monitoring surveys. From Merz et al. (2011), based on presence/absence of delta smelt. In all surveys, delta smelt are found across a broad range of the estuary.

Bay-Delta Fisheries Resources: Pelagic Organisms
September 14, 2012 Delta Smelt (Hypomesus transpacificus) · 37
is nonetheless used as a “surrogate” for delta smelt habitat for purposes of water management planning (USBR 2011). Because the extent of open waters is greater in western, downstream areas of the estuary, when X2 is located in those downstream areas the low-salinity zone is more expansive; hence, according to Feyrer et al. (2011) more habitat is available to support delta smelt. But, cannot justify using a surrogate for delta smelt habitat, rather than considering the full range of delta smelt habitat factors, until an analysis has been completed that supports using a surrogate.
An ecological indicator or management surrogate is an environmental attribute that responds to relevant ecological conditions in a manner similar to a target species or its habitat, where direct data for the species or its habitat are too difficult, inconvenient, or expensive to gather (see Landres et al. 1988; Caro 2010). Default to inference from indicators or surrogates in natural resources management has intuitive appeal, particularly in the case of delta smelt, given its elusive behavior and residence in turbid waters that obscure its interactions with its environment, making it especially difficult to observe or census. It is standard practice for wildlife and fisheries managers to determine whether the presence of an indicator or surrogate accurately predicts the presence of the target before employing such planning proxies in management practice (Caro et al. 2005; Wenger 2008). The published literature cautions against using a surrogate without proper analysis establishing the appropriateness of the practice (Landres et al. 1988; Noon et al. 2005; Cushman et al. 2010).
There are three criteria that an ecological indicator must fulfill to establish its validity, and ultimately its utility, for use as a surrogate that can represent habitat for a species in the context of conservation planning:
1) the indicator must spatially and temporally occur over much of the geographic range of the target species and the distribution of its habitat;
2) there must be an ecological mechanism by which the indicator controls or affects the distribution or abundance of the species, or extent or condition of its habitat;
3) the status of the indicator must be anticipatory of changes in the status of the species or its habitat; that is, a measurable change in the indicator will predict changes in population numbers or habitat conditions that can be averted by management action.
(consistent with Hunsaker et al. 1990; Dale and Beyeler 2001; Niemi and McDonald 2004.)
Use of the location of X2 in the fall months as an indicator of the extent of habitat for delta smelt does not satisfy the above criterion. An effective surrogate measure for delta smelt habitat must exhibit a high degree of spatial and temporal overlap with the distribution of delta smelt. Delta smelt can be found at salinities substantially greater than 10 psu, as much as five times the X2 concentration and well outside the 0.5-6 psu range often used to describe the low-salinity zone (see, e.g., Baxter et al. 2010). Moreover, delta smelt are found in substantial numbers in near-freshwater portions of the estuary in upstream areas unaffected by the location of the X2 isohaline. Furthermore, large portions of the estuary

Bay-Delta Fisheries Resources: Pelagic Organisms
38 Delta Smelt (Hypomesus transpacificus) September 14, 2012
that experience X2 and near-X2 conditions are not occupied by delta smelt in the fall months and have not been occupied during most of the past decade. Those areas appear not to be suitable for delta smelt, either because of inadequate turbidity conditions or seasonally excessive temperatures (Hamilton and Murphy, in prep.); hence, despite acceptable salinities, those extensive areas do not serve as habitat for delta smelt. Accordingly, on the one hand, the low-salinity zone, as described in the biological opinion, does not include significant areas of delta smelt habitat and, on the other hand, much of the low-salinity zone frequently does not support delta smelt. It therefore cannot be said that the low-salinity zone serves as “core habitat” area for the species, as suggested by Feyrer et al. (2007, 2011).
2.4.8.1.2.8 Summer Townet Survey for 2012 Would Not Have Been Predicted by the Feyrer et al. (2007) Equation
The Feyrer et al. (2007) fall X2 model is based on a predictive stock-recruit relationship between the FMWT of one year and the succeeding Summer Townet Survey, with the average location of X2 in the fall months used as a covariate (USFWS 2008, 2011). Using the Feyrer et al. model, the average position of X2 in the fall months of 2011 would be expected to produce a Summer Townet Survey index in 2012 of 7.99. The recently published Summer Townet Survey index for delta smelt is 0.9, which is far lower than would be predicted by Feyrer et al. (2007). That the prediction is off by an order of magnitude does not necessarily invalidate the fall X2 hypothesis; however, it does suggest that something else is contributing to delta smelt abundance. In addition, it raises significant uncertainty with respect to the utility of the fall X2 hypothesis for management purposes.
2.4.8.1.2.9 Fall X2 Has Not Been Trending Upstream
The fall X2 conceptual model is premised on a belief that there has been a continual increase in salinity (i.e., X2 moving upstream or east) since 1967; however, the years selected for the analysis influenced the results. By choosing the years 1967-2004, the agencies compared a very wet period to a very dry period. Whenever specific years within the hydrological record are selected for analysis, it is important to account for hydrology to avoid interpreting results that are purely hydrology driven as a change in water consumption.
As explained by Dr. Paul Hutton during the PWAs’ oral presentation on ecosystem changes and the low-salinity zone on 16 August 2012, a statistically significant long term (water years 1922-2011) trend in X2 position shows that the Delta has been getting fresher in September. X2 position does not show a statistically significant long term trend upward or downward in October. Dr. Hutton noted that, although fall X2 position has been higher in recent decades, it is comparable with conditions observed prior to construction of Shasta Dam. It is possible that higher fall X2 positions in recent decades correspond to deepening of the estuary’s main channels due to erosion, which would increase gravitational circulation allowing higher salinity bay waters to intrude farther into the Delta.
B

Bay-Delta Fisheries Resources: Pelagic Organisms
September 14, 2012 Delta Smelt (Hypomesus transpacificus) · 39
2.4.8.1.2.10 Summer X2 Conceptual Model Has Not Been Investigated and the Preliminary Data Does Not Suggest That Summer Has Particular Biological Importance
The California Department of Fish and Game’s submittal, Written Information Responsive to the Workshop Questions for the Bay-Delta Workshop 1 - Ecosystem Changes and Low Salinity Zone, dated 16 August 2012, suggests that the State Water Board consider flow objectives for summer as well as fall. If scientific information emerges during the process of updating the Bay-Delta Plan indicating that summer low-salinity zone position is important to juvenile survival (p. 3), it should be noted that Nobriga et al. (2008), the only published study testing a summer X2 conceptual model, performed essentially the same analysis as Feyrer et al. (2007) except using the Summer Townet Survey rather than the FMWT. As a result, many of the same uncertain methodological approaches that are made by Feyrer et al. (2007) are repeated in Nobriga et al. (2008), including but not limited to use of X2 as an unverified surrogate of delta smelt habitat, induced correlation, and using a limited number of abiotic and biotic characteristics of actual delta smelt habitat. To its credit, Nobriga et al. (2008) did not limit its analysis to the post-1987 period. Nobriga et al. (2008) performed spatial (entire upper estuary and three regions) linear regression analyses of salinity, Secchi depth, and water temperature against relative abundance of delta smelt using the Summer Townet Survey; however, salinity was not found to be a significant predictor for any region either in terms of its predictive power (R2-value) or level of statistical significance (p-value). Therefore, Nobriga et al. (2008) offers little guidance to the State Water Board in considering modifications to the Bay-Delta Plan.
C

Bay-Delta Fisheries Resources: Pelagic Organisms
40 Delta Smelt (Hypomesus transpacificus) September 14, 2012
[This page intentionally left blank for double-sided printing]

Bay-Delta Fisheries Resources: Pelagic Organisms
September 14, 2012 Other Pelagic Organisms · 41
3.0 Other Pelagic Organisms
This chapter addresses additional fishes and other pelagic organisms. For each of the species, there is considerable uncertainty as to whether additional reservoir releases or Delta through flows can achieve desired ecological functions. For some species, available survey data suggests that additional flow-based actions are unsupported.
A brief summary of factors the State Water Board should consider when evaluating the need for Delta through flows for other pelagic organisms include:
Green sturgeon: There is currently little or no scientific basis that any specific action, such as further modifications of water project operations, will produce negligible, limited, or substantial benefits. Due to a fundamental lack of information and the status of green sturgeon and the factors that limit its numbers, additional research is an essential prerequisite to the identification of additional actions.
Splittail: No flow-related actions are supported by the scientific literature. The
literature supports actions intended to increase the availability of floodplain rearing and spawning habitat for splittail and other fishes, including physical modifications to the Fremont Weir and Yolo Bypass to manage the timing, frequency, and duration of inundation of the Yolo Bypass with gravity flow from the Sacrament River, and to improve upstream fish passage past barriers that include Fremont and Lisbon weirs.
Starry flounder: Based on the Bay Study Otter Trawl data from the past three decades, starry flounder is not experiencing a decline in abundance in the San Francisco estuary. There is no scientific justification for the State Water Board to take any further actions to maintain the abundance of the fish.
American shad: American shad is a bay fish that spawns upstream in larger rivers; it is not an estuarine fish. Its weak relationship with the position of X2 in the Delta is likely an artifact of physical circumstances that co-vary with inter-year variation in Delta through flows. Similar to Chinook salmon, the use of the Delta by American shad is primarily a just-passing-through phenomenon on directional downstream migration to salt waters. The scientific literature does not support additional flow-based actions.
Northern anchovy: The central stock of northern anchovy is not experiencing a decline.
Striped bass: In spite of the effects of density dependence during their young juvenile stage, sufficient numbers of age-0 fish appear to be recruiting into the adult population. Likewise, recreational catch, the CDFG’s designated beneficial use for striped bass, has not declined.

Bay-Delta Fisheries Resources: Pelagic Organisms
42 Other Pelagic Organisms September 14, 2012
California bay shrimp: Based on the Bay Study Otter Trawl data, California bay shrimp is not experiencing a decline. There is no reason to believe that further actions are needed to maintain its abundance.

Bay-Delta Fisheries Resources: Pelagic Organisms
September 14, 2012 Other Pelagic Organisms · 43
3.1 Green Sturgeon
3.2 Summary and Introduction
The green sturgeon is an anadromous species that spawns in the main stem of the Sacramento and Feather rivers, and matures over the first few years of life in the Sacramento-San Joaquin Delta prior to emigrating to the ocean and large coastal bays where it spends most of its life (Beamesderfer et al. 2007). The more numerous white sturgeon, Acipenser transmontanus, is also present in the system.
Green sturgeon in the San Francisco estuary were listed on April 7, 2006, as threatened under the Endangered Species Act (ESA) by the National Marine Fisheries Service (NMFS) (71 FR 17757). The listing includes only the southern distinct population segment (DPS), which includes only the single Central Valley population. Green sturgeon from the northern DPS, occurring in coastal California and Oregon rivers from the Eel to the Umpqua, was not listed under the ESA.
Information on the historical and current distribution and status of green sturgeon in California’s Central Valley is sparse. These fish were listed due to: (1) the concentration of spawning into one river system, which serves to increase the risk of catastrophic events causing extinction; (2) apparent loss of spawning habitat due to migration barriers; (3) suspected small population size (acknowledging a general lack of population data); and (4) exposure to a variety of direct and indirect risk factors related to widespread ecosystem alteration and suspected loss of habitat.
Critical Habitat was formally designated by NMFS on September 3, 2008, in freshwater, marine, and coastal bay and estuary areas inhabited by green sturgeon (73 FR 52084). In fresh water, those include the Sacramento River upstream to Keswick Dam, the Yolo and Sutter bypasses, the lower Feather and Yuba rivers, and the Sacramento-San Joaquin Delta. Coastal marine waters included areas within 110 m depth from (and including) Monterey Bay north to the U.S.-Canada border. Coastal bays and estuaries included San Francisco, San Pablo, Suisun bays, and seven additional bays or estuaries between Humboldt Bay, California and Grays Harbor, Washington.
NMFS has convened a green sturgeon recovery team and is in the process of developing a formal recovery plan; however, specific measures for conservation and recovery of this species have not yet been articulated.
3.3 Green Sturgeon Biology
Green sturgeon, Acipenser medirostris, are an ancient but elusive species that spend most of their lives in marine waters along the continental shelf from northern California to southern Canada (Moyle 2002). Like all sturgeon, they are long-lived and reach large sizes. Ages of 60-70 years are likely and sizes up to eight feet and 400 pounds have been recorded. Sexual maturity typically occurs at 15 to 25 years of age and four to five feet in length. Green sturgeon are bottom-oriented feeders and eat a variety of invertebrates and fish.

Bay-Delta Fisheries Resources: Pelagic Organisms
44 Other Pelagic Organisms September 14, 2012
Spawning occurs at specific sites in the main stem Sacramento River between Hamilton City (mile 199) and Keswick Dam (mile 301). Adults are occasionally observed in the Feather River and spawning was documented there in 2011. Moyle et al. (1992) surmised that spawning may take place or once did in the lower San Joaquin River; however, there is currently no direct evidence of green sturgeon occurrences or spawning in the San Joaquin River upstream from the Delta (Adams et al. 2002; Beamesderfer et al. 2004, 2007).
Only a portion of the adult population spawns in any year, but green sturgeon return to spawn in the Sacramento River every year (see Figure 11). Due to their large size, female sturgeon are very fecund and can produce large numbers of offspring under favorable conditions. The success of spawning and subsequent survival varies considerably from year-to-year due to environmental conditions. The long sturgeon life span is adapted to accommodate episodic recruitment; green sturgeon abundance appears to fluctuate over time in response to intervals of high and low recruitment.
The Delta and other areas, including San Francisco, San Pablo, and Suisun bays, provide important rearing habitat for juveniles and sub-adults, and areas through which sub-adults and adults migrate (Adams et al. 2002; NMFS 2009).
3.4 Environmental Factors Affecting Green Sturgeon
Factors currently limiting green sturgeon status are poorly understood. While a variety of potential limitations have been identified, the population-scale impacts of specific factors have not been quantified. Known or suspected limiting factors identified by NMFS (Adams et al. 2002, 2007; NMFS 2005, 2008) include:
Figure 11. The green sturgeon life cycle. From Beamesderfer et al. (2007).
Bay-Delta Fisheries Resources: Pelagic Organisms
September 14, 2012 Other Pelagic Organisms · 45
3.4.1 Impassable Dams
Upstream migration is blocked at Keswick and Shasta dams on the Sacramento River and the Fish Barrier and Oroville dams on the Feather River. Areas upstream from these barriers are believed to have historically supported green sturgeon spawning (Mora et al. 2009).
3.4.2 Migration Barriers
A number of structures may impede upstream migration of adults under certain conditions. Red Bluff Diversion Dam historically blocked migration during the irrigation season when control gates were in place; however, 2011 was the last year of gate operation. Adults can be attracted into the Yolo Bypass in high flow years and may become stranded below the Fremont Weir. The Delta Cross Channel gates may impede passage under certain conditions. Shanghai Bench and the Sunset Pumps diversion appear to impede passage in the lower Feather River under low-flow conditions.
3.4.3 Fishing Impacts
Because of their long life span and delayed maturation, sturgeon are very susceptible to overfishing. California sturgeon populations collapsed due to unregulated commercial fishing prior to 1900; numbers gradually increased over the next century. Sport fisheries for green sturgeon in California and commercial fisheries for green sturgeon in Oregon and Washington have been closed following listing. Fish are still subject to incidental handling in various fresh water and marine, sport and commercial fisheries, and illegal harvest occurs in fresh water during spawning migrations.
3.4.4 Water Diversions
Entrainment and impingement by water diversions has been identified as a threat, but the degree to which those factors affect the abundance of green sturgeon or the continued existence of the Southern DPS remains uncertain (71 FR 17757). Variable numbers of juvenile sturgeon are seen in fish salvage at the CVP Tracy and SWP Skinner Fish Collection Facilities in some years (Figure 12). Salvage estimates of green sturgeon numbered in the hundreds or thousands until the 1980s, but have averaged fewer than 100 green sturgeon per year since that time.
3.4.5 Flow and Temperature Effects
Insufficient flow and high water temperatures were identified by NMFS as risk factors but specific information on the significance of these factors to green sturgeon abundance and the continued existence of the species is lacking (NMFS 2009). Water temperatures of less than 20°C (68°F) are required for successful spawning and egg incubation (Beamesderfer et al. 2007 and references therein). Unfavorable temperatures for spawning and egg incubation were historically documented downstream from Shasta Dam, but have been ameliorated by temperature controls. Recruitment of white sturgeon in some populations has been correlated to stream flows during spring (Duke et al. 1999). Attempts to regulate

Bay-Delta Fisheries Resources: Pelagic Organisms
46 Other Pelagic Organisms September 14, 2012
flows to
improve recruitment of white sturgeon in Pacific Northwest populations have been unsuccessful. The mechanism(s) by which flow affects green sturgeon is unclear.
3.4.5 Ecosystem Changes
Large-scale ecological changes in the Delta ecosystem have resulted from a combination of physical landscape changes, food web alteration, and exotic species introductions. NMFS has identified exotic species as potential risk factors, and speculated on predation by striped bass. The net impact of multiple ecosystem changes on green sturgeon is uncertain and likely complex. Notably, the point at which the food web in the estuary was substantially modified by the proliferation of the Amur River clam coincided with the decline in green sturgeon juveniles as indexed by water-project salvage numbers, suggesting that ecosystem changes could have a significant impact upon population abundance.
1968 1972 1976 1980 1984 1988 1992 1996 2000 2004 2008
Stur
geon
Sal
vage
(tho
usan
ds)
0
2
4
6
8
SWPCVP
Figure 12. Estimated annual salvage of green sturgeon at State Water Project (SWP) and federal Central Valley Project (CVP) fish facilities in the South Delta. Data from California Department of Fish and Game.

Bay-Delta Fisheries Resources: Pelagic Organisms
September 14, 2012 Other Pelagic Organisms · 47
4.0 Sacramento Splittail 4.1 Introduction and Summary
Meng and Moyle (1995) concluded that the geographic range of splittail had been reduced to a fraction of its former extent; attributing this to a loss of low-salinity habitat in Suisun Bay and Suisun Marsh. Based on Meng and Moyle (1995) and other sources, the USFWS took action to list the splittail as a threatened species in 1999. Since then, it has been determined that splittail’s range is greater than was previously thought (USFWS 2010). Subsequent wet years with significant floodplain inundation events caused its abundance to rebound, leading to a remanding of its threatened status in 2003, and eventual reversal of its listing under the federal Endangered Species Act in 2010.
Entrainment of splittail in the fish collection facilities increases in hydrologically wet years when floodplain inundation events result in a spike in population size and decreases during hydrologically dry years when recruitment is low (Sommer et al. 2007). No evidence is available that indicates that water project operations have a significant effect on splittail population size and trends (Sommer et al. 2007).
The abundance of age-0 splittail has not shown a discernible change in either adult or juvenile abundance after 1987, the point at which the food web in the estuary was substantially modified by the proliferation of the Amur River clam P. amurensis (Sommer et al. 1997; Kimmerer 2002).
No flow-related actions are supported by the scientific literature. The literature supports actions intended to increase the frequency and persistence of Yolo Bypass inundation.
4.2 Sacramento Splittail Biology
Sacramento splittail, Pogonichthys macrolepidotus, is a native cyprinid that can live 8-10 years (Moyle 2002). Splittail are physiologically hardy and able to tolerate a relatively wide range of temperature, salinity, and dissolved oxygen levels (Young and Cech 1996), including a broad tolerance for salinities of 10-18 psu, which avails them to slow moving sections of rivers and sloughs in the Delta (Moyle 2002; Moyle et al. 2004). Their range encompasses much of the Delta tributaries below the major rim dams, the lower Napa River, and the lower Petaluma River, where a self-sustaining population apparently exists (Moyle 2002; Sommer et al. 2007, 2010). The Sutter and Yolo Bypasses are apparently important spawning areas (Moyle 2002). In the Delta, they are most abundant in the north and west when populations are low, but are more evenly distributed in years in which they realize high reproductive success. The opossum shrimp N. mercedis is an important food resource for splittail, although after the invasion of the Amur River clam their diet has increasingly focused on bivalves and amphipods (Sommer et al. 2007). While on floodplains, aquatic invertebrates, such as chironomid midge larvae, make up the largest portion of their diet (USFWS 2010).
Splittail use inundated floodplains in spring as spawning habitats (Sommer et al. 1997; Moyle 2002), requiring flooded vegetation for both spawning and rearing. Strong year classes are associated with wet-year inundation events (Sommer et al. 2007), with the

Bay-Delta Fisheries Resources: Pelagic Organisms
48 Other Pelagic Organisms September 14, 2012
abundance of age-0 fish being relatively low during dry years (Figure 13). Floodplain inundation represents the primary factor that determines spawning success (Sommer et al. 1997). When the combined flow of Sutter Bypass and the Sacramento and Feather rivers raises water levels at Fremont Weir to an elevation of 32.8 feet (which typically occurs when combined total flow from these sources surpasses 55,000 cfs), flows begin to enter Yolo Bypass (BDCP 2012). Adults begin a gradual upstream migration towards spawning areas sometime between late November and late January (Moyle et al 2004). As floodplains drain down, a downstream dispersal phenomenon occurs.
4.3 Environmental Factors Affecting Sacramento Splittail
The most significant factor predicting splittail abundance is the availability of inundated floodplain over a sufficient amount of time to allow for successful spawning and rearing. Feyrer et al. (2006) noted that manipulating flows entering Yolo Bypass, such that floodplain inundation is maximized during January-June, might provide the greatest overall benefit for splittail, especially in relatively dry years when overall production is lowest. Inundation for at least a month appears to be necessary for a strong year class of splittail (Sommer et al. 1997).

Bay-Delta Fisheries Resources: Pelagic Organisms
September 14, 2012 Other Pelagic Organisms · 49
Figure 13. Age-0 splittail (>24 mm FL) abundance and distribution based on U.S. Fish and Wildlife Service beach seine survey, 1978-1982, 1992-2002. Data are mean catch per haul by region for May and June. Regions follow Sommer et al. (1997), except for those upstream of the Delta: (1) lower Sacramento River (“LowSac.R”—Feather River [river kilometer 129] to American River [river kilometer 97]); (2) middle Sacramento River (“MidSac.R.”—Butte Creek [river kilometer 222] to Knights Landing [river kilometer 145]); and (3) Upper Sacramento River (“UppSac.R.”—Ord Bend [river kilometer 296] to Colusa State Park [river kilometer 239]). Sampling in the latter three regions began in 1981. From Sommer et al. (2007).

Bay-Delta Fisheries Resources: Pelagic Organisms
50 Other Pelagic Organisms September 14, 2012
5.0 Starry Flounder
5.1 Introduction and Summary
Since 2002, the starry flounder abundance index has been from 300-500. Based on the Bay Study Otter Trawl data from the past three decades, starry flounder is not experiencing a decline in abundance in the San Francisco estuary. There is no scientific justification for the SWRCB to take any further actions to maintain the abundance of the fish.
5.2 Starry Flounder Biology
Starry flounder, Platichthys stellatus, is a flatfish found along the Pacific Coast from Santa Barbara County northward to the Alaskan Peninsula (Wang 1986). In the Bay-Delta estuary it is one of the most common flatfish found (Wang 1986). It is a fish of San Francisco Bay that can survive in fresh water – it has been observed in San Luis Reservoir, arriving there via transport in the California Aqueduct or San Luis Canal (Moyle 2002) – making some use of the lower Delta for rearing of young. Spawning occurs in late fall and early spring months in shallow coastal waters or tidal sloughs (e.g., Elkhorn Slough) (Wang 1986). Young juveniles apparently are pelagic, gradually settling on the bottom by the end of April. While in the estuary, young fish eat amphipods and copepods (Moyle 2002).
The Bay Study Otter Trawl is the best monitoring survey for detecting starry flounder, because the Otter Trawl monitors the bottom of the water column. The Otter Trawl indicates that starry flounder exhibit periods of dramatic variation in abundance in San Francisco Bay (see Figure 14), which may be cyclical – although anomalies in survey returns that result from gear-related sampling phenomena may affect returns.
5.3 Environmental Factors Affecting Starry Flounder
Starry flounder spend little of their lives in the estuary. Since their diet while in the estuary consists of amphipods and copepods, reductions in the abundance of these food resources could reduce numbers there. The damage already done to the ecosystem’s food web by the invasive Amur River clam is well documented (see, e.g., Carlton et al. 1990; Alpine and Cloern 1992; Kimmerer et al. 1994; Feyrer et al. 2003; Kimmerer 2006; Greene et al 2011). Kimmerer et al. (1994) reported a 69 percent drop in chlorophyll concentration after the Amur River clam became abundant. Greene et al. (2011) found that P. amurensis feeds heavily on microzooplankton (e.g., ciliates), which are a food resource for macrozooplankton (e.g., copepods). As a result, the Amur River clam may disrupt links between these trophic levels (Greene et al. 2011).
In the 1980s, increasing anthropogenic discharges of nitrogen were coupled with reductions in phosphorus loading in the estuary (Van Nieuwenhuyse 2007; Glibert et al. 2011). Changes in nutrient forms and ratios caused stoichiometric changes in lower trophic levels, away from a diatom-based food web and toward a less efficient bacterial food web (Glibert 2010; Glibert et al. 2011). According to Glibert (2010), the decline in diatoms, which began in 1982, is highly correlated with the increase in ammonium loading. Diatoms prefer and, under some conditions, physiologically require, nitrate over ammonium. As nitrate became less available relative to ammonium in Suisun Bay, a competitive advantage

Bay-Delta Fisheries Resources: Pelagic Organisms
September 14, 2012 Other Pelagic Organisms · 51
shifted to phytoplankton taxa that can more efficiently use reduced forms of nitrogen (Berg et al. 2001; Glibert et al. 2004, 2006; Brown 2009). Among the phytoplankton groups that replaced diatoms in the estuary, cyanobacteria and many flagellates, phytoplankton groups that do not support key food web linkages, show a preference for chemically reduced forms of nitrogen. Today the Suisun Bay region is dominated by cyanobacteria and flagellates (Brown 2009). These changes in phytoplankton composition are consistent with ecological stoichiometric principles, which predict that consumers that successfully sequester the nutrient in lowest supply relative to their needs should dominate and, in so doing, may stabilize at a new stable state (Glibert et al. 2011).
Combined, the effect on the estuary’s food web has been severe – its carrying capacity has been reduced as the effects of an altered lower food web have cascaded upward (Kimmerer et al. 2000). Importantly, flows apparently do not alter estuarine nutrient ratios; accordingly, Glibert (2010) states that the current strategy of salinity management will likely show little beneficial effect on phytoplankton, zooplankton, or fish. Rather, regulation of effluent nitrogen discharge through nitrification and denitrification offers an alternative management strategy with a track record of success in other estuaries (see the PWA presentation on ecosystem changes and the low-salinity zone, Ecosystem Changes to the Bay-Delta Estuary: A Technical Assessment of Available Scientific Information, pp. 2-23 to 2-39).
Ab
un
dan
ce Ind
ex (Tho
usan
ds)
Figure 14. Annual abundance of age-0 starry flounder. Data from Bay Study Otter Trawl. Figure from IEP Newsletter, 2012(1), p. 24. Starry flounder appear to undergo cyclic abundances.

Bay-Delta Fisheries Resources: Pelagic Organisms
52 Other Pelagic Organisms September 14, 2012
6.0 American Shad
6.1 Introduction and Summary
American shad is not an estuarine species. It spawns and rears to adulthood in areas above the estuary in the open waters of larger rivers (Moyle 2002). Variation in population numbers drawn from the Fall Midwater Trawl index indicates that through-Delta flows do not determine American shad population dynamics.
6.2 American Shad Biology
The American shad, Alosa sapidissima, is an anadromous fish that was intentionally introduced into California in the late 1880s. They are found along the Atlantic seaboard from Labrador to Florida and are one of the most abundant anadromous fish on the east coast. Since its introduction in California, it has become an important sport fish in the San Francisco estuary. American shad range from Alaska to Mexico and use major rivers between British Columbia and the Sacramento-San Joaquin watershed for spawning (Moyle 2002).
At age-3 to age-5, American shad migrate from the ocean into freshwater reaches of the Sacramento and San Joaquin rivers during March-May, with peak migration occurring in May (Stevens et al. 1987). American shad spawn in open waters and do not often move up into the lesser tributaries of the large rivers that they ascend. The major spawning run in California occurs in the Sacramento River up to Red Bluff and in the adjoining American, Feather, and Yuba rivers, with lesser use of the Mokelumne, Cosumnes, and Stanislaus rivers and the Delta (Moyle 2002). Spawning takes place from May-July (Stevens et al. 1987). American shad are not semalparous (spawn only once and then die) like salmon; they will return annually up to seven years of age to spawn (Stevens et al. 1987), although the majority of spawners are first-time participants (Moyle et al. 2002). The young migrate seaward through the estuary from June through December (Stevens 1966). It is hypothesized that river flows affect the distribution of first time spawners, with numbers of newly mature adults spawning in rivers proportional to flows at the time of arrival (Stevens et al. 1987), with spawning taking place in the main channels of the rivers and flows washing negatively buoyant eggs downstream.
The lower Feather River and the Sacramento River from Colusa to the northern estuary provide the major summer nursery areas for larvae and juveniles, although there is some evidence that at least some American shad spawn in the estuary itself (Stevens 1966) – note that American shad juveniles can tolerate an abrupt switch to sea water (Moyle 2002).
Flows are hypothesized to affect the downstream transport of young, with wet years moving the location of the concentration of young and their nursery area further downstream (Stevens et al. 1987); however, it is unclear how enhanced flows provide benefits to the American shad population. Out migration of young American shad through the estuary occurs June-November (Stevens 1966). During migration to the ocean, young fish feed upon zooplankton, including copepods, mysids, and cladocerans, as well as

Bay-Delta Fisheries Resources: Pelagic Organisms
September 14, 2012 Other Pelagic Organisms · 53
amphipods (Stevens 1966; Moyle 2002). Most American shad migrate to the ocean by the end of their first year, but some remain in the estuary (Stevens et al. 1987; Moyle 2002).
Year-class strength correlates positively with river flow during the April-June spawning and nursery period (Stevens and Miller 1983.) Age-0 American shad exhibit a weak abundance relationship with the location of the X2 isohaline in the estuary (Kimmerer 2002). After 1987, the relationship changed such that abundance increased per unit flow (Kimmerer 2002; Kimmerer 2009); the X2 location versus abundance relationship has remained intact in recent years (Kimmerer et al. 2009.) In addition, Kimmerer et al. (2009) found that American shad exhibit a relationship with salinity and water depth that appeared consistent with its relationship of abundance to X2 location; that is, slopes for abundance versus X2 and salinity and depth versus X2 are similar, which provides some support for the idea that increasing the extent of areas of specific salinity and depth could explain the X2-abundance relationship for the species. Stevens and Miller (1983) hypothesized that the apparent general effect of high flow on all of the species they examined, including American shad, is to increase the extent and quality of nursery areas, thereby more widely dispersing young fish, thus reducing density-dependent mortality.
6.3 Environmental Factors Affecting American Shad
An examination of the annual abundance index for American shad indicates the population’s fresh water residency undergoes wide swings, with nearly biennial peaks and troughs (Figure 15). As shown by Figure 15, low index values experienced from 2007-2011 are not unusually low when compared to early to mid-1970s returns. For water flows to produce such an effect, alternating extreme events producing boom-or-bust conditions would have to occur. Such has not been the case. More likely, cycling numbers of American shad may be an artifact of the timing of American shad’s movements through the estuary in relation to the Fall Midwater Trawl. Stevens and Miller (1983) acknowledged that the Fall Midwater Trawl index is affected by imprecision in data derived from generalized sampling techniques that are not designed to accommodate species-specific ecological phenomena.
While Kimmerer et al. (2009) found that American shad exhibit an abundance relationship with X2 location in the Delta, the relationship is weak, which indicates little support for the idea that increasing habitat by moving X2 downstream will benefit American shad. Stevens and Miller (1983) suggest that American shad abundance is affected by estuary inflows. That is consistent with Moyle (2002), who reported that shad are able to adjust the timing of their spawning runs to the timing of river outflows. The biennial nature of the Fall Midwater Trawl abundance index for American shad belies a substantive influence of flows and instead suggests that American shad, as a long-lived species, can choose their spawning years to correspond with wet years.

Bay-Delta Fisheries Resources: Pelagic Organisms
54 Other Pelagic Organisms September 14, 2012
Figure 15. Annual index of American shad abundance. Data from Fall Midwater Trawl.
0
1000
2000
3000
4000
5000
6000
7000
8000
9000
10000
19
67
19
69
19
71
19
73
19
75
19
77
19
79
19
81
19
83
19
85
19
87
19
89
19
91
19
93
19
95
19
97
19
99
20
01
20
03
20
05
20
07
20
09
20
11
FMW
T In
dex

Bay-Delta Fisheries Resources: Pelagic Organisms
September 14, 2012 Other Pelagic Organisms · 55
7.0 Northern Anchovy
7.1 Introduction and Summary
The northern anchovy is abundant off the coast of California and is ecologically and economically important in the coastal waters of southern California. Three stocks of northern anchovy have been identified -- northern, central and southern. California fishery harvests are taken from the central stock, which ranges from northern Baja to San Francisco. Management of northern anchovy is shared by the Pacific Fishery Management Council and the National Marine Fisheries Service. Data do not indicate that the northern anchovy is experiencing a decline.
7.2 Northern Anchovy Biology
In the winter, northern anchovy, Engraulis mordax, usually move to deeper water offshore, and in the spring they return to inshore shallow waters. Spawning is mostly within 60 miles of the coast, although it has been recorded up to 300 miles offshore. Anchovies stay near the bottom in the daytime and come to the surface at night. They spawn mostly in the ocean at depths less than 10 meters, at water temperatures of 12-15oC (Kucas 1986). Anchovies spawn throughout the year, although most spawn in winter and spring (Kucas 1986). While the northern anchovy diet consists of zooplankton, phytoplankton, and fish, it is primarily a planktivore (Kucas 1986; Kimmerer 2006).
7.3 Environmental Factors Affecting Northern Anchovy
The response of northern anchovy to changed conditions in the estuary is noteworthy; its recent shift in distribution appears to have been a direct behavioral response to reduced food. Prior to invasion by the Amur River clam, summer-long phytoplankton blooms were common. In 1987, the clam eliminated these blooms, leading to a redistribution of northern anchovy toward higher salinity, reducing its summer abundance in the low-salinity zone by 94% (Kimmerer 2006).
The decline in anchovies in the estuary’s low-salinity zone, but not in areas of higher salinity, occurred in striking coincidence with the decline in chlorophyll-a. The bulk of the northern anchovy population, before the recent decline was documented, occurred at high salinity – 95% of the catch before 1987 occurred at >10 psu salinity (Kimmerer 2006). Hence, their declines in the low-salinity zone most likely occurred directly in response to declines in food availability, since there has been no long-term change in the distribution of the low-salinity zone within the estuary in the spring. Furthermore, chlorophyll-a concentrations did not change appreciably in San Pablo Bay (Kimmerer 2004), a higher-salinity region where anchovy abundances have remained high.
Kimmerer (2006) explored several possible explanations for the dramatic and rapid decline in northern anchovy in the low-salinity zone in 1987 and thereafter, including climate variability and biomass, catch, or abundance of northern anchovy on the California coast, and concluded that the most parsimonious explanation for the decline in anchovy abundance in the low-salinity zone is as a direct or indirect response to the decline in chlorophyll-a.

Bay-Delta Fisheries Resources: Pelagic Organisms
56 Other Pelagic Organisms September 14, 2012
The shift of the population away from a region that had become inhospitable is not surprising. In the lower Hudson River, several open-water fish species shifted seaward following a reduction in chlorophyll concentration due to the introduced zebra mussel Dreissena polymorpha (Strayer et al. 2004 in Kimmerer 2006). Similar behavioral shifts of northern anchovy in apparent response to chlorophyll concentration (or its covariates) have been noted off Baja California (Robinson 2004 in Kimmerer 2006). Behavioral shifts in the geographic position of populations in response to food availability is a simpler explanation for observed phenomena that recognizes the ability of animals to move from unfavorable to favorable locations.

Bay-Delta Fisheries Resources: Pelagic Organisms
September 14, 2012 Other Pelagic Organisms · 57
8.0 Striped Bass
8.1 Introduction and Summary
Striped bass are a non-native species.
8.2 Striped Bass Biology
Striped bass, Morone saxatilis, were deliberately introduced in California from the East Coast, where they are found from the Gulf of St. Lawrence to Alabama. The initial introduction took place in 1879, when 132 fingerling bass were brought to California by rail from the Navesink River in New Jersey and released near Martinez. Fish from this lot were caught within a year near Sausalito, Alameda, and Monterey, and others were caught occasionally at scattered locations for several years afterwards. There was much concern by the Fish and Game Commission that such a small number of bass might fail to establish the species, so a second introduction of about 300 striped bass was made into lower Suisun Bay in 1882.
In a few years, striped bass were being caught in California in large numbers. By 1889, only a decade after the first lot of eastern fish had been released, bass were being commercially harvested and sold in San Francisco markets. In another decade, the commercial net catch was averaging well over a million pounds a year. In the belief that it would enhance the sport fishery, in 1935 the Fish and Game Commission declared striped bass to be a game fish and all commercial fishing for striped bass was halted.
Striped bass have been monitored more extensively than perhaps any other Bay-Delta fish. The Fall Midwater Trawl was designed to determine the relative abundance and distribution of age-0 striped bass in the estuary. It has sampled portions of the estuary annually since 1967 (with the exceptions of 1974 and 1979). Currently, it samples 122 stations each month from September to December, and a subset of these data is used to calculate an annual abundance index. The 122 stations range from San Pablo Bay upstream to Stockton on the San Joaquin River, Hood on the Sacramento River, and the Sacramento Deep Water Ship Channel in the upper estuary. Oblique tows from bottom to top are conducted at each of the stations.
8.3 Environmental Factors Affecting Striped Bass
The FMWT Index for age-0 striped bass shows a dramatic and persistent decline starting in 1987 (Figure 16). Bioenergetic modeling provides evidence that major changes to the estuarine food web are primarily responsible for the decline (Nobriga 2009). Kimmerer et al. (2000) also suggests a decline in the estuary’s carrying capacity due to food limitation. Feyrer et al. (2003) noted a major decline in mysid abundance caused by the invasion of the Amur River clam as a cause of the decline in striped bass abundance and a switch to piscivory by earlier age classes. Bryant and Arnold (2007) suggest the most significant impact of food limitation occurs during first-feeding by larvae in the spring, since Summer

Bay-Delta Fisheries Resources: Pelagic Organisms
58 Other Pelagic Organisms September 14, 2012
Townet Survey data indicates that striped bass diets have adjusted to changes in the summer food availability.
At least part of the decline in age-0 striped bass abundance can be explained by an apparent long-term distributional shift away from channels, which are sampled by the FMWT, toward shoal areas, which are not (Schroeter 2008; Sommer et al. 2011). Therefore, at least part of the decline in the FMWT Index is attributed to under-sampling of striped bass habitat. Reduced food availability in pelagic habitat caused by the invasion of the Amur River clam is hypothesized by Sommer et al. (2011) to be the major cause of the distributional shift. Glibert et al. (2011) found that both ammonium levels and nutrient ratios explained the variation in age-0 striped bass abundance as measured by the FMWT.
A decline in the number of age-0 striped bass would manifest itself as reduced recruitment (Kolhorst 1999), but the overall population of adult striped bass has not shown a decline since 1987 (Figure 17), nor has the population of sub-adult fish (Figure 18). Striped bass have a wide-ranging diet, consuming copepods, planktonic crustaceans (e.g., Daphnia spp.), cladocerans, mysids, amphipods, small fishes, and other prey (Bryant and Arnold 2007). Only age-0 fish have a more constrained diet (they are non-piscivorous at smaller sizes). The fact that neither sub-adult nor adult striped bass numbers have declined over decades suggests that the number of age-0 fish recruiting to the adult population is sufficient to ensure a robust and apparently sustaining population. Recreational catches of striped bass also have not declined from the early 1980s (see Figure 17). An apparent surge in recreational catch happened in the late 1990s, but without a subsequent pattern.
Kimmerer (2002) found that survival of striped bass from eggs to 38 mm is increased as the location of the X2 isohaline shifts downstream in the estuary. Given that age-1 through age-6 fish have not experienced overall declines in numbers, little is gained from a population perspective by shifting X2 downstream. Density dependence offers an explanatory mechanism whereby the number of age-0 striped bass is delinked from the
FMW
T Ind
ex
Figure 16. Fall Midwater Trawl index for striped bass.

Bay-Delta Fisheries Resources: Pelagic Organisms
September 14, 2012 Other Pelagic Organisms · 59
number of older fish. Kimmerer et al. (2000) found a density-dependent survival bottleneck during the first three to four months of life, and offered as reasonable candidates for causation density dependence, food limitation, cannibalism, response of predators, and migration. The study identified food limitation as the most likely candidate.
Ad
ult Strip
ed B
ass Ab
un
dan
ceEstim
ate (millio
ns)
Catch
per U
nit Effo
rt
Sub
-Ad
ult Strip
ed B
ass Ab
un
dan
ceEstim
ate (millio
ns)
Figure 17. Population abundance estimates of adult striped bass (age-3 to age-6). Data from Loboschefsky et al. (2012) 1969-2004; 2005-2010 (gray bars) estimated using the same methods as Loboschefsky et al. 2012. Catch per unit effort (dashed line) from California Department of Fish and Game, http://nrm.dfg.ca.gov/documents/ContextDocs.aspx?cat=R3-StripedBassStudy.
Figure 18. Population abundance estimates of sub-adult striped bass (age-1 and age-2). From Loboschefsky et al. (2012) Figure 3.
Bay-Delta Fisheries Resources: Pelagic Organisms
60 Other Pelagic Organisms September 14, 2012
Contaminants may also explain some of the decline in striped bass abundance. Ostrach et al. (2008) examined maternal transfer of contaminants in striped bass and reported: “The results from this study clearly demonstrate that xenobiotics are adversely affecting early-life-stage striped bass in the San Francisco Estuary and need to be considered as one of multiple stressors affecting the continuing population decline.” Ostrach et al. (2008) further concluded: “Our results indicate that pesticides not in use for decades, such as DDT and its degradation products, are still persistent in the estuary and are being made bioavailable by recycling through the food chain to apex predators. Furthermore, our results show that these contaminants are being transferred to their progeny in biologically relevant levels.”
Further analysis found results consistent with the earlier studies (Ostrach et al. 2009). In addition, Sommer (2008) reported that the sex ratio of young of the year striped bass in the Delta is heavily skewed toward male (90:10 male:female). While the cause of this skewed sex ratio is unknown at this time, exposure to endocrine disrupting chemicals cannot be ruled out.

Bay-Delta Fisheries Resources: Pelagic Organisms
September 14, 2012 Other Pelagic Organisms · 61
9.0 California Bay Shrimp
9.1 Introduction and Summary
A relationship between the location of the X2 isohaline in the estuary and California bay shrimp abundance has continued without change after invasion of the Amur River clam in 1986 (Kimmerer et al. 2009). No known mechanism of effect has been identified for how California bay shrimp respond to estuarine flows, but it is hypothesized to be increased passive upstream transport of juvenile shrimp by strong bottom currents due to gravitational circulation (Siegfried 1989; Moyle 2002).
Glibert et al. (2011) found that bay shrimp abundance, as measured by the FMWT, was related to nutrients as well as to the location of X2, leading to uncertainty as to whether salinity (a proxy for through-Delta flow) or nutrients are the controlling variable.
9.2 California Bay Shrimp Biology
California bay shrimp, Crangon franciscorum, occurs in coastal bays along the Pacific Coast of North America from southeastern Alaska to at least San Diego, CA (Wang 1986). Two other closely related shrimp also exist in the Bay-Delta, the black shrimp Crangon nigricauda and the blue-spotted shrimp Crangon nigromaculata. Both of these prefer higher salinity water and are not associated with the eastern reach of the estuary and the Delta. Adult California bay shrimp feed on bay bottoms on crustaceans, polychaetes, mollusks, foraminiferans, and plant material. Amphipods are the most frequently ingested (Wang 1986; Siegfried 1989). Crangon shrimp live for approximately two years. They are an important food resource of the principal sport and commercial fisheries of Pacific Coast estuaries (Wang 1986). A bait fishery accounts for a small annual harvest.
Bay shrimp spawn in bay waters and may spawn multiple times (Wang 1986). The larvae are initially found in near-surface waters of the bay, while later stage larvae are associated with the bottom of the water column. This places them in favorable position for dispersal up-estuary by gravitational circulation. Their abundance commonly peaks in spring and summer in low-salinity waters (Wang 1986). As the juveniles mature, they move to higher salinity waters. By fall the late-juveniles move back out into bay waters, apparently related to reproduction. Annual abundance of bay shrimp has been linked to the volume of through flows to San Francisco Bay (Wang 1986; Kimmerer et al. 2009).
The distribution of the opossum shrimp is associated with the distribution of bay shrimp in the estuary; its density is greater in locations where mysids are abundant (Siegfried 1980). The abundances of early and mid-stage bay shrimp larvae in the estuary – the only stages using the upper estuary – are negatively correlated with estuary through flow (Kimmerer et al. 2009). In years of high freshwater outflow, a larger proportion of the reproductive population moves from bays to the near-shore coastal area, resulting in more larvae hatched outside the bays (Siegfried 1986), but with no apparent reduction in overall population size(s) as a result of diminished flows.

Bay-Delta Fisheries Resources: Pelagic Organisms
62 Other Pelagic Organisms September 14, 2012
9.3 Environmental Factors Affecting California Bay Shrimp
Organochlorine pesticide toxicity to bay shrimp has been reported (Wang 1986 and references therein). Its lethal threshold was estimated to be 100 ppb, while sub-lethal effects include increased physical activity, and decreased feeding and molting rates (Wang 1986).
The relationship between bay shrimp and the opossum shrimp (N. mercedis) suggests a more important effect. The effect of the invasive Amur River clam on N. mercedis abundance is well documented in the literature; Glibert et al. (2011) found that nutrient forms and ratios predicted N. mercedis abundances better than the location of X2 in the estaury (Figure 19). Flows do not alter the nutrient ratios. Glibert (2010) points out that the current strategy of salinity management will likely show little beneficial effect on phytoplankton, zooplankton, or fish. Rather, regulation of effluent nitrogen discharge through nitrification and denitrification offers an alternative management strategy with a history of success in other estuaries (see PWA submittal Ecosystem Changes to the Bay-Delta Estuary: A Technical Assessment of Available Scientific Information, pp. 2-28 to 2-39).

Bay-Delta Fisheries Resources: Pelagic Organisms
September 14, 2012 Other Pelagic Organisms · 63
-1
1
3
1 2 3 4 5
DIN:TP (wt:wt)
Log FM
WT C
atch Per To
w
-1
1
3
Log NH4 (mg/L-1)
60 80X2 (km)
A
B
C
3
2
1
Log A
bu
nd
ance In
dex
Figure 19. Change in abundance of California bay shrimp over time in relation to (A) spring X2 location, (B) ammonium, (C) nitrogen:phosphorus ratio. Abundance data is log transformed. 1975-1986 (circles); 1987-1999 (diamonds); post-1999 (squares). (A) from Kimmerer et al. (2009) Figure 3; (B) and (C) from Glibert et al. (2011) Figure 16.

Bay-Delta Fisheries Resources: Pelagic Organisms
64 Cited References September 14, 2012
Cited References
Adams PB, Grimes CB, Lindley ST, Moser ML. 2002. Status review for North American green sturgeon, Acipenser medirostris. NOAA, National Marine Fisheries Service, Southwest Fisheries Science Center, Santa Cruz, CA. 50 pp.
Alpine AE, Cloern JE. 1992. Trophic interactions and direct physical effects control phytoplankton biomass and production in an estuary. Limnology and Oceanography 37(5):946-955.
Ambler JW, Cloern JE, Hutchinson A. 1985. Seasonal cycles of zooplankton from San Francisco Bay. Hydrobiologia 129:177-197.
Baxter R, Breuer R, Brown L, Conrad L, Feyrer F, Fong S, Gehrts K, Grimaldo L, Herbold B, Hrodey P, Mueller-Solger A, Sommer T, Souza K. 2010. 2010 pelagic organism decline work plan and synthesis of results. Interagency Ecological Program for the San Francisco Estuary report dated 12/6/2010.
Baxter R. 1999. Osmeridae. Pages 179–216 in Orsi J, editor. Report on the 1980-1995 fish, shrimp, and crab sampling in the San Francisco Estuary, California. California Department of Fish and Game, Technical Report 63, Stockton.
Baxter RD, Nobriga ML, Slater SB, Fujimura RW. 2009. State Water Project effects on longfin smelt. California Department of Fish and Game.
Bay-Delta Conservation Plan. 2012. Conservation strategy (Sections 3.4 and 3.5). Administrative draft. 238 pp.
Beamesderfer R, Simpson M, Kopp G, Inman J, Fuller A, Demko D. 2004. Historical and current information on green sturgeon occurrence in the Sacramento and San Joaquin rivers and tributaries. S.P. Cramer & Associates, Inc. 44 pp.
Beamesderfer R, Simpson M, Kopp G. 2007. Use of life history information in a population model for Sacramento green sturgeon. Environmental Biology of Fishes 79:315-337.
Becker S. 1991. Recommended guidelines for measuring conventional marine water-column variables in Puget Sound. Report for US Environmental Protection Agency and Puget Sound Water Quality Authority, May 1991.
Beggel S, Werner I, Connon RE, Geist J. 2010. Sublethal toxicity of commercial insecticide formulations and their active ingredients to larval fathead minnow (Pimephales promelas). Science of the Total Environment 408:3169-3175.
Bennett WA, Kimmerer WJ, Burau JR. 2002. Plasticity in vertical migration by native and exotic estuarine fishes in a dynamic low-salinity zone. Limnology and Oceanography 47(5):1496-1507.

Bay-Delta Fisheries Resources: Pelagic Organisms
September 14, 2012 Cited References · 65
Bennett WA, Hobbs JA, Teh SJ. 2008. Interplay of environmental forcing and growth-selective mortality in the poor year-class success of delta smelt in 2005. Final report: Fish otolith and condition study 2005. Prepared for the POD Management Team of the Interagency Ecological Program for the San Francisco Estuary. 30 pp.
Bennett WA, Moyle PB. 1996. Where have all the fishes gone? Interactive factors producing fish declines in the Sacramento-San Joaquin Delta. In Hollibaugh JT (ed.) San Francisco Bay: The Ecosystem. Pacific Division of the American Association for the Advancement of Science. 542 pp.
Bennett WA. 1998. Silversides, smelt, and the slough of dreams: Who will come if we restore it? Proceedings of San Francisco Estuary Institute workshop 4/25/1998 "Biological Invasions in Aquatic Ecosystems: Impacts on Restoration and Potential for Control".
Bennett WA. 2005. Critical assessment of the delta smelt population in the San Francisco estuary, California. San Francisco Estuary and Watershed Science 3(2).
Berg GM, Glibert PM, Jorgensen NOG, Balode M, Purina I. 2001. Variability in inorganic and organic nitrogen uptake associated with riverine nutrient input in the Gulf of Riga, Baltic Sea. Estuaries 24: 176-186.
Boehloert GW, Morgan JB. 1985. Turbidity enhances feeding abilities of larval Pacific herring, Clupea harengus pallasi. Hydrobiologia 123: 161-170.
Brooks ML, Fleishman E, Brown LR, Lehman PW, Werner I, Scholz N, Mitchelmore C, Lovvorn JR, Johnson ML, Schlenk D, van Drunick S, Drever JI, Stoms DM, Parker AE, Dugdale R. 2012. Life histories, salinity zones, and sublethal contributions of contaminants to pelagic fish declines illustrated with a case study of San Francisco Estuary, California, USA. Estuaries and Coasts 35(2):603-321.
Brown LR. 2003. Will tidal wetland restoration enhance populations of native fishes? San Francisco Estuary and Watershed Science 1(1).
Brown LR, Baxter R, Castillo G, Conrad L, Culberson S, Erickson G, Feyrer F, Fong S, Gehrts K, Grimaldo L, Herbold B, Kirsch J, Mueller-Solger A, Slater S, Sommer T, Souza K, Van Nieuwenhuyse E. 2012. Draft synthesis of studies in the fall low salinity zone of the San Francisco Estuary, September-December 2011. US Geological Survey. Embargoed draft. 182 pp.
Brown LR, Greene S, Coulston P, Barrow S. 1996. An evaluation of the effectiveness of fish salvage operations at the intake of the California Aqueduct, 1979-1993. In Hollibaugh (ed) San Francisco Bay: The Ecosystem, San Francisco, CA. 542 pp.
Brown LR. 2003. Will tidal wetland restoration enhance populations of native fishes? San Francisco Estuary and Watershed Science 1(1).
Brown T. 2009. Phytoplankton community composition: The rise of the flagellates. IEP Newsletter 22(3):20-28.

Bay-Delta Fisheries Resources: Pelagic Organisms
66 Cited References September 14, 2012
California Department of Fish and Game. 2008. A status review of the threatened delta smelt (Hypomesus transpacificus) in California. Report to California Fish and Game Commission.
Cappiella K, Malzone C, Smith R, Jaffe B. 1999. Sedimentation and bathymetry changes in Suisun Bay: 1867-1990. USGS open-file report 99-563. US Geological Survey. Menlo Park, CA.
Carlton JT, Thompson JK, Schemel LE, Nichols FH. 1990. Remarkable invasion of San Francisco Bay (California, USA) by the Asian clam Potamocorbula amurensis. Marine Ecology Progress Series 66:81-94.
Caro T. 2010. Conservation by proxy. Island Press. Washington, D.C.
Caro TJ, Sih E, Sih A. 2005. Use of substitute species in conservation biology. Conservation Biology 19:1821-1826.
Cavallo B, Schumer G, Gaskill P. 2011. Use of real-time quantitative polymerase chain reaction to detect delta smelt DNA in the stomach contents of predators. Cramer Fish Sciences. Technical review report.
Chigbu P, Sibley TH, Beuchamp DA. 1998. Abundance and distribution of Neomysis mercedis and a major predator, longfin smelt (Spirinchus thaleichthys) in LakeWashington. Hydrobioilogia 386:167-182.
Cloern JE. 1987. Turbidity as a control on phytoplankton biomass and productivity in estuaries. Continental Shelf Research 7(11/12):1367-1381.
Cloern JE. 2007. Habitat connectivity and ecosystem productivity: Implications from a simple model. The American Naturalist 169:E21–E33.
Cloern JE, Knowles N, Brown LR, Cayan D, Dettinger MD, Morgan TL, Schoellhamer DH, Stacey MT, van der Wegen M, Wagner RW, Jassby AD. 2011. Projected evolution of California’s San Francisco Bay-Delta river system in a century of climate change. PLoS ONE 6(9).
Contreras D. 2011. 2011 Summer Townet Survey Delta Smelt Index. Memorandum. Sacramento, California: Author.
Dale VH, Beyeler SC. 2001. Challenges in the development and use of ecological indicators. Ecological Indicators 1:3-10.
Dege M, Brown LR. 2004. Effect of outflow on spring and summertime distribution and abundance of larval and juvenile fishes in the upper San Francisco estuary. American Fisheries Society Symposium 39:49-65.
Deri E, Magura T, Horvath R, Kisfali M, Ruff G, Lengyel S, Tothmeresz B. 2010. Measuring the short-term success of grassland restoration: The use of habitat affinity indices in ecological restoration. Restoration Ecology DOI: 10.1111/j.1526-100X.2009.00631.x.

Bay-Delta Fisheries Resources: Pelagic Organisms
September 14, 2012 Cited References · 67
Deriso RB. 2011. Declaration of Dr. Richard B. Deriso in support of Plantiffs' motion for injunctive relief dated 01/28/2011. Delta smelt consolidated cases 1:09-cv-00407-OWW-DLB, document 772.
Dugdale RC, Wilkerson FP, Hogue VE, Marchi A. 2007. The role of ammonium and nitrate in spring bloom development in San Francisco Bay. Estuarine, Coastal and Shelf Science 73:17-29.
Duke S, Anders P, Ennis G, Hallock R, Hammond J, Ireland S, Laufle J, Lauzier R, Lockhard L, Marotz B, Paragamian VL, Westerhof R. 1999. Journal of Applied Ichthyology 15:157-163.
Dunham J, Rieman B, Chandler G. 2003. Influences of temperature and environmental variables on the distribution of bull trout within streams at the southern margin of its range. North American Journal of Fisheries Management 23:894-904.
Feyrer F, Herbold B, Matern S, Moyle PB. 2003. Dietary shifts in a stressed fish assemblage: Consequences of a bivalve invasion in the San Francisco Estuary. Environmental Biology of Fishes 67: 277–288.
Feyrer F, Hobbs J, Baerwald M, Sommer T, Yin Q, Clark K, May B, Bennett W. 2007. Otolith microchemistry provides information complementary to microsatellite DNA for a migratory fish. Transactions of the American Fisheries Society 136:469-476.
Feyrer F, Newman K, Nobriga M, Sommer T. 2011. Modeling the Effects of Future Outflow on the Abiotic Habitat of an Imperiled Estuarine Fish. Estuaries and Coasts 34:120-128.
Feyrer F, Nobriga M, Sommer T. 2007. Multi-decadal trends for three declining fish species: habitat patterns and mechanisms in the San Francisco estuary. Canadian Journal of Fisheries and Aquatic Sciences 64: 723-734.
Feyrer F, Sommer T, Hobbs J. 2007. Living in a dynamic environment: Variability in life history traits of age-0 splittail in tributaries of San Francisco Bay. Transactions of the American Fisheries Society 136:1393-1405.
Foott JS, True K, Stone R. 2006. Histological evaluation and viral survey of juvenile longfin smelt (Spirinchus thaleichthys) and threadfin shad (Dorosoma petenense) collected from the Sacramento-San Joaquin River Delta, April-November 2006. U.S. Fish and Wildlife Service, California-Nevada Fish Health Center.
Foott JS, True K, Stone R. 2008. Histological evaluation and viral survey of juvenile longfin smelt (Spirinchus thaleichthys) and threadfin shad (Dorosoma petenense) collected from the Sacramento-San Joaquin River Delta, April-November 2007. U.S. Fish and Wildlife Service, California-Nevada Fish Health Center.
Ganju NK, Jaffe BE, Schoellhamer DH. 2011. Discontinuous hindcast simulations of estuarine bathymetric change: A case study from Suisun Bay, California. Estuarine, Coastal and Shelf Science 93:142-150.
Bay-Delta Fisheries Resources: Pelagic Organisms
68 Cited References September 14, 2012
Ganju NK, Schoelhamer DH, Jaffe BE. 2009. Hindcasting of decadal-timescale estuarine bathymetric change with a tidal-timescale model. Journal of Geophysical Research 114, F04019., doi:10.1029/2008JF001191.
Glibert P. 2012. Ecological stoichiometry and its implications for aquatic ecosystem sustainability. Current Opinion in Environmental Sustainability 4:1-6.
Glibert PM, 2010. Long-term changes in nutrient loading and stoichiometry and their relationships with changes in the food web and dominant pelagic fish species in the San Francisco estuary, California. Reviews in Fishery Science 18(2):211-232.
Glibert PM, Heil CA, Hollander D, Revilla M, Hoare A, Alexander J, Murasko S. 2004. Evidence for dissolved organic nitrogen and phosphorous uptake during a cyanobacterial bloom in Florida bay. Marine Ecological Progress Series 280:73-83.
Glibert PM, Harrison J, Heil CA, Seitzinger S. 2006. Escalating worldwide use of urea – a global change contributing to coastal eutrophication. Biogeochemistry 77: 441-463.
Glibert PM, Fullerton D, Burkholder JM, Cornwell JC, Kana TM. 2011. Ecological stoichiometry, biogeochemical cycling, invasive species and aquatic food webs: San Francisco estuary and comparative systems. Reviews in Fishery Science 19(4):358-417.
Gould AL, Kimmerer WJ. 2010. Development, growth, and reproduction of the cyclopoid copepod Limnoithona tetraspina in the upper San Francisco Estuary. Marine Ecology Progress Series 412:163-177.
Greene VE, Sullivan SJ, Thompson JK, Kimmerer WJ. 2011. Grazing impact of the invasive clam Corbula amurensis on the microplankton assemblage of the northern San Francisco Estuary. Marine Ecology Progress Series 431:183-193.
Hamilton SA, Murphy DD. In prep. Habitat affinity analysis as a tool to guide environmental restoration for an imperiled estuarine fish: the case of the delta smelt in the Sacramento-San Joaquin Delta.
Hieb K, Fleming K. 1999. Summary chapter. In: Orsi J (ed). Report on the 1980-1995 fish, shrimp and crab sampling in the San Francisco Estuary, California. Interagency Ecological Program for the San Francisco Estuary Technical Report 63. 503 pp.
Hobbs JA, Lewis LS, Ikemiyagi N, Sommer T, Baxter R. 2010. Identifying critical nursery habitat for an estuarine fish with otolith strontium isotopes. Environmental Biology of Fishes 89:557-569.
Huggett RJ, Anderson JJ, Campana ME, Dunne T, Giorgi AE, Glibert PM, Klein CA, Luoma SN, McGuire MJ, Miller T, Obeysekera J, Pfeffer MJ, Reed DJ, Rose KA, Tullos DD. 2010. A Scientific Assessment of Alternatives for Reducing Water Management Effects on Threatened and Endangered Fishes in California’s Bay Delta. National Academies Press. Washington, D.C. 94 pp.

Bay-Delta Fisheries Resources: Pelagic Organisms
September 14, 2012 Cited References · 69
Hunsaker C, Carpenter D, Messer J. 1990. Ecological indicators for regional monitoring. Bulletin of the Ecological Society of America 71:165-172.
Jaffe BE, Smith RE, Torresan LZ. 1998. Sedimentation and bathymetric change in San Pablo Bay: 1856-1983. USGS open-file report 98-759. US Geological Survey. Menlo Park, CA.
Jassby AD. 2008. Temperature trends at several sites in the upper San Francisco Estuary. Unpublished report dated, June 2, 2008.
Jassby AD, Cloern JE, Cole BE. 2002. Annual primary production: Patterns and mechanisms of change in a nutrient-rich tidal ecosystem. Limnology and Oceanography 47(3):698-712.
Jassby AD, Kimmerer WJ, Monismith SG, Armor C, Cloern CE, Powell M, Vendlinski JR. 1995. Isohaline position as a habitat indicator for estuarine populations. Ecological Applications 5: 272-289.
Kimmerer W, Gross E, MacWilliams M. 2009. Is the response of estuarine nekton to freshwater flow in the San Francisco Estuary explained by variation in habitat volume? Estuaries and Coasts 32:375-389.
Kimmerer W. 2002. Effects of freshwater flow on abundance of estuarine organisms: physical effects or trophic linkages? Marine Ecology Progress Series 243: 39-55.
Kimmerer W. 2004. Open water processes of the San Francisco Estuary: From physical forcing to biological responses. San Francisco Estuary and Watershed Science 2(1).
Kimmerer WJ, Cowan Jr. JH, Miller LW, Rose KA. 2000. Analysis of an estuarine striped bass (Morone saxatilis) population: Influence of density-dependent mortality between metamorphosis and recruitment. Canadian Journal of Fisheries and Aquatic Science 57:478-486.
Kimmerer WJ, Gartside E, Orsi JJ. 1994. Predation by an introduced clam as the likely cause of substantial declines in zooplankton of San Francisco Bay. Marine Ecology Progress Series 113:81-93.
Kimmerer WJ. 2004. Open water processes of the San Francisco Estuary: From physical forcing to biological responses. San Francisco Estuary and Watershed Science 2(1), Article 1.
Kimmerer WJ. 2006. Response of anchovies dampens effects of the invasive bivalve Corbula amurensis on the San Francisco estuary foodweb. Marine Ecology Progress Series 324:207-218.
Kucas ST Jr. 1986. Species profiles: Life histories and environmental requirements of coastal fishes and invertebrates (Pacific Southwest) - northern anchovy. US Fish and Wildlife Service biological report 82(11.50). US Army Corps of Engineers, TR EL-82-4. 11 pp.
Bay-Delta Fisheries Resources: Pelagic Organisms
70 Cited References September 14, 2012
Lam VWY, Cheung WWL, Close C, Hodgson S, Watson R, Pauly D. 2008. Modeling seasonal distribution of pelagic marine fishes and squids. In Cheung WWL, Lam VWY, Pauly D (eds.) Modeling present and climate-shifted distribution of marine fishes and invertebrates. Fisheries Centre Research Report 16(3). Fisheries Centre, University of British Columbia.
Landres PB, Verner J, Thomas JW. 1988. Ecological uses of vertebrate indicator species: a critique. Conservation Biology 2:316-328.
Lawson TA, Hilborn R. 1985. Equilibrium yields and yield isopleths from a general age-structured model of harvested populations. Canadian Journal of Fisheries and Aquatic Science 42:1766-1771.
Leidy RA. 2007. Ecology, assemblage, structure, distribution, and status of fishes in streams tributary to the San Francisco estuary. San Francisco Estuary Institute. Contribution No. 530.
Lindberg J, Baskerville-Bridges B, Doroshov S. 2000. Update on delta smelt culture with and emphasis on larval feeding behavior. IEP Newsletter 13(1):45-49.
MacNally R, Thomson JR, Kimmerer WJ, Feyrer F, Kewman KB, Sih A, Bennett WA, Brown L, Fleischman E, Culberson SD, Castillo G. 2010. Analysis of pelagic species decline in the upper San Francisco Estuary using multivariate autoregressive modeling (MAR). Ecological Applications 20(5):1417-1430.
Maunder MN, Deriso RB. 2011. A state-space multi-stage lifecycle model to evaluate population impacts in the presence of density dependence: illustrated with application to delta smelt. Canadian Journal of Fisheries and Aquatic Science 68:1285-1306.
Miller WJ, Manly BFJ, Murphy DD, Fullerton D, Ramey RR. 2012. An investigation of factors affecting the decline of delta smelt (Hypomesus transpacificus) in the Sacramento-San Joaquin Estuary. Reviews in Fisheries Science 20: 1-19.
Monismith SG, Burau JR, Stacey MT. 1996. Stratification dynamics and gravitational circulation in northern San Francisco Bay. In Hollibaugh JT (ed) San Francisco Bay: The Ecosystem. American Association for the Advancement of Science.
Mora EA, Lindley ST, Erickson DL, Klimley AP. 2009. Do impassable dams and flow regulation constrain the distribution of green sturgeon in the Sacramento River, California? Journal of Applied Ichthyology 25:39-47.
Moyle P B. 2002. Inland fishes of California. University of California Press, Berkeley, CA. 502 pp.
Moyle PB, Baxter RD, Sommer TR, Foin TC, Matern SA. 2004. Biology and population dynamics of Sacramento splittail (Pogonichthys macrolepidotus) in the San Francisco estuary: A review. San Francisco Estuary and Watershed Science 2(2).

Bay-Delta Fisheries Resources: Pelagic Organisms
September 14, 2012 Cited References · 71
Moyle PB, Lund JR, Bennett WA, Fleenor WE. 2010. Habitat variability and complexity in the upper San Francisco estuary. San Francisco Estuary and Watershed Science 8(3).
Murphy DD, Weiland PS, Cummins KW. 2011. A critical assessment of the use of surrogate species in conservation planning in the Sacramento-San Joaquin California (U.S.A.). Conservation Biology 25:873-878.
National Marine Fisheries Service. 2005. Green sturgeon (Acipenser medirostris) status review update. Southwest Science Center, Santa Cruz, CA. 31 pp.
National Marine Fisheries Service. 2009. Designation of critical habitat for the Southern Distinct Population Segment of North American green sturgeon. October 2009. Prepared by NMFS, Southwest Region, Long Beach, CA. 144 pp.
Niemi GJ, McDonald ME. 2004. Application of ecological indicators. Annual Reviews in Ecology, Evolution, and Systematics 35:89-111.
Nixon SW. 1988. Physical energy inputs and the comparative ecology of lake and marine ecosystems. Limnology and Oceanography 33(4, Part 2):1005-1025.
Nobriga M, Sommer T, Feyrer F, Fleming K. 2008. Long-term trends in summertime habitat suitability for delta smelt (Hypomesus transpacificus). San Francisco Estuary and Watershed Science 6(1).
Nobriga ML, Feyrer F. 2007. Shallow-water piscivore-prey dynamics in California’s Sacramento-San Joaquin Delta. San Francisco Estuary and Watershed Science 5(2).
Orsi JJ, Mecum WL. 1996. Food limitation as the probable cause of a long-term decline in the abundance of Neomysis mercedis the opossum shrimp in the Sacramento-San Joaquin estuary. In Hollibaugh JT (ed) San Francisco Bay: The Ecosystem. 542 pp.
Osborn K. 2012 (July 18). 2012 Summer Townet Survey age-0 delta smelt index. California Department of Fish and Game memorandum to Scott Wilson.
Ostrach D, Low-Marchelli J, Eder K, Whiteman S, Zinkl J. 2008. Maternal transfer of xenobiotics and effects on larval striped bass in the San Francisco Estuary. Proceedings of the National Academy of Sciences 105(49):19354-19359.
Ostrach D, Weber P, Ginn T, Loge F. 2009. The role of contaminants, within the context of multiple stressors, in the collapse of the striped bass population in the San Francisco estuary and its Watershed. Year 2 final report for DWR Agreement No. 4600004664.
Peterson HA, Vayssières M. 2010. Benthic assemblage variability in the upper San Francisco estuary: A 27-year retrospective. San Francisco Estuary and Watershed Science 8(1).
Poff NL, Allan JD, Bain MB, Karr JR, Prestegaard KL, Richter BD, Sparks RE, Stromberg JE. 1997. The natural flow regime: A paradigm for river conservation and restoration. BioScience 47(11):769-784.
Bay-Delta Fisheries Resources: Pelagic Organisms
72 Cited References September 14, 2012
Robinson CJ. 2004. Responses of the northern anchovy to the dynamics of the pelagic environment: Identification of fish behaviours that may leave the population under risk of overexploitation. Journal of Fish Biology 64(4):1072-1087.
Rosenfield JA, Baxter RD. 2007. Population dynamics and distribution patterns of longfin smelt in the San Francisco estuary. Transactions of the American Fisheries Society 136:1577-1592.
Rosenfield JA. 2010. Life history conceptual model and sub-models for longfin smelt, San Francisco Estuary population. Delta Regional Ecosystem Restoration Implementation Plan, dated 5/2010.
Ruhl CA, Shoellhamer DH. 2004. Spatial and temporal variability of suspended sediment concentrations in a shallow estuarine environment. San Francisco Estuary and Watershed Science 2(2).
Schemel LE, Sommer TR, Mueller-Solger AB, Harrell WC. 2004. Hydrologic variability, water chemistry, and phytoplankton biomass in a large floodplain of the Sacramento River, CA, U.S.A. Hydrobiologia 513:129-139.
Schloss J. 2002. Murky waters: Gaining clarity on water transparency measurements. Clean Water Team Guidance Compendium for Watershed Monitoring and Assessment. New Hampshire State Department of Water Resources, Division of Water Quality.
Schoellhamer DH. 2011. Sudden clearing of estuarine waters upon crossing the threshold from transport to supply regulation of sediment transport as an erodible sediment pool is depleted: San Francisco Bay, 1999. Estuaries and Coasts 34:885-899.
Siegfried CA. 1980. Seasonal abundance and distribution of Crangon franciscorum and Palaemon macrodactylus (Decapoda, Caridea) in the San Francisco Bay-Delta. Biological Bulletin 159:177-192.
Siegfried CA. 1989. Species profiles: Life histories and environmental requirements of coastal fishes and invertebrates (Pacific Southwest) – Crangonid shrimp. US Fish and Wildlife Service. Biological Report 82(11.125). US Army Corps of Engineers TR EL82-4. 18 pp.
Sommer T, Armor C, Baxter R, Breuer R, Brown L, Chotkowski M, Culberson S, Feyrer F, Gingras M, Herbold B, Kimmerer W, Mueller-Solger A, Nobriga M, Souza K. 2007. The collapse of pelagic fishes in the upper San Francisco Estuary. Fisheries 32:270–277.
Sommer T, Mejia F, Hieb K, Baxter R, Loboschevsky E, Loge F. 2011. Long-term shifts in the lateral distribution of age-0 striped bass in the San Francisco estuary. Transactions of the American Fisheries Society 140:1451-1459.
Sommer T, Mejia F. In review. A place to call home: A synthesis of delta smelt habitat in the upper San Francisco estuary. San Francisco Estuary and Watershed Science.

Bay-Delta Fisheries Resources: Pelagic Organisms
September 14, 2012 Cited References · 73
Sommer TR, Baxter RD, Feyrer F. 2007. Splittail "delisting": A review of recent population trends and restoration activities. American Fisheries Society Symposium 53:25–38.
Sommer TR, Baxter RD, Herbold B. 1997. Resilience of splittail in the Sacramento-San Joaquin estuary. American Fisheries Society 126:961-976.
Sommer TR, Reece K, Feyrer F, Baxter R, Baerwald M. 2010. Splittail persistence in the Petaluma River. IEP Newsletter 21:9-79.
Spies RB, Rice Jr DW, Felton J. 1988. Effects of organic contaminants on reproduction of the starry flounder Platichthys stellatus in San Francisco Bay. Marine Biology 98:181-189.
Sterner RW, Elser JJ. Ecological stoichiometry: The biology of elements from molecules to the biosphere. Princeton, NJ: Princeton University Press. 439 pp.
Stevens DE, Miller LW. 1983. Effects of river flow on abundance of young Chinook salmon, American shad, longfin smelt, and delta smelt in the Sacramento-San Joaquin River system. North American Journal of Fisheries Management 3:425-437.
Stevens DE. 1966. Distribution and food habits of the American shad, Alosa sapidissima, in the Sacramento-San Joaquin Delta. California Fish and Game 136:97-107.
Strayer DL, Hattala KA, Kahnle AW. 2004. Effects of an invasive bivalve (Dresseina polymorpha) on fish in the Hudson River estuary. Canadian Journal of Fisheries and Aquatic Science 61:924-941.
Swanson C, Young PS, Cech Jr. JJ. 1998. Swimming performance of delta smelt: Maximum performance, and behavioral, and kinematic limitations on swimming at submaximal velocities. Journal of Experimental Biology 201: 333-345.
Swanson C, Reid T, Young PS, Cech Jr. JJ. 2000. Comparative environmental tolerances of threatened delta smelt (Hypomesus transpacificus) and introduced wakasagi (H. nipponensis) in an altered California estuary. Oecologia 123:384-390.
Sweetnam DA. 1999. Status of delta smelt in the Sacramento-San Joaquin estuary. California Fish and Game 85:22-27.
The Bay Institute. 1998. From the Sierra to the sea: The ecological history of the San Francisco Bay-Delta watershed. The Bay Institute of San Francisco. 286 pp.
Thomson JR, Kimmerer WJ, Brown LR, Newman KB, MacNally R, Bennett WA, Feyrer F, Fleishman E. 2010. Bayesian change point analysis of abundance trends for pelagic fishes in the upper San Francisco Estuary. Ecological Applications 20(5):1431-1448.
Uhlén M. 2008. Affinity as a tool in life science. BioTechniques 44:649-654.
University of California, Davis. 2012. 2011 delta smelt predation project update. University of California, Davis.

Bay-Delta Fisheries Resources: Pelagic Organisms
74 Cited References September 14, 2012
University of California, Davis, Aquatic Ecosystems Analysis Laboratory. 2009. Pharmaceuticals and personal care products in surface water - Occurrence, fate and transport, and effect on aquatic organisms. Report to State Water Resources Control Board, October 2009.
US Bureau of Reclamation. 2011. Adaptive management of fall outflow for delta smelt protection and water supply reliability, milestone draft. US Bureau of Reclamation.
US Fish and Wildlife Service. 1995. Recovery plan for the Sacramento-San Joaquin Delta native fishes. US Fish and Wildlife Service, Portland, OR.
US Fish and Wildlife Service. 1996. Recovery plan for the Sacramento-San Joaquin Delta native fishes. US Department of the Interior, Region 1, Portland, OR. 208 pp.
US Fish and Wildlife Service. 2008. Delta smelt biological opinion on the coordinated operations of the Central Valley Project and State Water Project. 396 pp.
US Fish and Wildlife Service. 2010. Endangered and Threatened Wildlife and Plants; 12-month finding on a petition to list the Sacramento splittail as endangered or threatened. 50 CFR Part 17, Docket No. FWS-R8-ES-2010-0013.
US Fish and Wildlife Service. 2012. Notice of 12-month petition finding. Federal Register 50:17, Docket No. FWS-R8-ES-2008-0045.
US Fish and Wildlife Service. 2012b. Technical Staff Comments to the State Water Resources Control Board re: the Comprehensive (Phase 2) Review and Update to the Bay-Delta Plan. 63 pp.
van Geen A, Luoma SN. 1999. The impact of human activities on sediments of San Francisco Bay, California: An overview. Marine Chemistry 94:1-6.
Van Nieuwenhuyse EE. 2007. Response of summer chlorophyll concentration to reduced phosphorus concentration in the Rhine River (Netherlands) and the Sacramento-San Joaquin Delta (California, USA). Canadian Journal of Fisheries and Aquatic Science 64:1529-1542.
Wagner RW, Stacey M, Brown LR, Dettinger M. 2011. Statistical models of temperature in the Sacramento-San Joaquin Delta under climate-change scenarios and ecological implications. Estuaries and Coasts 34:544-556.
Wang JCS. 1986. Fishes of the Sacramento-San Joaquin estuary and adjacent waters, California: A guide to the early life histories. Interagency Ecological Program, technical report no. 9.
Wanger O. 2011. Findings of fact and conclusions of law re. plaintiffs' request or injunctive relief against implementation of RPA component 3 (Action 4) (Doc. 1013). Dated 8/31/2011.

Bay-Delta Fisheries Resources: Pelagic Organisms
September 14, 2012 Cited References · 75
Wenger SJ. 2008. Use of surrogates to predict the stressor response of imperiled species. Conservation Biology 22:1564-1571.
Weiland PS, Murphy DD. 2011. The route to best science in implementation of the Endangered Species Act’s consultation mandate: the benefits of structured effects analysis. Environmental Management 47:167-172.
Weston DP, Lydy ML. 2010. Urban and agricultural sources of pyrethroid insecticides to the Sacramento-San Joaquin Delta of California. Environmental Science and Technology 44(5):1833-1840.
Winder M, Jassby AD. 2010. Shifts in zooplankton community structure: Implications for food web processes in the upper San Francisco estuary. Estuaries and Coasts 34(4):675-690.
Wright SA, Schoellhamer DH. 2004. Trends in the sediment yield of the Sacramento River, California, 1957-2001. San Francisco Estuary and Watershed Science 2(2).
Wright-Walters M, Volz C. 2009. Municipal wastewater concentrations of pharmaceutical and xeno-estrogens: Wildlife and human health implications. In Proceedings of the National Conference on Environmental Science and Technology 3:103-113.
Young PS, Cech JJ. 1996. Environmental tolerances and requirements of splittail. Transactions of the American Fisheries Society 125:664-678.