Bay Beaches TMDL Staff Report - California State Water ... · PDF fileOakland, CA 94612 ....
147
Appendix C Staff Report Appendix C Staff Report April 13, 2016
Transcript of Bay Beaches TMDL Staff Report - California State Water ... · PDF fileOakland, CA 94612 ....
Appendix C Staff Report
Appendix C
Staff Report
April 13, 2016
This page intentionally left blank

Total Maximum Daily Load for Bacteria at San Francisco Bay Beaches
Staff Report For Proposed Basin Plan Amendment
California Regional Water Quality Control Board San Francisco Bay Region
April 13, 2016
San Francisco Bay Regional Water Quality Control Board 1515 Clay Street, Suite 1400 Oakland, CA 94612 Telephone: (510) 622-2300 Fax: (510) 622-2460 http://www.waterboards.ca.gov/sanfranciscobay/water_issues/programs/TMDLs/SFbaybeachespathogens.shtml

San Francisco Bay Beaches Bacteria TMDL Staff Report April 13, 2016
TABLE OF CONTENTS 1 INTRODUCTION ....................................................................................................................................... 1
1.1 REGULATORY BACKGROUND .......................................................................................................... 1 1.2 DOCUMENT ORGANIZATION ............................................................................................................ 4
2 DESCRIPTION OF IMPAIRED BEACHES ............................................................................................... 5 2.1 AQUATIC PARK BEACH .................................................................................................................. 5 2.2 CANDLESTICK POINT BEACHES ...................................................................................................... 5 2.3 CRISSY FIELD BEACH .................................................................................................................... 6 2.4 MARINA LAGOON BEACHES ........................................................................................................... 8 2.5 CHINA CAMP BEACH ...................................................................................................................... 8 2.6 MCNEARS BEACH .......................................................................................................................... 9
3 PROJECT DEFINITION........................................................................................................................... 10 3.1 PROBLEM STATEMENT ................................................................................................................. 10 3.2 PROJECT DEFINITION ................................................................................................................... 10 3.3 PROJECT OBJECTIVES ................................................................................................................. 11
4 WATER QUALITY STANDARDS ........................................................................................................... 12 4.1 USE OF FECAL INDICATOR BACTERIA IN WATER QUALITY STANDARDS .......................................... 12 4.2 WATER QUALITY STANDARDS ...................................................................................................... 13
4.2.1 Beneficial Uses ...................................................................................................................... 13 4.2.2 Water Quality Objectives ....................................................................................................... 14 4.2.3 Antidegradation ..................................................................................................................... 15
5 BEACH WATER QUALITY DATA .......................................................................................................... 17 5.1 DATA EVALUATION ...................................................................................................................... 17 5.2 AQUATIC PARK BEACH ................................................................................................................ 18 5.3 CANDLESTICK POINT BEACHES .................................................................................................... 21 5.4 CRISSY FIELD BEACH .................................................................................................................. 26 5.5 MARINA LAGOON BEACHES ......................................................................................................... 30 5.6 CHINA CAMP BEACH .................................................................................................................... 33 5.7 MCNEARS BEACH ........................................................................................................................ 35 5.8 HEAL THE BAY REPORT CARD “GRADES” .................................................................................... 37
6 NUMERIC TARGETS .............................................................................................................................. 38 6.1 NUMERIC TARGETS ...................................................................................................................... 38 6.2 IMPLEMENTATION OF THE NUMERIC TARGETS ............................................................................... 39
7 SOURCE ASSESSMENT ........................................................................................................................ 40 7.1 BACKGROUND – BACTERIA FATE AND TRANSPORT ....................................................................... 40 7.2 SOURCES OF BACTERIA TO URBAN BEACHES ............................................................................... 41
7.2.1 Municipal Wastewater Treatment Plant Discharges ............................................................. 41 7.2.2 Sanitary Sewer Collection Systems ...................................................................................... 41 7.2.3 Urban Stormwater Runoff ...................................................................................................... 43 7.2.4 Pets at Beaches .................................................................................................................... 45 7.2.5 Vessels (Recreational, Live-aboard, and Anchor-out Boats) ................................................ 45 7.2.6 Wildlife ................................................................................................................................... 46
7.3 BEACH-SPECIFIC POLLUTANT SOURCES ....................................................................................... 46 7.3.1 Aquatic Park Beach ............................................................................................................... 47 7.3.2 Candlestick Point Beaches .................................................................................................... 49 7.3.3 Crissy Field Beach ................................................................................................................ 51
San Francisco Bay Beaches Bacteria TMDL Staff Report April 13, 2016
7.3.4 Marina Lagoon Beaches ....................................................................................................... 54 7.3.5 China Camp Beach ............................................................................................................... 58 7.3.6 McNears Beach ..................................................................................................................... 59
8 TOTAL MAXIMUM DAILY LOAD AND POLLUTANT ALLOCATIONS ................................................ 61 8.1 GENERAL APPROACH .................................................................................................................. 61 8.2 PROPOSED TOTAL MAXIMUM DAILY LOAD .................................................................................... 61 8.3 PROPOSED LOAD AND WASTELOAD ALLOCATIONS ....................................................................... 62 8.4 MARGIN OF SAFETY ..................................................................................................................... 63 8.5 CRITICAL CONDITIONS ................................................................................................................. 63
9 LINKAGE BETWEEN WATER QUALITY TARGETS AND POLLUTANT SOURCES......................... 65 10 IMPLEMENTATION PLANS AND MONITORING ........................................................................ 66
10.1 IMPLEMENTATION AND MONITORING PLAN ELEMENTS ................................................................... 66 10.1.1 Sanitary Sewer Collection System Actions ........................................................................... 70 10.1.2 Urban Runoff Load Reduction ............................................................................................... 71 10.1.3 Control of Waste from Pets at the Beach .............................................................................. 75 10.1.4 Vessel Load Reduction ......................................................................................................... 76 10.1.5 Reduction of Controllable Loads from Wildlife ...................................................................... 76 10.1.6 Monitor for Effectiveness of Load Reduction Actions............................................................ 77
10.2 IMPLEMENTATION PLANS FOR IMPAIRED BEACHES ........................................................................ 78 10.2.1 Aquatic Park Beach Implementation Plan ............................................................................. 79 10.2.2 Candlestick Point Beaches Implementation Plan.................................................................. 82 10.2.3 Crissy Field Beach Implementation Plan .............................................................................. 85 10.2.4 Marina Lagoon Beaches Implementation Plan ..................................................................... 88 10.2.5 China Camp and McNears Beaches Implementation Plan ................................................... 92
10.3 ADAPTIVE IMPLEMENTATION ......................................................................................................... 92 11 REGULATORY ANALYSES ......................................................................................................... 93
11.1 OVERVIEW ................................................................................................................................... 93 11.2 ENVIRONMENTAL ANALYSIS ......................................................................................................... 93
11.2.1 Project Description ................................................................................................................ 94 11.2.2 Project Objectives ................................................................................................................. 94 11.2.3 Baseline Conditions ............................................................................................................... 95 11.2.4 Reasonably Foreseeable Methods of Compliance ............................................................... 95 11.2.5 Environmental Analysis ......................................................................................................... 97 11.2.6 Cumulative Impact Analysis ................................................................................................ 124
11.3 ALTERNATIVES ANALYSIS .......................................................................................................... 125 11.3.1 Alternative 1 – Water Board TMDL as Proposed ................................................................ 126 11.3.2 Alternative 2 – TMDL with Longer Implementation Time Frames ....................................... 126 11.3.3 Alternative 3 – No TMDL ..................................................................................................... 127 11.3.4 Recommended Program Alternative ................................................................................... 127
11.4 ECONOMIC CONSIDERATIONS ..................................................................................................... 127 11.4.1 Sanitary Sewer Collection Systems .................................................................................... 129 11.4.2 Urban Runoff ....................................................................................................................... 129 11.4.3 Control Wildlife at Beach ..................................................................................................... 131 11.4.4 Vessels (Recreational, Anchor-out, Live-aboard Boats) ..................................................... 131 11.4.5 Costs of Monitoring ............................................................................................................. 132
12 REFERENCES ............................................................................................................................. 134
San Francisco Bay Beaches Bacteria TMDL Staff Report April 13, 2016
LIST OF TABLES TABLE 2.1 ESTIMATED ANNUAL RECREATIONAL USERS - CANDLESTICK POINT BEACHESA ................................... 6 TABLE 4.1 BENEFICIAL USES OF SAN FRANCISCO BAY BEACHES RELEVANT TO BACTERIA TMDL ..................... 14 TABLE 4.2 BASIN PLAN’S RECREATIONAL WATER QUALITY OBJECTIVES FOR BACTERIA .................................... 14 TABLE 4.3 U.S.EPA 2012 RECOMMENDED RECREATIONAL WATER QUALITY CRITERIA .................................... 15 TABLE 5.1 AQUATIC PARK BEACH DATA SUMMARY: 1/2/2008 – 11/24/2014 ................................................... 19 TABLE 5.2 CSDS IN VICINITY OF AQUATIC PARK BEACH: 2008 – 2014A ........................................................... 21 TABLE 5.3 JACKRABBIT BEACH DATA SUMMARY, 1/2/2008 – 11/24/2014 ........................................................ 23 TABLE 5.4 SUNNYDALE COVE DATA SUMMARY, 1/2/2008 – 11/24/2014 .......................................................... 23 TABLE 5.5 WINDSURFER CIRCLE DATA SUMMARY, 1/2/2008 – 11/24/2014 ..................................................... 23 TABLE 5.6 COMBINED SEWER DISCHARGES IN VICINITY OF CANDLESTICK PARK BEACHES: 2008 – 2014A ......... 25 TABLE 5.7 CRISSY FIELD BEACH DATA SUMMARY: 1/2/2008 – 11/24/2014 ..................................................... 26 TABLE 5.8 COMBINED SEWER DISCHARGES IN VICINITY OF CRISSY BEACH: 2008 – 2014A ............................... 28 TABLE 5.9 CRISSY MARSH BACTERIA DATA, 2007A ......................................................................................... 29 TABLE 5.10 PRESIDIO WATERSHED MONITORING DATA SUMMARY .................................................................. 30 TABLE 5.11 PARKSIDE AQUATIC PARK BEACH DATA SUMMARY, 1/2/2008 – 12/22/2014 ................................. 31 TABLE 5.12 LAKESHORE PARK BEACH DATA SUMMARY, 1/2/2008 – 12/22/2014 ............................................. 31 TABLE 5.13 BACTERIA DENSITIES: GOOSE PILOT PERIOD VS. HISTORIC .......................................................... 33 TABLE 5.14 CHINA CAMP BEACH DATA SUMMARY: 4/5/2006 – 10/29/2014 .................................................... 34 TABLE 5.15 MCNEARS BEACH DATA SUMMARY, 2006 – 2008, 2013-2014 ..................................................... 35 TABLE 5.16 HEAL THE BAY BEACH GRADES FOR 2014 .................................................................................... 37 TABLE 6.1 NUMERIC TARGETS FOR SAN FRANCISCO BAY BEACHES ................................................................ 38 TABLE 7.1 SANITARY SEWER SYSTEM COMPONENTS ...................................................................................... 42 TABLE 7.2 POTENTIAL SOURCES OF BACTERIA IN URBANIZED AREAS, EXCLUDING WASTEWATERA .................... 44 TABLE 7.3 SAN FRANCISCO BAY BOAT MARINAS............................................................................................. 46 TABLE 8.1 TOTAL MAXIMUM DAILY LOAD OF FECAL INDICATOR BACTERIA FOR SAN FRANCISCO BAY BEACHES . 62 TABLE 8.2 LOAD AND WASTELOAD ALLOCATIONS FOR SAN FRANCISCO BAY BEACHES ..................................... 62 TABLE 10.1 IMPLEMENTATION PLAN ELEMENTS .............................................................................................. 67 TABLE 10.2 AQUATIC PARK BEACH IMPLEMENTATION PLAN ............................................................................. 79 TABLE 10.3 CANDLESTICK POINT BEACHES IMPLEMENTATION PLAN ................................................................ 82 TABLE 10.4 CRISSY FIELD BEACH IMPLEMENTATION PLAN .............................................................................. 85 TABLE 10.5 MARINA LAGOON BEACHES IMPLEMENTATION PLAN ...................................................................... 90 TABLE 11.1 IMPLEMENTATION PLAN ACTIONS EVALUATED IN THE CEQA ANALYSIS .......................................... 95 TABLE 11.2 PROJECT LOCATIONS AND SURROUNDING LAND USES .................................................................. 98 TABLE 11.3 PROJECT LOCATIONS AND SURROUNDING LAND USES .................................................................. 99 TABLE 11.4 SUMMARY OF POTENTIAL COST RANGES OF IMPLEMENTATION .................................................... 128 TABLE 11.5 WATER QUALITY MONITORING COST ESTIMATE .......................................................................... 132
San Francisco Bay Beaches Bacteria TMDL Staff Report April 13, 2016
LIST OF FIGURES FIGURE 1.1 SAN FRANCISCO BAY BEACHES 3 FIGURE 5.1 AQUATIC PARK BEACH, SAN FRANCISCO 18 FIGURE 5.2 COMBINED SEWER SYSTEM DIAGRAM 20 FIGURE 5.3 CANDLESTICK POINT BEACHES 22 FIGURE 5.4 CRISSY FIELD BEACH 27 FIGURE 5.5 CRISSY FIELD MARSH SAMPLE LOCATIONS 29 FIGURE 5.6 MARINA LAGOON WITH LAKESHORE AND PARKSIDE BEACHES 32 FIGURE 5.7 CHINA CAMP BEACH 34 FIGURE 5.8 NUMBER OF ANNUAL TOTAL COLIFORM EXCEEDANCES - CHINA CAMP BEACH 35 FIGURE 5.9 MCNEARS BEACH 36 FIGURE 5.10 NUMBER OF ANNUAL TOTAL COLIFORM EXCEEDANCES AT MCNEARS BEACH 36 FIGURE 7.1 WASTEWATER TREATMENT PLANT OUTFALLS IN SAN FRANCISCO BAY REGION 42 FIGURE 7.2 EXAMPLE CAUSES OF INFLOW AND INFILTRATION 43 FIGURE 7.3 UPPER PRESIDIO WATERSHED MITIGATION PROJECT LOCATIONS 53 FIGURE 7.4 SANITARY SEWER OVERFLOWS WITH 1 MILE OF SAN MATEO LAGOON 2008–14 55 FIGURE 7.5 SCHEMATIC DRAWING OF PUBLIC VS. PRIVATE SEWER LATERALSA 56 FIGURE 7.6 MARINA LAGOON AND CONNECTED SLOUGHS 57 TABLE 11.5 WATER QUALITY MONITORING COST ESTIMATE 132
1 Introduction
San Francisco Bay Beaches Bacteria TMDL Staff Report April 13, 2016
1
1 INTRODUCTION
This report presents the supporting documentation for a proposed amendment of the San Francisco Bay Basin Water Quality Control Plan (Basin Plan) to address impairment of San Francisco Bay beaches by bacteria and other pathogens (e.g., viruses) associated with fecal contamination, hereinafter referred to as bacteria. The Basin Plan amendment would establish:
(1) Numeric targets for indicator bacteria densities (concentrations) based on current Basin Plan water quality objectives. Attainment of targets will protect the health of water contact recreational users of the beaches;
(2) Total Maximum Daily Loads (TMDL) and allocations that will achieve the targets; and
(3) Implementation plans for bacteria. This TMDL addresses bacteria impaired beaches in San Francisco Bay east of the Golden Gate Bridge. The impaired beaches include: Aquatic Park Beach, San Francisco Jackrabbit, Sunnydale Cove, and Windsurfer Beaches in Candlestick Point State
Recreation Area, San Francisco Crissy Field Beach, San Francisco Parkside Aquatic and Lakeshore Beaches on Marina Lagoon, City of San Mateo China Camp Beach, Marin County McNears Beach, Marin County
China Camp Beach and McNears Beach are on the list of impaired water bodies because levels of only one bacterial indicator in waters at these beaches, total coliform, exceeds the Basin Plan’s water quality objective. Waters at the other beaches exceed the bacterial indicator for Enterococcus and other bacterial indicators. Figure 1.1 shows all the beaches located along San Francisco Bay that are monitored for bacteria under section 115880 of the California Health and Safety Code. The CWA Section 303(d)-listed beaches highlighted; based on current data the remaining beaches are not impaired. This report contains the results of analyses of bacteria impairment assessments, sources and loadings, linkage analyses, proposed acceptable bacterial load allocations, and implementation actions.
1.1 Regulatory Background The CWA requires California to adopt and enforce water quality standards to protect all water bodies within the State. The Basin Plan delineates these standards for the Region. The standards include beneficial uses of waters in the Region, numeric and
1 Introduction
San Francisco Bay Beaches Bacteria TMDL Staff Report April 13, 2016
2
narrative water quality objectives to protect those uses, provisions to enhance and protect existing water quality (antidegradation), and other plans and policies necessary to implement water quality objectives. CWA Section 303(d)1 requires states to compile a list of “impaired” water bodies that do not meet water quality standards and to establish a TMDL for the pollutant that causes impairment. The proposed TMDL and implementation plan are designed to resolve existing bacterial impairment in San Francisco Bay beaches. A TMDL specifies the maximum amount of a pollutant that a water body can receive and still meet water quality standards, and allocates the acceptable pollutant load to point and nonpoint sources. A TMDL is defined as the sum of the individual wasteload allocations for point sources, load allocations for nonpoint sources, and natural background that will enable the water body to assimilate pollutant loads, without exceedance of water quality objectives. The TMDL must take into account seasonal variations and include a margin of safety to address uncertainty in the analysis. In addition, the Water Board must develop a water quality management plan (“implementation plan”) to implement the TMDL. Finally, TMDLs must be included in the State's water quality management plan (i.e., the Basin Plan). The U.S. Environmental Protection Agency (U.S. EPA) has oversight authority for the CWA 303(d) program and is required to review and either approve or disapprove the state’s 303(d) list and each TMDL developed by the state. In addition, the scientific basis of the Basin Plan amendment must undergo external scientific peer review pursuant to section 57004, subdivision (b) of the California Health and Safety Code. The “scientific basis” of a Basin Plan amendment is the portion of the amendment that uses “empirical data or other scientific findings, conclusions or assumption” to establish “a regulatory level, standard, or other requirements for the protection of public health or the environment” (Cal. Health & Safety Code § 57004(a)(2)). The scientific basis of the San Francisco Bay Beaches Bacteria TMDL, as presented in this Staff Report, has undergone evaluation by two peer reviewers whose comments were considered in finalizing this staff report and the proposed Basin Plan amendment.
1 33 U.S.C. § 1313(d).

1 Introduction
San Francisco Bay Beaches Bacteria TMDL Staff Report April 13, 2016
3
Figure 1.1 San Francisco Bay Beaches
1 Introduction
San Francisco Bay Beaches Bacteria TMDL Staff Report April 13, 2016
4
1.2 Document Organization The process for establishing a TMDL includes compiling and considering available data and information, conducting analyses relevant to defining the impairment problem, identifying sources, and allocating responsibility for actions to resolve the impairment. This report is organized into sections that reflect the key elements of the TMDL and the new implementation provisions for bacterial water quality objectives, as follows:
• Section 2 presents background information about the physical settings of Aquatic Park, Candlestick Point, Crissy Field, Marina Lagoon, China Camp and McNears Beaches.
• Section 3 presents the problem definition that the project is based on and defines the project, why it is necessary, and its objectives.
• Section 4 presents the applicable water quality standards. • Section 5 presents results of past and recent bacterial water quality studies. • Section 6 presents the proposed numeric targets. • Section 7 provides our understanding of the potential sources of loading of
bacteria to each of the San Francisco Bay Beaches. • Section 8 presents the proposed pollutant load and wasteload allocations to
identified pollutant sources. • Section 9 presents the linkage analysis, which describes the relationship
between indicator bacteria sources, load allocations, and the proposed targets. • Section 10 presents the implementation plan, which includes actions and
requirements deemed necessary to resolve the water quality impairment. • Section 11 presents the Regulatory Analyses, including the California
Environmental Quality Act (CEQA) analysis and CEQA checklist and a consideration of economics.
• Section 12, References, lists all the information sources cited and relied upon in preparation of this report.
San Francisco Bay Beaches Bacteria TMDL Staff Report April 13, 2016
5
2 DESCRIPTION OF IMPAIRED BEACHES
This section provides descriptions of the general characteristics, surrounding land use, and recreational usage of each of the San Francisco Bay beaches for which recreational uses are impaired currently by excessive concentrations of fecal indicator bacteria (FIB).
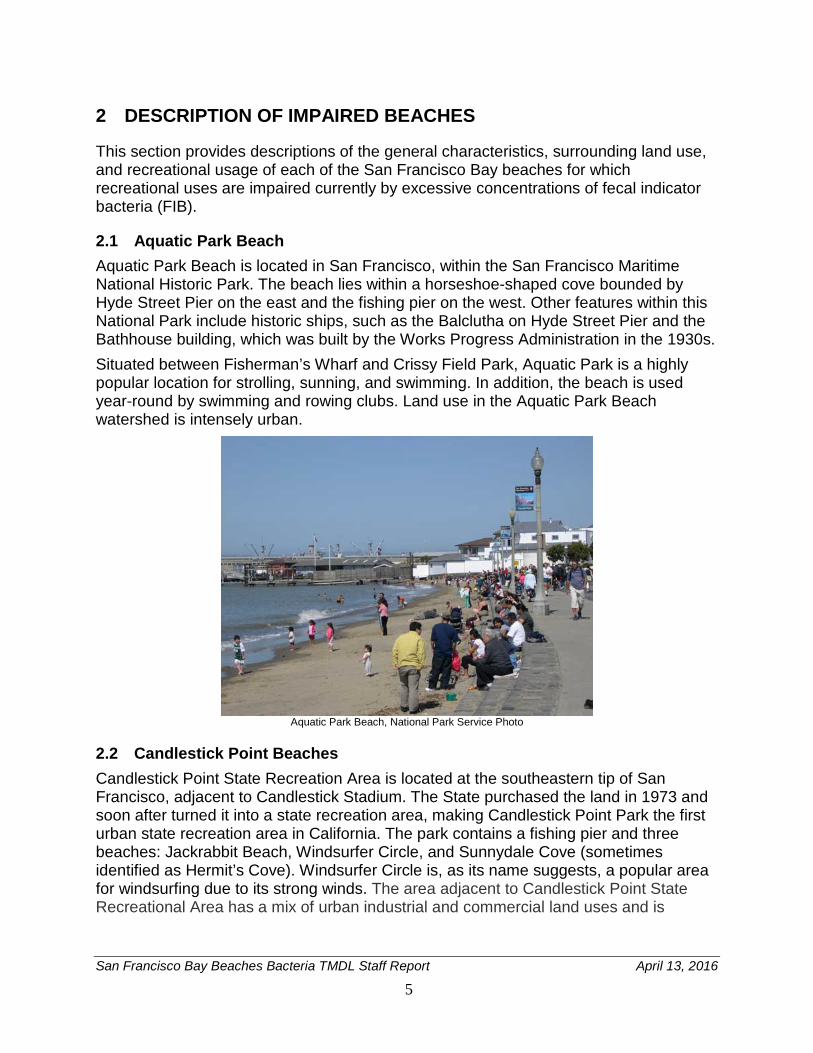
2.1 Aquatic Park Beach Aquatic Park Beach is located in San Francisco, within the San Francisco Maritime National Historic Park. The beach lies within a horseshoe-shaped cove bounded by Hyde Street Pier on the east and the fishing pier on the west. Other features within this National Park include historic ships, such as the Balclutha on Hyde Street Pier and the Bathhouse building, which was built by the Works Progress Administration in the 1930s. Situated between Fisherman’s Wharf and Crissy Field Park, Aquatic Park is a highly popular location for strolling, sunning, and swimming. In addition, the beach is used year-round by swimming and rowing clubs. Land use in the Aquatic Park Beach watershed is intensely urban.
Aquatic Park Beach, National Park Service Photo
2.2 Candlestick Point Beaches Candlestick Point State Recreation Area is located at the southeastern tip of San Francisco, adjacent to Candlestick Stadium. The State purchased the land in 1973 and soon after turned it into a state recreation area, making Candlestick Point Park the first urban state recreation area in California. The park contains a fishing pier and three beaches: Jackrabbit Beach, Windsurfer Circle, and Sunnydale Cove (sometimes identified as Hermit’s Cove). Windsurfer Circle is, as its name suggests, a popular area for windsurfing due to its strong winds. The area adjacent to Candlestick Point State Recreational Area has a mix of urban industrial and commercial land uses and is

2 Description of Impaired Beaches
San Francisco Bay Beaches Bacteria TMDL Staff Report April 13, 2016
6
currently undergoing extensive redevelopment. The future use of the former Candlestick Stadium site is expected to be a mix of residential and commercial uses.
Candlestick Stadium, left, and Sunnydale Cove, www.kayaker.net
As required by its National Pollutant Discharge Elimination System (NPDES) permit for discharges of treated wastewater, the San Francisco Public Utility Commission (SFPUC) conducts recreational-use studies to quantify, to the extent possible, the number of people using areas near its outfalls for water contact recreation and non-contact recreation. Results of a study of Candlestick Point beaches conducted between October 2009 and September 2011, shown in Table 2.1, provide an idea of the recreational usage at the three beaches.
Table 2.1 Estimated Annual Recreational Users - Candlestick Point Beachesa
Beach Water-
Contact Users
(REC-1)
Non-Contact Users (REC-2)
Total Users Activities
Sunnydale Cove 210 261 471 Walking, jogging and fishing
Windsurfer Circle 5,698 529 6,227
Fishing at nearby pier accounted for 65% of all REC1; Site also had 87% of all windsurfers observed during study
Jackrabbit 456 770 1,226 Walking/jogging followed by sitting/sunbathing; 75% of all wading observed during study
a Source: SFPUC 2012
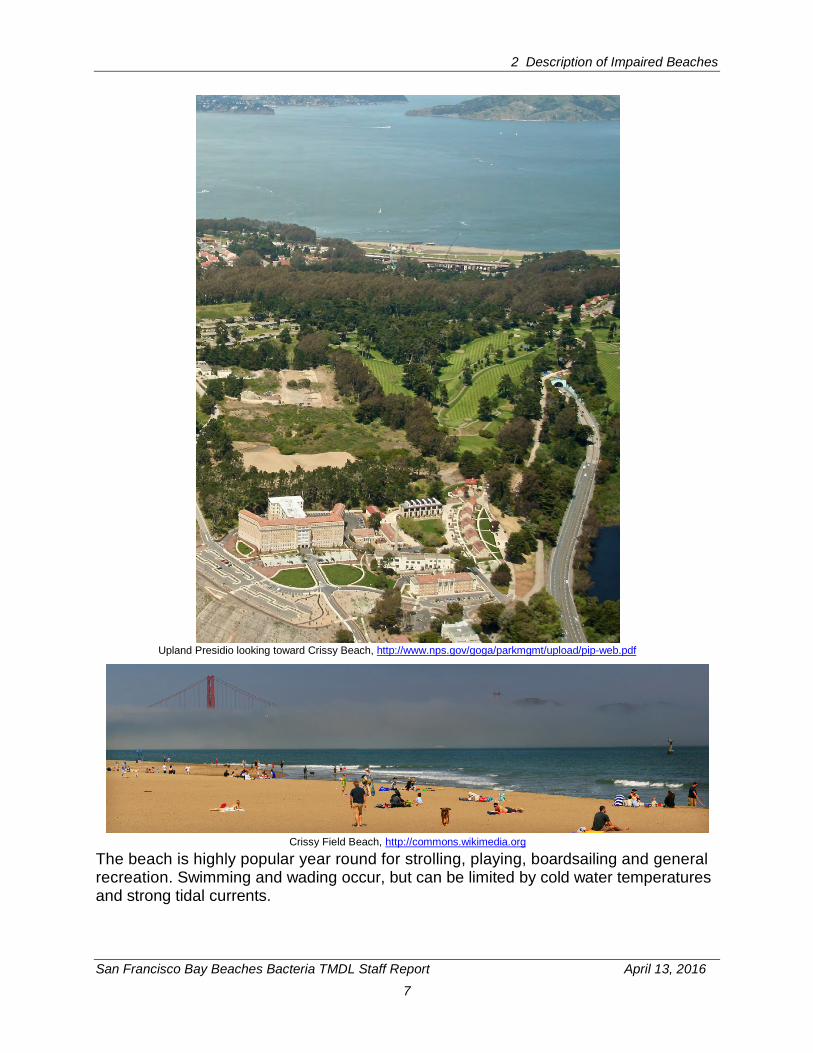
2.3 Crissy Field Beach Crissy Field Beach, also called Crissy Beach, is a highly popular two-mile long beach located within the Golden Gate National Recreation Area and the Presidio, a National Historic Landmark District and former U.S. Army base. After the U.S. Army transferred the base to the National Park Service in 1994, Congress created the Presidio Trust, a federal corporation, to manage building leasing, operation and maintenance for the interior area of the Presidio. This interior, or upland, area contains the San Francisco National Cemetery, restaurants, a hotel, museums, office space, retail stores, a water treatment facility, roads and highway, and residences, in addition to high-use park trails and open space. The National Park Service remains responsible for the remaining coastal areas and a few other sites.
2 Description of Impaired Beaches
San Francisco Bay Beaches Bacteria TMDL Staff Report April 13, 2016
7
Upland Presidio looking toward Crissy Beach, http://www.nps.gov/goga/parkmgmt/upload/pip-web.pdf
Crissy Field Beach, http://commons.wikimedia.org
The beach is highly popular year round for strolling, playing, boardsailing and general recreation. Swimming and wading occur, but can be limited by cold water temperatures and strong tidal currents.
2 Description of Impaired Beaches
San Francisco Bay Beaches Bacteria TMDL Staff Report April 13, 2016
8
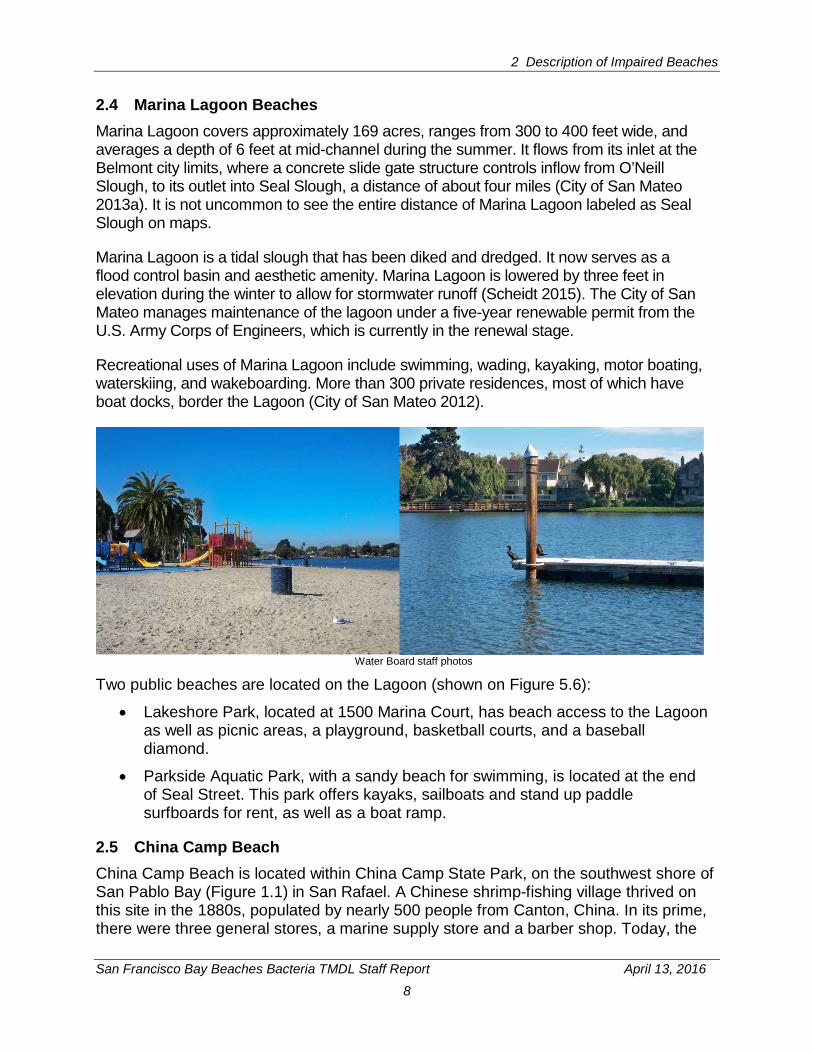
2.4 Marina Lagoon Beaches Marina Lagoon covers approximately 169 acres, ranges from 300 to 400 feet wide, and averages a depth of 6 feet at mid-channel during the summer. It flows from its inlet at the Belmont city limits, where a concrete slide gate structure controls inflow from O’Neill Slough, to its outlet into Seal Slough, a distance of about four miles (City of San Mateo 2013a). It is not uncommon to see the entire distance of Marina Lagoon labeled as Seal Slough on maps.
Marina Lagoon is a tidal slough that has been diked and dredged. It now serves as a flood control basin and aesthetic amenity. Marina Lagoon is lowered by three feet in elevation during the winter to allow for stormwater runoff (Scheidt 2015). The City of San Mateo manages maintenance of the lagoon under a five-year renewable permit from the U.S. Army Corps of Engineers, which is currently in the renewal stage.
Recreational uses of Marina Lagoon include swimming, wading, kayaking, motor boating, waterskiing, and wakeboarding. More than 300 private residences, most of which have boat docks, border the Lagoon (City of San Mateo 2012).
Water Board staff photos
Two public beaches are located on the Lagoon (shown on Figure 5.6):
• Lakeshore Park, located at 1500 Marina Court, has beach access to the Lagoon as well as picnic areas, a playground, basketball courts, and a baseball diamond.
• Parkside Aquatic Park, with a sandy beach for swimming, is located at the end of Seal Street. This park offers kayaks, sailboats and stand up paddle surfboards for rent, as well as a boat ramp.
2.5 China Camp Beach China Camp Beach is located within China Camp State Park, on the southwest shore of San Pablo Bay (Figure 1.1) in San Rafael. A Chinese shrimp-fishing village thrived on this site in the 1880s, populated by nearly 500 people from Canton, China. In its prime, there were three general stores, a marine supply store and a barber shop. Today, the
2 Description of Impaired Beaches
San Francisco Bay Beaches Bacteria TMDL Staff Report April 13, 2016
9
beach offers year-round wading, swimming, kayaking, and boating, with the greatest usage during the warmer months. China Camp Beach is home to China Camp Village, which consists of a small museum, snack shop, restrooms, and a year-round residence. Other surrounding land uses include the park road and open space.
China Camp Beach and village www.parks.ca.gov Water Board staff photo
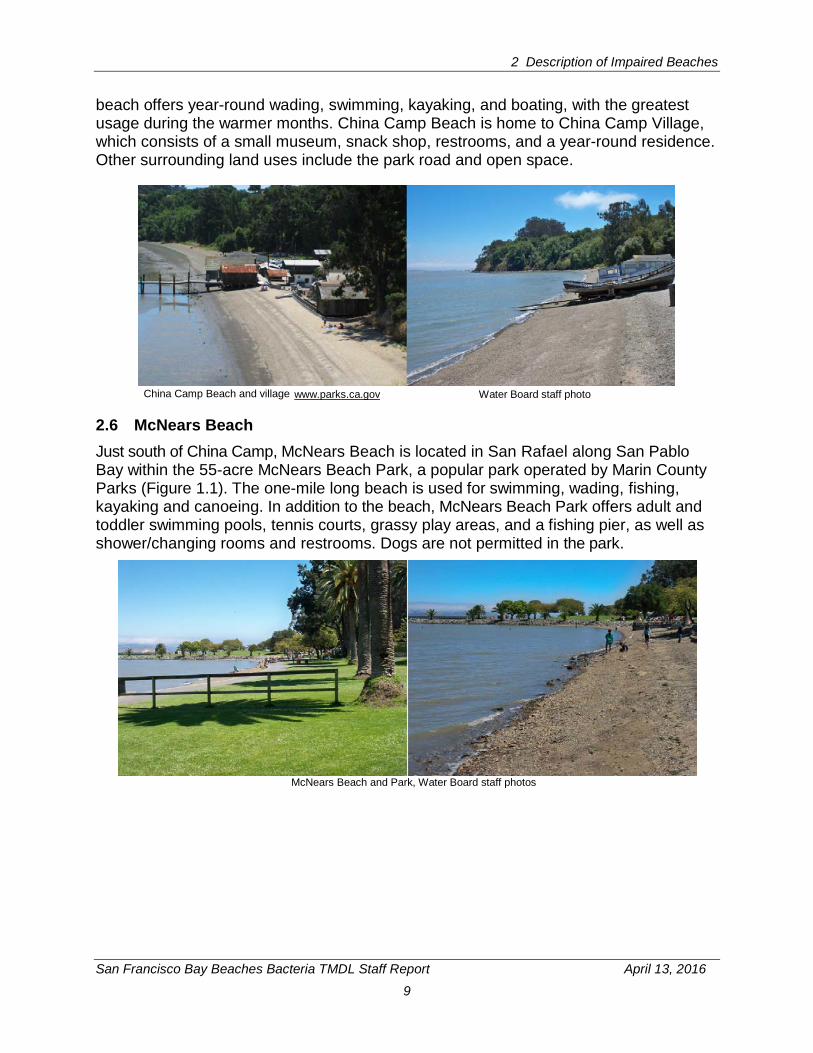
2.6 McNears Beach Just south of China Camp, McNears Beach is located in San Rafael along San Pablo Bay within the 55-acre McNears Beach Park, a popular park operated by Marin County Parks (Figure 1.1). The one-mile long beach is used for swimming, wading, fishing, kayaking and canoeing. In addition to the beach, McNears Beach Park offers adult and toddler swimming pools, tennis courts, grassy play areas, and a fishing pier, as well as shower/changing rooms and restrooms. Dogs are not permitted in the park.
McNears Beach and Park, Water Board staff photos
San Francisco Bay Beaches Bacteria TMDL Staff Report April 13, 2016
10
3 PROJECT DEFINITION
This section presents the problem statement upon which the proposed Basin Plan amendment project is based. It also presents the project definition and objectives by which the project is evaluated under the California Environmental Quality Act (CEQA).
3.1 Problem Statement San Francisco Bay Beaches are impaired due to fecal indicator bacteria concentrations that exceed water quality objectives. Fecal indicator bacteria include fecal coliform, total coliform and Enterococcus, which are types of bacteria that indicate the potential for fecal contamination and a potential risk of pathogen-induced illness to humans. Pathogens pose potential health risks, including gastrointestinal, respiratory, eye, ear, nose, throat, and skin diseases, to people who recreate in contaminated waters. Because specific illness-inducing pathogens are difficult to measure in water, we infer the presence of pathogens from high concentrations of fecal indicator bacteria. This TMDL addresses beaches in San Francisco Bay east of the Golden Gate Bridge, including: Aquatic Park Beach, San Francisco Jackrabbit, Sunnydale Cove, and Windsurfer Beaches in Candlestick Point State
Recreation Area, San Francisco Crissy Field Beach, San Francisco Parkside Aquatic and Lakeshore Beaches on Marina Lagoon, City of San Mateo China Camp Beach, Marin County McNears Beach, Marin County
3.2 Project Definition The project is the adoption of a proposed Basin Plan Amendment to: (1) establish a TMDL and an implementation plan for indicator bacteria at San Francisco Bay Beaches; and, (2) establish a framework for achieving water quality objectives at other San Francisco Bay beaches at which bacteria standards are exceeded in the future. The Water Board is obligated under CWA §303(d) to develop a TMDL for these water bodies to address their impairment. The following components form the basis of the proposed regulatory provisions and define the project: • Numeric targets for indicator bacteria concentrations in the water column; • Density-based total maximum daily bacteria-indicator loads to the beaches; • Allocation of the density-based total maximum daily bacteria-indicator load among
the categorical source categories at each beach; • A plan to implement the TMDL that includes actions to reduce sources of fecal
contamination to achieve load allocations at each of the Beaches; and • A monitoring program to evaluate progress in meeting the numeric targets.

3 Project Definition
San Francisco Bay Beaches Bacteria TMDL Staff Report April 13, 2016
11
3.3 Project Objectives The objectives of the proposed Basin Plan amendment are consistent with the mission of the Water Board and the requirements of the CWA and Water Code. The objectives are to: • Comply with the CWA requirement to adopt a TMDL for Section 303(d)-listed water
bodies; • Protect existing recreational uses at San Francisco Bay Beaches; • Attain the water quality objectives for Enterococcus protective of water contact
recreation at San Francisco Bay Beaches, as quickly as feasible; • Set numeric targets to attain relevant water quality standards at San Francisco Bay
Beaches; • Avoid imposing regulatory requirements that are more stringent than necessary to
meet numeric targets and attain water quality standards; and • Complete implementation of needed fecal contamination abatement measures in as
short a time as is feasible.

4 Water Quality Standards
San Francisco Bay Beaches Bacteria TMDL Staff Report April 13, 2016
12
4 WATER QUALITY STANDARDS
This section identifies applicable laws and regulations, including applicable water quality objectives, beneficial uses of the water bodies covered by this TMDL, and water quality standards.
4.1 Use of Fecal Indicator Bacteria in Water Quality Standards Microorganisms that have the potential to cause disease are called pathogens. A subset of pathogens, called human pathogens, is capable of causing human diseases. More than 100 types of human pathogens can occur in a water body polluted by fecal matter (Havelaar 1993), and detecting these organisms is costly and time consuming. Fecal indicator organisms are easier to identify and enumerate in water samples than the broad range of pathogens in human and animal feces, and thus FIB are commonly used to assess microbial water quality for recreational uses. FIB themselves do not necessarily impair water quality; rather they are intended to indicate the presence of fecal contamination, which presents a potential human health risk for those who recreate in the water. FIB include bacteria from animal and environmental sources as well as human sources. Animal sources include domestic pets, wild animals and rodents, and livestock; environmental sources include biofilms in storm sewers, naturally occurring soil bacteria and decaying kelp; and human sources include sanitary sewer overflows, combined sewer overflows and others. Human sources of bacteria are expected to pose a greater health risk than animal or environmental sources (U.S. EPA 2007). However, U.S. EPA states:
Contamination of recreational waters with feces from warm-blooded animals poses a risk of zoonotic2 infection of humans with some of the pathogens in those waters. Although the risk and severity of human illness due to contamination with animal feces and zoonotic pathogens is most likely lower than the risk and severity of illness from treated or untreated human sewage, currently available data are insufficient to quantify the differences. (U.S. EPA 2009)
While FIB are not necessarily human pathogens, they are abundant in wastes from warm-blooded animals and are easily detected in the environment. The detection of FIB indicates that the environment is contaminated with fecal waste and that human pathogens may be present. Commonly used bacterial indicators of fecal contamination include total coliform, fecal coliform, E. coli, and Enterococcus.
• Total coliform include several genera of bacteria commonly found in the intestines of warm-blooded animals. However, many types of coliform bacteria grow naturally in the environment – that is, outside the bodies of warm-blooded animals. As discussed further below, the U.S. EPA no longer recommends total coliform be used as FIB.
2 Indicates a disease that normally exists in animals but that can infect humans.

4 Water Quality Standards
San Francisco Bay Beaches Bacteria TMDL Staff Report April 13, 2016
13
• Fecal coliform are a subset of total coliform and are more specific than total coliform to wastes from warm-blooded animals, but not necessarily to humans. As discussed further below, the U.S. EPA no longer recommends fecal coliform be used as FIB.
• E. coli are a subset of fecal coliform and are thought to be more closely related to the presence of human pathogens than fecal coliform (U.S. EPA 2002).
• Enterococcus represents a different bacterial group from coliform. It is regarded to be a good indicator of fecal contamination from warm-blooded animal sources, especially in salt water (ibid.).
Epidemiology studies conducted in the 1950s and 1960s found an association between fecal coliform bacteria and human illness, which forms the basis for why these particular FIB are used in water quality objectives. More recent scientific studies, however, have found that in marine waters Enterococcus is most closely associated with human illness and that the other bacterial indicators of fecal contamination listed above are not (e.g., Cabelli 1982). This is discussed further in Sections 4.2.2 and 6.1.
4.2 Water Quality Standards Under the authority of the CWA, the Water Board has established water quality standards for bacteria. Water quality standards consist of the following elements: 1) beneficial uses of the water body in question; 2) narrative and/or numeric water quality objectives to protect those beneficial uses; and 3) the state of California’s antidegradation policy, which requires continued maintenance of existing high-quality waters. These three elements are described below.
4.2.1 Beneficial Uses The Basin Plan designates beneficial uses for each water body in the Region. The designated beneficial uses of San Francisco Bay that are impaired by FIB include the following:
• IND – industrial service supply • COMM – commercial sport fishing • SHELL – shellfish harvesting • EST – estuarine habitat • MIGR – fish migration • RARE – preservation of rare and endangered species • SPWN – fish spawning • WILD – wildlife habitat • REC-1 – water contact recreation • REC-2 – noncontact water recreation • NAV – navigation
The observed elevated concentrations of fecal indicator bacteria at San Francisco Bay beaches pose a potential health risk to individuals recreating in these water bodies. Specifically, the REC-1 and REC-2 beneficial uses, described in Table 4.1, could be negatively impacted.

4 Water Quality Standards
San Francisco Bay Beaches Bacteria TMDL Staff Report April 13, 2016
14
Table 4.1 Beneficial Uses of San Francisco Bay Beaches Relevant to Bacteria TMDL
Designated Beneficial Uses Description
Water Contact Recreation (REC-1)
Uses of water for recreational activities involving body contact with water where ingestion of water is reasonably possible. These uses include, but are not limited to, swimming, wading, water-skiing, skin and scuba diving, surfing, whitewater activities, fishing, and uses of natural hot springs.
Non-contact Water Recreation (REC-2)
Uses of water for recreational activities involving proximity to water, but not normally involving contact with water where water ingestion is reasonably possible. These uses include, but are not limited to, picnicking, sunbathing, hiking, beach combing, camping, boating, tide pool and marine life study, hunting, sightseeing, or aesthetic enjoyment in conjunction with the above activities.
While a possibility of impairment of the shellfish harvesting beneficial use could exist, the fecal indicator bacteria data upon which this TMDL is based were collected at locations where people wade and swim at the beaches, and there is no evidence of shellfish collection at these beaches. Further data are needed to determine if SHELL beneficial uses are in fact impaired. The goal of this TMDL is to restore and protect REC-1 and REC-2 beneficial uses at San Francisco Bay beaches. SHELL beneficial uses will be addressed in a separate TMDL project and/or water quality standards action at a later date.
4.2.2 Water Quality Objectives The Basin Plan contains bacteria water quality objectives (WQOs), shown in Table 4.2, to protect REC-1 and REC-2 uses. WQOs for REC-2 are less stringent than those for REC-1; therefore, attainment of REC-1 objectives through the implementation of the TMDL will also meet the water quality objectives for REC-2.
Table 4.2 Basin Plan’s Recreational Water Quality Objectives for Bacteria
Beneficial Use Fecal Coliform (MPNa/100 mL)
Total Coliform (MPN/100 mL)
Enterococci (MPN/100mL)
Water Contact Recreation (REC-1)
Geometric meanb < 200 90th percentile < 400
Median < 240 No sample > 10,000
Geometric meanb < 35 No sample > 104
Non-contact Water Recreation (REC-2)
Mean < 2000 90th percentile < 4000 No objective No objective
a. Most Probable Number (MPN) is a statistical representation of the results of the standard coliform test b. Based on a minimum of five consecutive samples equally spaced over a 30-day period
The Basin Plan also contains U.S. EPA bacteriological criteria for REC-1, and, of these, the criteria for Enterococcus in salt water are applicable and used in this TMDL:
• Enterococcus geometric mean < 35 colonies/100 mL; and • Enterococcus single sample maximum < 104 colonies/100 mL.
4 Water Quality Standards
San Francisco Bay Beaches Bacteria TMDL Staff Report April 13, 2016
15
As shown in Table 4.2, the Basin Plan WQOs currently include fecal coliform, total coliform and Enterococcus. However, scientific studies have shown that, in marine waters, Enterococcus is more closely associated with human illness than are the other FIB. U.S. EPA has recommended States adopt WQOs for bacteria in marine waters based only on Enterococcus; therefore, the State of California has begun the process of adopting new WQOs based on U.S. EPA’s recommendations, as further described below.
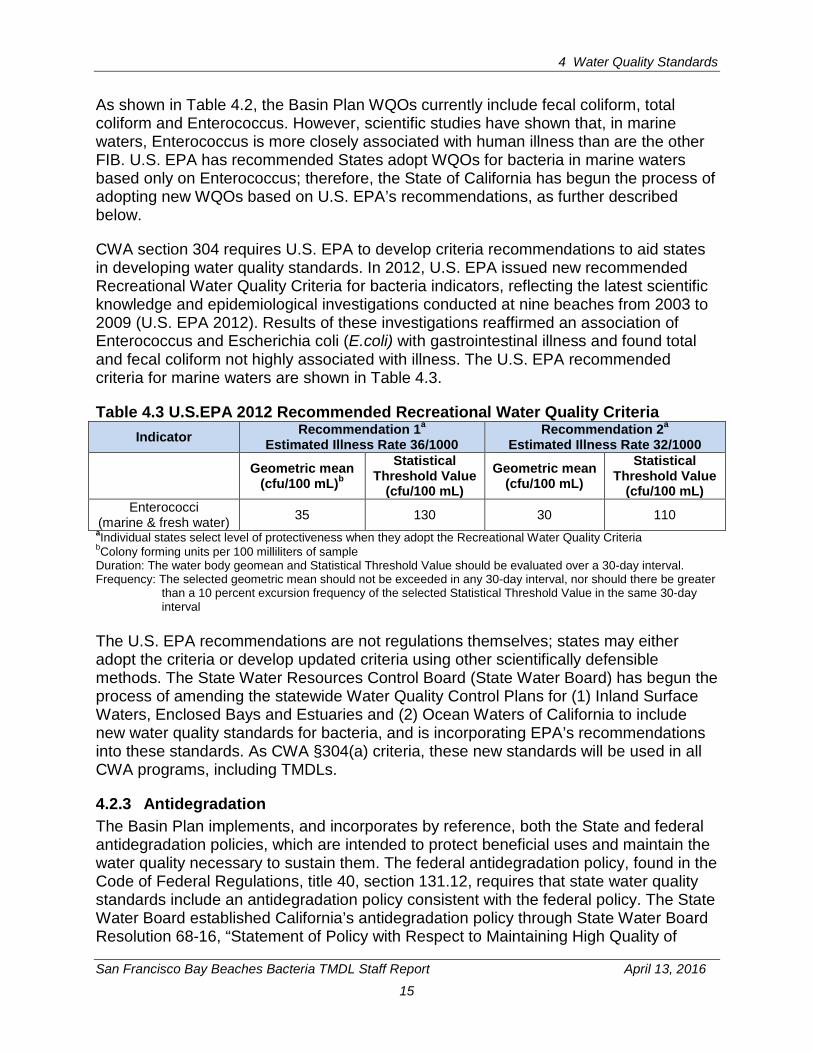
CWA section 304 requires U.S. EPA to develop criteria recommendations to aid states in developing water quality standards. In 2012, U.S. EPA issued new recommended Recreational Water Quality Criteria for bacteria indicators, reflecting the latest scientific knowledge and epidemiological investigations conducted at nine beaches from 2003 to 2009 (U.S. EPA 2012). Results of these investigations reaffirmed an association of Enterococcus and Escherichia coli (E.coli) with gastrointestinal illness and found total and fecal coliform not highly associated with illness. The U.S. EPA recommended criteria for marine waters are shown in Table 4.3.
Table 4.3 U.S.EPA 2012 Recommended Recreational Water Quality Criteria Indicator Recommendation 1a
Estimated Illness Rate 36/1000 Recommendation 2a
Estimated Illness Rate 32/1000
Geometric mean (cfu/100 mL)b
Statistical Threshold Value
(cfu/100 mL) Geometric mean
(cfu/100 mL) Statistical
Threshold Value (cfu/100 mL)
Enterococci (marine & fresh water) 35 130 30 110
aIndividual states select level of protectiveness when they adopt the Recreational Water Quality Criteria bColony forming units per 100 milliliters of sample Duration: The water body geomean and Statistical Threshold Value should be evaluated over a 30-day interval. Frequency: The selected geometric mean should not be exceeded in any 30-day interval, nor should there be greater
than a 10 percent excursion frequency of the selected Statistical Threshold Value in the same 30-day interval
The U.S. EPA recommendations are not regulations themselves; states may either adopt the criteria or develop updated criteria using other scientifically defensible methods. The State Water Resources Control Board (State Water Board) has begun the process of amending the statewide Water Quality Control Plans for (1) Inland Surface Waters, Enclosed Bays and Estuaries and (2) Ocean Waters of California to include new water quality standards for bacteria, and is incorporating EPA’s recommendations into these standards. As CWA §304(a) criteria, these new standards will be used in all CWA programs, including TMDLs.
4.2.3 Antidegradation The Basin Plan implements, and incorporates by reference, both the State and federal antidegradation policies, which are intended to protect beneficial uses and maintain the water quality necessary to sustain them. The federal antidegradation policy, found in the Code of Federal Regulations, title 40, section 131.12, requires that state water quality standards include an antidegradation policy consistent with the federal policy. The State Water Board established California’s antidegradation policy through State Water Board Resolution 68-16, “Statement of Policy with Respect to Maintaining High Quality of
4 Water Quality Standards
San Francisco Bay Beaches Bacteria TMDL Staff Report April 13, 2016
16
Waters in California,” which is deemed to incorporate the federal antidegradation policy where the federal policy applies under federal law. Resolution 68-16 requires that existing water quality be maintained unless degradation is consistent with the maximum benefit to the citizens of California. The proposed TMDL is not expected to degrade water quality, but instead to improve water quality by reducing the incidences of FIB exceedances.
San Francisco Bay Beaches Bacteria TMDL Staff Report April 13, 2016
17
5 BEACH WATER QUALITY DATA
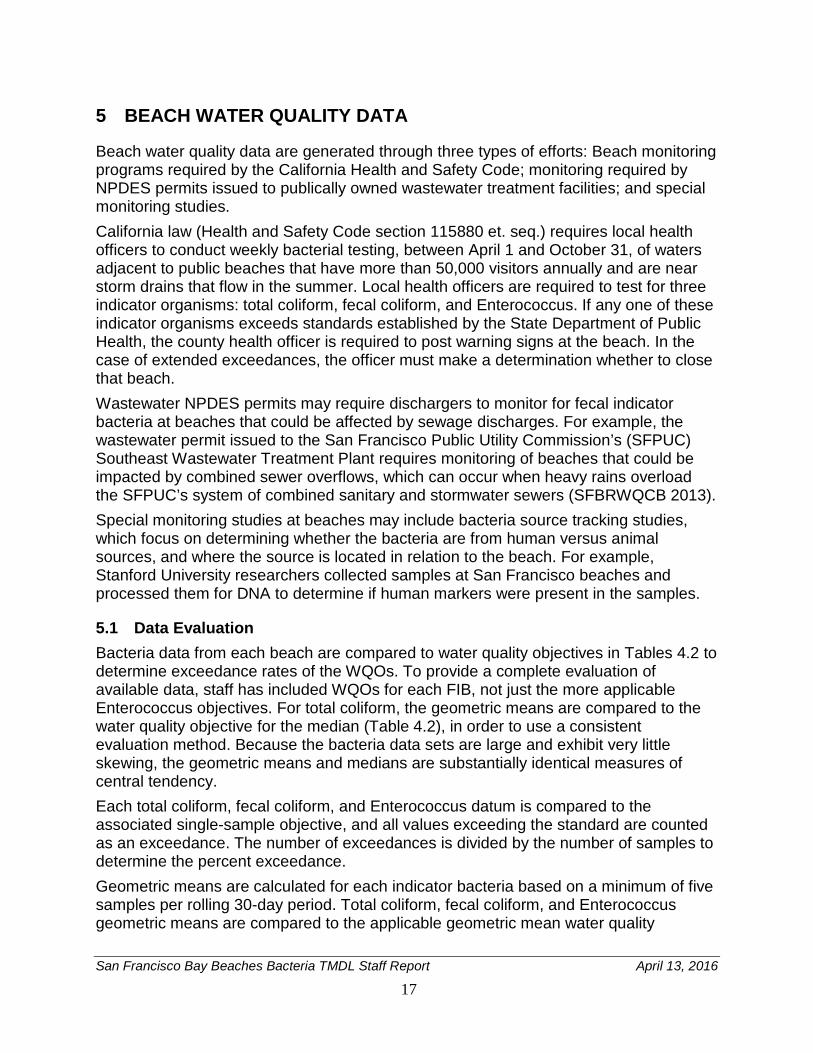
Beach water quality data are generated through three types of efforts: Beach monitoring programs required by the California Health and Safety Code; monitoring required by NPDES permits issued to publically owned wastewater treatment facilities; and special monitoring studies. California law (Health and Safety Code section 115880 et. seq.) requires local health officers to conduct weekly bacterial testing, between April 1 and October 31, of waters adjacent to public beaches that have more than 50,000 visitors annually and are near storm drains that flow in the summer. Local health officers are required to test for three indicator organisms: total coliform, fecal coliform, and Enterococcus. If any one of these indicator organisms exceeds standards established by the State Department of Public Health, the county health officer is required to post warning signs at the beach. In the case of extended exceedances, the officer must make a determination whether to close that beach. Wastewater NPDES permits may require dischargers to monitor for fecal indicator bacteria at beaches that could be affected by sewage discharges. For example, the wastewater permit issued to the San Francisco Public Utility Commission’s (SFPUC) Southeast Wastewater Treatment Plant requires monitoring of beaches that could be impacted by combined sewer overflows, which can occur when heavy rains overload the SFPUC’s system of combined sanitary and stormwater sewers (SFBRWQCB 2013). Special monitoring studies at beaches may include bacteria source tracking studies, which focus on determining whether the bacteria are from human versus animal sources, and where the source is located in relation to the beach. For example, Stanford University researchers collected samples at San Francisco beaches and processed them for DNA to determine if human markers were present in the samples.
5.1 Data Evaluation Bacteria data from each beach are compared to water quality objectives in Tables 4.2 to determine exceedance rates of the WQOs. To provide a complete evaluation of available data, staff has included WQOs for each FIB, not just the more applicable Enterococcus objectives. For total coliform, the geometric means are compared to the water quality objective for the median (Table 4.2), in order to use a consistent evaluation method. Because the bacteria data sets are large and exhibit very little skewing, the geometric means and medians are substantially identical measures of central tendency. Each total coliform, fecal coliform, and Enterococcus datum is compared to the associated single-sample objective, and all values exceeding the standard are counted as an exceedance. The number of exceedances is divided by the number of samples to determine the percent exceedance. Geometric means are calculated for each indicator bacteria based on a minimum of five samples per rolling 30-day period. Total coliform, fecal coliform, and Enterococcus geometric means are compared to the applicable geometric mean water quality
5 Beach Water Quality Data
San Francisco Bay Beaches Bacteria TMDL Staff Report April 13, 2016
18
standards. All values exceeding the geometric mean standards are counted as exceedances and are divided by the total number of geometric means to determine the percent exceedance. The State’s Water Quality Control Policy for Developing California’s Clean Water Act Section 303(d) List, specifies that a water segment shall be listed as impaired for bacteria in accordance with CWA § 303(d) if bacteria water quality standards in the California Code of Regulations, Basin Plans, or statewide plans are exceeded: (1) more than ten percent of the time where water quality is monitored year-round; or (2) more than four percent of the time for beaches monitored during the summer (State Water Board 2004). FIB data from each Bay Beach exceeded bacteria water quality standards more than the requisite percent of the time, as discussed further below.
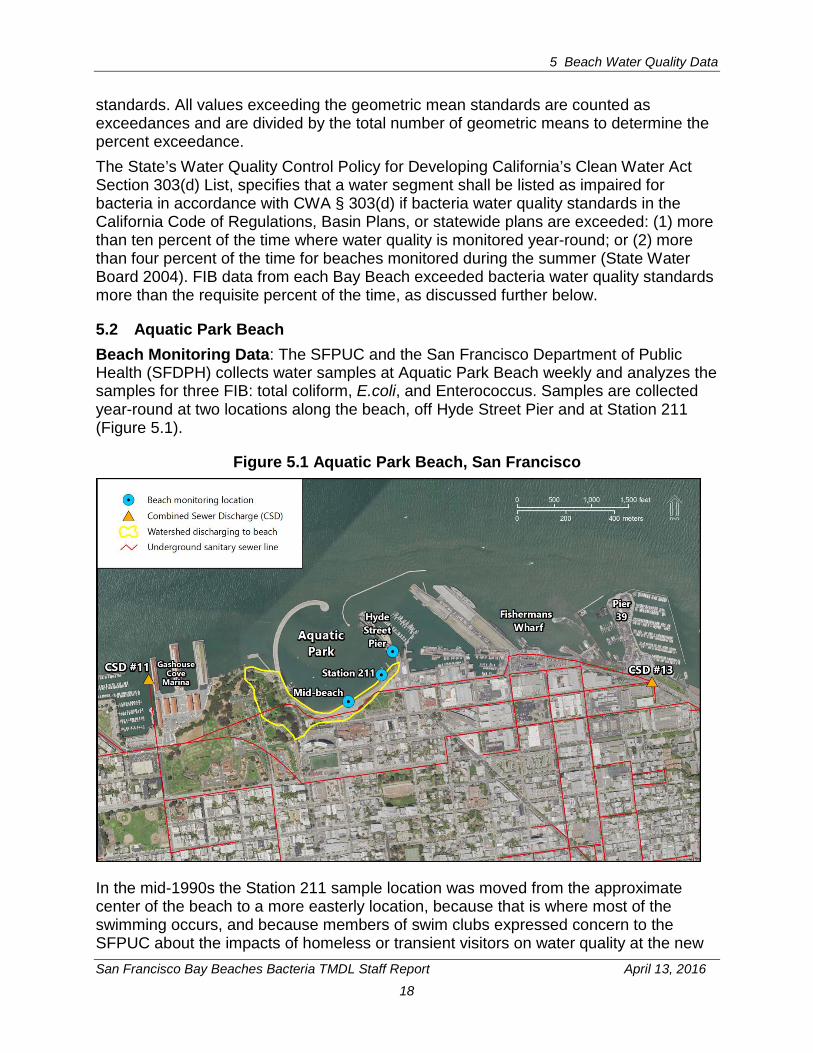
5.2 Aquatic Park Beach Beach Monitoring Data: The SFPUC and the San Francisco Department of Public Health (SFDPH) collects water samples at Aquatic Park Beach weekly and analyzes the samples for three FIB: total coliform, E.coli, and Enterococcus. Samples are collected year-round at two locations along the beach, off Hyde Street Pier and at Station 211 (Figure 5.1).
Figure 5.1 Aquatic Park Beach, San Francisco
In the mid-1990s the Station 211 sample location was moved from the approximate center of the beach to a more easterly location, because that is where most of the swimming occurs, and because members of swim clubs expressed concern to the SFPUC about the impacts of homeless or transient visitors on water quality at the new

5 Beach Water Quality Data
San Francisco Bay Beaches Bacteria TMDL Staff Report April 13, 2016
19
location. In addition to weekly sampling, after a combined sewer discharge SFPUC monitors the beach daily until monitoring confirms that FIB levels are below water contact recreation standards. SFPUC also monitors daily after an exceedance occurs, even if the exceedance is not related to a combined sewer discharge. Beach monitoring data are summarized in Table 5.1; entries in bold type exceed CWA §303(d) impairment listing criteria.
Table 5.1 Aquatic Park Beach Data Summary: 1/2/2008 – 11/24/2014 Location # Data
points # Samples exceeding
Single Sample Max (%) # Samples exceeding Geometric Meana (%)
Enterococcus Hyde St. Pier 386 11 (2.8%) 15 (3.9%) Station 211 434 42 (9.7%) 78 (18.1%)
Total Coliform Hyde St. Pier 385 0 21 (5.5%) Station 211 434 2 (0.5%) 104 (24.2%)
E.coli b Hyde St. Pier 385 8 (2.1%) 0 Station 211 434 38 (8.8%) 20 (9.7%)
aGeometric means calculated using all data collected in rolling 30-day periods bCompare to fecal coliform objective, because no marine E.coli objective exists for estuarine waters
These data indicate that Enterococcus and total coliform exceed the water quality standards more than ten percent of the time at the Station 211 sample location. Exceedances of FIB water quality objectives rarely exceed water quality standards at the Hyde Street Pier location, indicating there is a source of FIB in the vicinity of Station 211 that is not impacting the Hyde Street Pier location. With very few exceptions, the elevated FIB concentrations occurred during the wet season (October 1 – April 15), although a thorough comparison of rainfall and sampling data was not made. NPDES Monitoring Data: The SFPUC operates a combined wastewater and stormwater collection and treatment system throughout most of the city of San Francisco. During periods of heavy rain, the collection system’s storage capacity (Figure 5.2) can be exceeded due to very high volumes of stormwater runoff, resulting in combined sewer overflow discharges (CSDs) to the Bay.
5 Beach Water Quality Data
San Francisco Bay Beaches Bacteria TMDL Staff Report April 13, 2016
20
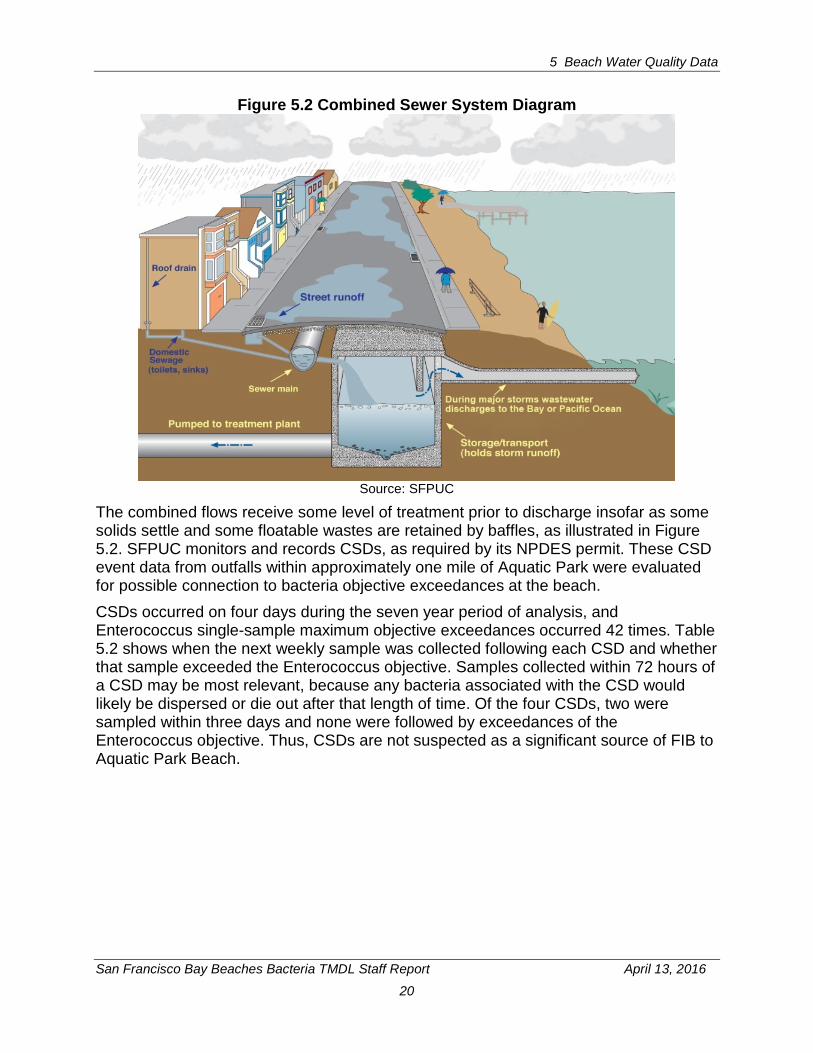
Figure 5.2 Combined Sewer System Diagram
Source: SFPUC
The combined flows receive some level of treatment prior to discharge insofar as some solids settle and some floatable wastes are retained by baffles, as illustrated in Figure 5.2. SFPUC monitors and records CSDs, as required by its NPDES permit. These CSD event data from outfalls within approximately one mile of Aquatic Park were evaluated for possible connection to bacteria objective exceedances at the beach. CSDs occurred on four days during the seven year period of analysis, and Enterococcus single-sample maximum objective exceedances occurred 42 times. Table 5.2 shows when the next weekly sample was collected following each CSD and whether that sample exceeded the Enterococcus objective. Samples collected within 72 hours of a CSD may be most relevant, because any bacteria associated with the CSD would likely be dispersed or die out after that length of time. Of the four CSDs, two were sampled within three days and none were followed by exceedances of the Enterococcus objective. Thus, CSDs are not suspected as a significant source of FIB to Aquatic Park Beach.

5 Beach Water Quality Data
San Francisco Bay Beaches Bacteria TMDL Staff Report April 13, 2016
21
Table 5.2 CSDs in Vicinity of Aquatic Park Beach: 2008 – 2014a
CSD Outfall # 11 13 Date of next sample at Station 211
- and - does it exceed Enterococcus single sample
maximum water quality objective?
Location Approximately 0.6 mile west of Aquatic Park, at eastern end of
Gas House Cove (Fig. 5.1)
Approximately one-half mile east of Aquatic Park Beach,
near Pier 39 (Fig. 5.1)
Date Duration of reported combined sewer discharge in hoursa
3/14/2012 0 5.7 3/21/2012 - no 11/30/2012 0 1.7 12/3/2012 - no
2/9/2014 0 1 2/10/2014 - no 11/20/2014 0 0.4 11/24/14 - no
aCompiled from Self-Monitoring Reports available in CIWQS. Bold values indicate beach samples within 3 days of a combined sewer discharge
Special Monitoring Study: In 2012, the Boehm Research Group at Stanford University conducted a study in which it collected two water samples near Station 211 and analyzed the samples using traditional techniques for FIB as well as quantitative polymerase chain reaction (qPCR) technique for human fecal markers. The samples contained Enterococcus concentrations of 10 and 41 MPN/100 mL, well below the single sample maximum objective of 104. Total coliform and E.coli were not detected. The HF183Taqman human fecal material marker was present at 114 and 158 copies per milliliter of Bay water, indicating that at least some of the fecal coliform at Station 211 is of human origin (Boehm 2012).
5.3 Candlestick Point Beaches Beach Monitoring Data: The SFPUC and San Francisco Department of Public Health sample the three Candlestick beaches (Figure 5.3) weekly for three FIB: total coliform, E.coli, and Enterococcus. Samples are collected year-round and are not analyzed specifically for fecal coliform. In addition to weekly sampling, following a combined sewer discharge the beaches are monitored daily until monitoring confirms that FIB levels are below water contact recreation standards. Beach monitoring data for Jackrabbit Beach, Sunnydale Cove, and Windsurfer Circle are summarized in the tables below; entries in bold type exceed CWA §303(d) impairment listing criteria.

5 Beach Water Quality Data
San Francisco Bay Beaches Bacteria TMDL Staff Report April 13, 2016
22
Figure 5.3 Candlestick Point Beaches
5 Beach Water Quality Data
San Francisco Bay Beaches Bacteria TMDL Staff Report April 13, 2016
23
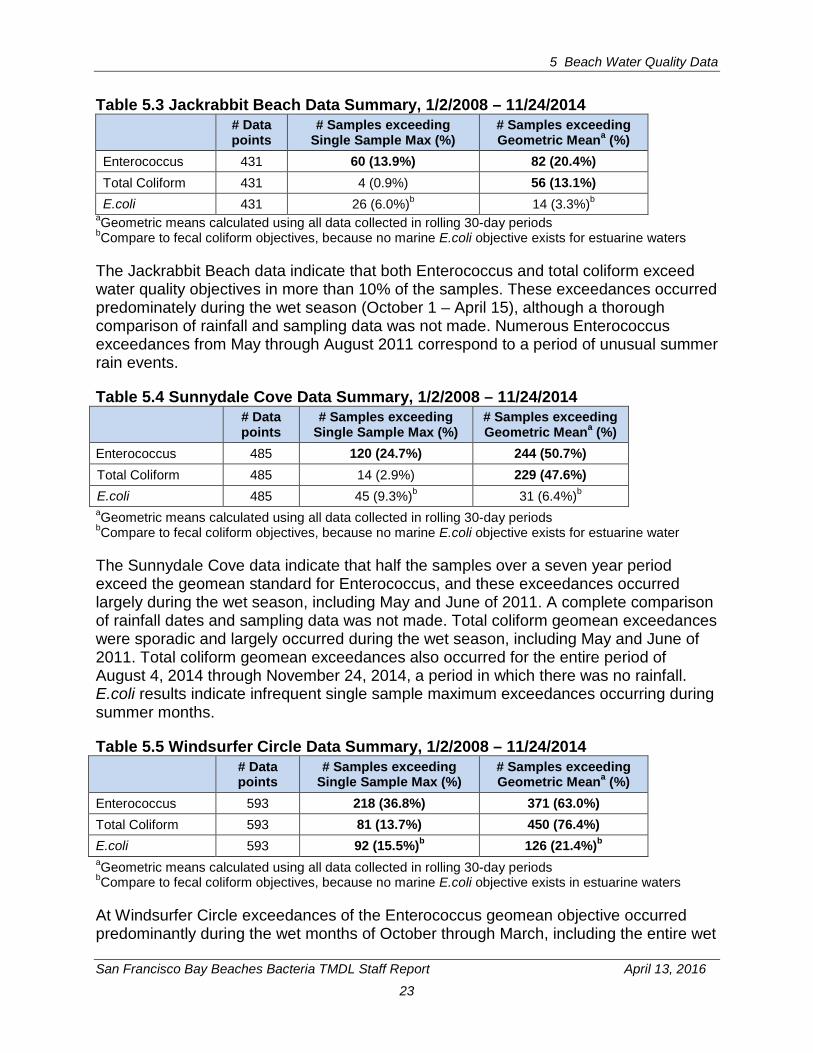
Table 5.3 Jackrabbit Beach Data Summary, 1/2/2008 – 11/24/2014 # Data
points # Samples exceeding
Single Sample Max (%) # Samples exceeding Geometric Meana (%)
Enterococcus 431 60 (13.9%) 82 (20.4%) Total Coliform 431 4 (0.9%) 56 (13.1%) E.coli 431 26 (6.0%)b 14 (3.3%)b
aGeometric means calculated using all data collected in rolling 30-day periods bCompare to fecal coliform objectives, because no marine E.coli objective exists for estuarine waters
The Jackrabbit Beach data indicate that both Enterococcus and total coliform exceed water quality objectives in more than 10% of the samples. These exceedances occurred predominately during the wet season (October 1 – April 15), although a thorough comparison of rainfall and sampling data was not made. Numerous Enterococcus exceedances from May through August 2011 correspond to a period of unusual summer rain events.
Table 5.4 Sunnydale Cove Data Summary, 1/2/2008 – 11/24/2014 # Data
points # Samples exceeding
Single Sample Max (%) # Samples exceeding Geometric Meana (%)
Enterococcus 485 120 (24.7%) 244 (50.7%) Total Coliform 485 14 (2.9%) 229 (47.6%) E.coli 485 45 (9.3%)b 31 (6.4%)b aGeometric means calculated using all data collected in rolling 30-day periods bCompare to fecal coliform objectives, because no marine E.coli objective exists for estuarine water
The Sunnydale Cove data indicate that half the samples over a seven year period exceed the geomean standard for Enterococcus, and these exceedances occurred largely during the wet season, including May and June of 2011. A complete comparison of rainfall dates and sampling data was not made. Total coliform geomean exceedances were sporadic and largely occurred during the wet season, including May and June of 2011. Total coliform geomean exceedances also occurred for the entire period of August 4, 2014 through November 24, 2014, a period in which there was no rainfall. E.coli results indicate infrequent single sample maximum exceedances occurring during summer months.
Table 5.5 Windsurfer Circle Data Summary, 1/2/2008 – 11/24/2014 # Data
points # Samples exceeding
Single Sample Max (%) # Samples exceeding Geometric Meana (%)
Enterococcus 593 218 (36.8%) 371 (63.0%) Total Coliform 593 81 (13.7%) 450 (76.4%) E.coli 593 92 (15.5%)b 126 (21.4%)b aGeometric means calculated using all data collected in rolling 30-day periods bCompare to fecal coliform objectives, because no marine E.coli objective exists in estuarine waters
At Windsurfer Circle exceedances of the Enterococcus geomean objective occurred predominantly during the wet months of October through March, including the entire wet
5 Beach Water Quality Data
San Francisco Bay Beaches Bacteria TMDL Staff Report April 13, 2016
24
season of September 2010 through April 2011, and nearly every week of the following three wet seasons (2011-12, 2012-13, and 2013-14). A complete comparison of rainfall dates and sampling data was not made. Sporadic exceedances of the Enterococcus objective occurred during typically dry months. Similarly to Sunnydale Cove and Jackrabbit Beach, Enterococcus exceedances occurred during May 2011, coinciding with rain events; however, unlike at the other two beaches, these exceedances did not extend through the remainder of the summer months of 2011. Total coliform exceedances occurred largely during the wet season, and also during June and July 2011. Except for one four-week period, the geomean objective for total coliform was exceeded for the entire period of September 2012 through November 2014 (end of data set). E.coli exceedances most often coincided with wet weather months. NPDES Monitoring Data: The SFPUC operates a combined wastewater and stormwater collection and treatment system (Figure 5.2). During periods of heavy rain, the collection system’s storage capacity can be exceeded due to very high volumes of stormwater runoff, resulting in CSDs to the Bay. The combined flows receive some level of treatment prior to discharge in that some solids will settle and some floatable wastes are retained by baffles, as illustrated in Figure 5.2. SFPUC monitors and records CSDs, as required by its NPDES permit. These CSD event data were evaluated for possible connection to bacteria objective exceedances at Candlestick beaches. The four CSD outfalls located closest to Candlestick Park (Figure 5.3) discharged on seven days during the seven year period of 2008-2014 (Table 5.6). The potential effects of these discharges to Jackrabbit Beach and Sunnydale Cove are evaluated here; Windsurfer Circle Beach is not included because it lies between the other two beaches and any impacts from CSDs should be similar to the other beaches. Table 5.6 shows when the next weekly sample was collected following each CSD and whether that sample exceeded the Enterococcus objective. Samples collected within 72 hours of a CSD may be most relevant, because any bacteria associated with the CSD would likely be dispersed or die out after that length of time, and most of the CSDs were sampled with this timeframe. Of the seven CSDs, three were followed by Enterococcus objective exceedances at Jackrabbit Beach and four were followed by exceedances at Sunnydale Cove. However, during the same timeframe, the Enterococcus water quality objective was exceeded 60 times at Jackrabbit and 120 times at Sunnydale Cove. Thus, CSDs are not suspected to be a substantial source of FIB to Candlestick Park beaches.

5 Beach Water Quality Data
San Francisco Bay Beaches Bacteria TMDL Staff Report April 13, 2016
25
Table 5.6 Combined Sewer Discharges in Vicinity of Candlestick Park Beaches: 2008 – 2014a
CSD Outfall # 40 41 42 43 Date of next
sample at Jackrabbit
- and - does it exceed Enterococcus single sample
maximum water quality objective?
Date of next sample at Sunnydale
- and - does it exceed Enterococcus single sample
maximum water quality
objective?
Location In Yosemite Slough, approx.
one mile northwest of Jackrabbit Beach (Fig. 5.2)
Approximately one-quarter mile southwest of
Sunnydale Cove (Fig. 5.2)
Date Duration of reported combined sewer discharge in hoursa
1/4/2008 0.25 0.25 0.25 0 1/5/2009 - yes 1/5/2008 - yes
1/25/2008 3.1 3.1 3.1 8.25 1/26/2008 - yes 1/26/2008 - yes
3/5/2009 0 0 0 0.9 3/6/2009 - no 3/6/2009 - no
10/13/2009 1.1 1.1 1.1 0 10/14/2009 - yes 10/14/2009 - yes
10/19/2009 1.5 1.5 1.5 0 10/20/2009 - no 10/21/2009 - no
1/19/2010 1.1 1.1 1.1 0 1/27/2010 - no 1/20/2010 - yes
12/2/2012 0.22 0.22 0.22 0.63 12/3/2012 - no 12/3/2012 - no aCompiled from Self-Monitoring Reports available in CIWQS. Bold values indicate beach samples within 3 days of a combined sewer discharge
Special Monitoring Studies: While most of the area abutting Candlestick Point is served by the SFPUC’s combined sewer system, some portions of Candlestick Stadium, Jamestown Avenue and Hunters Point Expressway drain to one of two separate networks of stormwater pipes, and then to one of four stormwater outfalls (Figure 5.3). In addition, the southeastern-most outfall discharges stormwater from the Stadium parking lot to Windsurfer Circle (Figure 5.3). In 2012, the Boehm Research Group at Stanford University conducted a study in which it collected two water samples from the storm drain outfall at Windsurfer Circle and analyzed them using both traditional techniques for FIB and a quantitative polymerase chain reaction (qPCR) technique for human fecal markers. The samples contained Enterococcus concentrations of 2,000 - 3,000 MPN/100 mL, well above the single sample maximum objective of 104. E. coli were detected at 1,500 - 1,700 MPN/100 mL. However, the HF183Taqman human fecal material marker was not detected in either sample, meaning that evidence of human fecal coliform was not found in the samples (Boehm 2012).
5 Beach Water Quality Data
San Francisco Bay Beaches Bacteria TMDL Staff Report April 13, 2016
26
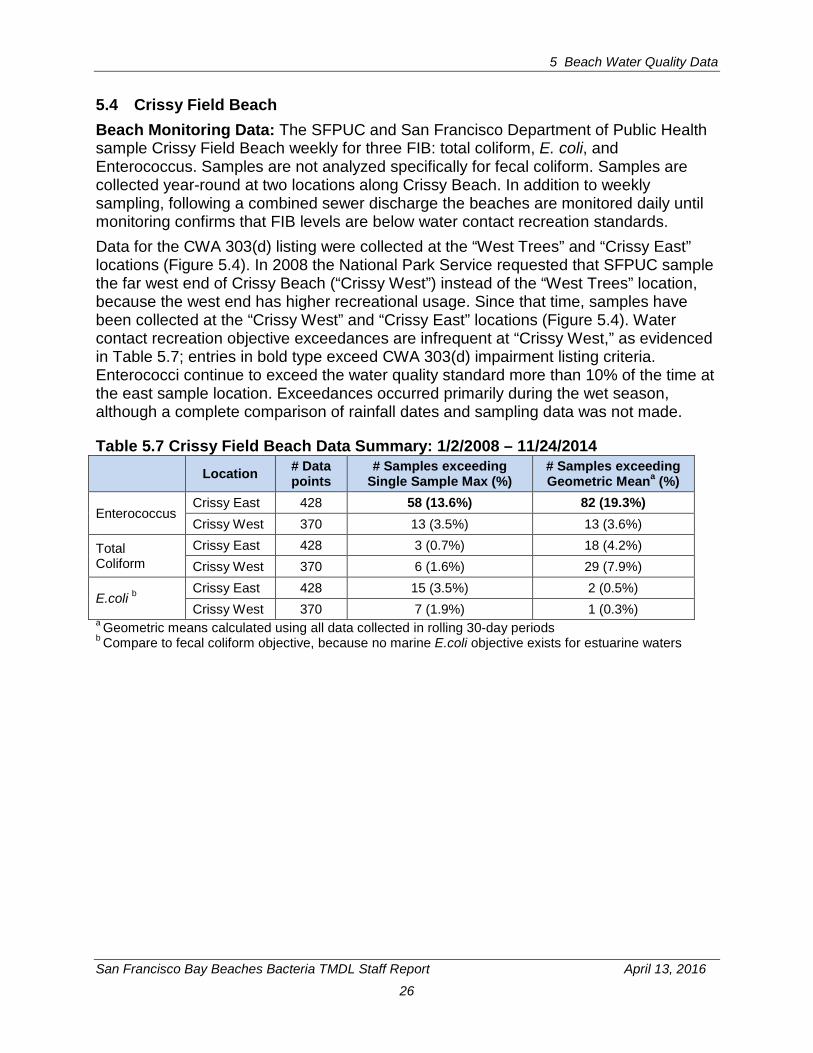
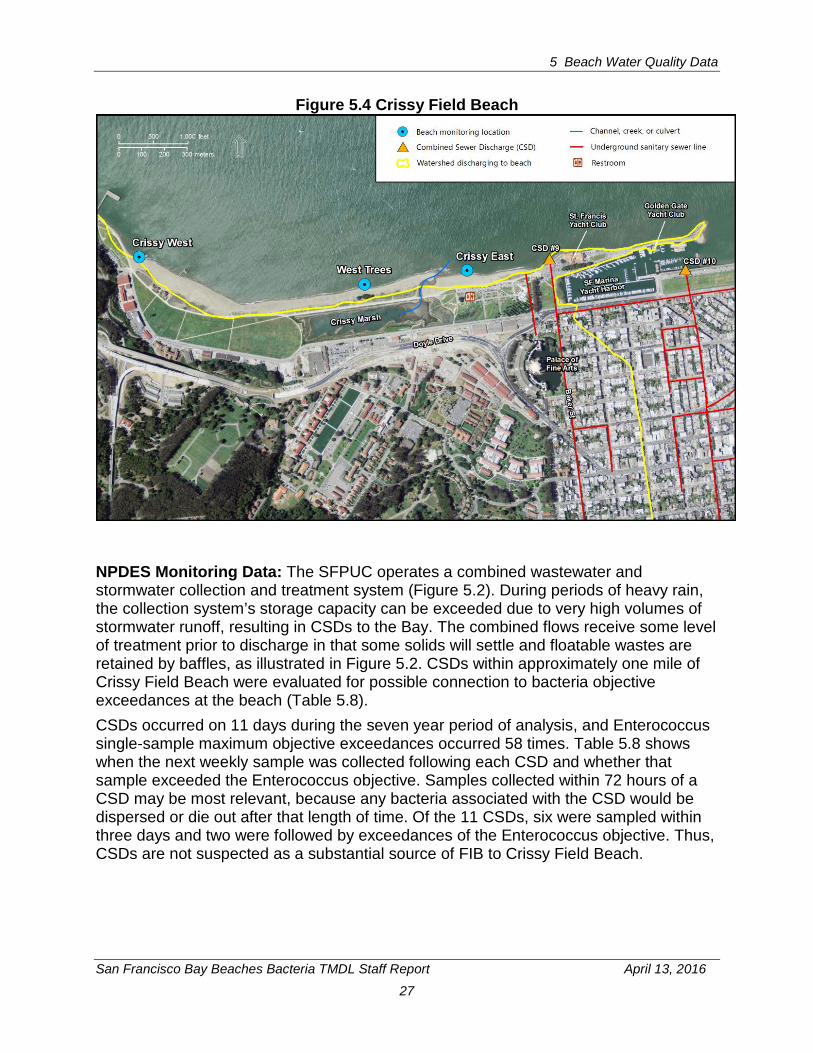
5.4 Crissy Field Beach Beach Monitoring Data: The SFPUC and San Francisco Department of Public Health sample Crissy Field Beach weekly for three FIB: total coliform, E. coli, and Enterococcus. Samples are not analyzed specifically for fecal coliform. Samples are collected year-round at two locations along Crissy Beach. In addition to weekly sampling, following a combined sewer discharge the beaches are monitored daily until monitoring confirms that FIB levels are below water contact recreation standards. Data for the CWA 303(d) listing were collected at the “West Trees” and “Crissy East” locations (Figure 5.4). In 2008 the National Park Service requested that SFPUC sample the far west end of Crissy Beach (“Crissy West”) instead of the “West Trees” location, because the west end has higher recreational usage. Since that time, samples have been collected at the “Crissy West” and “Crissy East” locations (Figure 5.4). Water contact recreation objective exceedances are infrequent at “Crissy West,” as evidenced in Table 5.7; entries in bold type exceed CWA 303(d) impairment listing criteria. Enterococci continue to exceed the water quality standard more than 10% of the time at the east sample location. Exceedances occurred primarily during the wet season, although a complete comparison of rainfall dates and sampling data was not made.
Table 5.7 Crissy Field Beach Data Summary: 1/2/2008 – 11/24/2014 Location # Data
points # Samples exceeding
Single Sample Max (%) # Samples exceeding Geometric Meana (%)
Enterococcus Crissy East 428 58 (13.6%) 82 (19.3%) Crissy West 370 13 (3.5%) 13 (3.6%)
Total Coliform
Crissy East 428 3 (0.7%) 18 (4.2%) Crissy West 370 6 (1.6%) 29 (7.9%)
E.coli b Crissy East 428 15 (3.5%) 2 (0.5%) Crissy West 370 7 (1.9%) 1 (0.3%)
a Geometric means calculated using all data collected in rolling 30-day periods b Compare to fecal coliform objective, because no marine E.coli objective exists for estuarine waters
5 Beach Water Quality Data
San Francisco Bay Beaches Bacteria TMDL Staff Report April 13, 2016
27
Figure 5.4 Crissy Field Beach
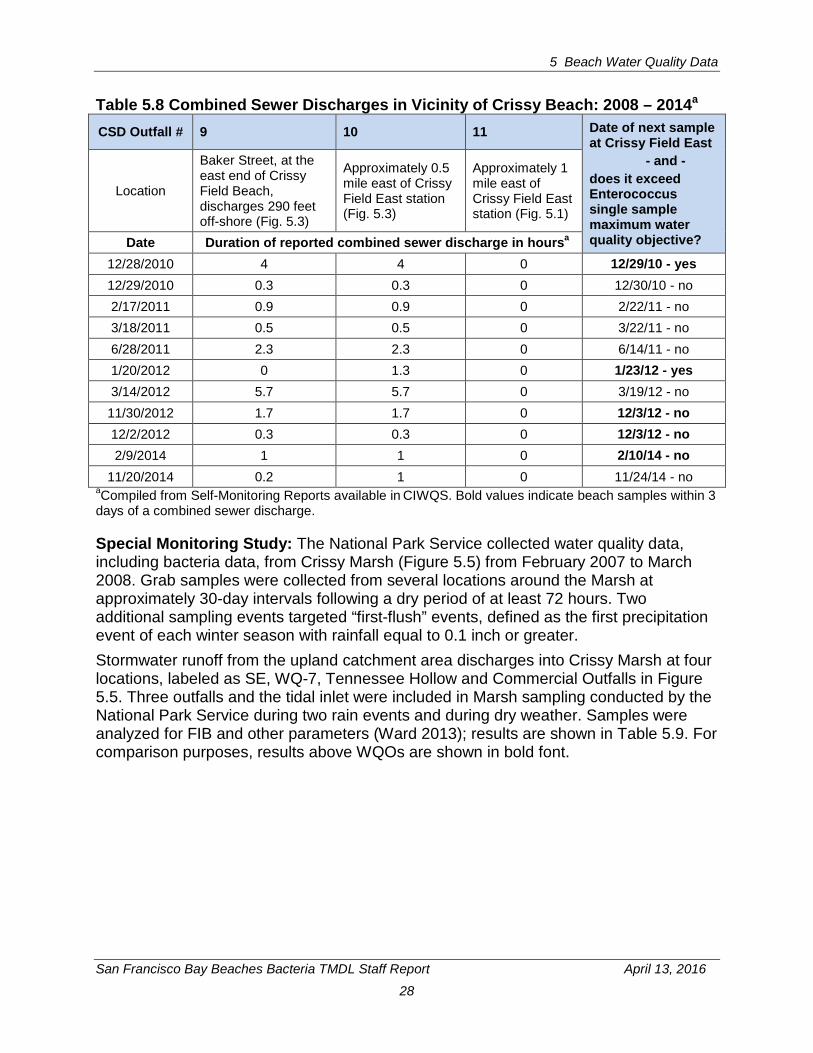
NPDES Monitoring Data: The SFPUC operates a combined wastewater and stormwater collection and treatment system (Figure 5.2). During periods of heavy rain, the collection system’s storage capacity can be exceeded due to very high volumes of stormwater runoff, resulting in CSDs to the Bay. The combined flows receive some level of treatment prior to discharge in that some solids will settle and floatable wastes are retained by baffles, as illustrated in Figure 5.2. CSDs within approximately one mile of Crissy Field Beach were evaluated for possible connection to bacteria objective exceedances at the beach (Table 5.8). CSDs occurred on 11 days during the seven year period of analysis, and Enterococcus single-sample maximum objective exceedances occurred 58 times. Table 5.8 shows when the next weekly sample was collected following each CSD and whether that sample exceeded the Enterococcus objective. Samples collected within 72 hours of a CSD may be most relevant, because any bacteria associated with the CSD would be dispersed or die out after that length of time. Of the 11 CSDs, six were sampled within three days and two were followed by exceedances of the Enterococcus objective. Thus, CSDs are not suspected as a substantial source of FIB to Crissy Field Beach.
5 Beach Water Quality Data
San Francisco Bay Beaches Bacteria TMDL Staff Report April 13, 2016
28
Table 5.8 Combined Sewer Discharges in Vicinity of Crissy Beach: 2008 – 2014a
CSD Outfall # 9 10 11 Date of next sample at Crissy Field East
- and - does it exceed Enterococcus single sample maximum water quality objective?
Location
Baker Street, at the east end of Crissy Field Beach, discharges 290 feet off-shore (Fig. 5.3)
Approximately 0.5 mile east of Crissy Field East station (Fig. 5.3)
Approximately 1 mile east of Crissy Field East station (Fig. 5.1)
Date Duration of reported combined sewer discharge in hoursa 12/28/2010 4 4 0 12/29/10 - yes 12/29/2010 0.3 0.3 0 12/30/10 - no 2/17/2011 0.9 0.9 0 2/22/11 - no 3/18/2011 0.5 0.5 0 3/22/11 - no 6/28/2011 2.3 2.3 0 6/14/11 - no 1/20/2012 0 1.3 0 1/23/12 - yes 3/14/2012 5.7 5.7 0 3/19/12 - no 11/30/2012 1.7 1.7 0 12/3/12 - no 12/2/2012 0.3 0.3 0 12/3/12 - no 2/9/2014 1 1 0 2/10/14 - no
11/20/2014 0.2 1 0 11/24/14 - no aCompiled from Self-Monitoring Reports available in CIWQS. Bold values indicate beach samples within 3 days of a combined sewer discharge.
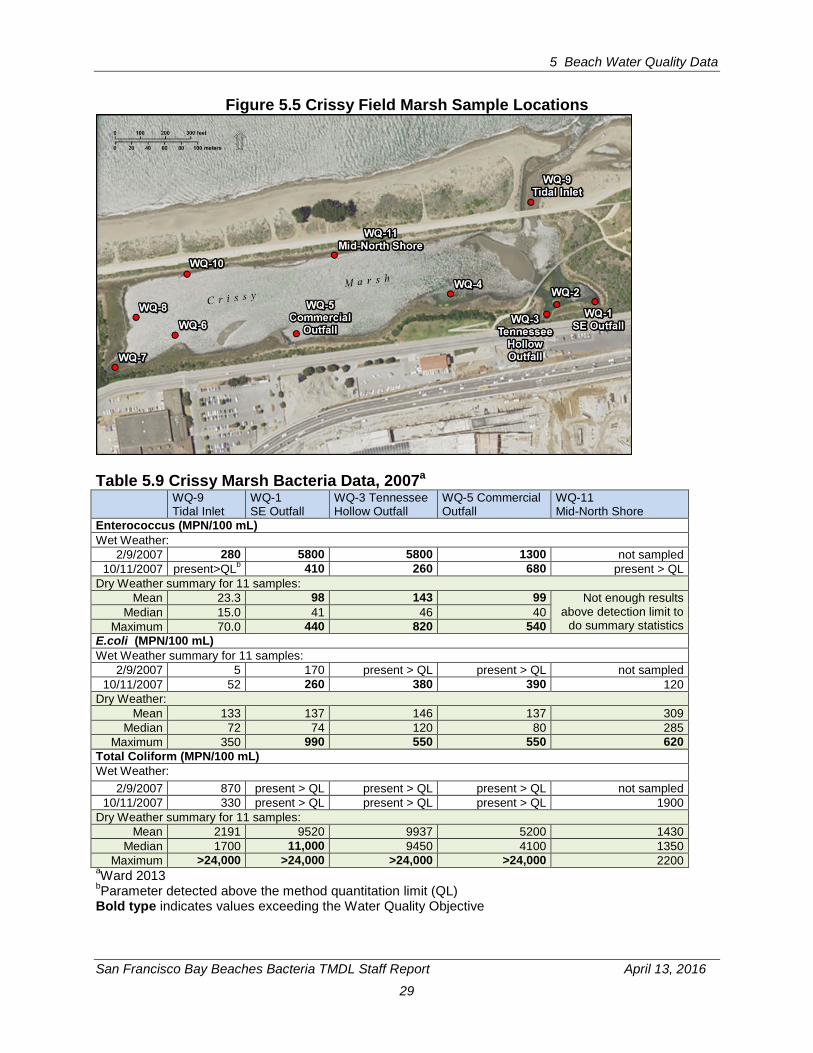
Special Monitoring Study: The National Park Service collected water quality data, including bacteria data, from Crissy Marsh (Figure 5.5) from February 2007 to March 2008. Grab samples were collected from several locations around the Marsh at approximately 30-day intervals following a dry period of at least 72 hours. Two additional sampling events targeted “first-flush” events, defined as the first precipitation event of each winter season with rainfall equal to 0.1 inch or greater. Stormwater runoff from the upland catchment area discharges into Crissy Marsh at four locations, labeled as SE, WQ-7, Tennessee Hollow and Commercial Outfalls in Figure 5.5. Three outfalls and the tidal inlet were included in Marsh sampling conducted by the National Park Service during two rain events and during dry weather. Samples were analyzed for FIB and other parameters (Ward 2013); results are shown in Table 5.9. For comparison purposes, results above WQOs are shown in bold font.
5 Beach Water Quality Data
San Francisco Bay Beaches Bacteria TMDL Staff Report April 13, 2016
29
Figure 5.5 Crissy Field Marsh Sample Locations
Table 5.9 Crissy Marsh Bacteria Data, 2007a WQ-9
Tidal Inlet WQ-1 SE Outfall
WQ-3 Tennessee Hollow Outfall
WQ-5 Commercial Outfall
WQ-11 Mid-North Shore
Enterococcus (MPN/100 mL) Wet Weather:
2/9/2007 280 5800 5800 1300 not sampled 10/11/2007 present>QLb 410 260 680 present > QL
Dry Weather summary for 11 samples: Mean 23.3 98 143 99 Not enough results
above detection limit to do summary statistics
Median 15.0 41 46 40 Maximum 70.0 440 820 540
E.coli (MPN/100 mL) Wet Weather summary for 11 samples:
2/9/2007 5 170 present > QL present > QL not sampled 10/11/2007 52 260 380 390 120
Dry Weather: Mean 133 137 146 137 309
Median 72 74 120 80 285 Maximum 350 990 550 550 620
Total Coliform (MPN/100 mL) Wet Weather:
2/9/2007 870 present > QL present > QL present > QL not sampled 10/11/2007 330 present > QL present > QL present > QL 1900
Dry Weather summary for 11 samples: Mean 2191 9520 9937 5200 1430
Median 1700 11,000 9450 4100 1350 Maximum >24,000 >24,000 >24,000 >24,000 2200
aWard 2013 bParameter detected above the method quantitation limit (QL) Bold type indicates values exceeding the Water Quality Objective
5 Beach Water Quality Data
San Francisco Bay Beaches Bacteria TMDL Staff Report April 13, 2016
30
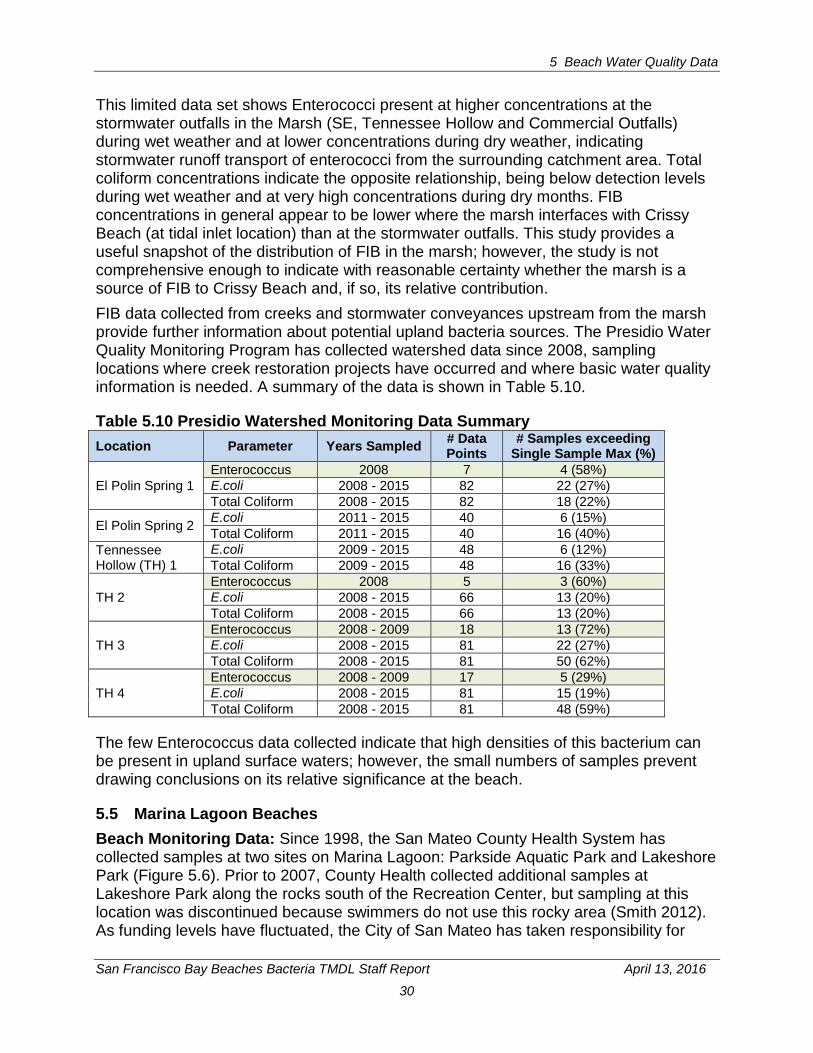
This limited data set shows Enterococci present at higher concentrations at the stormwater outfalls in the Marsh (SE, Tennessee Hollow and Commercial Outfalls) during wet weather and at lower concentrations during dry weather, indicating stormwater runoff transport of enterococci from the surrounding catchment area. Total coliform concentrations indicate the opposite relationship, being below detection levels during wet weather and at very high concentrations during dry months. FIB concentrations in general appear to be lower where the marsh interfaces with Crissy Beach (at tidal inlet location) than at the stormwater outfalls. This study provides a useful snapshot of the distribution of FIB in the marsh; however, the study is not comprehensive enough to indicate with reasonable certainty whether the marsh is a source of FIB to Crissy Beach and, if so, its relative contribution. FIB data collected from creeks and stormwater conveyances upstream from the marsh provide further information about potential upland bacteria sources. The Presidio Water Quality Monitoring Program has collected watershed data since 2008, sampling locations where creek restoration projects have occurred and where basic water quality information is needed. A summary of the data is shown in Table 5.10.
Table 5.10 Presidio Watershed Monitoring Data Summary Location Parameter Years Sampled # Data
Points # Samples exceeding
Single Sample Max (%)
El Polin Spring 1 Enterococcus 2008 7 4 (58%) E.coli 2008 - 2015 82 22 (27%) Total Coliform 2008 - 2015 82 18 (22%)
El Polin Spring 2 E.coli 2011 - 2015 40 6 (15%) Total Coliform 2011 - 2015 40 16 (40%)
Tennessee Hollow (TH) 1
E.coli 2009 - 2015 48 6 (12%) Total Coliform 2009 - 2015 48 16 (33%)
TH 2 Enterococcus 2008 5 3 (60%) E.coli 2008 - 2015 66 13 (20%) Total Coliform 2008 - 2015 66 13 (20%)
TH 3 Enterococcus 2008 - 2009 18 13 (72%) E.coli 2008 - 2015 81 22 (27%) Total Coliform 2008 - 2015 81 50 (62%)
TH 4 Enterococcus 2008 - 2009 17 5 (29%) E.coli 2008 - 2015 81 15 (19%) Total Coliform 2008 - 2015 81 48 (59%)
The few Enterococcus data collected indicate that high densities of this bacterium can be present in upland surface waters; however, the small numbers of samples prevent drawing conclusions on its relative significance at the beach.
5.5 Marina Lagoon Beaches Beach Monitoring Data: Since 1998, the San Mateo County Health System has collected samples at two sites on Marina Lagoon: Parkside Aquatic Park and Lakeshore Park (Figure 5.6). Prior to 2007, County Health collected additional samples at Lakeshore Park along the rocks south of the Recreation Center, but sampling at this location was discontinued because swimmers do not use this rocky area (Smith 2012). As funding levels have fluctuated, the City of San Mateo has taken responsibility for

5 Beach Water Quality Data
San Francisco Bay Beaches Bacteria TMDL Staff Report April 13, 2016
31
some of this sampling. The two beach areas are sampled year-round on a weekly basis for three FIB: total coliform, fecal coliform, and Enterococcus. Beach monitoring data are summarized in Table 5.11 and Table 5.12; entries in bold type exceed CWA 303(d) impairment listing criteria.
Table 5.11 Parkside Aquatic Park Beach Data Summary, 1/2/2008 – 12/22/2014 # Data
points # Samples exceeding
Single Sample Max (%) # Samples exceeding Geometric Meana (%)
Enterococcus 327 102 (31.2%) 145 (54.1%) Total Coliform 329 65 (19.8%) 266 (96.0%) Fecal Coliform 329 115 (35.0%) 134 (48.0%) aGeometric means calculated using all data collected in rolling 30-day periods.
Table 5.12 Lakeshore Park Beach Data Summary, 1/2/2008 – 12/22/2014 # Data
points # Samples exceeding
Single Sample Max (%) # Samples exceeding Geometric Meana (%)
Enterococcus 325 84 (25.8%) 148 (54.6%) Total Coliform 326 65 (19.9%) 274 (98.9%) Fecal Coliform 326 84 (25.8%) 99 (35.7%) aGeometric means calculated using all data collected in rolling 30-day periods.
The data are similar between the two beaches on Marina Lagoon. The Enterococcus geomean objective is exceeded in approximately half the samples and nearly all the samples exceed the total coliform geomean objective. At Aquatic Park Beach, Enterococcus exceedances occurred during both wet and dry months, including the entire relatively storm-free period from September 2013 through mid-July of 2014. At Lakeshore Park Beach, Enterococcus exceedances occurred during typically wet months, and also during the primarily dry months of June-September of 2012. NPDES Monitoring Data: The City of San Mateo Wastewater Treatment Plant (Plant), located at the mouth of Marina Lagoon (Figure 5.6), discharges secondary and advanced secondary treated municipal wastewater through a deep water discharge pipe approximately 3,700 feet offshore in San Francisco Bay. This discharge is located too far from the San Mateo beaches to affect them, and the Plant’s NPDES permit (No. CA0037541) does not require pathogen monitoring in Marina Lagoon. The Plant is not considered a source of FIB to Marina Lagoon beaches.
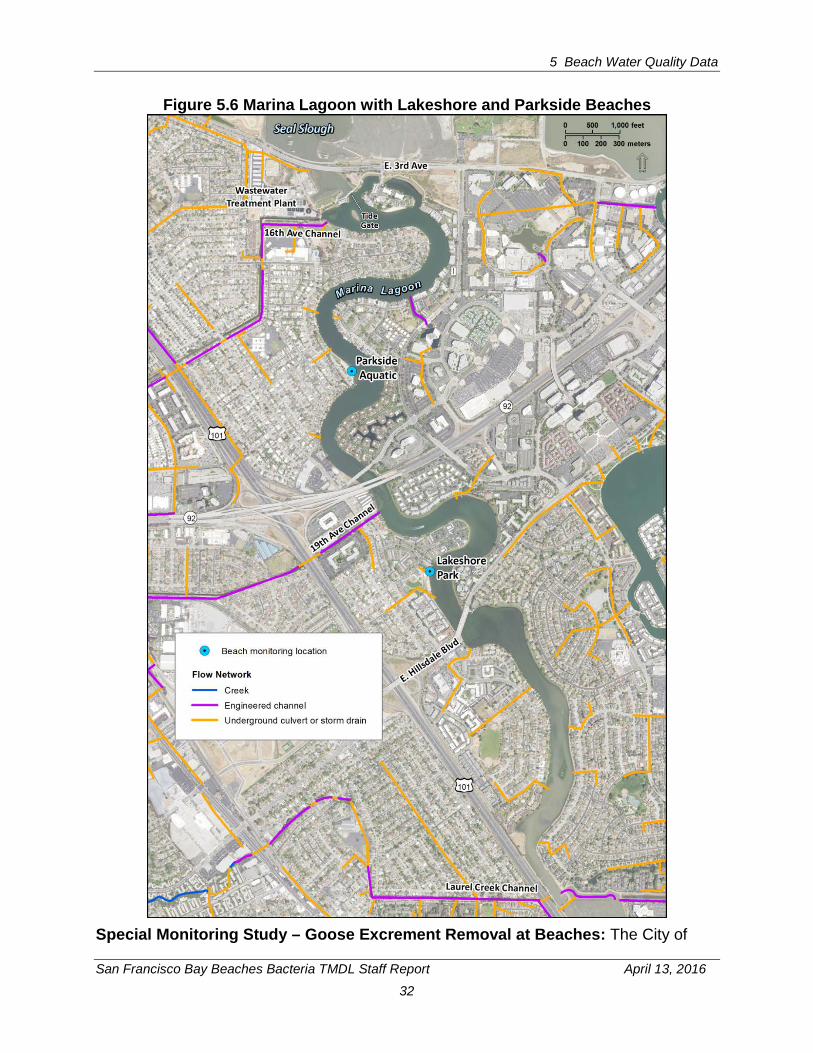
5 Beach Water Quality Data
San Francisco Bay Beaches Bacteria TMDL Staff Report April 13, 2016
32
Figure 5.6 Marina Lagoon with Lakeshore and Parkside Beaches
Special Monitoring Study – Goose Excrement Removal at Beaches: The City of
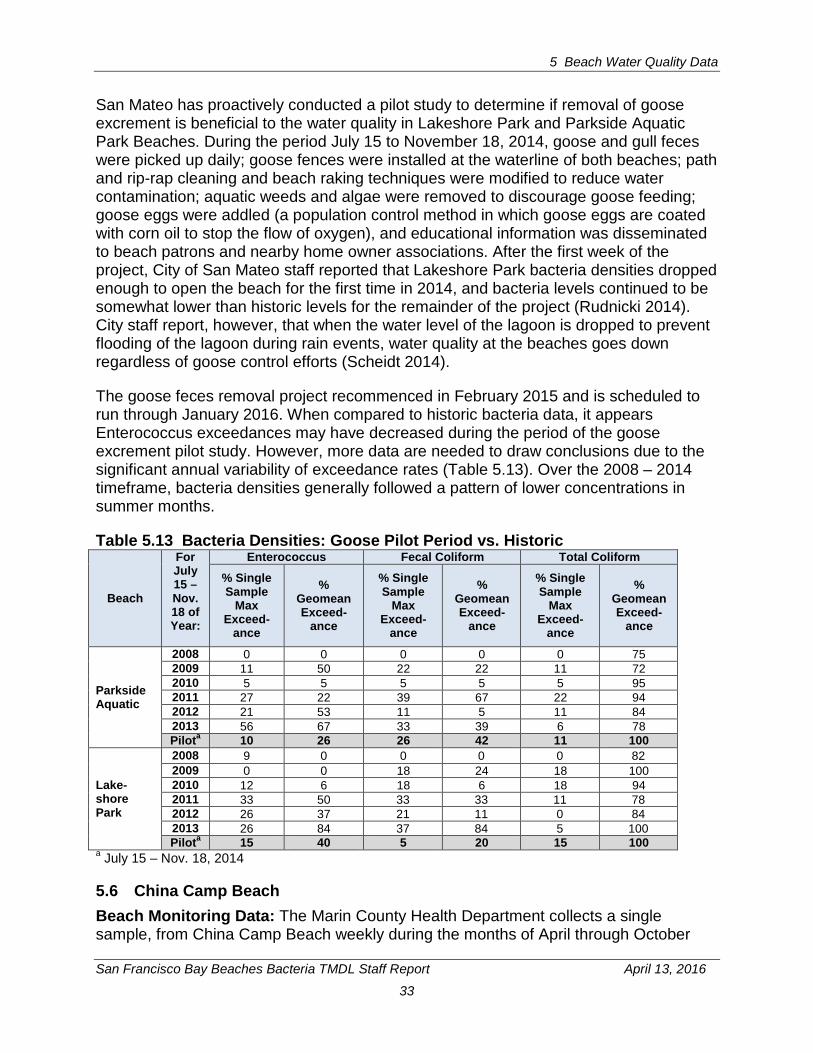
5 Beach Water Quality Data
San Francisco Bay Beaches Bacteria TMDL Staff Report April 13, 2016
33
San Mateo has proactively conducted a pilot study to determine if removal of goose excrement is beneficial to the water quality in Lakeshore Park and Parkside Aquatic Park Beaches. During the period July 15 to November 18, 2014, goose and gull feces were picked up daily; goose fences were installed at the waterline of both beaches; path and rip-rap cleaning and beach raking techniques were modified to reduce water contamination; aquatic weeds and algae were removed to discourage goose feeding; goose eggs were addled (a population control method in which goose eggs are coated with corn oil to stop the flow of oxygen), and educational information was disseminated to beach patrons and nearby home owner associations. After the first week of the project, City of San Mateo staff reported that Lakeshore Park bacteria densities dropped enough to open the beach for the first time in 2014, and bacteria levels continued to be somewhat lower than historic levels for the remainder of the project (Rudnicki 2014). City staff report, however, that when the water level of the lagoon is dropped to prevent flooding of the lagoon during rain events, water quality at the beaches goes down regardless of goose control efforts (Scheidt 2014).
The goose feces removal project recommenced in February 2015 and is scheduled to run through January 2016. When compared to historic bacteria data, it appears Enterococcus exceedances may have decreased during the period of the goose excrement pilot study. However, more data are needed to draw conclusions due to the significant annual variability of exceedance rates (Table 5.13). Over the 2008 – 2014 timeframe, bacteria densities generally followed a pattern of lower concentrations in summer months.
Table 5.13 Bacteria Densities: Goose Pilot Period vs. Historic
Beach
For July 15 – Nov. 18 of Year:
Enterococcus Fecal Coliform Total Coliform
% Single Sample
Max Exceed-
ance
% Geomean Exceed-
ance
% Single Sample
Max Exceed-
ance
% Geomean Exceed-
ance
% Single Sample
Max Exceed-
ance
% Geomean Exceed-
ance
Parkside Aquatic
2008 0 0 0 0 0 75 2009 11 50 22 22 11 72 2010 5 5 5 5 5 95 2011 27 22 39 67 22 94 2012 21 53 11 5 11 84 2013 56 67 33 39 6 78 Pilota 10 26 26 42 11 100
Lake-shore Park
2008 9 0 0 0 0 82 2009 0 0 18 24 18 100 2010 12 6 18 6 18 94 2011 33 50 33 33 11 78 2012 26 37 21 11 0 84 2013 26 84 37 84 5 100 Pilota 15 40 5 20 15 100
a July 15 – Nov. 18, 2014
5.6 China Camp Beach Beach Monitoring Data: The Marin County Health Department collects a single sample, from China Camp Beach weekly during the months of April through October

5 Beach Water Quality Data
San Francisco Bay Beaches Bacteria TMDL Staff Report April 13, 2016
34
(location shown on Figure 5.7). U.S. EPA placed China Camp Beach on the 303(d) list based on 26% of samples exceeding the geomean of total coliform objective (U.S. EPA 2011), using data collected in the 2003-2005 sampling timeframe. Analysis of beach monitoring data collected since then (Table 5.14) indicates that the geomean for total coliform remains elevated above the objective. Table 5.14 China Camp Beach Data Summary: 4/5/2006 – 10/29/2014 # Data
points # Samples exceeding
Single Sample Max (%) # Samples exceeding Geometric Meana (%)
Enterococcus 271 3 (1.1%) 0 Total Coliform 267 10 (3.7%) 75 (32.1%) E.coli b 271 2 (0.7%) 0 aGeometric means calculated using all data collected in rolling 30-day periods bCompare to fecal coliform objectives, because no marine E.coli objective exists for estuarine waters
Figure 5.7 China Camp Beach
The total coliform exceedances tended to occur between May and September, which are typically dry months. However, there is a wide annual variation in total coliform results, as illustrated in Figure 5.8. Note that approximately 30 samples are collected annually between April 1 and October 31.
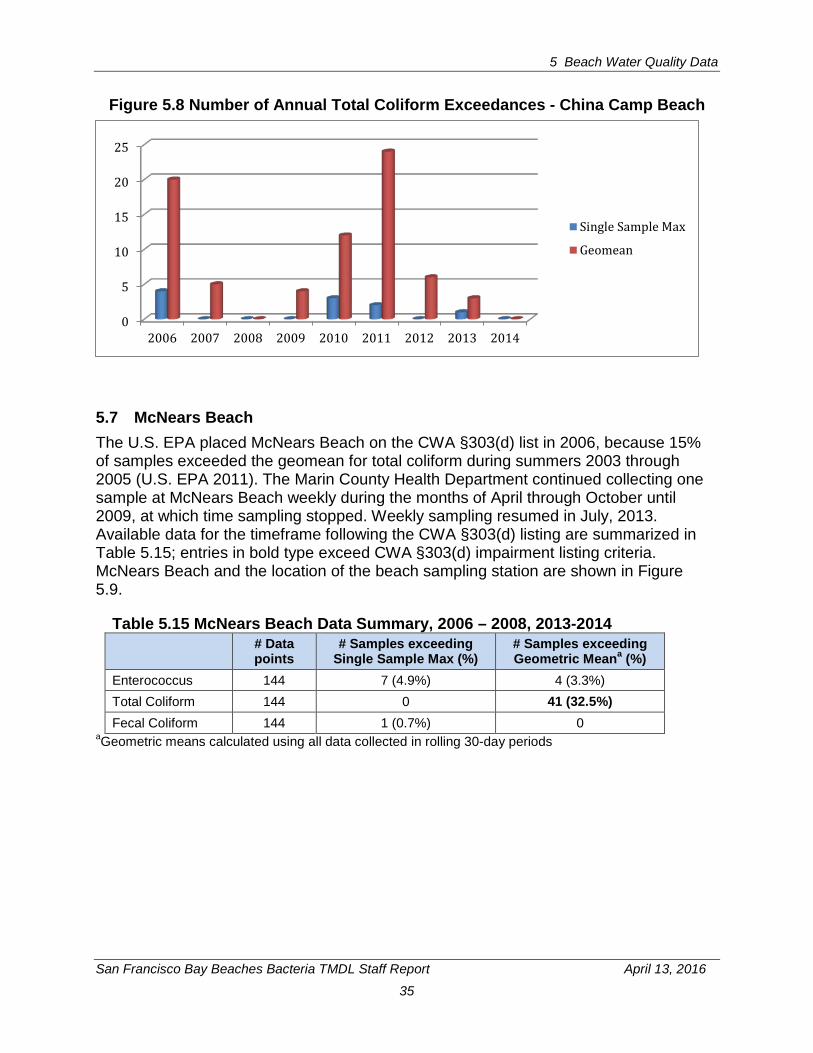
5 Beach Water Quality Data
San Francisco Bay Beaches Bacteria TMDL Staff Report April 13, 2016
35
Figure 5.8 Number of Annual Total Coliform Exceedances - China Camp Beach
5.7 McNears Beach The U.S. EPA placed McNears Beach on the CWA §303(d) list in 2006, because 15% of samples exceeded the geomean for total coliform during summers 2003 through 2005 (U.S. EPA 2011). The Marin County Health Department continued collecting one sample at McNears Beach weekly during the months of April through October until 2009, at which time sampling stopped. Weekly sampling resumed in July, 2013. Available data for the timeframe following the CWA §303(d) listing are summarized in Table 5.15; entries in bold type exceed CWA §303(d) impairment listing criteria. McNears Beach and the location of the beach sampling station are shown in Figure 5.9.
Table 5.15 McNears Beach Data Summary, 2006 – 2008, 2013-2014 # Data
points # Samples exceeding
Single Sample Max (%) # Samples exceeding Geometric Meana (%)
Enterococcus 144 7 (4.9%) 4 (3.3%) Total Coliform 144 0 41 (32.5%) Fecal Coliform 144 1 (0.7%) 0
aGeometric means calculated using all data collected in rolling 30-day periods
0
5
10
15
20
25
2006 2007 2008 2009 2010 2011 2012 2013 2014
Single Sample Max
Geomean
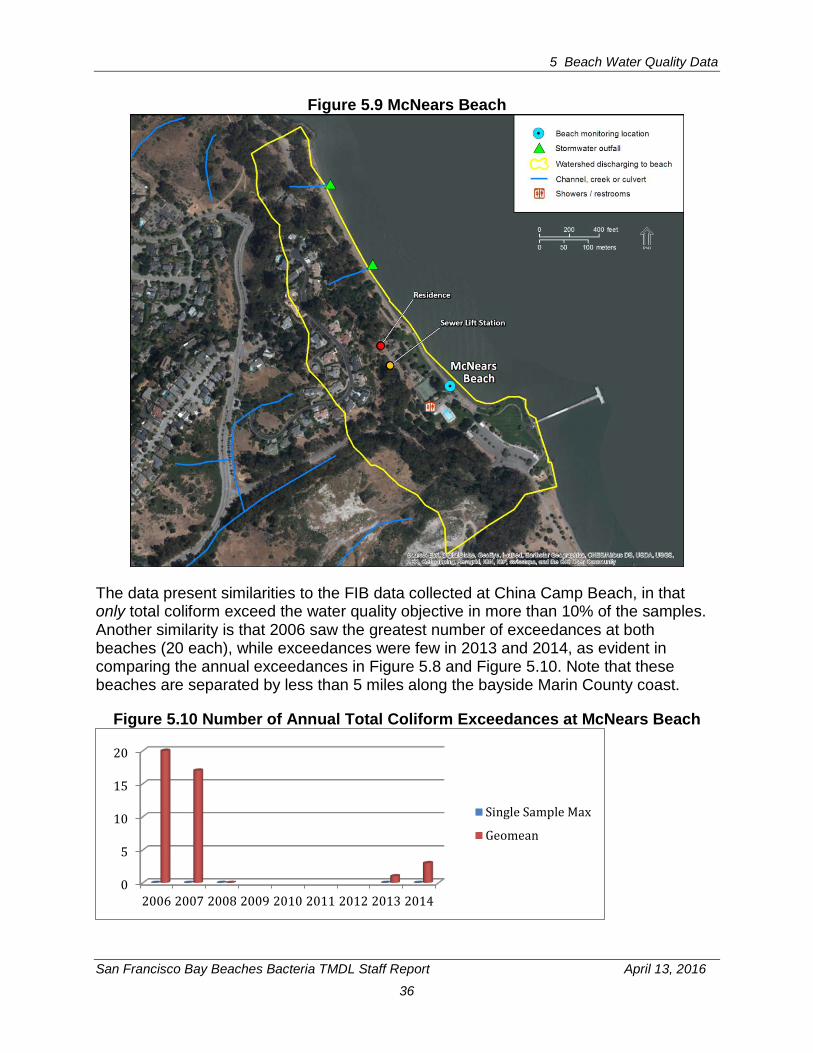
5 Beach Water Quality Data
San Francisco Bay Beaches Bacteria TMDL Staff Report April 13, 2016
36
Figure 5.9 McNears Beach
The data present similarities to the FIB data collected at China Camp Beach, in that only total coliform exceed the water quality objective in more than 10% of the samples. Another similarity is that 2006 saw the greatest number of exceedances at both beaches (20 each), while exceedances were few in 2013 and 2014, as evident in comparing the annual exceedances in Figure 5.8 and Figure 5.10. Note that these beaches are separated by less than 5 miles along the bayside Marin County coast.
Figure 5.10 Number of Annual Total Coliform Exceedances at McNears Beach
0
5
10
15
20
2006 2007 2008 2009 2010 2011 2012 2013 2014
Single Sample Max
Geomean

5 Beach Water Quality Data
San Francisco Bay Beaches Bacteria TMDL Staff Report April 13, 2016
37
5.8 Heal the Bay Report Card “Grades” The nonprofit environmental organization Heal the Bay evaluates beach monitoring data and presents it annually in the form of report card grades, A through F, which provides a different way to look at the same data as used in the analyses above. Heal the Bay’s data analyses involved deriving total points available by adding together the geometric mean and the single sample standard (although there is no geometric mean component to wet weather grades), subtracting points lost for exceedances of water quality objectives, then dividing by total number of samples and multiplying by 100 (Heal the Bay 2015). Grades are assigned for each beach sampling location, resulting in some beaches receiving more than one grade, and separate grades are given for summer dry weather, winter dry weather and wet weather year round. The different data evaluation methods make it difficult to compare beach grades to the data summaries provided for each beach in the previous sections of this report. Table 5.16 shows Heal the Bay grades for 2014 along with the long-term exceedance rates of the Enterococcus geometric mean WQO.
Table 5.16 Heal the Bay Beach Grades for 2014
Beach - Sample Location Summer Dry (April-Oct)
Winter Dry (Nov-Mar)
Wet Weather
Year round
Enterococcus geomean
exceedance rate: 2008-2014
Aquatic Park – Hyde ST A A B 4% Aquatic Park – 211 Station B B A 18% Candlestick – Jackrabbit A B F 20% Candlestick – Windsurfer Circle C C F 50%
Candlestick – Sunnydale Cove F B F 63%
Crissy Field – East A A B 19% Crissy Field – West A A+ B 4% Marina Lagoon – Aquatic Park F F F 54
Marina Lagoon – Lakeshore F C F 55 China Camp – only station A+ NDa ND 0 McNears – only station A+ ND ND 3 a ND indicates no data were collected during that timeframe Source: Heal the Bay 2015

San Francisco Bay Beaches Bacteria TMDL Staff Report April 13, 2016
38
6 NUMERIC TARGETS
In order to establish a TMDL, a desired or target condition is established to provide measurable environmental management goals and a clear linkage to attaining the applicable water quality objectives. This section describes the proposed numeric targets.
6.1 Numeric Targets The numeric targets for San Francisco Bay beaches are based on the Basin Plan water quality objectives for Enterococcus for water contact recreation uses in marine and estuarine waters and are consistent with U.S. EPA’s 2012 recommended Recreational Water Quality Criteria for Enterococcus in marine and fresh water. The U.S. EPA recommendations provide two slightly different possible values (geometric means of 30 vs. 35 cfu/100 mL), and the State Board is considering an action to adopt one of those values statewide for Enterococcus in marine waters. The value adopted statewide will be used for future beach delistings and will not replace the numeric targets, listed in Table 6.1.
Table 6.1 Numeric Targets for San Francisco Bay Beaches Enterococcus
Geometric mean < 35 MPN / 100 mLa,b
Single sample maximum No sample > 104 MPN / 100 mL
a. Most Probable Number (MPN) is a method for counting viable cells and provides a statistical representation of the more time-consuming “colony forming unit” method for estimating the number of viable bacteria cells in a sample
b. Based on a minimum of five samples during a 30-day period
San Francisco Bay Water Board staff has adopted numeric targets only for Enterococcus, not fecal and total coliform, for San Francisco Bay beaches because U.S. EPA’s 2012 Recreational Water Quality Criteria guidance document recommends relying on Enterococcus alone as a FIB in marine waters. U.S. EPA’s current recommendation is based on updated research indicating that levels of Enterococcus in marine waters correlate highly to incidences of human illness (Cabelli et al., 1982; Wade et al., 2008), while levels of total coliform and fecal coliform do not. In addition, EPA has advised states to use Enterococcus as the sole FIB in marine waters in three other guidance documents: “Ambient Water Quality Criteria for Bacteria” issued in 1986; “Protocol for Developing Pathogen TMDLs,” issued in 2001; and “Implementation Guidance for Ambient Water Quality Criteria for Bacteria,” issued in 2002 and reaffirming the 1986 guidance. The Basin Plan currently contains bacterial indicator water quality objectives for fecal coliform, total coliform and Enterococcus; however, use of only Enterococcus numeric targets for the San Francisco Bay Beaches is appropriate in light of U.S. EPA’s updated recommendations.

6 Numeric Targets
San Francisco Bay Beaches Bacteria TMDL Staff Report April 13, 2016
39
6.2 Implementation of the Numeric Targets The numeric targets are the desired condition for all San Francisco Bay beaches. Success in achieving these conditions will be evaluated in accordance with the State of California CWA §303(d) listing policy (State Board 2004).
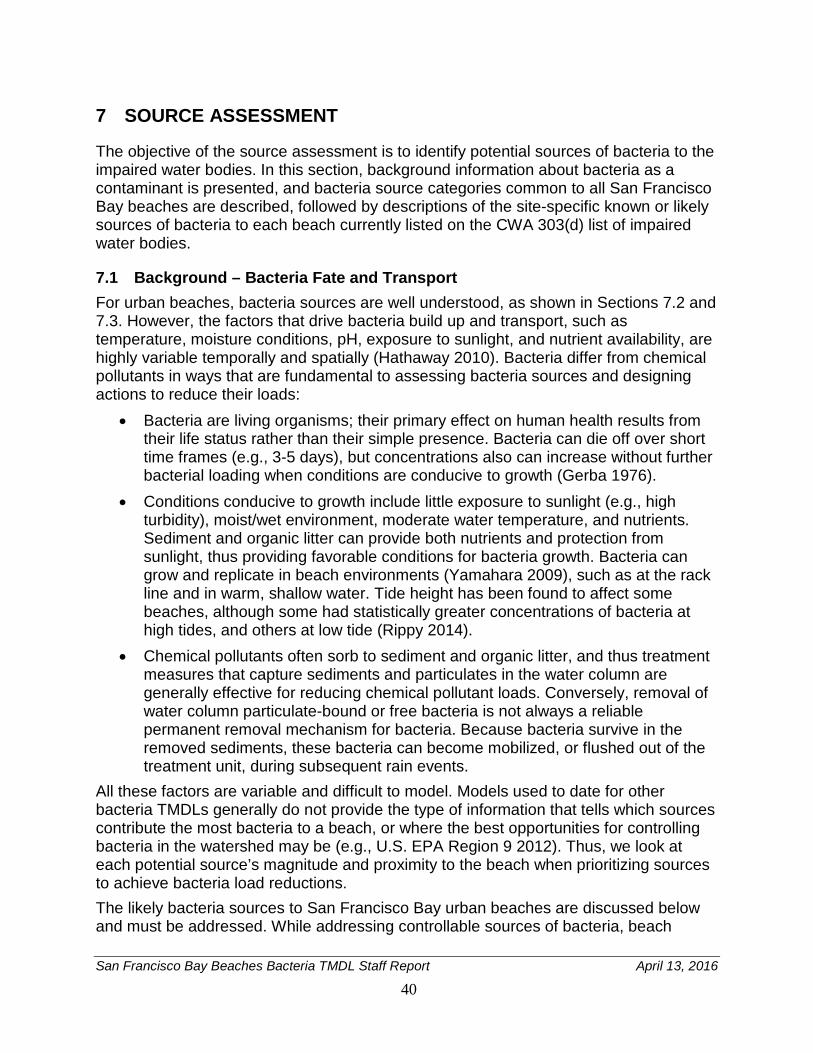
San Francisco Bay Beaches Bacteria TMDL Staff Report April 13, 2016
40
7 SOURCE ASSESSMENT
The objective of the source assessment is to identify potential sources of bacteria to the impaired water bodies. In this section, background information about bacteria as a contaminant is presented, and bacteria source categories common to all San Francisco Bay beaches are described, followed by descriptions of the site-specific known or likely sources of bacteria to each beach currently listed on the CWA 303(d) list of impaired water bodies.
7.1 Background – Bacteria Fate and Transport For urban beaches, bacteria sources are well understood, as shown in Sections 7.2 and 7.3. However, the factors that drive bacteria build up and transport, such as temperature, moisture conditions, pH, exposure to sunlight, and nutrient availability, are highly variable temporally and spatially (Hathaway 2010). Bacteria differ from chemical pollutants in ways that are fundamental to assessing bacteria sources and designing actions to reduce their loads:
• Bacteria are living organisms; their primary effect on human health results from their life status rather than their simple presence. Bacteria can die off over short time frames (e.g., 3-5 days), but concentrations also can increase without further bacterial loading when conditions are conducive to growth (Gerba 1976).
• Conditions conducive to growth include little exposure to sunlight (e.g., high turbidity), moist/wet environment, moderate water temperature, and nutrients. Sediment and organic litter can provide both nutrients and protection from sunlight, thus providing favorable conditions for bacteria growth. Bacteria can grow and replicate in beach environments (Yamahara 2009), such as at the rack line and in warm, shallow water. Tide height has been found to affect some beaches, although some had statistically greater concentrations of bacteria at high tides, and others at low tide (Rippy 2014).
• Chemical pollutants often sorb to sediment and organic litter, and thus treatment measures that capture sediments and particulates in the water column are generally effective for reducing chemical pollutant loads. Conversely, removal of water column particulate-bound or free bacteria is not always a reliable permanent removal mechanism for bacteria. Because bacteria survive in the removed sediments, these bacteria can become mobilized, or flushed out of the treatment unit, during subsequent rain events.
All these factors are variable and difficult to model. Models used to date for other bacteria TMDLs generally do not provide the type of information that tells which sources contribute the most bacteria to a beach, or where the best opportunities for controlling bacteria in the watershed may be (e.g., U.S. EPA Region 9 2012). Thus, we look at each potential source’s magnitude and proximity to the beach when prioritizing sources to achieve bacteria load reductions. The likely bacteria sources to San Francisco Bay urban beaches are discussed below and must be addressed. While addressing controllable sources of bacteria, beach
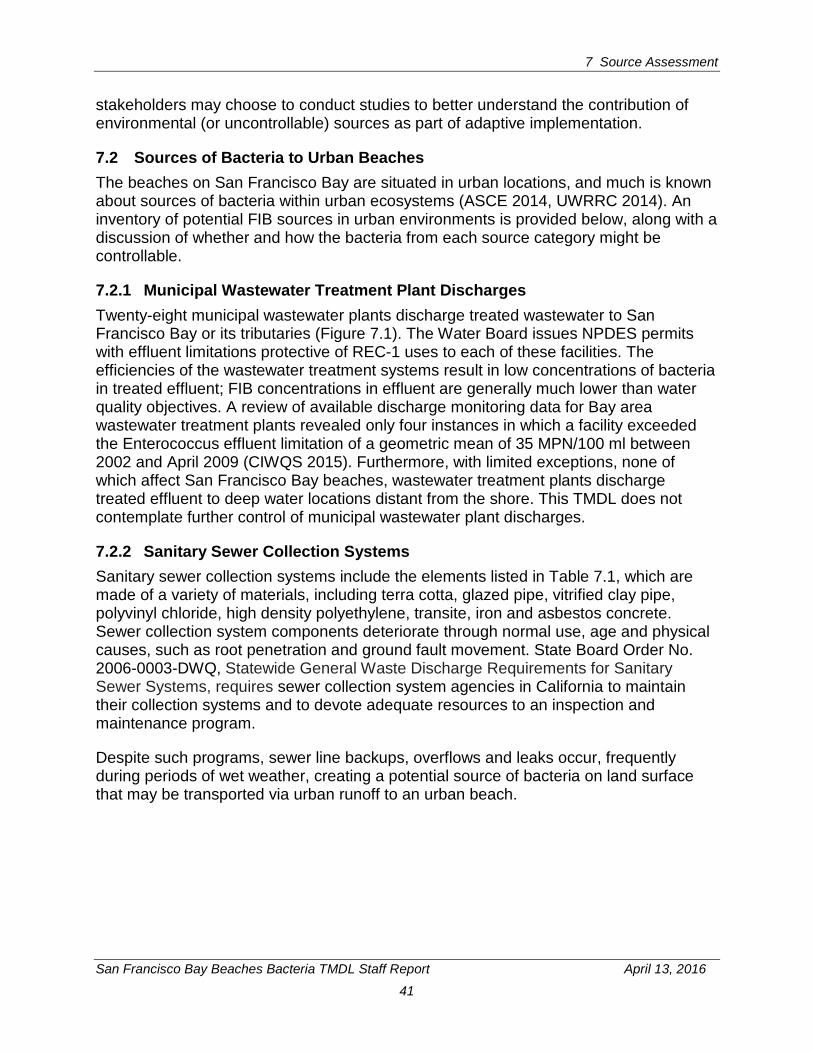
7 Source Assessment
San Francisco Bay Beaches Bacteria TMDL Staff Report April 13, 2016
41
stakeholders may choose to conduct studies to better understand the contribution of environmental (or uncontrollable) sources as part of adaptive implementation.
7.2 Sources of Bacteria to Urban Beaches The beaches on San Francisco Bay are situated in urban locations, and much is known about sources of bacteria within urban ecosystems (ASCE 2014, UWRRC 2014). An inventory of potential FIB sources in urban environments is provided below, along with a discussion of whether and how the bacteria from each source category might be controllable.
7.2.1 Municipal Wastewater Treatment Plant Discharges Twenty-eight municipal wastewater plants discharge treated wastewater to San Francisco Bay or its tributaries (Figure 7.1). The Water Board issues NPDES permits with effluent limitations protective of REC-1 uses to each of these facilities. The efficiencies of the wastewater treatment systems result in low concentrations of bacteria in treated effluent; FIB concentrations in effluent are generally much lower than water quality objectives. A review of available discharge monitoring data for Bay area wastewater treatment plants revealed only four instances in which a facility exceeded the Enterococcus effluent limitation of a geometric mean of 35 MPN/100 ml between 2002 and April 2009 (CIWQS 2015). Furthermore, with limited exceptions, none of which affect San Francisco Bay beaches, wastewater treatment plants discharge treated effluent to deep water locations distant from the shore. This TMDL does not contemplate further control of municipal wastewater plant discharges.
7.2.2 Sanitary Sewer Collection Systems Sanitary sewer collection systems include the elements listed in Table 7.1, which are made of a variety of materials, including terra cotta, glazed pipe, vitrified clay pipe, polyvinyl chloride, high density polyethylene, transite, iron and asbestos concrete. Sewer collection system components deteriorate through normal use, age and physical causes, such as root penetration and ground fault movement. State Board Order No. 2006-0003-DWQ, Statewide General Waste Discharge Requirements for Sanitary Sewer Systems, requires sewer collection system agencies in California to maintain their collection systems and to devote adequate resources to an inspection and maintenance program.
Despite such programs, sewer line backups, overflows and leaks occur, frequently during periods of wet weather, creating a potential source of bacteria on land surface that may be transported via urban runoff to an urban beach.
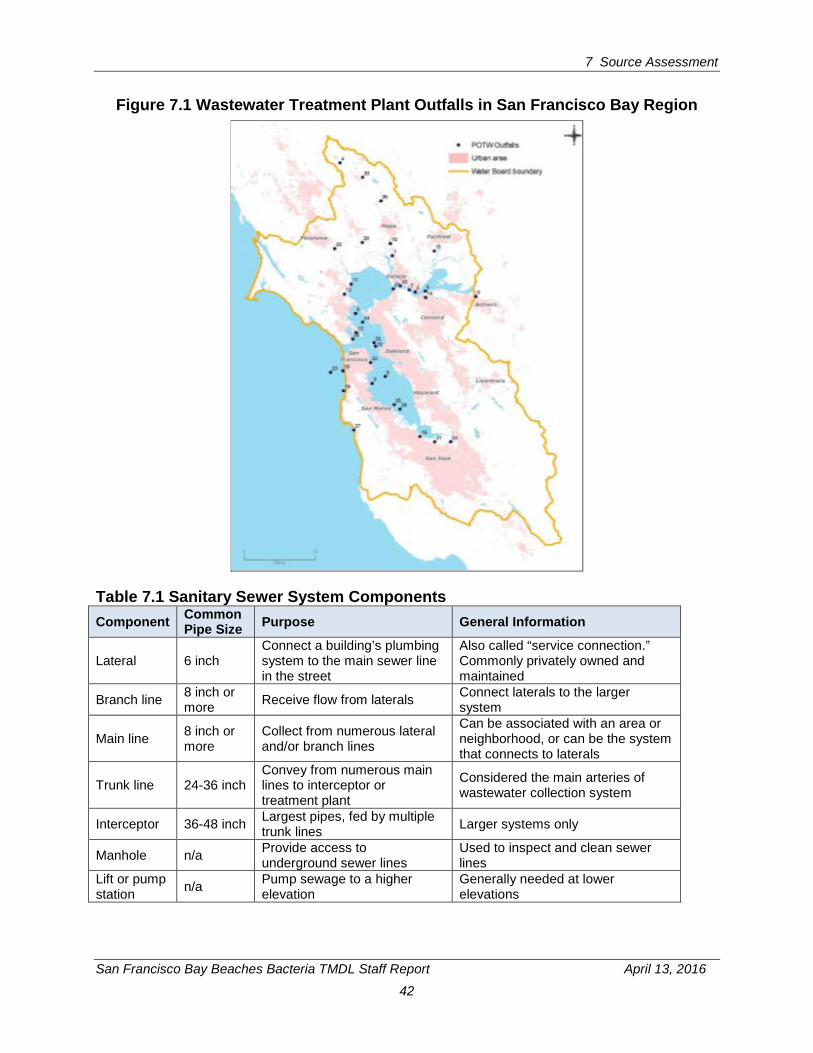
7 Source Assessment
San Francisco Bay Beaches Bacteria TMDL Staff Report April 13, 2016
42
Figure 7.1 Wastewater Treatment Plant Outfalls in San Francisco Bay Region
Table 7.1 Sanitary Sewer System Components Component Common
Pipe Size Purpose General Information
Lateral 6 inch Connect a building’s plumbing system to the main sewer line in the street
Also called “service connection.” Commonly privately owned and maintained
Branch line 8 inch or more Receive flow from laterals Connect laterals to the larger
system
Main line 8 inch or more
Collect from numerous lateral and/or branch lines
Can be associated with an area or neighborhood, or can be the system that connects to laterals
Trunk line 24-36 inch Convey from numerous main lines to interceptor or treatment plant
Considered the main arteries of wastewater collection system
Interceptor 36-48 inch Largest pipes, fed by multiple trunk lines Larger systems only
Manhole n/a Provide access to underground sewer lines
Used to inspect and clean sewer lines
Lift or pump station n/a Pump sewage to a higher
elevation Generally needed at lower elevations
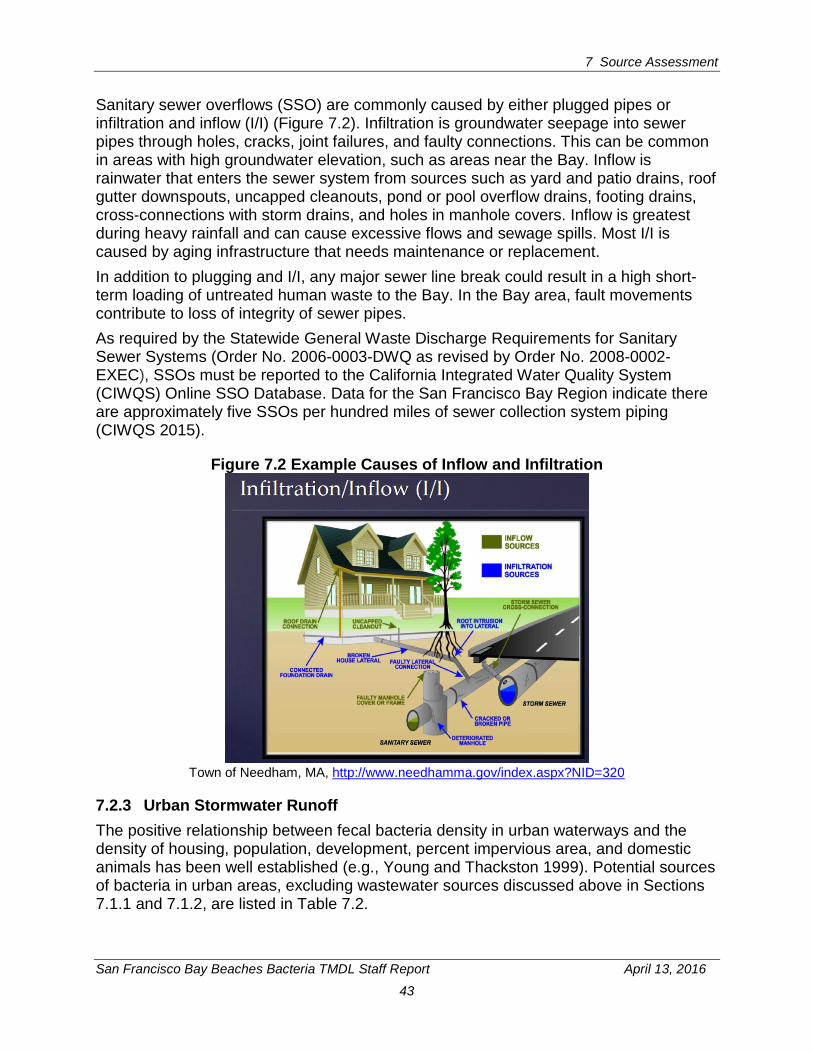
7 Source Assessment
San Francisco Bay Beaches Bacteria TMDL Staff Report April 13, 2016
43
Sanitary sewer overflows (SSO) are commonly caused by either plugged pipes or infiltration and inflow (I/I) (Figure 7.2). Infiltration is groundwater seepage into sewer pipes through holes, cracks, joint failures, and faulty connections. This can be common in areas with high groundwater elevation, such as areas near the Bay. Inflow is rainwater that enters the sewer system from sources such as yard and patio drains, roof gutter downspouts, uncapped cleanouts, pond or pool overflow drains, footing drains, cross-connections with storm drains, and holes in manhole covers. Inflow is greatest during heavy rainfall and can cause excessive flows and sewage spills. Most I/I is caused by aging infrastructure that needs maintenance or replacement. In addition to plugging and I/I, any major sewer line break could result in a high short-term loading of untreated human waste to the Bay. In the Bay area, fault movements contribute to loss of integrity of sewer pipes. As required by the Statewide General Waste Discharge Requirements for Sanitary Sewer Systems (Order No. 2006-0003-DWQ as revised by Order No. 2008-0002-EXEC), SSOs must be reported to the California Integrated Water Quality System (CIWQS) Online SSO Database. Data for the San Francisco Bay Region indicate there are approximately five SSOs per hundred miles of sewer collection system piping (CIWQS 2015).
Figure 7.2 Example Causes of Inflow and Infiltration
Town of Needham, MA, http://www.needhamma.gov/index.aspx?NID=320
7.2.3 Urban Stormwater Runoff The positive relationship between fecal bacteria density in urban waterways and the density of housing, population, development, percent impervious area, and domestic animals has been well established (e.g., Young and Thackston 1999). Potential sources of bacteria in urban areas, excluding wastewater sources discussed above in Sections 7.1.1 and 7.1.2, are listed in Table 7.2.
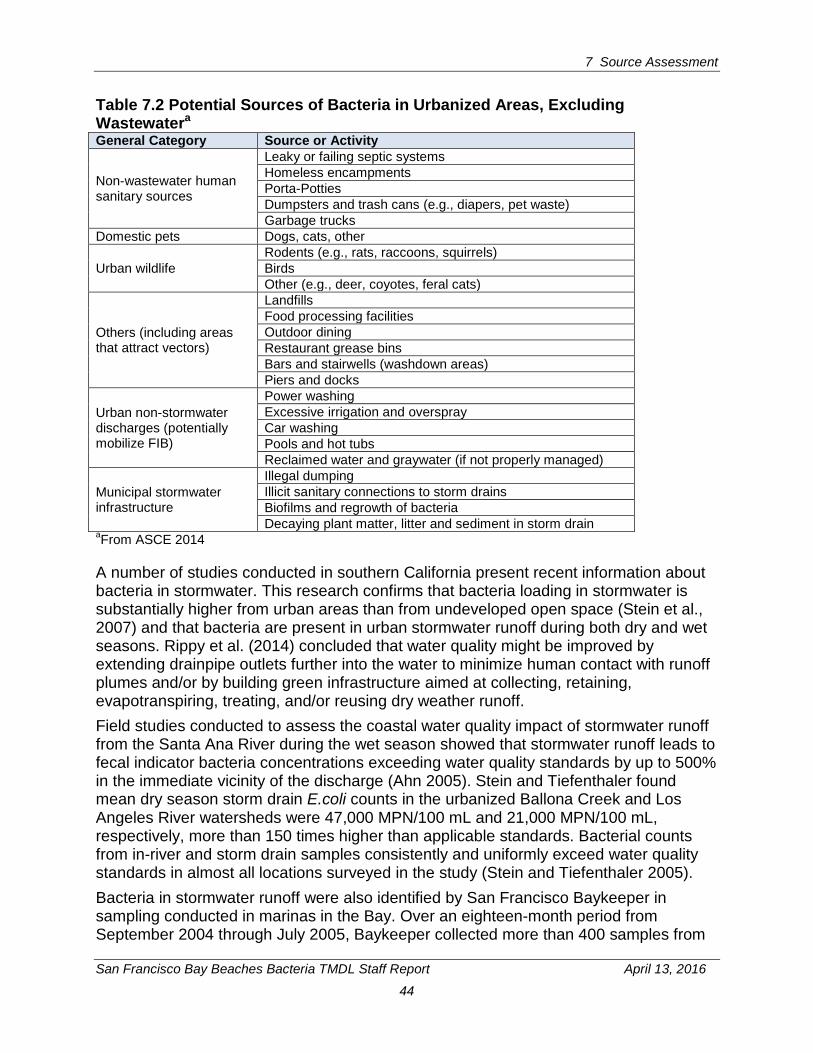
7 Source Assessment
San Francisco Bay Beaches Bacteria TMDL Staff Report April 13, 2016
44
Table 7.2 Potential Sources of Bacteria in Urbanized Areas, Excluding Wastewatera General Category Source or Activity
Non-wastewater human sanitary sources
Leaky or failing septic systems Homeless encampments Porta-Potties Dumpsters and trash cans (e.g., diapers, pet waste) Garbage trucks
Domestic pets Dogs, cats, other
Urban wildlife Rodents (e.g., rats, raccoons, squirrels) Birds Other (e.g., deer, coyotes, feral cats)
Others (including areas that attract vectors)
Landfills Food processing facilities Outdoor dining Restaurant grease bins Bars and stairwells (washdown areas) Piers and docks
Urban non-stormwater discharges (potentially mobilize FIB)
Power washing Excessive irrigation and overspray Car washing Pools and hot tubs Reclaimed water and graywater (if not properly managed)
Municipal stormwater infrastructure
Illegal dumping Illicit sanitary connections to storm drains Biofilms and regrowth of bacteria Decaying plant matter, litter and sediment in storm drain
aFrom ASCE 2014
A number of studies conducted in southern California present recent information about bacteria in stormwater. This research confirms that bacteria loading in stormwater is substantially higher from urban areas than from undeveloped open space (Stein et al., 2007) and that bacteria are present in urban stormwater runoff during both dry and wet seasons. Rippy et al. (2014) concluded that water quality might be improved by extending drainpipe outlets further into the water to minimize human contact with runoff plumes and/or by building green infrastructure aimed at collecting, retaining, evapotranspiring, treating, and/or reusing dry weather runoff. Field studies conducted to assess the coastal water quality impact of stormwater runoff from the Santa Ana River during the wet season showed that stormwater runoff leads to fecal indicator bacteria concentrations exceeding water quality standards by up to 500% in the immediate vicinity of the discharge (Ahn 2005). Stein and Tiefenthaler found mean dry season storm drain E.coli counts in the urbanized Ballona Creek and Los Angeles River watersheds were 47,000 MPN/100 mL and 21,000 MPN/100 mL, respectively, more than 150 times higher than applicable standards. Bacterial counts from in-river and storm drain samples consistently and uniformly exceed water quality standards in almost all locations surveyed in the study (Stein and Tiefenthaler 2005). Bacteria in stormwater runoff were also identified by San Francisco Baykeeper in sampling conducted in marinas in the Bay. Over an eighteen-month period from September 2004 through July 2005, Baykeeper collected more than 400 samples from

7 Source Assessment
San Francisco Bay Beaches Bacteria TMDL Staff Report April 13, 2016
45
four marinas located on San Francisco Bay: Clipper Yacht Harbor in Sausalito, Corinthian Yacht Club in Tiburon; Berkeley Marina in Berkeley, and Jack London Marina in Oakland. Of the 422 water samples collected and analyzed, only 19 (5%) had bacteria levels that exceeded one or more of the water quality standards listed in Table 4.2. A correlation between elevated bacteria levels and the presence of a storm drain was apparent; seventeen of the 19 (89%) samples that exceeded a water quality standard were collected from stations located adjacent to a municipal storm drain (SF Baykeeper 2006). Urban runoff from California Department of Transportation’s (Caltrans) highways has not been found to be a significant source of indicator bacteria, largely because Caltrans’ highways comprise a very small area within San Francisco Bay beach watersheds and are not known to have typical bacteria-generating sources such as homeless encampments, restroom facilities, and garbage bins.
7.2.4 Pets at Beaches Pet waste originating in the general urban area constitutes part of the urban runoff bacteria load. However, pets at or in the near vicinity of beaches present a bacteria load that does not enter the municipal stormwater collection system. Most San Francisco Bay beaches allow dogs either on- or off-leash. While signs may encourage owners to remove pet waste, the level of compliance varies. Poor pet management within a beach area is a potential source of bacteria to the beaches.
7.2.5 Vessels (Recreational, Live-aboard, and Anchor-out Boats) Waste discharge from vessels is a potential source of FIB at beaches with marinas. Based on a marina survey conducted for the California Department of Boating and Waterways (DBW) in August 2004, there are 99 recreational marinas with a total of more than 20,000 slips in San Francisco Bay. Most boats are designed for active self-propelled navigation and also to accommodate living onboard. Boats that are used as long-term private residences as well as for navigation are referred to as “live-aboards.” More than 1300 live-aboards are berthed in San Francisco Bay marinas (McDowell and Patton 2004).
There are approximately 35 pumpout facilities on San Francisco Bay (DBW and SFEP 2005). A more recent DBW survey did not contain the level of detail found on Table 7.3, but did find that 59% of boats on San Francisco Bay have installed onboard toilets, and 18% have porta-potties. Asked to identify obstacles to using sewage pumpouts on San Francisco Bay, 12% of respondents said the stations are broken at least half the time, and 14% said they are unable to find one at least half the time. Of boaters statewide (question not broken down by area) 64% of the respondents stated that California boaters frequently discharge untreated sewage into the water (DBW 2011).
Note that the San Francisco Baykeeper marina sampling discussed above (Section 7.1.3) found only 5% of water samples from four marinas on San Francisco Bay exceeded bacteria objectives, while the Richardson Bay Pathogen TMDL adopted in 2008 identifies live-aboard vessels as a significant bacteria source.
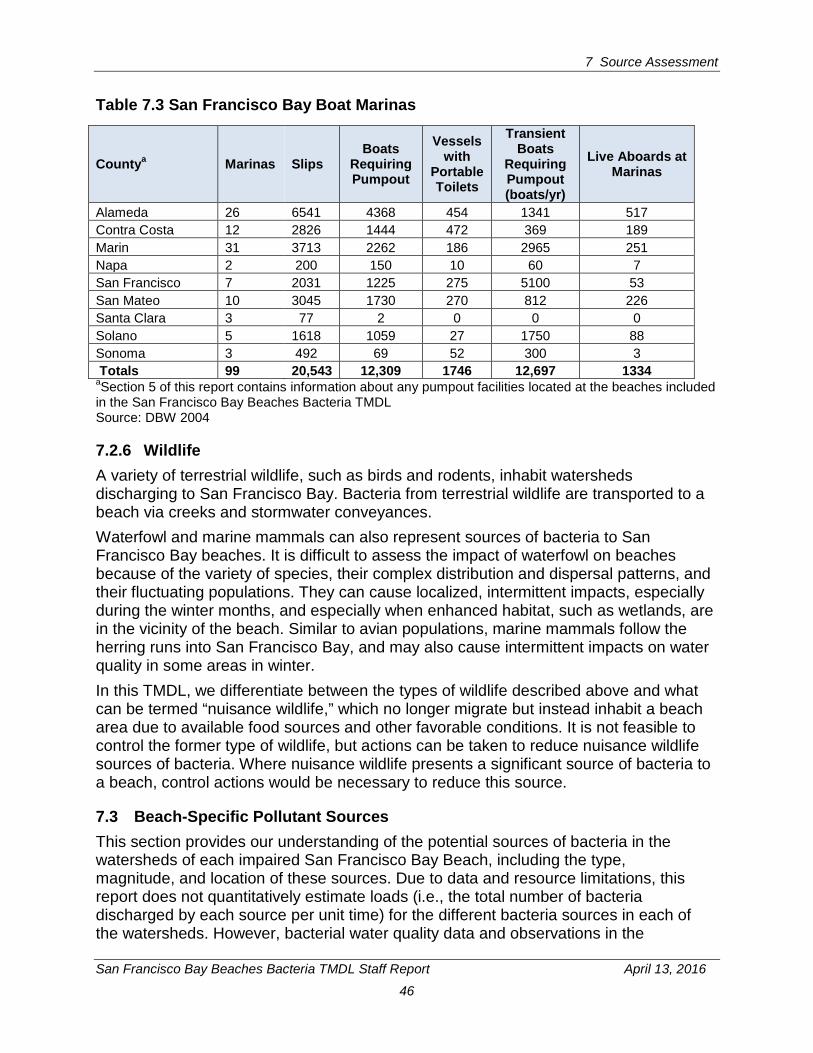
7 Source Assessment
San Francisco Bay Beaches Bacteria TMDL Staff Report April 13, 2016
46
Table 7.3 San Francisco Bay Boat Marinas
aSection 5 of this report contains information about any pumpout facilities located at the beaches included in the San Francisco Bay Beaches Bacteria TMDL Source: DBW 2004
7.2.6 Wildlife A variety of terrestrial wildlife, such as birds and rodents, inhabit watersheds discharging to San Francisco Bay. Bacteria from terrestrial wildlife are transported to a beach via creeks and stormwater conveyances. Waterfowl and marine mammals can also represent sources of bacteria to San Francisco Bay beaches. It is difficult to assess the impact of waterfowl on beaches because of the variety of species, their complex distribution and dispersal patterns, and their fluctuating populations. They can cause localized, intermittent impacts, especially during the winter months, and especially when enhanced habitat, such as wetlands, are in the vicinity of the beach. Similar to avian populations, marine mammals follow the herring runs into San Francisco Bay, and may also cause intermittent impacts on water quality in some areas in winter. In this TMDL, we differentiate between the types of wildlife described above and what can be termed “nuisance wildlife,” which no longer migrate but instead inhabit a beach area due to available food sources and other favorable conditions. It is not feasible to control the former type of wildlife, but actions can be taken to reduce nuisance wildlife sources of bacteria. Where nuisance wildlife presents a significant source of bacteria to a beach, control actions would be necessary to reduce this source.
7.3 Beach-Specific Pollutant Sources This section provides our understanding of the potential sources of bacteria in the watersheds of each impaired San Francisco Bay Beach, including the type, magnitude, and location of these sources. Due to data and resource limitations, this report does not quantitatively estimate loads (i.e., the total number of bacteria discharged by each source per unit time) for the different bacteria sources in each of the watersheds. However, bacterial water quality data and observations in the
Countya Marinas Slips Boats
Requiring Pumpout
Vessels with
Portable Toilets
Transient Boats
Requiring Pumpout (boats/yr)
Live Aboards at Marinas
Alameda 26 6541 4368 454 1341 517 Contra Costa 12 2826 1444 472 369 189 Marin 31 3713 2262 186 2965 251 Napa 2 200 150 10 60 7 San Francisco 7 2031 1225 275 5100 53 San Mateo 10 3045 1730 270 812 226 Santa Clara 3 77 2 0 0 0 Solano 5 1618 1059 27 1750 88 Sonoma 3 492 69 52 300 3 Totals 99 20,543 12,309 1746 12,697 1334
7 Source Assessment
San Francisco Bay Beaches Bacteria TMDL Staff Report April 13, 2016
47
watersheds lead us to conclusions about the likelihood and significance of different sources of bacteria.
7.3.1 Aquatic Park Beach Monitoring data from the two sample locations at Aquatic Park Beach (Section 5.2) show the bacteria objectives are exceeded at only one, Station 211, where the Enterococcus objective is exceeded in 18% of the samples. The Hyde Street Pier sample location does not experience significant bacteria objective exceedances, indicating the likelihood of a bacteria source affecting the area of Aquatic Beach associated with Station 211. The potential bacteria sources are described below. Sanitary Wastewater: Potential sanitary wastewater sources to Aquatic Park Beach include CSDs and SSOs. However, data on CSD overflows (Section 5.1) demonstrate that CSDs are not a significant source of pathogens to Aquatic Park Beach. Sanitary sewer leakage remains a potential source. A sanitary sewer main pipeline runs parallel to the beach and is owned and operated by the SFPUC. At the time of report preparation, no information on the condition of this line was available. Other sanitary sewer infrastructure in the vicinity of Aquatic Park Beach includes:
• Under pier piping connects a public restroom facility on Hyde Street Pier to the SFPUC main pipeline. The Port of San Francisco inspects the condition of all under pier water and sewer infrastructure at least annually. Port of San Francisco staff has observed no leaking pipes beneath the Hyde Street Pier. Restroom facilities for vessel berth holders are located at the Hyde Street Harbor Office, adjacent to Hyde Street Pier. The underground laterals for this facility are under the Port’s control until they tie into SFPUC’s sewer main (Alford 2015).
• The National Park Service owns two public restroom structures, one at either end of the beach. Both were built in the mid-1930s and closed in about 2006 because the piping and pump stations needed frequent maintenance and operating these facilities was not cost-effective. There are no plans to renovate the rest rooms.
• The Sea Scout structure at the west end of the beach does not contain a restroom. Temporary sanitation stations are rented when the structure is used for overnight events.
• The Maritime Museum structure (also called the Aquatic Park Bathhouse) has been extensively renovated. Two pumps within the building pump wastewater to the SFPUC combined sewer system.
Sanitary sewer lines operated by SFPUC, National Park Service, and Port of San Francisco merit investigation as possible sources of bacteria to Aquatic Park Beach. Urban Runoff: Because most of the watershed runoff flows to San Francisco’s combined sewer system, a relatively small land area discharges to Aquatic Park Beach, primarily at the east and western ends of the beach (Figure 5.1). Urban runoff from the Maritime Museum building and grounds, including the green roof over the building, discharges in the vicinity of the former Mid-beach sampling station. Urban
7 Source Assessment
San Francisco Bay Beaches Bacteria TMDL Staff Report April 13, 2016
48
runoff from the remainder of the catchment flows to the SFPUC’s combined sewer system, discussed below. Because the area discharging to the beach is quite limited, it would appear that urban runoff would not be a major source of pathogens. However, urban runoff does discharge to the general location of FIB exceedances, i.e., Station 211, and FIB exceedances occur predominately in wet weather months. Thus, urban runoff is a potential source of FIB to Aquatic Park Beach. Pets at the beach: Officially, dogs are not allowed on Aquatic Park Beach, but dogs do frequent the beach and pet waste is evident at times, according to National Park Service personnel groundskeepers. To date, there has not been a campaign to enforce the “no dogs” rule; thus, pets are a potential source of bacteria to the beach. Boat waste: Aquatic Park provides anchorage for non-motorized boats for short-term docking of one to five nights. For the period July 2011-June 2012, an average of nine boats anchored overnight per month. However, during the Fourth of July and Fleet Week holidays, up to 50 boats will anchor in Aquatic Park Cove (Morris 2013b). Boaters either call the harbormaster when they want to anchor or apply in advance for a permit. At that time, boaters are informed of the rules, including the rule that boat must have “zero discharge” of waste to the water. While National Park Service personnel cannot strictly enforce this rule, it is thought that only a minority of boaters may discharge waste in the harbor. Further, Park Service personnel find that most boaters are aware of fact that dumping is prohibited in the entire San Francisco Bay, and within several miles of the coast (Morris 2013a). Signs stating that dumping is prohibited are posted at Municipal Pier and at the U.S. Army Corps of Engineers breakwater. Another 60 temporary berths are located on the east side of Hyde Street Pier, where Port of San Francisco staff provides information on proper management of marine sanitary devices. Pathogen exceedances of WQOs are not observed at the Hyde Street sampling station, indicating that boats do not appear to be a significant source of FIB to the beach. At this time, boats are not considered a significant source of bacteria to Aquatic Park Beach. Should this change, enforcement of current regulations by the National Park Service and Port of San Francisco should be sufficient to address this source. Wildlife: Seals are commonly seen at Aquatic Park, frequently at the west end, and birds are present year-round. National Park Service personnel report that the presence of a barn owl near the cable car turnaround may keep the number of sea gulls in the vicinity relatively low. Nuisance wildlife, such as flocks of geese or seagulls, is not common at or near the beach. Wildlife is not considered a major contributor of bacteria to Aquatic Park Beach. CONCLUSION: The incidence of exceedance of bacteria objectives at Station 211 is 18.6%, and exceedances commonly occur during wet weather. Possible sources are sewer system overflows or leaks and stormwater runoff, including runoff of pet waste.
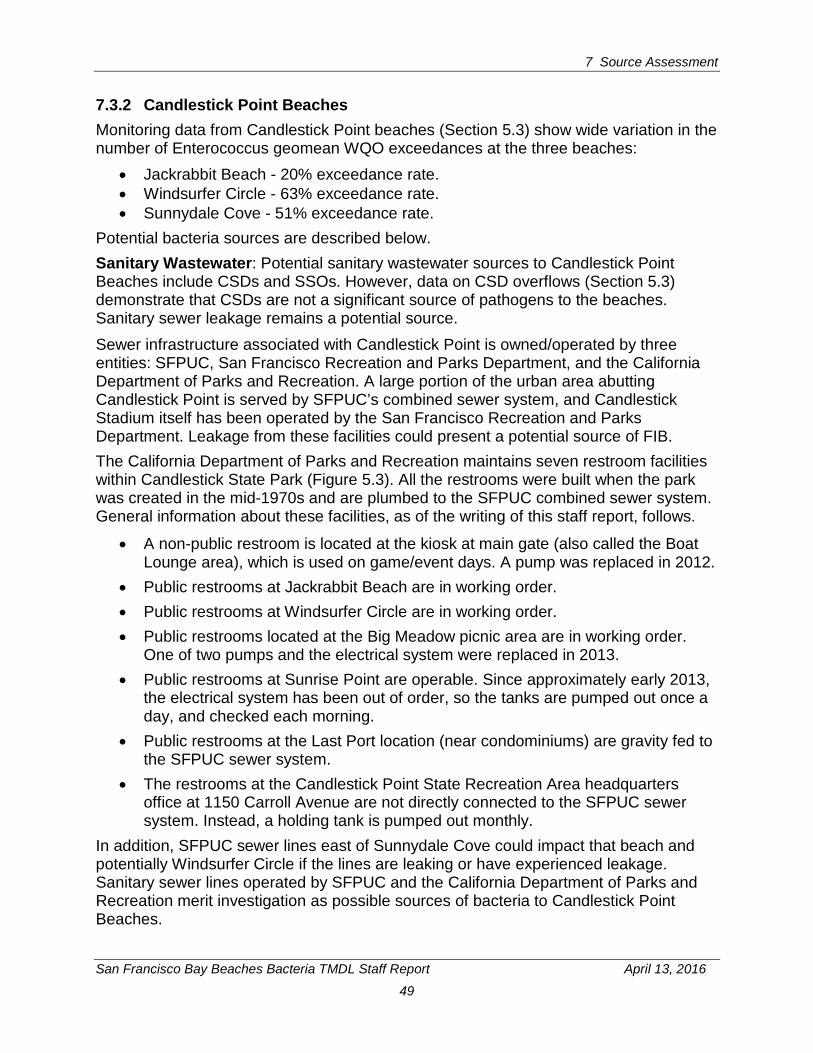
7 Source Assessment
San Francisco Bay Beaches Bacteria TMDL Staff Report April 13, 2016
49
7.3.2 Candlestick Point Beaches Monitoring data from Candlestick Point beaches (Section 5.3) show wide variation in the number of Enterococcus geomean WQO exceedances at the three beaches:
• Jackrabbit Beach - 20% exceedance rate. • Windsurfer Circle - 63% exceedance rate. • Sunnydale Cove - 51% exceedance rate.
Potential bacteria sources are described below. Sanitary Wastewater: Potential sanitary wastewater sources to Candlestick Point Beaches include CSDs and SSOs. However, data on CSD overflows (Section 5.3) demonstrate that CSDs are not a significant source of pathogens to the beaches. Sanitary sewer leakage remains a potential source. Sewer infrastructure associated with Candlestick Point is owned/operated by three entities: SFPUC, San Francisco Recreation and Parks Department, and the California Department of Parks and Recreation. A large portion of the urban area abutting Candlestick Point is served by SFPUC’s combined sewer system, and Candlestick Stadium itself has been operated by the San Francisco Recreation and Parks Department. Leakage from these facilities could present a potential source of FIB. The California Department of Parks and Recreation maintains seven restroom facilities within Candlestick State Park (Figure 5.3). All the restrooms were built when the park was created in the mid-1970s and are plumbed to the SFPUC combined sewer system. General information about these facilities, as of the writing of this staff report, follows.
• A non-public restroom is located at the kiosk at main gate (also called the Boat Lounge area), which is used on game/event days. A pump was replaced in 2012.
• Public restrooms at Jackrabbit Beach are in working order. • Public restrooms at Windsurfer Circle are in working order. • Public restrooms located at the Big Meadow picnic area are in working order.
One of two pumps and the electrical system were replaced in 2013. • Public restrooms at Sunrise Point are operable. Since approximately early 2013,
the electrical system has been out of order, so the tanks are pumped out once a day, and checked each morning.
• Public restrooms at the Last Port location (near condominiums) are gravity fed to the SFPUC sewer system.
• The restrooms at the Candlestick Point State Recreation Area headquarters office at 1150 Carroll Avenue are not directly connected to the SFPUC sewer system. Instead, a holding tank is pumped out monthly.
In addition, SFPUC sewer lines east of Sunnydale Cove could impact that beach and potentially Windsurfer Circle if the lines are leaking or have experienced leakage. Sanitary sewer lines operated by SFPUC and the California Department of Parks and Recreation merit investigation as possible sources of bacteria to Candlestick Point Beaches.
7 Source Assessment
San Francisco Bay Beaches Bacteria TMDL Staff Report April 13, 2016
50
Urban Runoff: While most of the area adjacent to Candlestick Point is served by the SFPUC’s combined sewer system, some portions of the Candlestick Stadium property, Jamestown Avenue and Hunters Point Expressway drain to one of two separate networks of stormwater pipes, and to one of four stormwater outfalls (Figure 5.3). Runoff from the Stadium parking lot flows through a pipe under Hunters Point Expressway, and discharges via the southeastern-most outfall to Windsurfers Circle. The SFPUC has collected samples of discharges from the outfall (three samples in 2003 and one in 2013). All of the samples had Enterococcus and E.coli concentrations significantly less than water quality standards, but total coliform concentrations greater than the water quality standard. The final football season for Candlestick Stadium occurred in 2013-2014. At this time, the stadium has been demolished to make way for other development. Control of runoff during reconstruction will be an important factor in controlling pollutants, including FIB, discharged to the beaches, especially to Windsurfer Circle. In addition, stormwater controls (including control of dry weather discharges) must be incorporated into the new design(s) and construction as the property is redeveloped, with the goal of eliminating or minimizing urban runoff flows to the Candlestick Recreation Area shoreline. The City of San Francisco is responsible for managing the development process. Dirt lots surrounding Candlestick Stadium are owned and managed by the California Department of Parks and Recreation and have been rented out to private parking operators. These lots have been used during San Francisco 49er football games and other public events at Candlestick Stadium. Stormwater discharges from these lots via overland flow to the Bay. The future use of these parcels is unknown. Any new development of these parcels should be designed to eliminate or minimize runoff to the Candlestick Recreation Area shoreline. Pets at the Beach: Pets are allowed at Candlestick Point recreation area but must be on a leash. No survey or anecdotal information is available on the numbers of pets that visit the beach. Until such information can demonstrate otherwise, pets are considered a potential source of bacteria to the beaches. Boats: There is no boat ramp at Candlestick Point State Recreation Area. Due to its location on the Bay, which does not facilitate extended anchoring, it is unlikely that dumping from boats is a significant source of pathogens at the Candlestick Point beaches. Wildlife: Various park personnel have described squirrels and blackbirds as the primary wildlife in the Park, not seagulls or other nuisance wildfowl often associated with marine beaches. Seagulls were prevalent during football games and other events at Candlestick Stadium before it was demolished. In addition, a large municipal solid waste recycling facility located across Highway 101 from Candlestick Point attracts birds in large numbers, and, while the birds do not inhabit the Park, they may deposit droppings in flight to and from that recycling facility. To date, the limited (two samples) genetic data obtained from Windsurfer Circle Beach did not detect human fecal material marker (Section 5.3), but further data are needed to draw conclusions about the significance of wildlife as a source of bacteria to the
7 Source Assessment
San Francisco Bay Beaches Bacteria TMDL Staff Report April 13, 2016
51
beaches. At this time, avian populations are considered an uncontrollable wildlife source. CONCLUSION: The Candlestick Point Park beaches are located within a distance of approximately one-half mile and have similar sources of bacteria, yet the beaches have distinct physical properties and differing rates of bacteria water quality objective exceedances. Windsurfer Circle, with the highest rate of bacteria exceedances, has been directly impacted by runoff from Candlestick Stadium, which has a storm drain culvert and outfall at the beach. Redevelopment of the Candlestick Stadium property could present an FIB load in the future. Windsurfer Circle Beach has a sunny and somewhat muddy, shallow aspect that may provide physical conditions for bacteria to thrive. Sunnydale Cove may be receiving bacteria through leaking sewer infrastructure or urban runoff, and this area may receive a lesser degree of mixing with open Bay waters due to its location. Jackrabbit Beach has the lowest rate of bacteria exceedances, faces the open Bay, and is physically separated from the other two beaches by a small peninsula. Any of the beaches could be affected by leaking piping from aging sewer infrastructure and/or restroom facilities. Wildlife is a potential source. In addition, the beaches are shallow and the possibility that bacteria may persist in the sediments should be examined.
7.3.3 Crissy Field Beach Monitoring data from the two sample locations at Crissy Field Beach (Section 5.4) show the bacteria objectives are exceeded at only the east end of the beach, where the Enterococcus objective is exceeded in 19% of samples. Enterococcus exceedances occur primarily in November through March, during the rainy season. These data indicate a possible bacteria source at the east end of the beach. Potential bacteria sources are described below. Sanitary Wastewater: In the 1990s, first the U.S. Army (1992-95) and then the Presidio Trust (1997-present) began systematically upgrading the sanitary infrastructure at the Presidio. This work continues with the repair of interconnections, rehabilitation of manholes, slip-lining of sewer mains, and similar repairs, including repairs along the Doyle Drive realignment project mentioned above (Hurley 2013). Due to the age of the Presidio, leaky sewer infrastructure remains a likely source of FIB. Infrastructure associated with the Palace of Fine Arts (Figure 5.4) may be a source of bacteria as well. The sewerage system within the Exhibition Hall has overflowed to Palace Drive on more than one occasion; there have been minor back-ups to the landscaping outside the men’s restroom; and the sewer pump station at Lyon Street has overflowed (Taylor 2015). Water in the lagoon, which provides habitat to a variety to birds and aquatic fauna, is a single-use flow-through which discharges to the SFPUC combined sewer system via the sewer pump at Lyon Street. The stand-alone restroom structure in the Palace’s parking lot north of Marina Boulevard is in working order, but has not been inspected for at least 19 years (Chow 2015). The San
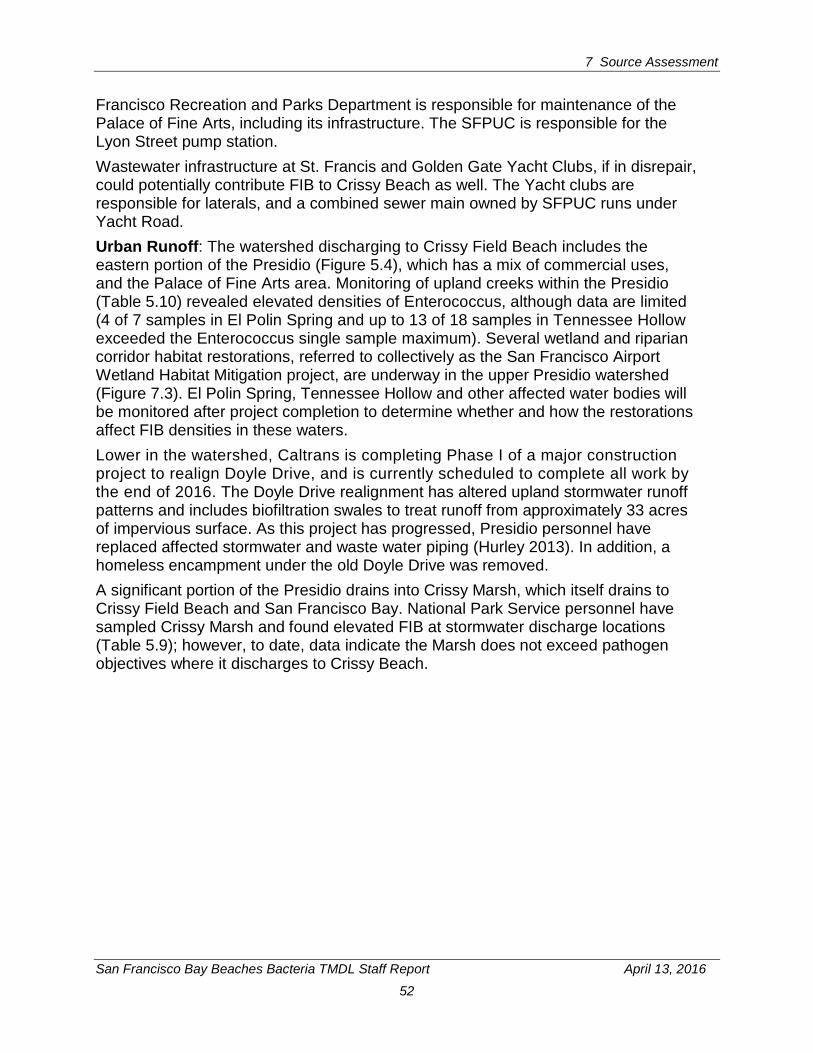
7 Source Assessment
San Francisco Bay Beaches Bacteria TMDL Staff Report April 13, 2016
52
Francisco Recreation and Parks Department is responsible for maintenance of the Palace of Fine Arts, including its infrastructure. The SFPUC is responsible for the Lyon Street pump station. Wastewater infrastructure at St. Francis and Golden Gate Yacht Clubs, if in disrepair, could potentially contribute FIB to Crissy Beach as well. The Yacht clubs are responsible for laterals, and a combined sewer main owned by SFPUC runs under Yacht Road. Urban Runoff: The watershed discharging to Crissy Field Beach includes the eastern portion of the Presidio (Figure 5.4), which has a mix of commercial uses, and the Palace of Fine Arts area. Monitoring of upland creeks within the Presidio (Table 5.10) revealed elevated densities of Enterococcus, although data are limited (4 of 7 samples in El Polin Spring and up to 13 of 18 samples in Tennessee Hollow exceeded the Enterococcus single sample maximum). Several wetland and riparian corridor habitat restorations, referred to collectively as the San Francisco Airport Wetland Habitat Mitigation project, are underway in the upper Presidio watershed (Figure 7.3). El Polin Spring, Tennessee Hollow and other affected water bodies will be monitored after project completion to determine whether and how the restorations affect FIB densities in these waters. Lower in the watershed, Caltrans is completing Phase I of a major construction project to realign Doyle Drive, and is currently scheduled to complete all work by the end of 2016. The Doyle Drive realignment has altered upland stormwater runoff patterns and includes biofiltration swales to treat runoff from approximately 33 acres of impervious surface. As this project has progressed, Presidio personnel have replaced affected stormwater and waste water piping (Hurley 2013). In addition, a homeless encampment under the old Doyle Drive was removed. A significant portion of the Presidio drains into Crissy Marsh, which itself drains to Crissy Field Beach and San Francisco Bay. National Park Service personnel have sampled Crissy Marsh and found elevated FIB at stormwater discharge locations (Table 5.9); however, to date, data indicate the Marsh does not exceed pathogen objectives where it discharges to Crissy Beach.
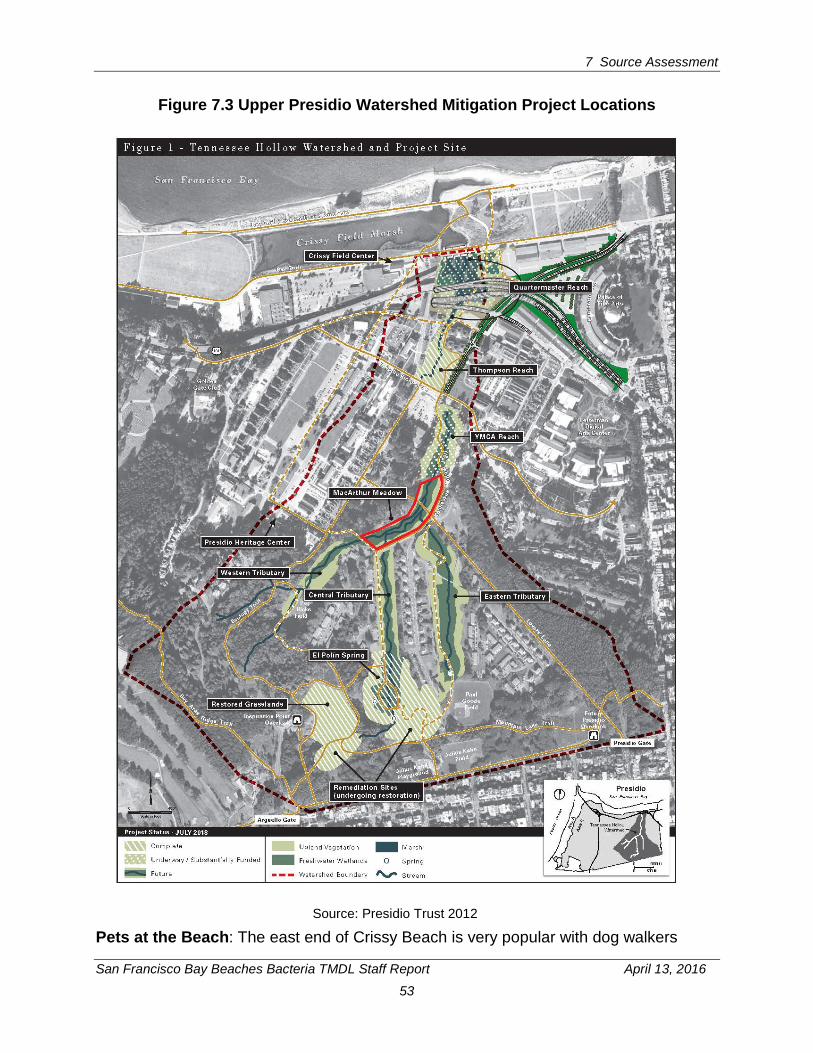
7 Source Assessment
San Francisco Bay Beaches Bacteria TMDL Staff Report April 13, 2016
53
Figure 7.3 Upper Presidio Watershed Mitigation Project Locations
Source: Presidio Trust 2012
Pets at the Beach: The east end of Crissy Beach is very popular with dog walkers

7 Source Assessment
San Francisco Bay Beaches Bacteria TMDL Staff Report April 13, 2016
54
year-round. Current rules restrict dogs on the western end of the beach when plovers are present. Otherwise, dogs are allowed on Crissy Beach on leash or under voice control. The National Park Service is developing new rules regarding pets at Crissy Beach and throughout Golden Gate National Resource Area. Proposed rules will limit the number of dogs per person, but they will continue to allow off-leash dogs on Crissy Beach. Regardless of the final ruling, enforcement of pet waste scoop rules is needed. Boats: The Yacht Harbor located east of Crissy Beach does not allow live-aboard boats. Restroom facilities are located in the St. Francis and Golden Gate Yacht Clubs as well as the stand-alone restroom on north Lyon St/Yacht Road. Due to the physical configuration of Yacht Harbor, FIB from the Harbor would be subject to mixing prior to potentially reaching Crissy Beach through tidal action. Boat wastes are not considered a significant source of bacteria to Crissy Beach. Wildlife: Nuisance wildlife, such as flocks of geese or seagulls, is not common at or near the beach. Wildlife is not considered a major contributor of bacteria to Crissy Beach. CONCLUSION: The rate of exceedance of the Enterococcus water quality objective is 19%, and exceedances occur primarily during typically wet-weather months. Potential sources of bacteria could be stormwater discharges, pets on the beach, leaky sewer lines, or a combination of these sources.
7.3.4 Marina Lagoon Beaches The physical setting of Marina Lagoon and its two beaches is very different from the other beaches, which are situated on the open Bay. Both Parkside Aquatic and Lakeshore Park Beach had Enterococcus exceedances in over half their samples over the last seven years. A description of potential controllable pathogen sources follows.
Sanitary Wastewater: As mentioned in Section 5.5, the San Mateo Wastewater Treatment Plant (WWTP) discharge to the Bay is not considered to be a source of bacteria to the beaches. Conversely, I/I from sewer lines are known sources, as illustrated by the City of San Mateo in a Clean Beach Initiative grant application (City of San Mateo, 2012b):
“Sewer mainlines in neighborhoods surrounding the Marina Lagoon have been identified as old, defected and in need of replacement. These pipes are located in bay mud. Summer raising and winter lowering of lagoon levels above and below the water table together with shallow and cracked sewer pipes may be responsible for leaching of sewage through the bay mud into lagoon waters. The high salinity content of sewage flow from this area into the WWTP seems to confirm this infiltration/exfiltration.”
Similarly, SSOs from the WWTP’s collection system appear to be a significant source of FIB to the Lagoon via washoff during precipitation events. The WWTP’s sewage collection system includes approximately 257 miles of sanitary sewer and 25 pump
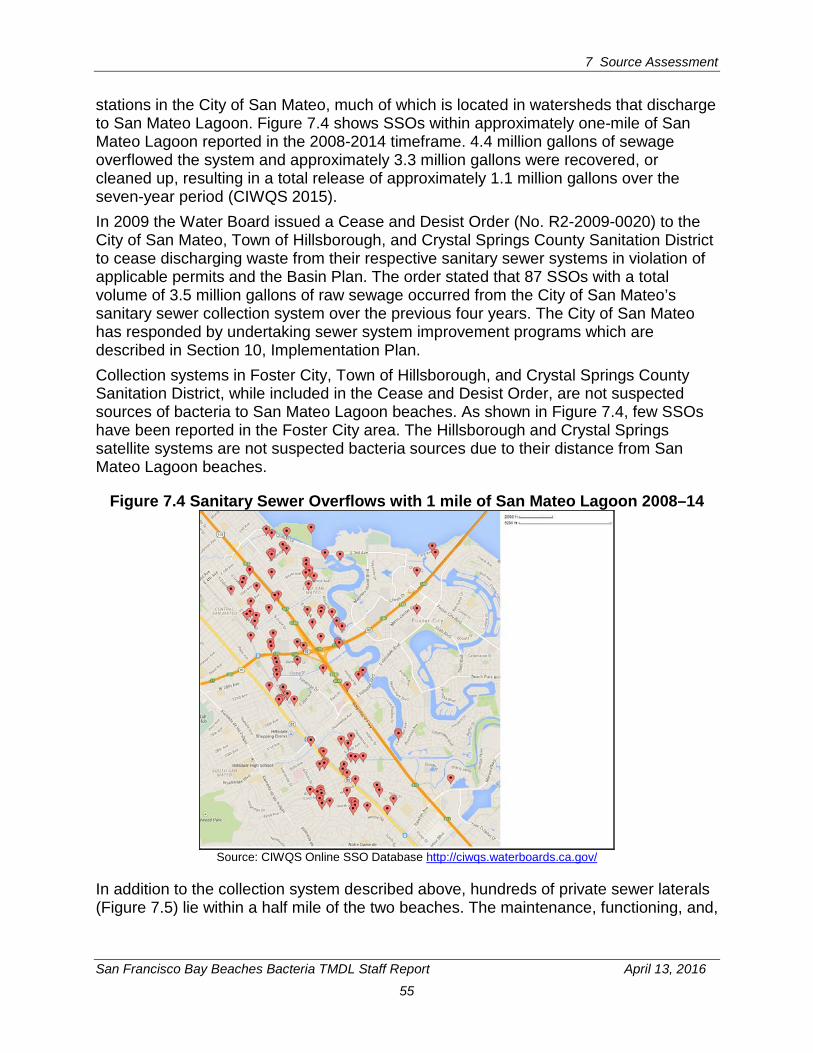
7 Source Assessment
San Francisco Bay Beaches Bacteria TMDL Staff Report April 13, 2016
55
stations in the City of San Mateo, much of which is located in watersheds that discharge to San Mateo Lagoon. Figure 7.4 shows SSOs within approximately one-mile of San Mateo Lagoon reported in the 2008-2014 timeframe. 4.4 million gallons of sewage overflowed the system and approximately 3.3 million gallons were recovered, or cleaned up, resulting in a total release of approximately 1.1 million gallons over the seven-year period (CIWQS 2015). In 2009 the Water Board issued a Cease and Desist Order (No. R2-2009-0020) to the City of San Mateo, Town of Hillsborough, and Crystal Springs County Sanitation District to cease discharging waste from their respective sanitary sewer systems in violation of applicable permits and the Basin Plan. The order stated that 87 SSOs with a total volume of 3.5 million gallons of raw sewage occurred from the City of San Mateo’s sanitary sewer collection system over the previous four years. The City of San Mateo has responded by undertaking sewer system improvement programs which are described in Section 10, Implementation Plan. Collection systems in Foster City, Town of Hillsborough, and Crystal Springs County Sanitation District, while included in the Cease and Desist Order, are not suspected sources of bacteria to San Mateo Lagoon beaches. As shown in Figure 7.4, few SSOs have been reported in the Foster City area. The Hillsborough and Crystal Springs satellite systems are not suspected bacteria sources due to their distance from San Mateo Lagoon beaches.
Figure 7.4 Sanitary Sewer Overflows with 1 mile of San Mateo Lagoon 2008–14
Source: CIWQS Online SSO Database http://ciwqs.waterboards.ca.gov/
In addition to the collection system described above, hundreds of private sewer laterals (Figure 7.5) lie within a half mile of the two beaches. The maintenance, functioning, and,
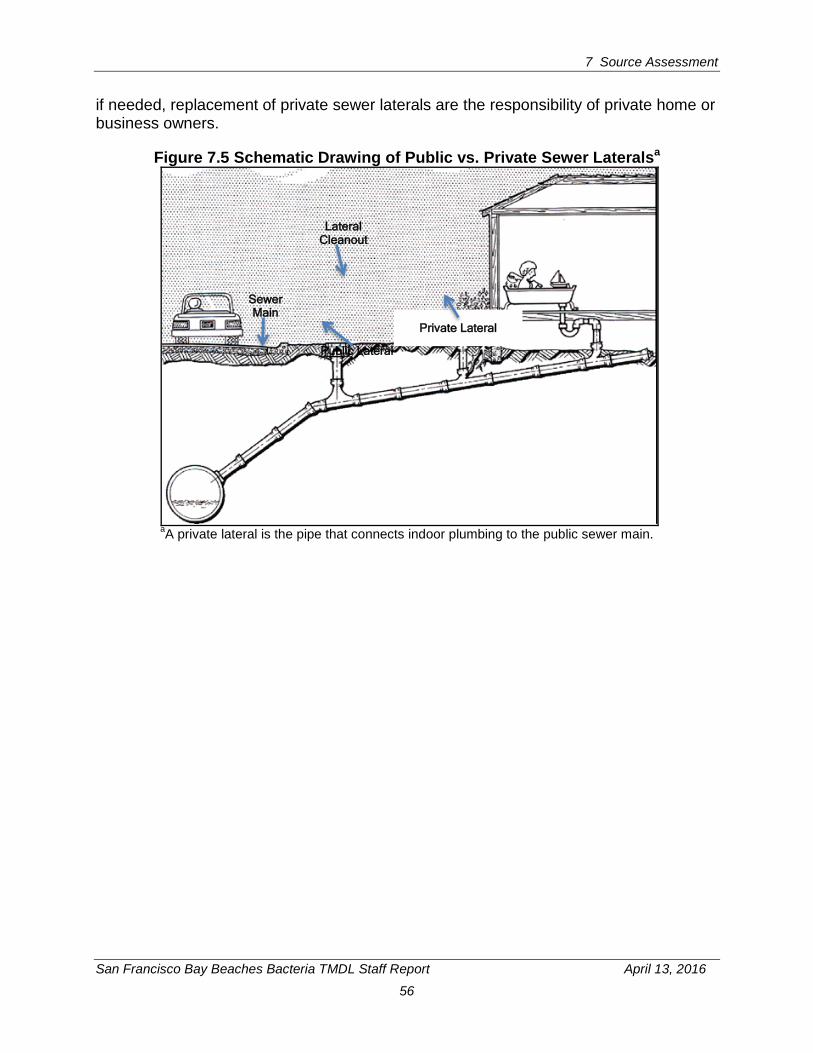
7 Source Assessment
San Francisco Bay Beaches Bacteria TMDL Staff Report April 13, 2016
56
if needed, replacement of private sewer laterals are the responsibility of private home or business owners.
Figure 7.5 Schematic Drawing of Public vs. Private Sewer Lateralsa
aA private lateral is the pipe that connects indoor plumbing to the public sewer main.
Lateral Cleanout
Private Lateral
Public Lateral
Sewer Main
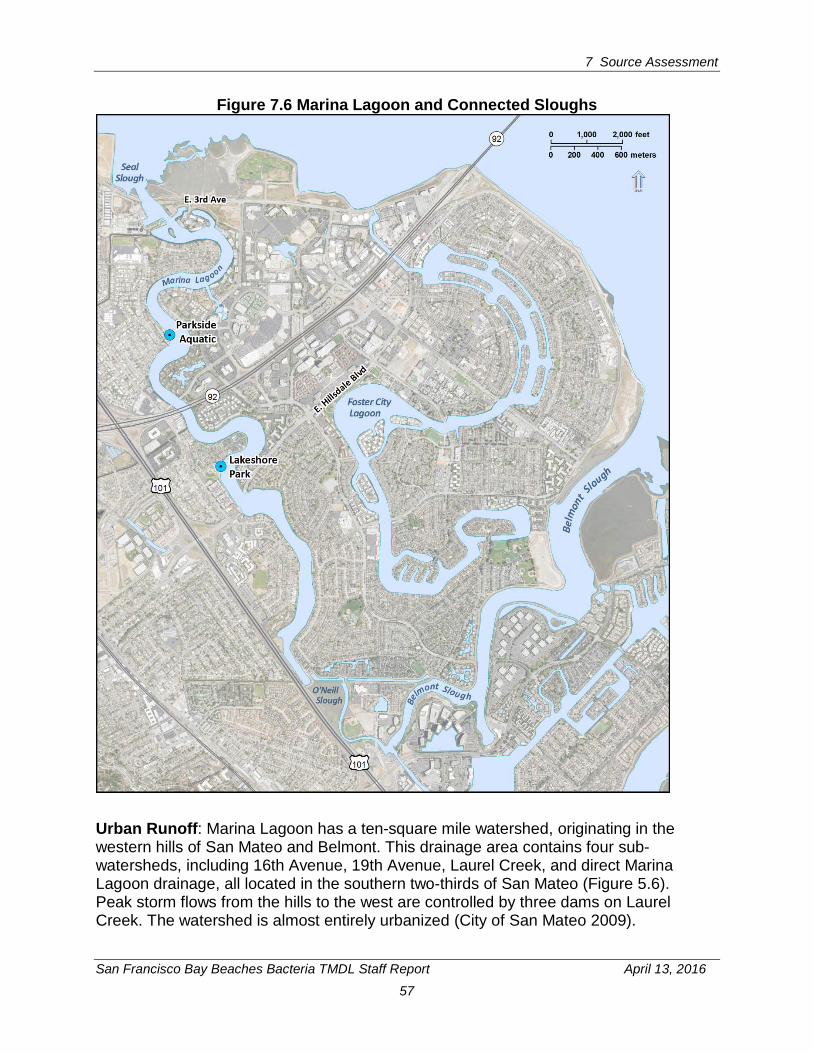
7 Source Assessment
San Francisco Bay Beaches Bacteria TMDL Staff Report April 13, 2016
57
Figure 7.6 Marina Lagoon and Connected Sloughs
Urban Runoff: Marina Lagoon has a ten-square mile watershed, originating in the western hills of San Mateo and Belmont. This drainage area contains four sub-watersheds, including 16th Avenue, 19th Avenue, Laurel Creek, and direct Marina Lagoon drainage, all located in the southern two-thirds of San Mateo (Figure 5.6). Peak storm flows from the hills to the west are controlled by three dams on Laurel Creek. The watershed is almost entirely urbanized (City of San Mateo 2009).

7 Source Assessment
San Francisco Bay Beaches Bacteria TMDL Staff Report April 13, 2016
58
As described in Section 2.4, tidal flows reach Marina Lagoon via O’Neill Slough, at an annualized rate of approximately 52 million gallons per day. Bay water is augmented by perennial low volume fresh water inflow from Laurel Creek and lesser drainage sub-basins. Fresh water flows comprise only about 0.3 percent of total annual inflow, but runoff can comprise a larger proportion of inflow over the short-term during the wet season (City of San Mateo 2013a). Figure 5.6 shows creek and storm drain discharge locations along San Mateo Lagoon, including a storm drain outfall in the vicinity of Lakeshore Park Beach. Figure 7.6 shows the connection between Seal, Belmont and O’Neill Sloughs and Marina Lagoon. Boat waste: There are no houseboat moorages on the Lagoon, but pleasure boating is a common activity, including motor boating, water skiing, and kayaking. Given the rate of exceedance of bacteria water quality objectives and the lack of moorages, boat waste is not considered a significant potential source of FIB to the beaches. Pets and Wildlife at the Beach: Within the large urban watershed discharging to Marina Lagoon, bacteria from urban wildlife and pets at the beach are likely to contribute to FIB densities at the beaches. The City of San Mateo has begun evaluating the feasibility and effectiveness of various ways to decrease the FIB load from wildfowl at both beaches (Section 5.5). CONCLUSION: Documented SSOs and general leakage from the sewage collection system are known sources of controllable bacteria within the beaches’ watersheds and, along with private laterals, are likely the greatest source. The large urban watershed’s urban sources of bacteria are likely significant FIB sources as well, with nuisance wildlife and other sources also contributing.
7.3.5 China Camp Beach Due to its location within a sizeable state park and the topography of the surrounding area, China Camp Beach has few of the bacteria sources common to the more urbanized San Francisco Bay beaches described above. Potential bacteria sources at China Camp Beach are outlined below. Sanitary Wastewater: Wastewater from the residence, café and public restrooms at the beach and the upper parking area are pumped uphill to a San Rafael Sanitary District sewer main in the upland portion of the Park. California State Parks personnel have performed flow tests by volume from each fixture in these structures to the lift station and found the sewer system to be tight, with no indications of ground water or bay water influence into the sewer system (O’Reilly 2015). The sanitary wastewater collection system is not considered a likely significant source of bacteria to China Camp Beach. Urban Runoff: China Camp State Park itself has no urbanized land use and the beach’s catchment, likewise, is not urbanized. The beach lies at the base of a cliff and has very little runoff catchment area beyond the beach itself. With the exception of one resident, who is the last surviving Chinese fisherman of China Camp Village, the structures on the beach are largely historic and unoccupied. A small café and a public restroom structure are located on the beach, along with a one-room museum and a residence.
7 Source Assessment
San Francisco Bay Beaches Bacteria TMDL Staff Report April 13, 2016
59
According to State Park personnel, China Camp Beach is well maintained by its visitors, and there is not a lot of litter. Once a year, on Earth Day, a litter pick-up event yields less than one dumpster load of litter (Goering 2013).Urban runoff is not expected to be a significant source of pathogens to the beach. Pets at the Beach: Pets are allowed on the beach, provided they are on a leash. There is no survey data, but anecdotal information indicates that pet visits numbers are relatively low, and pets at the beach are not considered a significant potential source of bacteria to the beach. Boat waste: During the warmer months, sailboats may anchor offshore of the beach. At a busy time, but not commonly, up to 15 boats may be anchored. Less frequently a houseboat has anchored offshore for a longer period of time. These are county waters, and the Marin County or San Rafael police boat patrol deal with the anchored boats, or the U.S. Coast Guard will do so. There are no records kept of when houseboats or large groups of sailboats have anchored off China Camp Beach, so it is not possible to determine whether such activities have been correlated with increased FIB (Goering 2013). Wildlife: Approximately a mile north of the beach is a marsh that extends northward for several miles. The marsh is heavily used by wildfowl. China Camp Beach itself is not noted for wildfowl or other wildlife populations. A variety of terrestrial wildlife, such as the birds and rodents that inhabit the open space lands adjacent to San Pedro Creek and the Pacific Ocean, can contribute indicator bacteria to these water bodies through stormwater runoff or direct deposit of waste. No accurate information as to the magnitude and geographic distribution of this waste source is available. CONCLUSION: During seven years of April-October sampling, only three samples collected at China Beach exceeded the Enterococcus single sample maximum objective, and there were no exceedances of the Enterococcus geometric mean objective. There are few, if any, significant potential sources of human fecal bacteria to China Camp Beach.
7.3.6 McNears Beach Due to its location within a sizeable county park and the topography of the surrounding area, McNears Beach has few of the common potential sources of pathogens, as outlined below. Sanitary Wastewater: The Park contains a public swimming pool, showers, restrooms, a small café, park ranger headquarters, and a residence. A sewer main running the length of the park and two pump stations are owned by the San Rafael Sanitation District, which conducts checks on the pump stations three times per week. In early 2014 the San Rafael Sanitation District cleaned all the sewer mains in McNears Beach Park and inspected the manholes and pump station and found no suggestions of leakage. The District has no record of SSOs at the park, and regularly checks for sewer main sags, evidence of surcharged conditions at the manholes, debris and odors during cleaning activities (Smith 2014). At this time, the sanitary wastewater collection system is not considered a likely significant source of bacteria to McNears Beach.
7 Source Assessment
San Francisco Bay Beaches Bacteria TMDL Staff Report April 13, 2016
60
Urban Runoff: Like nearby China Camp Beach, the stormwater catchment area for McNears Beach is small. McNears Park lies at the base of a cliff and thus the Park comprises almost the entire runoff catchment area for the beach. McNears Park is heavily used throughout much of the year, and park users leave behind large volumes of litter, especially on weekends and holidays. Stormwater runoff from the park discharges to the beach at four locations. In addition, McNears Beach is positioned geographically so that litter from the Delta and Napa River lands on the beach. Park personnel report that they remove plastic and other debris from the beach on a daily basis. Urban runoff is not expected to be a significant source of pathogens to the beach. Pets at the Beach: Pets are not allowed in McNears Park. One or more Marin County Park rangers work at the park on a daily basis; enforcing the “no pets” policy is among their duties. Pets at the beach are not considered a significant source of bacteria to the beach. Boat waste: McNears Beach does not have a boat launch area. However, similarly to nearby China Camp Beach, day boats and yachts will anchor offshore for varying lengths of time. On at least one occasion, a boat was anchored offshore for a period of several weeks or months. Boat waste could be an occasional source of FIB to the beach but is not considered an ongoing source. Wildlife: Geese are attracted to the green lawn at the park, and goose droppings are a nuisance for park-goers. Deer inhabit the park, and marine birds are present as well. No accurate information as to the magnitude of this waste source is available. CONCLUSION: Of the nearly 150 samples collected at McNears Beach since 2008, fewer than 5% exceeded either the single sample maximum or geometric mean objective for Enterococcus. There are few, if any, significant potential sources of human fecal bacteria to McNears Beach.

San Francisco Bay Beaches Bacteria TMDL Staff Report April 13, 2016
61
8 TOTAL MAXIMUM DAILY LOAD AND POLLUTANT ALLOCATIONS
This Section discusses the approach used for expressing the TMDLs and pollutant load allocations and presents the proposed bacteria TMDLs and load allocations (for nonpoint sources) and wasteload allocations (for point sources) as applicable to identified sources.
8.1 General Approach U.S. EPA’s protocol for developing pathogen TMDLs (U.S. EPA 2001) defines a total maximum daily load as the allowable loadings of a specific pollutant that a water body can receive without exceeding water quality standards. The sum of individual wasteload allocations for point sources and load allocations for nonpoint sources must not result in the exceedance of water quality standards for that water body. In addition, the TMDL must include a margin of safety, either implicit or explicit, that accounts for the uncertainty in the relationship between pollutant loads and the quality of the receiving water body. For most pollutants, TMDLs are expressed on a mass loading basis (e.g., kilograms per year). Regulations (40 CFR §130.2(1)) provide that TMDLs do not need to be expressed as loads (mass per unit time), but may be expressed as “other appropriate measure.” For pathogen indicators, it is the number of organisms in a given volume of water (i.e., their density), and not their mass or total number, that is significant with respect to public health and protection of beneficial uses. The density of fecal indicator organisms in a discharge and in the receiving waters is the relevant criterion for assessing the impact of discharges, the quality of the affected receiving waters, and the public-health risk. Therefore, we propose density-based TMDLs and pollutant load allocations, expressed in terms of indicator bacteria densities. Establishing a density-based, rather than a mass load-based, TMDL has the advantage of eliminating the need to conduct a complex and potentially error-prone analysis to link loads and projected densities. A load-based TMDL would require calculation of loads based on acceptable bacterial densities and expected flows, and then back-calculation of expected densities under various load reduction scenarios. Because flow conditions at San Francisco Bay beaches are highly variable and difficult to measure, such an analysis would involve a great deal of uncertainty with no increased water quality benefit.
8.2 Proposed Total Maximum Daily Load The proposed TMDL for San Francisco Bay beaches is the water quality objective for Enterococcus for contact recreation. Enterococcus is protective of the other bacteria WQOs, as discussed in Section 6. This TMDL represents the total density of Enterococcus that can be discharged from all sources while not causing the water quality in the beaches to exceed the bacterial densities specified in the Basin Plan. This TMDL is applicable year-round.
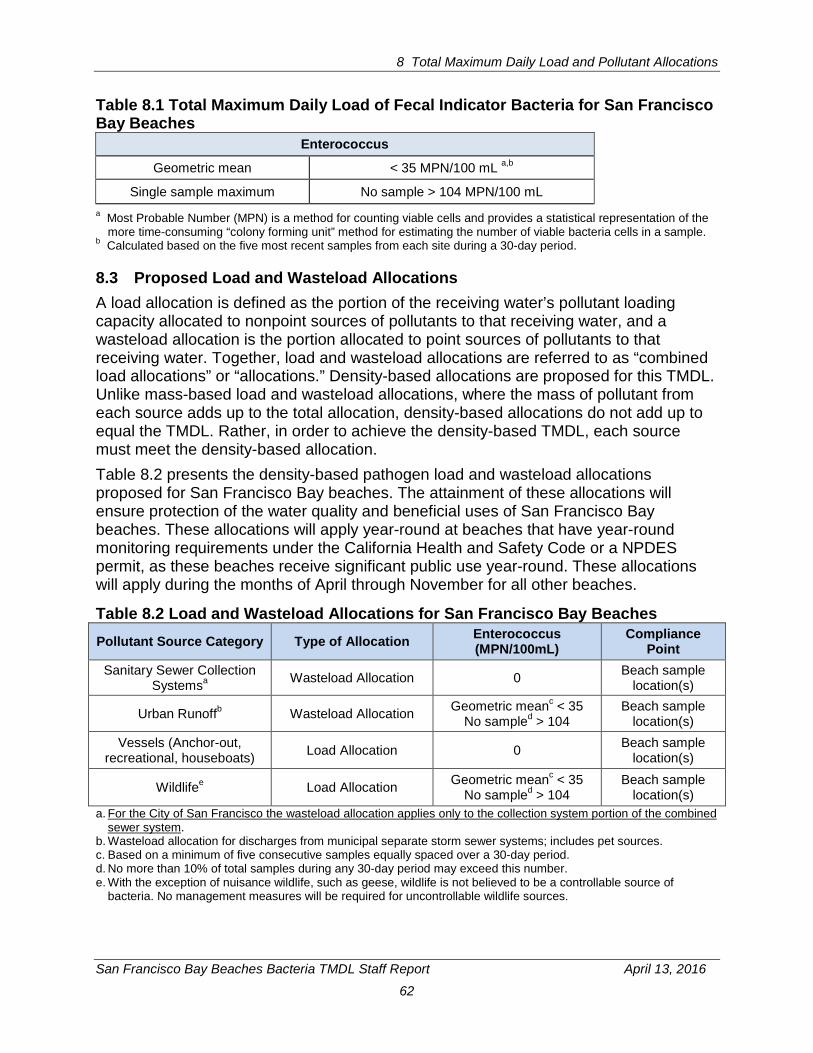
8 Total Maximum Daily Load and Pollutant Allocations
San Francisco Bay Beaches Bacteria TMDL Staff Report April 13, 2016
62
Table 8.1 Total Maximum Daily Load of Fecal Indicator Bacteria for San Francisco Bay Beaches
Enterococcus
Geometric mean < 35 MPN/100 mL a,b
Single sample maximum No sample > 104 MPN/100 mL a Most Probable Number (MPN) is a method for counting viable cells and provides a statistical representation of the
more time-consuming “colony forming unit” method for estimating the number of viable bacteria cells in a sample. b Calculated based on the five most recent samples from each site during a 30-day period.
8.3 Proposed Load and Wasteload Allocations A load allocation is defined as the portion of the receiving water’s pollutant loading capacity allocated to nonpoint sources of pollutants to that receiving water, and a wasteload allocation is the portion allocated to point sources of pollutants to that receiving water. Together, load and wasteload allocations are referred to as “combined load allocations” or “allocations.” Density-based allocations are proposed for this TMDL. Unlike mass-based load and wasteload allocations, where the mass of pollutant from each source adds up to the total allocation, density-based allocations do not add up to equal the TMDL. Rather, in order to achieve the density-based TMDL, each source must meet the density-based allocation. Table 8.2 presents the density-based pathogen load and wasteload allocations proposed for San Francisco Bay beaches. The attainment of these allocations will ensure protection of the water quality and beneficial uses of San Francisco Bay beaches. These allocations will apply year-round at beaches that have year-round monitoring requirements under the California Health and Safety Code or a NPDES permit, as these beaches receive significant public use year-round. These allocations will apply during the months of April through November for all other beaches.
Table 8.2 Load and Wasteload Allocations for San Francisco Bay Beaches Pollutant Source Category Type of Allocation Enterococcus
(MPN/100mL) Compliance
Point Sanitary Sewer Collection
Systemsa Wasteload Allocation 0 Beach sample location(s)
Urban Runoffb Wasteload Allocation Geometric meanc < 35 No sampled > 104
Beach sample location(s)
Vessels (Anchor-out, recreational, houseboats) Load Allocation 0 Beach sample
location(s)
Wildlifee Load Allocation Geometric meanc < 35 No sampled > 104
Beach sample location(s)
a. For the City of San Francisco the wasteload allocation applies only to the collection system portion of the combined sewer system.
b. Wasteload allocation for discharges from municipal separate storm sewer systems; includes pet sources. c. Based on a minimum of five consecutive samples equally spaced over a 30-day period. d. No more than 10% of total samples during any 30-day period may exceed this number. e. With the exception of nuisance wildlife, such as geese, wildlife is not believed to be a controllable source of
bacteria. No management measures will be required for uncontrollable wildlife sources.
8 Total Maximum Daily Load and Pollutant Allocations
San Francisco Bay Beaches Bacteria TMDL Staff Report April 13, 2016
63
For allocations specified by source category, it is the responsibility of individual facility or property owners within a given source category to meet these allocations. In other words, individual facilities and property owners shall not discharge or release a load of pollution that will increase the density of fecal coliforms in the downstream portion of the nearest water body above the proposed load or wasteload allocation assigned to that source type. This allocation scheme assumes that the concentration of FIB upstream from the discharge point is not in excess of the assigned allocations. For example, the geometric mean of FIB concentrations in urban runoff samples collected at a residential area’s storm drain that discharges to a beach shall not exceed the allocated loads listed for the urban runoff source category. We assign wasteload allocations of zero to sanitary wastewater collections systems and vessels for the following reasons:
• As sources of human waste (as opposed to animal waste) they pose the greatest threat to the public health.
• The zero wasteload allocation is consistent with the existing Basin Plan prohibition of release of untreated sewage.
• When operated properly and lawfully, sanitary sewer systems and vessels should not cause any human waste discharges.
• Human waste discharges from these sources are fully controllable and preventable.
For these reasons, zero wasteload allocations for these source categories are both feasible and warranted. Wet weather discharges from the City of San Francisco’s combined sewer system authorized pursuant to U.S. EPA’s Combined Sewer Overflow (CSO) Control Policy are not given a waste load allocation because at this time such discharges are not deemed to contribute significantly to bacteria at the beaches; changes to NPDES permit requirements are unnecessary to achieve this TMDL. All permittees or entities that discharge indicator bacteria or have jurisdiction over such dischargers are collectively responsible for meeting these allocations. Water quality monitoring data at the beaches will be used to demonstrate achievement of the allocations.
8.4 Margin of Safety TMDLs are required to achieve numeric targets under critical conditions and to include a margin of safety to account for data uncertainty and lack of knowledge. Because the allocations in this TMDL are identical to existing numeric WQOs, which are established as protective standards and inclusive of all uncertainties, the margin of safety is implicitly incorporated into the proposed TMDLs and load and wasteload allocations. Therefore, no additional or explicit margin of safety is needed for this TMDL.
8.5 Critical Conditions TMDLs are set to meet the numeric target under “critical conditions,” which are extreme (or above average) environmental conditions, such as high or low flows or temperatures. Although analyzed separately from the margin of safety for data
8 Total Maximum Daily Load and Pollutant Allocations
San Francisco Bay Beaches Bacteria TMDL Staff Report April 13, 2016
64
uncertainty and lack of knowledge, the consideration of critical conditions may be thought of as an additional margin of safety because it ensures the targets are met despite volatility in temperature and precipitation. FIB densities appear to be greater during the winter wet season (see Section 5 data) due to such factors as precipitation runoff, but they can be high any time of year. Recreational uses of San Francisco Bay beaches are most prevalent in the summer, but can also occur year-round. Therefore, we are not proposing seasonal variation to the TMDLs and load allocations.
San Francisco Bay Beaches Bacteria TMDL Staff Report April 13, 2016
65
9 LINKAGE BETWEEN WATER QUALITY TARGETS AND POLLUTANT SOURCES
The objective of this section is to define the linkage between the selected water quality targets and identified sources of indicator bacteria loading. For this TMDL, the proposed load and wasteload allocations will protect the water contact beneficial use because:
• Fecal waste from warm-blooded animals can contain pathogens. • Indicator bacteria are present in fecal waste from warm-blooded animals and are
routinely used as a monitoring surrogate for pathogens. Thus, it is appropriate to use indicator bacteria as a surrogate to measure pathogen impairment of beneficial uses.
• The proposed pollutant load and wasteload allocations are based on the proposed numeric targets for indicator bacteria for water contact recreation.
• The proposed numeric targets are based on the Basin Plan and U.S. EPA’s bacterial water quality objectives for water contact recreation waters.
• The Basin Plan and U.S. EPA’s bacterial water quality objective for Enterococcus for water contact recreation, expressed as a geometric mean of 35 MPN/100ml, reflects the assumption that this density of Enterococcus creates an acceptable health risk of 8-19 illnesses per 1,000 exposed individuals (U.S. EPA 1986). Based on more recent studies, however, the same geometric mean of 35 MPN/100mL for Enterococcus is equated with 36 illnesses per 1,000 exposed individuals, which is still considered acceptable. This geometric mean remains a recommended water quality objective by U.S. EPA (U.S. EPA 2012).
Therefore, achievement of the proposed pollutant load and wasteload allocations will ensure the protection of the water quality and water contact beneficial use of San Francisco Bay beaches.
San Francisco Bay Beaches Bacteria TMDL Staff Report April 13, 2016
66
10 IMPLEMENTATION PLANS AND MONITORING
This section outlines the TMDL implementation plans, or strategies, for restoring and monitoring water quality at San Francisco Bay beaches. As shown in the Source Analysis (Section 7), most of the beaches are located in highly developed urban areas that have common anthropogenic sources of bacteria. The implementation plans focus on these known, controllable bacteria sources common to urban beaches. In addition to anthropogenic and controllable bacteria sources, bacteria in beach water bodies may be present due to natural sources. A variety of environmental factors affect the fate, transport, and persistence of bacteria in beach waters, as discussed in Section 7.1. Because the beaches have data and conclusive information indicating the presence of controllable bacteria sources, and little to no data regarding natural sources, it is the strategy of this TMDL to address the controllable and anthropogenic sources in the near term. Either concurrently or as part of adaptive management, implementing parties may work to identify natural bacteria sources and obtain data to support revision of the numeric targets to reflect bacteria contributions from non-controllable sources. In all cases, implementing parties must control anthropogenic controllable sources of bacteria to the beach. The steps described in each chapter of this Staff Report and in The California Microbial Source Identification Manual: A Tiered Approach to Identifying Fecal Pollution Sources to Beaches (Griffith 2013) should be used to guide adaptive implementation of the TMDL.
The overarching strategy to address each of the common controllable sources of bacteria at San Francisco Bay beaches is presented in Section 10.1. The sections that follow tailor the implementation strategy to specific conditions at each beach.
10.1 Implementation and Monitoring Plan Elements Because bacteria sources are similar across urban watersheds in the San Francisco Bay area, this section outlines the overarching strategy, or typical actions, for reducing common, controllable bacteria sources at urban beaches. All potential sources may not be present at all beaches, and sources may vary in their significance. Implementing entities must consider all potential bacteria sources as they implement this strategy and take actions to reduce the sources present at their beaches. At a given beach, responsibility for reducing bacteria sources will fall on several different entities, potentially including sewage collection system districts; municipal stormwater programs; port authorities; and city, county, regional, state and/or national park managers. The responsibility for meeting the TMDL shall be shared among all the implementing entities. Cooperation is necessary not only to reach the numeric targets for Enterococcus, but also to avoid duplicate actions, such as monitoring and reporting. It would benefit implementing entities to select a lead agency and staff person to manage this shared responsibility. The TMDL may be implemented through any of the following actions, or a combination of the actions, as needed to address the sources of bacteria contributing to impairment at a given beach:

10.1 Implementation Plans and Monitoring
San Francisco Bay Beaches Bacteria TMDL Staff Report April 13, 2016
67
• State Water Board Statewide General Waste Discharge Requirements for Sanitary Sewer Systems (Order No. 2006-0003-DWQ as revised by Order No. 2008-0002-EXEC)
• Cease and Desist Orders as needed to address sanitary waste or other bacteria releases
• Water Board Municipal Regional Stormwater Permit (NPDES No. CAS612008) • State Water Board NPDES Permit for Small Municipal Separate Storm Sewer
Systems (MS4) (NPDES No. CAS000004) • State Water Board Stormwater Permit for State of California Department of
Transportation (NPDES No. CAS000003) • NPDES Wastewater permits as needed to address sanitary waste releases.
Table 10.1 presents the general elements of an implementation plan for achieving bacteria water quality standards at an urban beach. Each implementation action is described more fully in the following sections.
Table 10.1 Implementation Plan Elements
Source Action General Description
Implementing party
Completion Timeframe
Sanitary Sewer Collection Systems
1. Comply with Statewide General Waste Discharge Requirements for Sanitary Sewer Systems.
All Waste Discharge Requirements continue to apply.
Sanitary sewer collection system authority
Ongoing
2. Submit an enhanced Sewer System Management Plan that prioritizes sewer system inspections and repairs in areas within ¼ mile of beach or otherwise connected to the beach. Include a diagram of prioritized infrastructure, a time schedule for implementing short- and long-term plans, and, as necessary, a schedule for developing the funds needed for the capital improvement plan.
Complete inspections and repairs.
Within the Sewer System Management Plan, assign a high priority to system components within ¼ mile of the beach, such that these components are inspected and repaired in the near term.
Sanitary sewer collection system authority
6 months 3 years
3. Determine effectiveness of sewer system repairs: Assess beach monitoring data to determine if targets are met at the beach.
This step allows time for data collection to determine if further sewer system investigations are needed.
Sanitary sewer collection system authority
5 years
After five years, begin enhanced implementation if targets not met
4. If targets not met (see #3 above), submit an enhanced Sewer System
If targets are not met, expand the
Sanitary sewer
5.5 years
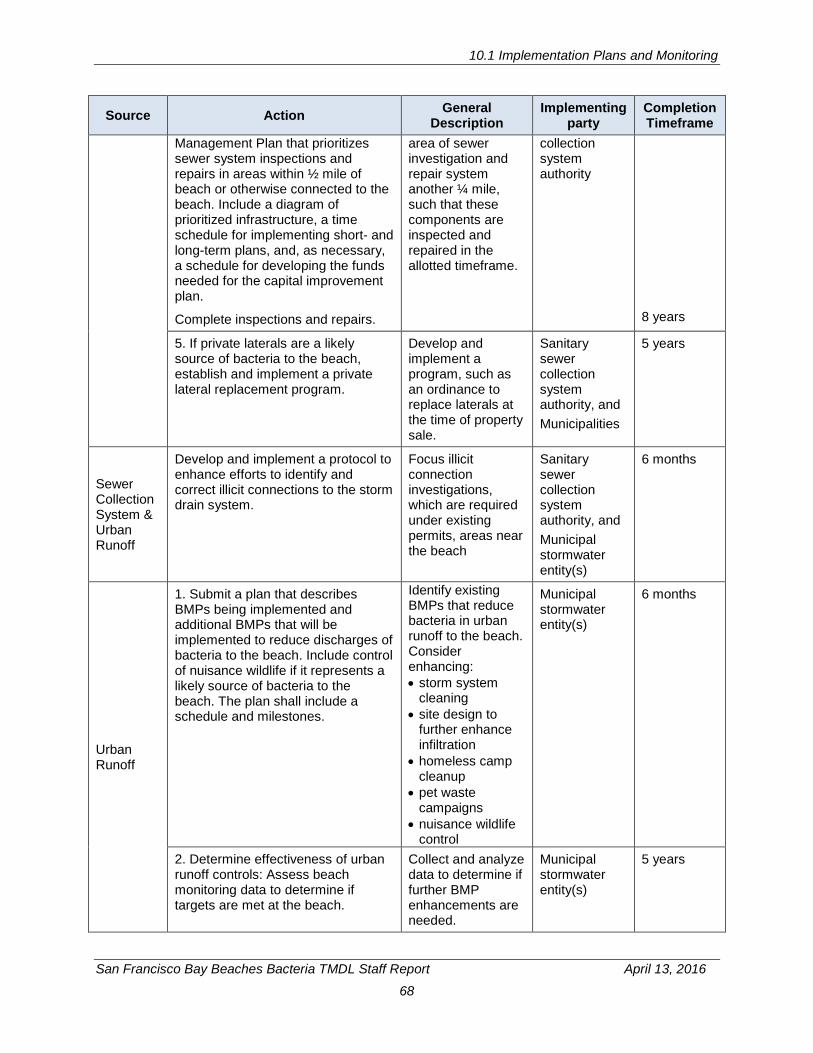
10.1 Implementation Plans and Monitoring
San Francisco Bay Beaches Bacteria TMDL Staff Report April 13, 2016
68
Source Action General Description
Implementing party
Completion Timeframe
Management Plan that prioritizes sewer system inspections and repairs in areas within ½ mile of beach or otherwise connected to the beach. Include a diagram of prioritized infrastructure, a time schedule for implementing short- and long-term plans, and, as necessary, a schedule for developing the funds needed for the capital improvement plan.
Complete inspections and repairs.
area of sewer investigation and repair system another ¼ mile, such that these components are inspected and repaired in the allotted timeframe.
collection system authority
8 years
5. If private laterals are a likely source of bacteria to the beach, establish and implement a private lateral replacement program.
Develop and implement a program, such as an ordinance to replace laterals at the time of property sale.
Sanitary sewer collection system authority, and Municipalities
5 years
Sewer Collection System & Urban Runoff
Develop and implement a protocol to enhance efforts to identify and correct illicit connections to the storm drain system.
Focus illicit connection investigations, which are required under existing permits, areas near the beach
Sanitary sewer collection system authority, and Municipal stormwater entity(s)
6 months
Urban Runoff
1. Submit a plan that describes BMPs being implemented and additional BMPs that will be implemented to reduce discharges of bacteria to the beach. Include control of nuisance wildlife if it represents a likely source of bacteria to the beach. The plan shall include a schedule and milestones.
Identify existing BMPs that reduce bacteria in urban runoff to the beach. Consider enhancing: • storm system
cleaning • site design to
further enhance infiltration
• homeless camp cleanup
• pet waste campaigns
• nuisance wildlife control
Municipal stormwater entity(s)
6 months
2. Determine effectiveness of urban runoff controls: Assess beach monitoring data to determine if targets are met at the beach.
Collect and analyze data to determine if further BMP enhancements are needed.
Municipal stormwater entity(s)
5 years
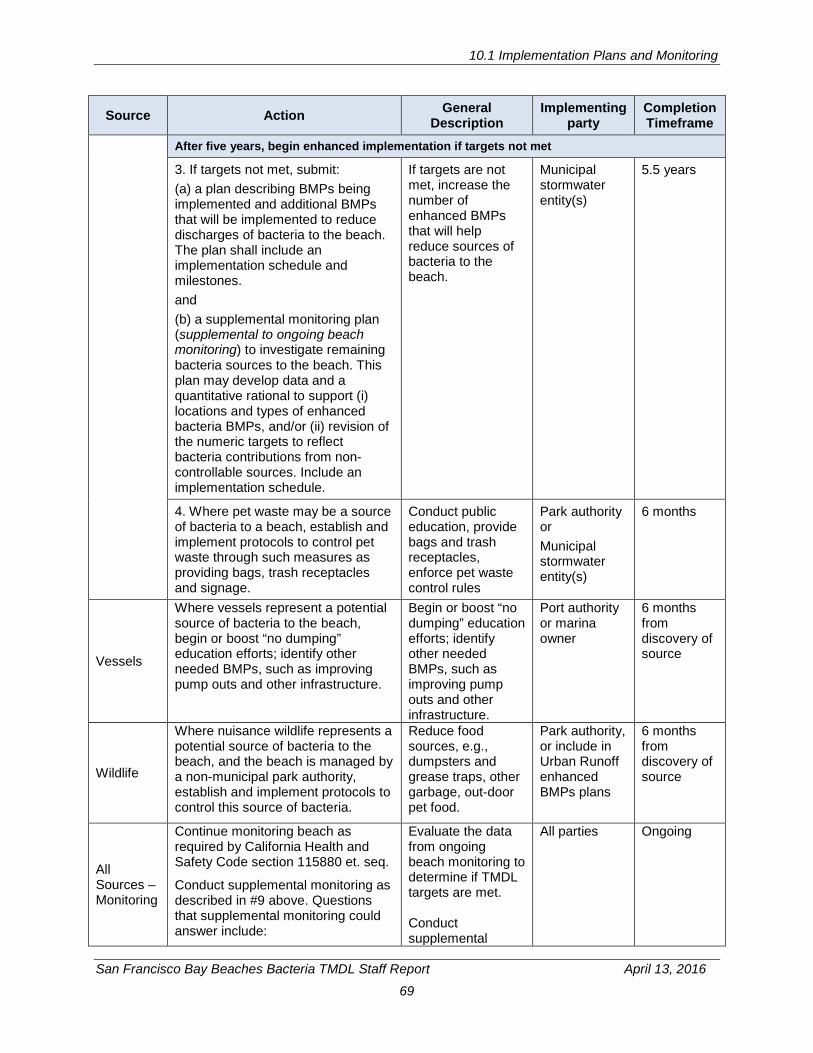
10.1 Implementation Plans and Monitoring
San Francisco Bay Beaches Bacteria TMDL Staff Report April 13, 2016
69
Source Action General Description
Implementing party
Completion Timeframe
After five years, begin enhanced implementation if targets not met
3. If targets not met, submit: (a) a plan describing BMPs being implemented and additional BMPs that will be implemented to reduce discharges of bacteria to the beach. The plan shall include an implementation schedule and milestones. and (b) a supplemental monitoring plan (supplemental to ongoing beach monitoring) to investigate remaining bacteria sources to the beach. This plan may develop data and a quantitative rational to support (i) locations and types of enhanced bacteria BMPs, and/or (ii) revision of the numeric targets to reflect bacteria contributions from non-controllable sources. Include an implementation schedule.
If targets are not met, increase the number of enhanced BMPs that will help reduce sources of bacteria to the beach.
Municipal stormwater entity(s)
5.5 years
4. Where pet waste may be a source of bacteria to a beach, establish and implement protocols to control pet waste through such measures as providing bags, trash receptacles and signage.
Conduct public education, provide bags and trash receptacles, enforce pet waste control rules
Park authority or Municipal stormwater entity(s)
6 months
Vessels
Where vessels represent a potential source of bacteria to the beach, begin or boost “no dumping” education efforts; identify other needed BMPs, such as improving pump outs and other infrastructure.
Begin or boost “no dumping” education efforts; identify other needed BMPs, such as improving pump outs and other infrastructure.
Port authority or marina owner
6 months from discovery of source
Wildlife
Where nuisance wildlife represents a potential source of bacteria to the beach, and the beach is managed by a non-municipal park authority, establish and implement protocols to control this source of bacteria.
Reduce food sources, e.g., dumpsters and grease traps, other garbage, out-door pet food.
Park authority, or include in Urban Runoff enhanced BMPs plans
6 months from discovery of source
All Sources – Monitoring
Continue monitoring beach as required by California Health and Safety Code section 115880 et. seq.
Conduct supplemental monitoring as described in #9 above. Questions that supplemental monitoring could answer include:
Evaluate the data from ongoing beach monitoring to determine if TMDL targets are met. Conduct supplemental
All parties Ongoing
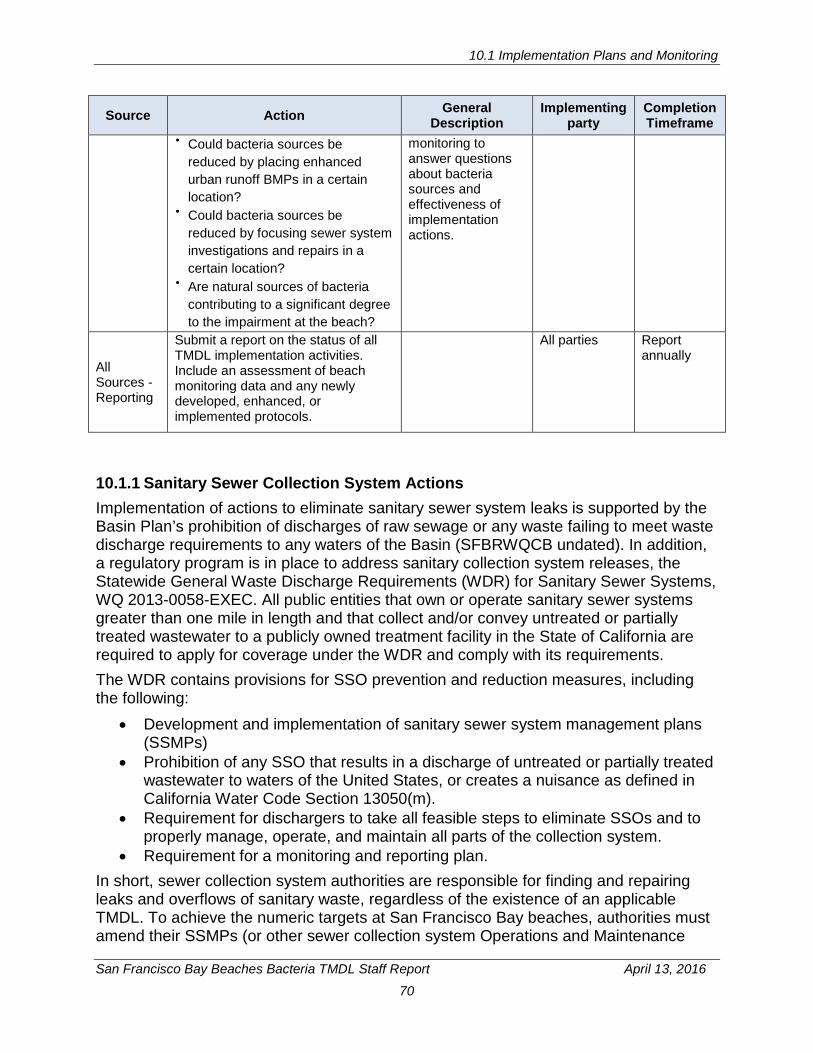
10.1 Implementation Plans and Monitoring
San Francisco Bay Beaches Bacteria TMDL Staff Report April 13, 2016
70
Source Action General Description
Implementing party
Completion Timeframe
• Could bacteria sources be reduced by placing enhanced urban runoff BMPs in a certain location?
• Could bacteria sources be reduced by focusing sewer system investigations and repairs in a certain location?
• Are natural sources of bacteria contributing to a significant degree to the impairment at the beach?
monitoring to answer questions about bacteria sources and effectiveness of implementation actions.
All Sources - Reporting
Submit a report on the status of all TMDL implementation activities. Include an assessment of beach monitoring data and any newly developed, enhanced, or implemented protocols.
All parties Report annually
10.1.1 Sanitary Sewer Collection System Actions Implementation of actions to eliminate sanitary sewer system leaks is supported by the Basin Plan’s prohibition of discharges of raw sewage or any waste failing to meet waste discharge requirements to any waters of the Basin (SFBRWQCB undated). In addition, a regulatory program is in place to address sanitary collection system releases, the Statewide General Waste Discharge Requirements (WDR) for Sanitary Sewer Systems, WQ 2013-0058-EXEC. All public entities that own or operate sanitary sewer systems greater than one mile in length and that collect and/or convey untreated or partially treated wastewater to a publicly owned treatment facility in the State of California are required to apply for coverage under the WDR and comply with its requirements. The WDR contains provisions for SSO prevention and reduction measures, including the following:
• Development and implementation of sanitary sewer system management plans (SSMPs)
• Prohibition of any SSO that results in a discharge of untreated or partially treated wastewater to waters of the United States, or creates a nuisance as defined in California Water Code Section 13050(m).
• Requirement for dischargers to take all feasible steps to eliminate SSOs and to properly manage, operate, and maintain all parts of the collection system.
• Requirement for a monitoring and reporting plan. In short, sewer collection system authorities are responsible for finding and repairing leaks and overflows of sanitary waste, regardless of the existence of an applicable TMDL. To achieve the numeric targets at San Francisco Bay beaches, authorities must amend their SSMPs (or other sewer collection system Operations and Maintenance
10.1 Implementation Plans and Monitoring
San Francisco Bay Beaches Bacteria TMDL Staff Report April 13, 2016
71
Plans required by applicable permits or orders) as needed to prioritize the investigation and repair of faulty sewer pipes, pumps, and other infrastructure according to their proximity to the beach, the magnitude of leak or overflow risk, and similar considerations. The radii of initial and expanded implementation efforts are based on the likelihood of sewer leakage impacting the beach and are intended to focus efforts on those areas, while considering what is reasonably achievable by implementing agencies. One quarter mile of the beach refers to a quarter mile radius centered at the beach sampling location that has experienced the bacteria water quality objectives exceedances. Where publically-owned portions of the sewer collection system have been shown to be in good repair and sewer-related sources of bacteria persist, it may be necessary to address private sewer laterals (Table 7.1, Figure 7.2). Private lateral replacement programs may be a necessary element in achieving the TMDL’s numeric targets and may be required under adaptive implementation if beach water quality continues to exceed targets after SSOs and other major sources of bacteria have been minimized. Inspectors for both the sewer collection system and the municipal stormwater entity must identify cross-connections between sewer and storm water piping and take action to eliminate them, using effective methods such as tracers to identify and quantify sources of FIB as described in analyses by the Urban Water Resources Council (UWRRC 2014) and the City of Santa Barbara (City of Santa Barbara 2012).
10.1.2 Urban Runoff Load Reduction The federal Clean Water Act requires municipalities to obtain NPDES permits for discharges of municipal runoff from their Municipal Separate Storm Sewer Systems (MS4s). For San Francisco Bay area municipalities, MS4 requirements have been adopted in two permits:
• Municipal Regional Stormwater NPDES permit (MRP) (R2-2015-0049). This permit covers the municipalities in Alameda, Contra Costa, San Mateo and Santa Clara Counties and the cities of Fairfield, Suisun and Vallejo.
• General Permit for Waste Discharge Requirements for Storm Water Discharges from Small Municipal Separate Storm Sewer Systems (MS4) (Order No. 2013-0001-DWQ). This permit covers the remaining municipalities in Marin, Napa, Sonoma, and Solano Counties as well as parts of the City and County of San Francisco.
Under both permits, each Permittee is individually responsible for adoption and enforcement of ordinances and policies, for implementation of control measures or best management practices (BMPs) needed to prevent or reduce pollutants in stormwater, and for funding its own capital, operation, and maintenance expenditures necessary to implement such control measures or BMPs. Both MS4 permits have requirements related to bacterial pollution prevention, including “illicit discharge detection and elimination” provisions that require Permittees to (1) address stormwater and non-stormwater pollution associated with, but not limited to sewage, wash water, discharges of pet waste, etc., and (2) prohibit, investigate, and
10.1 Implementation Plans and Monitoring
San Francisco Bay Beaches Bacteria TMDL Staff Report April 13, 2016
72
eliminate illicit connections and discharges to storm drains. Both MS4 permits require Permittees to notify the Water Board promptly when discharges are causing or contributing to an exceedance of an applicable water quality standard. Both require treatment units for reducing pollutants in runoff be installed at the time property is develop or redeveloped (see Section 10.1.3.1 below), and both require water quality monitoring. The bacteria-related control measures required by MS4 permits can be helpful in identifying and controlling bacteria inputs in stormwater discharges and dry weather flows. However, the numbers and locations of control measures required by MS4 permits may not achieve sufficient bacteria reduction to achieve the numeric target at a given beach. If this is the case, the San Francisco Bay Water Board may include requirements in reopened or reissued permits to implement wasteload allocations based on implementation of BMPs. The Water Board will not include numeric limits, based on the wasteload allocations, in NPDES permits provided the discharger demonstrates that it has fully implemented technically feasible, effective, and cost-efficient BMPs to control all controllable sources of FIB to, and discharges from, their storm drain systems. A menu of BMPs to address bacteria discharges in urban runoff is provided in the subsections below. First, structural stormwater controls (e.g., constructed treatment units such as bioretention cells) are discussed, followed by non-structural BMPs (e.g., prevention practices such as educational campaigns).
10.1.2.1 Urban Load Reduction via Structural BMPs Structural BMPs are constructed units designed to divert or treat runoff at either the point of generation or the point of discharge to a storm system or receiving water body. Diversion of urban runoff for reuse or infiltration, or to a treatment plant, is the most effective way to reduce bacteria loads, because the runoff will never reach the beach. Structural treatment BMPs reduce bacteria loads by trapping the particles to which bacteria adhere through the mechanisms of sorption, filtration and/or sedimentation. The effectiveness of structural treatment BMPs in reducing bacteria loads varies by their capacity and their ability to trap such particles without re-releasing particulate-bound or free bacteria, as discussed below. Vegetated Treatment Systems Vegetated treatment systems, such as swales (also called bioswales), filter strips, bioretention units, tree wells, and stormwater planters, employ a combination of biologic reaction, adsorption to soil particles, retention, infiltration, and evapotranspiration to reduce the total volume of runoff and the concentration of pollutants the runoff contains. These BMPs, often referred to collectively as biofiltration units, can be installed as on-site features during development and redevelopment and/or in street medians, parking lot islands, or curb extensions. Vegetated BMPs can be useful tools for reducing SSOs because they can reduce or even eliminate runoff volumes from frequent, smaller storm events. Our understanding of these systems’ performance with respect to reducing bacteria continues to develop, in part due to inconsistencies in sampling and analytical methods
10.1 Implementation Plans and Monitoring
San Francisco Bay Beaches Bacteria TMDL Staff Report April 13, 2016
73
used in evaluation studies to date (Clary 2008). The International Stormwater BMP Database (Wright and Geosyntec 2010) analyzed available data and determined that bioretention and retention (wet) ponds appear able to reduce bacteria (as do media filters, see below), but detention (dry) ponds and grass swales do not appear to reduce bacteria. Pitt et al. found that biofiltration systems remove sediment particles and the associated bacteria from urban runoff. However, in areas with frequent rainfall, regrowth and subsequent release of bacteria are likely. This phenomenon may occur to a lesser extent in drier climates where biofilter media drying between storms would be more pronounced (Pitt and Clark 2010). Local Infiltration and Rainwater Capture Systems Local infiltration systems contribute to bacteria control by reducing the volume of potentially contaminated runoff from houses, streets, parking lots, and agriculture, and mitigating peak flows (CASQA 2003). Such infiltration systems include porous concrete, pervious asphalt, grass pavers, gravel pavers, pervious crushed stone, retention grading that allows rainwater to collect on-site until it can percolate into the ground, and infiltration pits. Local infiltration systems can also entail disconnecting downspouts from the storm drain and directing downspout flows to infiltrative areas, cisterns or subsoil drains (i.e., French drains) where soil conditions and terrain allow infiltration. Rainwater capture systems include rain barrels, cisterns, and other containers used to hold rainwater for reuse or recharge. These systems are usually designed to capture runoff from roofs. Shergill and Pitt (2004) found that roofs with birds and squirrels in the overhead tree canopy had higher FIB than those without animal activity, indicating that rooftops can be a source of FIB loading during wet weather events. In such cases, disconnecting roof downspouts to collect runoff or redirect it to pervious areas is expected to reduce both runoff volumes and FIB loads. Media Filtration In this process, storm water is captured and either gravity fed or pumped through media such as sand, compost, zeolite, or other substrates. Media filtration removes pollutants primarily by separating out fine particles and their associated pollutants. Sand filters can be “extremely effective” in removing bacteria when they are modified to permit water to flow slowly through them; at normal speeds, however, sand filters are only “marginally effective.” (McCoy 2006). Diversion to Sanitary Sewer This control measure routes urban runoff away from the storm drain system or waterway and redirects it into the sanitary sewer system. Diversion can be a particularly effective method of treating dry weather urban flows when wastewater treatment plants have excess capacity. However, sanitary sewers may not have the capacity to treat urban runoff during wet weather flows. An example of an urban runoff diversion project is the Ettie Street pump station in Oakland, which diverts some dry weather flows to the East Bay Municipal Utility District treatment plant, primarily for reduction of PCB loads (United States of America 2014).

10.1 Implementation Plans and Monitoring
San Francisco Bay Beaches Bacteria TMDL Staff Report April 13, 2016
74
10.1.2.2 Urban Runoff Load Reduction via Non-structural BMPs Non-structural BMPs include prevention practices designed to improve water quality by reducing bacteria sources. Non-structural BMPs provide for the development of bacteria control programs that include, but are not limited to, prevention, education, and regulation. These programs are described below. Storm Drain System and Structural BMP Maintenance The dark, humid environment and possible presence of wildlife (e.g., raccoons in storm drain catchbasins) can provide conditions favorable to the persistence of bacteria in storm drain systems and BMPs. Examples of maintenance activities that may help to reduce FIB loading include (Geosyntec Consultants 2012):
• Storm Sewer Cleaning: Cleaning by jet spraying and vacuuming of wash water removes accumulated trash, sediment, organic matter and animal waste, thereby reducing both FIB and other pollutants. Features and locations to be cleaned can be prioritized based on proximity to the beach, magnitude of threat, and similar considerations.
• Catchbasin Cleaning: Most cities clean catchbasins and drain inlets periodically to reduce trash and other pollutants. The FIB load reduction benefits from frequent cleaning, however, have not been well documented (Weston Solutions 2010a). A San Diego study found that commercial catchbasins had significantly higher bacteria than residential catchbasins (Weston Solutions 2010b); thus, if catchbasin cleaning is employed as a BMP, those in commercial areas might be prioritized.
• Structural BMP Maintenance: Structural BMPs, such as those described above for urban runoff FIB load reduction, require maintenance both to operate properly and to help remove secondary reservoirs of FIB which can be re-suspended and released during storm events.
Street Cleaning Measurements of fecal coliform bacteria on sediment collected during street cleaning have ranged up to 108 colonies per pound of sediment (Bannerman 1993, Snyder 2012). Street and parking lot cleaning reduces sediment, trash, and other pollutant loading to urban storm drains. The degree of pollutant reduction is influenced by the frequency and timing of cleaning, sweeper speed, whether cars are parked on the street during cleaning, and the type of street cleaning equipment used. High efficiency street sweepers, such as regenerative air sweepers and vacuum assisted sweepers, remove more sediment from roadways, and they better capture the fine particles with which bacteria are typically associated (UWRRC 2014). As with storm drain system cleaning, most cities clean streets periodically to reduce trash. Increasing the frequency of cleaning in prioritized areas may help reduce FIB in urban runoff discharging in the vicinity of a beach. Administrative Controls Administrative controls require less initial investment of time compared to structural BMPs. However, for continuous implementation, administrative actions may require
10.1 Implementation Plans and Monitoring
San Francisco Bay Beaches Bacteria TMDL Staff Report April 13, 2016
75
greater time. These actions include better enforcement of existing pet or domestic animals waste disposal ordinances; better enforcement of existing litter ordinances, posting additional signage and proposing stricter penalties for littering; enforcing ordinances for commercial, industrial and multi-family garbage control, including requirements to cover trash enclosures; developing and enforcing guidelines for portable toilets and recreational vehicle dumping, and other actions of an administrative nature. Outreach and Education Education and outreach to residents may reduce the potential for contamination of stormwater runoff by encouraging residents to clean up after their pets; pick up litter; minimize runoff from agricultural, residential, and commercial facilities; prevent excessive irrigation; and collect car washing and power washing wastewaters. The public is often unaware of the fact that excess water discharged on streets and lawns ends up in receiving waters, or that the runoff contains pollutants. The effectiveness of education and outreach efforts is difficult to measure, and there is little information on whether behavior changes continue after cessation of outreach efforts. Thus, education and outreach are important, but not stand-alone, elements for reducing FIB loads.
10.1.3 Control of Waste from Pets at the Beach Proper disposal of animal waste is an important element of FIB control at beaches, and the discussion below applies to pets in urban watersheds as well. Pets, particularly dogs, are the primary focus, although some urban beaches and watersheds may need to consider horse boarding facilities and trails as well. Elements of pet control programs may include (UWRRR 2014):
• Posting park and trail signs regarding pet waste disposal requirements and leash laws.
• Providing disposal cans at convenient intervals on trails and in open space areas.
• Providing and maintaining off-leash dog parks with stormwater treatment BMPs to prevent or minimize off-site transport of FIB.
• Allowing natural riparian buffers to grow alongside streams to dissuade pet access.
• Providing educational materials regarding the impact of improperly disposed pet waste. These materials can be made available in locations such as pet stores, animal shelters, veterinary offices, and other sites frequented by pet owners.
• Developing and enforcing pet waste ordinances and leash laws. In areas with significantly elevated FIB, allocation of resources to park and open space rangers to enforce pet waste disposal controls and leash laws may be needed.
The effectiveness of pet waste control programs in reducing FIB sources is not well documented, at least in part due to paucity of relevant data. In association with FIB TMDLs in southern California, the degree of behavior change resulting from pet waste outreach campaigns has been measured. A report on the Dog Waste Management Plan for Dog Beach and Ocean Beach found that public compliance with the “scoop the

10.1 Implementation Plans and Monitoring
San Francisco Bay Beaches Bacteria TMDL Staff Report April 13, 2016
76
poop” policy was highly dependent on awareness of the policy and availability of waste disposal bags and trash cans (Weston 2004). The City of Austin, Texas, conducted public surveys and found their educational campaign resulted in a 9% improvement in the number of pet owners who claim to regularly pick up waste (UWRRC 2014). Studies in San Diego have shown that installation of pet waste stations with trash cans and disposal bags has resulted in a 37% reduction in the total amount of pet waste in city parks (UWRRC 2014).
10.1.4 Vessel Load Reduction Actions to reduce bacteria loads related to vessels involve inspections, repair and upgrade of leaky and malfunctioning sewage collection systems, such as onboard sewage systems, pumps, sewer lines, etc. Cities and port authorities should evaluate the adequacy and performance of sewage collection systems (sewage dump stations, sewage pumpout stations, onboard sewage systems, sewer lines, etc.) for all vessel marinas and vessels with toilet facilities on an on-going basis. Marina owners should install an adequate number of sewage pumpout and dump stations, in addition to the inspections, repair and upgrade of sewage systems under their management authority. In addition, where vessels are a source of bacteria to a beach, beach or port authorities should enhance their education and enforcement of “no dumping” and cleanout rules.
10.1.5 Reduction of Controllable Loads from Wildlife Although raccoons and other mammals are present in most urban areas surrounding San Francisco Bay, birds are present in more significant numbers and in close proximity to beaches. Geese are considered a contributor to bacteria objective exceedances at two or more of the beaches included within this TMDL, and other types of birds may also contribute. Control strategies for geese have been developed by the University of Nebraska at Lincoln (Cleary 1994, Internet Center for Wildlife Damage Management 2015) and the U.S. Department of Agriculture APHIS (Preusser 2008), and some of these strategies are appropriate for waterfowl in general. Techniques for waterfowl include the following (UWRRC 2014):
• Public education o Minimize feeding
• Habitat modification o Porcupine wire to reduce roosting waterfowl and pigeons o Eliminate shorelines, islands and peninsulas in constructed water bodies o String wire or Mylar tape in grids above roosting pond areas o Fence, rock or vegetative barriers around water o Minimize mowing adjacent to water bodies o Place walking path near water and fields away from water
• Deterrence Measures o Sprinklers and motion-detection activated sprayers o Pyrotechnics o Sonic devices, such as ultrasonics, distress calls, sirens, horns, whistles

10.1 Implementation Plans and Monitoring
San Francisco Bay Beaches Bacteria TMDL Staff Report April 13, 2016
77
o Active visual deterrents, such as strobe lights, laser, light beams o Passive visual deterrents, such as low balloons, kites, flags, scarecrows,
predator decoys (temporary) • Dispersion Measures
o Dogs o Radio-controlled aircraft or boats
• Reproductive Controls o Remove nesting materials before egg laying o Oil/addle/puncture eggs during incubation o Replace eggs with dummy eggs
As described in Section 5.5, the City of San Mateo conducted a pilot study at its Lakeshore Park and Parkside Aquatic Beaches in 2014, during which goose and gull feces were picked up daily for four months; goose fences were installed at the waterlines; goose eggs were addled; path and rip-rap cleaning and beach raking techniques were modified to reduce water contamination; aquatic weeds and algae were removed to discourage goose feeding; and educational information was disseminated. After one week, City of San Mateo staff reported that Lakeshore Park bacteria densities dropped enough to open the beach for the first time in 2014, and bacteria levels continued to be somewhat lower than historic levels for the remainder of the project (Rudnicki 2014). However, bacteria data at both beaches followed the historic pattern of lower concentrations in summer months, and further monitoring is needed to gauge the effectiveness of this program.
10.1.6 Monitor for Effectiveness of Load Reduction Actions County health departments, city public works departments and public park organizations conduct FIB monitoring at San Francisco Bay beaches as described in Section 5 in accordance with California Health and Safety Code section 115880 et. seq. Throughout implementation of this TMDL, data from the beach monitoring programs will be used to assess attainment of the TMDL numeric targets for each beach. The compliance points for these assessments will be at or near the existing beach water quality monitoring stations. If initial implementation actions do not result in achievement of numeric targets at a beach, supplemental monitoring (in addition to beach monitoring) will be needed to investigate and identify bacteria sources in the watershed that could be contributing to the bacteria impairment. Monitoring of catchments within the watershed should help characterize and identify indicator bacteria loadings from different land uses and locations, as well as the effects of any bacteria control actions. Supplemental monitoring is intended to answer such questions as:
• Could bacteria sources be reduced by placing enhanced urban runoff BMPs in a certain location?
• Could bacteria sources be reduced by focusing sewer system investigations and repairs in a certain location?
• Are natural sources of bacteria contributing to a significant degree to the impairment at the beach?
10.1 Implementation Plans and Monitoring
San Francisco Bay Beaches Bacteria TMDL Staff Report April 13, 2016
78
Implementing entities need not wait four years is they wish to begin supplemental monitoring earlier. At any time, implementing entities may present data indicating the presence of natural sources of bacteria to the beach, such as non-nuisance wildfowl, to the Executive Officer of the Water Board, and the Water Board may consider developing new allocations that could include a natural source exclusion. Monitoring data shall be reported to the Water Board and entered into the State Water Board’s “Beach Watch” data base as appropriate.
10.2 Implementation Plans for Impaired Beaches Implementation plans for each of the beaches currently listed as impaired by bacteria are presented in the following sections. Each plan establishes a strategy to provide reasonable assurance the load allocations and wasteload allocations can be met. Each implementation plan includes a summary table of implementation requirements, implementing entities, and a schedule for implementing those requirements. Implementing entities should look to Section 10.1 and the scientific literature as appropriate for more detail on how to carry out the implementation requirements. The implementation schedules are intended to allow time for implementing parties to identify and implement measures that are necessary to control bacteria sources contributing to exceedances of water quality objectives at the beaches. The implementation plans also are intended to be adaptive and incorporate new and relevant scientific information such that effective and efficient measures can be taken to achieve the numeric targets. Water Board staff will periodically evaluate new and relevant information from implementation actions, water quality monitoring results and the scientific literature, including any local reference system studies, U.S. EPA’s revised recommended bacteria criteria, or new or revised State bacteria water quality objectives, and assess progress toward attaining TMDL targets, and present that information to the Water Board. When new and relevant information indicate it is appropriate to do so, the Water Board will consider the merits and need for a Basin Plan amendment that reflects any necessary modifications to the targets or implementation.
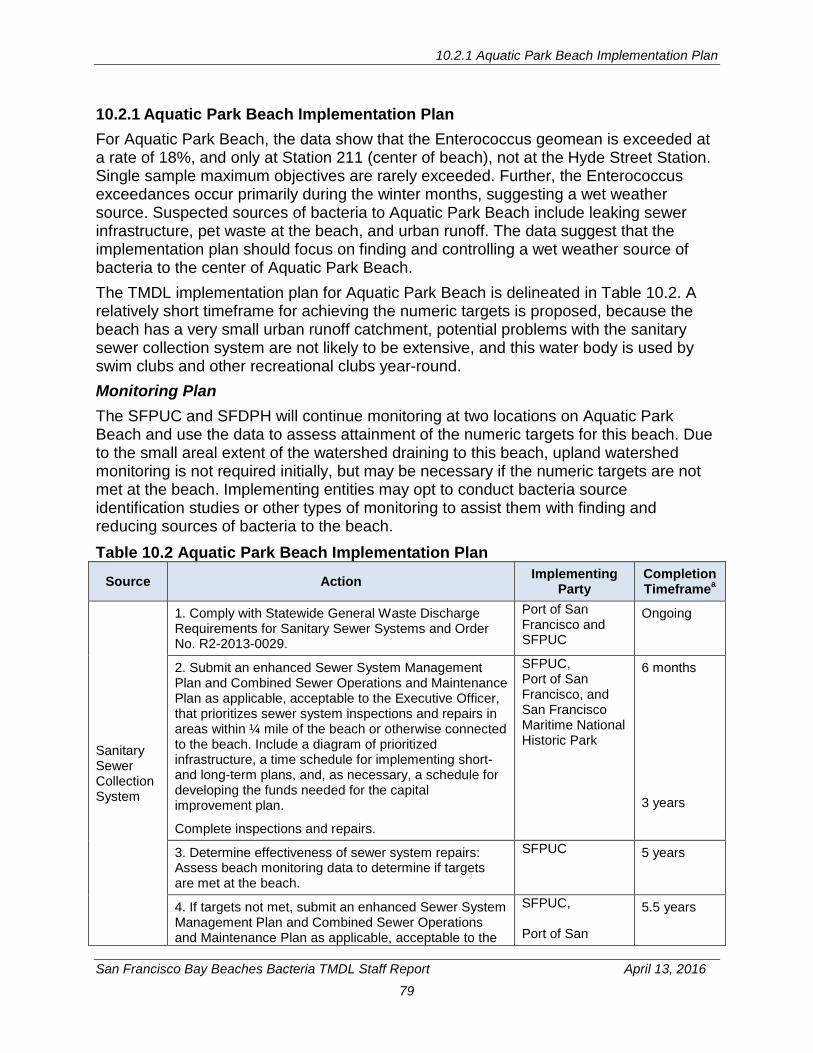
10.2.1 Aquatic Park Beach Implementation Plan
San Francisco Bay Beaches Bacteria TMDL Staff Report April 13, 2016
79
10.2.1 Aquatic Park Beach Implementation Plan For Aquatic Park Beach, the data show that the Enterococcus geomean is exceeded at a rate of 18%, and only at Station 211 (center of beach), not at the Hyde Street Station. Single sample maximum objectives are rarely exceeded. Further, the Enterococcus exceedances occur primarily during the winter months, suggesting a wet weather source. Suspected sources of bacteria to Aquatic Park Beach include leaking sewer infrastructure, pet waste at the beach, and urban runoff. The data suggest that the implementation plan should focus on finding and controlling a wet weather source of bacteria to the center of Aquatic Park Beach. The TMDL implementation plan for Aquatic Park Beach is delineated in Table 10.2. A relatively short timeframe for achieving the numeric targets is proposed, because the beach has a very small urban runoff catchment, potential problems with the sanitary sewer collection system are not likely to be extensive, and this water body is used by swim clubs and other recreational clubs year-round. Monitoring Plan The SFPUC and SFDPH will continue monitoring at two locations on Aquatic Park Beach and use the data to assess attainment of the numeric targets for this beach. Due to the small areal extent of the watershed draining to this beach, upland watershed monitoring is not required initially, but may be necessary if the numeric targets are not met at the beach. Implementing entities may opt to conduct bacteria source identification studies or other types of monitoring to assist them with finding and reducing sources of bacteria to the beach. Table 10.2 Aquatic Park Beach Implementation Plan
Source Action Implementing Party
Completion Timeframea
Sanitary Sewer Collection System
1. Comply with Statewide General Waste Discharge Requirements for Sanitary Sewer Systems and Order No. R2-2013-0029.
Port of San Francisco and SFPUC
Ongoing
2. Submit an enhanced Sewer System Management Plan and Combined Sewer Operations and Maintenance Plan as applicable, acceptable to the Executive Officer, that prioritizes sewer system inspections and repairs in areas within ¼ mile of the beach or otherwise connected to the beach. Include a diagram of prioritized infrastructure, a time schedule for implementing short- and long-term plans, and, as necessary, a schedule for developing the funds needed for the capital improvement plan.
Complete inspections and repairs.
SFPUC, Port of San Francisco, and San Francisco Maritime National Historic Park
6 months 3 years
3. Determine effectiveness of sewer system repairs: Assess beach monitoring data to determine if targets are met at the beach.
SFPUC 5 years
4. If targets not met, submit an enhanced Sewer System Management Plan and Combined Sewer Operations and Maintenance Plan as applicable, acceptable to the
SFPUC, Port of San
5.5 years
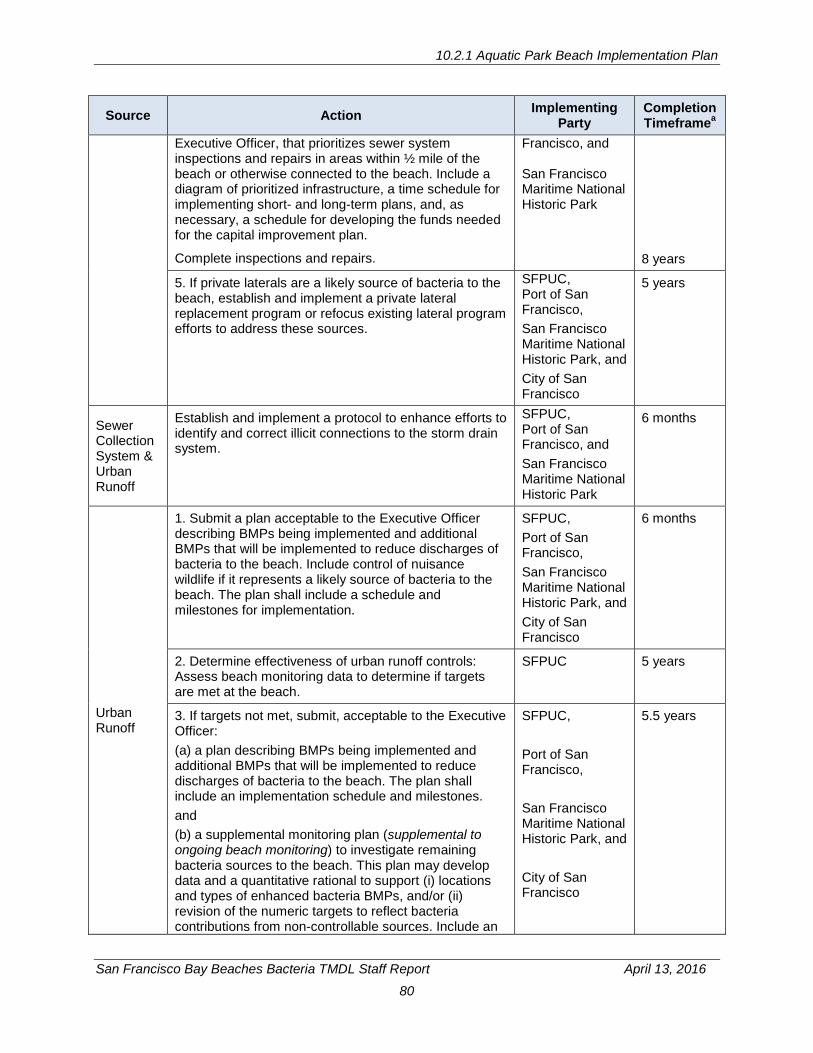
10.2.1 Aquatic Park Beach Implementation Plan
San Francisco Bay Beaches Bacteria TMDL Staff Report April 13, 2016
80
Source Action Implementing Party
Completion Timeframea
Executive Officer, that prioritizes sewer system inspections and repairs in areas within ½ mile of the beach or otherwise connected to the beach. Include a diagram of prioritized infrastructure, a time schedule for implementing short- and long-term plans, and, as necessary, a schedule for developing the funds needed for the capital improvement plan.
Complete inspections and repairs.
Francisco, and San Francisco Maritime National Historic Park
8 years
5. If private laterals are a likely source of bacteria to the beach, establish and implement a private lateral replacement program or refocus existing lateral program efforts to address these sources.
SFPUC, Port of San Francisco, San Francisco Maritime National Historic Park, and City of San Francisco
5 years
Sewer Collection System & Urban Runoff
Establish and implement a protocol to enhance efforts to identify and correct illicit connections to the storm drain system.
SFPUC, Port of San Francisco, and San Francisco Maritime National Historic Park
6 months
Urban Runoff
1. Submit a plan acceptable to the Executive Officer describing BMPs being implemented and additional BMPs that will be implemented to reduce discharges of bacteria to the beach. Include control of nuisance wildlife if it represents a likely source of bacteria to the beach. The plan shall include a schedule and milestones for implementation.
SFPUC, Port of San Francisco, San Francisco Maritime National Historic Park, and City of San Francisco
6 months
2. Determine effectiveness of urban runoff controls: Assess beach monitoring data to determine if targets are met at the beach.
SFPUC 5 years
3. If targets not met, submit, acceptable to the Executive Officer: (a) a plan describing BMPs being implemented and additional BMPs that will be implemented to reduce discharges of bacteria to the beach. The plan shall include an implementation schedule and milestones. and (b) a supplemental monitoring plan (supplemental to ongoing beach monitoring) to investigate remaining bacteria sources to the beach. This plan may develop data and a quantitative rational to support (i) locations and types of enhanced bacteria BMPs, and/or (ii) revision of the numeric targets to reflect bacteria contributions from non-controllable sources. Include an
SFPUC, Port of San Francisco, San Francisco Maritime National Historic Park, and City of San Francisco
5.5 years

10.2.1 Aquatic Park Beach Implementation Plan
San Francisco Bay Beaches Bacteria TMDL Staff Report April 13, 2016
81
Source Action Implementing Party
Completion Timeframea
implementation schedule.
4. Where pet waste may be a source of bacteria to a beach, establish and implement protocols to control pet waste through such measures as providing bags, trash receptacles and signage.
San Francisco Maritime National Historic Park
6 months
a Timeframe begins on the effective date of this Basin Plan amendment
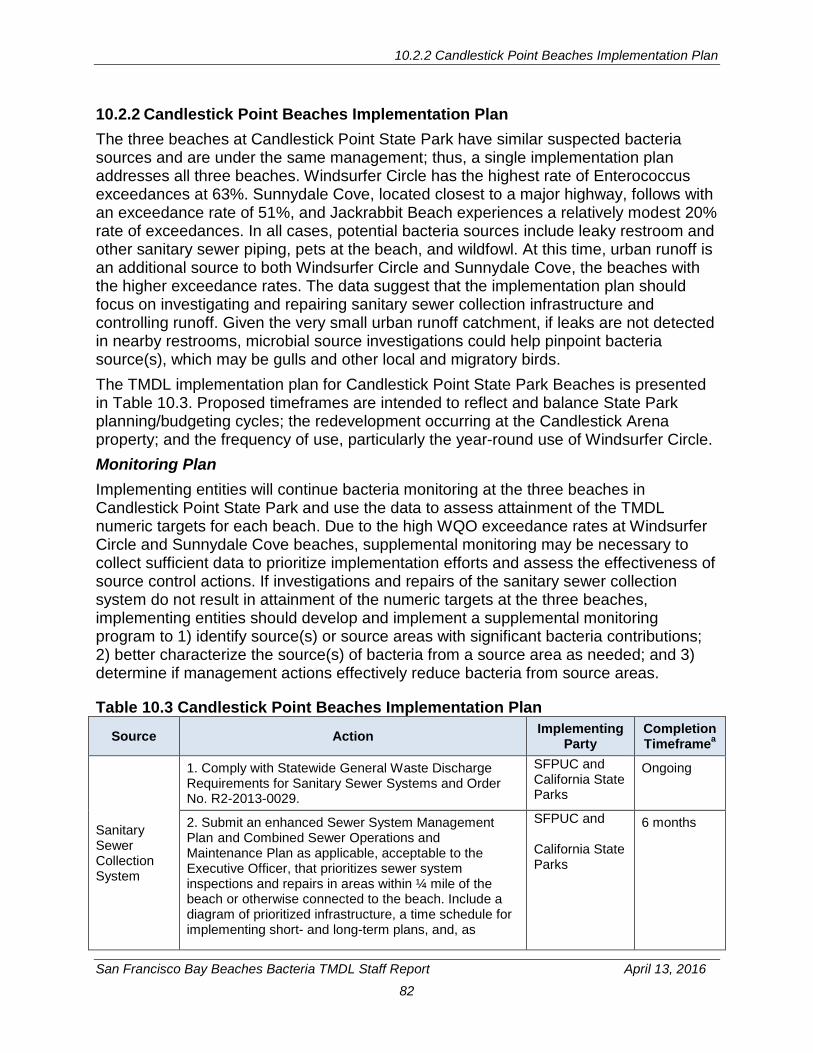
10.2.2 Candlestick Point Beaches Implementation Plan
San Francisco Bay Beaches Bacteria TMDL Staff Report April 13, 2016
82
10.2.2 Candlestick Point Beaches Implementation Plan The three beaches at Candlestick Point State Park have similar suspected bacteria sources and are under the same management; thus, a single implementation plan addresses all three beaches. Windsurfer Circle has the highest rate of Enterococcus exceedances at 63%. Sunnydale Cove, located closest to a major highway, follows with an exceedance rate of 51%, and Jackrabbit Beach experiences a relatively modest 20% rate of exceedances. In all cases, potential bacteria sources include leaky restroom and other sanitary sewer piping, pets at the beach, and wildfowl. At this time, urban runoff is an additional source to both Windsurfer Circle and Sunnydale Cove, the beaches with the higher exceedance rates. The data suggest that the implementation plan should focus on investigating and repairing sanitary sewer collection infrastructure and controlling runoff. Given the very small urban runoff catchment, if leaks are not detected in nearby restrooms, microbial source investigations could help pinpoint bacteria source(s), which may be gulls and other local and migratory birds. The TMDL implementation plan for Candlestick Point State Park Beaches is presented in Table 10.3. Proposed timeframes are intended to reflect and balance State Park planning/budgeting cycles; the redevelopment occurring at the Candlestick Arena property; and the frequency of use, particularly the year-round use of Windsurfer Circle. Monitoring Plan Implementing entities will continue bacteria monitoring at the three beaches in Candlestick Point State Park and use the data to assess attainment of the TMDL numeric targets for each beach. Due to the high WQO exceedance rates at Windsurfer Circle and Sunnydale Cove beaches, supplemental monitoring may be necessary to collect sufficient data to prioritize implementation efforts and assess the effectiveness of source control actions. If investigations and repairs of the sanitary sewer collection system do not result in attainment of the numeric targets at the three beaches, implementing entities should develop and implement a supplemental monitoring program to 1) identify source(s) or source areas with significant bacteria contributions; 2) better characterize the source(s) of bacteria from a source area as needed; and 3) determine if management actions effectively reduce bacteria from source areas.
Table 10.3 Candlestick Point Beaches Implementation Plan
Source Action Implementing Party
Completion Timeframea
Sanitary Sewer Collection System
1. Comply with Statewide General Waste Discharge Requirements for Sanitary Sewer Systems and Order No. R2-2013-0029.
SFPUC and California State Parks
Ongoing
2. Submit an enhanced Sewer System Management Plan and Combined Sewer Operations and Maintenance Plan as applicable, acceptable to the Executive Officer, that prioritizes sewer system inspections and repairs in areas within ¼ mile of the beach or otherwise connected to the beach. Include a diagram of prioritized infrastructure, a time schedule for implementing short- and long-term plans, and, as
SFPUC and California State Parks
6 months
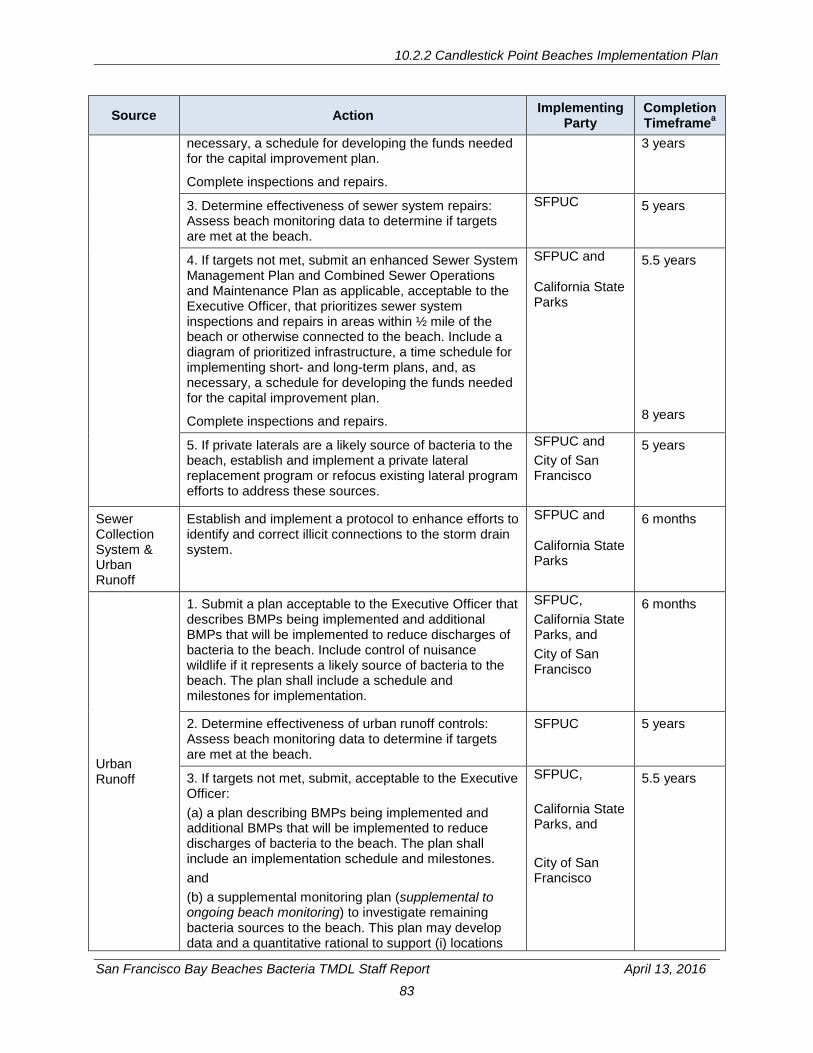
10.2.2 Candlestick Point Beaches Implementation Plan
San Francisco Bay Beaches Bacteria TMDL Staff Report April 13, 2016
83
Source Action Implementing Party
Completion Timeframea
necessary, a schedule for developing the funds needed for the capital improvement plan.
Complete inspections and repairs.
3 years
3. Determine effectiveness of sewer system repairs: Assess beach monitoring data to determine if targets are met at the beach.
SFPUC 5 years
4. If targets not met, submit an enhanced Sewer System Management Plan and Combined Sewer Operations and Maintenance Plan as applicable, acceptable to the Executive Officer, that prioritizes sewer system inspections and repairs in areas within ½ mile of the beach or otherwise connected to the beach. Include a diagram of prioritized infrastructure, a time schedule for implementing short- and long-term plans, and, as necessary, a schedule for developing the funds needed for the capital improvement plan.
Complete inspections and repairs.
SFPUC and California State Parks
5.5 years 8 years
5. If private laterals are a likely source of bacteria to the beach, establish and implement a private lateral replacement program or refocus existing lateral program efforts to address these sources.
SFPUC and City of San Francisco
5 years
Sewer Collection System & Urban Runoff
Establish and implement a protocol to enhance efforts to identify and correct illicit connections to the storm drain system.
SFPUC and California State Parks
6 months
Urban Runoff
1. Submit a plan acceptable to the Executive Officer that describes BMPs being implemented and additional BMPs that will be implemented to reduce discharges of bacteria to the beach. Include control of nuisance wildlife if it represents a likely source of bacteria to the beach. The plan shall include a schedule and milestones for implementation.
SFPUC, California State Parks, and City of San Francisco
6 months
2. Determine effectiveness of urban runoff controls: Assess beach monitoring data to determine if targets are met at the beach.
SFPUC 5 years
3. If targets not met, submit, acceptable to the Executive Officer: (a) a plan describing BMPs being implemented and additional BMPs that will be implemented to reduce discharges of bacteria to the beach. The plan shall include an implementation schedule and milestones. and (b) a supplemental monitoring plan (supplemental to ongoing beach monitoring) to investigate remaining bacteria sources to the beach. This plan may develop data and a quantitative rational to support (i) locations
SFPUC, California State Parks, and City of San Francisco
5.5 years
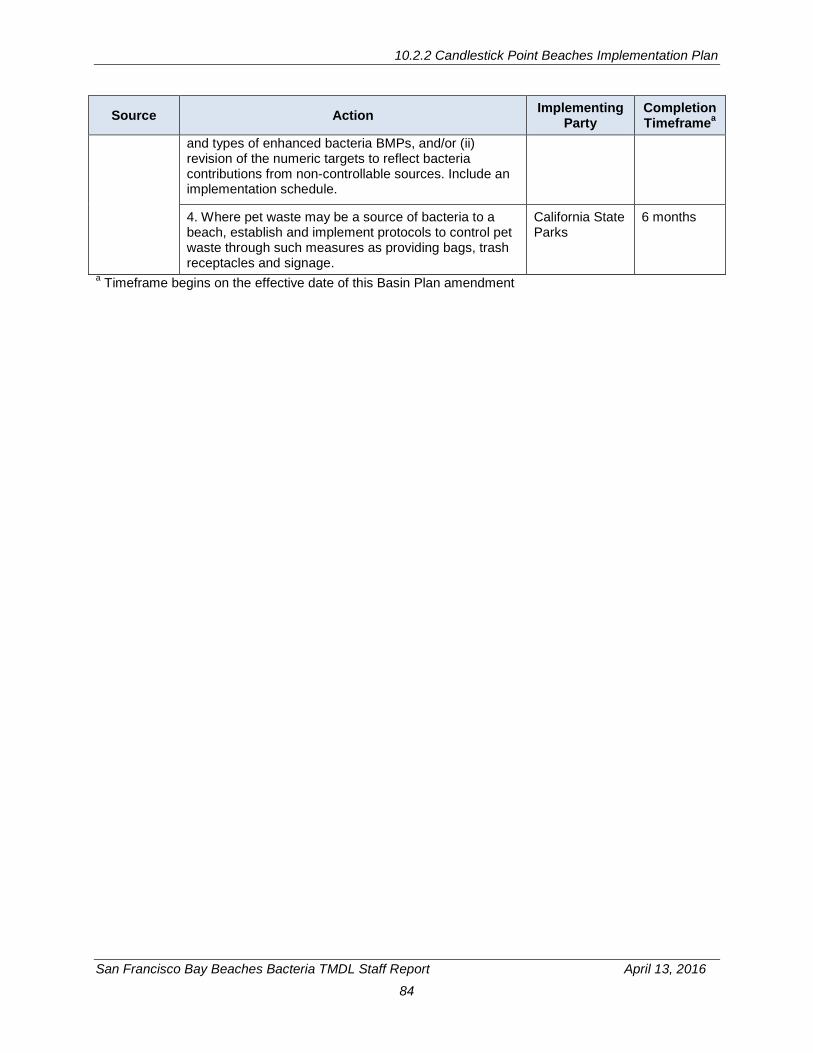
10.2.2 Candlestick Point Beaches Implementation Plan
San Francisco Bay Beaches Bacteria TMDL Staff Report April 13, 2016
84
Source Action Implementing Party
Completion Timeframea
and types of enhanced bacteria BMPs, and/or (ii) revision of the numeric targets to reflect bacteria contributions from non-controllable sources. Include an implementation schedule.
4. Where pet waste may be a source of bacteria to a beach, establish and implement protocols to control pet waste through such measures as providing bags, trash receptacles and signage.
California State Parks
6 months
a Timeframe begins on the effective date of this Basin Plan amendment
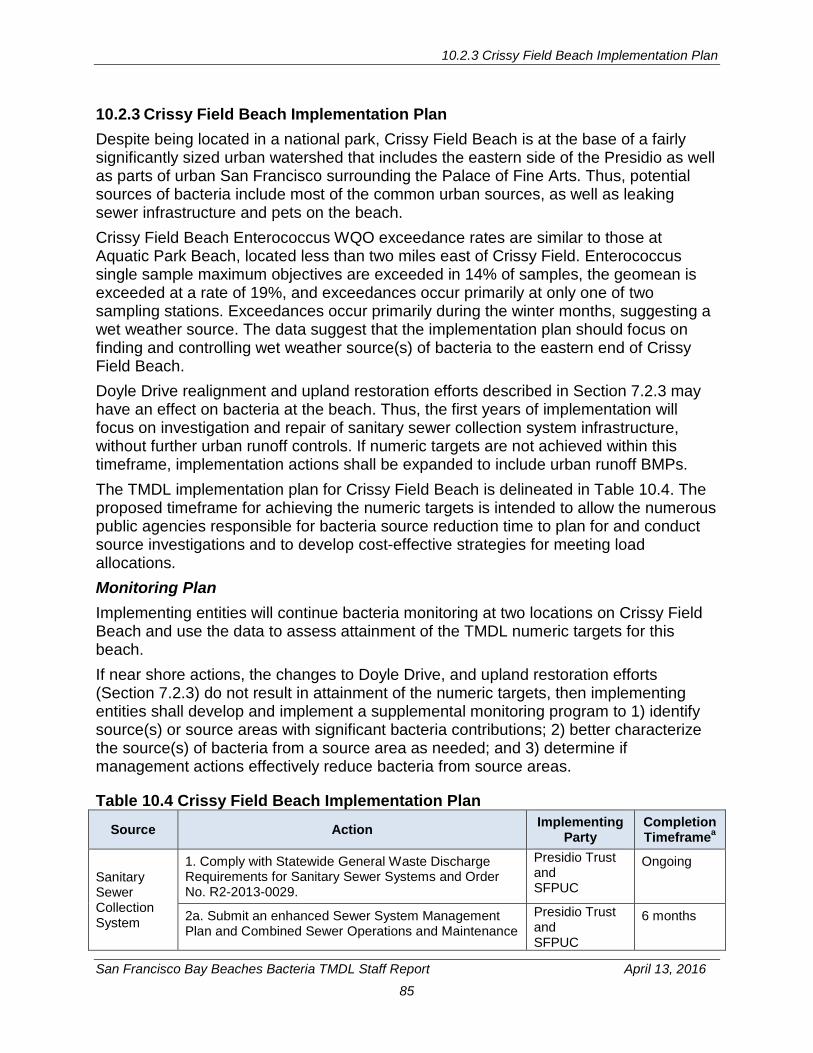
10.2.3 Crissy Field Beach Implementation Plan
San Francisco Bay Beaches Bacteria TMDL Staff Report April 13, 2016
85
10.2.3 Crissy Field Beach Implementation Plan Despite being located in a national park, Crissy Field Beach is at the base of a fairly significantly sized urban watershed that includes the eastern side of the Presidio as well as parts of urban San Francisco surrounding the Palace of Fine Arts. Thus, potential sources of bacteria include most of the common urban sources, as well as leaking sewer infrastructure and pets on the beach. Crissy Field Beach Enterococcus WQO exceedance rates are similar to those at Aquatic Park Beach, located less than two miles east of Crissy Field. Enterococcus single sample maximum objectives are exceeded in 14% of samples, the geomean is exceeded at a rate of 19%, and exceedances occur primarily at only one of two sampling stations. Exceedances occur primarily during the winter months, suggesting a wet weather source. The data suggest that the implementation plan should focus on finding and controlling wet weather source(s) of bacteria to the eastern end of Crissy Field Beach. Doyle Drive realignment and upland restoration efforts described in Section 7.2.3 may have an effect on bacteria at the beach. Thus, the first years of implementation will focus on investigation and repair of sanitary sewer collection system infrastructure, without further urban runoff controls. If numeric targets are not achieved within this timeframe, implementation actions shall be expanded to include urban runoff BMPs. The TMDL implementation plan for Crissy Field Beach is delineated in Table 10.4. The proposed timeframe for achieving the numeric targets is intended to allow the numerous public agencies responsible for bacteria source reduction time to plan for and conduct source investigations and to develop cost-effective strategies for meeting load allocations. Monitoring Plan Implementing entities will continue bacteria monitoring at two locations on Crissy Field Beach and use the data to assess attainment of the TMDL numeric targets for this beach. If near shore actions, the changes to Doyle Drive, and upland restoration efforts (Section 7.2.3) do not result in attainment of the numeric targets, then implementing entities shall develop and implement a supplemental monitoring program to 1) identify source(s) or source areas with significant bacteria contributions; 2) better characterize the source(s) of bacteria from a source area as needed; and 3) determine if management actions effectively reduce bacteria from source areas.
Table 10.4 Crissy Field Beach Implementation Plan
Source Action Implementing Party
Completion Timeframea
Sanitary Sewer Collection System
1. Comply with Statewide General Waste Discharge Requirements for Sanitary Sewer Systems and Order No. R2-2013-0029.
Presidio Trust and SFPUC
Ongoing
2a. Submit an enhanced Sewer System Management Plan and Combined Sewer Operations and Maintenance
Presidio Trust and SFPUC
6 months
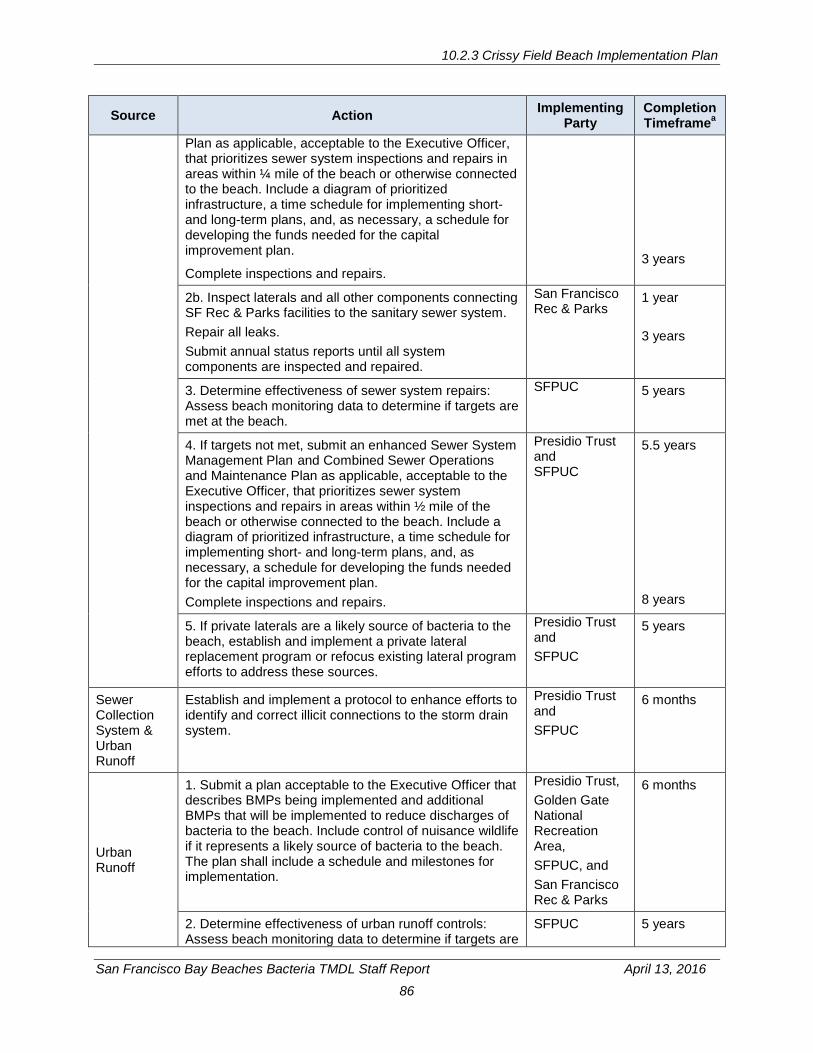
10.2.3 Crissy Field Beach Implementation Plan
San Francisco Bay Beaches Bacteria TMDL Staff Report April 13, 2016
86
Source Action Implementing Party
Completion Timeframea
Plan as applicable, acceptable to the Executive Officer, that prioritizes sewer system inspections and repairs in areas within ¼ mile of the beach or otherwise connected to the beach. Include a diagram of prioritized infrastructure, a time schedule for implementing short- and long-term plans, and, as necessary, a schedule for developing the funds needed for the capital improvement plan.
Complete inspections and repairs.
3 years
2b. Inspect laterals and all other components connecting SF Rec & Parks facilities to the sanitary sewer system. Repair all leaks. Submit annual status reports until all system components are inspected and repaired.
San Francisco Rec & Parks
1 year 3 years
3. Determine effectiveness of sewer system repairs: Assess beach monitoring data to determine if targets are met at the beach.
SFPUC 5 years
4. If targets not met, submit an enhanced Sewer System Management Plan and Combined Sewer Operations and Maintenance Plan as applicable, acceptable to the Executive Officer, that prioritizes sewer system inspections and repairs in areas within ½ mile of the beach or otherwise connected to the beach. Include a diagram of prioritized infrastructure, a time schedule for implementing short- and long-term plans, and, as necessary, a schedule for developing the funds needed for the capital improvement plan. Complete inspections and repairs.
Presidio Trust and SFPUC
5.5 years 8 years
5. If private laterals are a likely source of bacteria to the beach, establish and implement a private lateral replacement program or refocus existing lateral program efforts to address these sources.
Presidio Trust and SFPUC
5 years
Sewer Collection System & Urban Runoff
Establish and implement a protocol to enhance efforts to identify and correct illicit connections to the storm drain system.
Presidio Trust and SFPUC
6 months
Urban Runoff
1. Submit a plan acceptable to the Executive Officer that describes BMPs being implemented and additional BMPs that will be implemented to reduce discharges of bacteria to the beach. Include control of nuisance wildlife if it represents a likely source of bacteria to the beach. The plan shall include a schedule and milestones for implementation.
Presidio Trust, Golden Gate National Recreation Area, SFPUC, and San Francisco Rec & Parks
6 months
2. Determine effectiveness of urban runoff controls: Assess beach monitoring data to determine if targets are
SFPUC 5 years
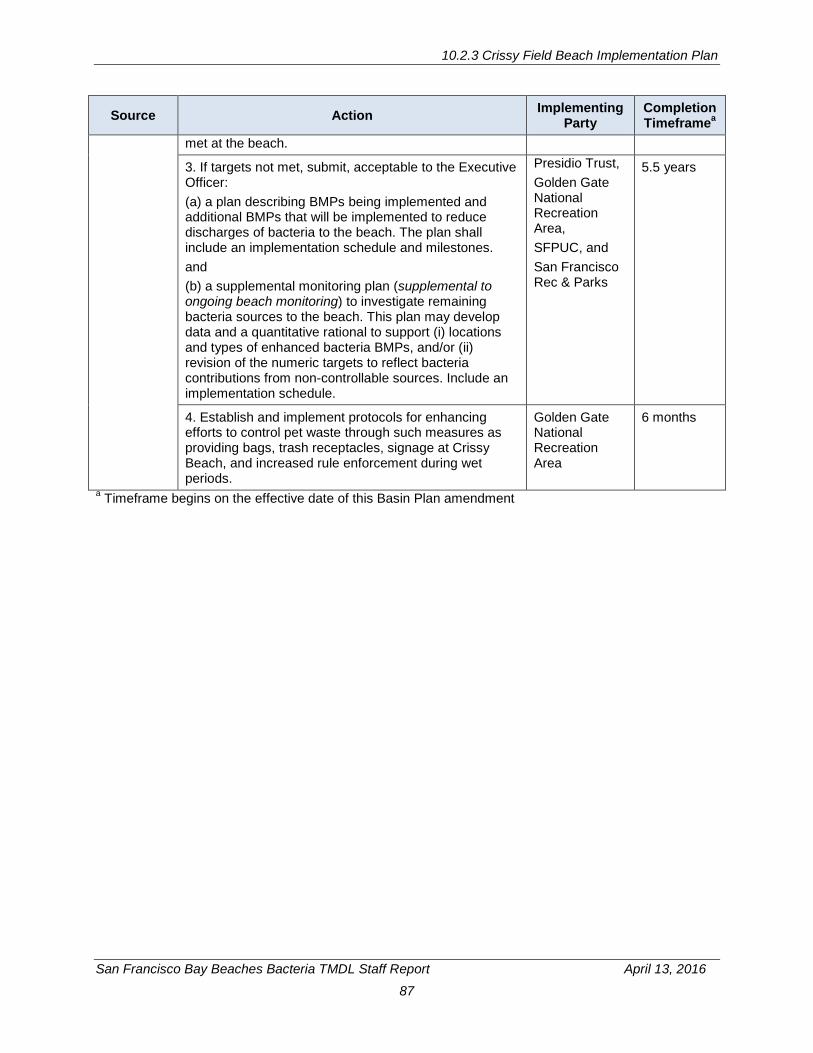
10.2.3 Crissy Field Beach Implementation Plan
San Francisco Bay Beaches Bacteria TMDL Staff Report April 13, 2016
87
Source Action Implementing Party
Completion Timeframea
met at the beach.
3. If targets not met, submit, acceptable to the Executive Officer: (a) a plan describing BMPs being implemented and additional BMPs that will be implemented to reduce discharges of bacteria to the beach. The plan shall include an implementation schedule and milestones. and (b) a supplemental monitoring plan (supplemental to ongoing beach monitoring) to investigate remaining bacteria sources to the beach. This plan may develop data and a quantitative rational to support (i) locations and types of enhanced bacteria BMPs, and/or (ii) revision of the numeric targets to reflect bacteria contributions from non-controllable sources. Include an implementation schedule.
Presidio Trust, Golden Gate National Recreation Area, SFPUC, and San Francisco Rec & Parks
5.5 years
4. Establish and implement protocols for enhancing efforts to control pet waste through such measures as providing bags, trash receptacles, signage at Crissy Beach, and increased rule enforcement during wet periods.
Golden Gate National Recreation Area
6 months
a Timeframe begins on the effective date of this Basin Plan amendment
10.2.4 Marina Lagoon Beaches Implementation Plan
San Francisco Bay Beaches Bacteria TMDL Staff Report April 13, 2016
88
10.2.4 Marina Lagoon Beaches Implementation Plan Lakeshore and Parkside Aquatic Beaches on Marina Lagoon have very large and very urban watersheds that include much of the city of San Mateo. Potential bacteria sources include most of the common urban sources and leaking sewer infrastructure, and nuisance wildlife contributes to the bacteria load as well. Both beaches exceed the Enterococcus geometric mean WQO at a rate of approximately 55 percent. The Enterococcus geomean exceedances tend to occur year-round at Parkside Aquatic Beach and occur primarily, but not exclusively, during non-summer months at Lakeshore Park Beach. Existing information and data suggest that the implementation plan should focus on repairing leaking sewer infrastructure and reducing bacteria loads in urban runoff year-round. Control of resident geese populations also appears effective in reducing bacteria loads, especially at Parkside Aquatic Beach in the summer months. Cease and Desist Order for Wastewater Discharges The City of San Mateo has taken actions to reduce bacteria loads to the beaches in response to the Water Board’s Cease and Desist Order (No. R2-2009-0020). This Order requires action toward elimination of capacity-related SSOs from a major trunk line; a plan and schedule for sewer system cleaning and root control; certification that pump stations are equipped for peak wet weather flows and continued operation during power or mechanical failure; a system capacity assessment; and a plan for short term and long term capacity improvements. The Order also includes requirements for sanitary sewer management plan certification, various communications and reports, and audits. Recent actions taken by the City in response to the Order include the following (Underwood 2015):
Sewer Cleaning and Root Control • Targeted sewer cleaning at “hot spots”: 417,564 linear feet (80 miles) • Citywide sewer cleaning: 1,425,296 linear feet (270 miles) Pump Station and Force Main Reliability and Upgrade • Completed upgrades of two pump stations • Initiated efforts for further upgrades Capacity Assurance: Short and Long Term Improvements • Short Term and Long Term Improvement Plans have been developed • Upgrades of sewer lines or pump stations have been initiated every year since
2009; approximately six projects have been completed.
The Cease and Desist Order also specifies that the plan for short term and long term sewer repair include measures to address private sewer lateral (Figure 7.5) repair, rehabilitation and replacement. In 2011, the City of San Mateo initiated a private lateral replacement project as a Supplemental Environmental Project funded in part by fine monies from the Cease and Desist Order. This project consisted of two parts: a grant program for lower income property owners and a low interest loan program, both for video inspection and replacement of laterals. In a two year period this project incentivized repair of 392 laterals at single family homes, including 149 laterals at low
10.2.4 Marina Lagoon Beaches Implementation Plan
San Francisco Bay Beaches Bacteria TMDL Staff Report April 13, 2016
89
income households, as well as 346 video inspections of sewer piping, at a cost of about $1.5 million (SFBRWQCB 2015). Following completion of this project, the City determined that administrative costs were too high relative to the number of laterals repaired or replaced. In 2013 the program was revived as the Private Sewer Lateral Cost Sharing Program, which provides grants to property owners for 50% of the cost of a full sewer lateral replacement, with a maximum grant of $5,000. Video inspections, spot repairs and partial repairs are not included in the cost sharing program. All types of properties (residential, commercial, multi-family, etc.) within the City of San Mateo are eligible for the full lateral replacement cost sharing. The City does not require inspection or replacement of laterals at the point of sale. Continued compliance with the Cease and Desist Order requirements may minimize SSOs sufficiently to address their contribution to the bacterial impairment at San Mateo beaches. Board staff from the NPDES Wastewater and the Planning and TMDL Divisions will review beach monitoring data, annual Cease and Desist Order Reports and other applicable information to determine whether the Order should be amended to include additional requirements. At this time, this TMDL does not include additional measures to address SSOs. In complying with the Cease and Desist Order, the City of San Mateo is replacing sewer lines and other infrastructure. During this process, potential exists for designing sanitary sewer collection system components to accept urban runoff flows from areas that may have high bacteria concentrations due to, for example, the age of private laterals. The City of San Mateo should investigate the feasibility of diverting stormwater and dry weather urban runoff to the City of San Mateo Wastewater Treatment Plant. Goose feces removal pilot project Independent of the Cease and Desist Order, the City of San Mateo has conducted a pilot test to determine whether removing goose feces from the beaches improves water quality at the beaches. This project, which featured the removal of goose feces on the order of about ten pounds/day from each beach, is more fully described in Section 5.5. Beach data collected during the pilot study suggested a decline in bacteria, although insufficient data were collected to perform a statistical evaluation of project results. The City of San Mateo should continue to develop and conduct a wildfowl feces removal study to determine the relative contribution of this source to ongoing bacteria impairment and the feasibility and cost-effectiveness of various feces removal methods. The purpose of the study would be twofold:
• Statistically evaluate whether removal of wildfowl feces from San Mateo beaches reduces bacterial impairment of the beaches on either a seasonal or continuous basis, and, if so,
• Develop wildfowl feces control measures for long-term implementation as needed to obtain and maintain the numeric target.
Because the City of San Mateo is both the stormwater management and beach authority, a nuisance wildlife control effectiveness study should be included as an element of the urban runoff BMP plan.
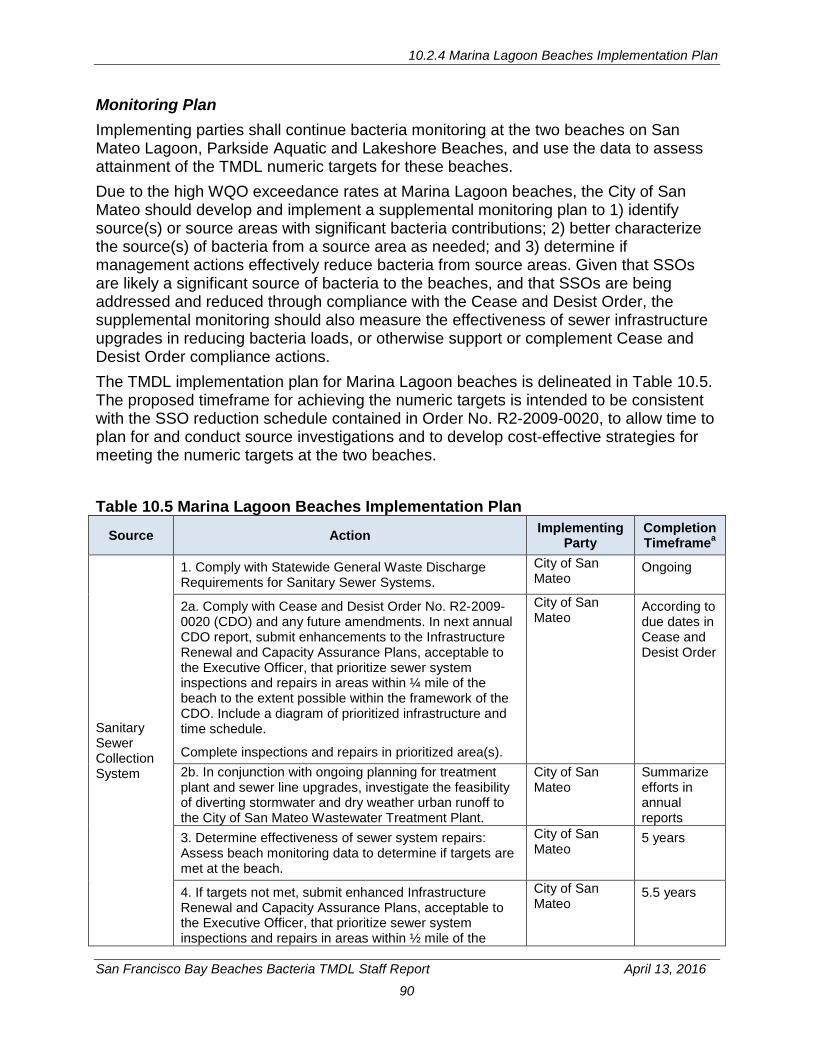
10.2.4 Marina Lagoon Beaches Implementation Plan
San Francisco Bay Beaches Bacteria TMDL Staff Report April 13, 2016
90
Monitoring Plan Implementing parties shall continue bacteria monitoring at the two beaches on San Mateo Lagoon, Parkside Aquatic and Lakeshore Beaches, and use the data to assess attainment of the TMDL numeric targets for these beaches. Due to the high WQO exceedance rates at Marina Lagoon beaches, the City of San Mateo should develop and implement a supplemental monitoring plan to 1) identify source(s) or source areas with significant bacteria contributions; 2) better characterize the source(s) of bacteria from a source area as needed; and 3) determine if management actions effectively reduce bacteria from source areas. Given that SSOs are likely a significant source of bacteria to the beaches, and that SSOs are being addressed and reduced through compliance with the Cease and Desist Order, the supplemental monitoring should also measure the effectiveness of sewer infrastructure upgrades in reducing bacteria loads, or otherwise support or complement Cease and Desist Order compliance actions. The TMDL implementation plan for Marina Lagoon beaches is delineated in Table 10.5. The proposed timeframe for achieving the numeric targets is intended to be consistent with the SSO reduction schedule contained in Order No. R2-2009-0020, to allow time to plan for and conduct source investigations and to develop cost-effective strategies for meeting the numeric targets at the two beaches. Table 10.5 Marina Lagoon Beaches Implementation Plan
Source Action Implementing Party
Completion Timeframea
Sanitary Sewer Collection System
1. Comply with Statewide General Waste Discharge Requirements for Sanitary Sewer Systems.
City of San Mateo
Ongoing
2a. Comply with Cease and Desist Order No. R2-2009-0020 (CDO) and any future amendments. In next annual CDO report, submit enhancements to the Infrastructure Renewal and Capacity Assurance Plans, acceptable to the Executive Officer, that prioritize sewer system inspections and repairs in areas within ¼ mile of the beach to the extent possible within the framework of the CDO. Include a diagram of prioritized infrastructure and time schedule.
Complete inspections and repairs in prioritized area(s).
City of San Mateo
According to due dates in Cease and Desist Order
2b. In conjunction with ongoing planning for treatment plant and sewer line upgrades, investigate the feasibility of diverting stormwater and dry weather urban runoff to the City of San Mateo Wastewater Treatment Plant.
City of San Mateo
Summarize efforts in annual reports
3. Determine effectiveness of sewer system repairs: Assess beach monitoring data to determine if targets are met at the beach.
City of San Mateo
5 years
4. If targets not met, submit enhanced Infrastructure Renewal and Capacity Assurance Plans, acceptable to the Executive Officer, that prioritize sewer system inspections and repairs in areas within ½ mile of the
City of San Mateo
5.5 years

10.2.4 Marina Lagoon Beaches Implementation Plan
San Francisco Bay Beaches Bacteria TMDL Staff Report April 13, 2016
91
Source Action Implementing Party
Completion Timeframea
beach or otherwise connected to the beach. Include a diagram of prioritized infrastructure, a time schedule for implementing short- and long-term plans, and, as necessary, a schedule for developing the funds needed for the capital improvement plan.
Complete inspections and repairs.
8 years
5. If private laterals are a likely source of bacteria to the beach, establish and implement a private lateral replacement program or refocus existing lateral program efforts to address these sources.
City of San Mateo
2 years
Sewer Collection System & Urban Runoff
Establish and implement a protocol to enhance efforts to identify and correct illicit connections to the storm drain system.
City of San Mateo
6 months
Urban Runoff
1. Submit a plan acceptable to the Executive Officer that describes BMPs being implemented and additional BMPs that will be implemented to reduce discharges of bacteria to the beaches. Include control of nuisance wildlife. The plan shall include a schedule and milestones for implementation.
City of San Mateo
6 months
2. Determine effectiveness of urban runoff controls: Assess beach monitoring data to determine if targets are met at the beaches.
City of San Mateo
5 years
3. If targets not met, submit, acceptable to the Executive Officer: (a) a plan describing BMPs being implemented and additional BMPs that will be implemented to reduce discharges of bacteria to the beaches. The plan shall include an implementation schedule and milestones. and (b) a supplemental monitoring plan (supplemental to ongoing beach monitoring) to investigate remaining bacteria sources to the beaches. This plan may develop data and a quantitative rational to support (i) locations and types of enhanced bacteria BMPs, and/or (ii) revision of the numeric targets to reflect bacteria contributions from non-controllable sources. Include an implementation schedule.
City of San Mateo
5.5 years
a Timeframe begins on the effective date of this Basin Plan amendment
10.2.3 China Camp and McNears Beaches Implementation Plan
San Francisco Bay Beaches Bacteria TMDL Staff Report April 13, 2016
92
10.2.5 China Camp and McNears Beaches Implementation Plan The data for China Camp and McNears beaches, which are co-located along a five-mile stretch of the Marin County shoreline, contrast vividly from FIB data from the remaining beaches on San Francisco Bay. Both China Camp and McNears Beaches exceed only the total coliform water quality objective, while the other beaches experience significant Enterococcus exceedances. The numeric targets for this TMDL are for Enterococcus only, as discussed in Section 4. Therefore, both China Camp and McNears Beaches already meet the numeric targets, and no further implementation actions are necessary.
10.3 Adaptive Implementation The Water Board will adapt the TMDL and implementation plans to incorporate new and relevant scientific information so that effective and efficient measures can be taken to achieve the numeric targets. At approximately six-year increments, Water Board staff will evaluate new and relevant information from implementation actions, water quality monitoring results and the scientific literature, including any local reference system studies, U.S. EPA’s revised recommended bacteria criteria, or new or revised State bacteria water quality objectives, and assess progress toward attaining the TMDL, and present that information to the Water Board. The Water Board will consider a Basin Plan amendment that reflects any necessary modifications to the targets or implementation plans.

San Francisco Bay Beaches Bacteria TMDL Staff Report April 13, 2016
93
11 REGULATORY ANALYSES
11.1 Overview This section provides the regulatory analyses required to adopt the Basin Plan amendment establishing both a TMDL for bacteria at SanFrancisco Bay beaches and an implementation plan. Regional basin planning is a certified regulatory program for which a substitute environmental document (SED) may be prepared in lieu of an Environmental Impact Report (EIR) or negative declaration under the California Environmental Quality Act (CEQA) (Cal. Pub. Res. Code § 21080.5; Cal. Code Regs., tit. 14, §§ 15251 (g), 15252(a)). This Staff Report, including the CEQA checklist and the analyses that follow, constitutes an SED under California Code of Regulations, title 14, section 15252, subdivision (a). The Staff Report also analyzes the environmental effects and economic feasibility of reasonably foreseeable implementation actions, as required under California Public Resources Code section 21159, which applies to rules or regulations requiring installation of pollution control equipment. These environmental and economic analyses assess impacts for many of the potential individual projects that may be developed to implement the TMDL, to the extent such impacts can be identified at this time. The results of these analyses indicate that the TMDL will not result in significant, long-term detrimental impacts to the environment and will not cause immediate, large scale expenditures by the entities required to implement it. The implementation plan of the TMDL incorporates management measures required by existing regulations to reduce or eliminate waste discharges from sanitary sewer systems, stormwater runoff, vessels, pets, and controllable wildlife, and the reduction or elimination of these discharges is expected to benefit the environment. This section of the Staff Report is organized into three main parts: 11.2 Environmental Analysis, including the Environmental Checklist, 11.3 Alternatives Analysis; and 11.4 Economic Considerations.
11.2 Environmental Analysis The Water Board is the Lead Agency responsible for evaluating the potential environmental impacts of the TMDL and its implementation plan. This section of the Staff Report describes the project, presents the environmental checklist evaluating the environmental impacts of the projects, and explains the results of the analysis. Sections 11.2 and 11.3 also provide details about the project definition, objectives and a description of the environmental setting that provide the basis for the CEQA evaluation. The environmental checklist frames the analysis and discusses potential environmental impacts as well as the mitigation measures that will likely be used to eliminate or reduce those impacts. Pursuant to section 13360 of the Water Code, the Water Board cannot dictate which compliance or mitigation measures parties employ to implement the TMDL. However, the Water Board recommends that the measures chosen be applied in order to reduce, and if possible avoid, significant environmental impacts. The measures discussed in this section are readily available, low-impact, and generally considered to be consistent with
11 Regulatory Analyses
San Francisco Bay Beaches Bacteria TMDL Staff Report April 13, 2016
94
industry standards. Therefore, these measures can and should be adopted by the parties.
11.2.1 Project Description This Basin Plan amendment will establish a Total Maximum Daily Load (TMDL) and an implementation plan for bacteria at SanFrancisco Bay beaches. The primary purpose of the project is to restore and protect the recreational beneficial uses in the following San Francisco Bay beaches: Aquatic Park Beach, San Francisco Jackrabbit, Sunnydale Cove, and Windsurfer Beaches in Candlestick Point State
Recreation Area, San Francisco Crissy Field Beach, San Francisco Parkside Aquatic and Lakeshore Beaches on Marina Lagoon, City of San Mateo China Camp Beach, Marin County McNears Beach, Marin County
The project includes numeric targets for Enterococcus to protect these recreational uses. The TMDL assigns load and wasteload allocations for Enterococcus that are expected to result in attainment of the targets. Two of the beaches, China Camp and McNears, have attained the targets already and the TMDL does not include implementation actions for them. Thus, these beaches are not included in the Regulatory Analysis. Bacteria sources identified in the TMDL include sanitary sewer collection systems, urban stormwater runoff, pets at the beaches, vessels and wildlife. The TMDL Implementation Plan includes existing regulatory programs and required management measures to reduce bacteria discharges from all of these sources. These implementation actions are summarized in Table 11.1 below.
11.2.2 Project Objectives The objectives of the proposed TMDL and implementation plan are consistent with the mission of the Water Board and the requirements of the federal Clean Water Act (CWA) and California’s Water Code. These objectives are:
• Comply with the CWA requirement to adopt a TMDL for Section 303(d)-listed water bodies;
• Protect existing recreational uses in San Francisco Bay beaches;
• Attain the bacteria objectives for water contact recreation in San Francisco Bay beaches as quickly as feasible;
• Set numeric targets to attain relevant water quality standards in San Francisco Bay beaches;
• Avoid imposing regulatory requirements that are more stringent than necessary to meet numeric targets and attain water quality standards.
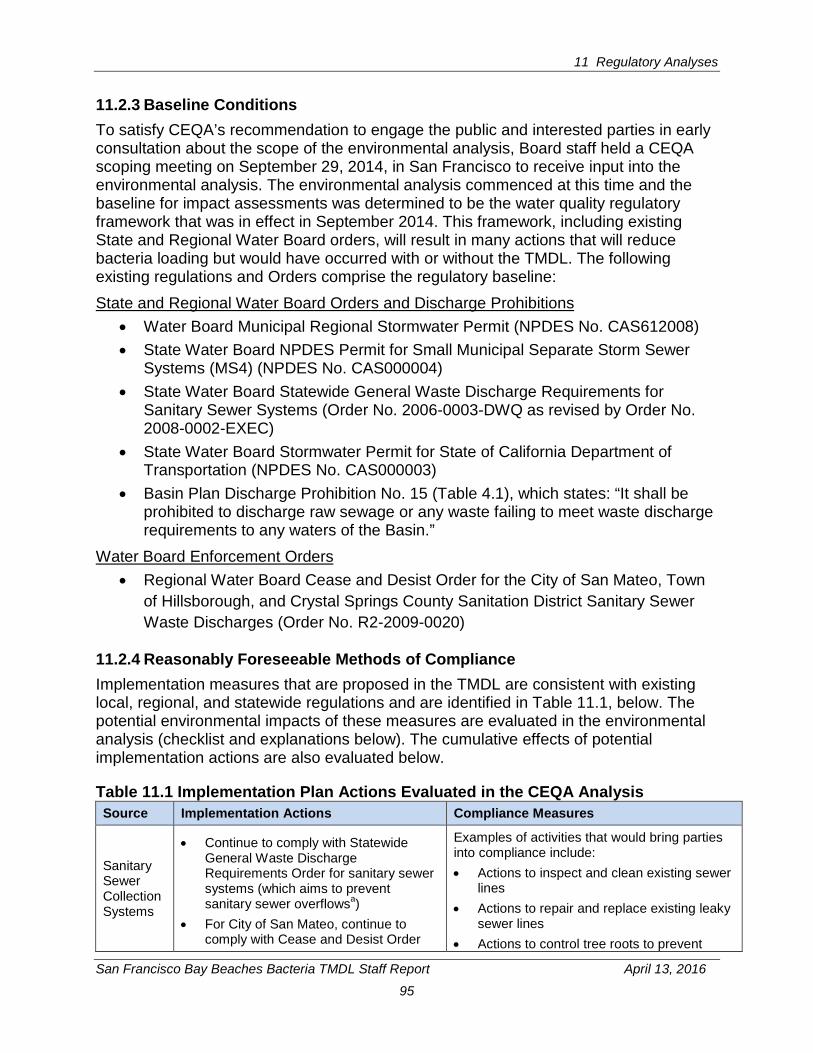
11 Regulatory Analyses
San Francisco Bay Beaches Bacteria TMDL Staff Report April 13, 2016
95
11.2.3 Baseline Conditions To satisfy CEQA’s recommendation to engage the public and interested parties in early consultation about the scope of the environmental analysis, Board staff held a CEQA scoping meeting on September 29, 2014, in San Francisco to receive input into the environmental analysis. The environmental analysis commenced at this time and the baseline for impact assessments was determined to be the water quality regulatory framework that was in effect in September 2014. This framework, including existing State and Regional Water Board orders, will result in many actions that will reduce bacteria loading but would have occurred with or without the TMDL. The following existing regulations and Orders comprise the regulatory baseline: State and Regional Water Board Orders and Discharge Prohibitions
• Water Board Municipal Regional Stormwater Permit (NPDES No. CAS612008) • State Water Board NPDES Permit for Small Municipal Separate Storm Sewer
Systems (MS4) (NPDES No. CAS000004) • State Water Board Statewide General Waste Discharge Requirements for
Sanitary Sewer Systems (Order No. 2006-0003-DWQ as revised by Order No. 2008-0002-EXEC)
• State Water Board Stormwater Permit for State of California Department of Transportation (NPDES No. CAS000003)
• Basin Plan Discharge Prohibition No. 15 (Table 4.1), which states: “It shall be prohibited to discharge raw sewage or any waste failing to meet waste discharge requirements to any waters of the Basin.”
Water Board Enforcement Orders • Regional Water Board Cease and Desist Order for the City of San Mateo, Town
of Hillsborough, and Crystal Springs County Sanitation District Sanitary Sewer Waste Discharges (Order No. R2-2009-0020)
11.2.4 Reasonably Foreseeable Methods of Compliance Implementation measures that are proposed in the TMDL are consistent with existing local, regional, and statewide regulations and are identified in Table 11.1, below. The potential environmental impacts of these measures are evaluated in the environmental analysis (checklist and explanations below). The cumulative effects of potential implementation actions are also evaluated below.
Table 11.1 Implementation Plan Actions Evaluated in the CEQA Analysis Source Implementation Actions Compliance Measures
Sanitary Sewer Collection Systems
• Continue to comply with Statewide General Waste Discharge Requirements Order for sanitary sewer systems (which aims to prevent sanitary sewer overflowsa)
• For City of San Mateo, continue to comply with Cease and Desist Order
Examples of activities that would bring parties into compliance include: • Actions to inspect and clean existing sewer
lines • Actions to repair and replace existing leaky
sewer lines • Actions to control tree roots to prevent
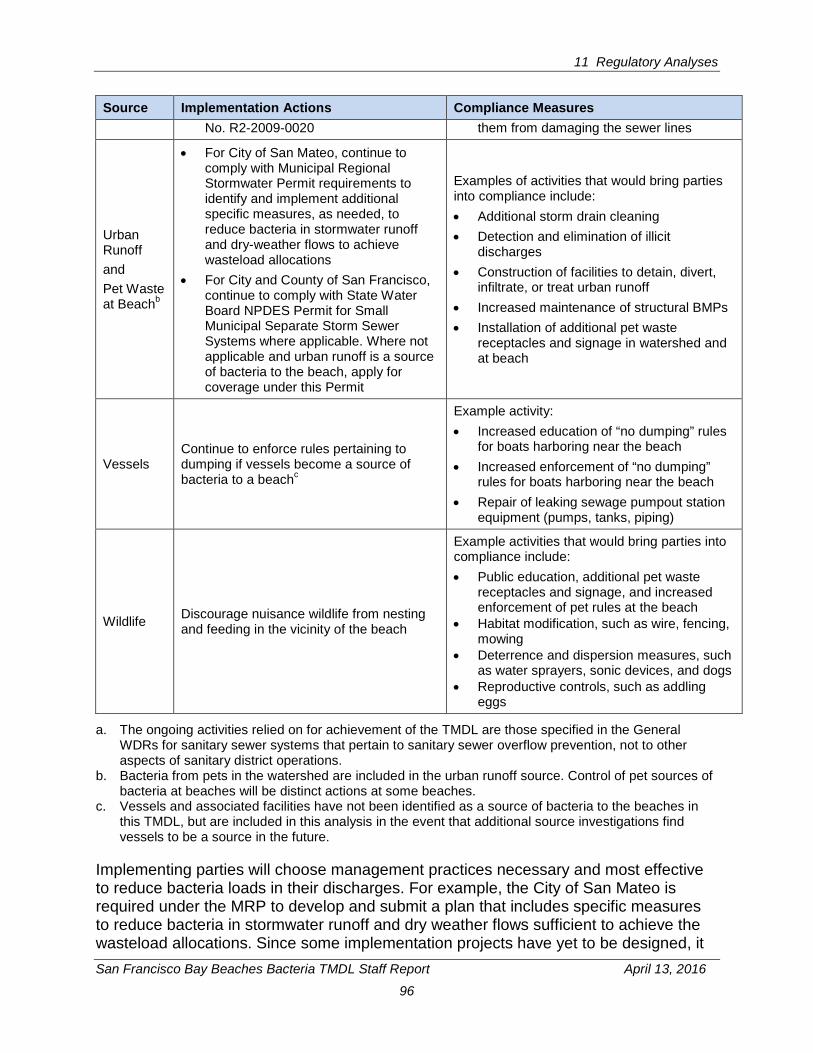
11 Regulatory Analyses
San Francisco Bay Beaches Bacteria TMDL Staff Report April 13, 2016
96
Source Implementation Actions Compliance Measures No. R2-2009-0020 them from damaging the sewer lines
Urban Runoff and Pet Waste at Beachb
• For City of San Mateo, continue to comply with Municipal Regional Stormwater Permit requirements to identify and implement additional specific measures, as needed, to reduce bacteria in stormwater runoff and dry-weather flows to achieve wasteload allocations
• For City and County of San Francisco, continue to comply with State Water Board NPDES Permit for Small Municipal Separate Storm Sewer Systems where applicable. Where not applicable and urban runoff is a source of bacteria to the beach, apply for coverage under this Permit
Examples of activities that would bring parties into compliance include: • Additional storm drain cleaning • Detection and elimination of illicit
discharges • Construction of facilities to detain, divert,
infiltrate, or treat urban runoff • Increased maintenance of structural BMPs • Installation of additional pet waste
receptacles and signage in watershed and at beach
Vessels Continue to enforce rules pertaining to dumping if vessels become a source of bacteria to a beachc
Example activity: • Increased education of “no dumping” rules
for boats harboring near the beach • Increased enforcement of “no dumping”
rules for boats harboring near the beach • Repair of leaking sewage pumpout station
equipment (pumps, tanks, piping)
Wildlife Discourage nuisance wildlife from nesting and feeding in the vicinity of the beach
Example activities that would bring parties into compliance include: • Public education, additional pet waste
receptacles and signage, and increased enforcement of pet rules at the beach
• Habitat modification, such as wire, fencing, mowing
• Deterrence and dispersion measures, such as water sprayers, sonic devices, and dogs
• Reproductive controls, such as addling eggs
a. The ongoing activities relied on for achievement of the TMDL are those specified in the General WDRs for sanitary sewer systems that pertain to sanitary sewer overflow prevention, not to other aspects of sanitary district operations.
b. Bacteria from pets in the watershed are included in the urban runoff source. Control of pet sources of bacteria at beaches will be distinct actions at some beaches.
c. Vessels and associated facilities have not been identified as a source of bacteria to the beaches in this TMDL, but are included in this analysis in the event that additional source investigations find vessels to be a source in the future.
Implementing parties will choose management practices necessary and most effective to reduce bacteria loads in their discharges. For example, the City of San Mateo is required under the MRP to develop and submit a plan that includes specific measures to reduce bacteria in stormwater runoff and dry weather flows sufficient to achieve the wasteload allocations. Since some implementation projects have yet to be designed, it
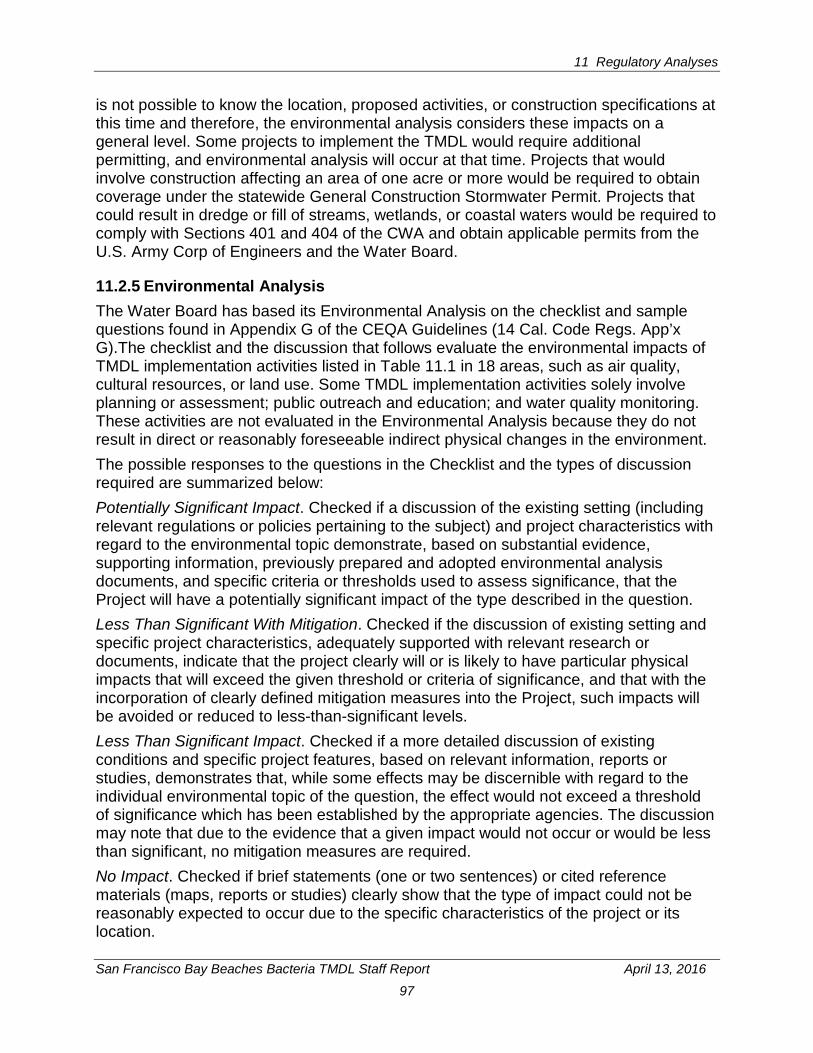
11 Regulatory Analyses
San Francisco Bay Beaches Bacteria TMDL Staff Report April 13, 2016
97
is not possible to know the location, proposed activities, or construction specifications at this time and therefore, the environmental analysis considers these impacts on a general level. Some projects to implement the TMDL would require additional permitting, and environmental analysis will occur at that time. Projects that would involve construction affecting an area of one acre or more would be required to obtain coverage under the statewide General Construction Stormwater Permit. Projects that could result in dredge or fill of streams, wetlands, or coastal waters would be required to comply with Sections 401 and 404 of the CWA and obtain applicable permits from the U.S. Army Corp of Engineers and the Water Board.
11.2.5 Environmental Analysis The Water Board has based its Environmental Analysis on the checklist and sample questions found in Appendix G of the CEQA Guidelines (14 Cal. Code Regs. App’x G).The checklist and the discussion that follows evaluate the environmental impacts of TMDL implementation activities listed in Table 11.1 in 18 areas, such as air quality, cultural resources, or land use. Some TMDL implementation activities solely involve planning or assessment; public outreach and education; and water quality monitoring. These activities are not evaluated in the Environmental Analysis because they do not result in direct or reasonably foreseeable indirect physical changes in the environment. The possible responses to the questions in the Checklist and the types of discussion required are summarized below: Potentially Significant Impact. Checked if a discussion of the existing setting (including relevant regulations or policies pertaining to the subject) and project characteristics with regard to the environmental topic demonstrate, based on substantial evidence, supporting information, previously prepared and adopted environmental analysis documents, and specific criteria or thresholds used to assess significance, that the Project will have a potentially significant impact of the type described in the question. Less Than Significant With Mitigation. Checked if the discussion of existing setting and specific project characteristics, adequately supported with relevant research or documents, indicate that the project clearly will or is likely to have particular physical impacts that will exceed the given threshold or criteria of significance, and that with the incorporation of clearly defined mitigation measures into the Project, such impacts will be avoided or reduced to less-than-significant levels. Less Than Significant Impact. Checked if a more detailed discussion of existing conditions and specific project features, based on relevant information, reports or studies, demonstrates that, while some effects may be discernible with regard to the individual environmental topic of the question, the effect would not exceed a threshold of significance which has been established by the appropriate agencies. The discussion may note that due to the evidence that a given impact would not occur or would be less than significant, no mitigation measures are required. No Impact. Checked if brief statements (one or two sentences) or cited reference materials (maps, reports or studies) clearly show that the type of impact could not be reasonably expected to occur due to the specific characteristics of the project or its location.
11 Regulatory Analyses
San Francisco Bay Beaches Bacteria TMDL Staff Report April 13, 2016
98
ENVIRONMENTAL CHECKLIST 1. Project Title: Proposed Basin Plan Amendment to Establish
a Total Maximum Daily Load (TMDL) for Bacteria at San Francisco Bay Beaches
2. Lead Agency Name and Address: California Regional Water Quality Control Board San Francisco Bay Region 1515 Clay Street, Suite 1400 Oakland, California 94612
3. Contact Person and Phone: Janet O’Hara, (510) 622-5681
4. Project Locations: San Francisco Bay at the City and County of San Francisco and at the City of San Mateo, San Mateo County, California
5. Project Sponsor’s Name & Address: California Regional Water Quality Control Board San Francisco Bay Region 1515 Clay Street, Suite 1400 Oakland, California 94612
6. General Plan Designation: Not Applicable
7. Zoning: Not Applicable
8. Description of Project:
The project is a proposed Basin Plan amendment for a TMDL and implementation plan for San Francisco Bay Beaches listed in Table 11.2. A detailed project description and a project definition are provided in Sections 2 and 3, respectively, of this report.
Table 11.2 Project Locations and Surrounding Land Uses Beach Locationa
Aquatic Park San Francisco, north shore Jackrabbit, Sunnydale Cove, and Windsurfer
Candlestick Point State Recreation Area, San Francisco
Crissy Field San Francisco, north shore Parkside Aquatic and Lakeshore Marina Lagoon, City of San Mateo China Campb Marin County, east shore McNearsb Marin County, east shore aSee Figure 1.1 for beach locations. bThe TMDL does not call for implementation actions at these beaches. See Staff Report sections 10.2.4 and 10.2.5.
The TMDL calls for implementation actions at each of the beaches listed in Table 11.2 except China Camp and McNears, which already meet the TMDL’s numeric targets for Enterococcus. Therefore, this Environmental Analysis focuses only on the beaches (and watersheds) where implementation actions will occur, as shown in Table 11.3 below.
11 Regulatory Analyses
San Francisco Bay Beaches Bacteria TMDL Staff Report April 13, 2016
99
9. Surrounding Land Uses and Setting:
The proposed Basin Plan amendment would affect San Francisco Bay beaches, as described in Section 2 of this report and listed below. Implementation is likely to involve the beaches themselves and upland urban watershed areas that drain to the beaches.
Table 11.3 Project Locations and Surrounding Land Uses Beach Surrounding Land Usea
Aquatic Park Highly urban, very small catchment area (Figure 5.1) Candlestick Point Park Beaches: Jackrabbit, Sunnydale Cove, and Windsurfer
Urban, with new high-density development occurring in the very small catchment area; narrow strip of park land buffers the beaches (Figure 5.3)
Crissy Field Upland urban uses; lower watershed is largely park land (Figure 5.4)
Marina Lagoon Beaches: Parkside Aquatic and Lakeshore
Highly urban ten square mile watershed (Figure 5.6)
aSee Section 2 of this report for more detailed description of surrounding land uses.
10. Other Public Agencies Whose Approval is Required:
The State Water Board, the California Office of Administrative Law, and the U.S. EPA must approve the Basin Plan amendment following adoption by the Water Board.
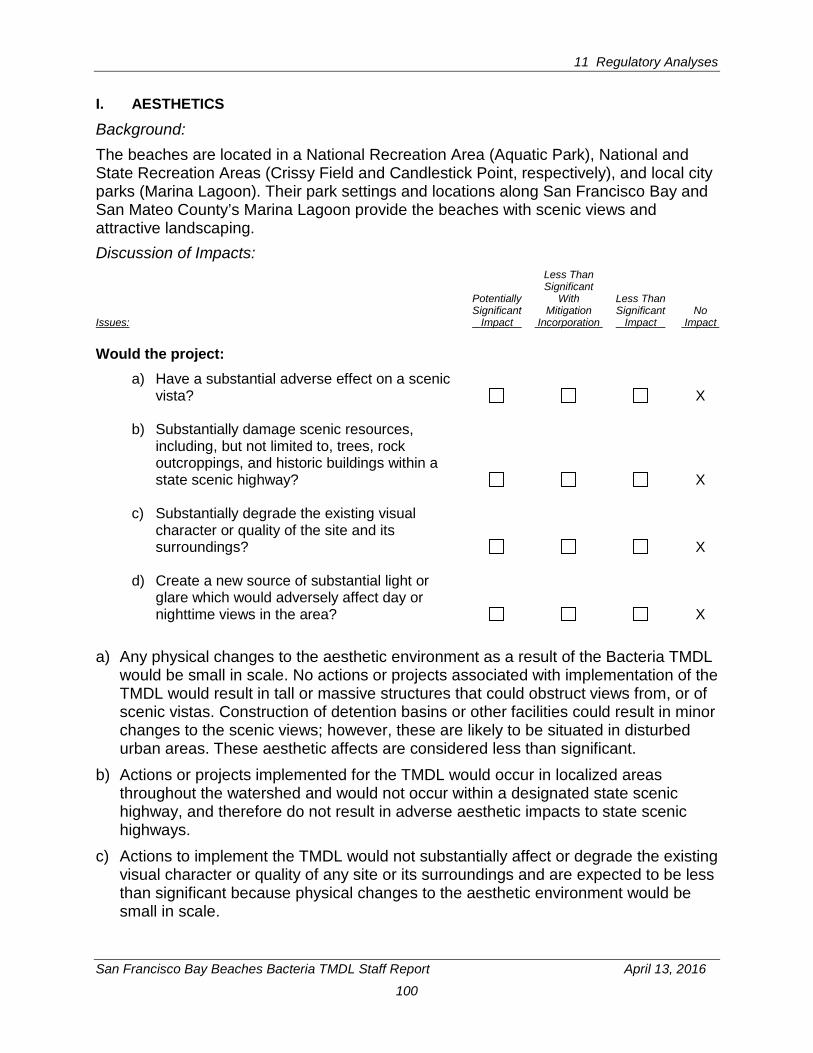
11 Regulatory Analyses
San Francisco Bay Beaches Bacteria TMDL Staff Report April 13, 2016
100
I. AESTHETICS
Background: The beaches are located in a National Recreation Area (Aquatic Park), National and State Recreation Areas (Crissy Field and Candlestick Point, respectively), and local city parks (Marina Lagoon). Their park settings and locations along San Francisco Bay and San Mateo County’s Marina Lagoon provide the beaches with scenic views and attractive landscaping. Discussion of Impacts: Less Than Significant Potentially With Less Than Significant Mitigation Significant No Issues: Impact Incorporation Impact Impact Would the project: a) Have a substantial adverse effect on a scenic
vista? X b) Substantially damage scenic resources,
including, but not limited to, trees, rock outcroppings, and historic buildings within a state scenic highway? X
c) Substantially degrade the existing visual
character or quality of the site and its surroundings? X
d) Create a new source of substantial light or
glare which would adversely affect day or nighttime views in the area? X
a) Any physical changes to the aesthetic environment as a result of the Bacteria TMDL would be small in scale. No actions or projects associated with implementation of the TMDL would result in tall or massive structures that could obstruct views from, or of scenic vistas. Construction of detention basins or other facilities could result in minor changes to the scenic views; however, these are likely to be situated in disturbed urban areas. These aesthetic affects are considered less than significant.
b) Actions or projects implemented for the TMDL would occur in localized areas throughout the watershed and would not occur within a designated state scenic highway, and therefore do not result in adverse aesthetic impacts to state scenic highways.
c) Actions to implement the TMDL would not substantially affect or degrade the existing visual character or quality of any site or its surroundings and are expected to be less than significant because physical changes to the aesthetic environment would be small in scale.
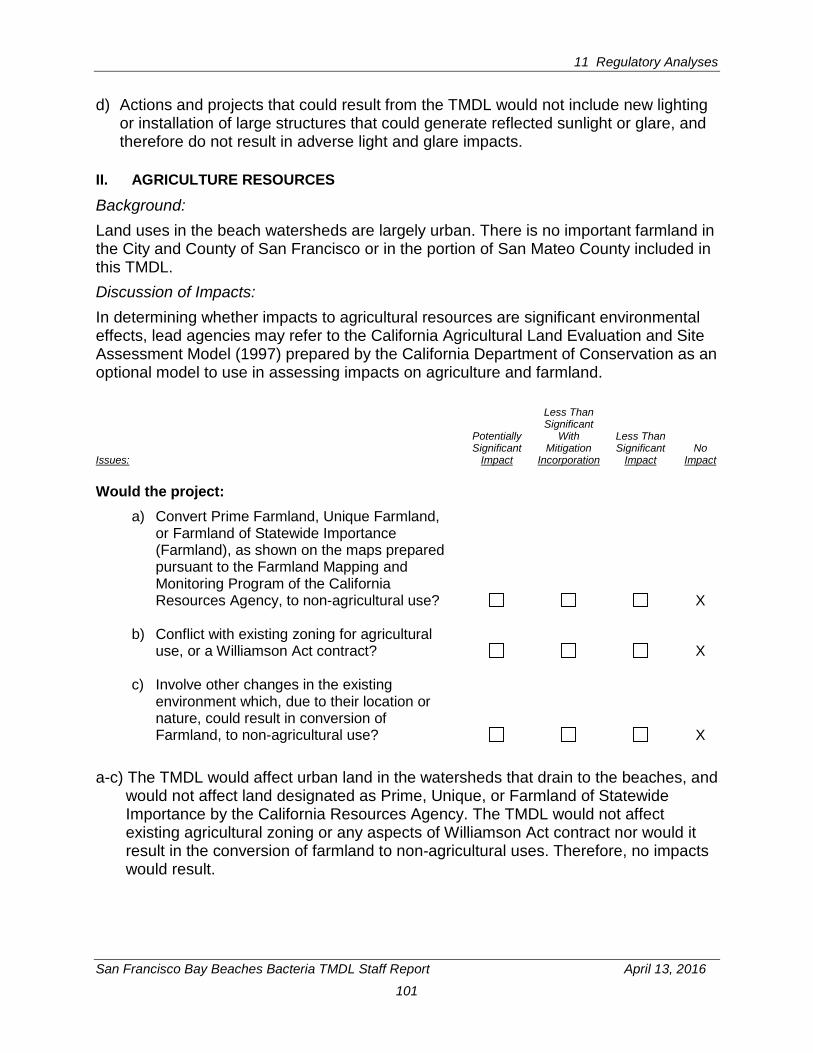
11 Regulatory Analyses
San Francisco Bay Beaches Bacteria TMDL Staff Report April 13, 2016
101
d) Actions and projects that could result from the TMDL would not include new lighting or installation of large structures that could generate reflected sunlight or glare, and therefore do not result in adverse light and glare impacts.
II. AGRICULTURE RESOURCES
Background: Land uses in the beach watersheds are largely urban. There is no important farmland in the City and County of San Francisco or in the portion of San Mateo County included in this TMDL. Discussion of Impacts: In determining whether impacts to agricultural resources are significant environmental effects, lead agencies may refer to the California Agricultural Land Evaluation and Site Assessment Model (1997) prepared by the California Department of Conservation as an optional model to use in assessing impacts on agriculture and farmland. Less Than Significant Potentially With Less Than Significant Mitigation Significant No Issues: Impact Incorporation Impact Impact Would the project: a) Convert Prime Farmland, Unique Farmland,
or Farmland of Statewide Importance (Farmland), as shown on the maps prepared pursuant to the Farmland Mapping and Monitoring Program of the California Resources Agency, to non-agricultural use? X
b) Conflict with existing zoning for agricultural
use, or a Williamson Act contract? X c) Involve other changes in the existing
environment which, due to their location or nature, could result in conversion of Farmland, to non-agricultural use? X
a-c) The TMDL would affect urban land in the watersheds that drain to the beaches, and would not affect land designated as Prime, Unique, or Farmland of Statewide Importance by the California Resources Agency. The TMDL would not affect existing agricultural zoning or any aspects of Williamson Act contract nor would it result in the conversion of farmland to non-agricultural uses. Therefore, no impacts would result.
11 Regulatory Analyses
San Francisco Bay Beaches Bacteria TMDL Staff Report April 13, 2016
102
III. AIR QUALITY
Background San Mateo County is bounded on the west by the Pacific Ocean, on the east by San Francisco Bay, on the south by the Santa Cruz Mountains and on the north by the City and County of San Francisco and the Golden Gate. The city of San Mateo lies in the southeastern peninsula and experiences warmer temperatures and fewer foggy days because the marine layer is blocked by the ridgeline to the west. Mean maximum summer temperatures are in the low-80’s, and mean minimum temperatures during winter months are in the high-30’s to low-40’s. A gap occurs in the Santa Cruz Mountains between Half Moon Bay and San Carlos. As the sea breeze strengthens on summer afternoons, the gap permits maritime air to pass across the mountains, and its cooling effect is commonly seen in San Mateo. On the east side of the mountains winds are generally from the west, although wind patterns in this area are often influenced greatly by local topographic features. Localized pollutants, such as carbon monoxide, can build up in "urban canyons." Winds are generally fast enough to carry the pollutants away before they can accumulate (BAAQMD 1999). San Francisco lies at the northern end of the peninsula. Because most of San Francisco's topography is below 200 feet, marine air is able to flow easily across most of the city, making its climate cool and windy. Mean maximum summer temperatures are in the mid-60's, and mean minimum temperatures during winter months are in the low-40’s. A second gap in the Santa Cruz Mountains extends from Fort Funston on the ocean to the San Francisco Airport. Because the gap is oriented in the same northwest to southeast direction as the prevailing winds, and because the elevations along the gap are less than 200 feet, marine air is easily able to penetrate into the bay (BAAQMD 1999). Discussion of Impacts Where available, the significance criteria established by the applicable air quality management or air pollution control district may be relied upon to make the following determinations. Less Than Significant Potentially With Less Than Significant Mitigation Significant No Issues: Impact Incorporation Impact Impact Would the project: a) Conflict with or obstruct implementation of the
applicable air quality plan? X b) Violate any air quality standard or contribute
substantially to an existing or projected air quality violation? X
11 Regulatory Analyses
San Francisco Bay Beaches Bacteria TMDL Staff Report April 13, 2016
103
c) Result in a cumulatively considerable net increase of any criteria pollutant for which the project region is non-attainment under an applicable federal or state ambient air quality standard (including releasing emissions which exceed quantitative thresholds for ozone precursors)? X
d) Expose sensitive receptors to substantial
pollutant concentrations? X e) Create objectionable odors affecting a
substantial number of people? X
a) Because the TMDL would not cause any significant changes in population or employment, it is not expected to generate ongoing traffic-related emissions. It does not require construction of any permanent emissions sources. For these reasons, no permanent change in air emissions would occur, and the TMDL would not conflict with applicable air quality plans. Therefore, no air quality impacts would result.
b) Construction of stormwater detention/treatment facilities and repair and replacement of sewer pipelines could result in temporary construction-related emissions. However, these emissions would not “violate any air quality standard or contribute substantially to an existing or project air quality standard.” Nor would it involve the construction of any permanent emissions sources or generate ongoing traffic-related emissions. Construction and minor earthmoving that would occur as a result of Bacteria TMDL implementation actions would be of short-term duration and would likely involve discrete, small-scale projects as opposed to extensive earthmoving activities. If specific construction projects were proposed to comply with requirements derived from the proposed TMDL, such projects would have to comply with the Bay Area Air Quality Management District’s (BAAQMD) requirements with respect to the operation of portable equipment. Moreover, BAAQMD has identified readily available measures, routinely employed at most construction sites, to control construction-related air quality emissions (BAAQMD 2012). These measures include watering active construction areas; covering trucks hauling soil; and applying water or applying soil stabilizers on unpaved areas. Therefore, the TMDL would not violate any air quality standard or contribute substantially to any air quality violation, and its temporary construction-related air quality impacts would be less than significant.
c) Because the TMDL would not generate ongoing traffic-related emissions or involve the construction of any permanent emissions sources, it would not result in a cumulatively considerable net increase of any pollutant for which the project region is in non-attainment of air quality standards. No air quality impact would result.
d) Because the TMDL would not require the construction of any permanent emissions sources but rather involves short-term and discrete construction activities, it would
11 Regulatory Analyses
San Francisco Bay Beaches Bacteria TMDL Staff Report April 13, 2016
104
not expose sensitive receptors to substantial pollutant concentrations. No air quality impact would result.
e) The TMDL would include actions to manage controllable wildlife sources of bacteria, including geese feces removal at the two Marina Lagoon beaches. This action began prior to adoption to the TMDL. Feces management activities include the collection and transport of feces, which could result in odor at the time of collection. However, because the feces are not stored or stockpiled prior to transport to an approved disposal facility, possible odors would not affect substantial numbers of people and impacts would be less than significant.
IV. BIOLOGICAL RESOURCES
Background The San Francisco Bay beaches included in this Environmental Analysis are in highly urban environments and can be subject to high use by the public. However, wild birds are present at the beaches. In addition, according to the California Department of Fish and Wildlife’s California Natural Diversity Database, the beaches may provide habitat for rare plants and animals including California red-legged frog, Cooper’s hawk, western snowy plover, and double-crested cormorant (https://map.dfg.ca.gov/bios/?tool=cnddbQuick). Discussion of Impacts Less Than Significant Potentially With Less Than Significant Mitigation Significant No Issues: Impact Incorporation Impact Impact Would the project: a) Have a substantial adverse effect, either
directly or through habitat modifications, on any species identified as a candidate, sensitive, or special-status species in local or regional plans, policies, or regulations, or by the California Department of Fish and Game or U.S. Fish and Wildlife Service? X
b) Have a substantial adverse effect on any
riparian habitat or other sensitive natural community identified in local or regional plans, policies, regulations, or by the California Department of Fish and Game or U.S. Fish and Wildlife Service? X
c) Have a substantial adverse effect on federally
protected wetlands as defined by Section 404 of the Clean Water Act (including, but not limited to, marsh, vernal pool, coastal, etc.) through direct removal, filling, hydrological interruption, or other means? X
11 Regulatory Analyses
San Francisco Bay Beaches Bacteria TMDL Staff Report April 13, 2016
105
d) Interfere substantially with the movement of any native resident or migratory fish or wildlife species or with established native resident or migratory wildlife corridors, or impede the use of native wildlife nursery sites? X
e) Conflict with any local policies or ordinances
protecting biological resources, such as a tree preservation policy or ordinance? X
f) Conflict with the provisions of an adopted
Habitat Conservation Plan, Natural Community Conservation Plan, or other approved local, regional, or state habitat conservation plan? X
a) Actions proposed under the Bacteria TMDL are likely to be small in scale and are located in areas that are currently developed. Actions, such as repair and replacement of pipelines and construction of stormwater detention/treatment facilities area likely to be located in existing disturbed areas such as in roadways or other paved urban areas and would not impact habitats of rare species. Therefore, the TMDL would not have significant adverse effect, either directly or through habitat modifications, on any sensitive or special-status species.
b) Implementation measures that involve repair of sewage systems or minor construction in beach watersheds are not expected to have a significant impact on sensitive natural communities because they would be located in already disturbed areas away from creeks and the beach. In addition, in discharging its regulatory program responsibilities, the Water Board is expected to require mitigation measures for work it approves that may impact coastal ecosystems or other sensitive natural communities. Such requirements include but are not limited to pre-construction surveys; construction buffers and setbacks; restrictions on construction during sensitive periods of time; employment of on-site biologists to oversee work; avoidance of construction in known sensitive habitat areas; and relocation and restoration of sensitive habitats where avoidance is impossible. Therefore, the TMDL would not have a substantial adverse effect, either directly or through habitat modifications to sensitive natural communities.
c) The TMDL does not authorize construction of new fill in riparian or wetland areas in the San Francisco Estuary. Implementation actions are likely to occur in existing roadways and at existing stormwater facilities. Therefore, the TMDL would result in less than significant adverse impacts on wetlands.
d) TMDL implementation actions could include management actions to keep nuisance, non-threatened species of wildlife off beaches. These actions could include egg addling of habituated, formerly migratory Canada geese, a practice which began prior to adoption of the TMDL. These actions could potentially affect wildlife migration; however this effect would be localized and unlikely to result in significant
11 Regulatory Analyses
San Francisco Bay Beaches Bacteria TMDL Staff Report April 13, 2016
106
disturbance to wildlife due to the size of the Canada goose population in the San Francisco Bay area. Therefore, impacts would be less than significant.
e) The TMDL does not conflict with any local policies or ordinances protecting biological resources such as trees. Projects to comply with the TMDL would not affect riparian zones, nor would they include tree removal, and would not conflict with local policies or ordinances.
f) Actions to implement the TMDL will promote improved water quality. The TMDL does not conflict with any adopted Habitat Conservation Plan, Natural Community Plan, or other approved local, regional or state habitat conservation plan.
V. CULTURAL RESOURCES
Background The San Francisco Bay beaches’ watersheds are located in an environment that would have been suitable for early inhabitants to live or gather resources, and therefore could be considered sensitive for prehistoric and tribal cultural resources. Potentially attractive natural resources during the prehistoric period would have included the Bay itself, which provided a bounty of resources for early inhabitants of the area, including estuarine fish, mammals, shellfish, and waterfowl. Historic buildings dating to the late 1800s and mid-1900s exist in the upper watersheds of Aquatic Park and Crissy Field, including the Bathhouse building and several structures within the historic Presidio, respectively. The entire Presidio has been designated a National Historic Landmark District. The historic ship Balclutha is moored at the Hyde Street Pier adjoining Aquatic Park Beach. Discussion of Impacts Less Than Significant Potentially With Less Than Significant Mitigation Significant No Issues: Impact Incorporation Impact Impact
Would the project: a) Cause a substantial adverse change in the
significance of a historical resource, as defined in California Code of Regulations, Title 14, section 15064.5, subdivision (a)? X
b) Cause a substantial adverse change in the
significance of a unique archaeological resource, as defined in Public Resources Code, section 21083.2, subdivision (g)? X
c) Directly or indirectly destroy a unique paleontological resource or site or unique geologic feature? X
d) Cause a substantial adverse change in the significance of a tribal cultural resource, as
11 Regulatory Analyses
San Francisco Bay Beaches Bacteria TMDL Staff Report April 13, 2016
107
defined in Public Resources Code section 21074, subdivision (a)? X
e) Disturb any human remains, including those interred outside of formal cemeteries? X
a) Likely TMDL implementation actions include only minor construction in existing roadways and stormwater facilities and would not require changes to historic buildings or structures. Therefore, the TMDL is not expected to have any impacts on historic resources.
b) Likely TMDL implementation actions would involve minor construction in existing roadways and stormwater facilities in urban areas that are not known or believed to contain significant archeological resources. Large-scale grading and deep excavations are not foreseeable. Therefore, the TMDL is anticipated to have less than significant impacts on archeological resources.
c) Likely TMDL implementation actions would involve minor construction in existing roadways and stormwater facilities, in urban areas not known or believed to contain unique paleontological resources or unique geologic features or resources of cultural value or significance to Native American tribes. Large-scale grading or deep excavations are not foreseeable. Therefore, impacts to paleontological and tribal cultural resources are expected to be less than significant.
d) Actions to implement the TMDL are likely to result in minor construction in existing roadways and stormwater facilities, where underground utilities already exist, and human remains are not known or believed to exist. No large-scale grading or deep excavations are foreseeable. No human remains are expected to be encountered or disturbed.
VI. GEOLOGY AND SOILS
Background San Francisco Bay is located within the Coast Ranges of California. The Coast Ranges are characterized by northwest trending longitudinal mountain ranges and valleys formed by faulting. The San Francisco Bay – Santa Clara Valley lies between the ranges in stable or slowly down-dropping areas formed between three major faults, the San Andreas, the Hayward and the Calavaras. Surface soils in the TMDL implementation areas are generally classified as “urban.” According to a 1991 Soil Survey of San Mateo County, Eastern Part, and San Francisco County, urban land consists of areas that are completely covered by asphalt, concrete, buildings, and other structures. These soils often consists of poorly drained soils that have been filled, and are composed of gravel, broken cement and asphalt, bay mud, and solid waste material. Discussion of Impacts Less Than Significant Potentially With Less Than Significant Mitigation Significant No
11 Regulatory Analyses
San Francisco Bay Beaches Bacteria TMDL Staff Report April 13, 2016
108
Issues: Impact Incorporation Impact Impact
Would the project: a) Expose people or structures to potential
substantial adverse effects, including the risk of loss, injury, or death involving:
i) Rupture of a known earthquake fault, as delineated on the most recent applicable Alquist-Priolo Earthquake Fault Zoning Map issued by the State Geologist, or based on other substantial evidence of a known fault? (California Geological Survey, Special Publication 42: Fault-Rupture Hazard Zones in California). X
ii) Strong seismic ground shaking? X iii) Seismic-related ground failure, including
liquefaction? X
iv) Landslides? X
b) Result in substantial soil erosion or the loss of topsoil? X
c) Be located on geologic unit or soil that is unstable, or that would become unstable as a result of the project, and potentially result in on- or off-site landslide, lateral spreading, subsidence, liquefaction, or collapse? X
d) Be located on expansive soil, as defined in Title 24, section 1803.5.3 of the California Code of Regulations, creating substantial risks to life or property? X
e) Have soils incapable of adequately supporting the use of septic tanks or alternative wastewater disposal systems where sewers are not available for the disposal of wastewater? X
a) Implementation of the TMDL would not require construction of habitable structures or lead to an increase in population; therefore, implementation actions would not create or increase any human safety risks related to fault rupture, seismic ground-shaking, ground failure, or landslides.
b) Action to implement the TMDL may result in minor construction and earthmoving. Although there is some risk of erosion during construction of stormwater facilities in low-lying areas, the risk is not expected to be significant because of the small scale of the likely projects. During large scale earthmoving and construction, landowners must implement erosion control practices per the Construction General Permit.
11 Regulatory Analyses
San Francisco Bay Beaches Bacteria TMDL Staff Report April 13, 2016
109
c) Actions to comply with the TMDL would generally be located in existing disturbed areas, such as streets, and on the beaches. While these areas may contain localized areas that are prone to instability, the type of construction anticipated under the TMDL, such as replacement of pipes, would be small in scale and very unlikely to trigger land instability. Construction of stormwater facilities in low-lying urban areas would not create a risk of landslides. No adverse impacts to local geologic conditions, including on- or off-site landslides, lateral spreading, subsidence, liquefaction, or collapse are expected to occur as a result of adoption of this Basin Plan amendment.
d) Construction of buildings (as defined in Cal. Code Regs. tit. 24, § 202) or any habitable structures is neither required by nor a reasonably foreseeable consequence of the TMDL. Minor grading could occur in areas with expansive soils but this activity would not create a substantial risk to life or property. Therefore, the TMDL would not result in impacts related to expansive soils or risks to life or property.
e) The TMDL would not require construction of new septic systems; therefore, affected soils need not be capable of supporting the use of septic tanks or alternative wastewater disposal systems. No impacts from septic tanks or alternative wastewater disposal systems would result from the project.
VII. GREENHOUSE GAS EMISSIONS
Background: In 2006, California passed the California Global Warming Solutions Act of 2006, which requires the California Air Resources Board (CARB) to design and implement emission limits and regulations to reduce statewide greenhouse gas (GHG) emissions by approximately 25 percent by 2020 in a feasible and cost-effective manner. California recognizes seven GHGs: carbon dioxide (CO2), methane (CH4), nitrous oxide (N2O), hydrofluorocarbons (HFCs), perfluorocarbons (PFCs), and sulfur hexafluoride (SF6) and nitrogen trifluoride (NF3) (Cal. Health & Safety Code, § 38505(g)(1)-(7)). Carbon dioxide is the reference gas for climate change, and to account for the warming potential of different GHGs, GHG emissions are quantified and reported as CO2 equivalents (CO2E). The effects of GHG emission sources (i.e., individual projects) are reported in metric tons/year of CO2E. State law requires local agencies to analyze the environmental impact of GHGs under CEQA. The Natural Resources Agency adopted the CEQA Guidelines Amendments in December 2009. San Mateo County adopted the San Mateo Energy Efficiency Climate Action Plan in 2013. The City and County of San Francisco updated its 2004 Climate Action Strategy in 2013. Discussion of Impacts: Less Than Significant Potentially With Less Than Significant Mitigation Significant No Issues: Impact Incorporation Impact Impact
11 Regulatory Analyses
San Francisco Bay Beaches Bacteria TMDL Staff Report April 13, 2016
110
Would the project: a) Generate greenhouse gas emissions, either
directly or indirectly, that may have a significant impact on the environment? X
b) Conflict with an applicable plan, policy or
regulation adopted for the purpose of reducing the emissions of greenhouse gases? X
a) Although actions to implement the TMDL are expected to generate intermittent,
short-term greenhouse gas emissions related to construction, repair, and maintenance activities, the actions listed in Table 11.1 will not be large-scale, nor will they be associated with a permanent new emissions source, such as from a new transportation or energy project.
b) In addition, many of these implementation activities are required under existing State
and Regional Water Board Orders. Therefore, implementation of the TMDL is expected to result in negligible GHG emissions beyond those that would have resulted from the baseline regulatory framework.
VIII. HAZARDS AND HAZARDOUS MATERIALS
Background Hazardous materials can threaten human health and/or the environment through routine emissions and/or accidental releases. Hazardous materials include materials that are toxic, corrosive, flammable, reactive, irritating, and strongly sensitizing. According to the State of California, a hazardous material is defined as a substance or combination of substances which, because of its quantity, concentration, or physical, chemical or infectious characteristics, may either: 1) cause, or significantly contribute to, an increase in mortality or an increase in serious irreversible, or incapacitating irreversible illness; or 2) pose a substantial present or potential hazard to human health or environment when improperly treated, stored, transported, or disposed of or otherwise managed. Hazardous waste (a subset of hazardous material) refers to a hazardous material that is to be abandoned, discarded or recycled. Discussion of Impacts: Less Than Significant Potentially With Less Than Significant Mitigation Significant No Issues: Impact Incorporation Impact Impact Would the project: a) Create a significant hazard to the public or the
environment through the routine transport, use, or disposal of hazardous materials? X
11 Regulatory Analyses
San Francisco Bay Beaches Bacteria TMDL Staff Report April 13, 2016
111
b) Create a significant hazard to the public or the environment through reasonably foreseeable upset and accident conditions involving the release of hazardous materials into the environment? X
c) Emit hazardous emissions or handle
hazardous or acutely hazardous materials, substances, or waste within one-quarter mile of an existing or proposed school? X
d) Be located on a site which is included on a list
of hazardous materials sites compiled pursuant to Government Code, section 65962.5 and, as a result, would it create a significant hazard to the public or the environment? X
e) For a project located within an airport land
use plan or, where such a plan has not been adopted, within two miles of a public airport or public use airport, would the project result in a safety hazard for people residing or working in the project area? X
f) For a project within the vicinity of a private
airstrip, would the project result in a safety hazard for people residing or working in the project area? X
g) Impair implementation of or physically
interfere with an adopted emergency response plan or emergency evacuation plan? X
h) Expose people or structures to a significant
risk of loss, injury or death involving wildland fires, including where wildlands are adjacent to urbanized areas or where residences are intermixed with wildlands? X
a) The TMDL is not expected to involve the routine transport, use, or disposal of hazardous materials. Therefore, no impacts from the use, transport or disposal of hazardous materials would result.
b) Actions to implement the TMDL, such as repair of pipelines and construction of stormwater facilities are not expected to result in upset or accident conditions involving the release of hazardous materials. Domestic sewage is not considered a hazardous material (Cal. Code Regs., tit. 22 § 66261.4(b)(2)). Laws and regulations restrict the manner of handling and disposal of sewage during repair and
11 Regulatory Analyses
San Francisco Bay Beaches Bacteria TMDL Staff Report April 13, 2016
112
replacement of holding tanks and sewer pipes. Although small amounts of potentially hazardous solvents could potentially be used for repairs or minor construction, these materials must be handled in accordance with applicable laws and regulations, which would minimize hazards to the public or the environment and the potential for accidents or upsets. Therefore, implementation of the TMDL is not expected to create, increase, or otherwise impact a health risk from exposure to hazardous materials.
c) As indicated in response to item VIII b) above, actions to implement the TMDL would not be associated with emission or handling of hazardous materials or substances. Therefore, no impact from hazardous materials would occur within one-quarter mile of an existing or proposed school.
d) There are no sites located within the San Francisco Bay beaches’ watersheds identified on the hazardous waste and substance material sites compiled pursuant to Government Code Section 65962.5 (Cortese List). Therefore, minor construction that may be undertaken to implement the TMDL would have no impact to hazardous waste sites.
e) There are no airports in the vicinity of the beaches requiring TMDL implementation actions. Therefore, the TMDL does not include actions that would result in a safety hazard for people residing or working within two miles of a public airport or vicinity.
f) There are no private airstrips are located near the beaches requiring TMDL implementation. Therefore, the TMDL would not result in the construction of buildings or other structures that could result in safety hazards for people residing or working near a private air strip.
g) Because implementation of the TMDL is not expected to generate hazardous wastes, the TMDL will not result in hazardous waste management activities that could interfere with any emergency response plans or emergency evacuation plans, and no impacts would result.
h) Implementation of the TMDL would not create or increase a risk of wildland fires. Therefore no impacts from wildfires would result.
XI. HYDROLOGY AND WATER QUALITY
Background The watershed area of each of the San Francisco Bay beaches is predominantly urbanized and highly impervious, with the remainder comprised mainly of land used for recreation. As a result of the changes to hydrology from urban development, stormwater outfalls provide most of the flow to the beaches, with some localized overland flow. The beaches are monitored weekly for bacteria indicators. Water quality at the beaches is presented in detail in Section 5.0 of this Staff Report. Discussion of Impacts Less Than Significant Potentially With Less Than Significant Mitigation Significant No
11 Regulatory Analyses
San Francisco Bay Beaches Bacteria TMDL Staff Report April 13, 2016
113
Issues: Impact Incorporation Impact Impact Would the project: a) Violate any water quality standards or waste
discharge requirements? X b) Substantially deplete groundwater supplies or
interfere substantially with groundwater recharge such that there would be a net deficit in aquifer volume or a lowering of the local groundwater table level (e.g., the production rate of pre-existing nearby wells would drop to a level which would not support existing land uses or planned uses for which permits have been granted)? X
c) Substantially alter the existing drainage
pattern of the site or area, including through the alteration of the course of a stream or river, in a manner which would result in substantial erosion of siltation on- or off-site? X
d) Substantially alter the existing drainage
pattern of the site or area, including through the alteration of the course of a stream or river, or substantially increase the rate or amount of surface runoff in a manner which would result in flooding on- or off-site? X
e) Create or contribute runoff water which would
exceed the capacity of existing or planned stormwater drainage systems or provide substantial additional sources of polluted runoff? X
f) Otherwise substantially degrade water
quality? X g) Place housing within a 100-year flood hazard
area as mapped on a federal Flood Hazard Boundary or Flood Insurance Rate Map or other flood hazard delineation map? X
h) Place within a 100-year flood hazard area
structures which would impede or redirect flood flows? X
i) Expose people or structures to a significant
risk of loss, injury or death involving flooding, including flooding as a result of the failure of a levee or dam? X
11 Regulatory Analyses
San Francisco Bay Beaches Bacteria TMDL Staff Report April 13, 2016
114
j) Inundation of seiche, tsunami, or mudflow? X
a) TMDL implementation actions listed in Table 11.1 would not result in violations of water quality standards or waste discharge requirements. The purpose of the TMDL is to attain applicable water quality standards, and implementation actions are expected to reduce bacteria densities at the beaches; therefore, the TMDL will not violate standards or waste discharge requirements.
b) The TMDL would not deplete groundwater supplies or interfere with groundwater recharge. No adverse impacts to groundwater would result.
c) Actions to comply with the TMDL could alter runoff patterns within urban areas if they increase the amount of urban runoff that is infiltrated or diverted to a treatment plant. Such actions would not alter the course of rivers or streams and would not include large scale grading, deep excavation, construction on unpaved areas, or vegetation removal. Implementation would not result in substantial erosion or siltation, either on- or off-site.
d) Compliance with the TMDL could involve minor construction and earthmoving, which would likely have minor effects on existing drainage patterns and the conveyance of urban storm water. Implementation actions could also include construction of drainage swales or other structures designed specifically to alter the flow of storm water. Such projects would be described in municipal storm water permit reports or enforcement order submittals that would be subject to Water Board review and/or approval; the board’s staff will ensure that these projects are designed not to adversely affect upstream areas or contribute to flooding. Therefore, the TMDL would not result in significant impacts related to flooding.
e) TMDL implementation actions would be designed and intended to decrease peak runoff rates from upland land uses. Therefore, the bacteria TMDL would not increase the rate or amount of runoff or exceed the capacity of storm water drainage systems. No adverse impacts to channels would occur.
f) TMDL implementation actions are intended to reduce bacteria in the San Francisco Bay beaches’ watersheds and improve water quality. No adverse water quality impacts would occur.
g-j) No new housing would be constructed as a result of the TMDL and no flood hazard would be created. Actions to implement the TMDL would not affect existing flood hazard areas or otherwise impede or redirect stream flows. As indicated in item IX d), actions taken to implement the bacteria TMDL are limited to minor construction to repair and replace pipelines and install other stormwater bacteria management features and would not create flooding hazards.
X. LAND USE AND PLANNING
Background The San Francisco Bay beaches’ watersheds are situated in densely populated, urbanized settings. The population of San Francisco is about 850,000. The city’s
11 Regulatory Analyses
San Francisco Bay Beaches Bacteria TMDL Staff Report April 13, 2016
115
principal planning document, the San Francisco General Plan, is updated periodically; for example, the Housing Element of the General Plan was updated in 2014, and the Environment Element was updated in 2004. The population of the City of San Mateo is about 100,000; its planning document, the City of San Mateo General Plan, “Vision 2030,” was updated in 2010. Discussion of Impacts Less Than Significant Potentially With Less Than Significant Mitigation Significant No Issues: Impact Incorporation Impact Impact Would the project: a) Physically divide an established community? X b) Conflict with any applicable land use plan,
policy, or regulation of an agency with jurisdiction over the project (including, but not limited to the general plan, specific plan, local coastal program, or zoning ordinance) adopted for the purpose of avoiding or mitigating an environmental effect? X
c) Conflict with any applicable habitat
conservation plan or natural community conservation plan? X
a) Implementation actions of the TMDL would include small-scale repairs and construction and would not physically divide any established community.
b) The TMDL is consistent with existing conservation policies and goals in both San Francisco and San Mateo’s general plans, and would not conflict with land use plans, policies, or regulations. Some actions to comply with TMDL requirements, such as detention basins or other stormwater facilities would be subject to regional or local agency review. Therefore, implementation actions would not conflict with local land use plans or policies.
c) Projects proposed to comply with the TMDL requirements would be implemented to improve water quality and would not conflict with habitat conservation plans or natural community conservation plans.
XI. MINERAL RESOURCES
Background San Francisco and the City of San Mateo do not contain areas of mineral resources of local importance. Discussion of Impacts Less Than Significant
11 Regulatory Analyses
San Francisco Bay Beaches Bacteria TMDL Staff Report April 13, 2016
116
Potentially With Less Than Significant Mitigation Significant No Issues: Impact Incorporation Impact Impact
Would the project: a) Result in the loss of availability of a known
mineral resource that would be of value to the region and the residents of the state? X
b) Result in the loss of availability of a locally-
important mineral resource recovery site delineated on a local general plan, specific plan or other land use plan? X
a-b) TMDL-related excavation and construction would be small in scale and would not result in loss of availability of any known mineral resources that would be of value to the region or the residents of the State.
XII. NOISE
Background The City of San Mateo General Plan indicates that noise levels in the city exceed 60 decibels throughout most of the city. San Mateo’s Municipal Code restricts the hours when construction activities can occur and the maximum noise levels that construction equipment can generate. (http://www.cityofsanmateo.org/DocumentCenter/Home/View/1888) San Francisco’s Noise Control Ordinance regulates prohibits noise that is loud, disturbing, unnecessary, and unusual and limits construction activities to the hours between 7:00 am and 8:00 pm. (http://www.sfdpw.org/ftp/uploadedfiles/sfdpw/boe/manager/Noise_Control_Ordinance.pdf) Discussion of Impacts Less Than Significant Potentially With Less Than Significant Mitigation Significant No Issues: Impact Incorporation Impact Impact Would the project: a) Exposure of persons to or generation of noise
levels in excess of standards established in the local general plan or noise ordinance, or applicable standards of other agencies? X
b) Exposure of persons to or generation of
excessive groundborne vibration or groundborne noise levels? X
11 Regulatory Analyses
San Francisco Bay Beaches Bacteria TMDL Staff Report April 13, 2016
117
c) A substantial permanent increase in ambient noise levels in the project vicinity above levels existing without the project? X
d) A substantial temporary or periodic increase
in ambient noise levels in the project vicinity above levels existing without the project? X
e) For a project located within an airport land
use plan or, where such a plan has not been adopted, within two miles of a public airport or public use airport, would the project expose people residing or working in the project area to excessive noise levels? X
f) For a project within the vicinity of a private
airstrip, would the project expose people residing or working in the project area to excessive noise levels? X
a) To comply with the TMDL, specific projects could involve minor construction and earthmoving, as well as the use of some heavy equipment, including pump trucks, which could result in temporary ground-borne vibration or noise. These activities would typically last no more than a few days, and would be carried out in compliance with local noise and nuisance standards. Therefore, the TMDL would not result in substantial noise, and noise impacts would be less-than-significant.
b) The bacteria TMDL would not cause any permanent increase in ambient noise levels. Any noise would be short-term in nature.
c) As indicated in response to XI b) above, specific projects would have to comply with local noise standards and would not result in substantial noise impacts.
d) The TMDL would not result in increased population in the watershed and would not affect residents’ or workers’ exposure to airport noise.
e) The San Francisco Bay beaches’ watersheds do not contain any private airstrips. XIII. POPULATION AND HOUSING
Background San Francisco has a population of about 850,000, living in 390,000 housing units, predominately multifamily units (http://quickfacts.census.gov/qfd/states/06/06075.html). San Francisco has experienced growth of approximately 45,000 inhabitants since 2010 (http://quickfacts.census.gov/qfd/states/06/0667000.html). The City of San Mateo has a population of about 100,000 living in about 40,000 housing units, split between single-family and multifamily houses. The City has experienced about 8% growth since 2000. (http://www.cityofsanmateo.org/DocumentCenter/View/3937)
Discussion of Impacts
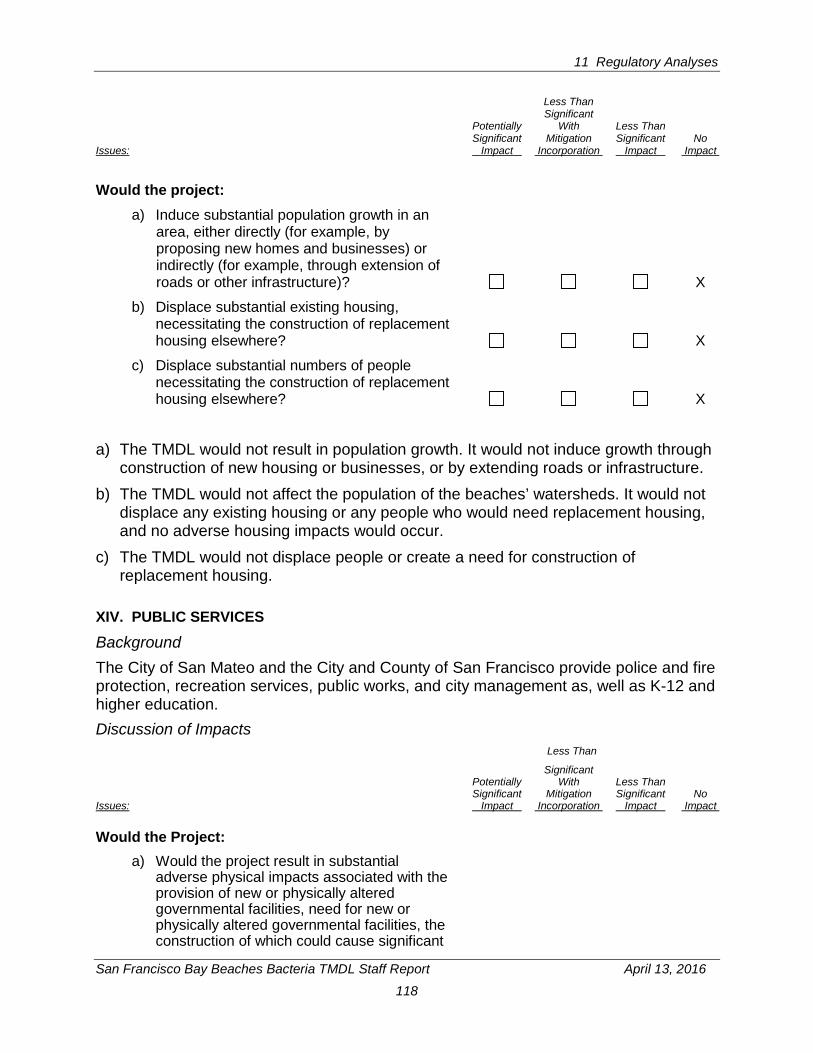
11 Regulatory Analyses
San Francisco Bay Beaches Bacteria TMDL Staff Report April 13, 2016
118
Less Than Significant Potentially With Less Than Significant Mitigation Significant No Issues: Impact Incorporation Impact Impact Would the project: a) Induce substantial population growth in an
area, either directly (for example, by proposing new homes and businesses) or indirectly (for example, through extension of roads or other infrastructure)? X
b) Displace substantial existing housing, necessitating the construction of replacement housing elsewhere? X
c) Displace substantial numbers of people necessitating the construction of replacement housing elsewhere? X
a) The TMDL would not result in population growth. It would not induce growth through construction of new housing or businesses, or by extending roads or infrastructure.
b) The TMDL would not affect the population of the beaches’ watersheds. It would not displace any existing housing or any people who would need replacement housing, and no adverse housing impacts would occur.
c) The TMDL would not displace people or create a need for construction of replacement housing.
XIV. PUBLIC SERVICES
Background The City of San Mateo and the City and County of San Francisco provide police and fire protection, recreation services, public works, and city management as, well as K-12 and higher education. Discussion of Impacts Less Than Significant Potentially With Less Than Significant Mitigation Significant No Issues: Impact Incorporation Impact Impact Would the Project: a) Would the project result in substantial
adverse physical impacts associated with the provision of new or physically altered governmental facilities, need for new or physically altered governmental facilities, the construction of which could cause significant
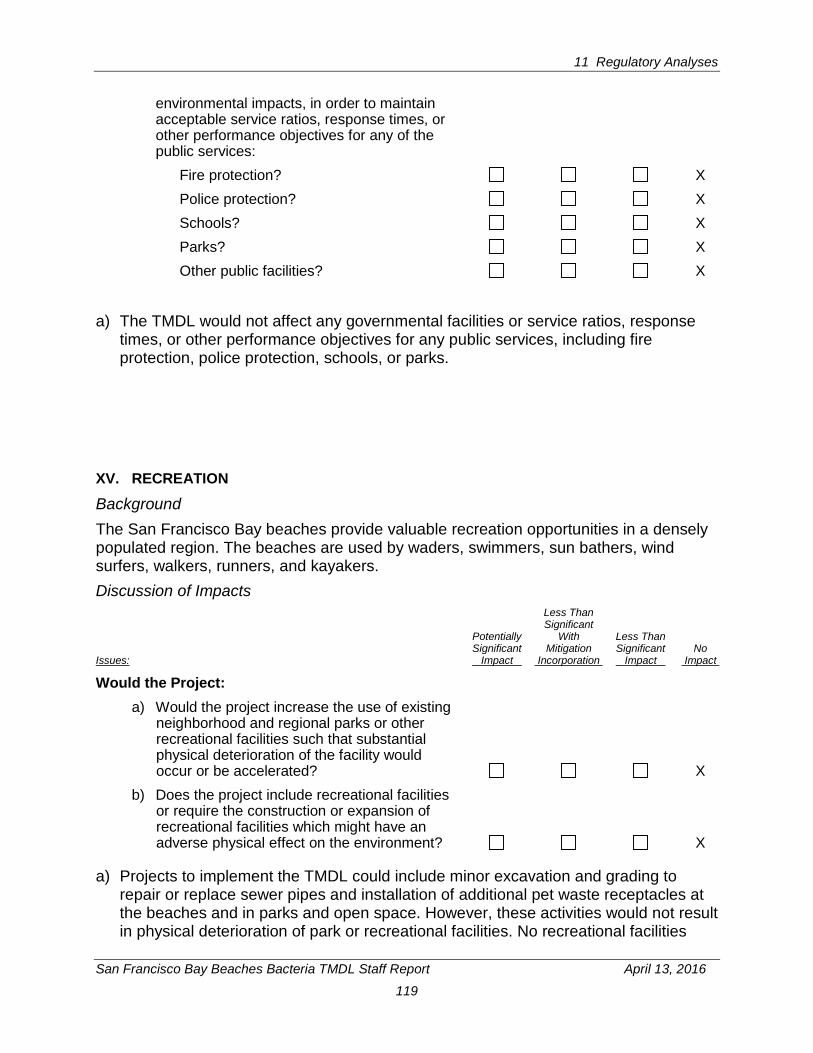
11 Regulatory Analyses
San Francisco Bay Beaches Bacteria TMDL Staff Report April 13, 2016
119
environmental impacts, in order to maintain acceptable service ratios, response times, or other performance objectives for any of the public services:
Fire protection? X Police protection? X Schools? X Parks? X Other public facilities? X
a) The TMDL would not affect any governmental facilities or service ratios, response times, or other performance objectives for any public services, including fire protection, police protection, schools, or parks.
XV. RECREATION
Background The San Francisco Bay beaches provide valuable recreation opportunities in a densely populated region. The beaches are used by waders, swimmers, sun bathers, wind surfers, walkers, runners, and kayakers. Discussion of Impacts Less Than Significant Potentially With Less Than Significant Mitigation Significant No Issues: Impact Incorporation Impact Impact
Would the Project: a) Would the project increase the use of existing
neighborhood and regional parks or other recreational facilities such that substantial physical deterioration of the facility would occur or be accelerated? X
b) Does the project include recreational facilities or require the construction or expansion of recreational facilities which might have an adverse physical effect on the environment? X
a) Projects to implement the TMDL could include minor excavation and grading to repair or replace sewer pipes and installation of additional pet waste receptacles at the beaches and in parks and open space. However, these activities would not result in physical deterioration of park or recreational facilities. No recreational facilities
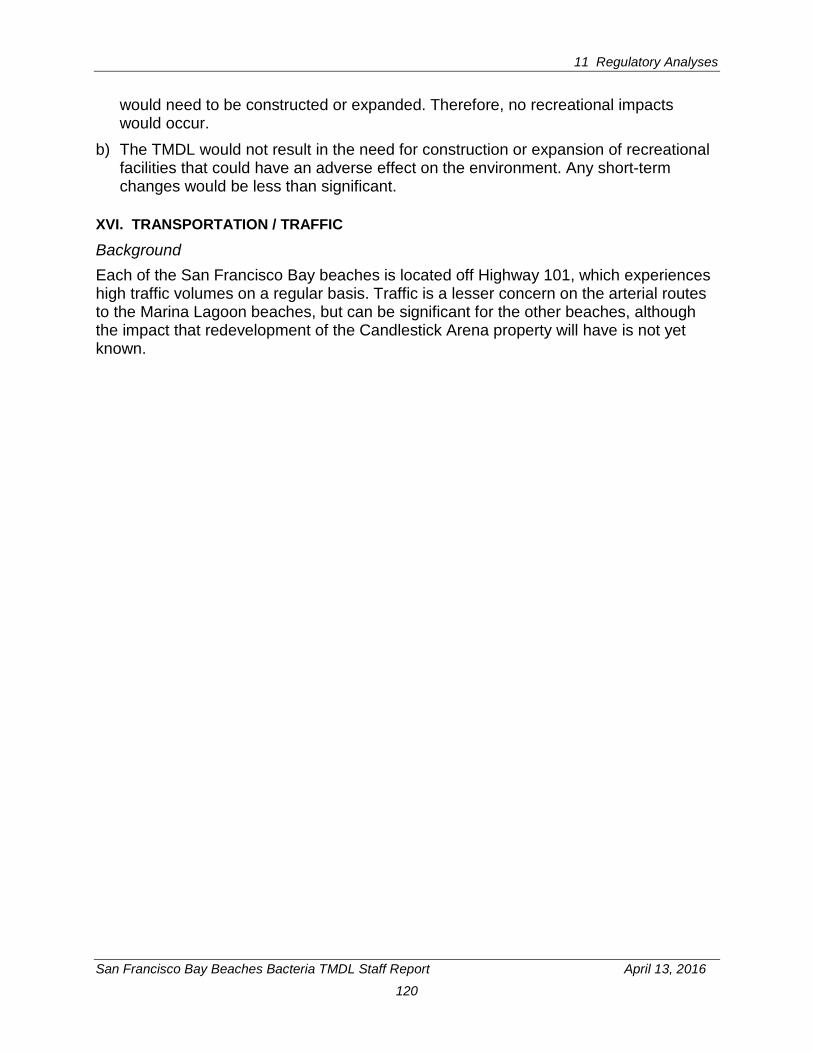
11 Regulatory Analyses
San Francisco Bay Beaches Bacteria TMDL Staff Report April 13, 2016
120
would need to be constructed or expanded. Therefore, no recreational impacts would occur.
b) The TMDL would not result in the need for construction or expansion of recreational facilities that could have an adverse effect on the environment. Any short-term changes would be less than significant.
XVI. TRANSPORTATION / TRAFFIC
Background Each of the San Francisco Bay beaches is located off Highway 101, which experiences high traffic volumes on a regular basis. Traffic is a lesser concern on the arterial routes to the Marina Lagoon beaches, but can be significant for the other beaches, although the impact that redevelopment of the Candlestick Arena property will have is not yet known.

11 Regulatory Analyses
San Francisco Bay Beaches Bacteria TMDL Staff Report April 13, 2016
121
Discussion of Impacts Less Than Significant Potentially With Less Than Significant Mitigation Significant No Issues: Impact Incorporation Impact Impact Would the project: a) Cause an increase in traffic which is
substantial in relation to the existing traffic load and capacity of the street system (i.e., result in a substantial increase in either the number of vehicle trips, the volume-to-capacity ratio on roads, or congestion at intersections)? X
b) Exceed, either individually or cumulatively, a level of service standard established by the county congestion management agency for designated roads or highways? X
c) Result in a change in air traffic patterns, including either an increase in traffic levels or a change in location that results in substantial safety risks? X
d) Substantially increase hazards due to a design feature (e.g., sharp curves or dangerous intersections) or incompatible uses (e.g., farm equipment)? X
e) Result in inadequate emergency access? X
f) Result in inadequate parking capacity? X
g) Conflict with adopted policies, plans, or programs supporting alternative transportation (e.g., bus turnouts, bicycle racks)? X
a) Actions to implement the TMDL could result in minor construction requiring the use of heavy equipment to repair sewer pipelines and construct stormwater facilities. Any increase in traffic would be temporary and would be limited to local areas and would not create substantial traffic in relation to the existing load and capacity of existing street systems.
b) Because the TMDL would not increase population or provide employment, it would not generate any ongoing motor vehicle trips and would not affect level of service standards established by the county congestion management agency. Therefore, the TMDL would not result in permanent, substantial increases in traffic above existing conditions. Impacts would be less than significant.
c) The TMDL would not affect air traffic and no impacts are anticipated.
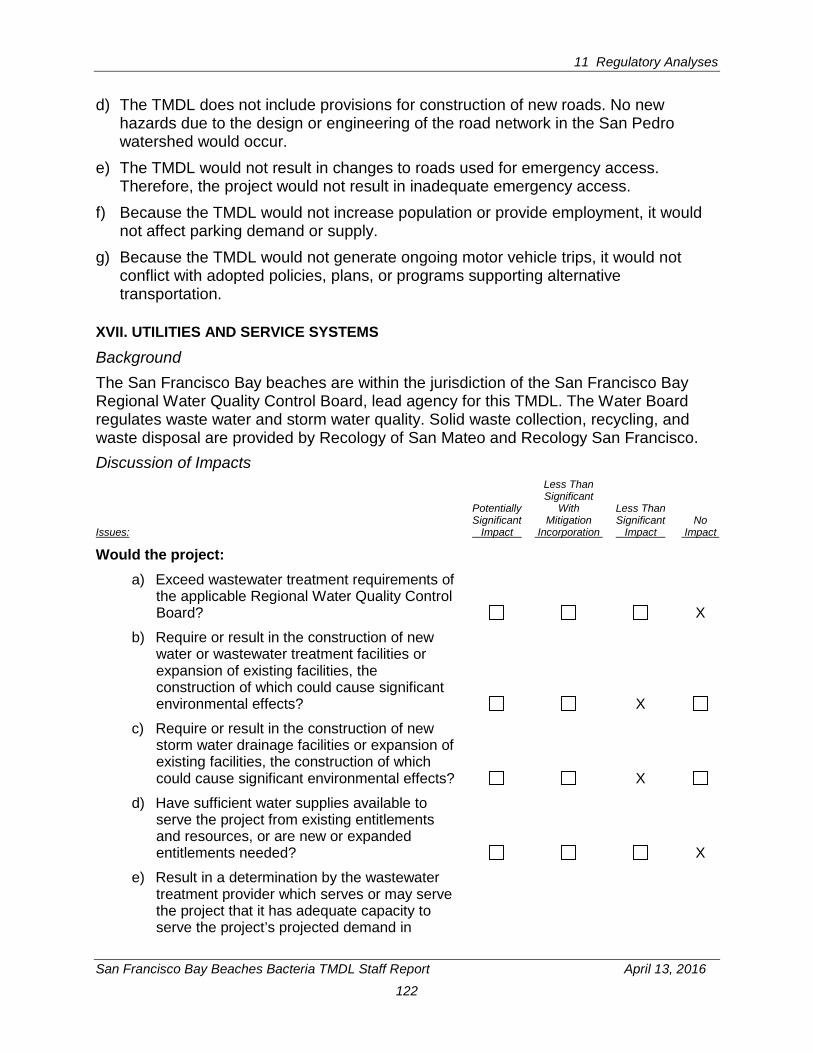
11 Regulatory Analyses
San Francisco Bay Beaches Bacteria TMDL Staff Report April 13, 2016
122
d) The TMDL does not include provisions for construction of new roads. No new hazards due to the design or engineering of the road network in the San Pedro watershed would occur.
e) The TMDL would not result in changes to roads used for emergency access. Therefore, the project would not result in inadequate emergency access.
f) Because the TMDL would not increase population or provide employment, it would not affect parking demand or supply.
g) Because the TMDL would not generate ongoing motor vehicle trips, it would not conflict with adopted policies, plans, or programs supporting alternative transportation.
XVII. UTILITIES AND SERVICE SYSTEMS
Background The San Francisco Bay beaches are within the jurisdiction of the San Francisco Bay Regional Water Quality Control Board, lead agency for this TMDL. The Water Board regulates waste water and storm water quality. Solid waste collection, recycling, and waste disposal are provided by Recology of San Mateo and Recology San Francisco. Discussion of Impacts Less Than Significant Potentially With Less Than Significant Mitigation Significant No Issues: Impact Incorporation Impact Impact
Would the project: a) Exceed wastewater treatment requirements of
the applicable Regional Water Quality Control Board? X
b) Require or result in the construction of new water or wastewater treatment facilities or expansion of existing facilities, the construction of which could cause significant environmental effects? X
c) Require or result in the construction of new storm water drainage facilities or expansion of existing facilities, the construction of which could cause significant environmental effects? X
d) Have sufficient water supplies available to serve the project from existing entitlements and resources, or are new or expanded entitlements needed? X
e) Result in a determination by the wastewater treatment provider which serves or may serve the project that it has adequate capacity to serve the project’s projected demand in
11 Regulatory Analyses
San Francisco Bay Beaches Bacteria TMDL Staff Report April 13, 2016
123
addition to the provider’s existing commitments? X
f) Be served by a landfill with sufficient permitted capacity to accommodate the project’s solid waste disposal needs? X
g) Comply with federal, state, and local statutes and regulations related to solid waste? X
a) The project would amend the Basin Plan, which is the basis for wastewater treatment requirements to improve water quality and the environment in the Bay Area; therefore, the TMDL would be consistent with such requirements.
b) The TMDL includes changes to local wastewater collection and conveyance systems but does not require construction of any new wastewater treatment facilities.
c) TMDL implementation actions could result in improvements to urban storm water runoff systems designed to reduce bacteria discharges to San Francisco Bay beaches. These improvements could include small stormwater detention ponds, holding tanks, or treatment wetlands. It is likely that stormwater facilities would be constructed at the bottom of the collection system, in the low-lying areas. The need, location and design of such facilities have not been determined, so it is not possible to evaluate specific impact at this time. Future projects to improve stormwater quality would be subject to environmental analysis pursuant to City of San Mateo or San Francisco regulations, and would be reviewed by state, local, and federal resources agencies, including the Water Board.
d) Because the TMDL will not increase population or provide employment, it will not require ongoing additional water supply or entitlements.
e) Because the TMDL addresses a pollution problem linked to the wastewater conveyance system, not the treatment plants themselves, compliance would not require any increased wastewater treatment capacity or construction. Implementing parties may choose to divert stormwater to a wastewater treatment plant but are not required to do so by the TMDL. Before making this determination, the implementing party would determine whether resultant additional flow is within the capacity of the treatment plant.
f) TMDL implementation would not substantially affect municipal solid waste generation or landfill capacities. No impacts would occur.
g) TMDL implementation would not substantially affect municipal solid waste generation or landfill capacities and no impacts would occur.
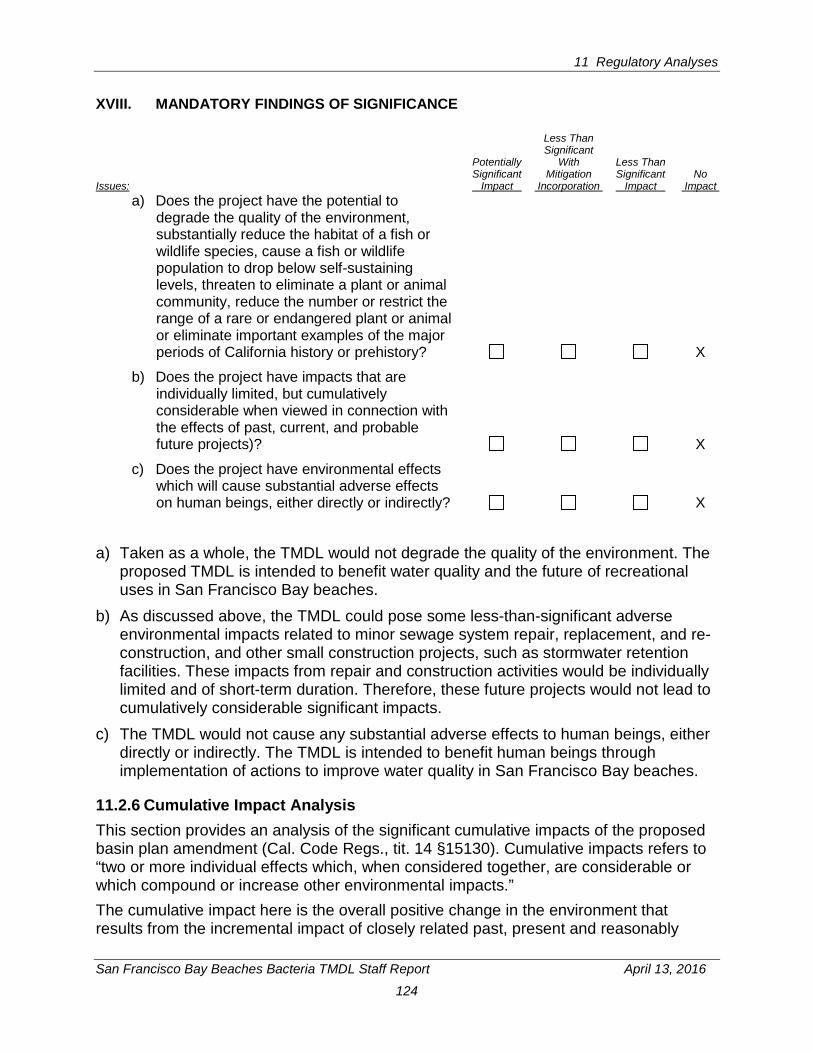
11 Regulatory Analyses
San Francisco Bay Beaches Bacteria TMDL Staff Report April 13, 2016
124
XVIII. MANDATORY FINDINGS OF SIGNIFICANCE Less Than Significant Potentially With Less Than Significant Mitigation Significant No Issues: Impact Incorporation Impact Impact a) Does the project have the potential to
degrade the quality of the environment, substantially reduce the habitat of a fish or wildlife species, cause a fish or wildlife population to drop below self-sustaining levels, threaten to eliminate a plant or animal community, reduce the number or restrict the range of a rare or endangered plant or animal or eliminate important examples of the major periods of California history or prehistory? X
b) Does the project have impacts that are individually limited, but cumulatively considerable when viewed in connection with the effects of past, current, and probable future projects)? X
c) Does the project have environmental effects which will cause substantial adverse effects on human beings, either directly or indirectly? X
a) Taken as a whole, the TMDL would not degrade the quality of the environment. The proposed TMDL is intended to benefit water quality and the future of recreational uses in San Francisco Bay beaches.
b) As discussed above, the TMDL could pose some less-than-significant adverse environmental impacts related to minor sewage system repair, replacement, and re-construction, and other small construction projects, such as stormwater retention facilities. These impacts from repair and construction activities would be individually limited and of short-term duration. Therefore, these future projects would not lead to cumulatively considerable significant impacts.
c) The TMDL would not cause any substantial adverse effects to human beings, either directly or indirectly. The TMDL is intended to benefit human beings through implementation of actions to improve water quality in San Francisco Bay beaches.
11.2.6 Cumulative Impact Analysis This section provides an analysis of the significant cumulative impacts of the proposed basin plan amendment (Cal. Code Regs., tit. 14 §15130). Cumulative impacts refers to “two or more individual effects which, when considered together, are considerable or which compound or increase other environmental impacts.” The cumulative impact here is the overall positive change in the environment that results from the incremental impact of closely related past, present and reasonably
11 Regulatory Analyses
San Francisco Bay Beaches Bacteria TMDL Staff Report April 13, 2016
125
foreseeable probable future projects to reduce bacteria in the watersheds of the San Francisco Bay beaches during the period of implementation. Individual TMDL implementation actions would not result in significant adverse impacts to the environment and no cumulative adverse impacts are anticipated. This analysis considers past, present, and reasonably foreseeable future projects, including projects that would involve substantial changes to urban stormwater infrastructure in the San Francisco Bay beach watersheds covered by the proposed Basin Plan amendment. For instance, projects implemented to comply with Regional Water Board Cease and Desist Order for the City of San Mateo’s Wastewater Discharges would also contribute to compliance with the TMDL, and would not adversely affect water quality or the environment. Other future Water Board regulations or enforcement actions would improve overall water quality in the beaches’ watersheds and could include implementation actions that would further reduce bacteria in the beaches. The cumulative impact of the TMDL with these other projects would be beneficial to the environment and would not result in significant adverse environmental impacts. Our review of other planned, proposed, and ongoing projects reveals none that would lead to significant environmental impacts.
11.3 Alternatives Analysis This section presents three Program Alternatives that encompass actions within the jurisdiction of the Water Board and implementing parties. An evaluation of the alternatives is required under California Code of Regulations, title 14, section 15252, subdivision (a)(2)(A) in order to avoid or reduce any significant or potentially significant effects on the environment. The program alternatives that we have considered are:
1. The bacteria TMDL as it is proposed for Water Board adoption; 2. A bacteria TMDL with longer implementation time frames; and, 3. A “No TMDL” alternative in which a bacteria TMDL is not implemented.
Because a TMDL is required by Section 303(d) of the Clean Water Act, the “No TMDL” alternative is only analyzed to allow decision makers to compare the impacts of approving a proposed alternative and its components compared with the impacts of not approving a proposed alternative. The specifics of the many projects which would make up a program alternative are discussed in detail in Section 10 (summarized in Table 11.1) and include structural and nonstructural bacteria control measures that are reasonably foreseeable to be implemented under the bacteria TMDL program alternatives. The components assessed at a program level generally are program elements that would be implemented as part of the bacteria TMDL, but these elements do not have specific locations or design details identified. The components assessed at a project level have specific locations which will be determined by implementing parties. The project-level components will be subject to additional future environmental analysis, including review by cities and municipalities implementing bacteria control projects.
11 Regulatory Analyses
San Francisco Bay Beaches Bacteria TMDL Staff Report April 13, 2016
126
11.3.1 Alternative 1 – Water Board TMDL as Proposed This program alternative is based on the TMDL that is presently proposed for Water Board consideration. The TMDL assigns both wasteload allocations and load allocations The wasteload allocations will achieve reductions in bacteria discharges from stormwater runoff and dry-weather flows and will be implemented through Municipal Regional Stormwater NPDES Permit; the NPDES Permit for Small Municipal Separate Storm Sewer Systems; and enforcement actions. The TMDL load allocations will achieve reductions of bacteria from sanitary sewer systems. The load allocations will be implemented through ongoing enforcement actions and new enforcement actions as needed. The Water Board TMDL provides a plan for addressing the adverse impacts of bacteria in the San Francisco Bay beaches. The plan uses a phased approach in which anthropogenic sources and controllable wildlife sources of bacteria are fully addressed before bacteria contributions from background sources such as wildlife, soil, sediment, and vegetation are investigated. This approach ensures that beach water quality is improved as quickly as possible and to the extent possible through reduction of common urban sources of bacteria, while allowing impementing parties to assess natural bacteria sources over the longer term. The TMDL proposes a five to ten year schedule for compliance with allowable exceedances at the beaches based on the complexity of sources and cost of controlling them at each beach. Once adopted into the Basin Plan, load and wasteload allocations will be considered in in other permitting and regulatory actions by the Water Board. Although the Water Board cannot mandate the manner of compliance, foreseeable environmental impacts from methods of compliance are well known. During the development of the TMDL, a CEQA scoping meeting was held during which the manner of compliance was discussed and reasonably foreseeable means of compliance were examined. This TMDL program alternative anticipates compliance through implementation of control measures as discussed in Section 10 and summarized in Table 11.1. Potential adverse impacts to the environment stem principally from the installation, operation, and maintenance of these control measures. This document analyzes these impacts and concludes that they will be relatively short-term and typical of baseline construction and maintenance projects that occur presently in the TMDL area. The document also concludes that the TMDL implementation projects will not cause significant adverse impacts to the environment either individually or cumulatively.
11.3.2 Alternative 2 – TMDL with Longer Implementation Time Frames Under this alternative, compliance with the proposed pollutant load allocations would be phased in over a longer period of time (i.e., ten to twenty years) than what is currently proposed by the Basin Plan amendment. Therefore, attainment of water quality standards would take a longer period of time. This alternative would not meet the project objectives because it would not attain standards in the shortest time frame possible. Further, many of the proposed implementation actions are and have been required under various existing regulatory
11 Regulatory Analyses
San Francisco Bay Beaches Bacteria TMDL Staff Report April 13, 2016
127
programs. Therefore, their implementation should be already underway, making a longer implementation time frame unnecessary. Further, implementing parties have begun to take actions independently in order to improve beach water quality.
11.3.3 Alternative 3 – No TMDL This program alternative assumes that the Water Board would not implement a bacteria TMDL. While responsible parties could implement bacteria control measures on a discretionary basis, this CEQA analysis is based on the assumption that no additional bacterial control measures would be implemented in addition to those that are presently in place. However, the “No TMDL” alternative is contrary to state and federal laws, which require TMDL implementation. Therefore, the failure to implement a bacteria TMDL is unlawful. In addition, while impact to the environment from construction or maintenance of structural BMPs would be avoided in this “No TMDL” alternative, this alternative would not restore beneficial uses in these San Francisco Bay beaches: Aquatic Park, Candlestick Point Park, Crissy Field, and Marina Lagoon beaches. TMDL program alternative 1 or 2 will restore water quality to meet beneficial uses in these beaches. As such, both program alternatives 1 and 2 represent a benefit to the environment and the No TMDL program alternative represents a continued bacteria impairment of the environment.
11.3.4 Recommended Program Alternative This environmental analysis finds that Program Alternative 1 is the most environmentally advantageous alternative. Alternative 3 is not a feasible alternative. While it avoids potential impacts due to discrete implementation projects, bacterial impairment of San Francisco Bay beaches will continue. Both program alternatives 1 and 2 will comply with the law and remove the bacterial impairment in the beaches.
11.4 Economic Considerations The objective of this analysis is to estimate the costs of various implementation measures for bacteria reduction in the watersheds draining to San Francisco Bay beaches. The implementation plan calls for reductions in the discharge of bacteria from sanitary sewer systems and urban runoff. This report’s implementation section (Section 10) describes possible implementation measures that may be used to control each potential bacteria source. The discussion of economic considerations or costs associated with various measures described in the implementation Section is limited to those actions that are currently technically feasible and reasonably likely to be implemented by dischargers. The TMDL is not prescriptive; no specific actions to achieve the numeric targets are required. Rather, dischargers are allowed to independently select implementation actions that will allow them to meet their allocations, based on their own considerations of need, budget, feasibility, or other criteria.

11 Regulatory Analyses
San Francisco Bay Beaches Bacteria TMDL Staff Report April 13, 2016
128
This section provides cost estimates for each reasonably foreseeable TMDL implementation measure. In most cases, specific elements of the implementation action will be determined at some point in the future, and therefore the specifics are unknown. In other cases, where it is possible to make educated guesses about the likely elements of an implementation action, cost estimates are included. In instances where estimating the elements of a program would be decidedly speculative, no cost estimates are developed. Costs of implementing existing requirements are also not included in this report. In reviewing the cost estimates, it should be noted that there are multiple additional benefits associated with the implementation of these strategies. For example, many of the structural and non-structural BMPs to address bacteria loading would also reduce the loading of other contaminants, which could assist in protecting other beneficial uses of the beaches. Furthermore, nothing in this TMDL suggests that structural BMPs should be installed at every possible location across each beach’s watershed. Structural BMPs should be installed at strategic locations to treat urban runoff at locations where the benefit of treat is expected to be maximized and most costs-effective. Thus, costs are generally presented as per acre of treated drainage area. A summary of the estimated cost ranges for each reasonably foreseeable TMDL implementation measure is given in Table 11.4.
Table 11.4 Summary of Potential Cost Ranges of Implementation Implementation Action Cost – low Cost - high Units Sanitary sewer collection system repair
Previously required No additional cost
Previously required No additional cost Not applicable
Nonstructural controls (enhanced O&M, pet waste and litter programs)
$161,000 Combined watersheds of Aquatic, Candlestick, Crissy & Marina Lagoon Beaches
Vegetated treatment system – residential area $7,000 $9,000 Per acre of impervious area
treated Vegetated treatment system – commercial/industrial area $17,000 $72,000 Per acre of impervious area
treated Local infiltration systems $75,000 $250,000 Per 25,000 sq.ft. installed
Rainwater capture $0.40 $4.00 Per gallon of rain water captured; labor not included
Media filtration, sand filter $10,000 $16,000 Per 5 acres of drainage area
Diversion / treatment $78,000 annualized capital cost $69,000 annualized operating costs
One low-flow storm drain diversion.
Control nuisance wildfowl at beach $20,000 $40,000 Per beach per year
Inspection and repair of marina sewage collection equipment/piping
$400 $33,500 Per pumpout station
Water Quality Monitoring $3,000 $10,000 Per beach, to add upland bacteria monitoring to existing monitoring programs
11 Regulatory Analyses
San Francisco Bay Beaches Bacteria TMDL Staff Report April 13, 2016
129
11.4.1 Sanitary Sewer Collection Systems Sanitary sewer collection system repairs or replacements may be necessary at all of the beaches in order to meet the TMDL’s numeric targets, as described in the implementation section (Section 10). For the Marina Lagoon beaches, collection system repair/replacement has been required since 2009 by the San Francisco Bay Water Board’s Cease and Desist Order for the City of San Mateo (Order No. R2-2009-0020); thus the TMDL does not require additional actions and no additional costs will be incurred. For Aquatic Park and Crissy Field beaches, the San Francisco Public Utility Commission (SFPUC), Presidio and Port of Oakland are covered under the Statewide General Waste Discharge Requirements for sanitary sewer systems (Order No. 2006-0003-DWQ). As a result, these entities are required to prepare and implement Sewer System Management Plans (SSMPs). A SSMP requires measures to contain sanitary sewer overflows, identify structures needing repair, and develop a preventive maintenance program. Requirements also include monitoring the effectiveness of each SSMP element, and submitting annual reports), and thus the TMDL does not require additional actions and no additional costs will be incurred. For the Candlestick Point beaches, repairs may be necessary within Candlestick Point State Recreation Area. The California Department of Parks and Recreation operates this Recreation Area, and is in the process of applying for coverage under the Statewide Waste Discharge Requirements for sanitary sewer systems (Order No. 2006-0003-DWQ). The Basin Plan amendment would not impose any new requirements or actions for sanitary sewer systems; therefore, no additional costs to sanitary sewer collection agencies would be incurred as result of this Basin Plan amendment.
11.4.2 Urban Runoff Approximate costs associated with typical best management practices (BMPs) that might be implemented in order to attain this TMDL’s numeric targets are provided below, including both non-structural and structural BMPs. For the purposes of the cost analysis, costs for structural BMPs are estimated for general BMP types, which could be scaled up or down depending on if sub-regional or regional BMPs were implemented. In all cases, land acquisition costs were excluded from the cost estimate, and costs are given in 2015 dollars.
11.4.2.1 Non-Structural BMPs The costs for a number of non-structural source control measures have been estimated for the entire Los Angeles Region (Devinny et al. 2004), which has an area of 3,100 square miles. The source control measure costs for the San Francisco Bay beaches’ watersheds were scaled down proportionally. The approximate areas of the beaches where implementation actions are necessary are as follows:
• Aquatic Park Beach – 0.02 square mile • Candlestick Point Beaches – 0.2 square mile • Crissy Field Beach East – 1 square mile; Note that Crissy Field West meets the
TMDL numeric target and thus pollution controls are not needed in its watershed.
11 Regulatory Analyses
San Francisco Bay Beaches Bacteria TMDL Staff Report April 13, 2016
130
• Marina Lagoon Beaches – 10 square miles
The approximate costs for implementing non-structure urban runoff controls across each of the beaches’ watersheds are as follows:
• Enforcement of litter and pet waste ordinances - $12,000 per year • Improved Public education - $6,700 per year • Increased storm drain cleaning - $36,000 per year • Enhanced Illicit discharge detection and elimination – $106,000
Summary: Estimated Annual Costs: $161,000 per year
11.4.2.2 Vegetated Treatment Systems Vegetated treatment systems, often referred to as bioretention cells, include curb planters (curb extensions), bioswales, and infiltration planters. The Alameda Countywide Clean Water Program (ACCWP) estimates that bioretention areas should be sized at about 4% of the contributing impervious area, or 1,740 square feet of bioretention per acre of impervious surface treated (ACCWP 2012). The 2003 CASQA BMP Handbook for New Development and Redevelopment estimates bioretention costs at about $4.00 to $5.20 per square foot for residential and as much as $10-41.50 per square foot of bioretention cell constructed for commercial and industrial land use (adjusted to 2015 dollars). After adjusting for inflation, in 2015 dollars, the bioretention cost is about $7,000 to $9,100 per acre of impervious surface treated in residential areas, or about $17,000 to $72,000 in certain industrial and commercial settings. The cost for retrofitting a site is typically more because of the need to remove existing asphalt, concrete, paving, drainage structures. For new construction, however, some cost savings may accrue due to avoiding or reducing construction of traditional underground storm drain infrastructure.
11.4.2.3 Local Infiltration Systems The installed costs per square foot of permeable paver materials can range from $0.50-1.50 for asphalt pavement; $2.50-8.50 for porous concrete; $2.00-7.75 for grass or gravel pavers, and $6.50-14.00 for interlocking concrete paving blocks (Low Impact Development Urban Design Tools 2015). Little data are available for life cycle costs, but maintenance by period cleaning is necessary to maintain system effectiveness. Permeable infiltration systems would be most cost-effective if located strategically, such as at parking areas and walkways surrounding the beach. Assuming a range of $3.00-10.00/sq.ft. to install infiltrating pavement on a total of 25,000 sq.ft. across the affected watersheds, the estimated construction cost would range from $75,000 to 250,000.
11.4.2.4 Rainwater Capture Rain barrels and cisterns can be installed to capture stormwater runoff from rooftops and store it for later use to irrigate landscapes. Costs vary between manufacturers, but the Low Impact Development Center (2015) provides the general cost estimates for
11 Regulatory Analyses
San Francisco Bay Beaches Bacteria TMDL Staff Report April 13, 2016
131
single rain barrel roof top water catchment system, pre-manufactured cisterns and constructed cisterns. Cost estimates for cisterns follow: Rain Barrel: $220 plus labor for 55 gallon barrel and accessories; Pre-manufactured Cistern: approximately $100 per 100 gallons of capacity for steel and
polyethylene tanks, $50 per 100 gallons of capacity for fiberglass; plus labor and associated piping;
Manually Constructed Cistern: $1200 plus labor and associated piping for a 3000 gallon unit; and
Summary: Rainwater capture systems range in cost from $0.40/gallon (manually constructed cistern) to $4.00/gallon (rain barrel) plus labor for installation and associated piping.
11.4.2.5 Media Filtration Systems The construction cost of a sand/organic filter system depends on the drainage areas, expected efficiency, and other design parameters, but ranges from $10,000 to $16,000 (2015 dollars) to treat a drainage area of 5 acres or less (LARWQCB 2010). Annual maintenance costs average approximately 5% of construction costs.
11.4.2.6 Diversion to Sanitary Sewer for Treatment The Santa Clara Estuary River Bacteria TMDL estimated the annualized capital cost to construct 10 low-flow storm drain diversions at $783,000 (2015 dollars), assuming financing for 20 years at 7 percent (LARWQCB 2010). It also estimated the operation and maintenance costs for 27 existing diversions at $1.7 million. From these estimates, we can estimate the annualized capital and operation and maintenance costs for a single low-flow diversion as follows: • Annualized Capital Costs - $78,000 • Operation and Maintenance Costs - $69,000 per year.
11.4.3 Control Wildlife at Beach Because control of pets at the beach is included in Section 11.4.2.1 Non-Structural BMPs, only the costs of controlling wildfowl are estimated here. In 2015 the City of San Mateo conducted a comprehensive pilot program to control geese at its two beaches. Pilot program actions included weekly inspections; excrement removal; raking tideline algae; adjusting mowing, fertilization, and watering schedules at adjoining parks; goose population control (addling eggs); and public outreach. To date, based on the pilot program, the annual cost is $20,000 per beach (Rudnicki 2015). To allow for contingencies and beach-specific added costs, such as increased goose activity, public outreach, mileage costs, inter-agency coordination, the annual cost range for controlling wildlife at a beach is $20,000 to $40,000.
11.4.4 Vessels (Recreational, Anchor-out, Live-aboard Boats) Where vessel pumpout stations are a suspected source of bacteria, marina owners would need to inspect the existing sewage pumpout and dump stations at marinas. This
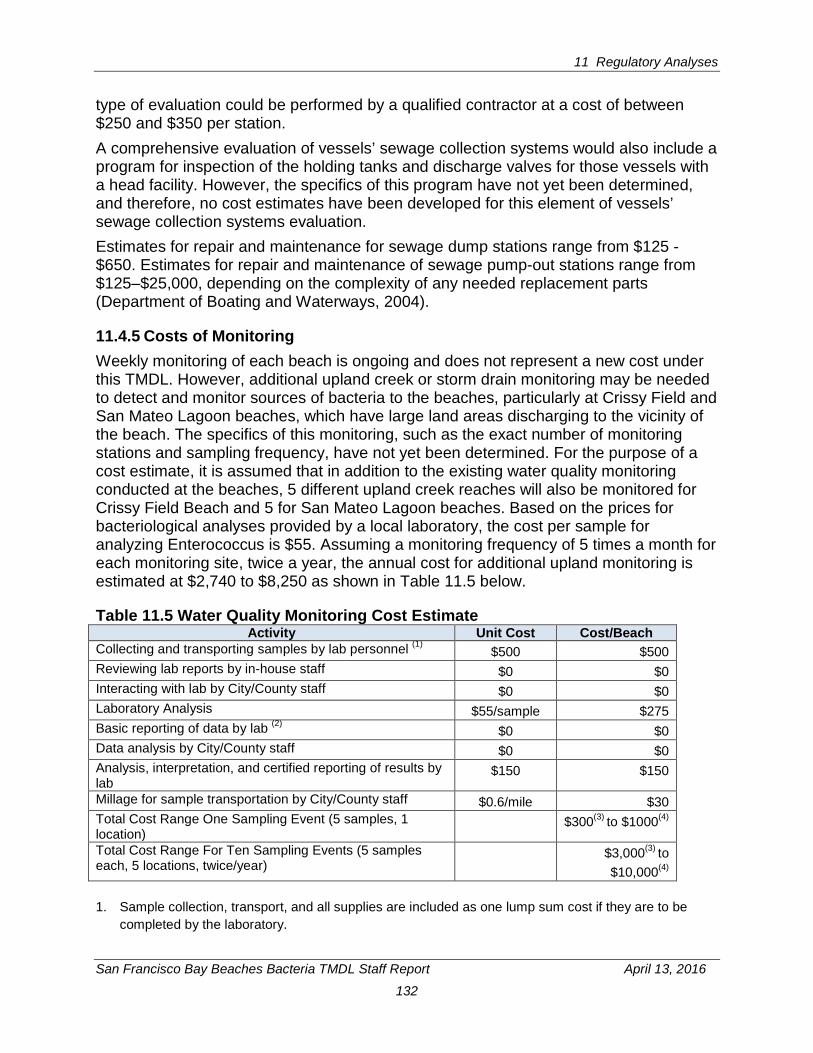
11 Regulatory Analyses
San Francisco Bay Beaches Bacteria TMDL Staff Report April 13, 2016
132
type of evaluation could be performed by a qualified contractor at a cost of between $250 and $350 per station. A comprehensive evaluation of vessels’ sewage collection systems would also include a program for inspection of the holding tanks and discharge valves for those vessels with a head facility. However, the specifics of this program have not yet been determined, and therefore, no cost estimates have been developed for this element of vessels’ sewage collection systems evaluation. Estimates for repair and maintenance for sewage dump stations range from $125 -$650. Estimates for repair and maintenance of sewage pump-out stations range from $125–$25,000, depending on the complexity of any needed replacement parts (Department of Boating and Waterways, 2004).
11.4.5 Costs of Monitoring Weekly monitoring of each beach is ongoing and does not represent a new cost under this TMDL. However, additional upland creek or storm drain monitoring may be needed to detect and monitor sources of bacteria to the beaches, particularly at Crissy Field and San Mateo Lagoon beaches, which have large land areas discharging to the vicinity of the beach. The specifics of this monitoring, such as the exact number of monitoring stations and sampling frequency, have not yet been determined. For the purpose of a cost estimate, it is assumed that in addition to the existing water quality monitoring conducted at the beaches, 5 different upland creek reaches will also be monitored for Crissy Field Beach and 5 for San Mateo Lagoon beaches. Based on the prices for bacteriological analyses provided by a local laboratory, the cost per sample for analyzing Enterococcus is $55. Assuming a monitoring frequency of 5 times a month for each monitoring site, twice a year, the annual cost for additional upland monitoring is estimated at $2,740 to $8,250 as shown in Table 11.5 below.
Table 11.5 Water Quality Monitoring Cost Estimate Activity Unit Cost Cost/Beach
Collecting and transporting samples by lab personnel (1) $500 $500 Reviewing lab reports by in-house staff $0 $0 Interacting with lab by City/County staff $0 $0 Laboratory Analysis $55/sample $275 Basic reporting of data by lab (2) $0 $0 Data analysis by City/County staff $0 $0 Analysis, interpretation, and certified reporting of results by lab
$150 $150
Millage for sample transportation by City/County staff $0.6/mile $30 Total Cost Range One Sampling Event (5 samples, 1 location)
$300(3) to $1000(4)
Total Cost Range For Ten Sampling Events (5 samples each, 5 locations, twice/year)
$3,000(3) to $10,000(4)
1. Sample collection, transport, and all supplies are included as one lump sum cost if they are to be
completed by the laboratory.
11 Regulatory Analyses
San Francisco Bay Beaches Bacteria TMDL Staff Report April 13, 2016
133
2. Basic reporting of results is included in the sample analysis cost and is expected to be sufficient for the purposes of the proposed monitoring.
3. Estimated cost if sample collection and transportation, and data analysis is conducted by City/County staff.
4. Estimated cost if samples collection and transportation and data analysis and certified reporting is conducted by the lab personnel.
12 References
San Francisco Bay Beaches Bacteria TMDL Staff Report April 13, 2016
134
12 REFERENCES
1. ACCWP Clean Water Program Alameda County. 2012. C.3 Stormwater Technical Guidance. A handbook for developers, builders and project applicants. May 29, 2012. Pg. 6-4. Available at: http://cleanwaterprogram.org/uploads/C3TG%20Version%204%20Chapter%206.pdf
2. Ahn, J. H., S. B. Grant, et al., 2005. Coastal Water Quality Impact of Stormwater Runoff from an Urban Watershed in Southern California. Environmental Science and Technology. 2005, 39, 5940.
3. Alford, S., Port of San Francisco, Regulatory Specialist. Email correspondence. April 28, 2015.
4. American Society of Civil Engineers (ASCE), 2014. Pathogens in Urban Stormwater Systems. August 2014. Page 22. Available at http://www.udfcd.org/downloads/pdf/tech_papers/PathogensUrbanStormwaterSystems_Aug2014.pdf.
5. Bannerman, R.T., D.W. Owens, et al. 1993. Sources of Pollutants in Wisconsin Stormwater. Wat. Sci. Tech. Vol. 28, No. 3-5, pp. 241-259, 1993. Page 17.
6. Bay Area Air Quality Management District (BAAQMD). 2012. BAAQMD CEQA Air Quality Guidelines. Pp. C-9, C-10. Available online at: http://www.baaqmd.gov/Divisions/Planning-and-Research/Planning-Programs-and-Initiatives/~/media/8C1411130E9947DC939B618A43732FCF.ashx
7. Boehm, A. 2012. Re: SIPP update. Stanford University. Email to MKellogg, SFPUC. March 23, 2012.
8. Braun, C., B. Steets, et al., Geosyntec Consultants. 2012. San Diego River Watershed Comprehensive Load Reduction Plan, Appendix F. Identification of Nonstructural BMP Types. County of San Diego Reference: Task Order 7. May 17, 2012. Pages 18-19.
9. Cabelli, V.J., et al. 1982. Swimming-Associated Gastroenteritis and Water Quality. American Journal of Epidemiology, Vol. 115, Issue 4. Pp. 606-616.
10. California Stormwater Quality Association (CASQA). 2003. California Stormwater BMP Handbook: New Development and Redevelopment. January 2003. Pp. 2-9 to 2-12.
11. Chow, B., 2015. RE: storm water runoff and sanitary wastewater collection systems at Palace of Fine Arts. San Francisco Recreation and Parks Department. Email, March 31, 2015.
12. City of San Mateo. 2009. General Plan Update, Draft Environmental Impact Report. Page 4.8-9. July 2009. Available at <http://www.cityofsanmateo.org/DocumentCenter/Home/View/5218>. Accessed February 11, 2013.
13. City of San Mateo. 2012. Administrative Report to Public Works Commission, Marina Lagoon Update. July 11, 2012. Available at <http://www.cityofsanmateo.org/DocumentCenter/Home/View/10999>. Accessed February 11, 2013.
14. City of San Mateo. 2012b. 2012 Clean Beaches Implementation (Round 1) Application. Submitted to the California State Water Resources Control Board’s Financial Assistance Application Submittal Tool at http://faast.waterboards.ca.gov/.
12 References
San Francisco Bay Beaches Bacteria TMDL Staff Report April 13, 2016
135
15. City of San Mateo. 2013a. Marina Lagoon description web page, <http://www.cityofsanmateo.org/index.aspx?nid=1064>. Accessed January 24, 2013.
16. City of San Mateo. 2013b. Annual Workplan for Marina Lagoon web page, <http://www.cityofsanmateo.org/index.aspx?NID=1065>. Accessed January 24, 2013.
17. City of Santa Barbara and University of CA, Santa Barbara. 2012. Tools for Tracking Human Fecal Pollution in Urban Storm Drains, Creeks, and Beaches. September 1, 2012. Available at http://www.santabarbaraca.gov/civicax/filebank/blobdload.aspx?BlobID=16722. Accessed December 2, 2015.
18. CIWQS 2015. California Integrated Water Quality System (CIWQS) Online SSO Database. Available at http://ciwqs.waterboards.ca.gov/. Accessed June 18, 2015.
19. Clary, et al. 2008. Can Stormwater BMPs Remove Bacteria? New Findings from the International Stormwater BMP Database. Available at: http://www.udfcd.org/downloads/pdf/tech_papers/Can%20Stormwater%20BMPs%20Remove%20Bacteria.pdf.
20. Cleary, E. 1994. Waterfowl. The Handbook: Prevention and Control of Wildlife Damage. Paper 74. Available at: http://digitalcomons.unl.edu/icwdmhandbook/74.
21. Department of Boating and Waterways. 2004. Report and Recommendations for Vessel Waste Disposal Facilities for Region 2 Marinas and Harbors, Excluding Tomales Bay. Report to the State Water Resources Control Board. August 2, 2004.
22. Department of Boating and Waterways and the San Francisco Estuary Project. 2005. Boater’s Pumpout Map and Guide.” Page 2.
23. Department of Boating and Waterways. 2011/ 2007-2009 California Boater Survey Report. Prepared by Godard, D. and R. Browning. July 2011.w
24. Devinny, J.S., S. Kamieniecki, and M. Stenstrom. 2004. Alternative Approaches to Storm Water Quality Control. Included as App. H to Currier et al. “NPDES Stormwater Cost Survey” (2005). Pp. 61-63.
25. Geosyntec Consultants. 2012. San Diego River Watershed Comprehensive Load Reduction Plan, Appendix E: Non-Structural BMP Memo. Prepared for the County of San Diego, the Cities of El Cajon, La Mesa, Santee, San Diego, and the California Department of Transportation.
26. Gerba, C.P. and J.S. McLeod. 1976. Effect of Sediment on the Survival of Escherichia coli in Marine Waters. Applied and Environ. Microbiology. July 1976. Pp. 114-120.
27. Godard, D., and R. Browning. 2011. 2007-2009 California Boater Survey Report. San Francisco State University Public Research Institute. San Francisco, CA. Pages 30, 33-35, 41. Available at http://www.coastal.ca.gov/ccbn/FinalCABoatersReport_July2011_DG.pdf. Accessed September 18, 2014.
28. Goering, R., CA State Parks, Peace Officer Supervisor – Mount Tamalpais, Olompali & China Camp State Parks. Personal communication. July 15, 2013.
29. Griffith, J., et al. 2013. The California Microbial Source Identification Manual: A Tiered Approach to Identifying Fecal Pollution Sources to Beaches. Southern California Coastal Water Research Project Technical Report 804. December 2013. Pp. 7-33.
12 References
San Francisco Bay Beaches Bacteria TMDL Staff Report April 13, 2016
136
30. Hathaway, J.M., W.F. Hunt and O.D.Simmons III. 2010. Statistical Evaluation of Factors Affecting Indicator Bacteria in Urban Storm-Water Runoff. Journal of Environmental Engineering 136: 1360-1368. December 2010.
31. Havelaar A.H. 1993. Bacteriophages as models of human enteric viruses in the environment. Journal of American Society of Microbiology News 59, No. 12: 614–619.
32. Heal the Bay. 2015. Heal the Bay’s 2014-2015 Annual Beach Report Card. Pages 41, 42, 48. Available at http://www.healthebay.org/sites/default/files/pdf/beachreportcard/1_BRC_2015_Beach_Report_Card_%28full%29.pdf.
33. Hurley, M., Presidio Trust, Associate Director for Infrastructure Management Services. Personal communication, January 10 and 31, 2013.
34. International Stormwater BMP Database. 2014. Version 12 30 2014. Developed by Wright Water Engineers, Inc. and Geosyntec Consultants for the Water Environment Research Foundation, the American Society of Civil Engineers/Environmental and Water Resources Institute, the American Public Works Association, the Federal Highway Administration, and U.S. EPA.
35. Internet Center for Wildlife Damage Management. 2015. Available at www.icwdm.org. Accessed December 1, 2015.
36. Los Angeles Regional Water Quality Control Board (LARWQCB). 2010. Total Maximum Daily Loads for Indicator Bacteria in Santa Clara River Estuary and Reaches 3, 5, 6 and 7. Los Angeles, California. July 10, 2010. Available online at: http://www.waterboards.ca.gov/losangeles/water_issues/programs/tmdl/tmdl_list.shtml
37. Low Impact Development Center. 2015. Urban Design Tools Website. http://www.lid-stormwater.net/permpaver_costs.htm. Accessed November 5, 2015.
38. McCoy, M., Wolosoff, S., Dresser, C., Susilo, M.K, Rathfelder, K., Leisenring, M., Poresky, A. 2006. Technical memorandum Task 7.2: Wet weather treatment plan. Memo to Hernandez, Carolina, County of Los Angeles Watershed Management Division. CDM Technical Memorandum. May 15, 2006. Pp. 13-14.
39. McDowell, K. and J. Patton. 2004. Report and Recommendations for Vessel Waste Disposal Facilities for Region 2 Marinas and Harbors, Excluding Tomales Bay. Submitted to the Department of Boating and Waterways. July 23, 2004. Pages 1-5.
40. MEC – Weston Solutions, Inc. 2004. San Diego River-Ocean Beach Water Quality Improvement Project – Phase II Kelp and Dog Waste Management Plan Final Report. Prepared for City of San Diego. September 2004.
41. Morris, J., San Francisco Maritime National Historic Park, Shipwright, Aquatic Park Cove Harbormaster. Personal communication, July 15, 2013a.
42. Morris, J., San Francisco Maritime National Historic Park, Shipwright, Aquatic Park Cove Harbormaster. Email to J. O’Hara, SF Bay Regional Water Quality Control Board, July 29, 2013b.
43. O’Reilly, G., Maintenance Chief, California State Parks. Personal communication, August 3, 2015.
44. Pitt, R., Clark, S. 2010. Evaluation of Biofiltration Media for Engineered Natural treatment Systems. May 10, 2010. Pp. 154-158.
12 References
San Francisco Bay Beaches Bacteria TMDL Staff Report April 13, 2016
137
45. Presidio Trust. 2012. Mountain Lake East Arm, YMCA Reach, and Quartermaster Marsh Monitoring Plan for Wetland Mitigation Project. February 14, 2012. Pp. 1-3.
46. Preusser, S., et al. 2008. Evaluation of an Integrated Non-Lethal Canada Goose Management Program in New York (2004-2006). Proceedings of 23rd Vertebrate Pest Conference, R.M.Timm and M.B.Madon, Eds. Publiches at University of California-Davis. 2008. Pp. 66-73.
47. Rippy, M.A., R. Stein, et al. 2014. Small Drains, Big Problems: The Impact of Dry Weather Runoff on Shoreline Water Quality at Enclosed Beaches. Southern California Coastal Research Program #0838. Accepted by Envir. Sci. & Tech. Nov. 10, 2014. Pg. H.
48. Rudnicki, C., 2014. Marina Lagoon Water Quality Progress Report, Meeting Minutes, and Data. Informational report to the City of San Mateo. December 1, 2014.
49. Rudnicki, C., 2015. Marina Lagoon Pathogen Control Program. Informational report to the City of San Mateo. Undated.
50. San Francisco Baykeeper. 2006. Assessment of Fecal Indicator Bacteria Levels and Basic Water Quality Parameters at Four Marinas in the San Francisco Bay. March 30, 2006.
51. Scheidt, S., 2014. DRAFT Goose Poop Annual Report. Informal report to the City of San Mateo. December 1, 2014.
52. Scheidt, S., 2015. City of San Mateo Comments Regarding Draft Staff Report for Proposed Basin Plan Amendment. September 15, 2015.
53. SFBRWQCB (San Francisco Bay Regional Water Quality Control Board). 2013. City and County of San Francisco Southeast Water Pollution Control Plant, North Point Wet Weather Facility, Bayside Wet Weather Facilities, and Wastewater Collection System NPDES Permit. NPDES No. CA0037664, Order No. R2-2013-0029.
54. SFBRWQCB. 2015. Executive Officer’s Report. Oakland, California. June 3, 2015. Pp. 6-7. Available online at: http://www.waterboards.ca.gov/sanfranciscobay/board_info/agendas/2015/June/4_eoreport.pdf http://www.swrcb.ca.gov/sanfranciscobay/basin_planning.shtml - 2004basinplan
55. SFBRWQCB. Undated. Water Quality Control Plan for the San Francisco Bay Basin. Oakland, California. Table 4-1. Available online at: http://www.swrcb.ca.gov/sanfranciscobay/basin_planning.shtml#2004basinplan
56. SFPUC (San Francisco Public Utilities Commission). 2012. Special Study: Overflow Impacts and Efficacy of Combined Sewer Overflow Controls for the San Francisco Bayside System. Southeast Water Pollution Control Plant, North Point Wet Weather Facility & Bayside Wet Weather Facilities, NPDES No. CA0037664. June 29. Pp. 18-19.
57. Shergill, S. and R. Pitt. 2004. Quantification of Escherichia Coli and Enterococci Levels in Wet Weather and Dry Weather Flows. Water Environment Federation Conference Proceedings. WEFTEC 2004: Session 61-70. Pp. 1-2. Available online at: http://water.epa.gov/polwaste/npdes/stormwater/upload/sw_idde_bacteria.pdf
58. Smith, G. 2012. San Mateo County Environmental Health, Supervisor of Water Protection & Land Use Programs. Personal communication, October 3, 2012.
59. Smith, M. 2014. San Rafael Sanitation District. Email to Janet O’Hara, SFBRWQCB. January 24, 2014.
12 References
San Francisco Bay Beaches Bacteria TMDL Staff Report April 13, 2016
138
60. State Board (State Water Resources Control Board). 2004. Water Quality Control Policy for Developing California’s Clean Water Act Section 303(d) List. September 2004. Pp. 11-26. Available at: http://www.waterboards.ca.gov/water_issues/programs/tmdl/docs/ffed_303d_listingpolicy093004.pdf
61. Stein, E.D. and L.L. Tiefenthaler. 2005. Dry-Weather Metals and Bacteria Loading in an Arid, Urban Watershed: Ballona Creek, California. Water, Air, and Soil Pollution 164:367-382.
62. Stein, E.D., et al. 2007. Sources, Patterns and Mechanisms of Storm Water Pollutant Loading from Watersheds and Land Uses of the Greater Los Angeles Area, California, USA. Southern Technical Report 510. California Coastal Water Research Project. March 20, 2007. Page i-v.
63. Taylor, Z., San Francisco Recreation and Parks Department. Personal conversation, March 27, 2015.
64. Underwood, B. 2015. 2014 Annual Report Submittal Cease and Desist Order No. R2-2009-0020. City of San Mateo Department of Public Works. May 12, 2015.
65. United States of America, et al. vs. East Bay Municipal Utility District. 2014. Consent Decree – Case Nos. C09-05684 filed 7/28/2014. Appendix C only.
66. U.S. Environmental Protection Agency (U.S. EPA). 1986. Ambient Water Quality Criteria for Bacteria. Washington, D.C.
67. U.S. EPA. 2001. Protocol for Developing Pathogen TMDLs. First Edition: January 2001. Chapters 1 – 6.
68. U.S. EPA. 2002. Draft Implementation Guidance for Ambient Water Quality Criteria for Bacteria. May 2002, Draft. EPA-8230-B-02-003. Washington, DC: Office of Water.
69. U.S. EPA. 2007. Report of the Experts Scientific Workshop on Critical Research Needs for the Development of New or Revised Recreational Water Criteria. March 26-30, 2007. EPA 823-R-07-006. http://www.epa.gov/waterscience/criteria/recreation/
70. U.S. EPA. 2009. Review of Zoonotic Pathogens in Ambient Waters. EPA-822-R-09-002. February 2009. Page 49.
71. U.S. EPA. 2011. 2010 California 303(d) List of Water Quality Limited Segments. Available at <http://www.waterboards.ca.gov/water_issues/programs/tmdl/2010state_ir_reports/category5_report.shtml>, accessed February 11, 2013. Follow link for the beach of interest. U.S. EPA Final Approval: October 11, 2011.
72. U.S. EPA. 2012. Office of Water Fact Sheet: 2012 Recreational Water Quality Criteria. EPA-820-F-12-061. December 2012. Available online at: http://water.epa.gov/scitech/swguidance/standards/criteria/health/recreation/upload/factsheet2012.pdf
73. U.S. EPA Region 9. 2012. Long Beach City Beaches and Los Angeles River Estuary Total Maximum Daily Loads for Indicator Bacteria. March 26, 2012.
74. Urban Water Resources Research Council (UWRRC). 2014. Pathogens in Urban Stormwater Systems. Environmental and Water Resources Institute, American Society of Civil Engineers. August 2014. Pages 84-90, 149, 150, 152.
http://www.waterboards.ca.gov/water_issues/programs/tmdl/2010state_ir_reports/category5_report.shtml
12 References
San Francisco Bay Beaches Bacteria TMDL Staff Report April 13, 2016
139
75. Ward, K., Golden Gate National Recreation Area, National Park Service, Biologist. Personal communication, January 10, 2013.
76. Weston Solutions. 2010a. San Diego River Source Tracking Investigation – Phase II, Final Report. Prepared for City of San Diego Storm Water Department. San Diego, CA. 2009.
77. Weston Solutions. 2010b. Tecolote Creek Microbial Source Tracking Summary: Phases I, II,and II. Prepared for City of San Diego Storm Water Department. San Diego, CA. 2010.
78. Wright Water Engineers, Inc. and Geosyntec Consultants. 2010. International Stormwater BMP Database – Pollutant Category Summary: Fecal Indicator Bacteria. December 2010. Page 16.
79. Yamahara, K.M., et al. 2009. Growth of Enterococci in Unaltered, Unseeded Beach Sands Subjected to Tidal Wetting. Applied and Environmental Microbiology. March 2009. Page 1517.
80. Young, K., E.Thackston. 1999. Housing Density and Bacterial Loading in Urban Streams. Journal of Environmental Engineering. December 1999.