Battery Selection, Safety, and Monitoring in Mobile ... 1 - Battery Selection... · Battery...
16
1-1 Battery Selection, Safety, and Monitoring in Mobile Applications Yevgen Barsukov, Texas Instruments ABSTRACT The battery is often considered by engineers as a constant voltage source that does not require any second thought. However, battery is in fact a little portable chemical factory with limited available resources. Because of that it has a complicated voltage response to an applied load that can sometimes affect device performance, and limited run-time that depends on the type of the load on the system. This paper describes in detail all considerations in selecting a battery for a specific application. The requirements to the electronics that services the battery, namely charger and safety devices, are also reviewed. This paper also summarizes the best handling practices depending on particular chemistry for most common rechargeable battery types. I. BATTERY FUNDAMENTALS AND ELECTRICAL BEHAVIOR UNDER DC AND TRANSIENT CONDITIONS Portable batteries share the same general principles with primary batteries as well as other electrochemical power sources such as fuel- cells. They consist of two electrodes that are electrically connected to active materials, immersed in electrolyte with porous separator placed between them to prevent electric contact, but allow ionic flow. Schematic of a common battery arrangement is given in Fig. 1. V CH R Cathode Anode V DIS V CH V DIS + - Separator e- C+ Electrolyte Fig. 1 Schematic of an electrochemical power source. The positive (+) electrode, called the cathode in batteries, is connected to an aggressive oxidizing material that is capable of ripping electrons from other materials. One example of a common oxidizing material is oxygen (which is indeed used in cathodes of fuel-cells) but in batteries solid oxidizing materials such as MnO 2 and NiO(OH) 2 are used. The negative (-) electrode, called the anode in batteries, is connected to a strong reducing material, that is rich in electrons which are easily released. These materials are similar to fuel in its function. Indeed some common fuels like natural gas can be used as an anode agent of fuel-cells. In batteries it is more practical to use solid fuels, such as Cd or Zn metals, or more exotic lithium intercalated into graphite. Both rechargeable and primary batteries have a fixed amount of active materials, which are physically attached to the electrodes. Active material of fuel cells are either gas or liquid, therefore more material can be added to replace the used one. Material in primary batteries either changes its crystalline structure or becomes electrically disconnected from electrodes during discharge, therefore making recharging impossible. A rechargeable battery retains its crystal structure and electric connecting over many charge and discharge cycles, but eventually degrades.
Transcript of Battery Selection, Safety, and Monitoring in Mobile ... 1 - Battery Selection... · Battery...

1-1
Battery Selection, Safety, and Monitoring in Mobile Applications
Yevgen Barsukov, Texas Instruments
ABSTRACT
The battery is often considered by engineers as a constant voltage source that does not require any second thought. However, battery is in fact a little portable chemical factory with limited available resources. Because of that it has a complicated voltage response to an applied load that can sometimes affect device performance, and limited run-time that depends on the type of the load on the system. This paper describes in detail all considerations in selecting a battery for a specific application. The requirements to the electronics that services the battery, namely charger and safety devices, are also reviewed. This paper also summarizes the best handling practices depending on particular chemistry for most common rechargeable battery types.
I. BATTERY FUNDAMENTALS AND ELECTRICAL BEHAVIOR UNDER DC AND TRANSIENT
CONDITIONS Portable batteries share the same general principles with primary batteries as well as other electrochemical power sources such as fuel-cells. They consist of two electrodes that are electrically connected to active materials, immersed in electrolyte with porous separator placed between them to prevent electric contact, but allow ionic flow. Schematic of a common battery arrangement is given in Fig. 1.
VCH
R
Cathode Anode
VDIS
VCH
VDIS
+ -
Separator
e-
C+
Electrolyte
Fig. 1 Schematic of an electrochemical power source.
The positive (+) electrode, called the cathode in batteries, is connected to an aggressive oxidizing material that is capable of ripping electrons from other materials. One example of a common oxidizing material is oxygen (which is indeed used in cathodes of fuel-cells) but in batteries solid oxidizing materials such as MnO2 and NiO(OH)2 are used.
The negative (-) electrode, called the anode in batteries, is connected to a strong reducing material, that is rich in electrons which are easily released. These materials are similar to fuel in its function. Indeed some common fuels like natural gas can be used as an anode agent of fuel-cells. In batteries it is more practical to use solid fuels, such as Cd or Zn metals, or more exotic lithium intercalated into graphite.
Both rechargeable and primary batteries have a fixed amount of active materials, which are physically attached to the electrodes. Active material of fuel cells are either gas or liquid, therefore more material can be added to replace the used one. Material in primary batteries either changes its crystalline structure or becomes electrically disconnected from electrodes during discharge, therefore making recharging impossible. A rechargeable battery retains its crystal structure and electric connecting over many charge and discharge cycles, but eventually degrades.

1-2
From an electrical point of view, batteries are often represented either as simply a voltage source, or as voltage source connected in series with a resistor representing internal resistance of the battery. Constant voltage presentation is accurate only for given state of charge of the battery with zero current. When battery is charged or discharged, its open circuit voltage changes, therefore it can be electrically represented as a capacitor with variable capacitance.
When current is flowing in or out of the battery, the battery terminal voltage is described in Equation (1).
RIVV OCV •−= (1)
where • R is the internal resistance • VOCV is the open circuit voltage at given
state of charge However, this presentation is only accurate
after current has been flowing for very long time (typically over 1 hour) so that all relaxation processes in batteries are finished. The voltage response of a battery is compared to that of a capacitor in Fig. 2.
0
3.84
3.831000 2000 3000 4000
3.86
3.85
3.88
3.87
3.90
3.89
I × R
ON
OFF
Battery
CapacitorCapacitor + Resistor
T – Time - s
Volta
ge -
V
Fig. 2 Voltage response to a step load current applied to a capacitor, capacitor with a series resistor and a battery.
As seen in Fig. 2, linear voltage decrease of voltage is observed for a capacitor when discharge current is passed. If a serial resistor is added to the capacitor, voltage immediately drops by IR value after current onset, and return to no resistor voltage level after current is removed. Battery voltage response to the current step is delayed, but after some time it approaches the behavior of a capacitor with a serial resistor. After termination of current, the battery voltage does not immediately return to no current state, but slowly increases until eventually it reaches the level of equivalent capacitor voltage which is the open circuit voltage.
A battery is not a simple capacitor because the electron transfer between materials has to go through many different electrical and chemical stages. Electrical stages include electrons moving between particles and ions moving in the pores. Chemical stages are the reaction on the particle surface and diffusion inside particles of the electrode material. Fig. 3 (a) helps to describe the current conducting path in the batteries.
CO
BAT-CC2
RSER
CARA
CA2
BAT+
Cathode Anode
Electrolyte
Separator
RC
(a)
(b) Fig. 3. Presentation of battery conduction under variable load conditions.

1-3
In Fig 3(B), RC and RA are summary diffusion, conduction and charge transfer resistances for cathode and anode correspondingly. CC and CA are chemical charge storage capacitances and CE2 and CA2 are surface capacitances. RSER is serial resistance that includes electrolyte, current collectors and wires resistances.
Each stage is associated with its own time-constants, which causes complex electrical behavior. To represent battery transient behavior correctly, use an equivalent circuit rather than simple resistance. The simple circuit in Fig. 3 (b) is given as an example and is valid for time constants between 1 Hz and 1 MHz. For higher frequencies additional inductive and capacitive elements need to be added. Different battery types need to use different equivalent circuits if very accurate representation is required.
II. GENERAL BATTERY CHARACTERISTICS How batteries evaluated for a particular
application? Several characteristics are applicable to all batteries and allow comparison in this chapter.
A. Chemical Capacity The main question regarding battery
functionality in a portable application is how long is it going to last? The answer is determined by the amount of active materials, their specific capacity, and voltage characteristics. When battery is discharged, its voltage gradually decreases until it reaches the minimal voltage acceptable for the device called end of discharge voltage (EDV), or the voltage where continuing discharge causes damage to the battery. Integrating the passed charge during the discharge process allows measurement of the capacity, (QMAX) that can be discharged until EDV is reached. Voltage profile during a low-rate lithium ion battery discharge is illustrated in Fig. 4.
0
3.0
01 2 3 4 5 6
3.5
4.5
4.0
Capacity - Ah
Volta
ge -
V
EDV
QMAX
Fig. 4. Voltage profile during low rate discharge of battery.
B. Useable Capacity Battery voltage depends not only on its state
of charge, but also on the discharge current. This is caused by voltage drop IR due to battery internal resistance. This drop is higher at high currents, low temperatures, and for aged batteries which have increased resistance. How does it influence run-time? Minimal acceptable voltage is reached earlier, therefore reducing the useable capacity that the battery can deliver. This is illustrated at Fig. 5.

1-4
3.0
0 1 2 3 4 5 6
3.5
4.5
4.0
Capacity - Ah
Volta
ge -
V
I × R
QUSE
No Load
Load
QMAX
EDV
Fig. 5. Battery voltage profiles under load and without load.
The capacity that is integrated until voltage reaches EDV under load conditions is called useable capacity. Because it depends on current, it has to be evaluated specifically for each application. Note that internal resistance, R, depends on state of charge and increases at the end of discharge, therefore simple modeling assuming fixed R does not give accurate estimation of useable capacity. Also battery manufacturers often report battery impedance at 1 kHz. This value cannot be used as estimate for internal resistance at DC conditions, because low-frequency impedance (which corresponds to DC conditions) is typically 2-3 times higher than that 1 kHz.
The best way to estimate useable capacity is to make a test, or to refer manufacturer discharge curves at load comparable with expected application load.
C. Power Capability, Ragone Plot In order to evaluate how much energy can be obtained from the battery at different rates of discharge (in particular, at given power) a plot of energy density vs power density is often used. It is called a Ragone plot (see example in Fig. 6).
100
60 80 100 140 160 180 200
200
500
400
Energy Density – Wh/kg
Pow
er D
ensi
ty –
W/k
g
1200
300
Small Pouch CellCylindrical Cell
Fig. 6. Ragone plot comparing cylindrical cell with laminate pouch Li-ion cells.
Each battery has a critical power density where its useable energy starts dropping rapidly. This corresponds to currents causing almost immediate drop of voltage below EDV level. From this comparison can be derived that cylindrical cell has higher energy density at low rates, however at high rates the laminated pouch cell shows superior rate capability because its critical power is almost same as that of a cylindrical cell. Calculating the battery cell size needed for particular application should provide that the application power does not exceed 1/3 of the plots height. That ensures that load spikes or impedance increases with aging do not cause battery to go over the critical threshold.
D. Durability, Cycle Life Both the capacity and rate characteristics of new batteries changed as it ages. Changes can be summarized as loss of chemical capacity and impedance increase.
Capacity loss is caused for example because crystalline structure of rechargeable material starts to change. Particles can break up, became disconnected from bulk material and therefore can no longer participate in energy storage.

1-5
There are many other chemical degradation mechanisms that cause same overall effect of having less material available in the battery. Chemical capacity losses influence high-rate and low-rate applications equally.
Impedance increase is mostly caused by growth of passivating layers on the surface of active material particles. These layers decrease the conductive path for electrons the wires connecting them were being ground away. Other mechanism of impedance increase is loss of electrolyte in pores, thus decreasing ionic conductivity. Increase of battery impedance is most critical for the high-rate applications. Indeed, in applications like a TV remote control device or wristwatch, where currents are close to zero, IR drop remains negligible even as R is increasing. However in applications with rates of discharge of C/3 up to 1C rate (C rate means current causing full battery discharge in 1 hour, C/3 discharge in 3 hours) useable capacity loss because of impedance increases can be the main contributor to overall loss.
How much chemical capacity loss and impedance increase can be expected? The effect is different for different batteries. Commonly chemical capacity loss is much less than an impedance increase. Fig. 7 (b) shows voltage profiles for low-rate discharge during 100 cycles of a Li-ion battery. It can be seen that capacity at EDV of 3 V changes only by about 5%. However, a low frequency impedance change, shown on Fig. 7 (a) for the same 100 cycles is more than 60%. Note that change at low frequency part of the impedance (which is most important for DC discharge) is very large, while a 1-kHz impedance almost does not change. This highlights the importance of obtaining a low-frequency impedance for evaluating the battery aging (this can be done for example by looking at 10 or 100 seconds voltage response to load).
The top graphic (a) is impedance spectra measured from 10 mHz to 1 kHz after each 10 cycles of a 100 cycle test and the bottom graphic (b) are the voltage profiles measured during each cycle.
0.09
0.01 0.1 10 100 1000
0.12
0.24
0.21
f - Frequency – Hz(a)
Des
crip
tion
- Re(
Z) /
Ohm
10.06
0.18
Cycle 1
Cycle 100
0.15
f - Frequency – Hz(b)
Fig. .7 Results of C/10 rate discharge cycling test.

1-6
The rate of degradation in a particular application strongly depends on usage conditions, mainly voltage (state of charge) and temperature. Sometimes the effects of a state of charge can be opposite for different battery types. For example, a lead-acid battery benefits from being stored at high states of charge, while Li-ion battery prefers more mild conditions of lower voltages, as can be seen in Fig. 8.
0.5
0 100 200 500 600 700 800
1.0
2.5
2.0
Cycle Number
Cap
acity
- A
h
4000
1.5
Charge Current = 1.25 ADischarge: 2 A to 3 V TJ = 21°C
300
VIN = 4.1 V
VIN = 4.2 V
Expected 20%Capacity Loss
After 500 Cycles
Fig. 8. Degradation of capacity during cycling at different voltages.
E. Self Discharge Properties Batteries do not retain charge forever. There
are many ways charge can be lost, depending on battery chemistry and design. Here are a few of the main culprits of charge loss. • Parasitic conductance inside battery.caused
by dendrites growing during charge on the anode or defects in the separator which might short the electrodes.
• Shuttle molecules. Some molecules can become oxidized on cathode, diffuse to anode, became reduced there and come back to cathode.
• Recombination of oxygen-hydrogen. Some hydrogen development happens on the anode (water reduced) and oxygen development on anode (water oxidized). Gasses then react building water again.
• Impurities in electrolytes can get oxidized and reduced, discharging the anode and/or cathode independently from each other.
• In Li-ion batteries, electrolytes react with electrodes because of their extreme activity.
• In NiCd and NiMH batteries voltage depression (memory effect) reduces battery energy without reducing discharge capacity. The rate of self-discharge increases with
temperature because all reactions are accelerated and with battery age (cycles) and because fractured active material has a higher (more active) surface area. Fig. 9 describes temperature dependence of self-discharge of a NiMH battery. Note that exact rates are dependent on particular cell design.
Fig. 9. Temperature dependence of NiMH battery self discharge
F. Shelf Life Batteries degrade not only during cycling,
but also during storage. This makes cycle number a rather uncertain estimate of effective battery age in view of its performance.
Degradation with storage is highly dependent on storage conditions, mostly voltage and temperature. Fig. 10 shows degradation of Li-ion battery capacity with storage at different temperatures.

1-7
20
1 3 7 9 11 13
40
120
100
T - Time - Months
Rec
over
able
Cap
acity
- %
50
80
20°C at 4.1 V
60
20°C at 4.2 V
60°C at 4.1 V60°C at 4.2 V
Fig. 10. Capacity decrease after floating..[1]
III. MONITORING AND SAFETY Increased temperature can not only
accelerate degradation, but it can cause thermal run-away and battery explosion. This is a specific concern with an Li-ion battery because of its very aggressive active material. To give an example, Li/carbon intercalated compound reacts with water and the released hydrogen can be ignited by the heat of the reaction. Cathode material starts reacting with electrolyte when the temperature goes above the thermal run-away threshold. Fig. 11 shows heat output of Li-ion battery depending on temperature:
Other batteries are also capable of explosive self-heating, just because they store large amount of energy in small volume. Rapid temperature increase can happen if battery is overcharged at high current or shorted. During an overcharge of a Li-ion battery, very active metallic lithium is deposited on the anode. This material highly increases the danger of an explosion, because it can react with variety of materials including electrolyte and cathode material. Fig. 12 shows a result of such an overcharge event.
Fig. 1.1 Heat flow dependence on temperature of LiCoO2 charged to 4.3 V.[2]
Fig. 12. Battery pack explosion after overcharging.
Material developments are ongoing to increase thermal runaway temperature. However, it remains the responsibility of the system designer to provide for correct charging conditions as well as for possibility of multiple failures of electronic components which by design should still not cause catastrophic failure. Typically this means having at least two independent overvoltage and short-circuit protection circuits as part of battery pack. A more detailed discussion of protection circuits occurs in the Li-ion battery section.

1-8
IV. OVERVIEW OF DIFFERENT BATTERY TECHNOLOGIES
A. Lead Acid
Active materials and reactions Discharge
• Minimum 1.5V • The anode and cathodes are converted to
lead sulfate • The electrolyte is converted to water • This conversion reduces the electrolyte
density and this is why the density of the electrolyte can be used to determine the state of charge
• During use the electrolyte water can be lost by evaporation and must be replaced
Charge • Maximum 2.7V • The negative electrode is converted to
lead • The positive electrode is converted to
lead dioxide • Sulfuric acid is added to electrolyte • Minimum current charge termination can
be used • Possible to trickle-charge.
Reactions
Fig. 13. Typical lead-acid battery design.
1-9
Charging Method A lead-acid battery is very flexible in terms
of charging. There are two limitations: • The charging rate is limited by extensive
gassing and temperature. If neither is observed, the rate can be increased. Usually higher rates are acceptable at the beginning of charge.
• Voltage is limited by 2.65 V during high-current period of charge, but should not exceed 2.39 V/cell at 25°C if current is low. If these two conditions are satisfied, design
of the charger is limited more by hardware limitations (such are rate capability of power supply) than by battery limitations.
The most common charging methods are: 1. Constant current (CC). Current of about 12
hours (C/12) rate is applied. Charging is terminated when voltage exceeds 2.65 V/cell.
2. Two step constant current. A high rate of current (C/6) is applied for about 3 hours, and then later switched to lower rate (C/16) that continues for 8 hours. There is no voltage control in this case.
3. Constant current/constant voltage (CC/CV). Current of about 1C is applied until the voltage reaches 2.39 V/cell, then switching to constant voltage charging at the same voltage. Charging is terminated when the current drops below the rate of C/20.
4. Constant voltage. Voltage of 2.39 V/cell is applied to the cells directly. Current is limited by current capability of the power supply. Charging is terminated when the current drops below the rate of C/20. Note that if charging is not terminated and voltage is maintained indefinitely (like in case of back-up batteries) it is important to follow the temperature compensation of the float voltage. A compensation table (V/T) can be obtained from battery manufacturer. Method 3 is preferable as the fastest and
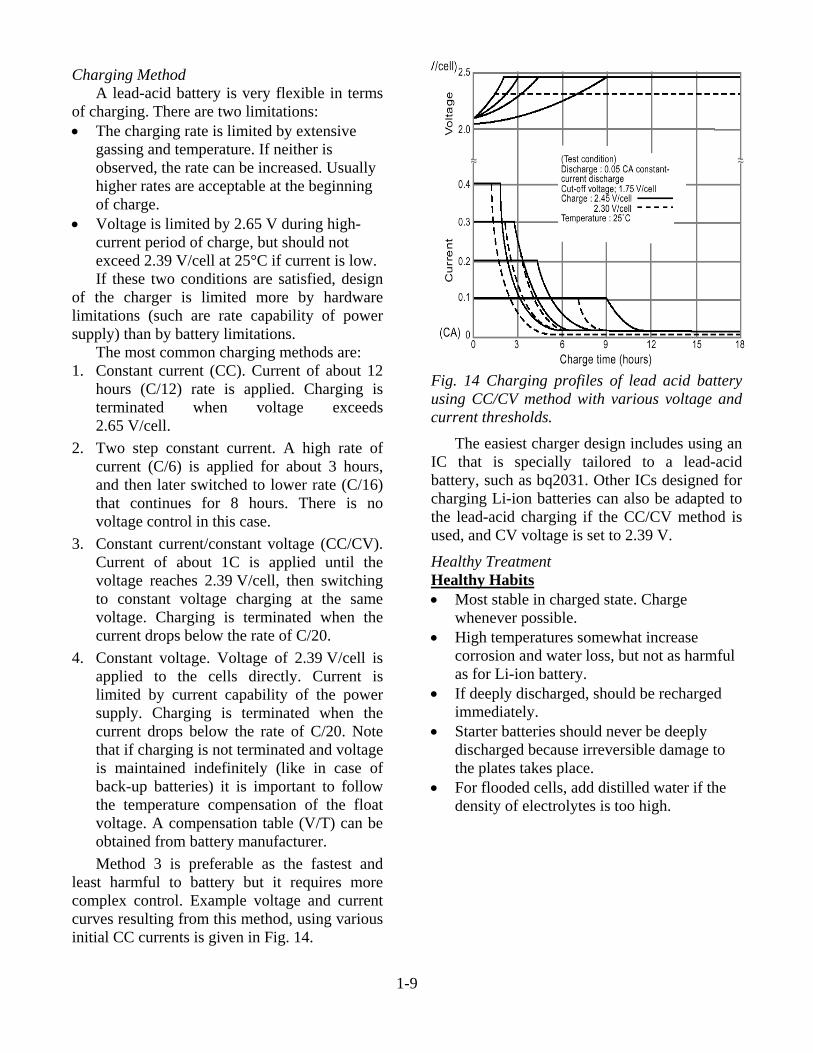
least harmful to battery but it requires more complex control. Example voltage and current curves resulting from this method, using various initial CC currents is given in Fig. 14.
Fig. 14 Charging profiles of lead acid battery using CC/CV method with various voltage and current thresholds.
The easiest charger design includes using an IC that is specially tailored to a lead-acid battery, such as bq2031. Other ICs designed for charging Li-ion batteries can also be adapted to the lead-acid charging if the CC/CV method is used, and CV voltage is set to 2.39 V.
Healthy Treatment Healthy Habits • Most stable in charged state. Charge
whenever possible. • High temperatures somewhat increase
corrosion and water loss, but not as harmful as for Li-ion battery.
• If deeply discharged, should be recharged immediately.
• Starter batteries should never be deeply discharged because irreversible damage to the plates takes place.
• For flooded cells, add distilled water if the density of electrolytes is too high.

1-10
Degradation Mechanisms • Sulfatation. A reduced form of anode
(PbSO4) is prone to growing large crystals which can be reduced only very slowly. Prevention – keep charged. Repair – charge at elevated voltage (2.5-2.6 V) for several days.
• Plate corrosion. Prevention – keep charged, but do not exceed temperature adjusted float voltage (2.4 V at room temperature). Repair – not possible
• Water loss. Prevention – do not overheat. Repair – in sealed not possible. Add distilled water if flooded.
Usual Applications • High power, stand-by • Automotive starter batteries • Deep-cycle batteries for electric cars • Back-up power. Popular because can be
trickle charge for long time without degradation.
B. Nickel Cadmium
Active Materials and Reactions Discharge • Minimum 0.7 V • The positive electrode is converted from
nickel oxyhydroxide to nickel hydroxide • The negative electrode is converted from
cadmium to cadmium hydroxide • The electrolyte is a water solution of
potassium hydroxide • The water in the electrolyte is converted to
hydroxide during discharge • The potassium hydroxide does not react and
is added for conductivity only Charge • Maximum 1.6 V • The reverse reaction occurs during charge. • Toward the end of charge the reaction
efficiency decreases. • Overcharge produces oxygen which then
produces heat as it exceeds the electrode recombination rate.
• Charge termination is -dV~10 mV, dT/dt~1°C/min. At low rate no –dV/dt occurs, and therefore termination by timer, or temperature of capacity count is needed.
Reactions
Construction Early NiCd battieries had designs similar to lead-acid batteries. This design is still used for large size batteries used for power backup. NiCd batteries used in portable electronics have their electrodes wound together, where NiOOH mixed with carbon black for higher conductivity is pressed upon Ni-mesh (cathode) and Cd-powder mixed with some amount of Cd(OH)2 is pressed on Ni-mesh making anode. Both electrodes are wound together with a separator (polyethylene non-woven fabric) and enclosed in a steel casing with a vent to release high-pressure. Typical design in shown in Fig. 15
Fig. 15 Typical design of NiCd and NiMH batteries
Charging Method NiCd batteries can only be charged with constant current method. The reason why a constant voltage method is not acceptable is because of a peculiar voltage decrease near the fully charged state. If CV method would be used, charging would never terminate because current near fully charged state would not decrease but increase. Charging profiles of NiCd battery at different rates are shown in Fig. 16.

1-11
Fig. 16 Charging profiles of NiCd battery
Charging rate can be from C/10 to C. As can be seen in Fig.16, voltage starts to decrease at the end of discharge. When voltage decrease is detected by observed negative dV/dt, charging is terminated. Note that termination should be disqualified for the beginning of charge, because during first 5 minutes of charge negative dV/dt is possible (impedance can decrease as some insulating layers break up). With lower than C/10 charging rate termination should be done using timer set to 12 to14 hours because voltage drop near fully charged state becomes less expressed at low rate, and also because overcharge at low rate is less dangerous. Alternatively, temperature rise at the end of discharge can be used for terminating charging.
Rate Capability NiCd batteries have excellent discharge rate
capabilities exceeding 10C rate, rivaled only by silver-zinc and most recent high-rate Li-ion batteries. Example of voltage response to different discharge rates is given in Fig. 17. It can be seen that at 3C rate battery delivers about 70% of rated capacity.
C. Nickel Metal-Hydride (NiMH)
Active materials and reactions Discharge • Minimal 0.7 V • The positive electrode is converted from
nickel oxyhydroxide to nickel hydroxide • The negative electrode is converted from a
metal hydride to metal plus water • The electrolyte is a weak solution of
potassium hydroxide • The water in the electrolyte is converted to
hydroxide during discharge • The potassium does not react
Charge • Maximal 1.6 V • The reverse reaction occurs during charge • When the metal is converted to a metal
hydride, heat is produced. Towards the end of the charge, the reaction efficiency decreases
• Overcharging produces oxygen which then produces heat as it exceeds the electrode recombination rate
• Charge termination occurs at peak voltage detection (PVD), using criteria dV/dt<-5 mV/min, or using temperature criteria dT/dt~1°C/min.It might not occur at low charge rate
• Construction of sealed NiMH used in portable electronics is similar to that of NiCd, except for the material of the anode, where hydrogen adsorbing alloy is used.
Reactions

1-12
Charging Method Charging of a NiMH battery is the same as
for a NiCd battery. In calculatiing the charging current value it is necessary to considered that for the same size, NiMH battery has about twice the capacity of NiCd battery. Because of that, chargers designed for AA (or other fixed format) NiCd batteries are not suitable for NiMH because they would undercharge them or charging would take too long (charge current too low).
Rate Capability NiMH batteries can be typically discharge at
up to a rate of 2C. They have higher internal resistance compared to NiCds, but the rate capability of some particular models can vary. The rate capability at low temperatures is somewhat degraded because of slower hydrogen reaction on anode surface. Use of catalysts can accelerate this reaction in particular models. If low-temperature performance is important in a particular application, the manufacturer-provided discharge curves used to check the rates for varying temperatures.
Healthy Treatment Healthy Habits • Most stable in discharged state. • If used in application needing prolonged
trickle-charge (stand-by), they should be periodically fully discharged because cathode material changes into inactive form if kept for long in charged state.
• Avoid high temperature as corrosion accelerates and charge efficiency drops
Degradation Mechanisms • Plate corrosion. Prevention – avoid high
temperatures. Repair – not possible. Faster than that of a NiCd.
• Voltage depression. Cathode material changes into inactive crystalline form when stored in charged state. Less expressed compared to NiCd because of newer technologies used in cathode material and electrolyte preparation. Prevention–discharge regularly. Repair:- charge and discharge several times to 0.7 V. For cases of severe capacity loss, keep at 0.7V for prolonged time (24 hrs)
Usual Applications • high capacity, long usage • consumer electronics • power tools • notebooks, mobile phones, PDAs
D. Lithium-Ion (Li-ion) Active Materials and Reactions Discharge • Minimum 2.7 V/cell • Li ions leave carbon matrix and are
adsorbed by LiCoO2 matrix Charge • Maximum 4.1 V or 4.2 V depending on
anode • Li ions are extracted from LiCoO2 and are
intercalated into carbon matrix.

1-13
Overall intercalation reaction is illustrated in Fig.18.
Fig. 18. Crystalline structure and schematic charge/discharge reactions of Li-ion inter-calation materials.
Construction Mechanical designs of Li-ion batteries can
be summarized as cylindrical, prismatic and laminated (pouch) cells. All designs have common characteristics. • Li-carbon intercalation compound is
extremely active, and therefore only organic electrolytes can be used.
• Contact of interiors with air or water destroys the battery, therefore casing and vent are designed to be extremely water and air resistant.
• All cells use a micro porous separator that prevents growth of Li-dendrites and shuts-down discharge in case of overheating.
• Electrodes use thin foils as current collectors. The anode is a Cu foil, and the cathode is an Al foil. Active materials are slurry-coated on the surface of current collectors as thin 50-µm to 100-µm films. The cylindrical design is similar to that of
NiCd battery. Electrodes are tightly wound together with a separator and placed in a robust steel casing. It typically includes a safety device (PTC) that shuts down discharge if current or temperature exceeds predefined thresholds (typically 2C rate and 75°C).
Prismatic design is similar to cylindrical design except that after winding the roll is compressed and placed in a prismatic aluminum casing. In some cases electrodes are stacked instead of winding. This provides for better rate capability, but is more labor intensive.
Laminate (pouch) design is similar to prismatic except that wound or stacked electrodes are glued together by either using thermoplastic separator or gelating additive to electrolyte. This gives the electrode stack mechanical stability even without external pressure, therefore no robust casing is needed. A flexible Al-coated polypropylene pouch is used instead of casing. This type of cell used to be called a Li-polymer battery, however because polymer electrolytes were found inferior to liquid electrolytes, only the pouch design was preserved, while mostly liquid electrolytes are now used.
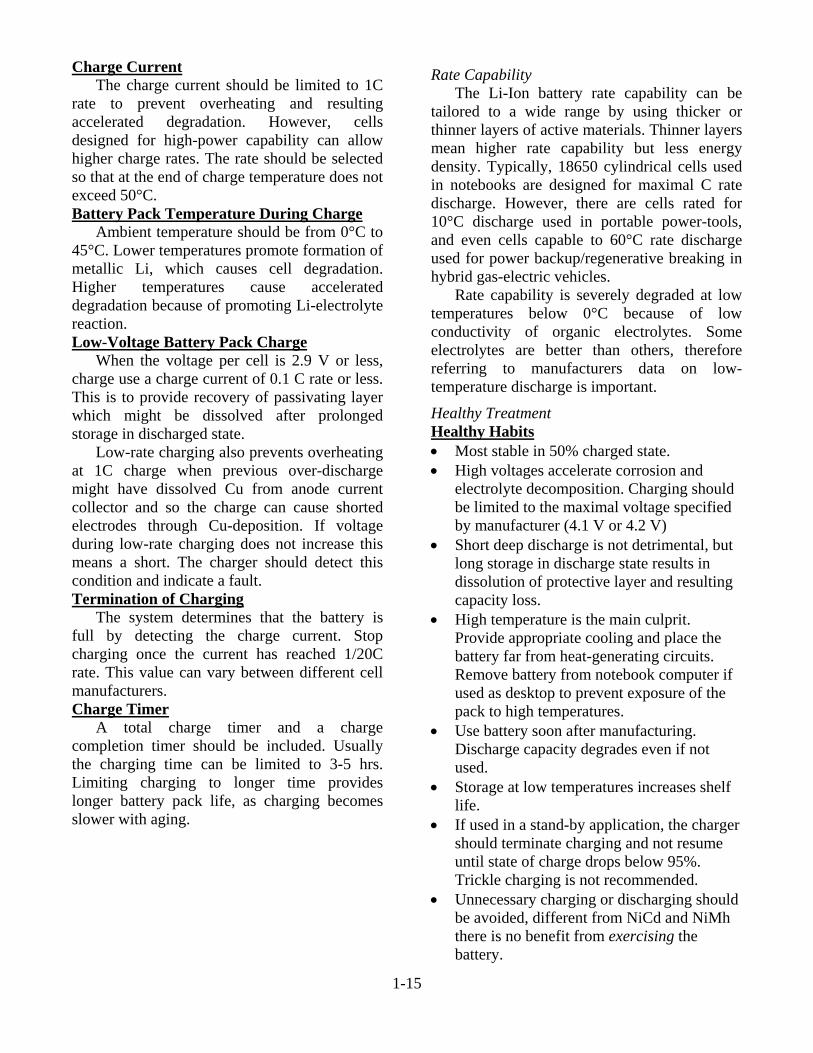
Charging Method Li-ion battery charging is performed by CC/CV method, illustrated in Fig. 19.
Fig. 19. Li-ion battery charging performed by CC/CV method.
1-14
Charge Voltage The voltage between the charging terminals should be no more than 4.20 V (Set this at 4.20 VMAX after taking into account fluctuations in power supply voltages, temperature deviations, etc.). The charge voltage varies according to model cell chemistry. Cells with coke based anodes use 4.1 V. Check manufacturers’ specifications for charging. It is extremely important that the charging voltage is not exceeded, as it can and will cause explosion. Cell Voltage Control
In case of state of charge (SOC) misbalance between serially connected cells, some cells can reach maximal charging voltage earlier than others. Therefore it is important to monitor each cell voltage separately, and terminate charging of the pack when highest cell voltage reaches unsafe region (4.25 V to 4.3 V).
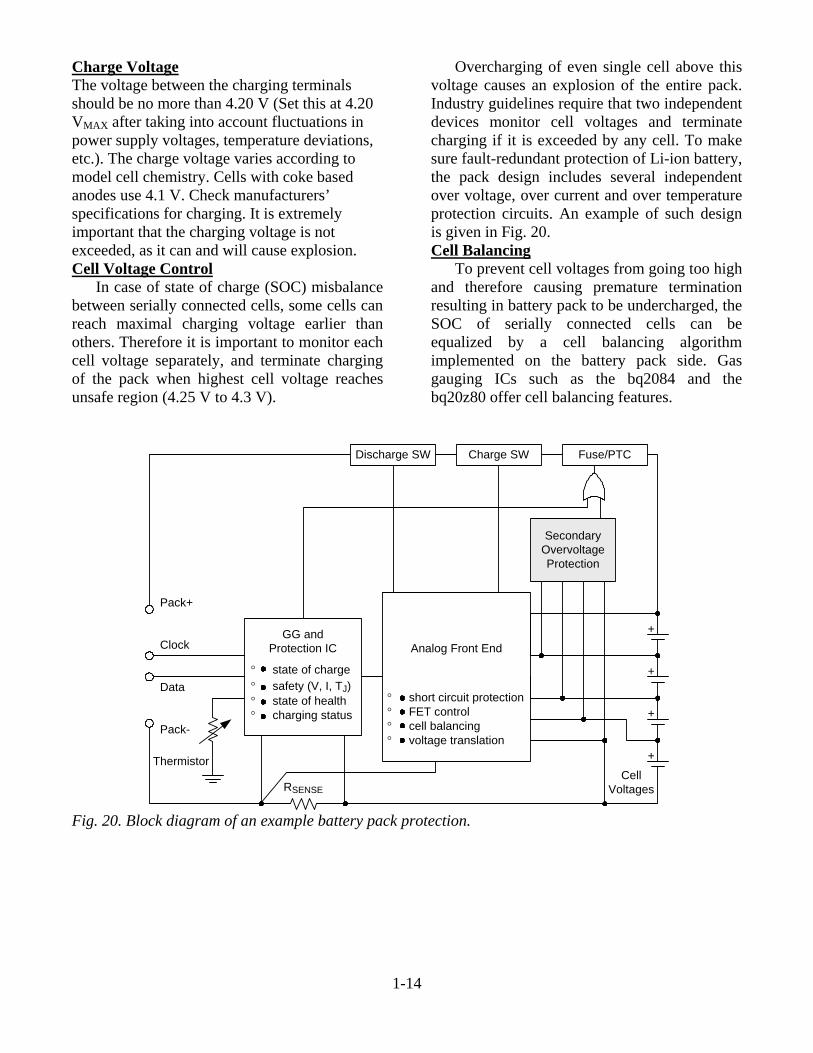
Overcharging of even single cell above this voltage causes an explosion of the entire pack. Industry guidelines require that two independent devices monitor cell voltages and terminate charging if it is exceeded by any cell. To make sure fault-redundant protection of Li-ion battery, the pack design includes several independent over voltage, over current and over temperature protection circuits. An example of such design is given in Fig. 20. Cell Balancing
To prevent cell voltages from going too high and therefore causing premature termination resulting in battery pack to be undercharged, the SOC of serially connected cells can be equalized by a cell balancing algorithm implemented on the battery pack side. Gas gauging ICs such as the bq2084 and the bq20z80 offer cell balancing features.
+
+
+
+
Secondary Overvoltage Protection
Analog Front End
° short circuit protection° FET control° cell balancing° voltage translation
RSENSE
GG and Protection IC
° state of charge° safety (V, I, TJ)° state of health° charging status
Cell Voltages
Fuse/PTCCharge SWDischarge SW
Thermistor
Pack+
Clock
Data
Pack-
Fig. 20. Block diagram of an example battery pack protection.
1-15
Charge Current The charge current should be limited to 1C
rate to prevent overheating and resulting accelerated degradation. However, cells designed for high-power capability can allow higher charge rates. The rate should be selected so that at the end of charge temperature does not exceed 50°C. Battery Pack Temperature During Charge
Ambient temperature should be from 0°C to 45°C. Lower temperatures promote formation of metallic Li, which causes cell degradation. Higher temperatures cause accelerated degradation because of promoting Li-electrolyte reaction. Low-Voltage Battery Pack Charge
When the voltage per cell is 2.9 V or less, charge use a charge current of 0.1 C rate or less. This is to provide recovery of passivating layer which might be dissolved after prolonged storage in discharged state.
Low-rate charging also prevents overheating at 1C charge when previous over-discharge might have dissolved Cu from anode current collector and so the charge can cause shorted electrodes through Cu-deposition. If voltage during low-rate charging does not increase this means a short. The charger should detect this condition and indicate a fault. Termination of Charging
The system determines that the battery is full by detecting the charge current. Stop charging once the current has reached 1/20C rate. This value can vary between different cell manufacturers. Charge Timer
A total charge timer and a charge completion timer should be included. Usually the charging time can be limited to 3-5 hrs. Limiting charging to longer time provides longer battery pack life, as charging becomes slower with aging.
Rate Capability The Li-Ion battery rate capability can be
tailored to a wide range by using thicker or thinner layers of active materials. Thinner layers mean higher rate capability but less energy density. Typically, 18650 cylindrical cells used in notebooks are designed for maximal C rate discharge. However, there are cells rated for 10°C discharge used in portable power-tools, and even cells capable to 60°C rate discharge used for power backup/regenerative breaking in hybrid gas-electric vehicles.
Rate capability is severely degraded at low temperatures below 0°C because of low conductivity of organic electrolytes. Some electrolytes are better than others, therefore referring to manufacturers data on low-temperature discharge is important.
Healthy Treatment Healthy Habits • Most stable in 50% charged state. • High voltages accelerate corrosion and
electrolyte decomposition. Charging should be limited to the maximal voltage specified by manufacturer (4.1 V or 4.2 V)
• Short deep discharge is not detrimental, but long storage in discharge state results in dissolution of protective layer and resulting capacity loss.
• High temperature is the main culprit. Provide appropriate cooling and place the battery far from heat-generating circuits. Remove battery from notebook computer if used as desktop to prevent exposure of the pack to high temperatures.
• Use battery soon after manufacturing. Discharge capacity degrades even if not used.
• Storage at low temperatures increases shelf life.
• If used in a stand-by application, the charger should terminate charging and not resume until state of charge drops below 95%. Trickle charging is not recommended.
• Unnecessary charging or discharging should be avoided, different from NiCd and NiMh there is no benefit from exercising the battery.

1-16
Degradation Mechanisms • The reaction of the Li-carbon compound
with electrolyte. Despite protective layer, this reaction is always ongoing and is accelerated by high voltage and high temperature.
• Electrode corrosion. Very thin Al and Cu foils are used as current collectors. They are prone to corrosion, particularly at high states of charge. For this reason and electrolyte decomposition it is recommended to store batteries at 50% state of charge
Usual Applications • high capacity, long usage • higital cameras • video cameras • notebooks, PDAs • mobile phones
V. REFERENCES
[1] J. Yamaki, T. Hirai, J. Applied Electrochemistry, 30, (2000) 405-410