
Bathurst Allen Walter Canada - Mercer Lecture
17
56 TH CANADIAN GEOTECHNICAL CONFERENCE 4 TH JOINT IAH-CNC/CGS CONFERENCE 2003 NAGS CONFERENCE 56 ième CONFÉRENCE CANADIENNE DE GÉOTECHNIQUE 4 ième CONFÉRENCE CONJOINTE AIH-CCN/SCG 2003 NAGS CONFÉRENCE REINFORCEMENT LOADS IN GEOSYNTHETIC WALLS AND THE CASE FOR A NEW WORKING STRESS DESIGN METHOD Richard J. Bathurst, GeoEngineering Centre at Queen’s-RMC, Royal Military College, Kingston, Ontario Tony Allen, Washington State Department of Transportation, Olympia, Washington, USA Dave Walters, GeoEngineering Centre at Queen’s-RMC, Queen’s University, Kingston, Ontario abstract: The paper provides a synthesis of work by the writers that has the objective of developing a new working stress method for the calculation of reinforcement loads in geosynthetic reinforced soil walls. As a precursor to this objective, careful back-analyses of a database of instrumented and monitored full-scale field and laboratory walls are used to demonstrate that the current Simplified Method used in North America results in excessively conservative estimates of the volume of reinforcement required to generate satisfactory long-term wall performance. The new design method captures the essential contributions of the different wall components and properties to reinforcement loads. The method is calibrated against measured in-situ wall reinforcement loads using a careful interpretation of reinforcement strains and the conversion of strain to load using a suitably selected reinforcement stiffness value. A novel feature of the method is to design the wall reinforcement so that the soil within the wall backfill is prevented from reaching a failure limit state, consistent with the notion of working stress conditions. RÉSUMÉ: L’article fournit une synthèse du travail faite par les auteurs qui a l'objectif de développer une nouvelle méthode de contraintes admissibles pour le calcul des charges de renforcement dans des murs de sol renforcés par les géosynthétiques. Comme précurseur à cet objectif, des analyses soigneuses d'une base de données des murs équipés de laboratoire et in-situ sont employées pour démontrer que la méthode simplifiée courante employée en Amérique du Nord a comme conséquence des évaluations excessivement conservatrices du volume du renforcement, exigé pour assurer une performance satisfaisante de mur à long terme. La nouvelle méthode de conception capture les contributions essentielles des différents composants et propriétés de mur aux charges de renforcement. La méthode est calibrée contre les charges de renforcement, mesurées in-situ, en utilisant une interprétation soigneuse des déformations de renforcement et de la conversion de la déformation en charge en utilisant une valeur convenablement choisie de la rigidité de renforcement. Une nouvelle caractéristique de la méthode est de concevoir le renforcement de sorte que le sol dans le mur soit empêché d'atteindre l’état limite de la rupture, conformément à la notion des contraintes admissibles. 1. INTRODUCTION Geosynthetic-reinforced soil walls have been in use for more than 25 years and in the vast majority of cases have performed very well. Nevertheless, the inherent margin of safety against poor performance with respect to internal stability has not been quantified in a systematic manner. This lack of quantification can be argued to contribute to the current lack of acceptance for this technology by some practitioners and government agencies in North America. The paper reviews evidence of the conservatism in current North American practice for geosynthetic- reinforced soil walls with respect to design for internal stability. The quantitative assessment of conservatism is based on data collected from carefully selected instrumented and monitored geosynthetic-reinforced field structures in North America, Europe and Scandinavia, and full-scale laboratory walls constructed at the Royal Military College of Canada (RMC). An additional acceptance criterion for the case studies was the availability of project-specific or closely related laboratory test data for the component reinforcement materials and reliable strength data for the granular soil backfill. The data taken from case studies have been used to identify sources of conservatism in current North American practice and identify quantitative behaviour with regard to magnitude and distribution of reinforcement loads at the end of construction and beyond. A fundamental requirement to assess conservatism in current design practice and to validate new design approaches is a reliable estimate of the load in reinforcement layers. However, direct measurement of reinforcement loads is rare in the case study literature. The paper describes how reinforcement strain measurements and the conversion of strain to load through the use of a properly selected reinforcement stiffness value can be used to estimate reinforcement loads. This approach also requires quantification of the reliability and accuracy of strain measurements from different instrumentation techniques. Next the paper examines strategies to select appropriate stiffness values for geosynthetic reinforcement products based largely on interpretation of in-isolation laboratory testing, but recognising the influence of soil confinement, strain level, duration of loading and temperature amongst other factors. Based on best estimates of reinforcement loads from the database of case studies, an empirical-based reinforcement load distribution that is trapezoidal in shape is shown to be more accurate than the triangular distribution that is assumed in current North America practice.
Transcript of Bathurst Allen Walter Canada - Mercer Lecture

56TH CANADIAN GEOTECHNICAL CONFERENCE4TH JOINT IAH-CNC/CGS CONFERENCE2003 NAGS CONFERENCE
56ième CONFÉRENCE CANADIENNE DE GÉOTECHNIQUE4ième CONFÉRENCE CONJOINTE AIH-CCN/SCG
2003 NAGS CONFÉRENCE
REINFORCEMENT LOADS IN GEOSYNTHETIC WALLS AND THE CASEFOR A NEW WORKING STRESS DESIGN METHODRichard J. Bathurst, GeoEngineering Centre at Queen’s-RMC, Royal Military College, Kingston, OntarioTony Allen, Washington State Department of Transportation, Olympia, Washington, USADave Walters, GeoEngineering Centre at Queen’s-RMC, Queen’s University, Kingston, Ontario
abstract: The paper provides a synthesis of work by the writers that has the objective of developing a new workingstress method for the calculation of reinforcement loads in geosynthetic reinforced soil walls. As a precursor to thisobjective, careful back-analyses of a database of instrumented and monitored full-scale field and laboratory walls areused to demonstrate that the current Simplified Method used in North America results in excessively conservativeestimates of the volume of reinforcement required to generate satisfactory long-term wall performance. The new designmethod captures the essential contributions of the different wall components and properties to reinforcement loads. Themethod is calibrated against measured in-situ wall reinforcement loads using a careful interpretation of reinforcementstrains and the conversion of strain to load using a suitably selected reinforcement stiffness value. A novel feature of themethod is to design the wall reinforcement so that the soil within the wall backfill is prevented from reaching a failurelimit state, consistent with the notion of working stress conditions.
RÉSUMÉ: L’article fournit une synthèse du travail faite par les auteurs qui a l'objectif de développer une nouvelleméthode de contraintes admissibles pour le calcul des charges de renforcement dans des murs de sol renforcés par lesgéosynthétiques. Comme précurseur à cet objectif, des analyses soigneuses d'une base de données des murs équipésde laboratoire et in-situ sont employées pour démontrer que la méthode simplifiée courante employée en Amérique duNord a comme conséquence des évaluations excessivement conservatrices du volume du renforcement, exigé pourassurer une performance satisfaisante de mur à long terme. La nouvelle méthode de conception capture lescontributions essentielles des différents composants et propriétés de mur aux charges de renforcement. La méthode estcalibrée contre les charges de renforcement, mesurées in-situ, en utilisant une interprétation soigneuse desdéformations de renforcement et de la conversion de la déformation en charge en utilisant une valeur convenablementchoisie de la rigidité de renforcement. Une nouvelle caractéristique de la méthode est de concevoir le renforcement desorte que le sol dans le mur soit empêché d'atteindre l’état limite de la rupture, conformément à la notion descontraintes admissibles.
1. INTRODUCTION
Geosynthetic-reinforced soil walls have been in use formore than 25 years and in the vast majority of cases haveperformed very well. Nevertheless, the inherent margin ofsafety against poor performance with respect to internalstability has not been quantified in a systematic manner.This lack of quantification can be argued to contribute tothe current lack of acceptance for this technology bysome practitioners and government agencies in NorthAmerica.
The paper reviews evidence of the conservatism incurrent North American practice for geosynthetic-reinforced soil walls with respect to design for internalstability. The quantitative assessment of conservatism isbased on data collected from carefully selectedinstrumented and monitored geosynthetic-reinforced fieldstructures in North America, Europe and Scandinavia,and full-scale laboratory walls constructed at the RoyalMilitary College of Canada (RMC). An additionalacceptance criterion for the case studies was theavailability of project-specific or closely related laboratorytest data for the component reinforcement materials andreliable strength data for the granular soil backfill. Thedata taken from case studies have been used to identifysources of conservatism in current North Americanpractice and identify quantitative behaviour with regard to
magnitude and distribution of reinforcement loads at theend of construction and beyond.
A fundamental requirement to assess conservatism incurrent design practice and to validate new designapproaches is a reliable estimate of the load inreinforcement layers. However, direct measurement ofreinforcement loads is rare in the case study literature.The paper describes how reinforcement strainmeasurements and the conversion of strain to loadthrough the use of a properly selected reinforcementstiffness value can be used to estimate reinforcementloads. This approach also requires quantification of thereliability and accuracy of strain measurements fromdifferent instrumentation techniques.
Next the paper examines strategies to select appropriatestiffness values for geosynthetic reinforcement productsbased largely on interpretation of in-isolation laboratorytesting, but recognising the influence of soil confinement,strain level, duration of loading and temperature amongstother factors.
Based on best estimates of reinforcement loads from thedatabase of case studies, an empirical-basedreinforcement load distribution that is trapezoidal in shapeis shown to be more accurate than the triangulardistribution that is assumed in current North Americapractice.
Finally, the paper reviews a new empirical-based designmethod that is demonstrated to give better predictions ofinternal reinforcement loads under working stressconditions when compared to values taken from thedatabase of monitored walls.
2. CASE STUDIES
The writers have collected a total of 20 case histories(including 35 different wall sections) from paperspublished in the open literature and in some cases fromunpublished sources (Allen et al. 2002). The soilreinforcement products in these structures includedgeotextiles and geogrids manufactured from a variety ofpolymers including polypropylene (PP), high densitypolyethylene (HDPE), and polyester (PET). The materialswere strip and continuous reinforcements with a widerange of index tensile strengths from 12 to 200 kN/m, andreinforcement index stiffness values at the end of wallconstruction from 43 to 7,400 kN/m at 2% strain.Reinforcement vertical spacing varied from 0.3 to 1.6 m.
Wall facing batter angles varied from 0� (vertical) to 27�,although most of the walls had facing batter angles of 8�or less. Wall heights varied from 3.0 to 12.6 m, withsurcharge heights of up to 5.3 m of soil. Facing typesincluded geosynthetic wrapped-face, welded wire, pre-cast concrete panels, and modular concrete blocks.
Measured peak friction angles from triaxial or direct sheartests ranged from 39� to 49� (42� to 57� plane strain).Peak friction angles reported in the source referencesfrom triaxial compression tests on granular soils werecorrected to peak plane strain friction angles using theequation by Lade and Lee (1976). Direct shear test peakfriction angle values for dense sands were converted topeak plane strain values using an expression presentedby Bolton (1986) and Jewell and Wroth (1987).
Most conditions that are likely to be encountered inpractice are included in these case histories. All of thecase histories used relatively clean granular backfills (i.e.,less than 15% silt content and little, if any, plasticity), andwere placed on relatively competent foundation soils.Therefore, the scope of this paper is limited togeosynthetic walls with relatively clean non-cohesivesand or gravel backfill. Finally, the wall case historiesrepresented in this paper do not include tiered structuresor walls used as bridge abutments.
3. EVIDENCE OF EXCESSIVE CONSERVATISM INCURRENT PRACTICE
An approach to quantify the global margin of safety forexisting geosynthetic retaining walls is to calculate thesum of reinforcement load capacities (R - resistance) anddivide this value by the total horizontal earth load that isassumed to be carried by the reinforcement layers (D -demand) (Allen et al. 2002). The resistance-demand ratio(RD) can be expressed as:
qHahK2γHK 0.5 ah
n
1iiT
DRRD
�
�
��� [1]
where: Ti = reinforcement load; Kah =Ka(�ps�����������cos����������horizontal component ofactive earth pressure; �ps = the measured peak planestrain friction angle of the soil; � = wall batter;����interface shear angle between wall facing and backfillsoil (assumed to be zero based on current practice asdefined by AASHTO (2002)); H = total wall heightmeasured from the toe of the wall to the soil surfaceimmediately behind the wall facing; � = the bulk unitweight of the soil and; q is the magnitude of any uniformlydistributed surcharge load at the soil surface. Thiscalculation can be carried out for conditions representingend of construction and at design-life (75 years).
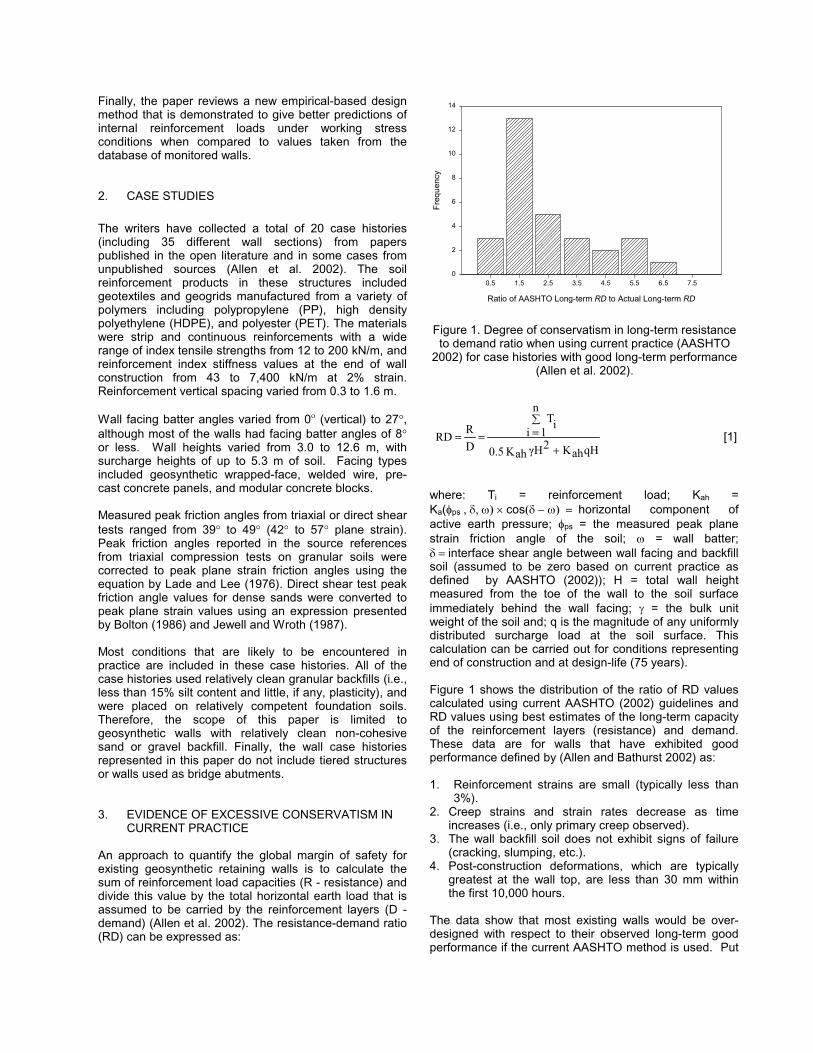
Figure 1 shows the distribution of the ratio of RD valuescalculated using current AASHTO (2002) guidelines andRD values using best estimates of the long-term capacityof the reinforcement layers (resistance) and demand.These data are for walls that have exhibited goodperformance defined by (Allen and Bathurst 2002) as:
1. Reinforcement strains are small (typically less than3%).
2. Creep strains and strain rates decrease as timeincreases (i.e., only primary creep observed).
3. The wall backfill soil does not exhibit signs of failure(cracking, slumping, etc.).
4. Post-construction deformations, which are typicallygreatest at the wall top, are less than 30 mm withinthe first 10,000 hours.
The data show that most existing walls would be over-designed with respect to their observed long-term goodperformance if the current AASHTO method is used. Put
Ratio of AASHTO Long-term RD to Actual Long-term RD
0.5 1.5 2.5 3.5 4.5 5.5 6.5 7.5
Freq
uenc
y
0
2
4
6
8
10
12
14
Figure 1. Degree of conservatism in long-term resistanceto demand ratio when using current practice (AASHTO
2002) for case histories with good long-term performance(Allen et al. 2002).

another way, these structures appear to be significantlyunder-designed based on current practice. Nevertheless,careful analyses showed that walls that exhibited goodperformance contained less than one half thereinforcement typically required using current AASHTOspecifications. In some cases only one-eighth thereinforcement was actually required. The potential toreduce excessive conservatism in current practice for thedesign of reinforcement is clear.
4. ESTIMATION OF LOADS IN GEOSYNTHETICREINFORCEMENT LAYERS
While the previous section has identified excessiveconservatism in current design methods using a globalapproach to reinforcement tensile capacity and demand,convincing arguments to abandon or modify the currentSimplified Method must be based on a comparison ofmeasured loads to predicted loads. Unfortunately, directmeasurement of reinforcement loads has only beenreported in one case history in the literature (Fannin1988). Typically, loads in reinforcement layers areinferred from measurements made by strain gauges orpairs of extensometers attached to the layers. Thissection gives a review of issues related to theinterpretation of strains using different instrumentationtechniques and the accuracy that may be expected fromthe readings. Next, techniques to properly select areinforcement stiffness value to convert strains to load arediscussed and a protocol to carryout this selection usingin-isolation laboratory testing summarised.
4.1 Strain Measurements
Interpretation of strain readings from devices attached togeosynthetic reinforcement layers depends on the type ofdevice (Perkins and Lapeyre 1997). The most commontypes of devices are strain gauges bonded directly to thesurface of the geosynthetic reinforcement material andextensometers. Displacements recorded by pairs ofextensometers are used to calculate global strainsassumed to be constant over the distance betweenmonitoring points. In one case study used by the writers,inductance coils were used to infer strains.
4.1.1 Strain Gauges
Small, high elongation strain gauges glued to thereinforcement material must be calibrated against the“true” global strain in the reinforcement. Strain gaugesbonded to woven geogrids or geotextiles typicallygenerate a local “hard spot” causing under-registration ofglobal tensile strains. Strain gauges bonded to integraldrawn PP and HDPE geogrids will record the local strainat the attachment point which may vary from point to pointdue to product geometry (cross-sectional area) andpolymer modulus (result of drawing process duringmanufacture). The calibration factor (CF) for a particularcombination of gauge, bonding technique, reinforcementtype and location of gauge is typically established fromconstant-rate-of-strain in-isolation wide width strip tensiletesting (e.g., ASTM D 4595).
Figure 2 demonstrates the relationship (under-registration) between global strain corresponding to theaverage strain over multiple apertures of a typical drawnHDPE geogrid and local strain. In this case the localstrain was recorded by a single strain gauge mounted ona longitudinal member at the midpoint between adjacenttransverse members.
Based on a review of available in-isolation tension testgauge calibration data the following observations havebeen made by Bathurst et al. (2002):
1. The magnitude of strain gauge under-registration (andhence magnitude of calibration factor CF) at a localstrain of 2% is greatest for woven or knittedgeotextiles and close to unity for extruded drawn PPgeogrids.
2. Variability in strain gauge response is greatest forwoven geotextiles.
3. Non-linearity in CF values with magnitude of globalstrain is greatest for woven geotextiles and geogridsand least for uniaxial HDPE geogrids. An example ofnon-linearity in strain response at large strains isillustrated in Figure 2.
4. In all the wall case histories reviewed, the magnitudeof calibration factor was greater than or equal to unity.
For the case of extruded drawn PP geogrid specimensinvestigated by the writers, the interpretation of globalstrain was complicated by the observation that lower CFvalues were obtained from constant-load calibration testscompared to the results for the same materials testedunder constant-rate-of-strain conditions.
4.1.2 In-situ Global Strains from ExtensometerReadings
A correction factor is not needed if extensometersattached to the geosynthetic are used. Nevertheless,strains inferred from extensometers may over-estimategeosynthetic yarn or rib strains as initial surface wrinklesor warps in the geosynthetic are taken up during fill
Local strain (%)
0 2 4 6 8 10
Glo
bal s
train
(%)
0
2
4
6
8
10
1
1
1
CF =1.25
HDPE uniaxial geogrid
2% strain/minute
5
Gauge failure
Figure 2. Example in-isolation global strain versus straingauge response for HDPE geogrid (after Bathurst 1992).
Note: CF = calibration factor for local strain 4%.

placement or under-estimate strains due to initialslackness in the extensometer cables.
4.1.3 Other Devices
Inductance coil pairs attached to and in the same planeas the geogrid reinforcement have been used to inferstrains. Average global strains based on sets of threedevices located at the same nominal distance from thewall face were as great as 0.9% at the end of surcharging(Fannin and Hermann 1990) and were reported to have aresolution of ��0.1% (Fannin 1988). These devices arecalibrated in-isolation and do not require a correctionfactor. However, the signal from inductance coil pairs issensitive to the magnitude of out-of-plane movementsthat may be generated due to fill placement, soildisplacements and flexure of the reinforcement.
4.1.4 Redundancy of Reinforcement Measurements
In several case studies, multiple strain gauges wereplaced at nominal identical locations from the wall facing.This approach allows readings to be averaged across thewidth of the wall and also provides redundancy in theevent of failure of an individual gauge in a set of two ormore gauges.
Figure 3 shows that the uncorrected response of a pair ofstrain gauges mounted on a PP geogrid may vary byabout ��15% of the mean reading of 2% strain at aprediction level of 95%.
The review of physical data from well-instrumented wallstructures has allowed the writers to comment on thereliability of the strain data, both qualitatively andquantitatively (Bathurst et al. 2002). Specifically:
1. Based on data available for an instrumented drawnPP geogrid, the coefficient of variation (COV) forstrain gauge readings was calculated to be 13% forstrains ��0.02%. Similar data for a knitted polyestergeogrid gave a COV = 14% for strains ��0.1%.
2. Based on data for instrumented PP geogrids, straingauges have proved accurate to estimatereinforcement strains at low strain levels (0.02 to 2%).Extensometers are more reliable for reinforcementstrains ��2%. For a knitted polyester geogrid, straingauges gave reliable readings for strains greater than0.1%.
3. Analysis of inductance coil readings showed thatthese instruments gave the least reliable readings ofthe three measurement techniques investigated (e.g.,COV = 32% for strains in the range of 0.2 to 0.9%).
4. Bonded strain gauges in the field typically gave a non-linear response or failed at strains greater than 3%,hence extensometers provide the only practical
means of estimating reinforcement strains at largestrain levels.
5. Based on the data available, the COV forextensometer readings was shown to be in the rangeof 29 to 56% for strains from 0.2 to 1%, but improvedto a value of 9% if the devices are restricted to strains��2%.
Strategies to improve confidence with interpretation ofstrain readings from field monitoring are: use both straingauges and extensometers; include multiple straingauges at nominal identical locations in the wall, and; usestrain gauge pairs mounted top and bottom at eachreinforcement monitoring point (Gnanendran andSelvadurai 2001).
4.2 Conversion of Geosynthetic Strain to Load usingReinforcement Stiffness
The second step in the calculation of reinforcement loadfrom global strain is the selection of a suitablereinforcement stiffness value. The following variables willinfluence the magnitude of geosynthetic reinforcementstiffness in-situ at the end of construction (Bush 1990;Rimoldi and Montanelli 1993; Allen and Bathurst 1994;Boyle et al. 1996; Yuan et al. 1998):
1. Loading sequence.2. Rate of loading and time after application of load.3. Soil confinement.4. Strain level.5. Temperature.6. Installation damage
Average strain (%)
0.0 0.5 1.0 1.5 2.0 2.5 3.0 3.5 4.0 4.5 5.0
Gau
ge s
train
(%)
0.0
0.5
1.0
1.5
2.0
2.5
3.0
3.5
4.0
4.5
5.0
+95% prediction limit 11
Limit of survivalof both strain gauges in a pair
-95% prediction limit
Figure 3. Variation in strain gauge response versusaverage of strain gauge pair mounted at nominal identical
distance behind the wall face on layers of PP geogrid(Bathurst et al. 2002).

4.2.1 Laboratory Test Methods
The stiffness of a geosynthetic at a given time or loadingrate, strain level, and temperature is essentially the slopeof a load-strain curve from a constant-rate-of-strain (CRS)tensile test, or the slope of an isochronous load-strain
curve from either a creep test or stress relaxation test. Asecant slope is used to define the reinforcement stiffnessin this paper. The stiffness obtained from a family ofcreep curves is denoted as the “creep stiffness” (Jc) andsimilarly, the “relaxation stiffness” (Jr) is obtained from afamily of stress relaxation curves. The creep stiffness Jc(typically kN/m) is expressed as follows:
a) constant-rate-of-strain tests
b) constant load (creep) tests
c) constant strain (stress relaxation tests)
Figure 4. Determination of reinforcement stiffness values as a function of time using different laboratory test methods.

iεiT
cJ � [2]
where Ti is the load per metre width (kN/m) and �i is thestrain at any time. The same equation can be used forthe relaxation stiffness, although the magnitude of creepstiffness is not necessarily equal to the relaxationstiffness value.
Figure 4 illustrates the approach to determine thestiffness of a geosynthetic reinforcement product fromeach test method. The most common method to convertstrain to load has been the in-isolation isochronous creepapproach.
Walters et al. 2002 pointed out that the loading rate in atypical index the test (ASTM D 4595) is approximately fiveorders of magnitude larger than the loading rate of thereinforcement in several example full-scale walls. Thisdifference in loading rate leads to a large difference in theestimated stiffness value for the reinforcement at end-of-construction and beyond. For example, the simple use ofstiffness values taken at 2% strain during an index CRStest run at 10% strain/minute (ASTM D 4595) can lead toan over-estimation of reinforcement loads for polyolefinproducts by a factor of 3 to 4 and, hence, lead toexcessively conservative design. The corresponding errorfor PET products is less, resulting in an over-estimation ofreinforcement loads in the range of about 20 to 30%.
In this study, 2% stain has been taken as a target valuefor selection of reinforcement stiffness values from in-isolation creep testing. With few exceptions, the correctedstrain values in full-scale walls under working stressconditions were less than 2% (Bathurst et al. 2002). Inaddition, a 2% strain level facilitates estimation ofreinforcement stiffness values from in-isolation laboratorytest results. Finally, the use of a 2% stiffness valueresults in a conservative (i.e., safe) estimate ofreinforcement load capacity for design.
Based on a review of published data for in-isolation creepand stress relaxation testing, Walters et al. (2002)observed the following general trends for stiffness valuescalculated at 2% strain:
1. Stiffness values decrease at a decreasing rate withlogarithm of time for all the materials testedregardless of the method of test.
2. The stiffness of PET products is least affected by timecompared to PP and HDPE geosynthetics, at least forstrains up to 2%.
3. The relaxation stiffness value is typically less than thecreep stiffness value for all three polymer types.
4. The stiffness values obtained from the different testmethods tend to converge at longer times for PPgeosynthetics (see example data in Figure 5).However, there was not a consistent trend regardingconvergence or non-convergence for the PET andHDPE geosynthetic materials tested.
5. The stiffness values obtained from the CRS tests as afunction of time for HDPE and PP geosynthetics areroughly the same or slightly lower than the stiffnessvalues obtained from creep testing, especially atlonger times.
6. The stiffness curves based on creep testing aresignificantly flatter at elapsed times in excess of 100hours which is less than the time required to constructwalls in the field.
4.3 Temperature and Installation Damage Effects
Temperature will affect the stiffness value ofgeosynthetics, with increasing temperature resulting inlower stiffness, especially for polyolefin materials (e.g.,Bush 1990). Time-temperature superposition techniquesare used to estimate the stiffness at any specifictemperature (e.g., WSDOT 1998). The stiffness valueused to estimate load from strain measurements shouldbe determined at the temperature in the wall. Current USdesign practice considers the effective wall temperatureto be the temperature that is the mean of the averageyearly air temperature and the normal daily airtemperature for the hottest month at the site (AASHTO2002).
Allen and Bathurst (1994) investigated the effect ofinstallation damage on the stiffness of different types ofgeosynthetic reinforcement. They determined that forwoven geotextiles, the decrease in stiffness is minor forlevels of damage that result in less than 40% peak tensilestrength loss. For geogrids, the stiffness loss isinsignificant until very high levels of damage areachieved.
Allen and Bathurst (1996) also investigated the combinedeffect of installation damage and creep on the strainresponse to load of various geosynthetics. Theydetermined that the creep strain response is the samebefore and after installation damage, which indicates thatthe creep stiffness will also be the same before and afterdamage.
Time to 2% strain, t (hours)
0.001 0.01 0.1 1 10 100 1000 10000
Stiff
ness
, J2%
(kN
/m)
0
50
100
150
200
250
300
Creep
Relaxation
CRS
Figure 5. In-isolation CRS, creep and relaxation stiffnessvalues at 2% strain for a biaxial PP geogrid (Walters et al.
2002).

Table 1 provides data presented by Allen and Bathurst(1994) who quantified variability in stiffness valuescaused by installation damage. This table also shows themagnitude of COV values for different geosynthetics.From their test data, the writers concluded that the COVof the reinforcement stiffness at 2% strain, consideringthe effects of significant installation damage and time,can be expected to vary from 5 to 18% for geogrids toapproximately 26% for woven geotextiles. If installationdamage is light (say, strength losses less than 20%), themaximum COV values reported here will likely be less.
4.4 Comparison of In-isolation and In-soil Test Results
The writers reviewed the effect of in-isolation and in-soiltesting on the calculation of in-soil stiffness at the times ofinterest (100 to 1,000 hours or more) and found them tobe relatively small. An example of stiffness values as afunction of time for a woven geotextile tested under in-isolation and in-soil conditions is illustrated in Figure 6.For woven geotextiles and geogrids, soil confinementappears to have little effect on the stiffness (less than a 5to 15% increase). Therefore, in-isolation testing shouldbe sufficient for these materials. The available data showthat the in-isolation creep tests gave the highestestimates of the long-term stiffness values. Thus theresults of this test are conservative for the estimation ofreinforcement loads in design. Furthermore, based on in-situ measured reinforcement strains in full-scale walls(Allen and Bathurst 2002), it appears that at the end ofwall construction, the reinforcement tends to exhibitprimarily creep, while at long times after construction, thereinforcement tends toward pure relaxation once the soilceases to deform. Therefore, it can be concluded that thein-isolation creep test can be used to conservativelyestimate the reinforcement stiffness at longer times (e.g.,500 to 1,000 hours or more) for woven geotextiles andgeogrids for the purpose of calculating reinforcementloads in field-scale walls.
Table 1. Coefficient of variation (COV) of reinforcementCRS stiffness value (Jcrs) at 5% strain for geosynthetics inboth virgin and damaged conditions (Walters et al. 2002).
Product Type Condition
COV (%) ofCRS StiffnessValue at 5%Strain
% Increasein COV dueto Damage
Geotextile Virgin 10.3 -Damaged 15.2 47.6
HDPE Geogrid Virgin 2.6 -Damaged 3.1 19.2
PET Geogrid Virgin 6.4 -Damaged 7.1 10.9
PP Geogrid Virgin 8.2 -Damaged 10.3 25.6
Note: All tests carried out at 10% strain/minute.
4.5 Approach to Determine Reinforcement StiffnessValues
For geogrids and woven geotextiles (the most commonreinforcement products for reinforced soil walls) thewriters have developed the following procedure toestimate the in-soil stiffness value:
1. Determine the total length of time it will take tocomplete construction of the reinforced soil structureat a given section (i.e., the time after which noadditional loading will occur – limited data availableto the writers shows that field walls are typicallyconstructed in 500 to 1500 hours).
2. Using the procedures illustrated in Figure 4, developan in-isolation creep stiffness versus time curve atconstant strain levels of interest, and select thecreep stiffness based on the elapsed time to the endof wall construction. Select the stiffness at theanticipated maximum working strains for the wall, asthe stiffness is likely to be strain level dependent.For design purposes, a 2% secant stiffness at 1,000hours is reasonable. If strains of 3 to 4% or moreare anticipated, determine the stiffness at the higherstrain level. If strains significantly less than 2% areanticipated, and a geosynthetic material is beingused which is known to have a highly non-linearload-strain curve over the strain range of interest(e.g., some PET geosynthetics), then a stiffnessvalue determined at a lower strain should beconsidered.
3. If the effective site temperature is anticipated to besignificantly different from 20oC, the creep stiffnessvalue may need to be temperature shifted, requiringcreep data at higher or lower temperatures toestablish the appropriate shift factors. See Bush(1990) for an example of temperature shifting.
Correct the stiffness obtained in step 3 for soilconfinement effects if the reinforcement is not a geogridor slit film woven geotextile. For multi-filament wovengeotextiles, the in-isolation stiffness may need to be
Time, t (hours)
0.001 0.01 0.1 1 10 100 1000 10000 100000
Stiff
ness
, J1%
(kN
/m)
0
50
100
150
200
250
300
350
400
450
Creep, in-isolation
Creep/relaxation, in-soil
CRSin-isolation
Figure 6. Comparison of CRS and isochronous creepstiffness values at 1% strain from in-isolation and in-soil
tests on woven PP geotextile (data from Boyle 1995).

increased by a factor of 1.1 to 1.2 and for nonwovengeotextiles by a factor of 2 to 5.
Estimates of the ratio of creep stiffness value at typicalworking conditions (i.e., strains at (say) 2% and loadingtimes of 1000 hours) to the stiffness value from aconventional CRS test (ASTM D 4595) are summarised inTable 2. This table is useful for estimating reinforcementstiffness values in the absence of in-isolation laboratorytest data.
Table 2. Ratio of typical working stress stiffness (at 1,000hours) to the stiffness obtained in a CRS test at10%/minute, per ASTM D 4595 (Walters et al. 2002).
Geosynthetic Polymer J1000 hours /JD 4595
PP 0.25 to 0.35HDPE 0.25 to 0.35PET 0.75 to 0.85
4.6 Accuracy of Stiffness Value and Estimate of Errorin Calculation of Reinforcement Load
The calculation of reinforcement load T based on bestestimates of stiffness and strain values is made using thefollowing expression:
Ti = Jc x �i [3]
Associated with each load value is uncertainty in thepredicted value that varies with the magnitude of theestimate of error of the stiffness and strain measurementsas noted earlier. Uncertainty in strain measurements(COV
�) and stiffness values (COVJ) are uncorrelated (i.e.
independent). Therefore, total uncertainty in estimatedreinforcement loads can be quantified by a coefficient ofvariation (COVT) value calculated as follows (Ang andTang 1975):
2JCOV2
εCOVTCOV �� [4]
This approach is used to calculate the error bars in theplots for estimated reinforcement load values presentedlater in the paper.
4.7 Example Wall GW14
Figure 7 shows a propped panel faced geogrid wall wasbuilt to full scale in the laboratory to a maximum height of3.0 m (Bathurst and Benjamin 1990). Figure 8 showsmeasured and predicted connection loads for this wall.Reinforcement loads were measured directly by load cellsat the connection with the facing and estimated fromstrains measured using strain gauges and extensometersattached to the reinforcement just beyond the load cells.Error bars in the figure represent � 1 standard deviation
Figure 7. Cross-section of RMC full-height propped aluminum panel wall constructed with PP geogrid reinforcementlayers (Wall GW14 – Bathurst and Benjamin 1990).

on estimates of reinforcement load using strain gaugeand extensometer readings. The load levels at theconnection from the load cells are slightly lower thanthose estimated from the strain gauge readings. The highload estimated using the strain gauge in the topreinforcement layer relative to the load measured by theload cell may be attributed to the vertical settlement of thesoil directly behind the facing, leading to the generation ofadditional down-drag strains. The strain gauges are ableto record additional strains due to changes inreinforcement out-of-plane geometry while the load cellswere configured to record only the in-plane horizontalload in the reinforcement. Notwithstanding thecomplications noted above, the measured loads andestimated loads from interpretation of reinforcementstrains are considered to be in reasonable agreement.
5. COMPARISON OF MEASURED LOADS WITHCURRENT PRACTICE
The methodologies described in the preceding sectionscan now be used to estimate reinforcement loads in thefull-scale reinforced soil walls investigated by the writers(Section 2) and these loads used to examine theaccuracy of predicted loads using current North Americanpractice.
5.1 Simplified Method
The primary design method in North America forgeosynthetic reinforced soil walls is called the TiebackWedge or Simplified Method (AASHTO 1996, 2002). Inthis approach the wall is assumed for internal design tobe flexible with enough deformation to generate an activestate of stress. Hence, the lateral earth pressurecoefficient Ka is used to convert vertical stress to lateralstress. Ka is determined in this method assuming ahorizontal backslope and no wall-soil interface friction inall cases. The reinforcement is assumed to resist lateralstresses occurring within the wall, with eachreinforcement layer designed to resist the lateral stress
over a tributary area. The Rankine failure wedge is held inhorizontal equilibrium by the reinforcement layers that actas tiebacks. The maximum tensile load in a reinforcementlayer, Tmax (in units of force per running unit length of wall)is calculated according to:
� �� � q Sz γaKvSmaxT ��� [5]
where, Sv = tributary area (assumed equivalent to thevertical spacing of the reinforcement when analyses arecarried out per unit length of wall), Ka = active lateralearth pressure coefficient, � = soil unit weight, z = depthto the reinforcement level relative to the wall top at thewall face, S = average soil surcharge depth above thewall top, and q = vertical stress due to traffic surcharge.
5.2 Comparison of Predicted and Estimated Loads
Figure 9 illustrates how well the Simplified Methodpredicts reinforcement loads in geosynthetic walls built inthe field. The error bars in the figure show the variance (�1 standard deviation) in the “best estimate of measured”reinforcement loads based on the estimate of uncertaintyin strain and reinforcement stiffness measurements.Note that triaxial or direct shear peak soil friction angles
Reinforcement load at connection, T (kN/m)
0 1 2 3 4 5
Dep
th b
elow
wal
l top
, z (m
)0
1
2
3
End of construction End of 80 kPa surcharge
connection load cells using strain gauges connection load cellsusing strain gaugesand extensometers
Figure 8. Measured reinforcement connection loads andconnection loads predicted from strain gauge and
extensometer measurements (Wall GW14 – Walters etal. 2002).
Load estimated from measured strain (kN/m)
0 5 10 15 20 25 30Pr
edic
ted
load
(kN
/m)
0
5
10
15
20
25
30
1
1
GW 8 GW 9 (no surcharge)GW 9 (with surcharge)
GW 5
GW 10
GW 7 (Section J)GW 7 (Section N)
GW 16 (no surcharge)GW 16 (with surcharge)GW 18
GW 20 (PP geogrid)GW 20 (HDPE geogrid)
GW 19
Figure 9. Predicted versus reinforcement load estimatedfrom strain measurements for full-scale field geosyntheticwalls, using the AASHTO Simplified Method and triaxialor direct shear peak shear strength values (Allen and
Bathurst 2002).

and unit weights estimated from measured data wereused to calculate loads. Plane strain conditions likelyprevail in these types of reinforced structures (Rowe andHo 1993; Zornberg et al. 1998) but it is recognised that inpractice triaxial or direct shear backfill friction angleswould be used with this design method (AASHTO 2002).No safety factors were applied to calculate the predictedloads.
The data in Figure 9 show that there is a tremendousamount of scatter in the predicted loads. Furthermore,with the exception of two walls (GW 19 and GW 7) thegeneral trend is that the predicted loads are greater thanthe estimated loads. Interestingly, Walls GW 19 and GW7 are a sloped-face wall (27o facing batter) and a polymerstrip reinforced soil wall, respectively, and are excludedas geosynthetic reinforced soil walls in current practice(Elias et al. 2001; AASHTO 2002).
Allen and Bathurst (2002) also compared the distributionof estimated reinforcement load and predicted loadsunder working load levels for the case study walls in thisinvestigation. An example comparison is shown in Figure10. The modified AASHTO curves refer to the use of thehorizontal component of earth pressure in Equation 5which reduces the magnitude of earth force calculated foreach reinforcement layer. The data in the figure show thatreinforcement loads were excessively conservative forthis structure and that the trend towards increasingreinforcement load with depth below the top of the wallwas not captured using the Simplified Method. Themagnitudes of predicted load were also reduced by usingplane strain friction angle values for the soil backfill. Thisresult suggests that a significant source of conservatism
in current design practice is the use of laboratory shearstrength values that are not corrected for the plane strainconditions that prevail in most geosynthetic reinforced soilwall structures.
Figure 11 shows the distribution of reinforcement loads(Tmax) estimated from measured strains in the full-scalefield walls, normalised to the maximum reinforcementload within the wall (Tmxmx). The normalised loads areplotted against the relative depth below the elevation ofthe average soil surcharge height to account for the effectof surcharge on reinforcement load near the top of thewall. The load distribution envelope is not triangular as iscurrently assumed for design, but rather is trapezoidal inshape. An approximate trend line is superimposed on thedata in the figure to help emphasise the shape of the loaddistribution envelope in the figure.
The explanation for the reduction in reinforcement loadsat the base of the walls in Figures 10 and 11 is proximityto the stiff foundation base and toe restraint at the wallfooting. Analysis of a series of RMC walls has shown thatthe combination of the wall face and wall toe restraintcarries a significant portion of the internal load forgeosynthetic walls, thereby reducing the load thereinforcement must carry. The stiffer the wall face/walltoe restraint, the less load the reinforcement must carry(Bathurst et al. 2000, 2001). The contribution of facingstiffness and toe restraint is not explicitly considered in
Tmax (kN/m)
0 5 10 15 20
z/H
0.0
0.1
0.2
0.3
0.4
0.5
0.6
0.7
0.8
0.9
1.0
GW8
Triaxial/Direct shear
Plane strain shear
Estimated load from measured strains
AASHTOModified AASHTO
Modified AASHTO
Figure 10. Predicted peak reinforcement loads, and peakloads estimated from measured strains (Wall GW8 –Allen et al. 2002). Note: Error bars represent bestestimate of measured load � 1 standard deviation.
Normalized load (Tmax / Tmxmx)
0.0 0.2 0.4 0.6 0.8 1.0 1.2
Nor
mal
ized
dep
th b
elow
top
of w
all (
z+S)
/ (H
+S) 0.0
0.1
0.2
0.3
0.4
0.5
0.6
0.7
0.8
0.9
1.0
GW 8 GW 9 (no surcharge)GW 9 (with surcharge)
GW 5GW 7 (Section J)GW 7 (Section N)
GW 16 (no surcharge)GW 18
GW 10
GW 20 (PP geogrid)GW 20 (HDPE geogrid)
GW 19
Figure 11. Normalized reinforcement loads estimated fromstrain measurements as a function of normalized depth
below wall top (Allen et al. 2003).

the AASHTO Simplified Method and is an importantsource of conservatism in current design practice.
5.3 Soil Failure as a Limit State in Wall Design
Included in the database of walls was one full-scalewrapped-face field wall (Allen et al. 1992) and a series offull-scale laboratory walls constructed at RMC (Bathurstet al. 2000, 2001) that were taken to load levels in excessof “working load” levels. This state was achieved throughthe application of a uniform surcharge pressure applied atthe surface of the wall backfill starting at the crest of thewall. Bathurst and co-workers noted that in their full-scalelaboratory tests, soil failure occurred before reinforcementrupture. Evidence of soil failure, defined as the internaldevelopment of a contiguous soil failure zone in thereinforced soil mass, included a sudden and largeoutward movement of the wall face, soil settlementdirectly behind the wall face and a concurrent increase inreinforcement strains. In some cases, further increasesin surcharge loading lead to reinforcement rupture andcollapse of the wall.
The performance of these walls prior to collapse wasused to delineate walls that can be expected to havegood long-term performance (see Section 3) from wallswith poor performance. Direct measurement of soil shearstrains consistent with the notion of soil plasticity (failure)was not possible. However, as a general rule,reinforcement strains in excess of 3% strain were shownto be a quantitative indicator of soil failure. Reinforcementstrains in excess of this value are believed to lead to soilsoftening and the shedding of soil load capacity to thereinforcement layers. From a practical point of view,restricting reinforcement strains from achieving tensilestrains in excess of 3% strain can be used to prevent soilfailure and represents an important limit state that shouldbe considered in the development of working stress walldesign methodologies.
6. A NEW WORKING STRESS METHOD FORPREDICTION OF REINFORCEMENT LOADS INGEOSYNTHETIC WALLS
The previous section has highlighted deficiencies in thecurrent Simplified Method with respect to the calculationof reinforcement loads for internal stability design ofgeosynthetic reinforced soil walls. A subset of thedatabase of case studies collected by the writers (16 fullyinstrumented walls and 14 walls with limitedmeasurements) was used to develop a new designmethodology based on working stress principles. “Bestestimate” reinforcement loads under working load levelswere used to calibrate this empirical-based designmethod. The methodology is called the “K-StiffnessMethod” (Allen et al. 2003; Allen and Bathurst 2003) andis briefly described in the following sections.
6.1 Background
The following key factors will influence the magnitude ofmaximum reinforcement load, Tmax:
1. Height of the wall and any surcharge loads.2. Global and local stiffness of the soil reinforcement.3. Resistance to lateral movement caused by the
stiffness of the facing and restraint at the wall toe.4. Face batter.5. Shear strength and stress-strain behaviour (e.g.,
modulus) of the soil.6. Unit weight of the soil.7. Vertical spacing of the reinforcement.
It is useful to note at this point that items 2, 3 and 4 arenot considered in the Simplified Method. Of particularimportance is the possible effect of magnitude ofreinforcement stiffness on the magnitude and distributionof reinforcement loads as demonstrated in physical testsand numerical models (Christopher 1993; Bathurst andHatami 1998).
In the K-Stiffness Method, the contribution of these keyfactors to the calculation of the maximum load in areinforcement layer i is expressed as:
fb Φfs Φlocal ΦgΦmaxt DivS) SH(Kγ
21i
maxT �� [6]
where: K = lateral earth pressure coefficient; � = unitweight of the soil; H = height of the wall; S = equivalentheight of uniform surcharge pressure q (i.e., S = q/�); i
vS= tributary area (equivalent to the vertical spacing of thereinforcement in the vicinity of each layer when analysesare carried out per unit length of wall); Dtmax = loaddistribution factor that modifies the reinforcement loadbased on layer location. The remaining terms, �g, �local, �fsand �fb are influence factors that account for the effects ofglobal and local reinforcement stiffness, facing stiffnessand face batter, respectively. The coefficient of lateralearth pressure K is calculated using the Jaky equation(Holtz and Kovacs 1981) together with �ps = peak planestrain friction angle of the soil. The use of K = Ko in thisproposed method does not imply that at-rest conditionsexist within the reinforced backfill. Ko is simply used as afamiliar index parameter to characterise soil behaviour.
The empirical reinforcement load distribution parameterDtmax is used to distribute the load as a function of depth,accounting for the reinforcement properties, loadredistribution among layers, and foundation conditions. Itis expressed here as a function of normalized depthbelow the top of the wall (z+S)/(H+S), including the effectof the soil surcharge S, and varies over the range0 �Dtmax 1. The distribution is illustrated by the dashedlines in Figure 11.
Parameter �g is a global stiffness factor that accounts forthe influence of the stiffness and spacing of thereinforcement layers over the entire wall height and hasthe general form:

β
apglobalS
α gΦ ��
�
�
��
�
�� [7]
Here, Sglobal is the global reinforcement stiffness and �and � are constant coefficients. The non-dimensionality ofthe expression is preserved by dividing the globalreinforcement stiffness by pa = 101 kPa (atmosphericpressure). The global reinforcement stiffness value for awall is calculated as (Christopher et al. 1990):
� �
H
n
1iiJ
H/naveJ
globalS�
��� [8]
Here, Jave is the average tensile stiffness of all “n”reinforcement layers over the wall height and, Ji is thetensile stiffness of an individual reinforcement layerexpressed in units of force per unit length of wall.
Parameter �local is a local stiffness factor that accountsfor the relative stiffness of the reinforcement layer withrespect to the average stiffness of all reinforcement layersand is expressed as:
a
globalSlocalS localΦ
��
�
�
��
�
�� [9]
Slocal is the local reinforcement stiffness for reinforcementlayer i calculated as:
ivS
JlocalS �
��
����
�� [10]
Local deviations from overall trends in reinforcementloads can be expected when the reinforcement stiffnessand/or spacing of the reinforcement change from averagevalues over the height of the wall (i.e., Slocal/Sglobal � 1;Hatami et al. 2001). This effect is captured by the localstiffness factor �local expressed by Equation 9.
Parameters �fs (facing stiffness factor) and �fb (facingbatter factor) in Equation 6 are factors that account for theinfluence of the facing stiffness and facing batter,respectively, and are constant values for a given wall.
6.2 Results of Back-analyses
The values for the influence factors introduced above areassumed to be uncorrelated to facilitate back-analysis.Individual values were back-calculated by rewritingEquation 6 to isolate each factor and using baselinevalues for the remaining influence factors and best
estimates of reinforcement loads and stiffness values.For example, the results of regression analysis gavevalues of � = 0.25 and � = 0.25 for the power functiondescribed by Equation 7.
Regression analyses using Equation 9 gave a = 1 forgeosynthetic reinforced soil walls. To accommodate aseamless transition to steel reinforced soil walls, a similarback-analysis by Allen and Bathurst (2003) gave a = 0 forsteel soil reinforcement systems.
For preliminary design purposes, the following facingstiffness factor values are recommended:
1. �fs���0.35 for modular block and propped concretepanel faced walls (stiff facings).
2. �fs���0.5 for incremental precast concrete facings.3. �fs���1.0 for all other types of wall facings (flexible
facings - e.g., wrapped-face, welded wire or gabionfaced).
The influence of wall facing batter on maximumreinforcement loads is adjusted in the proposed workingstress method using an empirical facing batter factorexpressed as:
d
avhKabhK
fbΦ ���
����
�� [11]
where: Kabh = horizontal component of active earthpressure coefficient accounting for wall face batter; Kavh =horizontal component of active earth pressure coefficient(assuming the wall is vertical) and; d = constantcoefficient. The form of the equation shows that as thewall face batter angle � � 0 (i.e., wall facing batterapproaches the vertical) the facing batter factor �fb � 1.A value of d = 0.25 gives the best fit based on theavailable Tmax data and is recommended as the defaultvalue in the proposed K-Stiffness Method.
6.3 Overall Performance of the K-Stiffness Method
The accuracy of the proposed K-Stiffness Method(Equation 6) for geosynthetic walls is illustrated in Figure12. The improvement over the Simplified Method isapparent when this figure is compared to Figure 9.Similarly, the improved performance of the K-StiffnessMethod over the Simplified Method with respect to thedistribution of loads in reinforced soil walls is apparent inFigure 13. The relative improvement of the K-StiffnessMethod over the Simplified Method can also be quantifiedby examining the ratio of the measured to predictedreinforcement loads (bias) and the spread in the biasvalues (Table 3). A bias value of one is desirable. Thelower the COV of the bias values the better the accuracyof the model. In both cases the K-Stiffness Method issuperior to the Simplified Method.
The strain level in the reinforcement also appears to havea significant effect on the prediction accuracy of the K-Stiffness Method. Figure 14 shows predicted

reinforcement strains using the K-Stiffness Method andTmxmx, plotted against the measured reinforcement strainsfor geosynthetic walls. The predicted strains werecalculated by dividing Tmxmx by the reinforcement layersecant modulus, J (see Equation 3). It appears that oncereinforcement strains exceed approximately 3 to 4% forthe available case histories, the K-Stiffness Methodconsistently under-predicts the measured strain. Itshould be noted that all of the strains greater than about3% were measured in full-scale test walls which weresurcharged to loads well in excess of working stressconditions (see Bathurst 1993; Bathurst et al. 1993, 2000,2001 for details regarding these full-scale test walls).
Table 3. Ratio of Measured to Predicted ReinforcementLoads (Bias) (Allen et al. 2003).
SimplifiedMethod
K-Stiffness Method
Mean Tmax 0.65 0.99COV Tmax 95% 36%Mean Tmxmx 0.58 0.99COV Tmxmx 99% 17%
Tmax = maximum load in a reinforcement layerTmxmx = maximum load in wall from all layersCOV = standard deviation of bias/mean of bias x 100%
It should also be noted in Figure 14 that at highreinforcement strains the walls with stiff facings plotconsistently below the walls with flexible facings. Thismay be an indicator that the facing stiffness correctionfactor used in the K-Stiffness method is not a constant asproposed, but increases toward 1.0 (i.e., less effect offacing stiffness) as strain increases. At higher strains, thefacing appears to have reduced reserve capacity to carryadditional load (Bathurst et al. 2000). While the facinghas not failed at reinforcement strains greater than 1.5 to2%, the reinforcement takes on additional load tomaintain facing column equilibrium. Once reinforcementstrains exceed 3 to 4%, the soil begins to fail for bothflexible and stiff-faced walls.
Geosynthetic reinforcement can reach much higherstrains without failure than the soil. Therefore, preventionof reinforcement failure, an objective of current internalstability design methods, does not ensure against failureof a geosynthetic wall due to failure of the backfill soil.Prevention of reinforcement strains (over the design life ofthe structure) that are great enough to allow failure of thesoil should be an objective of any working stress designmethod. Soil failure is defined as contiguous or near-contiguous zones of soil with shear strains in excess ofthe strain at peak strength. Contiguous shear zones havebeen observed in test walls taken to collapse underuniform surcharge loading (Bathurst 1990, Bathurst et al.1993). Once the soil has failed, for all practical purposesthe wall has failed and an internal strength limit stateachieved.
Plane strain shear strength data for the backfill used inone case study wall (GW16) indicated that the soil hadpeak strains on the range of 2 to 3% (Boyle 1995). Sincethe backfill used for this wall was at the upper endregarding shear strength for the case histories consideredherein, these plane strain peak strains are likely at thelower end of the typical range for granular soils. Planestrain shear strength data reported by Lee (2000) forRMC soil specimens at confining pressures comparableto surcharge pressures required to initiate large walldeformations indicate that peak soil strains in the wallswere about 2 to 3%. In both cases (Boyle 1995; Lee2000), the plane strain test results indicated that the peaksoil strain increases with increasing confining stress.
Based on data from the RMC full-scale walls,geosynthetic reinforcement tensile strains large enoughto cause signs of soil failure are typically numericallygreater than the 2 to 3% peak soil shear strain valuesrequired to generate a contiguous failure zone in thesewalls, as shown in Figure 14. Furthermore, Figure 14shows that for the available data, the K-Stiffness Methodprovides an accurate prediction of reinforcement strainsup to reinforcement strain levels that are numerically at orslightly greater than the soil peak shear strain (i.e.,reinforcement strain levels of approximately 3% or morethat appear to correspond to soil peak shear strains of 2to 3% based on laboratory plane strain testing of granularsoils used in full-scale walls). A direct theoretical
Measured load (kN/m)
0 2 4 6 8 10 12 14 16 18 20
K-St
iffne
ss M
etho
d pr
edic
ted
load
(kN
/m)
0
2
4
6
8
10
12
14
16
18
20
GW5GW7, Section JGW7, Section NGW8GW9, no surchargeGW9, with surchargeGW10, with waterrestraint removed
GW16, no surchargeGW16, with surchargeGW18GW19GW20, HDPE SectionGW20, PP Section
Figure 12. Predicted versus measured values of Tmax inreinforcement layers for geosynthetic walls, using the K-
Stiffness Method (Allen and Bathurst 2003).
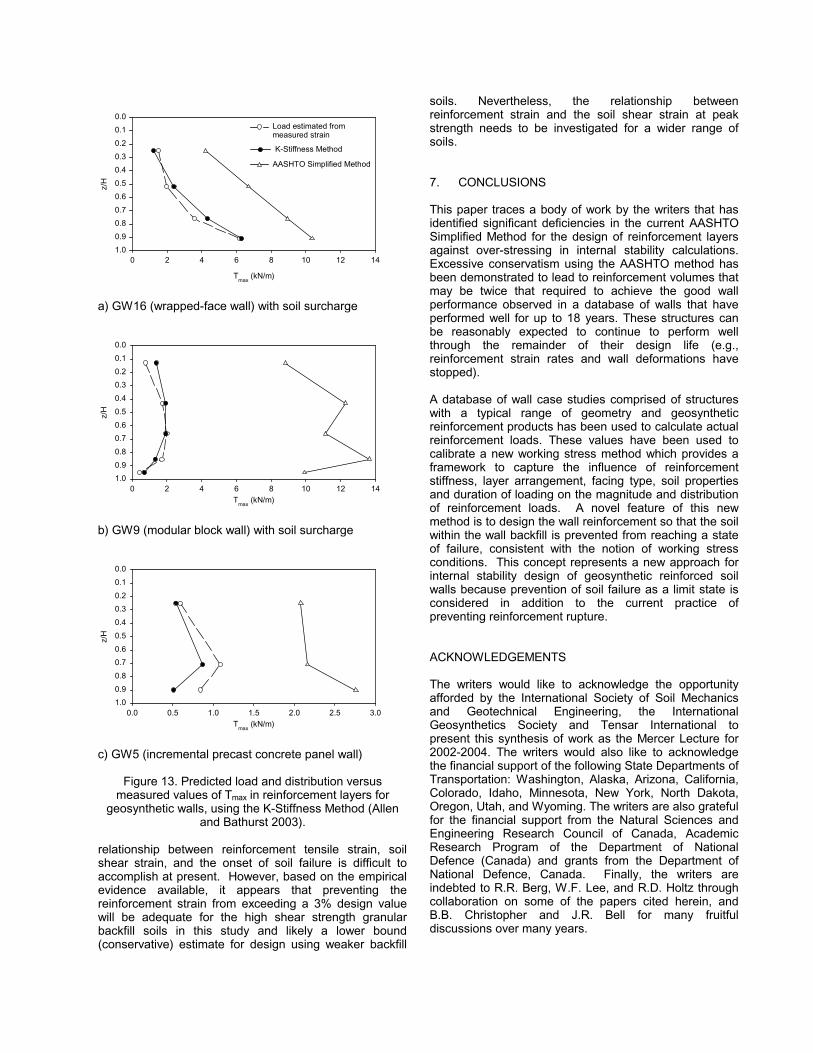
relationship between reinforcement tensile strain, soilshear strain, and the onset of soil failure is difficult toaccomplish at present. However, based on the empiricalevidence available, it appears that preventing thereinforcement strain from exceeding a 3% design valuewill be adequate for the high shear strength granularbackfill soils in this study and likely a lower bound(conservative) estimate for design using weaker backfill
soils. Nevertheless, the relationship betweenreinforcement strain and the soil shear strain at peakstrength needs to be investigated for a wider range ofsoils.
7. CONCLUSIONS
This paper traces a body of work by the writers that hasidentified significant deficiencies in the current AASHTOSimplified Method for the design of reinforcement layersagainst over-stressing in internal stability calculations.Excessive conservatism using the AASHTO method hasbeen demonstrated to lead to reinforcement volumes thatmay be twice that required to achieve the good wallperformance observed in a database of walls that haveperformed well for up to 18 years. These structures canbe reasonably expected to continue to perform wellthrough the remainder of their design life (e.g.,reinforcement strain rates and wall deformations havestopped).
A database of wall case studies comprised of structureswith a typical range of geometry and geosyntheticreinforcement products has been used to calculate actualreinforcement loads. These values have been used tocalibrate a new working stress method which provides aframework to capture the influence of reinforcementstiffness, layer arrangement, facing type, soil propertiesand duration of loading on the magnitude and distributionof reinforcement loads. A novel feature of this newmethod is to design the wall reinforcement so that the soilwithin the wall backfill is prevented from reaching a stateof failure, consistent with the notion of working stressconditions. This concept represents a new approach forinternal stability design of geosynthetic reinforced soilwalls because prevention of soil failure as a limit state isconsidered in addition to the current practice ofpreventing reinforcement rupture.
ACKNOWLEDGEMENTS
The writers would like to acknowledge the opportunityafforded by the International Society of Soil Mechanicsand Geotechnical Engineering, the InternationalGeosynthetics Society and Tensar International topresent this synthesis of work as the Mercer Lecture for2002-2004. The writers would also like to acknowledgethe financial support of the following State Departments ofTransportation: Washington, Alaska, Arizona, California,Colorado, Idaho, Minnesota, New York, North Dakota,Oregon, Utah, and Wyoming. The writers are also gratefulfor the financial support from the Natural Sciences andEngineering Research Council of Canada, AcademicResearch Program of the Department of NationalDefence (Canada) and grants from the Department ofNational Defence, Canada. Finally, the writers areindebted to R.R. Berg, W.F. Lee, and R.D. Holtz throughcollaboration on some of the papers cited herein, andB.B. Christopher and J.R. Bell for many fruitfuldiscussions over many years.
Tmax (kN/m)
0 2 4 6 8 10 12 14
z/H
0.00.10.20.30.40.50.60.70.80.91.0
Load estimated frommeasured strain
K-Stiffness Method
AASHTO Simplified Method
a) GW16 (wrapped-face wall) with soil surcharge
Tmax (kN/m)0 2 4 6 8 10 12 14
z/H
0.00.10.20.30.40.50.60.70.80.91.0
b) GW9 (modular block wall) with soil surcharge
Tmax (kN/m)0.0 0.5 1.0 1.5 2.0 2.5 3.0
z/H
0.00.10.20.30.40.50.60.70.80.91.0
c) GW5 (incremental precast concrete panel wall)
Figure 13. Predicted load and distribution versusmeasured values of Tmax in reinforcement layers for
geosynthetic walls, using the K-Stiffness Method (Allenand Bathurst 2003).

Measured reinforcement strain (%)
0 2 4 6 8 10 12 14 16 18 20 22 24 26 28 30
K-St
iffne
ss M
etho
d pr
edic
ted
rein
forc
emen
t stra
in (%
)
0
2
4
6
8
10
12
14
16
18
20
22
24
26
28
30
Workingstressconditionsfor design Signs of soil failure
(cracking, slumping, etc.)
3
Flexiblefacing
Rigidfacing
Geosynthetic production walls
Test walls with flexible facingTest walls with stiff facing
Measured reinforcement strain (%)0 1 2 3 4 5
K-St
iffne
ss M
etho
dpr
edic
ted
rein
forc
emen
t stra
in (%
)
0
1
2
3
4
5
Working stressconditions for design
Figure 14. Predicted versus measured reinforcement strain (based on Tmxmx) using the K-Stiffness Method for full-scaleproduction (field) and full-scale laboratory geosynthetic walls, a) inset showing 0 to 5% reinforcement strain range (Allen
et al. 2003).

REFERENCES
AASHTO. 1996. Standard Specifications for HighwayBridges. American Association of State Highwayand Transportation Officials, Sixteenth Edition,Washington, D.C.
AASHTO. 2002. Standard Specifications for HighwayBridges. American Association of State Highwayand Transportation Officials, Seventeenth Edition,Washington, D.C.
Allen, T.M., and Bathurst, R.J. 1994. Characterization ofGeosynthetic Load-Strain Behavior AfterInstallation Damage. Geosynthetics International,1 (2): 181-199.
Allen, T.M., and Bathurst, R.J. 1996. Combined AllowableStrength Reduction Factor for Geosynthetic Creepand Installation Damage. GeosyntheticsInternational, 3 (3): 407-439.
Allen, T.M., and Bathurst, R.J. 2002. Observed Long-Term Performance of Geosynthetic Walls, andImplications for Design. GeosyntheticsInternational, 9 (5-6): 567-606.
Allen, T.M., and Bathurst, R.J. 2003. Prediction ofReinforcement Loads in Reinforced Soil Walls.Washington State Department of Transportation,Report WA-RD 522.2.
Allen, T.M., Bathurst, R.J., and Berg, R.R. 2002. GlobalLevel of Safety and Performance of GeosyntheticWalls: An Historical Perspective. GeosyntheticsInternational, 9 (5-6): 395-450.
Allen, T.M., Christopher, B.R., and Holtz, R.D. 1992.Performance of a 12.6 m High Geotextile Wall inSeattle, Washington. In Proceedings of theInternational Symposium on Geosynthetic-Reinforced Soil Retaining Walls, Denver,Colorado. Edited by J.T.H. Wu. Balkema,Rotterdam, pp. 81-100.
Allen, T.M., Bathurst, R.J., Lee, W.F., Holtz, R.D., andWalters, D.L. 2003. A New Working Stress Methodfor Prediction of Reinforcement Loads inGeosynthetic Walls. (in press) CanadianGeotechnical Journal.
Ang, A.H-S., and Tang, W.H. 1975. Probability Conceptsin Engineering Planning and Design: Volume 1 –Basic Principles. John Wiley and Sons, New York,NY, USA.
ASTM D 4595. Standard Test Method for TensileProperties of Geotextiles by the Wide-width StripMethod. In 1996 Annual Book of ASTM Standards.ASTM, West Conshohocken, Pennsylvania.
Bathurst, R.J. 1990. Instrumentation of Geogrid-Reinforced Soil Walls. Transportation ResearchRecord No. 1277, Washington, DC, pp. 102-111.
Bathurst, R.J. 1992. Case Study of a Monitored ProppedPanel Wall. In Proceedings of the InternationalSymposium on Geosynthetic-Reinforced SoilRetaining Walls, Denver, Colorado. Edited byJ.T.H. Wu. Balkema, Rotterdam, pp. 159-166.
Bathurst, R.J. 1993. Investigation of Footing Restraint onStability of Large-Scale Reinforced Soil Wall Tests.In Proceedings of the 46th Annual CanadianGeotechnical Conference, Saskatoon,Saskatchewan, pp. 389-398.
Bathurst, R.J., and Benjamin, D.J. 1990. Failure of aGeogrid-Reinforced Soil Wall. TransportationResearch Board 1288, pp. 109-116.
Bathurst, R.J., and Hatami, K. 1998. Seismic ResponseAnalysis of a Geosynthetic Reinforced SoilRetaining Wall. Geosynthetics International, 5 (1-2): 127-166.
Bathurst, R.J., Allen, T.M., and Walters, D.L. 2002. Short-Term Strain and Deformation Behavior ofGeosynthetic Walls at Working Stress Conditions.Geosynthetics International, 9 (5-6): 451-482.
Bathurst, R.J., Jarrett, P.M., and Benjamin, D.J. 1993. ADatabase of Results from an IncrementallyConstructed Geogrid-Reinforced Soil Wall Test.Renforcement Des Sols: Experimentations enVraie Grandeur des Annees 80, Paris, pp. 401-430.
Bathurst, R.J., Walters, D.L., Hatami. K., and Allen, T.M.2001. Full-scale Performance Testing andNumerical Modelling of Reinforced Soil RetainingWalls. Special Invited Lecture. In InternationalSymposium on Earth Reinforcement, IS Kyushu2001, Fukuoka, Japan, Vol. 2, pp. 777-799.
Bathurst, R.J., Walters, D., Vlachopoulos, N., Burgess,P., and Allen, T.M. 2000. Full Scale Testing ofGeosynthetic Reinforced Walls. Invited keynotepaper. In Proceedings of Geo-Denver 2000.American Society of Civil Engineers. Edited byJ.G. Zornberg and B.R. Christopher. ASCE SpecialPublication No. 103, Advances in Transportationand Geoenvironmental Systems usingGeosynthetics, pp. 201-217.
Bolton, M.D. 1986. The strength and dilatancy of sands.Geotechnique, 36 (1): 65-78.
Boyle, S.R. 1995. Deformation Prediction of GeosyntheticReinforced Soil Retaining Walls. Ph.D. thesis,University of Washington, Washington.
Boyle, S.R., Gallager, M. and Holtz, R.D. 1996. Influenceof Strain Rate, Specimen, Length and Confinementon Measured Geotextile Properties. GeosyntheticsInternational, 3 (2): 205-225.
Bush, D.I. 1990. Variation of Long-Term Design Strengthof Geosynthetics in Temperatures up to 40oC. InProceedings of the Fourth InternationalConference on Geotextiles, Geomembranes, andRelated Products, The Hague, Netherlands, pp.673-676.
Christopher, B.R. 1993. Deformation Response and WallStiffness in Relation to Reinforced Soil WallDesign. Ph.D. Thesis, Purdue University, Indiana.
Christopher, B.R., Gill, S.A., Giroud, J.-P., Juran, I.,Mitchell, J.K., Schlosser, F., and Dunnicliff, J.1990. Reinforced Soil Structures Vol. 1: Designand Construction Guidelines. FHWA ReportFHWA-RD-89-043.
Elias, V., Christopher, B.R., and Berg, R.R. 2001.Mechanically Stabilized Earth Walls andReinforced Soil Slopes - Design and ConstructionGuidelines. FHWA-NHI-00-043, Federal HighwayAdministration, Washington, DC.

Fannin, R.J. 1988. Soil Reinforcement for NorwegianConditions - An Instrumented Field Study of theAnalysis and Design of Geogrid ReinforcedSlopes. Norwegian Geotechnical Institute, Report52757-10.
Fannin, R.J., and Hermann, S. 1990. Performance Datafor a Sloped Reinforced Soil Wall. CanadianGeotechnical Journal, 27: 676-686.
Gnanendran, C.T., and Selvadurai, A.P.S. 2001. StrainMeasurement and Interpretation of StabilizingForce in Geogrid Reinforcement. Geotextiles andGeomembranes, 19: 177-194.
Hatami, K., Bathurst, R.J., and Di Pietro, P. 2001. StaticResponse of Reinforced Soil Retaining Walls withNon-Uniform Reinforcement. International Journalof Geomechanics, 1 (4): 477-506.
Holtz, R.D., and Kovacs, W. D. 1981. An Introduction toGeotechnical Engineering. Prentice-Hall, Inc., NewJersey.
Jewell, R.A., and Wroth, C.P. 1987. Direct Shear Testson Reinforced Sand. Geotechnique, 37 (1): 53-68.
Lade, P.V., and Lee, K.L. 1976. Engineering Properties ofSoils. Report UCLA-ENG-7652. University ofCalifornia, Los Angeles.
Lee, W.F. 2000. Internal Stability Analysis ofGeosynthetic Reinforced Retaining Walls. Ph.D.Thesis, University of Washington, Washington.
Perkins, S.W., and Lapeyre, J.A. 1997. In-Isolation StrainMeasurement of Geosynthetics in Wide-WidthStrip Tension Test. Geosynthetics International, 4(1): 11-32.
Rimoldi, P., and Montanelli, F. 1993. Creep andAccelerated Creep Testing for Geogrids. InProceedings of Geosynthetics '93, Vancouver,British Columbia, Canada, April 1993, Vol. 2, pp.773-787.
Rowe, R.K., and Ho, S.K. 1993. Keynote Lecture: AReview of the Behavior of Reinforced Soil Walls. InProceedings of the International Symposium onEarth Reinforcement Practice, Vol. 2. Edited byH.Ochiai, S. Hayashi, and J. Otani, Balkema, pp.801-830.
Walters, D., Allen, T.M., and Bathurst, R.J. 2002.Conversion of Geosynthetic Strain to Load usingReinforcement Stiffness. GeosyntheticsInternational, 9 (5-6): 483-523.
WSDOT. 1998. Determination of Long-term Strength ofGeosynthetics. WSDOT Test Method 925,Washington State Department of Transportation,FOSSC Materials Laboratory, Tumwater, WA,USA.
Yuan, Z., Swan, R.H., Jr., and Bachus, R.C. 1998. SoilConfinement Effect on Stress-Strain Properties ofGeosynthetics. In Proceedings of the SixthInternational Conference on Geosynthetics, Vol. 2,Atlanta, GA, March 1998, pp. 523-528.
Zornberg, J.G., Sitar, N., and Mitchell, J.K. 1998. LimitEquilibrium as Basis for Design of GeosyntheticReinforced Slopes. Journal of Geotechnical andGeoenvironmental Engineering, 124 (8): 684-698.