Bath Market Profile Presentation
68
Ministry of Agriculture, Food and Rural Affairs Market Analysis Market Analysis Bath June 20, 2007
-
Upload
timothy212 -
Category
Documents
-
view
417 -
download
2
description
Transcript of Bath Market Profile Presentation
Ministry of Agriculture, Food and Rural Affairs
Market AnalysisMarket Analysis Bath
June 20, 2007
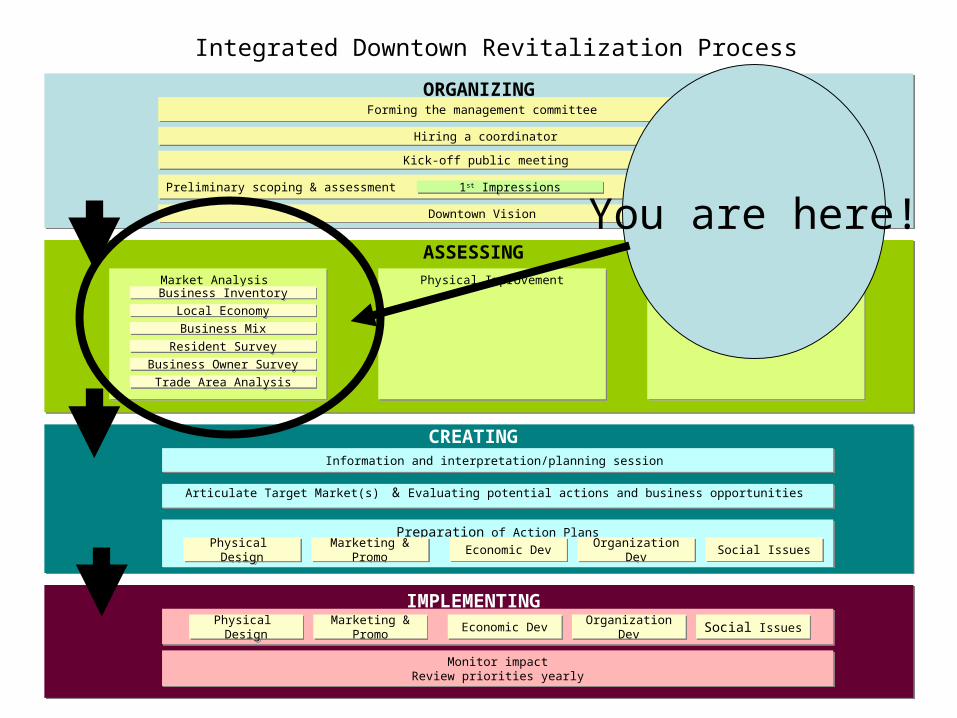
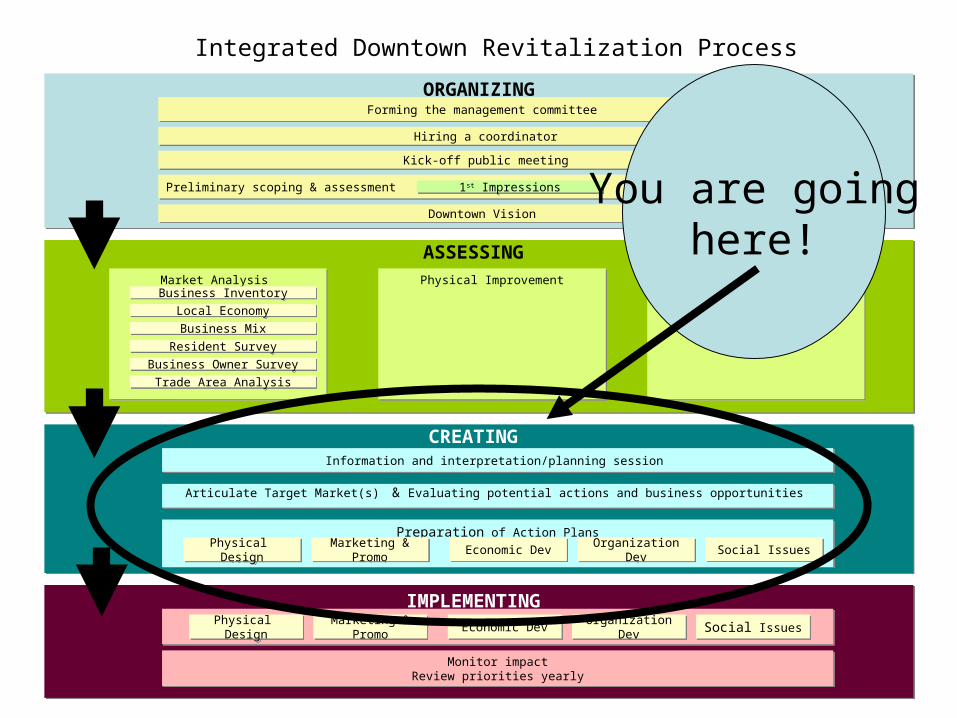
IMPLEMENTING
IMPLEMENTING
CREATING CREATING
Monitor impactReview priorities yearly
Monitor impactReview priorities yearly
ORGANIZINGORGANIZING
ASSESSING ASSESSING
Forming the management committee Forming the management committee
Hiring a coordinator Hiring a coordinator
Kick-off public meeting Kick-off public meeting
Preliminary scoping & assessment Preliminary scoping & assessment
Downtown Vision Downtown Vision
1st Impressions1st Impressions SWOTSWOT
Market Analysis Market Analysis Other researchOther researchPhysical ImprovementPhysical Improvement
Local EconomyLocal Economy
Business MixBusiness Mix
Resident SurveyResident Survey
Business Owner SurveyBusiness Owner Survey
Trade Area AnalysisTrade Area Analysis
Business InventoryBusiness Inventory
Information and interpretation/planning session Information and interpretation/planning session
Articulate Target Market(s) & Evaluating potential actions and business opportunities Articulate Target Market(s) & Evaluating potential actions and business opportunities
Preparation of Action PlansPreparation of Action PlansPhysical Design
Physical Design
Marketing & Promo
Marketing & Promo Economic DevEconomic Dev Organization DevOrganization Dev Social IssuesSocial Issues
Physical Design
Physical Design
Marketing & Promo
Marketing & Promo Economic DevEconomic Dev Organization DevOrganization Dev Social IssuesSocial Issues
Integrated Downtown Revitalization Process
You are here!
Ministry of Agriculture, Food and Rural Affairs
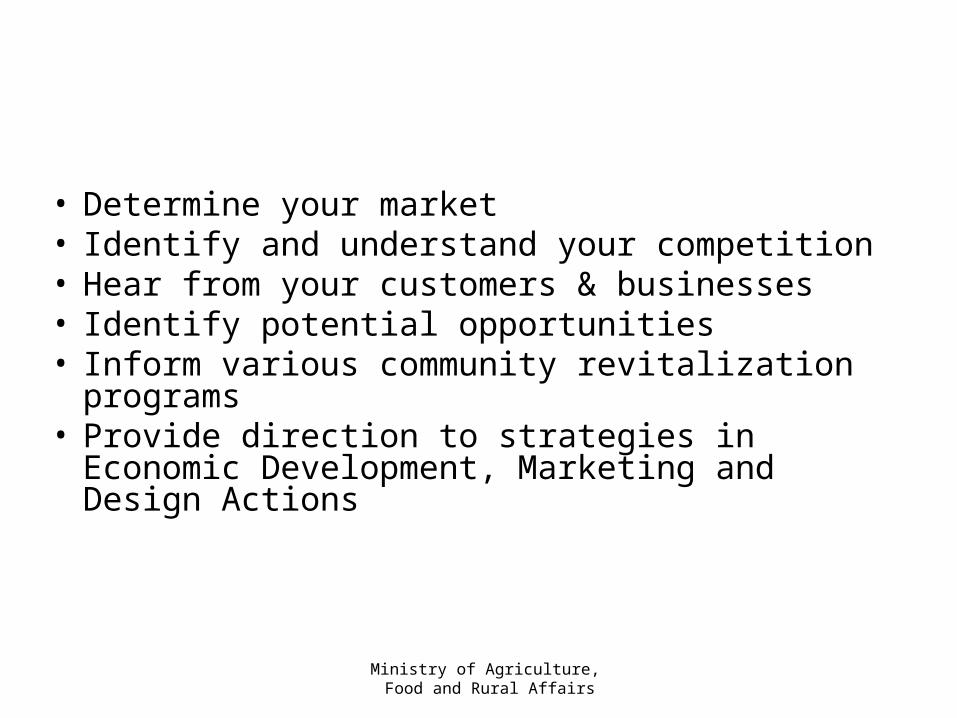
Why Do Market Analysis• Determine your market• Identify and understand your competition• Hear from your customers & businesses• Identify potential opportunities• Inform various community revitalization
programs• Provide direction to strategies in Economic
Development, Marketing and Design Actions
Ministry of Agriculture, Food and Rural Affairs
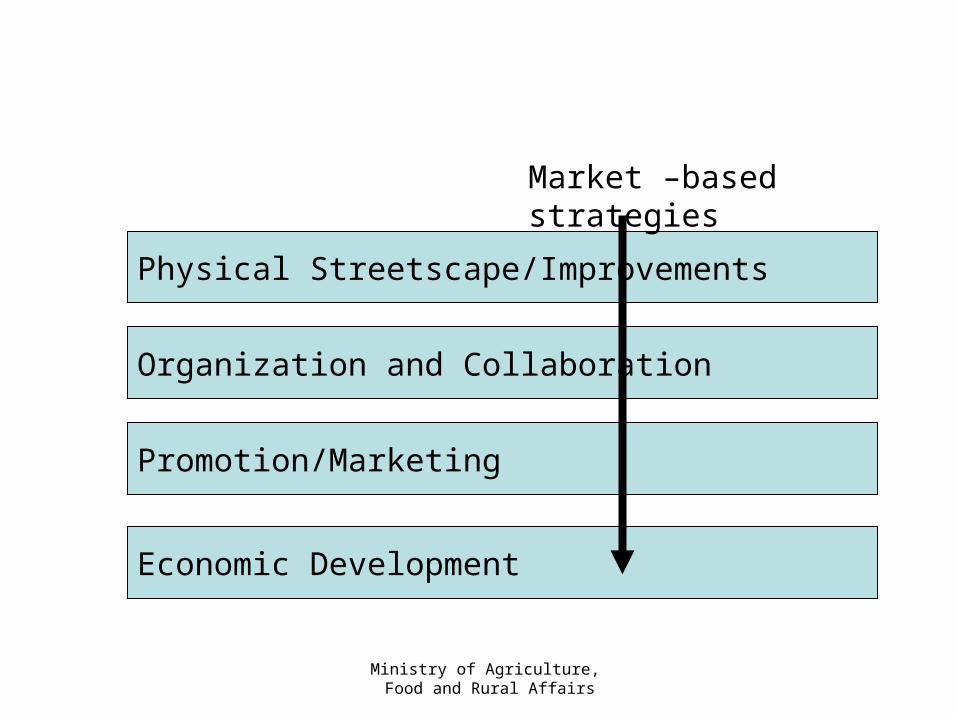
Creating
Physical Streetscape/Improvements
Organization and Collaboration
Promotion/Marketing
Economic Development
Market –based strategies
Ministry of Agriculture, Food and Rural Affairs
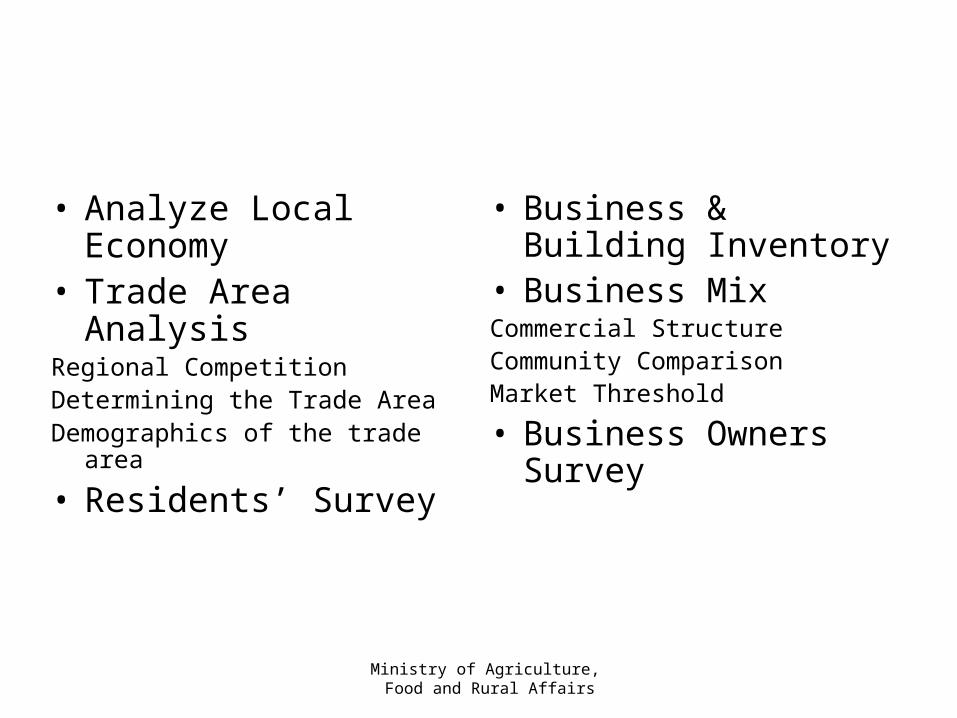
Components• Analyze Local
Economy• Trade Area AnalysisRegional CompetitionDetermining the Trade AreaDemographics of the trade area
• Residents’ Survey
• Business & Building Inventory
• Business MixCommercial StructureCommunity ComparisonMarket Threshold
• Business Owners Survey
Ministry of Agriculture, Food and Rural Affairs
Analyzing Bath’s Economy
Bath – Downtown Market AnalysisReport Back
Purpose
• To provide an overview of the local economy
• Highlight local trends
Bath – Downtown Market AnalysisReport Back
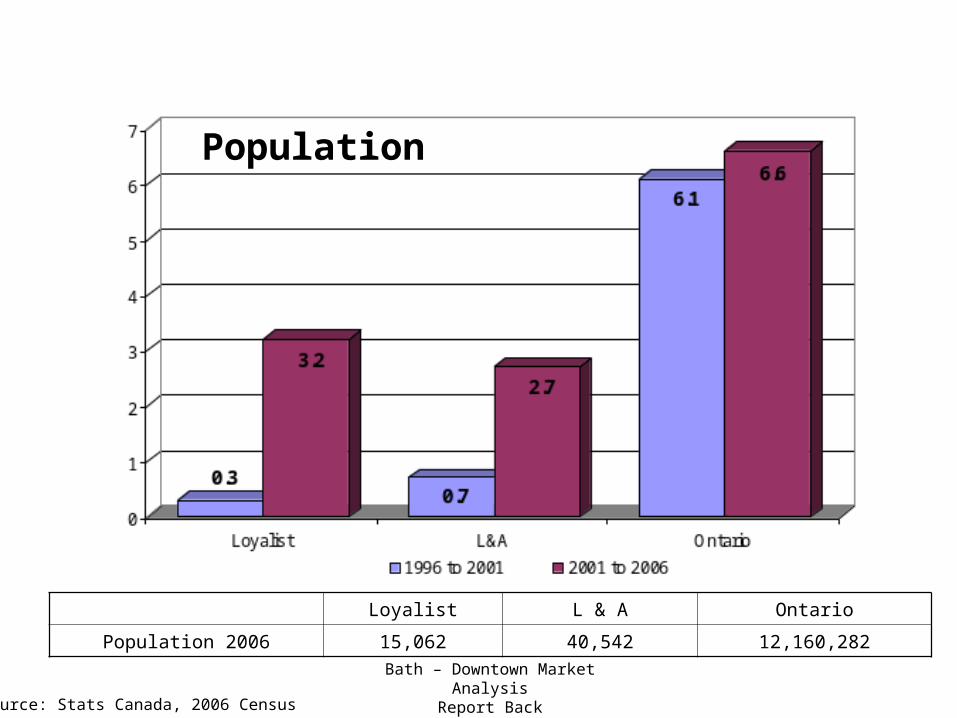
Loyalist L & A Ontario
Population 2006 15,062 40,542 12,160,282
Source: Stats Canada, 2006 Census
Population
Bath – Downtown Market AnalysisReport Back
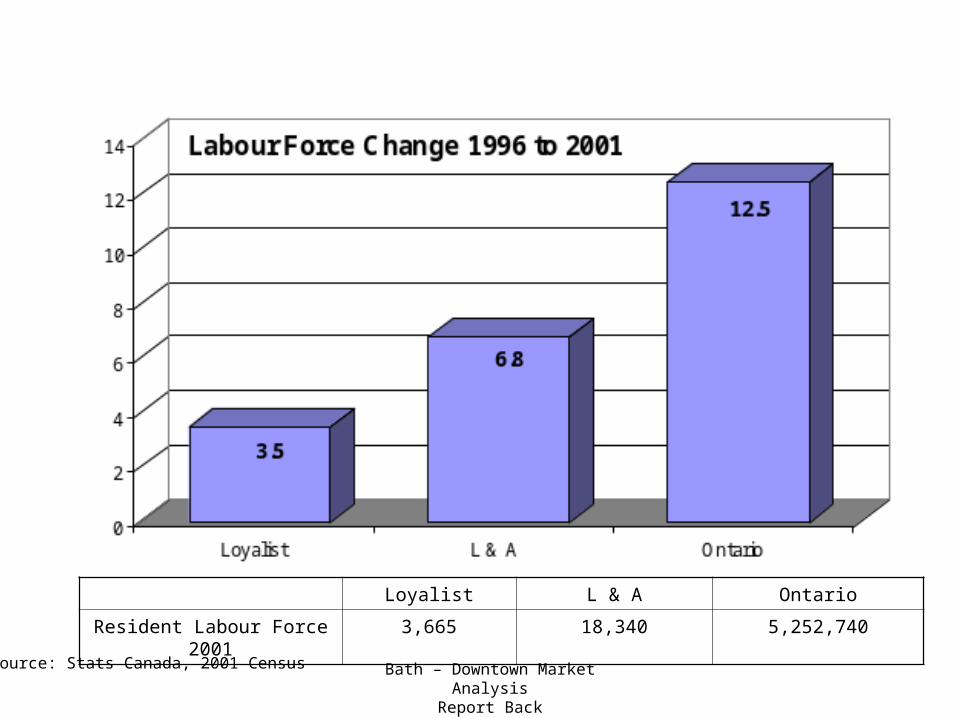
Loyalist L & A Ontario
Resident Labour Force 2001 3,665 18,340 5,252,740
Source: Stats Canada, 2001 Census
Bath – Downtown Market AnalysisReport Back
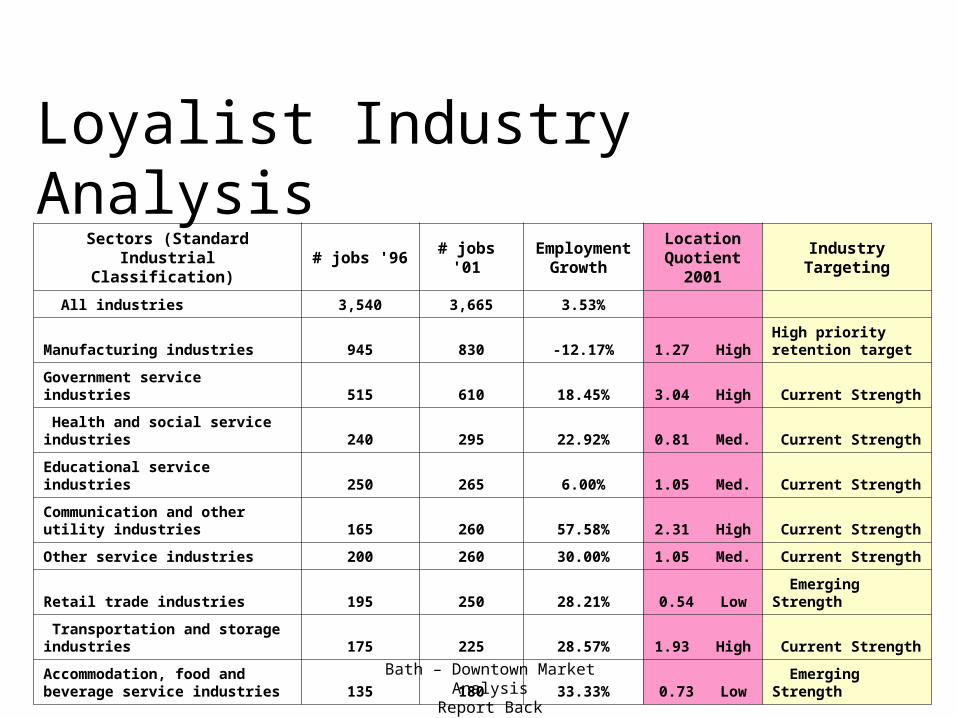
Loyalist Industry Analysis Sectors (Standard Industrial
Classification) # jobs '96 # jobs '01
Employment Growth
Location Quotient
2001Industry Targeting
All industries 3,540 3,665 3.53%
Manufacturing industries 945 830 -12.17% 1.27 HighHigh priority retention target
Government service industries 515 610 18.45% 3.04 High Current Strength
Health and social service industries 240 295 22.92% 0.81 Med. Current Strength
Educational service industries 250 265 6.00% 1.05 Med. Current Strength
Communication and other utility industries 165 260 57.58% 2.31 High Current Strength
Other service industries 200 260 30.00% 1.05 Med. Current Strength
Retail trade industries 195 250 28.21% 0.54 Low Emerging Strength
Transportation and storage industries 175 225 28.57% 1.93 High Current Strength
Accommodation, food and beverage service industries 135 180 33.33% 0.73 Low Emerging Strength
Bath – Downtown Market AnalysisReport Back
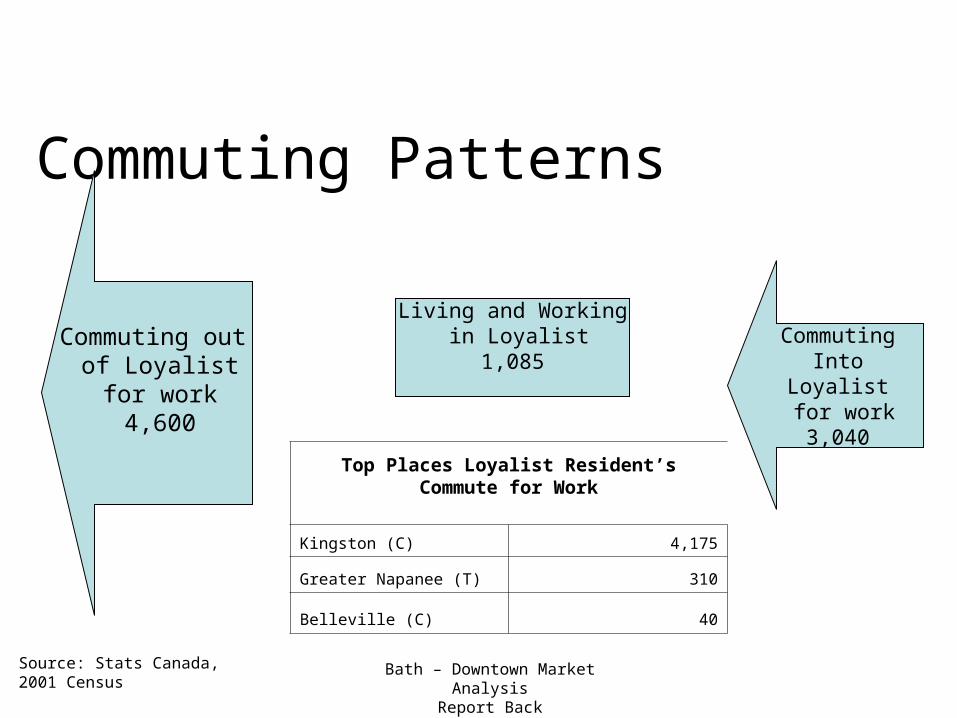
Commuting Patterns
Living and Working in Loyalist
1,085
CommutingInto Loyalist
for work3,040
Commuting out of Loyalistfor work4,600
Source: Stats Canada, 2001 Census
Top Places Loyalist Resident’s Commute for Work
Kingston (C) 4,175
Greater Napanee (T) 310
Belleville (C) 40
Bath – Downtown Market AnalysisReport Back
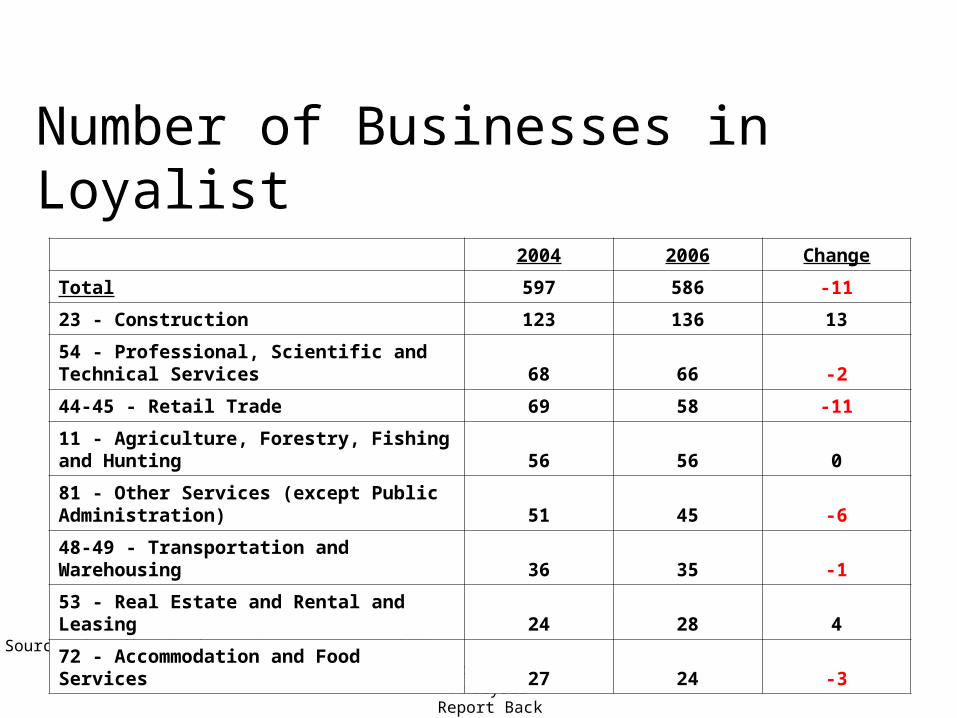
Number of Businesses in Loyalist
Source: Canadian Business Patterns, June 2006.
2004 2006 Change
Total 597 586 -11
23 - Construction 123 136 13
54 - Professional, Scientific and Technical Services 68 66 -2
44-45 - Retail Trade 69 58 -11
11 - Agriculture, Forestry, Fishing and Hunting 56 56 0
81 - Other Services (except Public Administration) 51 45 -6
48-49 - Transportation and Warehousing 36 35 -1
53 - Real Estate and Rental and Leasing 24 28 4
72 - Accommodation and Food Services 27 24 -3
Bath – Downtown Market AnalysisReport Back
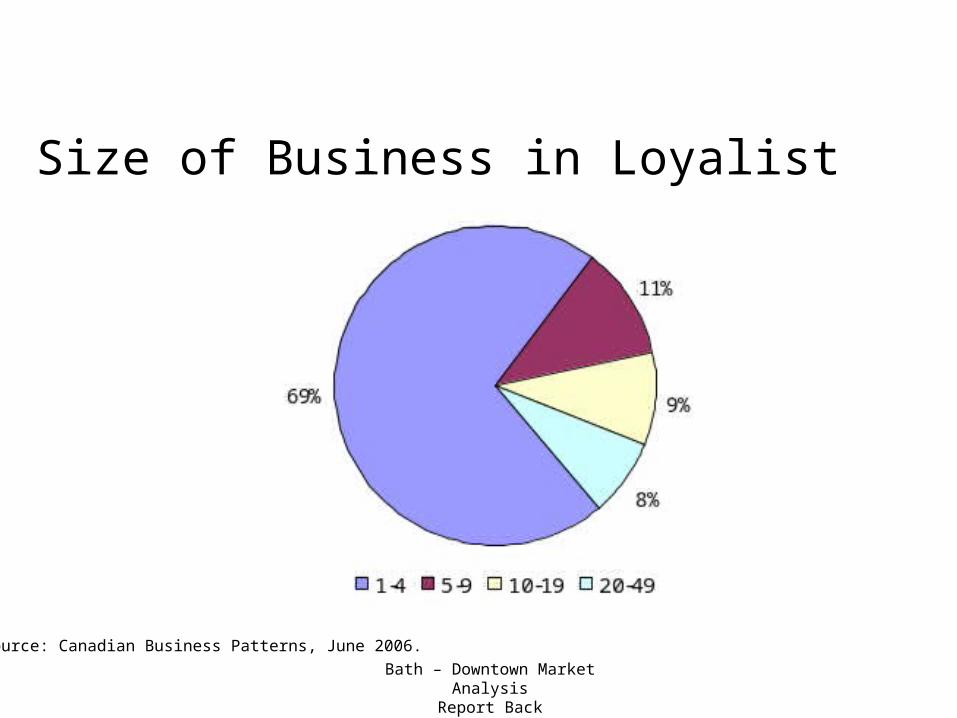
Size of Business in Loyalist
Source: Canadian Business Patterns, June 2006.
Bath – Downtown Market AnalysisReport Back
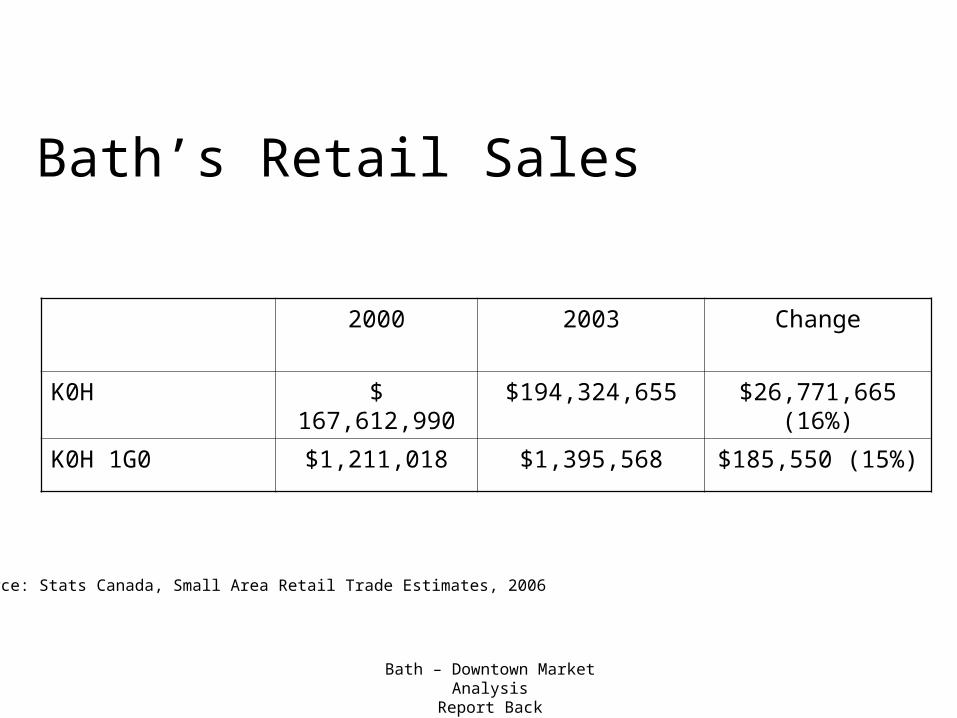
Bath’s Retail Sales
2000 2003 Change
K0H $ 167,612,990 $194,324,655 $26,771,665 (16%)
K0H 1G0 $1,211,018 $1,395,568 $185,550 (15%)
Source: Stats Canada, Small Area Retail Trade Estimates, 2006
Ministry of Agriculture, Food and Rural Affairs
Bath’s Customer Origin Survey& Trade AreaAnalysis Results
Bath – Downtown Market AnalysisReport Back
Purpose– Learn the buying habits of customers in the
trade area.– Determine the most appropriate customer
groups to target and market.– Make decisions regarding the type of
businesses, merchandise sold, and services offered.
Bath – Downtown Market AnalysisReport Back
Trade Area Analysis• A trade area is the area that generates the
majority of consumers (60 – 80%)for a community, business district or downtown.
• Different business will have different trade areas depending on their product.– Variety Store vs. Specialty Product Store
• A trade area is used to generate information about the people within the area.
Bath – Downtown Market AnalysisReport Back
What is a Trade Area?• A trade area is the area that generates the
majority of consumers (60 – 80%)for a community, business district or downtown.
• Different business will have different trade areas depending on their product.– Variety Store vs. Specialty Product Store
• A trade area is used to generate information about the people within the area.
Bath – Downtown Market AnalysisReport Back
Customer Origin Survey
• Is a short survey used to collect information from customers at selected businesses to determine where they are from, and why they are shopping in the community.
• The Bath Customer Origin Survey collected data at businesses in the community received 333 responses.
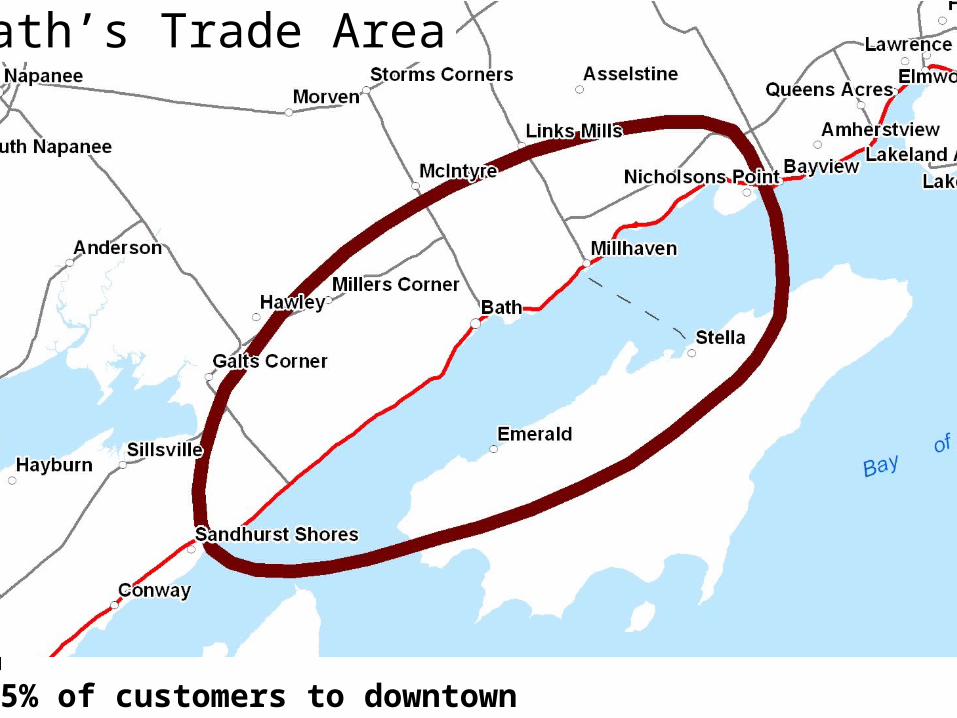
Bath – Downtown Market AnalysisReport Back75% of customers to downtown
Bath’s Trade Area
Bath – Downtown Market AnalysisReport Back
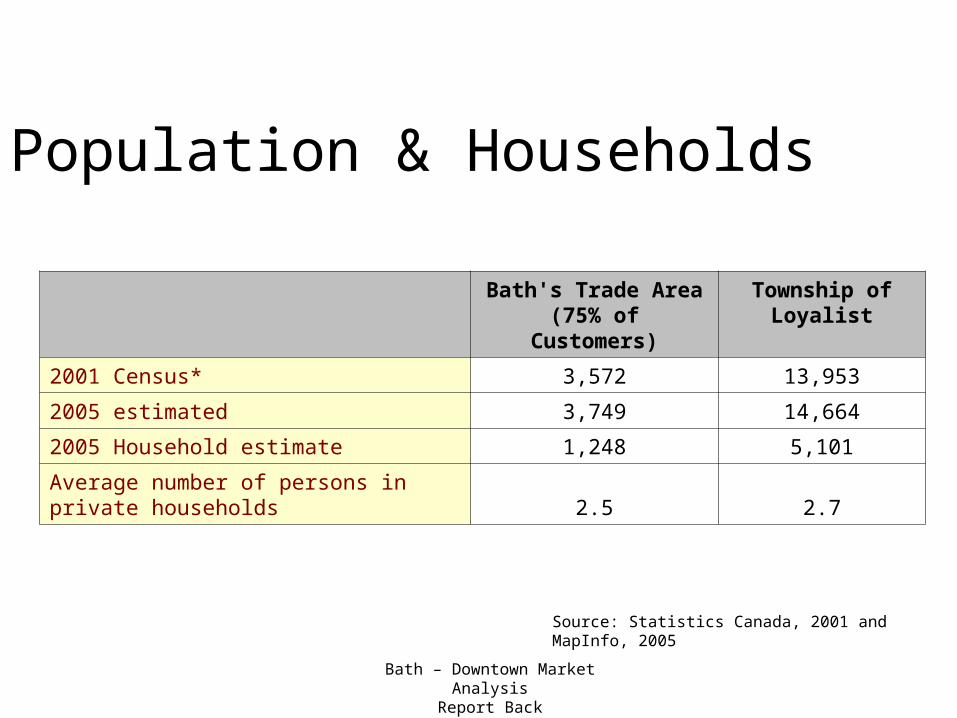
Population & Households
Source: Statistics Canada, 2001 and MapInfo, 2005
Bath's Trade Area (75% of
Customers)
Township of Loyalist
2001 Census* 3,572 13,953
2005 estimated 3,749 14,664
2005 Household estimate 1,248 5,101
Average number of persons in private households 2.5 2.7
Bath – Downtown Market AnalysisReport BackSource: Statistics Canada, 2001 and MapInfo, 2005
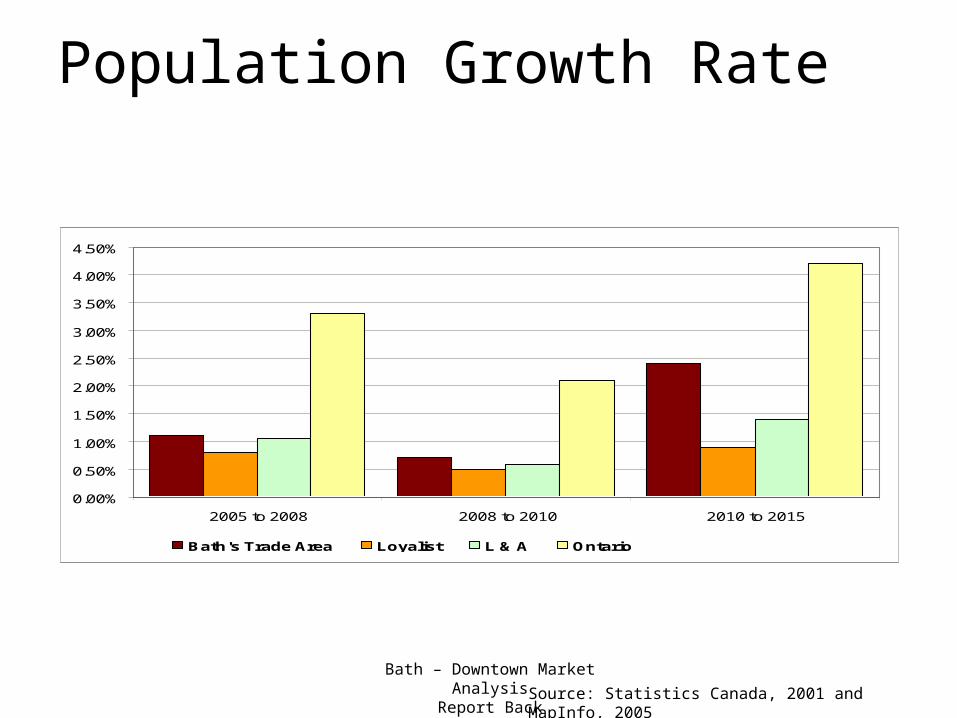
Population Growth Rate
0.00%
0.50%
1.00%
1.50%
2.00%
2.50%
3.00%
3.50%
4.00%
4.50%
2005 to 2008 2008 to 2010 2010 to 2015
Bath's Trade Area Loyalist L & A Ontario
Bath – Downtown Market AnalysisReport Back
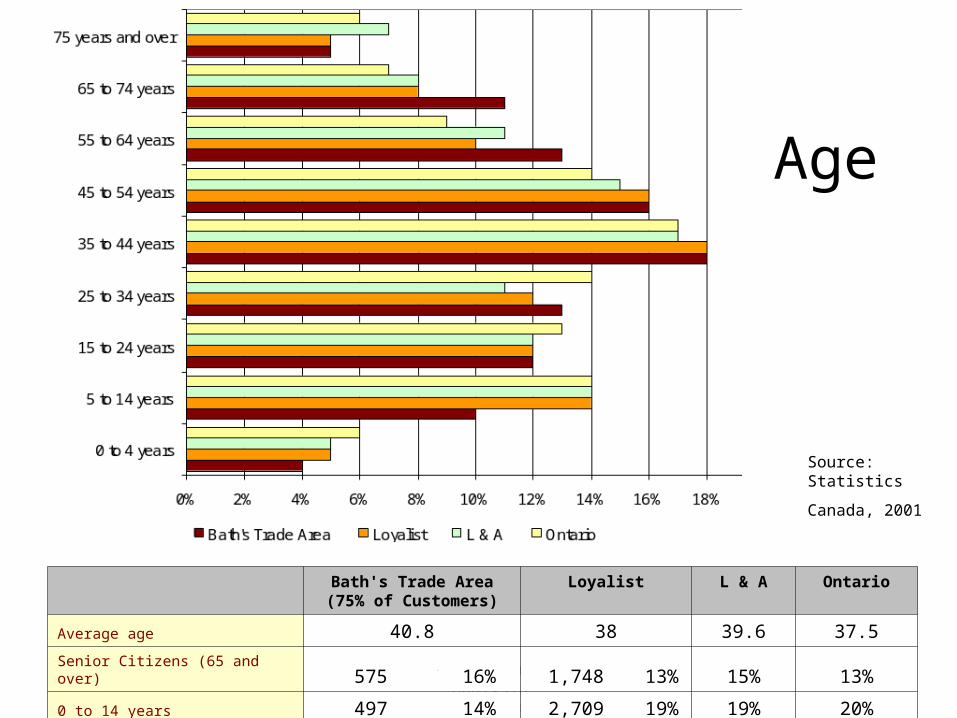
Age
Bath's Trade Area (75% of Customers)
Loyalist L & A Ontario
Average age 40.8 38 39.6 37.5
Senior Citizens (65 and over) 575 16% 1,748 13% 15% 13%
0 to 14 years 497 14% 2,709 19% 19% 20%
Source: Statistics
Canada, 2001
Bath – Downtown Market AnalysisReport Back
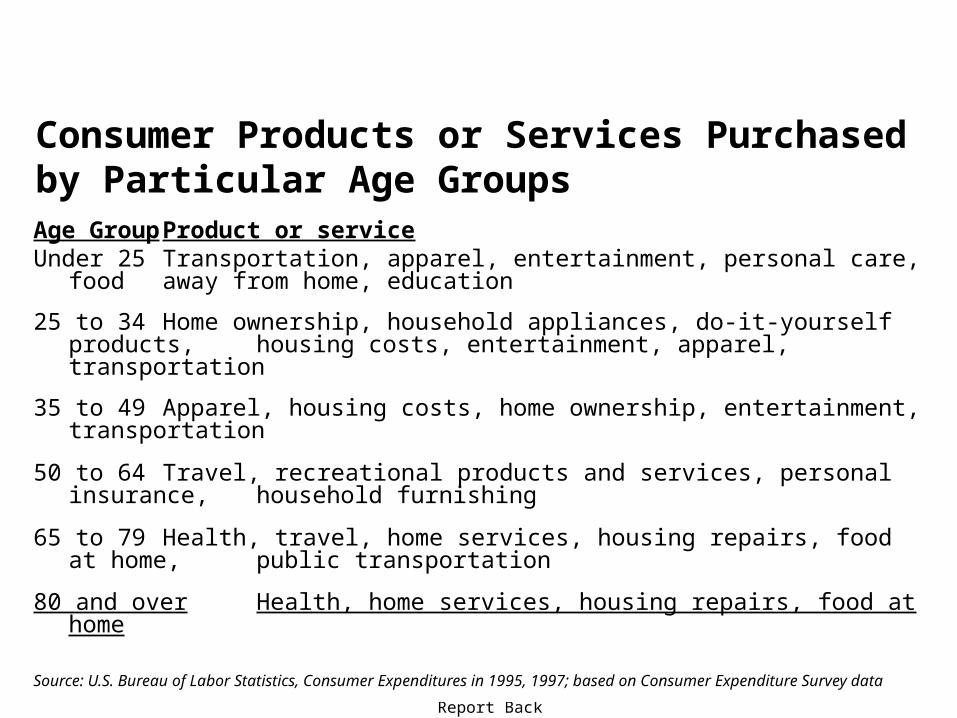
Consumer Products or Services Purchased by Particular Age GroupsAge Group Product or serviceUnder 25 Transportation, apparel, entertainment, personal care, food
away from home, education
25 to 34 Home ownership, household appliances, do-it-yourself products, housing costs, entertainment, apparel, transportation
35 to 49 Apparel, housing costs, home ownership, entertainment, transportation
50 to 64 Travel, recreational products and services, personal insurance, household furnishing
65 to 79 Health, travel, home services, housing repairs, food at home, public transportation
80 and over Health, home services, housing repairs, food at home
Source: U.S. Bureau of Labor Statistics, Consumer Expenditures in 1995, 1997; based on Consumer Expenditure Survey data
Bath – Downtown Market AnalysisReport Back
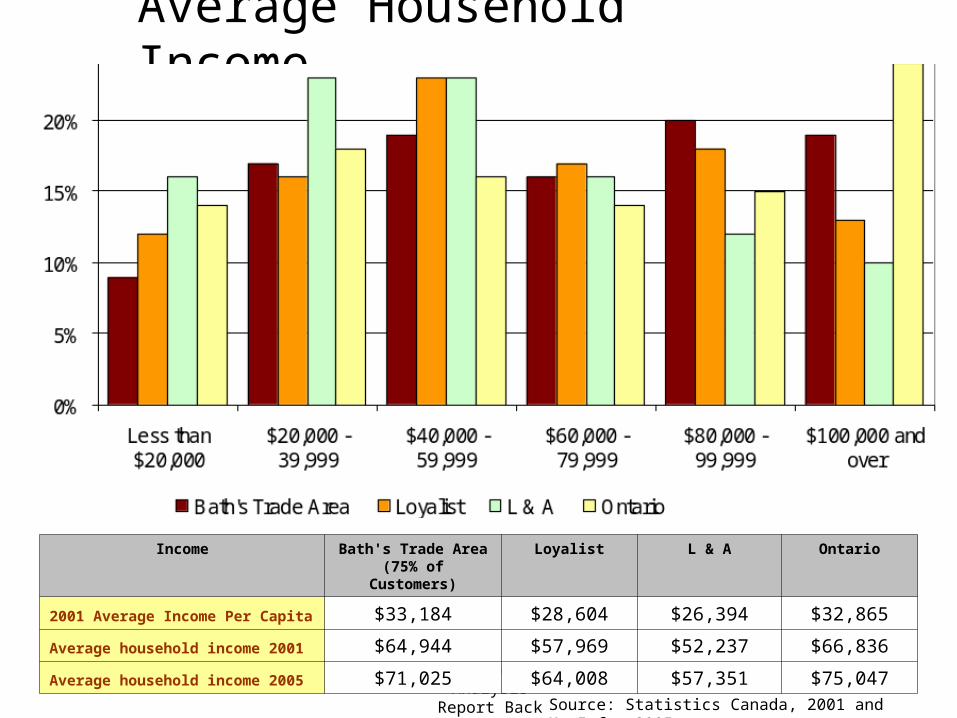
Income Bath's Trade Area (75% of
Customers)
Loyalist L & A Ontario
2001 Average Income Per Capita $33,184 $28,604 $26,394 $32,865
Average household income 2001 $64,944 $57,969 $52,237 $66,836
Average household income 2005 $71,025 $64,008 $57,351 $75,047
Source: Statistics Canada, 2001 and MapInfo, 2005
Average Household Income
Bath – Downtown Market AnalysisReport Back
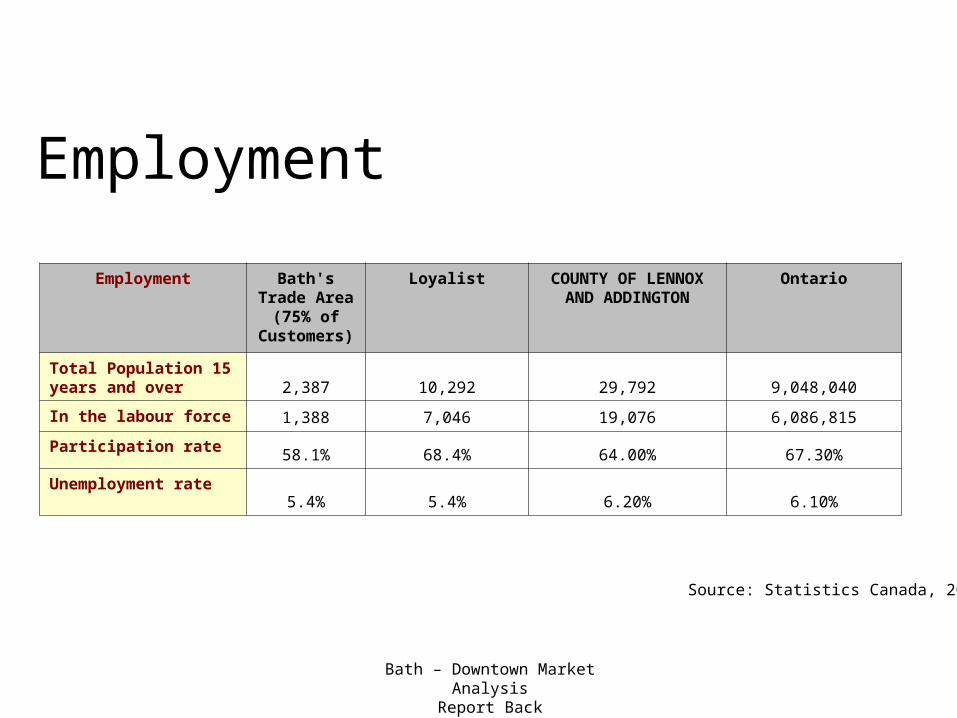
Employment
Source: Statistics Canada, 2001
Employment Bath's Trade Area
(75% of Customers
)
Loyalist COUNTY OF LENNOX AND ADDINGTON
Ontario
Total Population 15 years and over 2,387 10,292 29,792 9,048,040
In the labour force 1,388 7,046 19,076 6,086,815
Participation rate 58.1% 68.4% 64.00% 67.30%
Unemployment rate 5.4% 5.4% 6.20% 6.10%
Bath – Downtown Market AnalysisReport Back
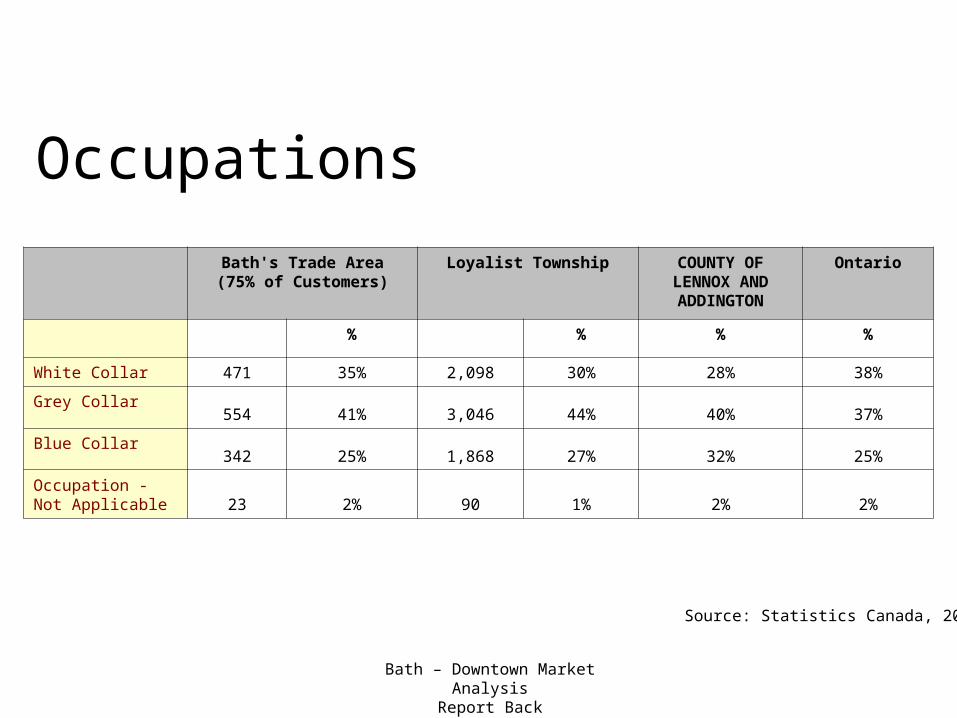
Occupations
Source: Statistics Canada, 2001
Bath's Trade Area (75% of Customers)
Loyalist Township COUNTY OF LENNOX AND ADDINGTON
Ontario
% % % %
White Collar 471 35% 2,098 30% 28% 38%
Grey Collar554 41% 3,046 44% 40% 37%
Blue Collar342 25% 1,868 27% 32% 25%
Occupation - Not Applicable 23 2% 90 1% 2% 2%

Bath – Downtown Market AnalysisReport Back
Highest Level of Education
Source: Statistics Canada, 2001
Bath – Downtown Market AnalysisReport Back
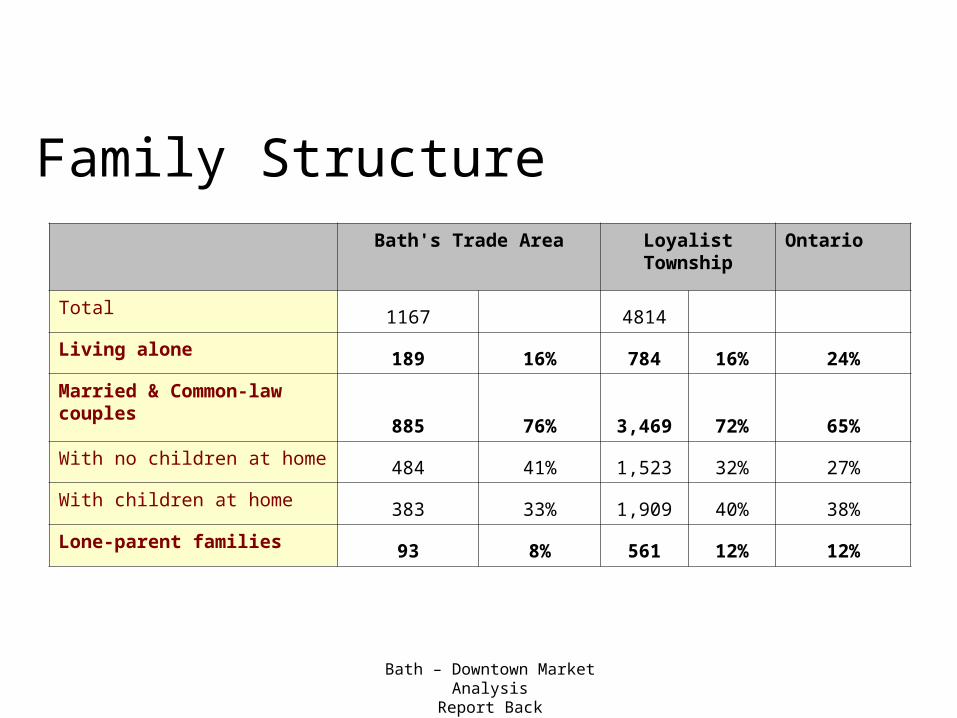
Family StructureBath's Trade Area Loyalist
TownshipOntario
Total 1167 4814
Living alone 189 16% 784 16% 24%
Married & Common-law couples
885 76% 3,469 72% 65%
With no children at home 484 41% 1,523 32% 27%
With children at home 383 33% 1,909 40% 38%
Lone-parent families 93 8% 561 12% 12%
Bath – Downtown Market AnalysisReport Back
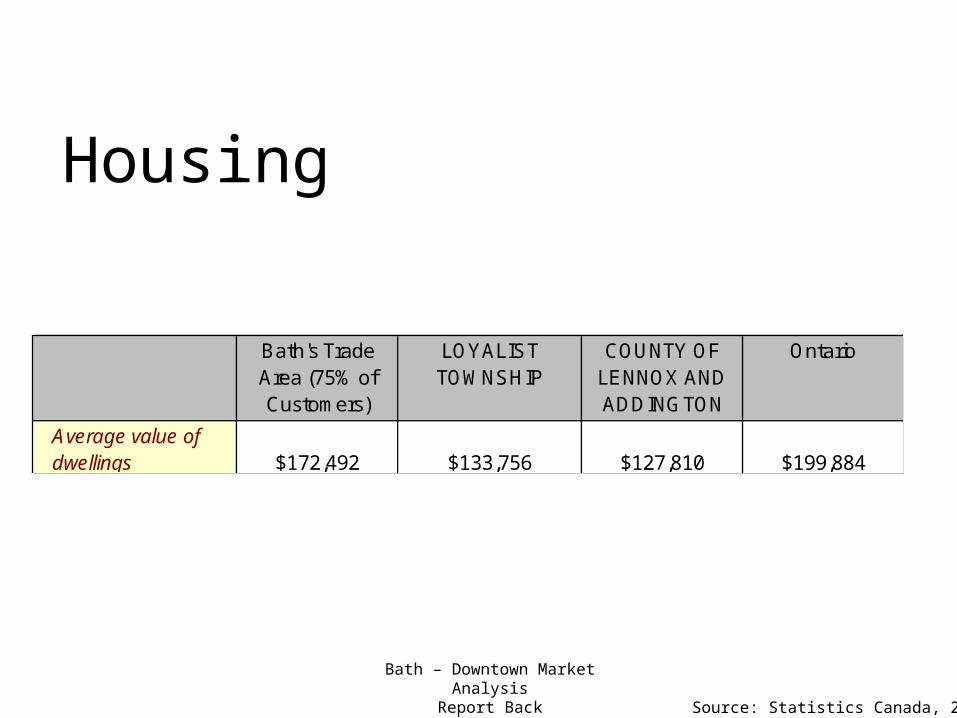
Housing
Source: Statistics Canada, 2001
Average value of dwellings $172,492 $133,756 $127,810 $199,884
Bath's Trade Area (75% of Customers)
LOYALIST TOWNSHIP
COUNTY OF LENNOX AND ADDINGTON
Ontario
Bath – Downtown Market AnalysisReport Back
GeoDemographics• It targets consumers using a cluster analysis of
2001 census demographics and exhaustive survey data on how Canadians spend their time and their money.
• It classifies all Canadians into one of 66 lifestyle types--with names like Cosmopolitan Elite, Electric Avenues, Les Chics and Lunch at Tim's.
Bath – Downtown Market AnalysisReport Back
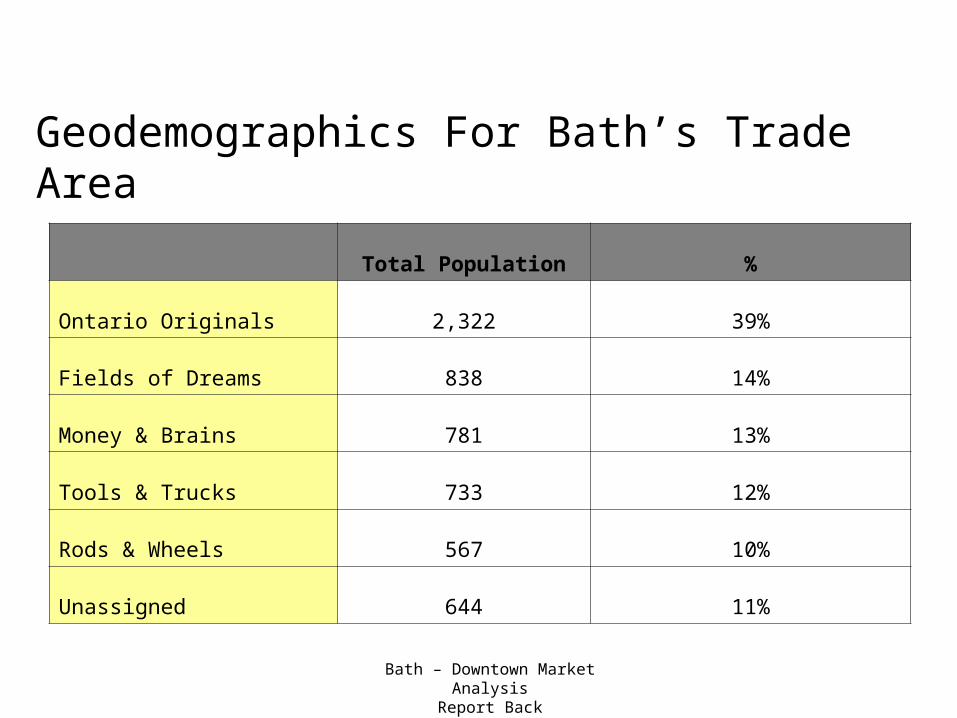
Geodemographics For Bath’s Trade Area
Total Population %
Ontario Originals 2,322 39%
Fields of Dreams 838 14%
Money & Brains 781 13%
Tools & Trucks 733 12%
Rods & Wheels 567 10%
Unassigned 644 11%
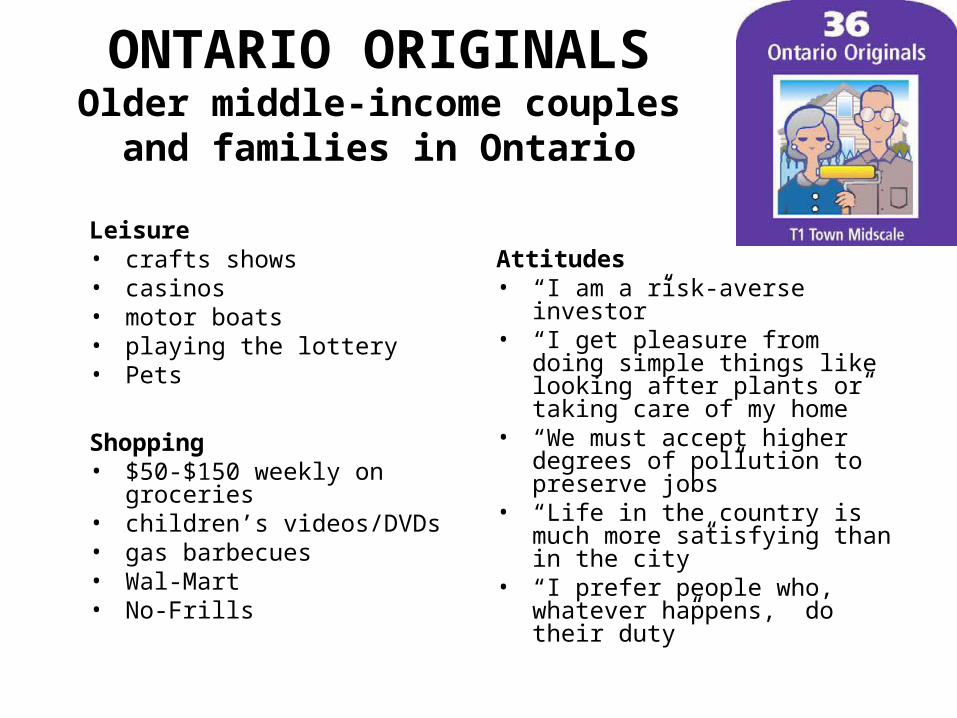
ONTARIO ORIGINALSOlder middle-income couples and
families in Ontario
Leisure• crafts shows• casinos• motor boats• playing the lottery• Pets
Shopping• $50-$150 weekly on groceries• children’s videos/DVDs• gas barbecues• Wal-Mart• No-Frills
Attitudes• “I am a risk-averse investor”• “I get pleasure from doing simple
things like looking after plants or taking care of my home”
• “We must accept higher degrees of pollution to preserve jobs”
• “Life in the country is much more satisfying than in the city”
• “I prefer people who, whatever happens, do their duty”
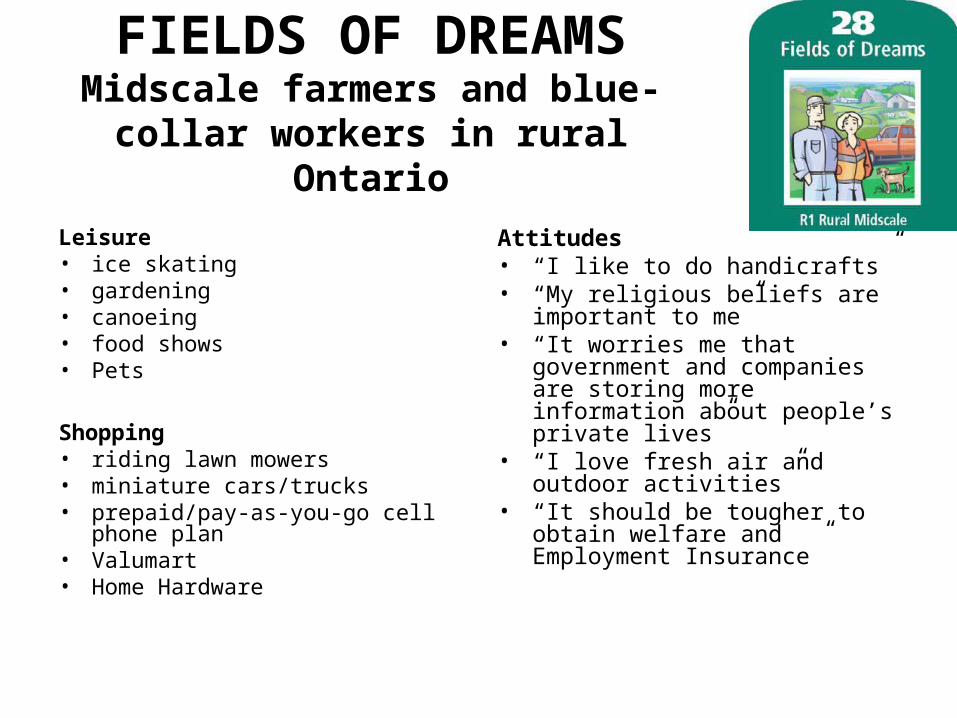
FIELDS OF DREAMSMidscale farmers and blue-collar
workers in rural Ontario
Leisure• ice skating• gardening• canoeing• food shows• Pets
Shopping• riding lawn mowers• miniature cars/trucks• prepaid/pay-as-you-go cell phone
plan• Valumart• Home Hardware
Attitudes• “I like to do handicrafts”• “My religious beliefs are important
to me”• “It worries me that government
and companies are storing more information about people’s private lives”
• “I love fresh air and outdoor activities”
• “It should be tougher to obtain welfare and Employment Insurance”
Bath – Downtown Market AnalysisReport Back
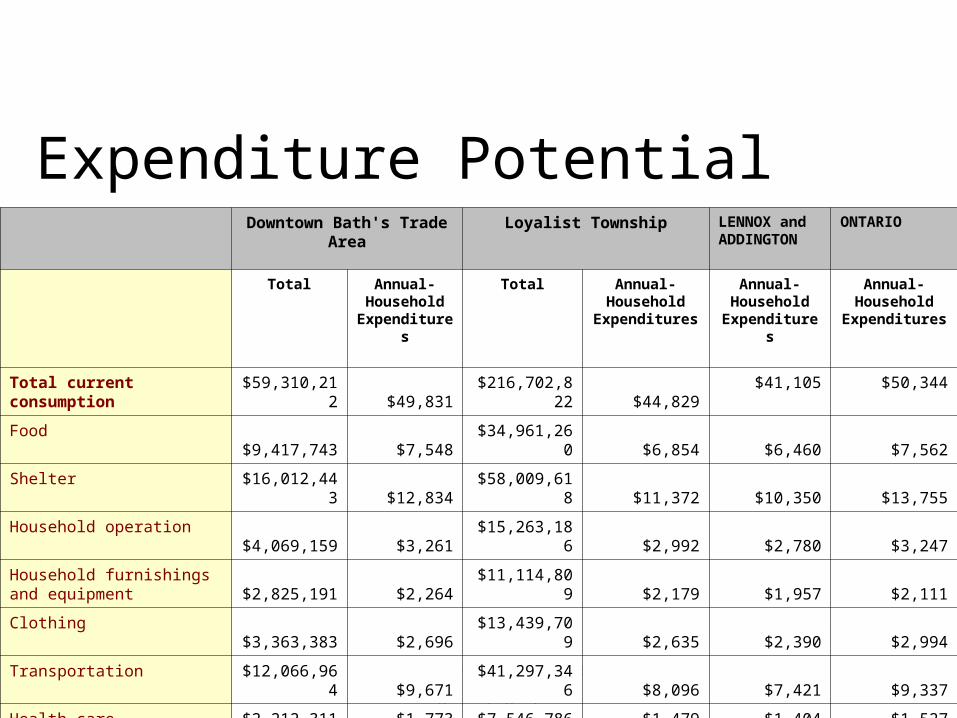
Expenditure Potential
Source: MapInfo, 2005
Downtown Bath's Trade Area
Loyalist Township LENNOX and ADDINGTON
ONTARIO
Total Annual-Household Expenditur
es
Total Annual-Household
Expenditures
Annual-Household
Expenditures
Annual-Household
Expenditures
Total current consumption
$59,310,212 $49,831
$216,702,822 $44,829
$41,105 $50,344
Food$9,417,743 $7,548
$34,961,260 $6,854 $6,460 $7,562
Shelter $16,012,443 $12,834
$58,009,618 $11,372 $10,350 $13,755
Household operation$4,069,159 $3,261
$15,263,186 $2,992 $2,780 $3,247
Household furnishings and equipment $2,825,191 $2,264
$11,114,809 $2,179 $1,957 $2,111
Clothing$3,363,383 $2,696
$13,439,709 $2,635 $2,390 $2,994
Transportation $12,066,964 $9,671
$41,297,346 $8,096 $7,421 $9,337
Health care $2,212,311 $1,773 $7,546,786 $1,479 $1,404 $1,527
Personal care $1,341,015 $1,075 $5,338,965 $1,047 $965 $1,181
Recreation$5,478,545 $4,391
$20,209,135 $3,962 $3,544 $4,237
Reading materials and other printed matter $457,729 $367 $1,646,457 $323 $295 $340
Tobacco products and alcoholic beverages $2,065,729 $1,656 $7,875,552 $1,544 $1,428 $1,381

Ministry of Agriculture, Food and Rural Affairs
Residents Survey
Ministry of Agriculture, Food and Rural Affairs
Purpose of Resident Survey• Determine retail/service needs, shopping behaviour,
and perceptions of downtown.
• Identify market gaps, businesses not meeting customer needs, goods/services residents feel are lacking.
• Give all residents an opportunity to become involved in their community’s development and communicate that a plan is being prepared.
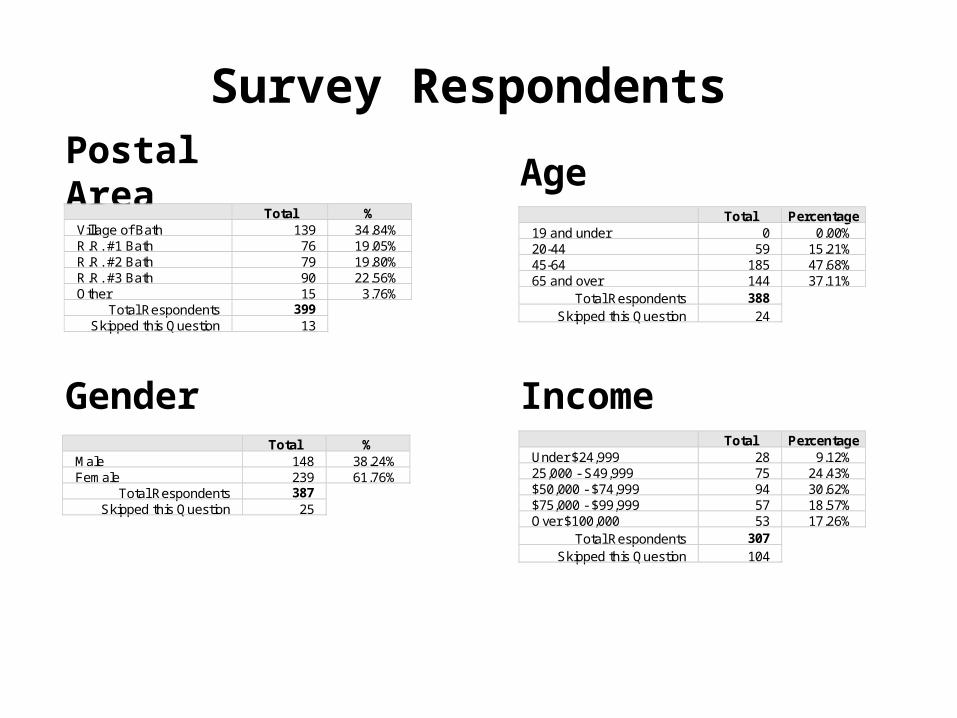
Postal Area
Gender
Survey Respondents
Age
Income
Total % Village of Bath 139 34.84% R.R. #1 Bath 76 19.05% R.R. #2 Bath 79 19.80% R.R. #3 Bath 90 22.56% Other 15 3.76%
Total Respondents 399 Skipped this Question 13
Total % Male 148 38.24% Female 239 61.76%
Total Respondents 387 Skipped this Question 25
Total Percentage 19 and under 0 0.00% 20-44 59 15.21% 45-64 185 47.68% 65 and over 144 37.11%
Total Respondents 388 Skipped this Question 24
Total Percentage Under $24,999 28 9.12% 25,000 - S49,999 75 24.43% $50,000 - $74,999 94 30.62% $75,000 - $99,999 57 18.57% Over $100,000 53 17.26%
Total Respondents 307 Skipped this Question 104
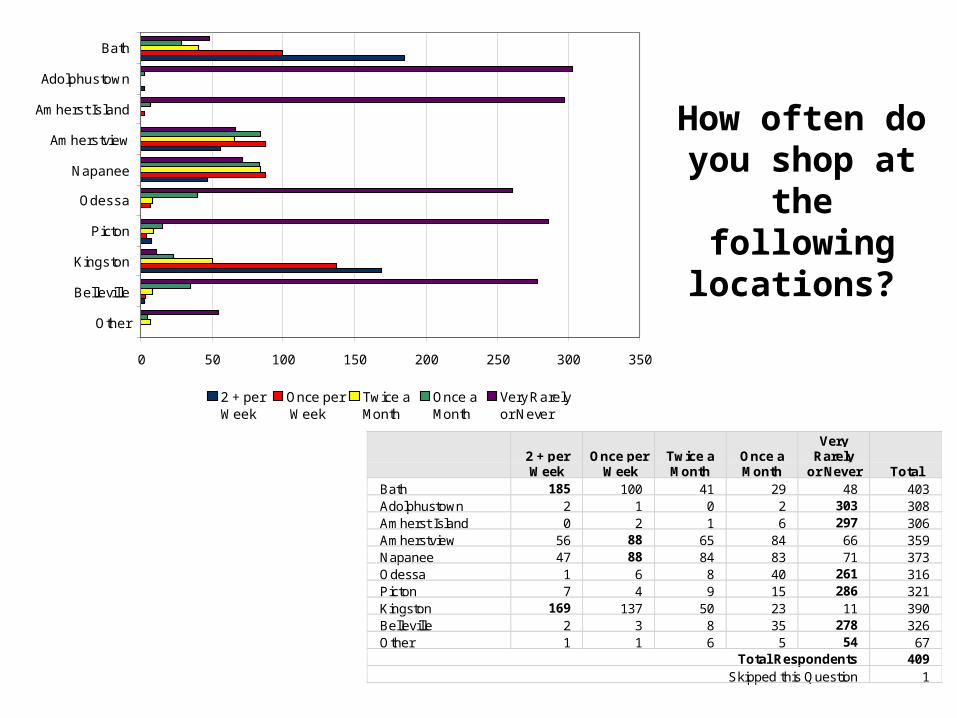
How often do you shop at the
following locations?
2 + per Week
Once per Week
Twice a Month
Once a Month
Very Rarely
or Never Total Bath 185 100 41 29 48 403 Adolphustown 2 1 0 2 303 308 Amherst Island 0 2 1 6 297 306 Amherstview 56 88 65 84 66 359 Napanee 47 88 84 83 71 373 Odessa 1 6 8 40 261 316 Picton 7 4 9 15 286 321 Kingston 169 137 50 23 11 390 Belleville 2 3 8 35 278 326 Other 1 1 6 5 54 67
Total Respondents 409 Skipped this Question 1
0 50 100 150 200 250 300 350
Other
Belleville
Kingston
Picton
Odessa
Napanee
Amherstview
Amherst Island
Adolphustown
Bath
2 + per Week
Once per Week
Twice a Month
Once a Month
Very Rarely or Never
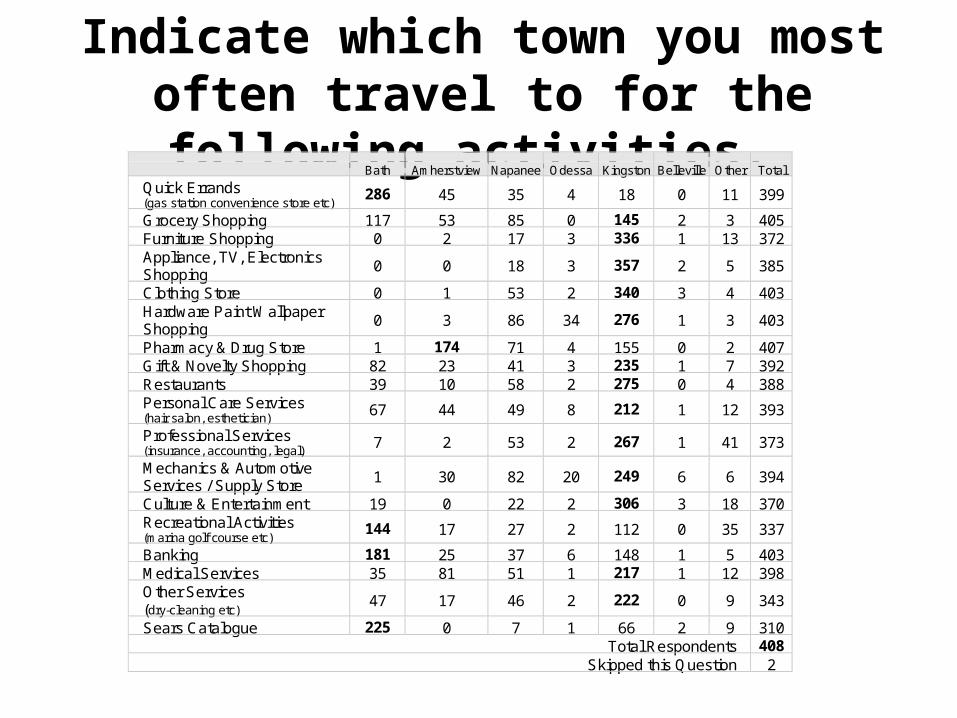
Indicate which town you most often travel to for the following activities.
Bath Amherstview Napanee Odessa Kingston Belleville Other Total
Quick Errands (gas station convenience store etc) 286 45 35 4 18 0 11 399
Grocery Shopping 117 53 85 0 145 2 3 405 Furniture Shopping 0 2 17 3 336 1 13 372 Appliance, TV, Electronics Shopping
0 0 18 3 357 2 5 385
Clothing Store 0 1 53 2 340 3 4 403 Hardware Paint Wallpaper Shopping
0 3 86 34 276 1 3 403
Pharmacy & Drug Store 1 174 71 4 155 0 2 407 Gift & Novelty Shopping 82 23 41 3 235 1 7 392 Restaurants 39 10 58 2 275 0 4 388 Personal Care Services (hair salon, esthetician)
67 44 49 8 212 1 12 393
Professional Services (insurance, accounting, legal) 7 2 53 2 267 1 41 373
Mechanics & Automotive Services / Supply Store
1 30 82 20 249 6 6 394
Culture & Entertainment 19 0 22 2 306 3 18 370 Recreational Activities (marina golf course etc) 144 17 27 2 112 0 35 337
Banking 181 25 37 6 148 1 5 403 Medical Services 35 81 51 1 217 1 12 398 Other Services (dry-cleaning etc)
47 17 46 2 222 0 9 343
Sears Catalogue 225 0 7 1 66 2 9 310 Total Respondents 408
Skipped this Question 2

When you shop in places other than Bath what are the main reasons why?
Total Percentage Closer to work 97 24.01% Better hours 83 20.54% Better price 185 45.79% Better selection 280 69.31% Better quality 68 16.83% Customer service 19 4.70% The goods I need are not in my community’s downtown 315 77.97% Other 39 9.65%
Total Respondents 404 Skipped this Question 6
0 50 100 150 200 250 300 350
Other
Goods needed are not in my community
Customer service
Better quality
Better selection
Better price
Better hours
Closer to work
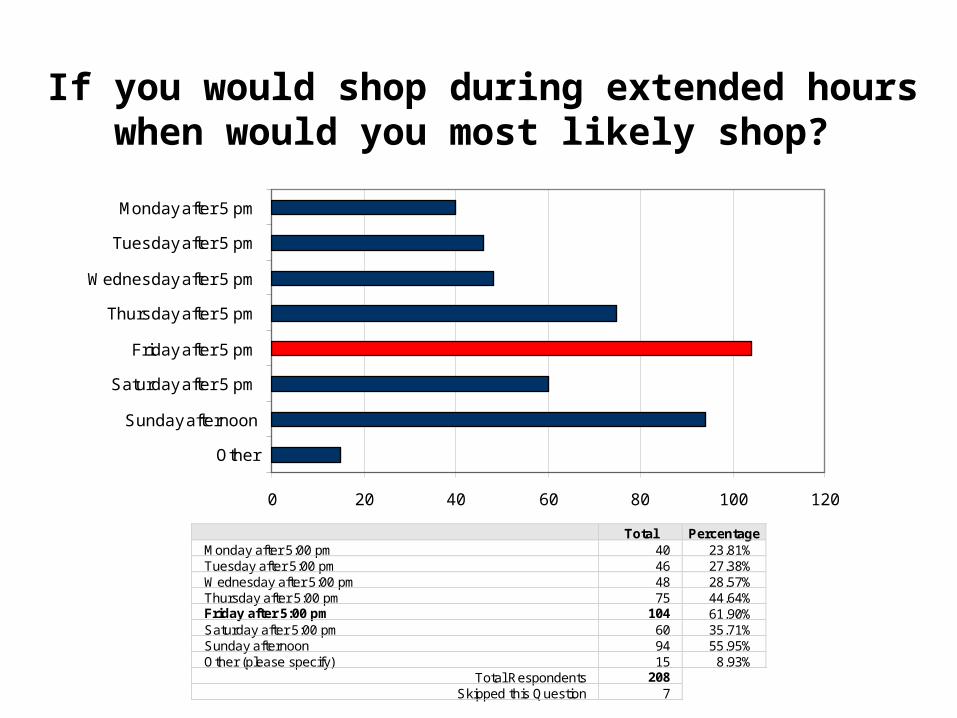
If you would shop during extended hours when would you most likely shop?
0 20 40 60 80 100 120
Other
Sunday afternoon
Saturday after 5 pm
Friday after 5 pm
Thursday after 5 pm
Wednesday after 5 pm
Tuesday after 5 pm
Monday after 5 pm
Total Percentage Monday after 5:00 pm 40 23.81% Tuesday after 5:00 pm 46 27.38% Wednesday after 5:00 pm 48 28.57% Thursday after 5:00 pm 75 44.64% Friday after 5:00 pm 104 61.90% Saturday after 5:00 pm 60 35.71% Sunday afternoon 94 55.95% Other (please specify) 15 8.93%
Total Respondents 208 Skipped this Question 7
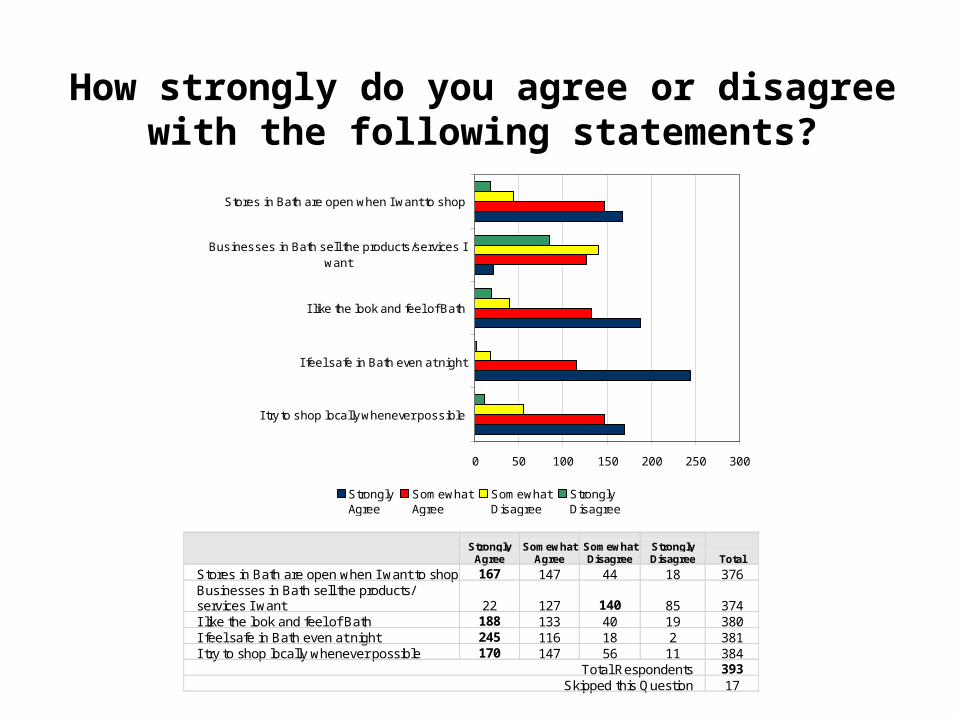
How strongly do you agree or disagree with the following statements?
0 50 100 150 200 250 300
I try to shop locally whenever possible
I feel safe in Bath even at night
I like the look and feel of Bath
Businesses in Bath sell the products/services Iwant
Stores in Bath are open when I want to shop
Strongly Agree
Somewhat Agree
Somewhat Disagree
Strongly Disagree
Strongly
Agree Somewhat
Agree Somewhat Disagree
Strongly Disagree Total
Stores in Bath are open when I want to shop 167 147 44 18 376 Businesses in Bath sell the products/ services I want 22 127 140 85 374 I like the look and feel of Bath 188 133 40 19 380 I feel safe in Bath even at night 245 116 18 2 381 I try to shop locally whenever possible 170 147 56 11 384
Total Respondents 393 Skipped this Question 17
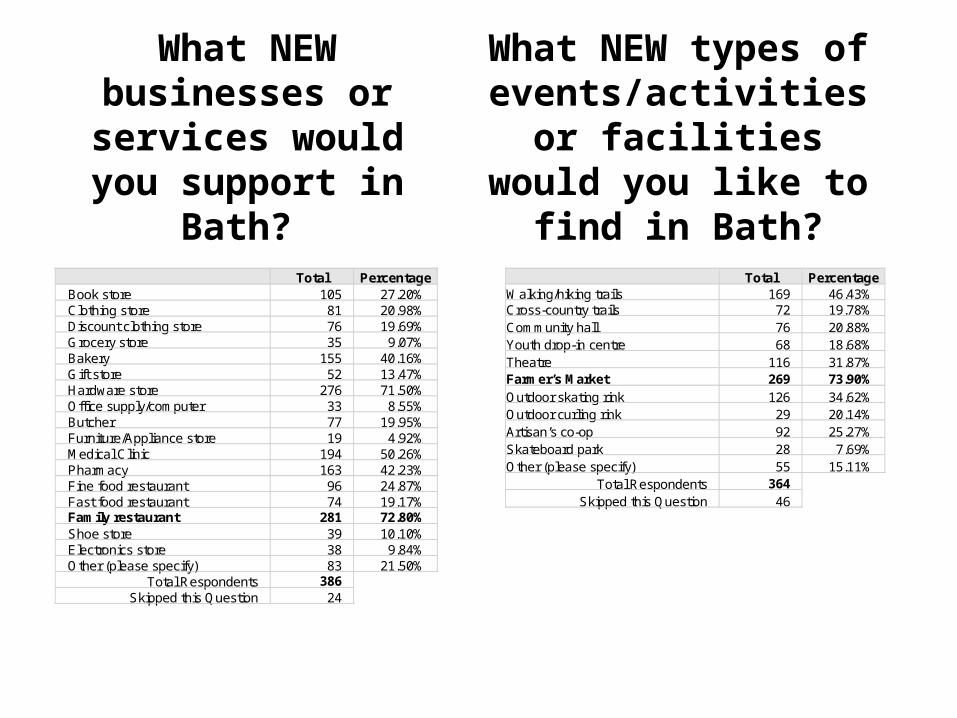
What NEW businesses or
services would you support in Bath?
Total Percentage Book store 105 27.20% Clothing store 81 20.98% Discount clothing store 76 19.69% Grocery store 35 9.07% Bakery 155 40.16% Gift store 52 13.47% Hardware store 276 71.50% Office supply/computer 33 8.55% Butcher 77 19.95% Furniture/Appliance store 19 4.92% Medical Clinic 194 50.26% Pharmacy 163 42.23% Fine food restaurant 96 24.87% Fast food restaurant 74 19.17% Family restaurant 281 72.80% Shoe store 39 10.10% Electronics store 38 9.84% Other (please specify) 83 21.50%
Total Respondents 386 Skipped this Question 24
Total Percentage Walking/hiking trails 169 46.43% Cross-country trails 72 19.78% Community hall 76 20.88% Youth drop-in centre 68 18.68% Theatre 116 31.87% Farmer’s Market 269 73.90% Outdoor skating rink 126 34.62% Outdoor curling rink 29 20.14% Artisan’s co-op 92 25.27% Skateboard park 28 7.69% Other (please specify) 55 15.11%
Total Respondents 364 Skipped this Question 46
What NEW types of events/activities or facilities would you like to find in Bath?
Ministry of Agriculture, Food and Rural Affairs
Business Mix Analysis
Bath
Bath – Downtown Market AnalysisReport Back
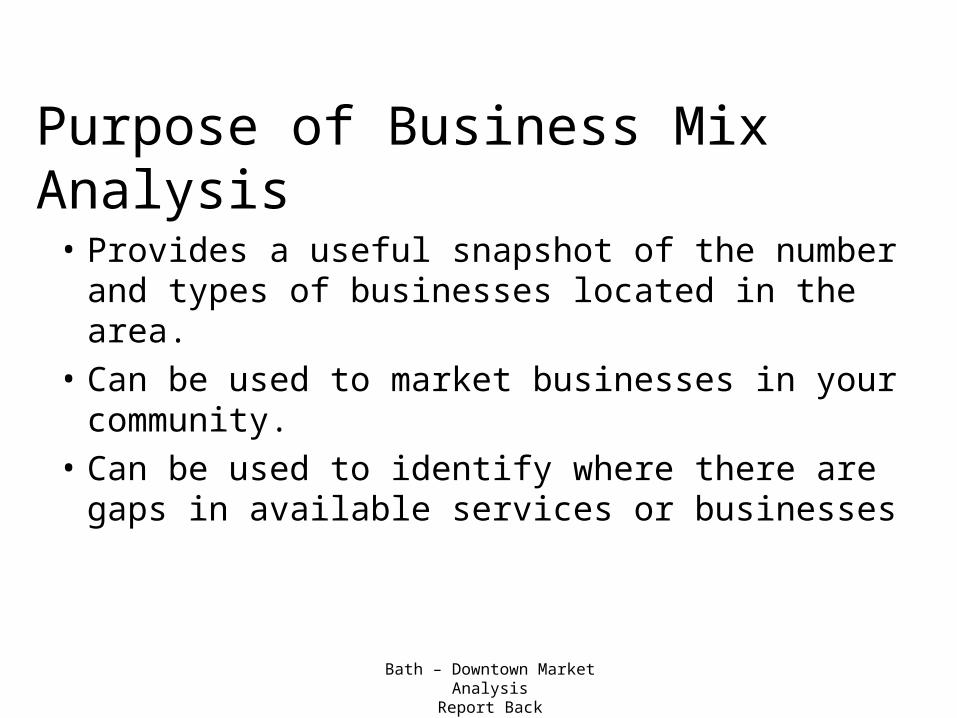
Purpose of Business Mix Analysis
• Provides a useful snapshot of the number and types of businesses located in the area.
• Can be used to market businesses in your community.
• Can be used to identify where there are gaps in available services or businesses
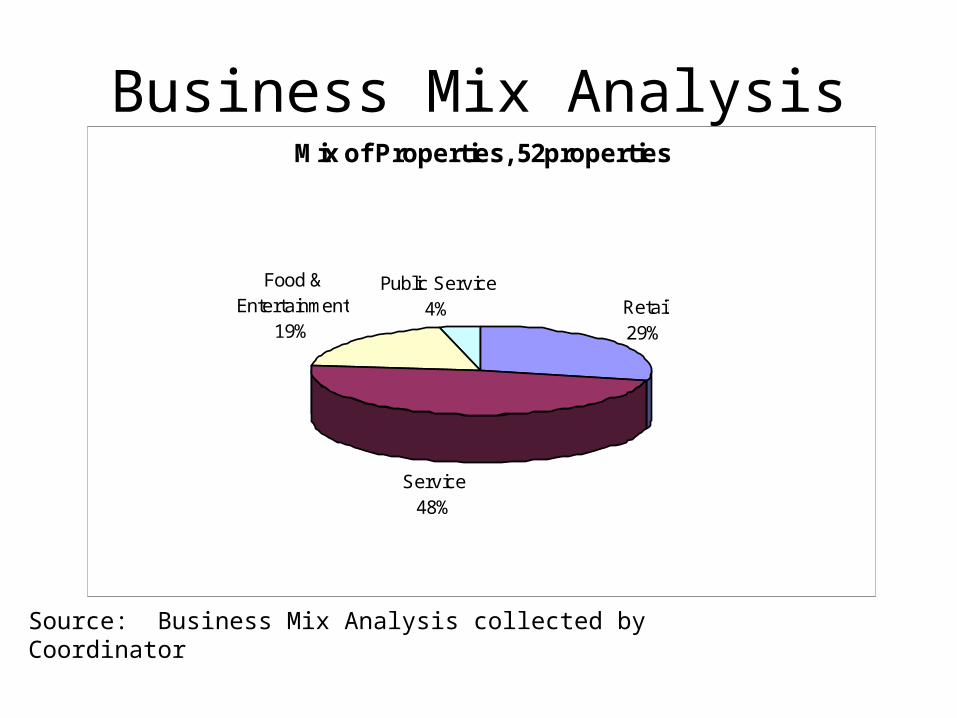
Source: Business Mix Analysis collected by Coordinator
Business Mix AnalysisMix of Properties, 52properties
Retail29%
Service48%
Food & Entertainment
19%
Public Service4%
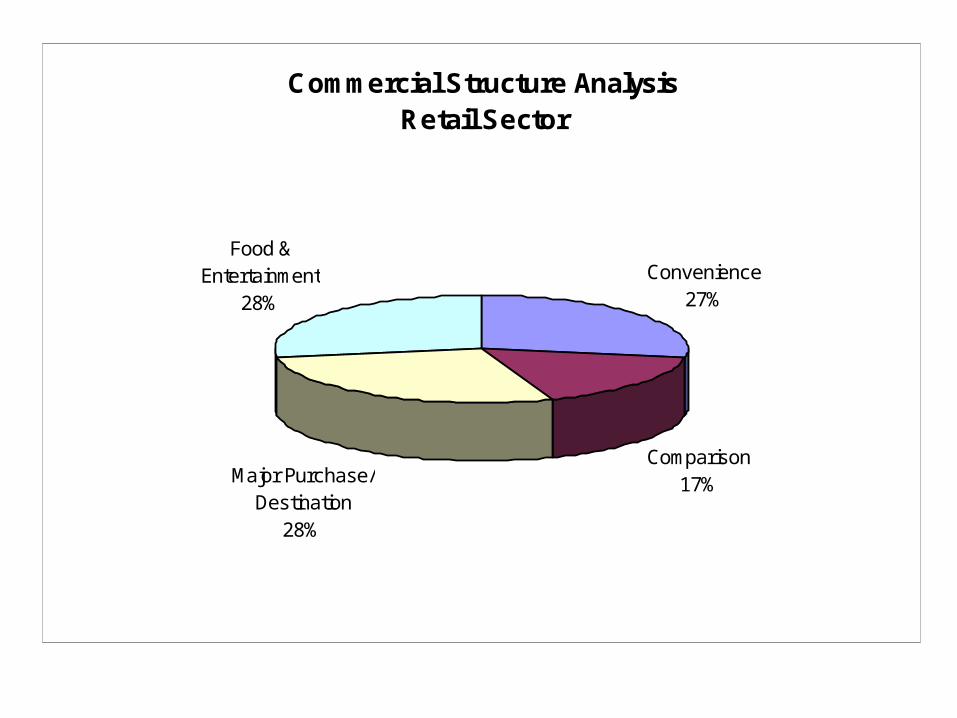
Commercial Structure AnalysisRetail Sector
Convenience27%
Comparison17%
Food & Entertainment
28%
Major Purchase/Destination
28%
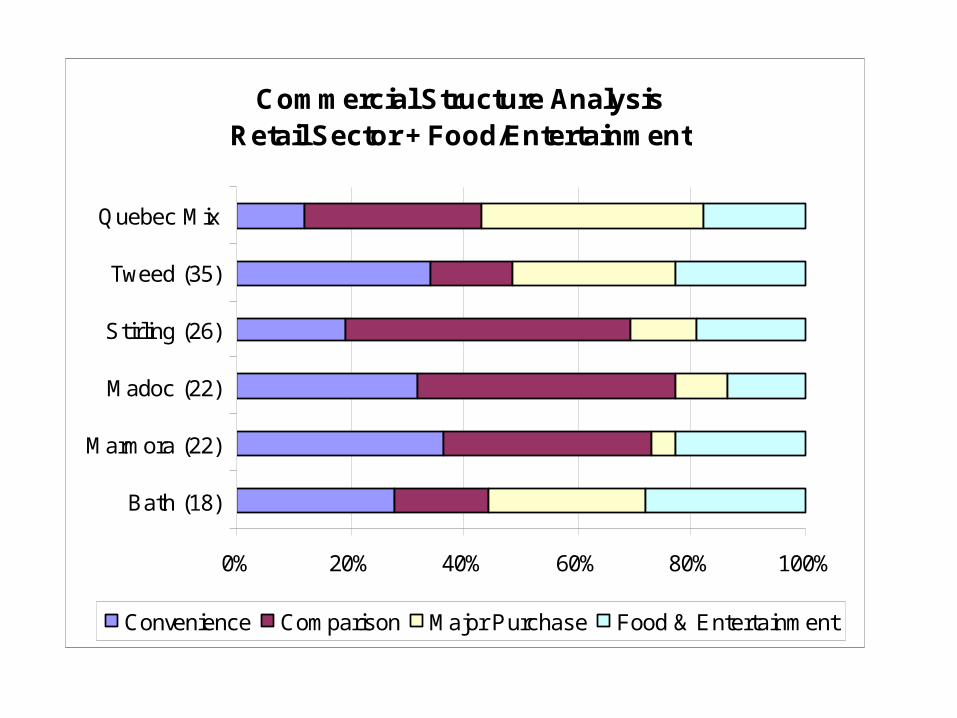
Commercial Structure AnalysisRetail Sector + Food/Entertainment
0% 20% 40% 60% 80% 100%
Bath (18)
Marmora (22)
Madoc (22)
Stirling (26)
Tweed (35)
Quebec Mix
Convenience Comparison Major Purchase Food & Entertainment

Target Markets – price pointsRestaurants *** *
Clothing/Jewellery **
Gas/Convenience * *
Grocery/Food *****
Furniture & Antiques/Decor ******
Art/Recreation/Music ******
Accommodations ***
Personal Services * ****
Commercial/Financial Services ******
Contractor Services ************
Low Medium High
Source: Business Mix Analysis collected by Coordinator
Bath – Downtown Market AnalysisReport Back
Community Business Mix Comparisons
Compare number of businesses in Bath to other similar sized communities to identify gaps and potential opportunities
Source of data: MapInfo 2006, based on community not municipal boundaries

CARRYING
PLACEHASTINGS
MERRICK
VILLEODESSA
OMEMEE
SYDENHAM
WELLING TON
BATH
Average
Estimated Population 1525 1533 1480 1641165
5 1781 1907 1742
442 Furniture and Home Furnishings Stores 0 0 4 1 1 1 2 1 1
443 Electronics and Appliance Stores 0 0 0 1 6 1 0 4 2
444 Building Material and Garden Equipment and Supplies Dealers 0 3 2 5 2 4 4 0 3
445 Food and Beverage Stores 2 4 5 3 3 5 4 3 4
446 Health and Personal Care Stores 0 1 2 1 1 1 1 1 1
448 Clothing and Clothing Accessories Stores 0 0 5 1 0 0 1 0 1
451 Sporting Goods, Hobby, Book and Music Stores 1 4 5 1 3 2 1 3 3
452 General Merchandise Stores 1 1 1 1 1 0 0 1 1
453 Miscellaneous Store Retailers 2 1 18 4 3 4 3 4 5
712 Museums 0 0 0 0 0 0 1 2 0
713 Amusement, Gambling and Recreation Industries 3 3 3 3 4 0 1 2 2
721 Accommodation Services 5 12 4 1 2 2 4 2 4
722 Food Services and Drinking Places 4 7 11 4 7 5 4 6 6
811 Repair and Maintenance 2 5 5 2 6 1 4 3 4
812 Personal and Laundry Services 1 2 6 5 5 8 3 1 4
Bath – Downtown Market AnalysisReport Back
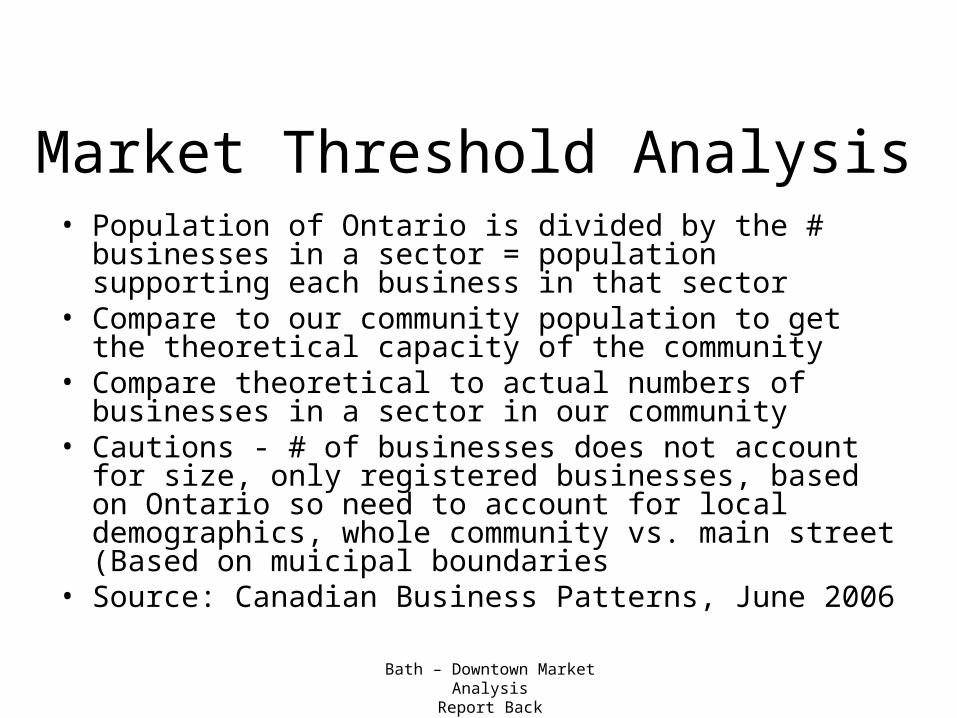
Market Threshold Analysis• Population of Ontario is divided by the # businesses in a
sector = population supporting each business in that sector
• Compare to our community population to get the theoretical capacity of the community
• Compare theoretical to actual numbers of businesses in a sector in our community
• Cautions - # of businesses does not account for size, only registered businesses, based on Ontario so need to account for local demographics, whole community vs. main street (Based on muicipal boundaries
• Source: Canadian Business Patterns, June 2006

Loyalist Population 15,062
# Businesse
s in Ontario
# people
per busines
s (Ontario
)
Theoretical
capacity of the
community
Actual number
in communi
ty
+ Greater than - fewer
than capacity
3118 - Bakeries and Tortilla Manufacturing 1111 10,945 1.4 0 -1.4
4421 - Furniture Stores 1883 6,458 2.3 0 -2.3
4441 - Building Material and Supplies Dealers 3233 3,761 4.0 4 -0.0
4451 - Grocery Stores 9752 1,247 12.1 9 -3.1
4452 - Specialty Food Stores 3242 3,751 4.0 1 -3.0
4461 - Health and Personal Care Stores 6421 1,894 8.0 2 -6.0
4481 - Clothing Stores 7440 1,634 9.2 0 -9.2
4511 - Sporting Goods, Hobby and Musical Instrument Stores
41082,960 5.1 5 -0.1
4532 - Office Supplies, Stationery and Gift Stores 3220 3,776 4.0 8 4.0
5221 - Depository Credit Intermediation 1786 6,809 2.2 2 -0.2
5412 - Accounting, Tax Preparation, Bookkeeping and Payroll Services
121181,003 15.0 2 -13.0
5419 - Other Professional, Scientific and Technical Services
100751,207 12.5 12 -0.5
5615 - Travel Arrangement and Reservation Services 3043 3,996 3.8 0 -3.8
7121 - Heritage Institutions 429 28,346 0.5 3 2.5
7139 - Other Amusement and Recreation Industries 5385 2,258 6.7 9 2.3
7221 - Full-Service Restaurants 14580 834 18.1 7 -11.1
7222 - Limited-Service Eating Places 15343 793 19.0 10 -9.0
7224 - Drinking Places (Alcoholic Beverages) 1720 7,070 2.1 0 -2.1
8111 - Automotive Repair and Maintenance 14812 821 18.3 7 -11.3
8121 - Personal Care Services 12077 1,007 15.0 10 -5.0
Bath – Downtown Market AnalysisReport Back
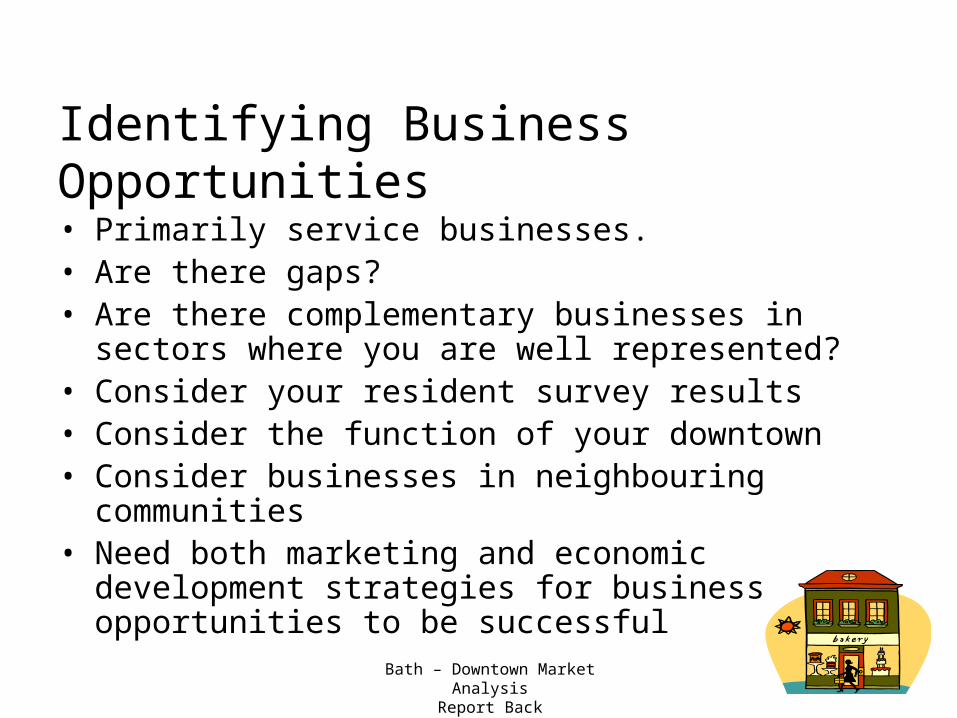
Identifying Business Opportunities
• Primarily service businesses. • Are there gaps?• Are there complementary businesses in sectors where
you are well represented?• Consider your resident survey results• Consider the function of your downtown• Consider businesses in neighbouring communities• Need both marketing and economic development
strategies for business opportunities to be successful

Ministry of Agriculture, Food and Rural Affairs
Business Owners Survey
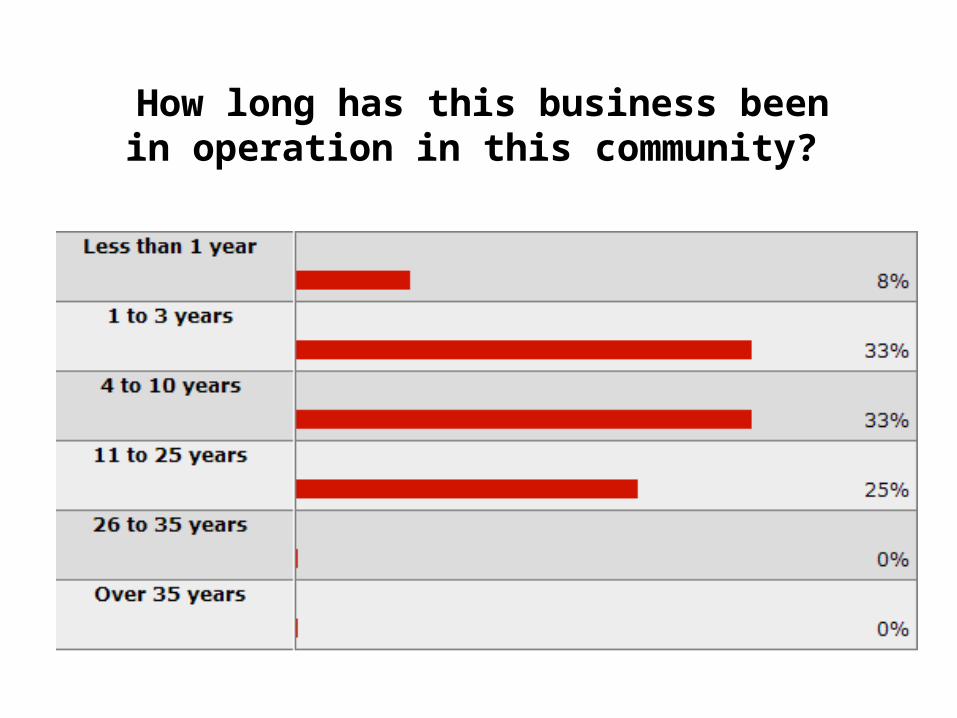
How long has this business beenin operation in this community?
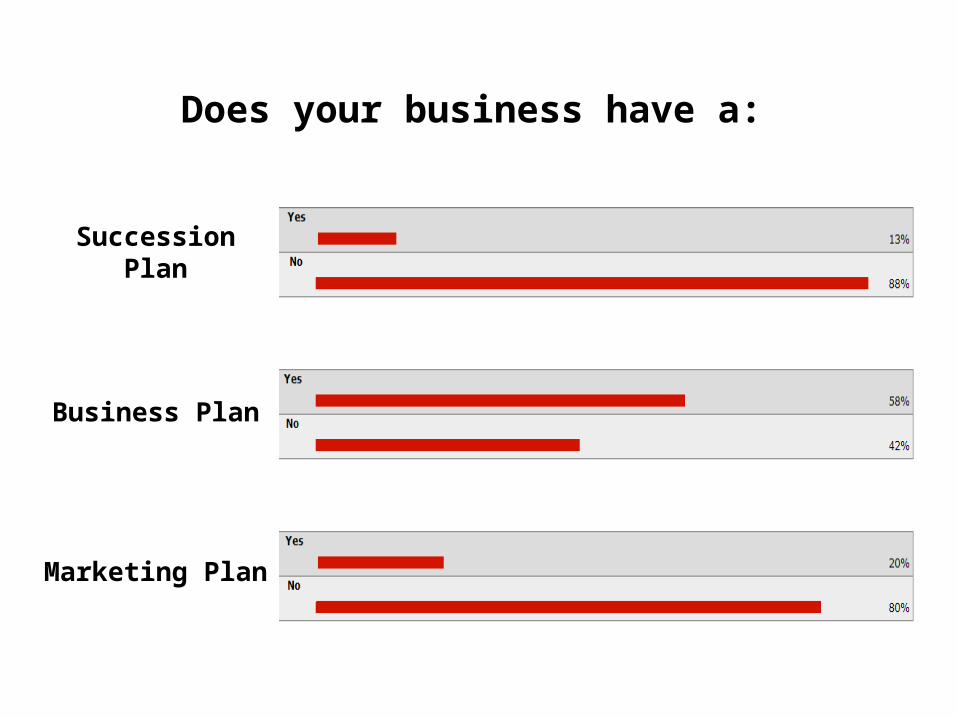
Does your business have a:
Succession Plan
Business Plan
Marketing Plan
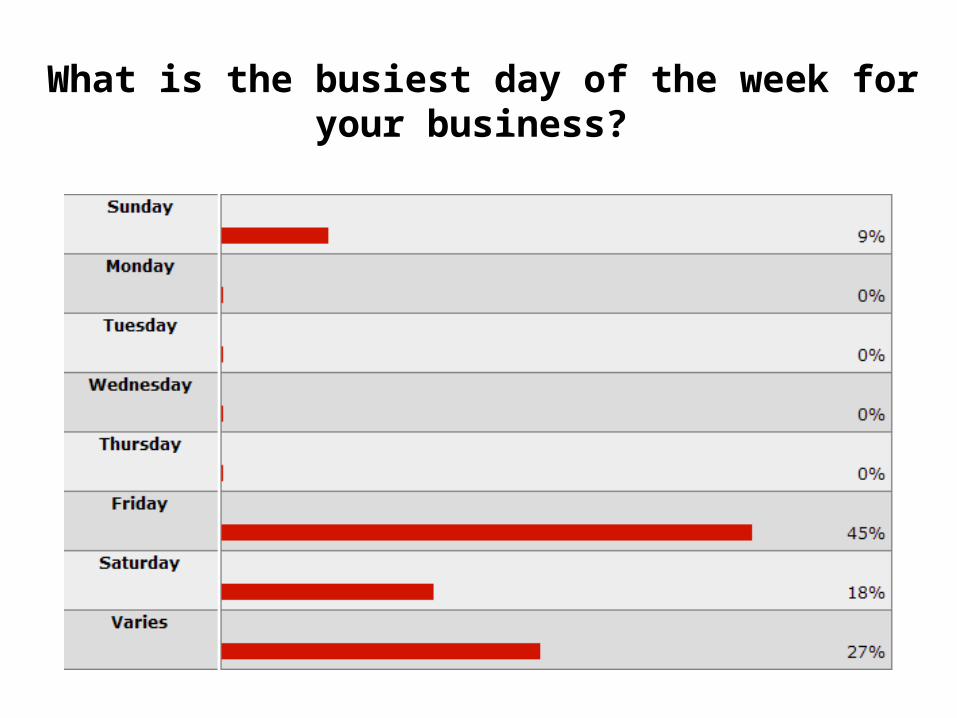
What is the busiest day of the week for your business?
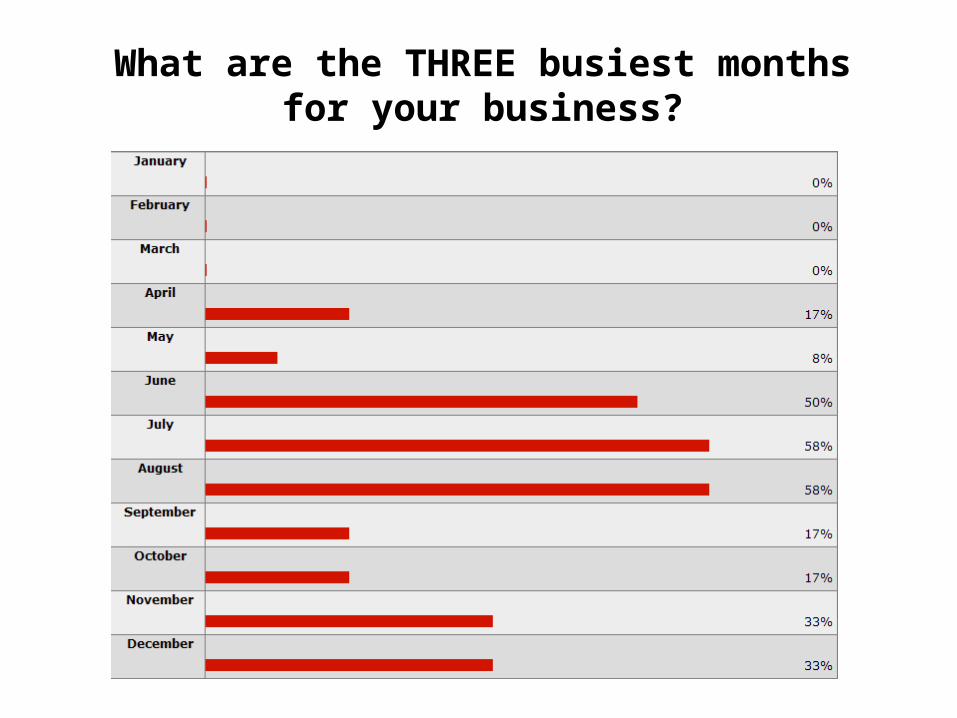
What are the THREE busiest months for your business?
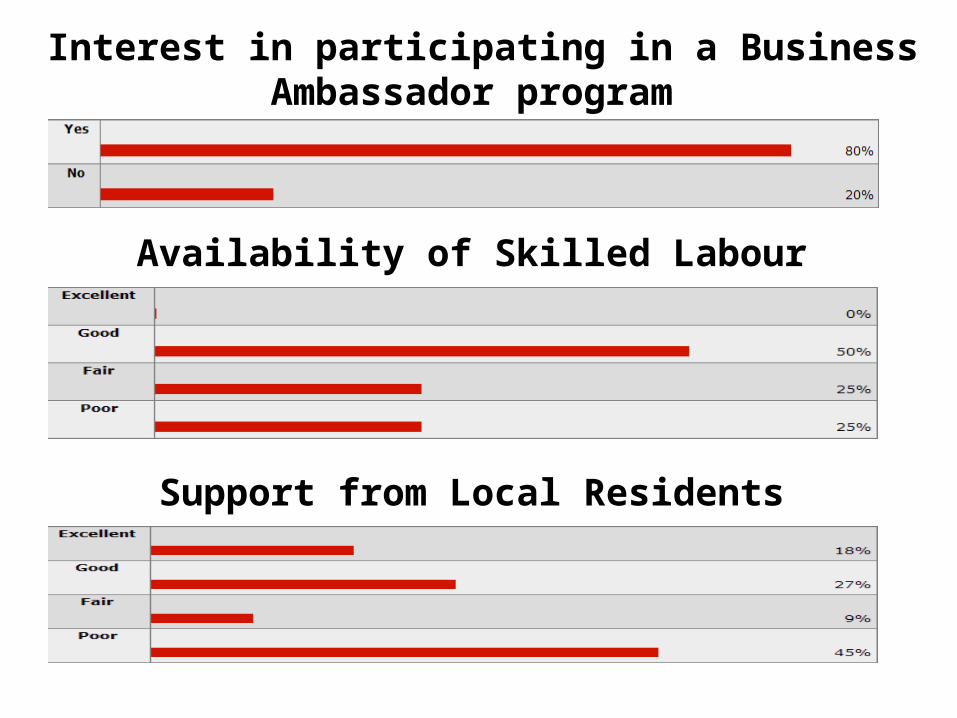
Interest in participating in a Business Ambassador program
Availability of Skilled Labour
Support from Local Residents
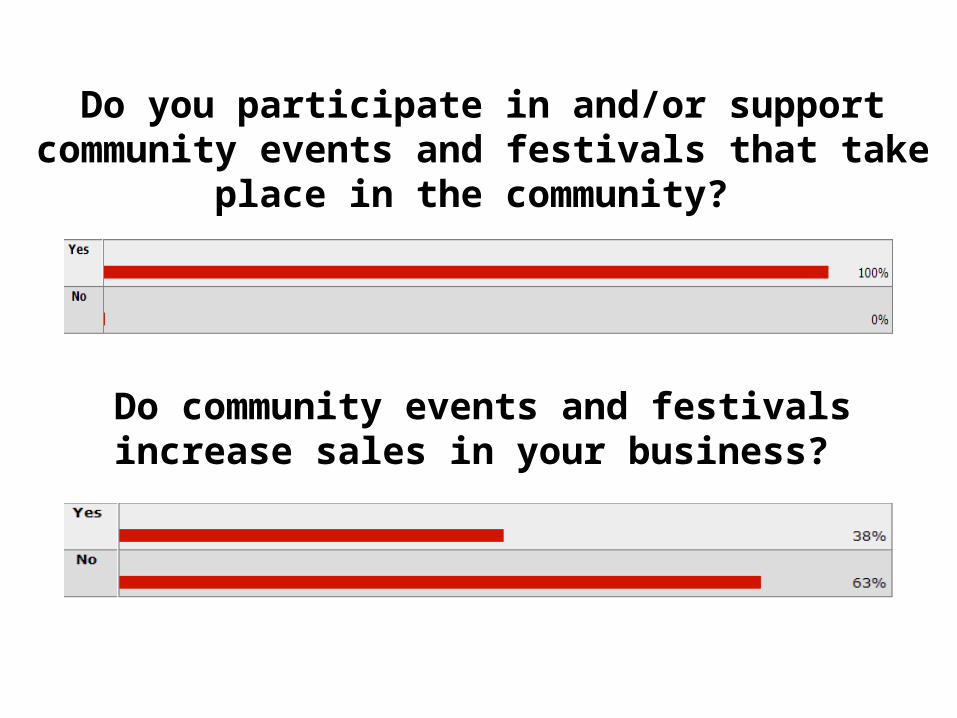
Do you participate in and/or support community events and festivals that take place in the
community?
Do community events and festivals increase sales in your business?
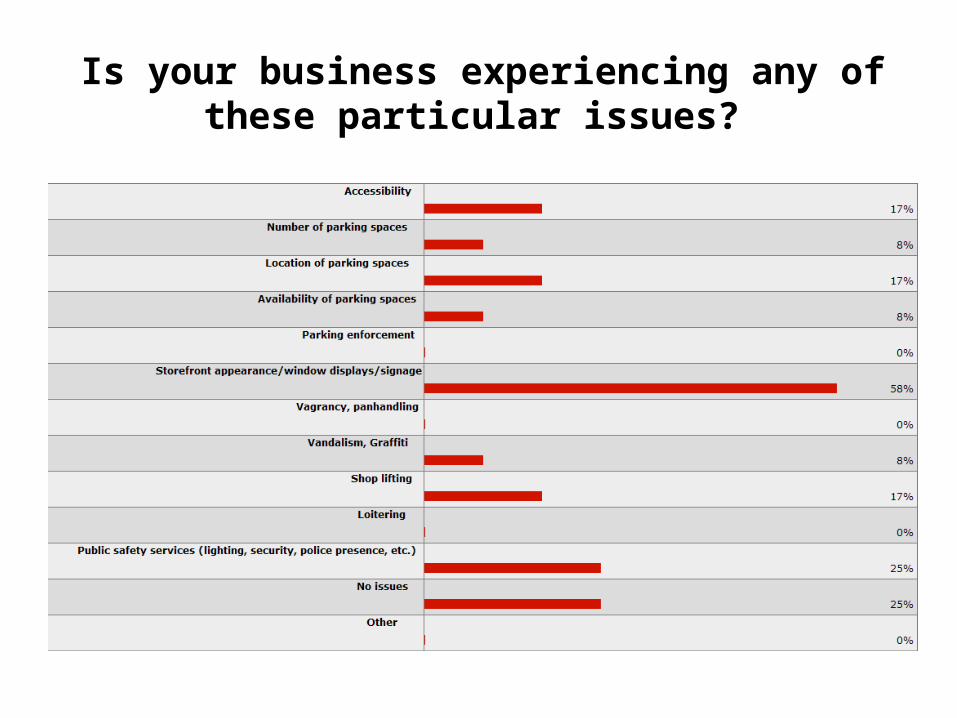
Is your business experiencing any of these particular issues?
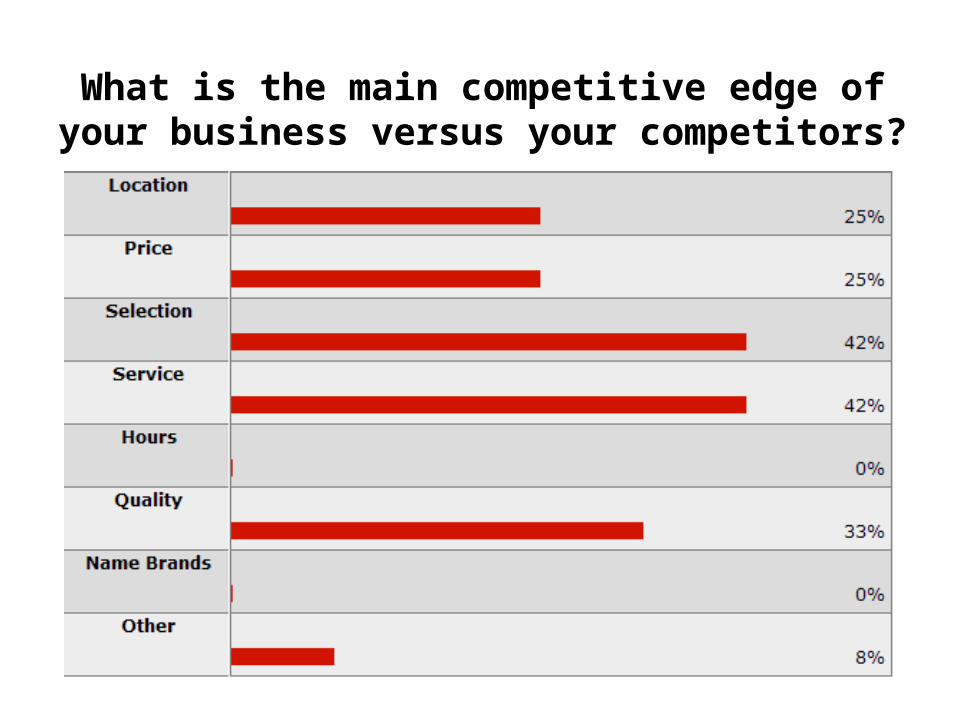
What is the main competitive edge of your business versus your competitors?

I always direct customers to other Bath businesses
I always try and buy products/services locally
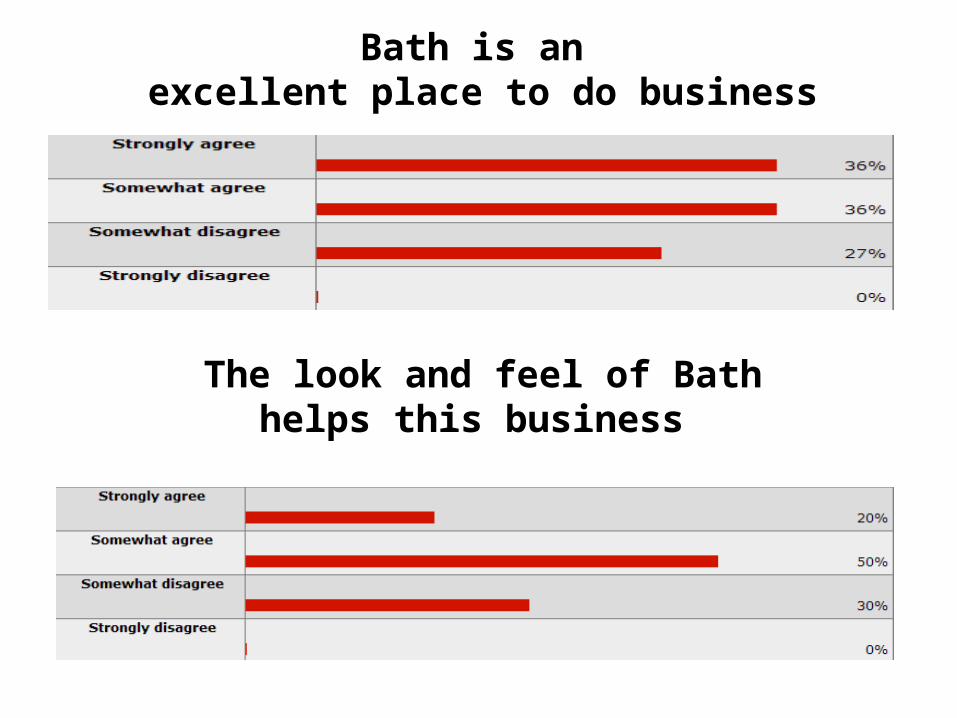
Bath is an excellent place to do business
The look and feel of Bathhelps this business
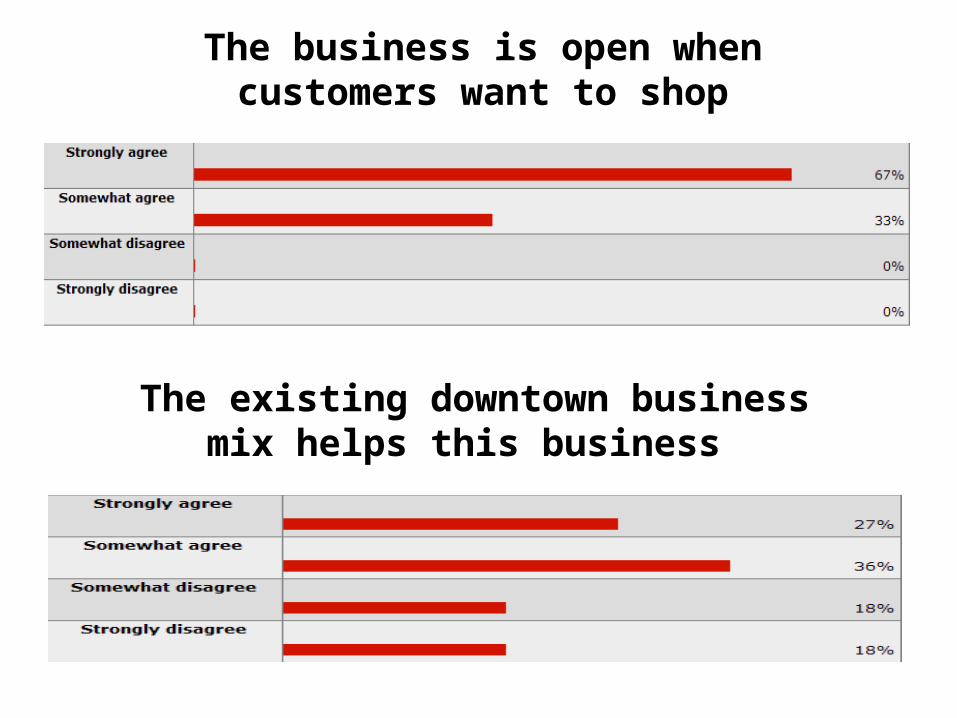
The business is open whencustomers want to shop
The existing downtown businessmix helps this business
IMPLEMENTING
IMPLEMENTING
CREATING CREATING
Monitor impactReview priorities yearly
Monitor impactReview priorities yearly
ORGANIZINGORGANIZING
ASSESSING ASSESSING
Forming the management committee Forming the management committee
Hiring a coordinator Hiring a coordinator
Kick-off public meeting Kick-off public meeting
Preliminary scoping & assessment Preliminary scoping & assessment
Downtown Vision Downtown Vision
1st Impressions1st Impressions SWOTSWOT
Market Analysis Market Analysis Other researchOther researchPhysical ImprovementPhysical Improvement
Local EconomyLocal Economy
Business MixBusiness Mix
Resident SurveyResident Survey
Business Owner SurveyBusiness Owner Survey
Trade Area AnalysisTrade Area Analysis
Business InventoryBusiness Inventory
Information and interpretation/planning session Information and interpretation/planning session
Articulate Target Market(s) & Evaluating potential actions and business opportunities Articulate Target Market(s) & Evaluating potential actions and business opportunities
Preparation of Action PlansPreparation of Action PlansPhysical Design
Physical Design
Marketing & Promo
Marketing & Promo Economic DevEconomic Dev Organization DevOrganization Dev Social IssuesSocial Issues
Physical Design
Physical Design
Marketing & Promo
Marketing & Promo Economic DevEconomic Dev Organization DevOrganization Dev Social IssuesSocial Issues
Integrated Downtown Revitalization Process
You are goinghere!